
95% of researchers rate our articles as excellent or good
Learn more about the work of our research integrity team to safeguard the quality of each article we publish.
Find out more
ORIGINAL RESEARCH article
Front. Mar. Sci. , 17 October 2022
Sec. Marine Fisheries, Aquaculture and Living Resources
Volume 9 - 2022 | https://doi.org/10.3389/fmars.2022.998190
This article is part of the Research Topic Current Knowledge and Recent Advances in Aquatic Animal Health Management View all 4 articles
 Bo Liu1,2†
 Hua-Yang Guo1,3,4†
 Bao-Suo Liu1,3,4,5
 Nan Zhang1,3,4Jing-Wen Yang1
 Liang Guo1,3,4
 Shi-Gui Jiang1,3,4
 Dian-Chang Zhang1,2,3,4,5*
Starvation is a common stress in fish that is caused by environmental changes, and refeeding after starvation is believed to cause compensatory growth. Here, we evaluated the impacts of starvation for 7 d, followed by refeeding for 7 d on growth, gut microbiome, biochemical indices, liver transcriptome, and immune response in golden pompanos (Trachinotus ovatus). Starvation induced hypoglycemia, reduced triglyceride concentration, and considerably affected the activities of glycolysis related enzymes, including glucokinase (GK), pyruvate kinase (PK), and fructokinase 6-phosphate (PFK). Additionally, starvation for 7 d increased the concentrations of oxidative stress indicators, including cortisol (COR), superoxide dismutase (SOD), malondialdehyde (MDA), and catalase (CAT) and non-specific immunity parameters, including alkaline phosphatase (ALP), acid phosphatase (ACP), and lysozyme (LYZ). parameters to normal levels. Moreover, starvation affected the diversity and composition of the intestinal microbiota of T. ovatus. At the phylum level, the dominant phyla were Proteobacteria, Spirochaetes, and Tenericutes, while the dominant genera were Brevinema, Haematospirillum, and Mycoplasma. Transcriptome analysis of liver tissues showed that the mRNA expression of GK, PK, and PFK, were altered by starvation, and the trends were consistent with the activity levels of the enzymes. A total of 2,287 DEGs were identified among the control, starvation, and refeeding groups. DEGs in starvation (ST7) vs. control (CK) groups were mainly involved in cell cycle, DNA replication, and mitosis, whereas those in the refeeding (RT7) vs. ST7 groups were associated with stimulus responses and carbohydrate metabolism. Overall, most starvation-induced changes in enzyme activity, intestinal microbiome, immune response, and liver transcriptome were gradually restored to normal after refeeding for 7 d. These data provide a theoretical reference for the farming of T. ovatus during periods of feed scarcity.
Environmental changes, including temperature and seasonal variations, can cause food deprivation among animals. Animals respond to starvation stress by lowering their metabolic rate and increasing energy metabolism, including lipid and glycogen metabolism (Navarro and Gutiérrez, 1995) to maintain normal body functions and regulate enzyme activities (Su et al., 2022). Compensatory growth is observed when animals are returned to normal feeding after a period of starvation (Wilson and Osbourn, 1960). However, there is considerable variation in the degree of compensatory growth in aquatic animals depending on the species and starvation duration (Wang et al., 2009). Previous findings suggest that compensatory growth can increase the body weight of fish and increase feed utilization (Maclean and Metcalfe, 2001; Huang et al., 2008; Blanquet and Oliva-Teles, 2010). Therefore, it is important to evaluate the effects of starvation and refeeding on compensatory growth in fish.
Fish can survive during starvation and other harsh conditions by regulating biochemical and physiological mechanisms (Sakyi et al., 2020). Starvation activates the antioxidant defense system (Sakyi et al., 2020), of which superoxide dismutase (SOD) and catalase (CAT) are two key enzymes in the antioxidant defense system of aquati7c animals (Su et al., 2022). Moreover, studies have reported increased SOD and CAT activities in animals during starvation (Sipra et al., 2017; Showkat et al., 2019; Su et al., 2022). Malondialdehyde (MDA), which is produced by lipid peroxidation, can lead to oxidative damage to cell membranes, and is considered a biomarker of oxidative stress (Liu et al., 2011). These indicators can be used to assess the impact of starvation and refeeding on fish.
The composition of the intestinal microflora plays an important role in maintaining homeostasis, health status and growth in fish (Flint et al., 2012). Therefore, several studies have investigated effects of starvation on gut microbiome composition in fish (Sakyi et al., 2020; Yang et al., 2019; Jawahar et al., 2022). There are trillions of intestinal microflorae in the intestine (Zhang et al., 2014; Zhang et al., 2016). The intestinal microbiota of aquatic animals (Li et al., 2012; Li et al., 2014) is affected by feeding habits (Ghanbari et al., 2015), physiological conditions (Yan et al., 2012), living environment (Sullam et al., 2012; Dehler et al., 2016), and feed type (Ringø et al., 2016). Starvation is a common phenomenon in fish farming (Namrata et al., 2011; Xia et al., 2014). During the period of starvation, a series of physiological changes occur in fish (Guderley et al., 2003), which not only affects the growth of animals, but also cause changes in intestinal microbiota (Namrata et al., 2011; Okada et al., 2013). Starvation has been shown to alter intestinal microbiota in Lates calcarifer (Xia et al., 2014), Ctenopharyngodon idellus (Tran et al., 2018), and Oreochromis niloticus (Sakyi et al., 2021). Starvation-induced changes in gut microbial composition and function can affect growth, metabolism, and inflammatory responses in fish (Xu et al., 2018; Sakyi et al., 2021). However, the existential correlation between starvation and changes in gut microbiota remains unknown in some fish species.
Another mechanism through which organisms adapt during starvation is by regulating metabolic activities to maintain homeostasis (Keogh et al., 2016). Recently, transcriptome analysis using next-generation sequencing (NGS) technologies have provided new insights into the response of various aquaculture animals to starvation and refeeding (Yang et al., 2019; Jawahar et al., 2022). For example, the muscle transcriptomes of Larimichthys crocea (Qian et al., 2016), Oncorhynchus mykiss (Rescan et al., 2007), and Lctalurus punctatus (Liu et al., 2013) have been analyzed during starvation and refeeding. Starvation can promote the metabolism of energy materials, such as body fat and protein, and significantly increase the expression of hormone synthesis-related genes to resist stress damage (Chen et al., 2022; Elbialy et al., 2022). Liver tissue is an important site for nutrient metabolism, and plays an important regulatory role in animals during starvation (Pilkis and Granner, 1992).
Golden pompano (Trachinotus ovatus) is one of the most important farmed fish in the South China Sea (Liu et al., 2020). Similar to other species, the growth and survival of golden pompano is affected considerable by environmental variations; however, the effect of starvation on gut microbial composition and metabolic pathways in golden pompano have not been thoroughly elucidated. Here, we examined the impacts of starvation on growth, gut microbiome, biochemical indices, liver transcriptome, and immune response in golden pompanos. It is anticipated that the findings of this study would serve as theoretical references for sustainable aquaculture of golden pompano.
A total of 360 healthy golden pompano (mean weight, 108.65 ± 1.36 g) independently bred by our research group were randomly assigned to nine floating net cages (1.0 m × 1.0 m × 1.0 m), with 40 fish per cage. The control (CK), starvation (ST), and refeeding (RT) groups were set in parallel, with three floating net cages per group. The CK group were fed to visual satiety twice daily (7:00 am and 5:00 pm), the ST group were starved for 7 d (ST7), while fish in the RT group were refed for 7 d after 7 d of starvation (RT7). At the end of the experimental period, the fish were anesthetized using 100 mg/L eugenol (Shanghai Medical Instruments Co., Ltd., Shanghai, China). The CK group was sampled on d-0, 7, and 14 (CK0, CK7, CK14); the ST group was sampled on d-7 (ST7); and the RT group was sampled on d-7 of refeeding after 7 d of starvation (RT7). The water conditions during the experimental period were as follows: salinity, 32%; temperature; 27-31°C; and pH, 7.5-8.2. Additionally, nine fishes were randomly sampled from each group, weighed for growth analysis, and blood samples were then collected for serum biochemical analysis. Liver and intestines tissues were rapidly isolated, frozen in liquid nitrogen, and stored for further analysis. Moreover, intestinal tissue was sampled for intestinal microflora analysis, while liver tissue was used for transcriptome analysis. All animal experimentations were performed in accordance with the regulations and guidelines of the Animal Care and Use Committee of the South China Sea Fisheries Research Institute, Chinese Academy of Fisheries Sciences (No. SCSFRI96-253).
The concentrations of serum biochemical parameters, including triglyceride (TG), total protein (TP), glucose (GLU), low-density lipoprotein (LDL), and high-density lipoprotein (HDL), were determined using Mindray BS-420 automatic biochemical instrument (Shenzhen Mindray Biological Medical Electronics Co., Ltd., China). The activities of glycolysis enzymes, including glucokinase (GK), pyruvate kinase (PK), and 6-phosphofructokinase (PFK) were determined using standard kits supplied by Nanjing Jian-Cheng Institute of Biological Engineering. Non-specific immunity parameters, including alkaline phosphatase (ALP), acid phosphatase (ACP), and lysozyme (LZM) activities, and oxidative stress parameters, including total antioxidant capacity (T-AOC), malondialdehyde (MDA) concentration, and catalase (CAT), superoxide dismutase (SOD), and cortisol (COR) activities, were analyzed according to previously described procedures (Liu et al., 2019; Yang et al., 2020; Ma et al., 2021), using enzyme kits (Beijing Sin-Uk Institute of Biological Technology, Beijing, China).
Total bacterial DNA was isolated using the TIANamp Micro DNA Purification Kit (Tiangen, Beijing, China). DNA yield was measured in NanoDrop (Thermo Fisher Scientific, Waltham, MA, US), and quality was assessed by PCR amplification of the bacterial 16S rRNA genes. Bacterial DNA was used as the template for the 16S rRNA V3+V4 region amplification. All PCR reactions were performed using 15 µL of Phusion® High-Fidelity PCR Master Mix (New England Biolabs), 0.2 µM of forward and reverse primers, and approximately 10 ng template DNA. The PCR products were purified using Qiagen Gel Extraction Kit (Qiagen, Germany), and sequence analysis was performed using Uparse software (Uparse v7.0.1001, http://drive5.com/uparse/) (Edgar, 2013). Intestinal microbes were clustered into operational taxonomic units (OTUsusing the Silva database (http://www.arb-silva.de/) as reference genome (Quast et al., 2013). Multiple sequence alignments were performed using MUSCLE software (Version 3.8.31, http://www.drive5.com/muscle/) (Edgar, 2004).
Total RNA was isolated from liver tissues using Trizol reagent (Invitrogen), according to the manufacturer’s protocol. RNA purity and integrity were assessed using NanoPhotometer ® spectrophotometer (IMPLEN, CA, USA) and RNA Nano 6000 Assay Kit (Agilent Technologies, CA, USA), respectively. Sequencing libraries were generated using NEBNext® UltraTM RNA Library Prep Kit for Illumina® (NEB, USA) according to the manufacturer’s instructions, and index codes were added to attribute sequences to each sample. Library sequencing was performed on the Illumina Novaseq platform, according to the manufacturer’s instructions. Quality screening, including the calculation of Q20, Q30 and GC content were performed. Differential expression analysis was performed using the DESeq2 R package (1.16.1). Gene ontology (GO) and Kyoto Encyclopedia of Genes and Genomes enrichment analysis of differentially expressed genes (DEGs) were performed using the cluster Profiler R package.
The expression profiles of PK, GK, and PFK were determined by RT-qPCR to validate the transcriptome data. Gene-specific (PK, GK, PFK) primers were designed using Primer Premier 6.0 software (Table 1). The qPCR reaction was performed using according to the manufacturer’s instructions (TaKaRa). All PCR reactions were performed using 12.5 µL reaction volume containing 6.25 µL 2 × TB Green Premix Ex Taq II (Tli RNaseH Plus) (TaKaRa), 1 µL cDNA template, 0.5 µL each primer of forward and reverse and 4.25 µL of Milli-Q water. The relative expression of the genes was determined using the CT method (2−ΔΔCT) (Livak and Schmittgen, 2001).
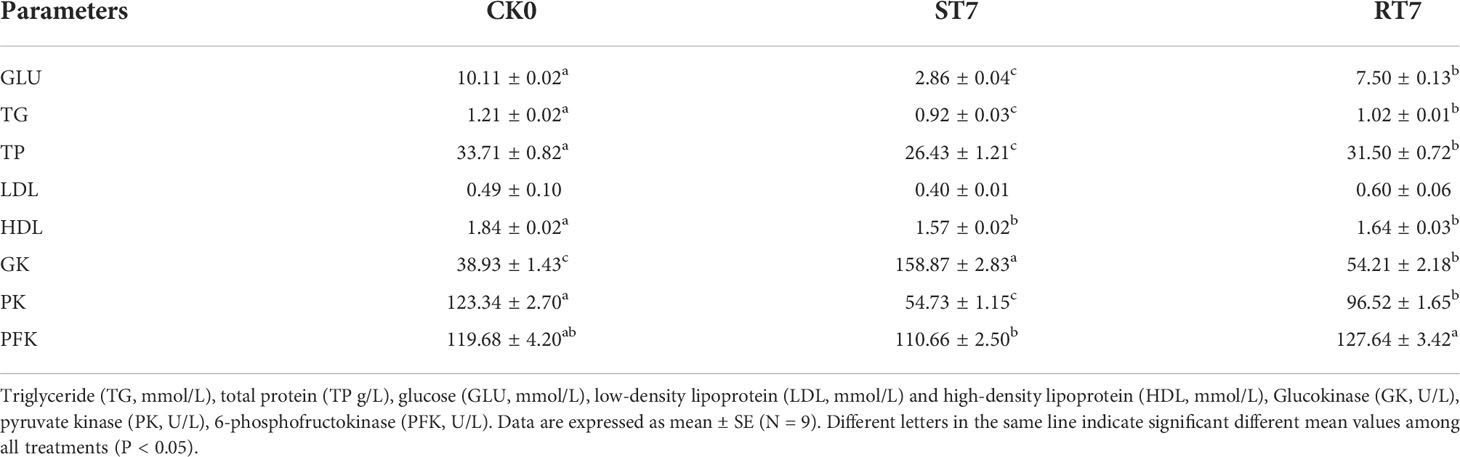
Table 1 Effects of starvation and refeeding on serum biochemical indices and glycolysis-related enzymes in golden pompano.
The experimental data were analyzed using SPSS 22.0 software (IBM Corporation, New York, USA). Experimental results are expressed as mean ± standard error (SE). Significant differences were determined using one-way analysis of variance (ANOVA), followed by Tukey’s post hoc test, and means were considered statistically significant at p < 0.05.
The body weights of golden pompano in the control (CK0, CK7 and CK14) and experimental (ST7 and RT7) groups are shown in Figure 1. There was a significant decrease in the body weight of fish in the ST7 group (101.88 g) after 7 d of starvation compared with the CK (108.65 g) and RT7 groups (130.61 g). However, there was no significant difference in body weight between RT7 and CK groups.
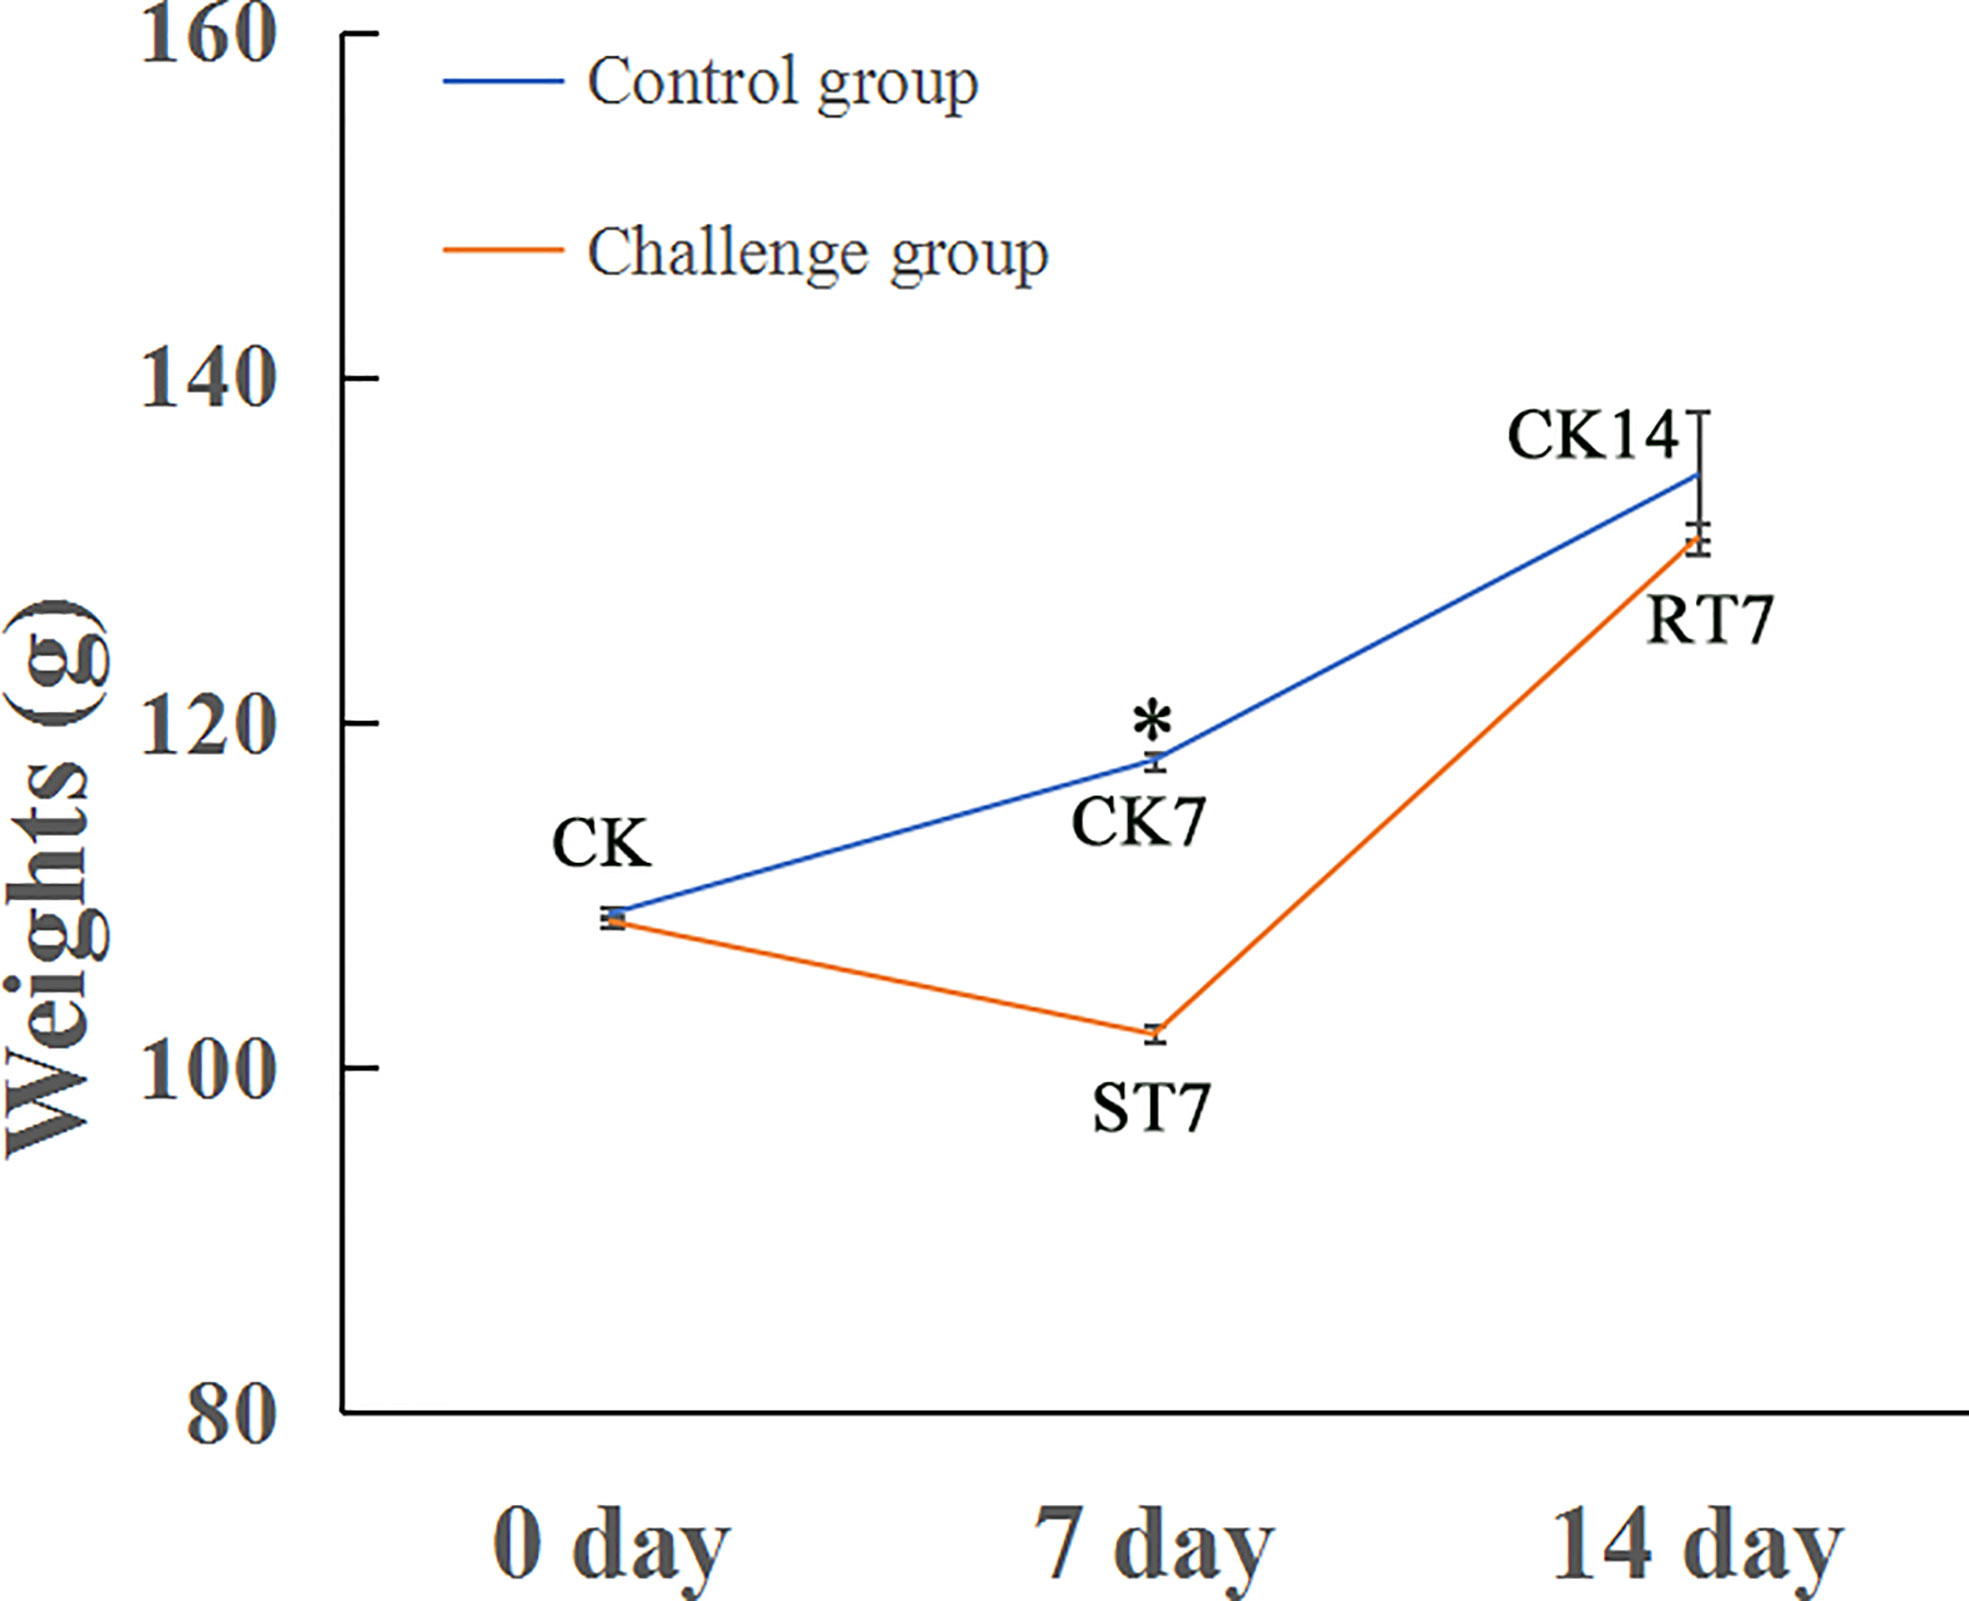
Figure 1 Growth curves of golden pompano under normal feeding, starvation, and refeeding. Asterisk indicated significant difference between two groups (p < 0.05); blue line represents the growth curve for control group (CK); red line indicates the growth curve for the challenge groups (starvation and refeeding groups).
There was a significant decrease (p < 0.05) in the concentrations of GLU, TG, and TP in the ST7 group compared with the CK group (Table 2), but there was no significant difference in LDL content between the groups. Additionally, starvation significantly increased (p < 0.05). GK activity, but inhibited the activities of PK and PFK. However, refeeding after starvation significantly decreased GK activity (p < 0.05) and increased PK and PFK activities, restoring them to normal levels.
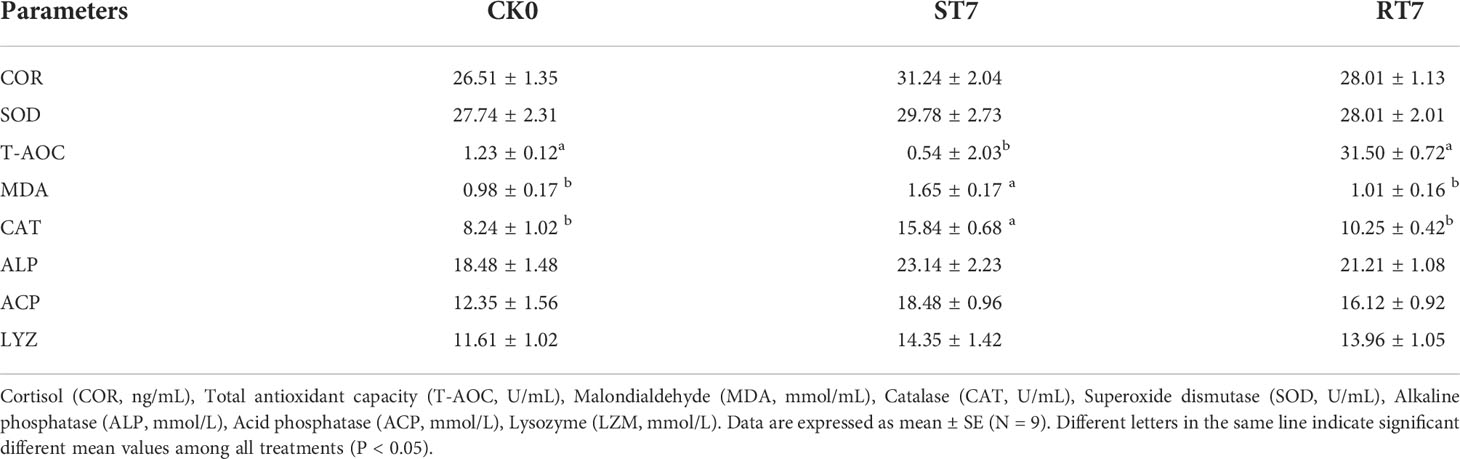
Table 2 Effect of starvation and refeeding on non-specific immunity and oxidative stress parameters in golden pompano.
Starvation for 7 d increased the activities of oxidative stress indicators (COR, SOD, MDA, and CAT) and non-specific immunity parameters, including ALP, ACP, and LYZ (Table 3) compared with the control group. However, refeeding for 7 d restored (decreased) the activities of these parameters back to normal.
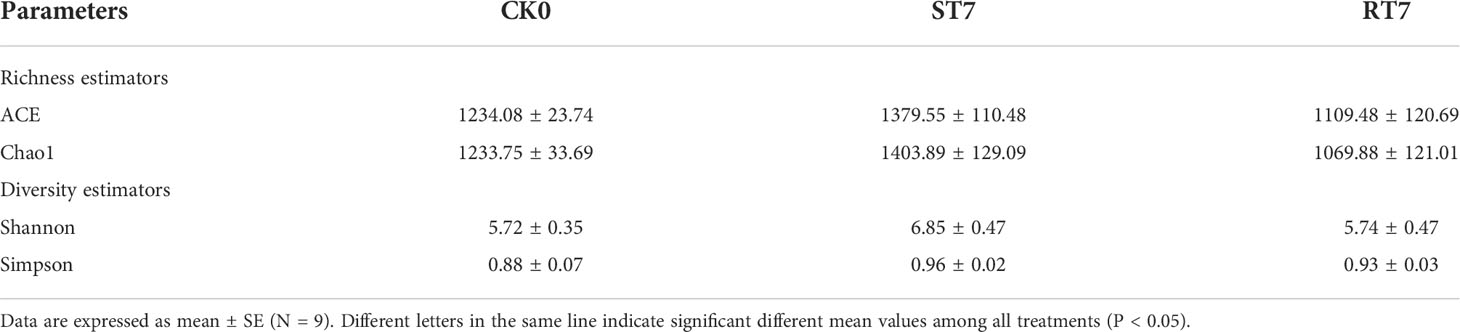
Table 3 Illumina high-throughput bacterial diversity richness, diversity index (Shannon and Simpson), and estimated OTU richness (ACE and Chao1) of the intestinal bacterial of golden pompano.
A total of 563,928 sequences were obtained from the samples of golden pompano, which were clustered into 3,295 OTUs (sequence similarity ≥ 97%). The OTUs were annotated using the Silva132 database, of which 1,393 (42.28%) OTUs were obtained at the genus level. α-diversity analysis showed that starvation caused a decrease (p < 0.05) in intestinal microbiota richness and diversity in golden pompano, including Ace, Chao1, Shannon’s, and Simpson’s indices, compared with the CK group (Table 4). Moreover, refeeding did not significantly reverse starvation-induced decrease in intestinal microbial diversity.
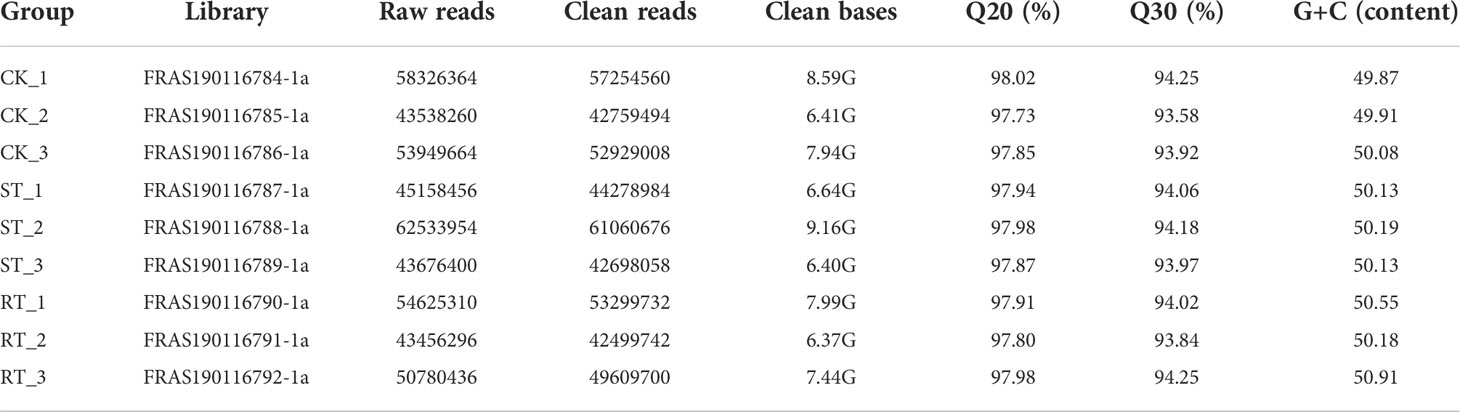
Table 4 Statistics of transcriptome data.
At the phylum level, the most dominant phyla were Proteobacteria, Spirochaetes, and Tenericutes (Figure 2A). Starvation increased the abundance of Spirochaetes, but decreased the abundance of Tenericutes; however, refeeding for 7 d significantly increased the abundance of Proteobacteria in the intestinal microbiota. At the genus level, the most dominant genera were Brevinema, Haematospirillum, and Mycoplasma (Figure 2B). There were some differences between groups, indicating that starvation and refeeding had some influence on intestinal microbial composition in golden pompano. Moreover, β-diversity analysis showed some differences among the sample groups (Figure 2C). Differences were also observed at the genus level: certain genera, such as Brevinema, Haematospirillum, and Mycoplasma (Figure 2D). Principal component analysis (PCA) and principal coordinate analysis (PCoA) confirmed that there were considerable differences in bacterial microbiota structure between the groups (Figures 3A, B). Linear discriminate analysis effect size (LEfSe) revealed that there were differential bacteria in the intestinal microbiota of golden pompano in the refeeding group, including Proteobacteria (Figures 3C, D).
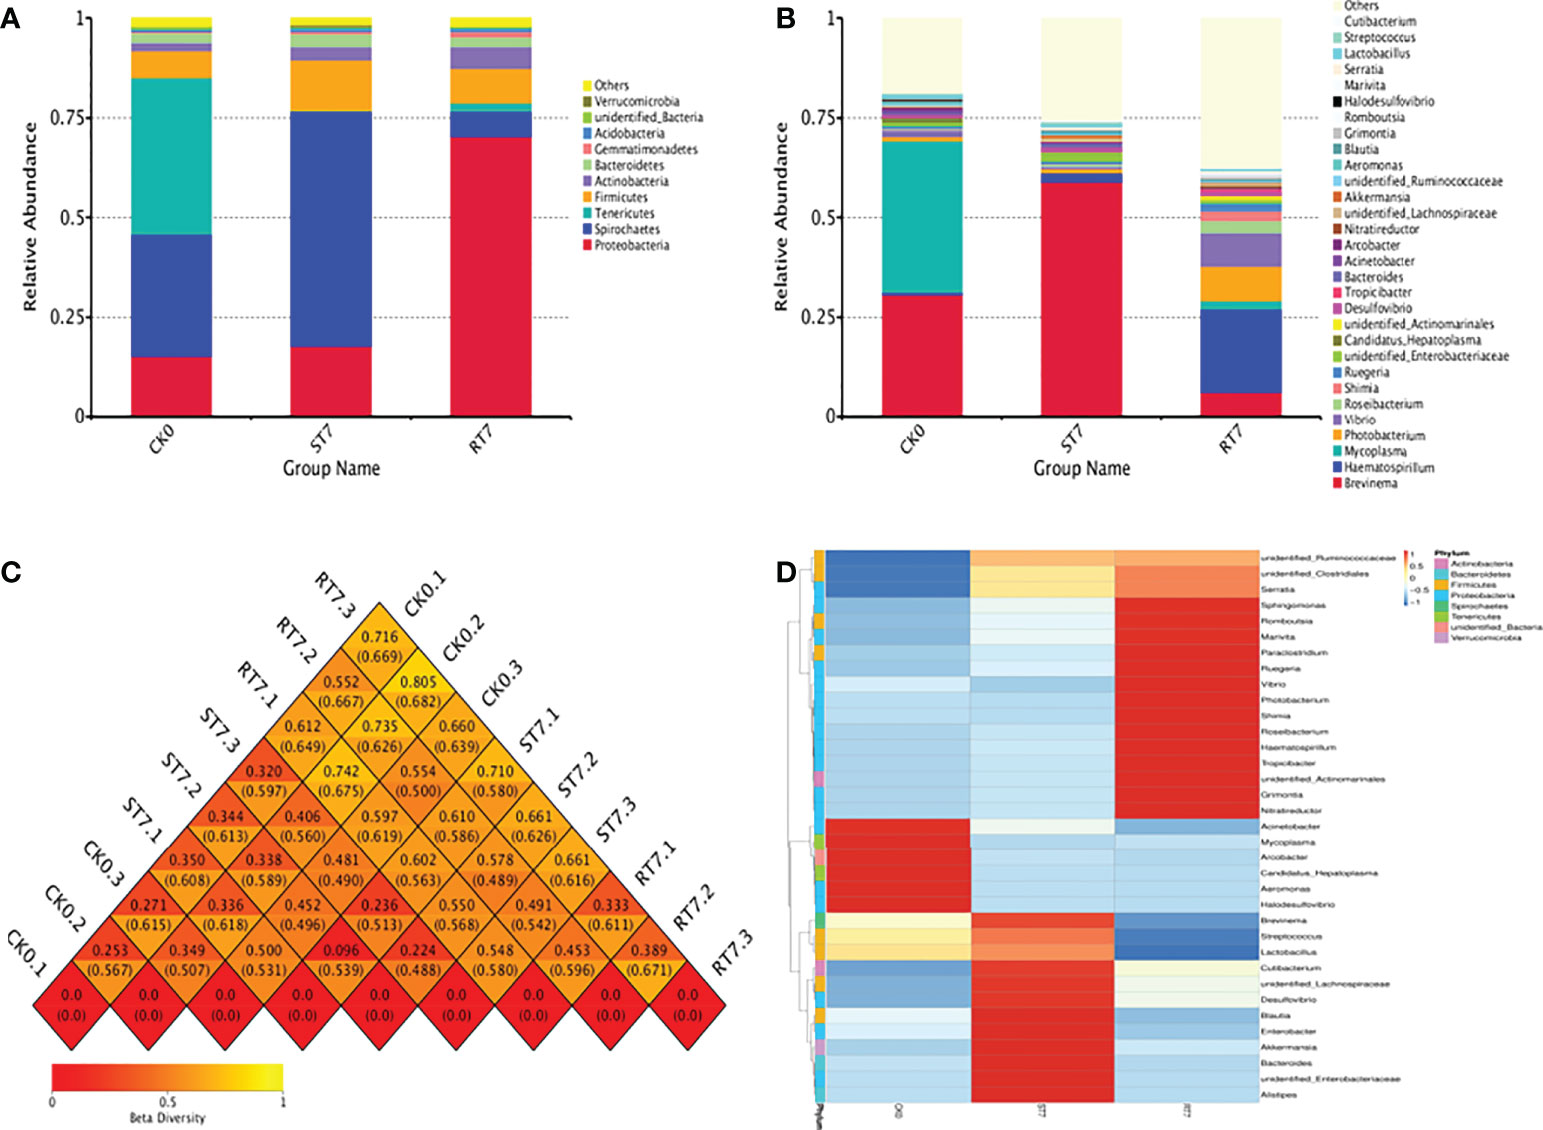
Figure 2 Alteration of intestine microbial structure. (A) Relative abundance of intestine microbial at phylum level. (B) Relative abundance of intestine microbial at genus level. (C) Heatmap of β-diversity. (D) Heatmap analysis of intestine microbial.
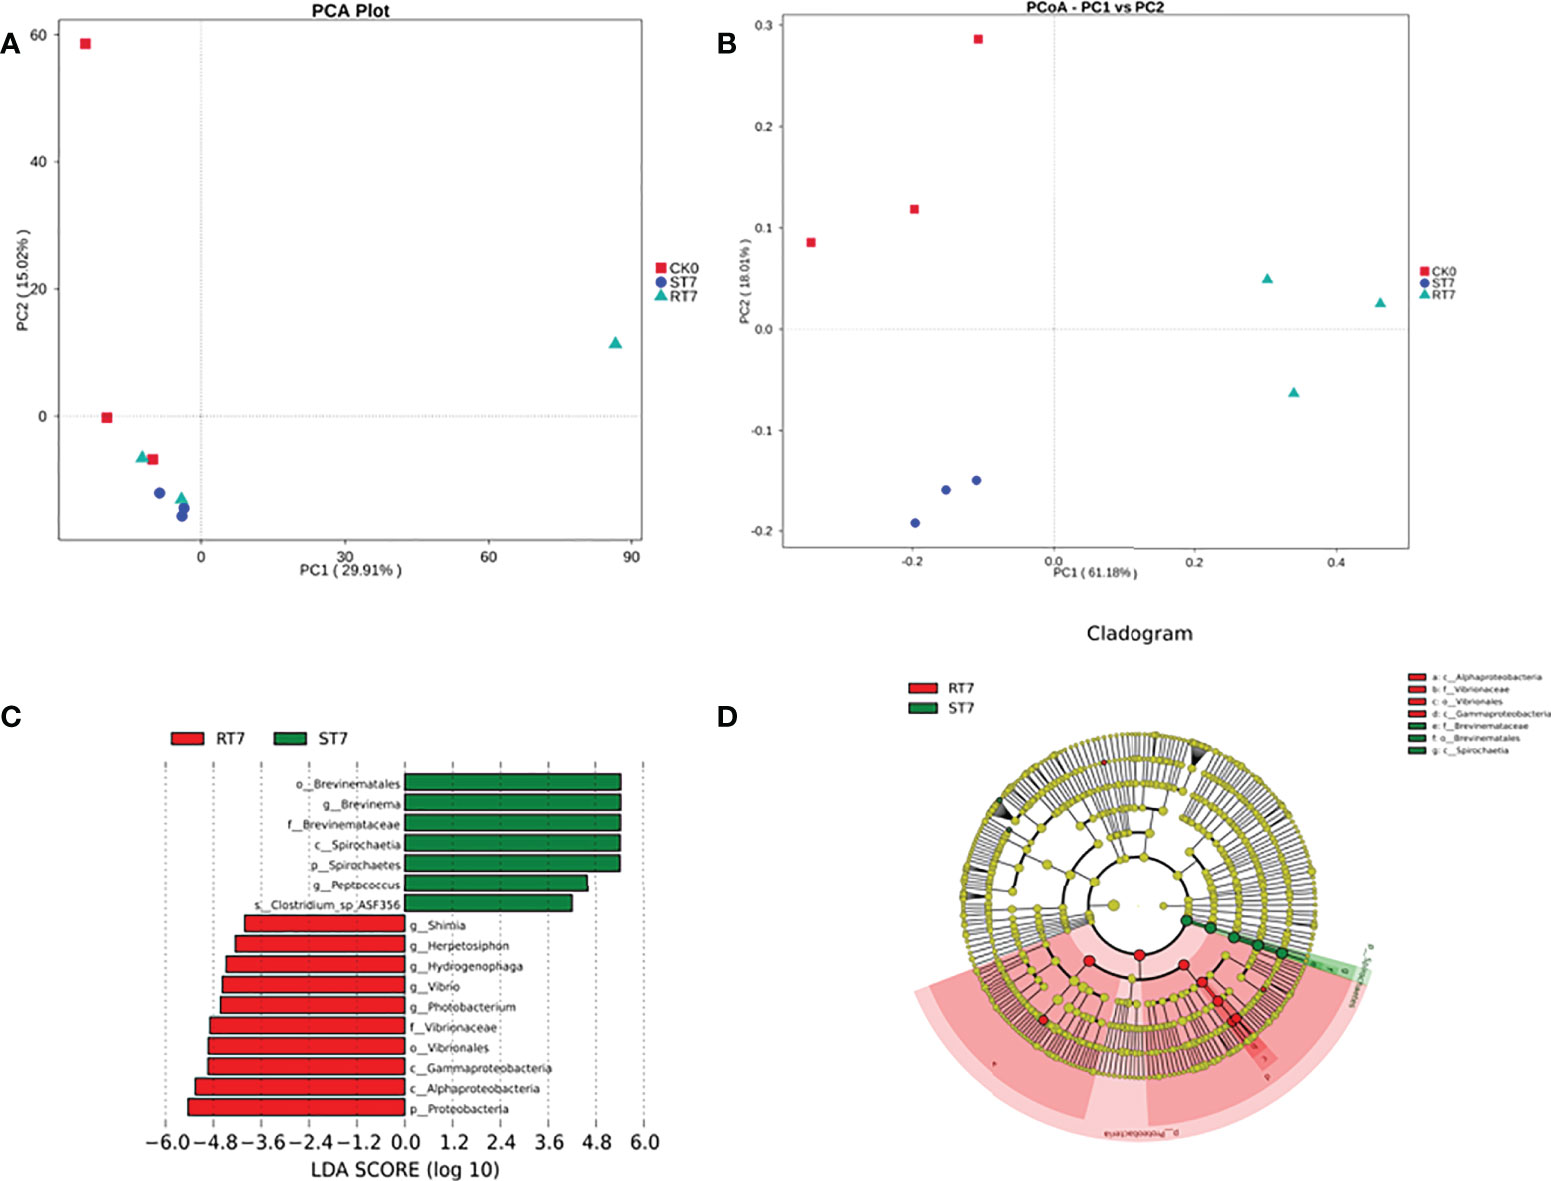
Figure 3 Inter-group variation and principal coordinates analysis (PCoA) in the relative abundance of intestine microbial communities. (A) PCoA plots based on weighted UniFrac metrics. (B) PCA plots based on unweighted UniFrac metric. (C) LDA score of Lefse-PICRUSt. The length of the column represents the effect size of bacterial lineages. (D) Lefse cladogram. The bacterial groups from family to class level are listed from center to outside. Each circle’s diameter is proportional to the bacterial taxa’s abundance. Only the taxa that linear discriminate analysis (LDA) value above 2.5 are shown.
A total of 496,000,000 raw reads were obtained from nine cDNA libraries, among which 398,000,000 were successfully annotated on the reference genome (Table 5). Differential gene expression levels were estimated using the fragments per kilobase per million map reads (FPKM) method, with red and green colors indicating highly- and lowly-expressed genes, respectively. Genes from the control and experimental groups clustered separately, while gene expression was more consistent between each parallel group of the control and experimental groups.
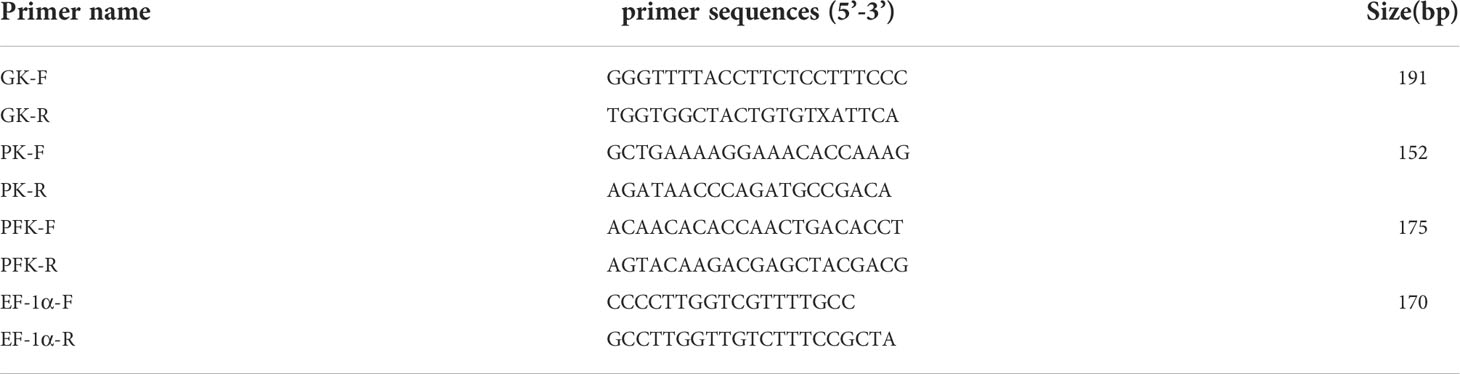
Table 5 Primers used in this study.
Differential analysis identified 1,495 DEGs (693 upregulated and 802 downregulated) in the ST7 vs. CK groups, and 2,366 DEGs (1092 upregulated and 1276 downregulated) in the ST7 vs. RT7 groups. GO analysis showed that DEGs in the ST7 vs. CK groups were mainly enriched in organonitrogen compound metabolic process, cellular amide metabolic process, organonitrogen compound biosynthetic process, and peptide metabolic process, in the “Biological Process” category; in ribosome, intracellular ribonucleoprotein complex, ribonucleoprotein complex, and cytoplasmic part, in the “Cell Component” category; and in structural constituent of ribosome, structural molecule activity, oxidoreductase activity, and serine-type endopeptidase activity, in the “Molecular Function” category (Figures 4A–D). The top 10 GO enriched terms are shown in Figure 4. Additionally, DEGs in the ST7 vs. RT7 groups were mainly enriched in oxidation-reduction process, small molecule metabolic process, lipid localization, and lipid transport in the “Biological Process” category; in structural constituent of oxidoreductase activity and peptidase activity in the “Molecular Function” category (Figures 5A, B). There top 10 GO enriched terms are shown in Figure 5.
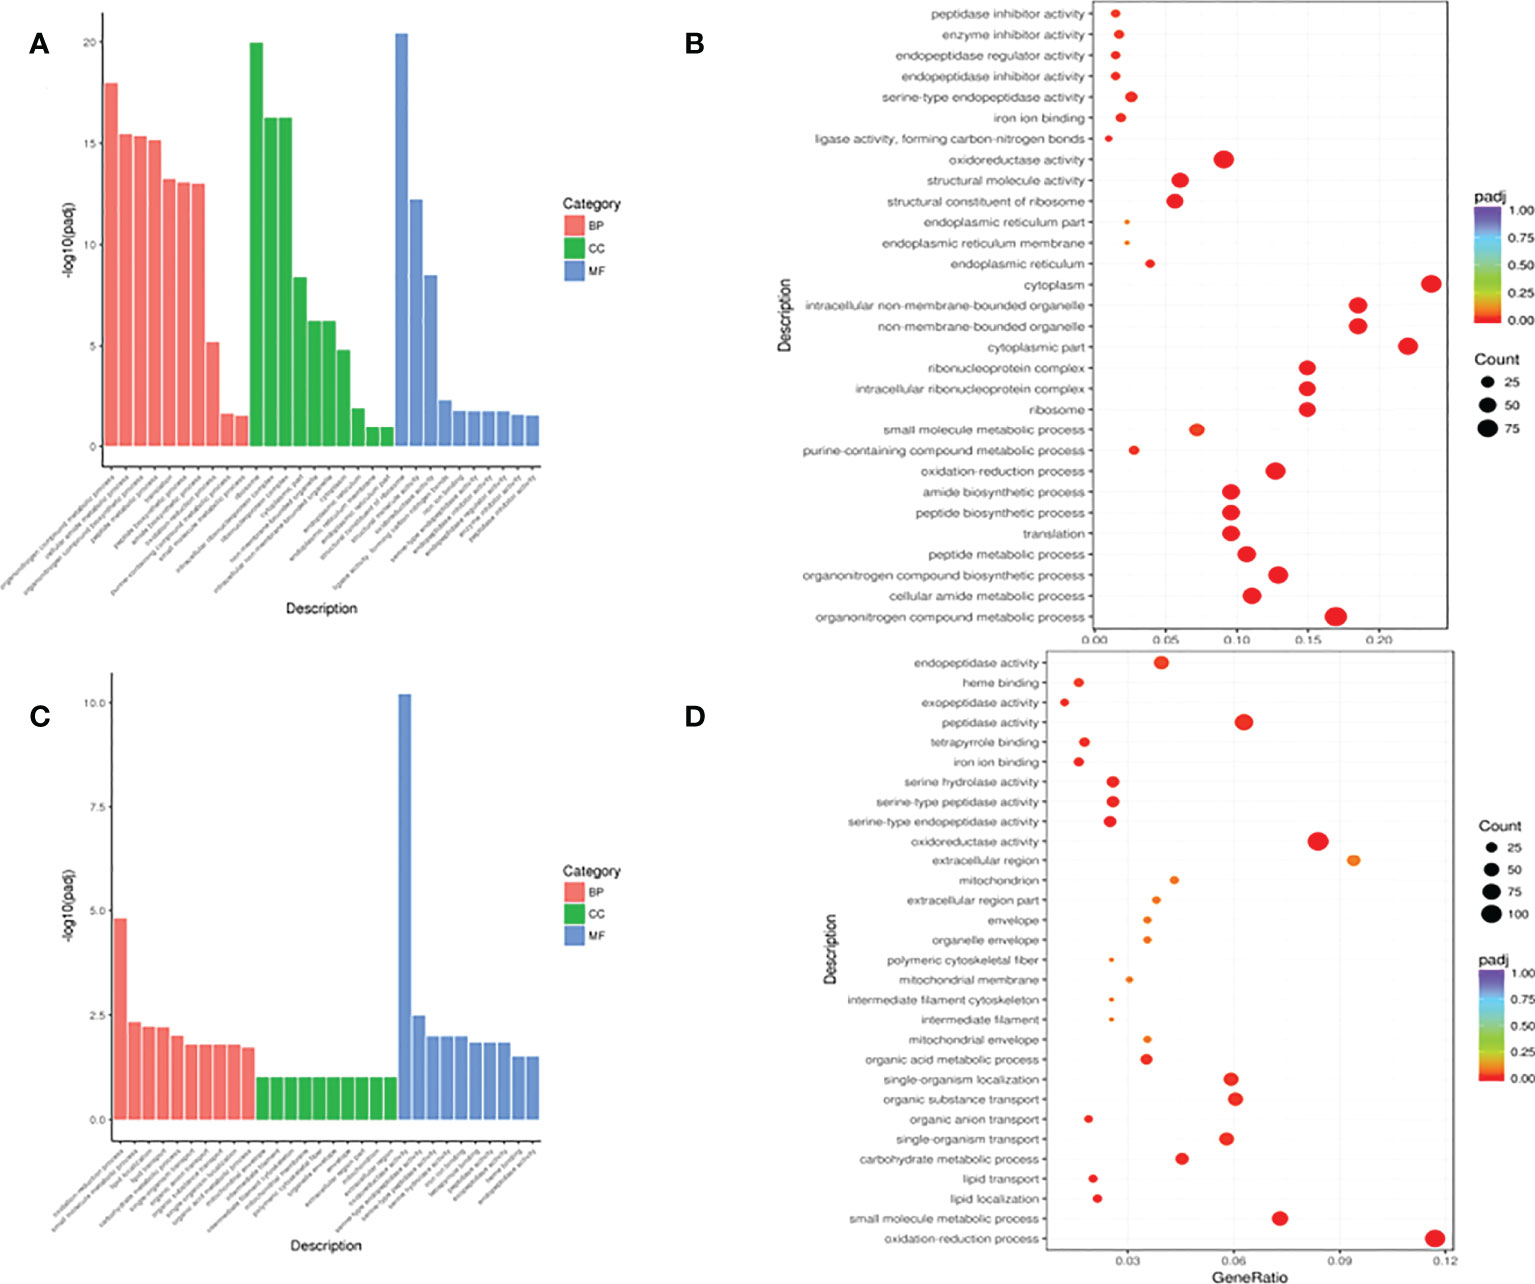
Figure 4 Gene ontology (GO) function annotation of DEGs. (A) GO annotation of DEGs in the control versus starvation groups; (B) Scatter plot of GO enrichment analysis of DEGs in the control versus starvation groups; (C) GO analysis of DEGs in the re-feeding versus starvation groups; (D) Scatter plot of GO enrichment analysis of DEGs in the re-feeding and starvation group.
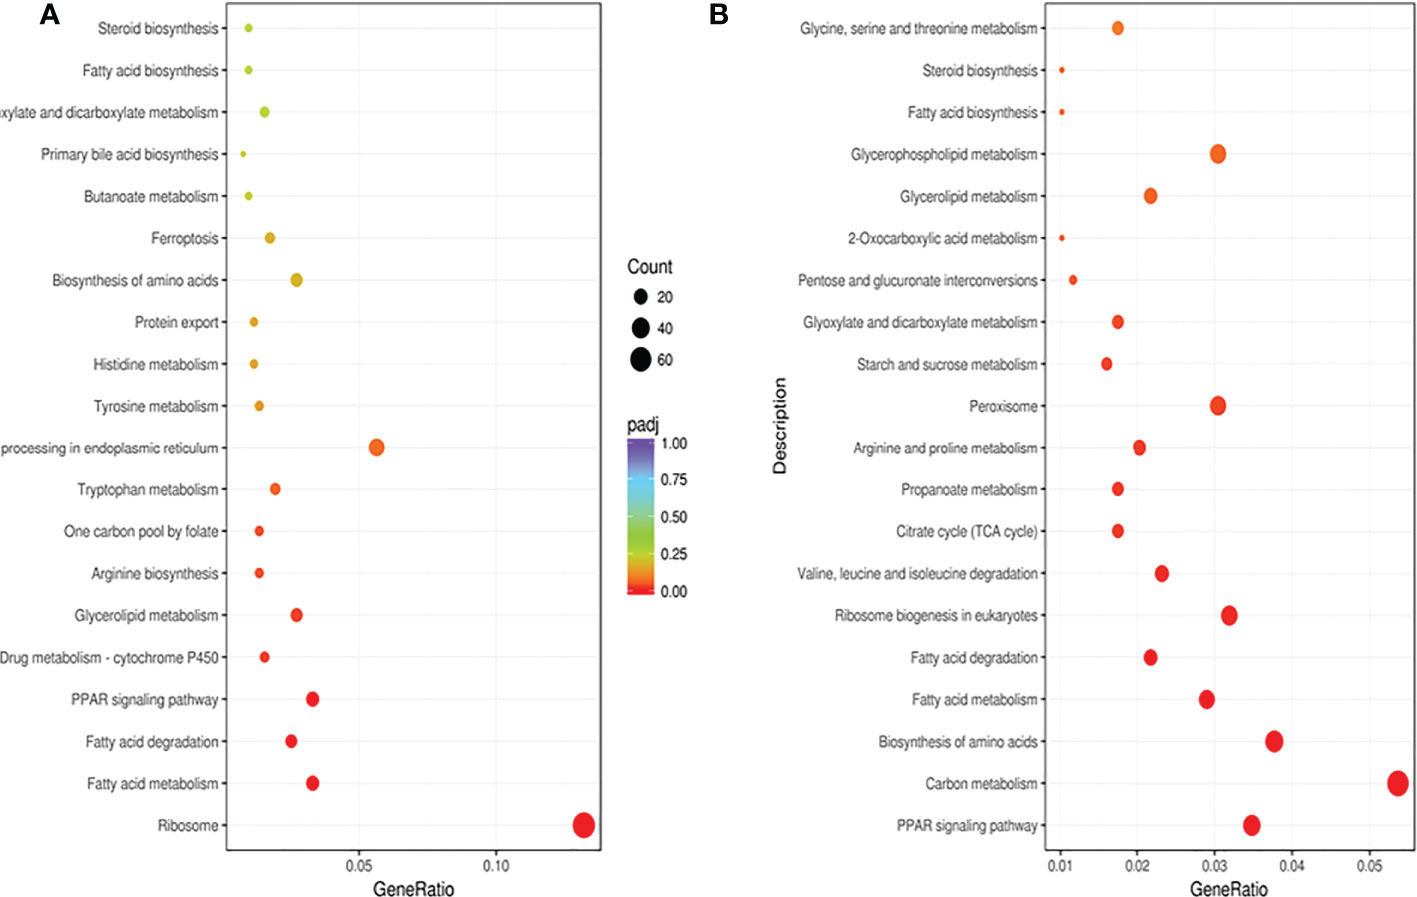
Figure 5 Kyoto Encyclopedia of Genes and Genomes (KEGG) pathway analysis of DEGs. (A) Pathway enrichment of DEGs in the control versus starvation groups; (B) Pathway enrichment of DEGs in the refeeding versus starvation groups.
KEGG pathway analysis showed that the 1,495 DEGs in the ST7 vs. CK groups were enriched in 142 pathways (Figure 6A), most of which were related to energy substance and hormone metabolism. The 2,366 DEGs in the ST7 vs. RT7 groups were enriched in 142 KEGG pathways (Figure 6B), most of which were related to energy substance metabolism, hormone metabolism, and signal transduction.
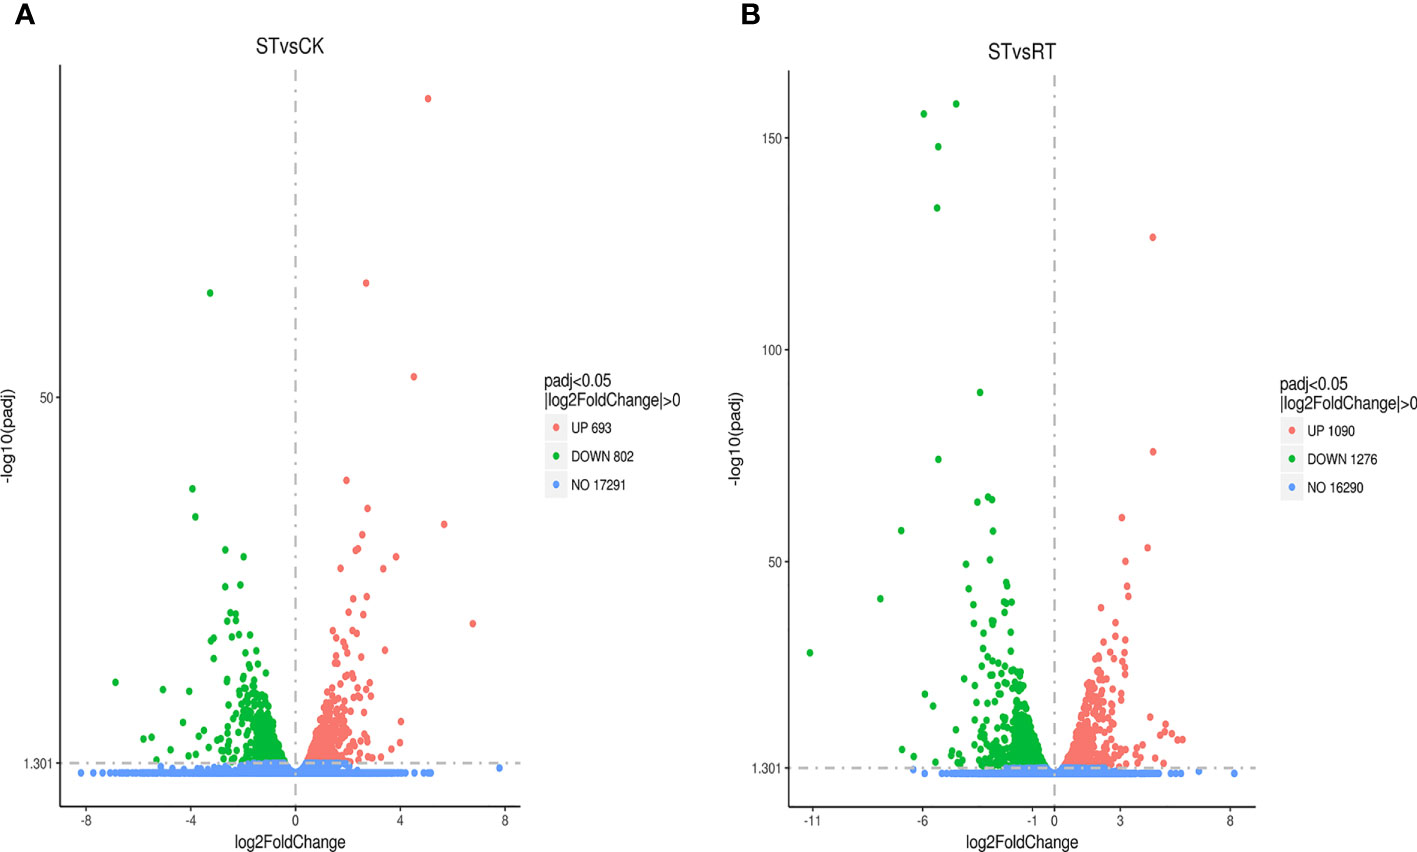
Figure 6 Differential gene statistics. (A) Volcano map of differential genes between the control group and starvation group; (B) Volcano map of differential genes between the refeeding and starvation group.
The expression profiles of three randomly selected genes (PK, GK, and PFK) were determined using qRT-PCR to validate the RNA-seq transcriptome data. The expression patterns of the three genes based on qRT-PCR were consistent with the RNA-seq data (Figure 7), indicating the specificity and accuracy of the transcriptome data. By starvation test, PK and PFK were up-regulated, while GK was down-regulated. After refeeding, PK was up-regulated, PFK and GK were down-regulated.
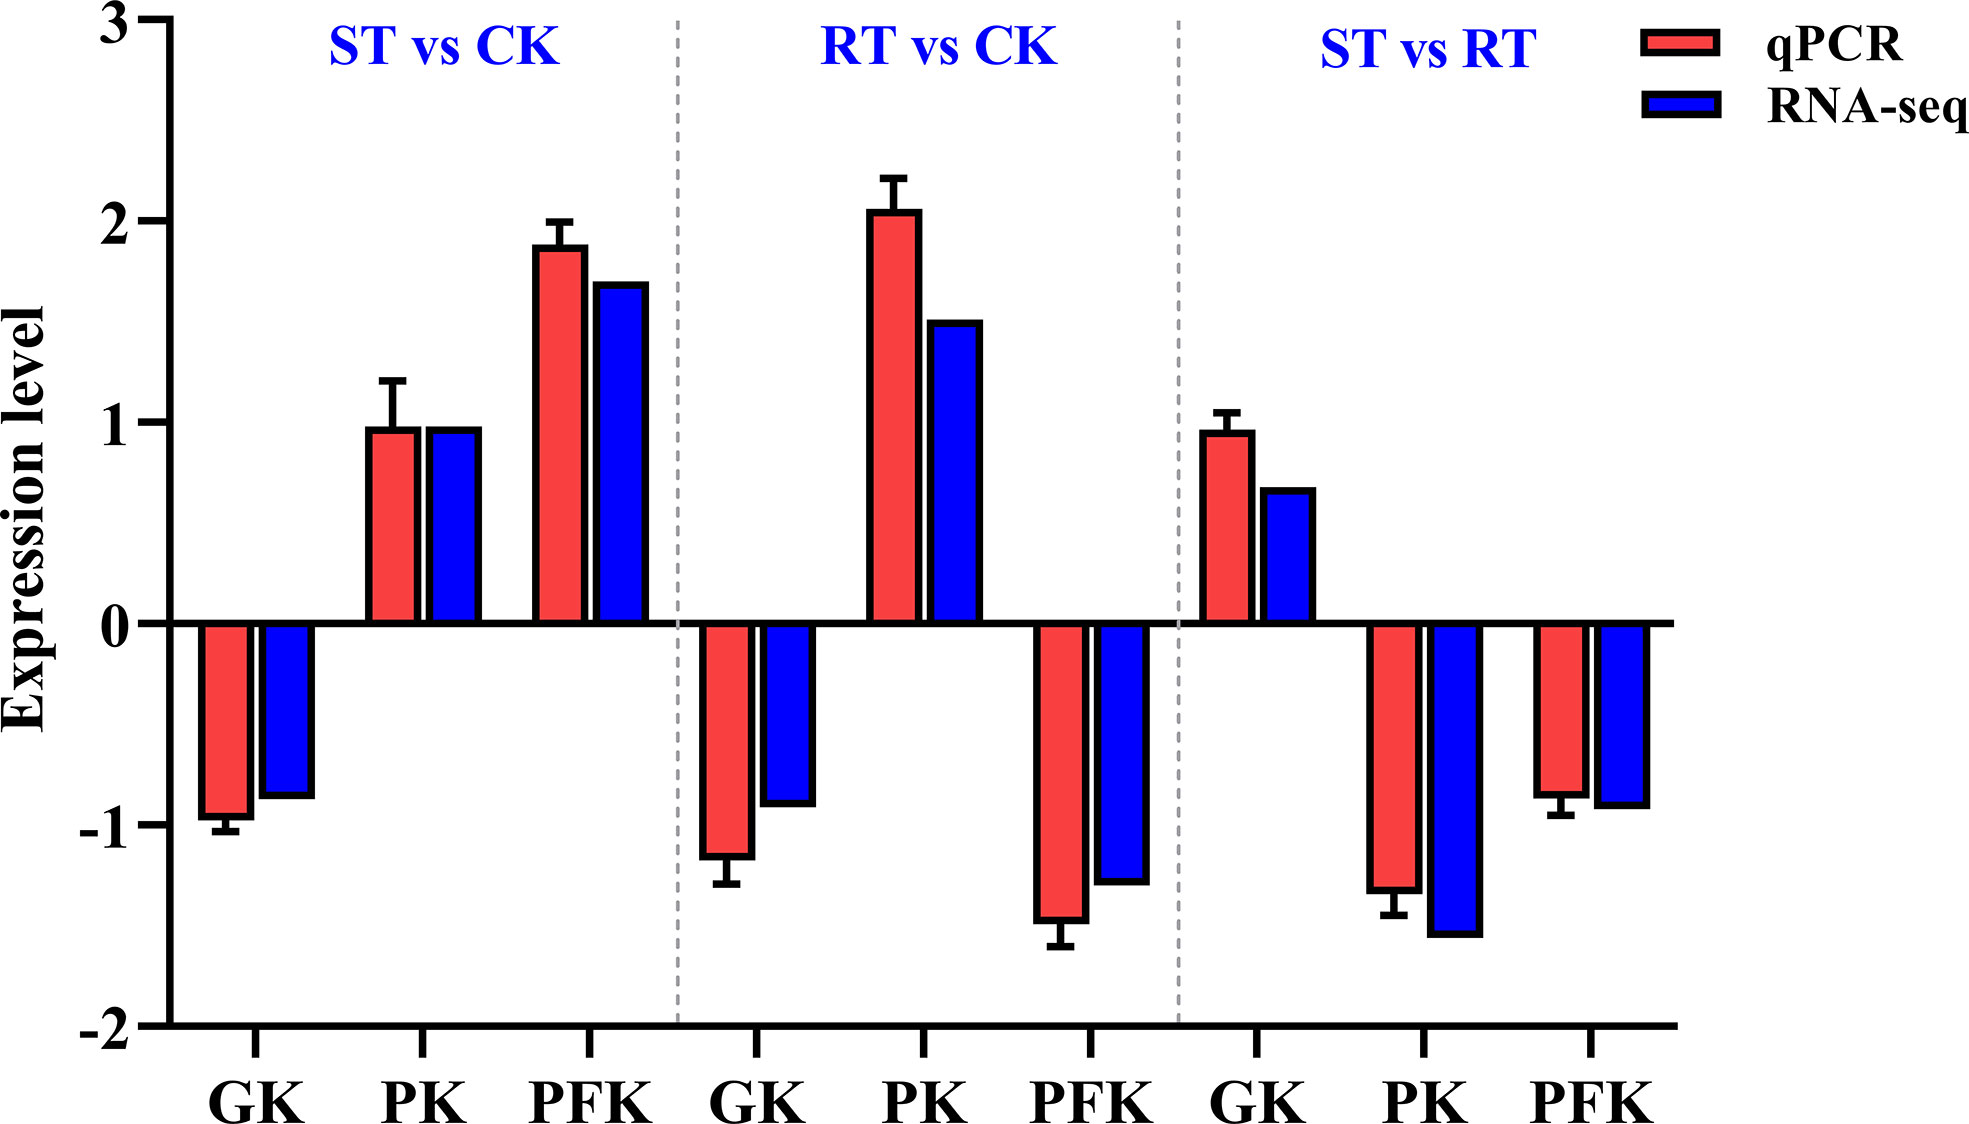
Figure 7 Comparison of gene expression between RNA-seq and quantitative real-time PCR (qRT-PCR) data.
During starvation, fish increase energy metabolism (glycogen, fat, and protein) to maintain normal body activities, resulting in weight lost (Navarro and Gutiérrez, 1995). Previous findings suggest that refeeding after short-term starvation could restore physiological functions to normal levels in fish (Metón et al., 2003; Rios et al., 2006). In the present study, the GLU level of the experimental fish decreased significantly under starvation, which was consistent with previous findings (Viegas et al., 2011; Pérez-Jiménez et al., 2012). However, fish in the CK group had higher GLU levels than those in the RT7 group, which could be attributed to the rapid utilization of glucose by the fish for compensatory growth after exposure to starvation for 7 d. Fish can use several strategies to cope with starvation, and variation have been observed in the GLU levels of fish species in response to starvation. For example, there was no significant change in glucose level in Anguilla rostrata (Suarez and Mommsen, 1987) and Clarias lazera (Navarro and Gutiérrez, 1995) after several months of starvation, whereas glucose level reduced by half in Rhamdia hilarii after 1 month of starvation (Machado et al., 1988).
TG are the most abundant lipids in the human body, and the decomposition products of TG are utilized for energy metabolism by several tissues (Grigorakis and Alexis, 2005). Under long-term starvation, TG can be decomposed to generate glycerol as a substrate in the gluconeogenesis pathway to provide energy for normal physiological activities (Grigorakis and Alexis, 2005). Consistent with previous findings (Hung et al., 1997; Pérez-Jiménez et al., 2005), fish in the CK group had significantly higher TG and lipoprotein concentrations than those in the ST group, indicating that the lipid material plays an important role in energy metabolism in fish during starvation. Fish regulate glucose metabolism during starvation by inhibiting glycolysis- and pentose phosphate-related enzymes and activating the activities of gluconeogenesis-related enzymes to maintain blood glucose balance (Pilkis and Granner, 1992; Nordlie et al., 1999). In the present study, starvation decreased the activities of glycolysis-related enzymes, including PK and PFK; however, both PFK and PK activities returned to normal after refeeding for 7 d, with PK activity significantly higher in the RT group compared with the CK group. These results indicated that starvation can inhibit the activities of glycolysis-related enzymes, and the change trends were positively correlated with blood GLU levels. However, GK activity showed a significant increase under starvation, but returned to normal after refeeding for 7 d, which was contrary to findings in Oncorhynchus mykiss (Kirchner et al., 2005), Sparus aurata (Metón et al., 2004), and hybrid grouper (Chen et al., 2022). The increase in GK activity during starvation may be due to the fact that it is the first rate-limiting enzyme in glycolytic pathway. As a substrate for glycogen synthesis, glucose plays an important role in maintaining normal physiological functions. Glycolysis promotes the decomposition and utilization of glucose, while gluconeogenesis promotes the synthesis of glucose and increases the body’s blood glucose concentration, indicating that glucose is not completely consumed under short-term starvation.
COR is an important hormone involved in maintaining normal physiological function of the body, and the concentration of COR is often used as an indicator of the stress level of fish (Fatima et al., 2018). In the present study, COR level increased after 7 d of starvation, which was consistent with previous findings in several fish species (Martinez-Porchas et al., 2009), including Garra gotyla (Sharma et al., 2017) and Salmo salar (Waagbo et al., 2017). However, refeeding for 7 d restored COR levels back to normal. These results showed that the fish responded to starvation stress by increasing cortisol levels. Starvation has a direct impact on fish health and immunity, depending on the duration of feed scarcity (Kiron, 2012). Starvation can cause an imbalance between reactive oxygen species and antioxidant defense systems, resulting in oxidative stress (Jia et al., 2016). SOD and CAT are important antioxidants in the non-specific immune system (Peter et al., 2020), and MDA is an indicator of the rate of oxidative stress-induced lipid peroxidation (Zhao et al., 2014). In the present study, starvation increased SOD and CAT activities in the fish, which was consistent with previous findings (Morales et al., 2004). Moreover, MDA levels were higher in the ST7 group compared with the RT7 group, which was consistent with findings in Pseudosciaena crocea (Zhang et al., 2008). These results showed that starvation-induced stress affected MDA activity in fish (Han et al., 2018). Proper nutrition plays an important role in the immune status of fish (Cotter et al., 2019). In the present study, there was an increase in the activities of LYZ, ACP, and ALP during starvation, which was similar to findings in Hippocampus erectus (Su et al., 2022) and Rutilus rutilus (Abolfathi et al., 2012). LYZ, ACP, and ALP play important roles in nonspecific immunity and immune regulation (Rojtinnakorn et al., 2002; Foss et al., 2009; Lalles, 2019). However, the activities of LYZ, ACP, and ALP decreased after refeeding for 7 d.
The role of the intestinal microbiota in nutrient allocation and physiological regulation in animals cannot be overemphasized (Zhang et al., 2016). Studies have shown that the restoration of feed after short-term feed deprivation increases the energy source and the relative abundance of intestinal microorganisms. Moreover, feed availability causes increased competition between intestinal microbial species, which can affect species abundance, leading to the emergence of dominant species (Li et al., 2014). In the present study, the intestinal microbial diversity of golden pompano was in the order of RT7 > CK0 > ST7, which was consistent with findings in Carassius auratus (Li et al., 2014). During starvation, the body and intestinal microbiota is faced with energy crisis, inducing a decrease in the size of the intestine (Starck, 2003; Karasov et al., 2004; Zaldúa and Naya, 2014). Moreover, the composition and diversity of the intestinal microbiota is also affected by starvation. For example, the intestinal microbiota of zebrafish showed a downward trend under starvation stress (Semova et al., 2012). The intestinal microbiota diversity is closely related to the host’s health (Flint et al., 2008; Pérez et al., 2010; Clemente et al., 2012). Studies have shown that human diarrhea and obesity caused by Clostridium are related to intestinal microbiota community diversity, and increased intestinal microbiota diversity can improve huma health (Ott et al., 2004; Clarke et al., 2014). In aquatic animals, red-operculum disease has been shown to reduce the intestinal microbiota diversity of fish (Li et al., 2017). Additionally, shrimps with white stool syndrome had lower intestinal microbiota diversity than healthy individuals (Hou et al., 2018). Since the host’s intestinal environment is closely related to the surrounding environment, the intestinal microbiota diversity and composition of aquatic animals is highly susceptible to changes in the water environment, food, and other factors. There were differences in the dominant phyla between the ST7 and RT7 groups, indicating that the resumption of feeding after starvation affected the abundance of the dominant phyla, but not the types of dominant bacteria. Starvation and refeeding may have some effects on the abundance and species diversity of the intestinal microbiota of fish (Dhanasiri et al., 2011; Claesson et al., 2012).
Starvation and compensatory growth are common phenomena in the natural environment. In the present study, the compensatory growth phenomenon was observed in the fish after refeeding for 7 d, which was consistent with findings in S. salar (Martin et al., 2010), C. Idella (He et al., 2015), O. mykiss (Rescan et al., 2017), Megalobrama amblycephala (Zhu et al., 2014), and Spinibarbus hollandi (Yang et al., 2019). After short-term starvation, refeeding can promote rapid weight gain (compensatory growth) in fish; however, this might be affected by feed intake and food conversion rate (Jobling and Johansen, 1999). Starvation has considerable effects on animal physiology, altering cellular processes in several tissues. The liver is an important organ of metabolism in aquatic animals, and it is involved in energy metabolism, substance synthesis and secretion, and immune response. In the present study, the mRNA level of GK was downregulated in the ST7 and RT7 groups, but PK expression was upregulated, which was consistent with the respective levels of the enzymes in the fish. The upregulated DEGs in the ST7 vs. CK groups were mainly involved in lipid and glucose metabolism and protein degradation and metabolism. The upregulated DEGs in the ST7 vs. RT7 groups were mainly involved in ribosomal proteins, stimulus responses, and carbohydrate metabolism, which was similar to findings in Danio rerio (Jawahar et al., 2022) and trout (Rescan et al., 2017). These results suggested that the adaptive physiology exhibited during starvation is reversible after refeeding in golden pompano.
KEGG pathway analysis showed the DEGs were significantly enriched in complement and coagulation cascade, fat digestion and absorption, steroid biosynthesis, and peroxidase proliferator activated receptor signaling pathway, which was consistent with findings in Larimichthys crocea (Qian et al., 2016). These results confirmed the positive regulatory role of the above pathways in hormone synthesis and energy metabolism in golden pompano during starvation and refeeding. Starvation decreases nutrient metabolism in fish. However, the lower metabolic level is maintained for a while when refeeding is resumed, which could increase the proportion of energy used for growth, thereby increasing food conversion rate and inducing compensatory growth (Dobson and Holmes, 1984; Miglavs and Jobling, 1989). Moreover, the increased appetite and feed intake after starvation period could also contribute to compensatory growth (Myung and Richard, 1995). During short-term starvation, fish metabolize body fat to generate energy, resulting in a decrease in fish body fat, which can trigger compensatory growth (Jobling et al., 1993). For example, Acanthopagrus schlegelii uses both fat and glycogen during starvation (Lou et al., 2006) and Sciaenops ocellatus uses mainly fat as energy source (Jiang et al., 2002). However, some fish species, including Lutjanus sebae, have been reported to mainly metabolize proteins during starvation to meet energy demand (Ou and Liu, 2007), indicating that different species utilize different energy storage materials during starvation. The liver is the main organ for energy metabolism and synthesis. During immune response, the liver rapidly produces acute phase response proteins to assist in the degradation of invading pathogens (Houlihan et al., 1986). The liver suppresses protein synthesis during starvation mainly through the reduction of multiple hormone signals (Gabillard et al., 2006). Moreover, protein synthesis is inhibited following reduced protein intake in fish, which might be a conserved response (Martin et al., 2010). Although protein synthesis and degradation reaches a certain balance during starvation, the overall shift is usually towards degradation, as evidenced by low serum protein levels during starvation (Peragon et al., 1999; Martin et al., 2002; Wang et al., 2006).
In summary, the impacts of starvation and refeeding on the growth, immune response, and gut microbiota of T. ovatus was examined. Starvation significant affected the activities of carbohydrate metabolism enzymes and increased the concentrations of COR, SOD, MDA, CAT, ALP ACP and LYZ. However, refeeding for 7 d restored most of the indices to their normal levels. Additionally, starvation increased the α-diversity of the gut microbial community, which was not affected by refeeding. Liver transcriptome analysis revealed that starvation and refeeding of affected protein, lipid, and steroid metabolism. Overall, these findings contribute to our understanding of how to fish respond to short starvation and refeeding, providing useful information for improving aquaculture management.
The datasets presented in this study can be found in online repositories. The names of the repository/repositories and accession number(s) can be found below: https://www.ncbi.nlm.nih.gov/- PRJNA863414, PRJNA863419.
All experiments in this study were approved by the Animal Care and Use Committee of South China Sea fisheries Research Institute, Chinese Academy of fishery Sciences (no. SCSFRI96-253) and performed according to the regulations and guidelines established by this committee. Written informed consent was obtained from the owners for the participation of their animals in this study.
BL, HG and D-CZ designed the research and wrote the paper. BL, HG and B-SL performed the experiments. BL, HG, B-SL, NZ, LG, and J-WY contributed to sample collection. BL analyzed the data and wrote the paper. SJ and D-CZ assisted with writing and proofreading. All authors contributed to the article and approved the submitted version.
This study was supported by the earmarked fund for the CARS-47, Key areas of Guangdong province research and development projects (2021B0202020002), Central Public-interest Scientific Institution Basal Research Fund CAFS (NO.2020TD29), Financial Fund of Ministry of Agriculture and Rural affairs of China (NHYYSWZZZYKZX2020), Key Special Project for Introduced Talents Team of Southern Marine Science and Engineering Guangdong Laboratory (Guangzhou) (GML2019ZD0605).
The authors declare that the research was conducted in the absence of any commercial or financial relationships that could be construed as a potential conflict of interest.
All claims expressed in this article are solely those of the authors and do not necessarily represent those of their affiliated organizations, or those of the publisher, the editors and the reviewers. Any product that may be evaluated in this article, or claim that may be made by its manufacturer, is not guaranteed or endorsed by the publisher.
Abolfathi M., Hajimoradloo A., Ghorbani R., Zamani A. (2012). Effect of starvation and refeeding on digestive enzyme activities in juvenile roach, Rutilus rutilus caspicus. Comp. Biochem. Physiol. A 161, 166–173. doi: 10.1016/j.cbpa.2011.10.020
Blanquet I., Oliva-Teles A. (2010). Effect of feed restriction on the growth performance of turbot (Scophthalmus maximus l.) juveniles under commercial rearing conditions. Aquac. Res. 41 (8), 1255–1260.
Chen G. F., Qian J. H., Liu H. Y., Tian B. P., Dong X. H., Yang Q. H., et al. (2022). Metabolic responses of hybrid grouper (♀Epinephelus fuscoguttatus ×♂E. lanceolatus) induced by different feeding modes: Effects on growth, serum biochemical indices, intestinal digestion and hepatic metabolism of glucose and lipid. Aquac. Res. 53, 2708–2723. doi: 10.1111/are.15787
Claesson M. J., Jeffery I. B., Conde S. (2012). Gut microbiota composition correlates with diet and health in the elderly. Nature 488 (7410), 178–184.
Clarke S. F., Murphy E. F., O’Sullivan O., Lucey A. J., Humphreys M., Hogan A., et al. (2014). Exercise and associated dietary extremes impact on gut microbial diversity. Gut 63 (12), 1913–1920. doi: 10.1136/gutjnl-2013-306541
Clemente J. C., Ursell L. K., Parfrey L. W., Knight R. (2012). The impact of the gut microbiota on human health: an integrative view. Cell 148 (6), 1258–1270. doi: 10.1016/j.cell.2012.01.035
Cotter S. C., Reavey C. E., Tummala Y., Randall J. L., Holdbrook R., Ponton F., et al. (2019). Diet modulates the relationship between immune gene expression and functional immune responses. Insect Biochem. Mol. Biol. 109, 128–141. doi: 10.1016/j.ibmb.2019.04.009
Dehler C. E., Secombes C. J., Martin S. A. (2016). Environmental and physiological factors shape the gut microbiota of Atlantic salmon parr (Salmo salar l.). Aquaculture 467, 149–157. doi: 10.1016/j.aquaculture.2016.07.017
Dhanasiri A. K., Brunvold L., Brinchmann M. F., Korsnes K., Bergh O., Kiron V., et al. (2011). Changes in the intestinal microbiota of wild Atlantic cod Gadus morhua l. upon captive rearing. Microb. Ecol. 61, 20–30. doi: 10.1007/s00248-010-9673-y
Dobson S. H., Holmes R. M. (1984). Compensatory growth in the rainbow trout, Salmo gairdneri Richardson. J. Fish. Biol. 25, 649–656. doi: 10.1111/j.1095-8649.1984.tb04911.x
Edgar R. C. (2004). MUSCLE: multiple sequence alignment with high accuracy and high throughput. Nucleic Acids Res. 32, 1792–1797. doi: 10.1093/nar/gkh340
Edgar R. C. (2013). UPARSE: highly accurate OTU sequences from microbial amplicon reads. Nat. Methods 10, 996–998. doi: 10.1038/nmeth.2604
Elbialy Z. I., Gamal S., Al−Hawary I. I., Shukry M., Salah A. S., Aboshosha A. A., et al. (2022). Exploring the impacts of diferent fasting and refeeding regimes on Nile tilapia (Oreochromis niloticus l.): growth performance, histopathological study, and expression levels of some muscle growth−related genes. Fish. Physiol. Biochem. 48, 973–989. doi: 10.1007/s10695-022-01094-0
Fatima S., Izhar S., Usman Z., Rashid F., Kanwal Z., Jabeen G., et al. (2018). Effects of high stocking density on condition factor and profile of free thyroxine and cortisol in Catla catla (Hamilto) and Labeo rohita (Hamilton 1822). Turk. J. Fish. Aquat. Sci. 18, 217–221. doi: 10.4194/1303-2712-v18_1_25
Flint H. J., Bayer E. A., Rincon M. T., Lamed R., White B. A. (2008). Polysaccharide utilization by gut bacteria: potential for new insights from genomic analysis. Nat. Rev. Microbiol. 6 (2), 121–131. doi: 10.1038/nrmicro1817
Flint H. J., Scott K. P., Louis P., Duncan S. H. (2012). The role of the gut microbiota in nutrition and health. Nat. Rev. Gastro. Hepat. 9 (10), 577–589. doi: 10.1038/nrgastro.2012.156
Foss A., Imsland A., Roth B., Schram E., Stefanssonc S. O. (2009). Effects of chronic and periodic exposure to ammonia on growth and blood physiology in juvenile turbot (Scophthalmus maximus). Aquaculture 296, 45–50. doi: 10.1016/j.aquaculture.2009.07.013
Gabillard J. C., Kamangar B. B., Montserrat N. (2006). Coordinated regulation of the GH/IGF system genes during refeeding in rainbow trout (Oncorhynchus mykiss). J. Endocrinol. 191 (1), 15–24. doi: 10.1677/joe.1.06869
Ghanbari M., Kneifel W., Domig K. J. (2015). A new view of the fish gut microbiome: Advances from next-generation sequencing. Aquaculture 448, 464–475. doi: 10.1016/j.aquaculture.2015.06.033
Grigorakis K., Alexis M. N. (2005). Effects of fasting on the meat quality and fat deposition of commercial-size farmed gilthead sea bream (Sparus aurata, l.) fed different dietary regimes. Aquac. Nutr. 11 (5), 341–344.
Guderley H., Lapoin D., Bedard M., Dutil J. D. (2003). Metabolic priorities during starvation: enzyme sparing in liver. Comp. Biochem. Physiol. A 135, 347–356. doi: 10.1016/S1095-6433(03)00089-8
Han S., Wang M., Wang B., Liu M., Jiang K. Y., Wang L., et al. (2018). A comparative study on oxidative stress response in the hepatopancreas and midgut of the white shrimp Litopenaeus vannamei under gradual changes to low or high pH environment. Fish. Shellfish Immunol. 76, 27–34. doi: 10.1016/j.fsi.2018.02.001
He L., Pei Y., Jiang Y., Li Y., Liao L., Zhu Z., et al. (2015). Global gene expression patterns of grass carp following compensatory growth. BMC Genomics 16 (1), 184. doi: 10.1186/s12864-015-1427-2
Houlihan D. F., McMillan D. N., Laurent P. (1986). Growth-rates, protein-synthesis, and protein-degradation rates in rainbow-trout-effects of body size. Appl. Microbiol. Biotechnol. 59 (4), 482–493. doi: 10.1086/physzool.59.4.30158601
Hou D., Huang Z., Zeng S., Liu J., Wei D., Deng X., et al (2018). Intestinal bacterial signatures of white feces syndrome in shrimp. Physiol. Zool. 102 (8), 3709–3709. doi: 10.1007/s00253-018-8855-2
Huang G., Wei L., Zhang X., Gao T. (2008). Compensatory growth of juvenile brown flounder Paralichthys olivaceus (Temminck & schlegel) following thermal manipulation. J. Fish. Biol. 72 (10), 2534–2542. doi: 10.1111/j.1095-8649.2008.01863.x
Hung S. S. O., Wei L., Li H., Storebakken T., Cui Y. (1997). Effect of starvation on some morphological and biochemical parameters in white sturgeon, acipenser transmontanus. Aquaculture 151 (1-4), 357–363. doi: 10.1016/S0044-8486(96)01506-2
Jawahar J., McCumber A. W., Lickwar C. R., Amoroso C. R., Canny S. T., Wong S., et al. (2022). Starvation causes changes in the intestinal transcriptome and microbiome that are reversed upon refeeding. BMC Genomics 23, 225. doi: 10.1186/s12864-022-08447-2
Jia R., Liu B. L., Han C., Huang B., Lei J. L. (2016). Influence of stocking density on growth performance, antioxidant status, and physiological response of juvenile turbot, Scophthalmus maximu, reared in land-based recirculating aquaculture system. J. World Aquacult. Soc. 47 (4), 587–599. doi: 10.1111/jwas.12295
Jiang Z. Q., Jia Z. M., Han Y. B. (2002). The compensatory growth and its mechanismin of red drum, Sciaenops ocellatus, after food deprivation. Jouranl. fish. China 26 (1), 62–72.
Jobling M., Johansen S. J. S. (1999). The lipostat, hyperphagia and catch-up growth. Aquac. Res. 30 (7), 473–478. doi: 10.1046/j.1365-2109.1999.00358.x
Jobling M., Jorgensen E. H., Siikavuopio S. I. (1993). The influence of previous feeding regime on the compensatory growth response of maturing and immature Arctic charr, salvelinus alpines. J. Fish. Biol. 43 (3), 409–419. doi: 10.1111/j.1095-8649.1993.tb00576.x
Karasov W. H., Pinshow B., Starck J. M., Afik D. (2004). Anatomical and histological changes in the alimentary tract of migrating blackcaps (Sylvia atricapilla): A comparison among fed, fasted, food-restricted, and refed birds. Physiol. Biochem. Zool. 77 (1), 149–160. doi: 10.1086/381465
Keogh K., Kenny D. A., Cormican P., Kelly A. K., O'Shea E., Kenny D.A., et al. (2016). Effect of dietary restriction and subsequent re-alimentation on the transcriptional profile of hepatic tissue in cattle. BMC Genomics 17, 244. doi: 10.1186/s12864-016-2578-5
Kirchner S., Seixas P., Kaushik S., Panserat S. (2005). Effects of low protein intake on extra-hepatic gluconeogenic enzyme expression and peripheral glucose phosphorylation in rainbow trout (Oncorhynchus mykiss). Comp. Biochem. Physiol. B 140 (2), 333–340. doi: 10.1016/j.cbpc.2004.10.019
Kiron V. (2012). Fish immune system and its nutritional modulation for preventive health care. Anim. Feed Sci. Technol. 173, 111–133. doi: 10.1016/j.anifeedsci.2011.12.015
Lalles J. (2019). Biology, environmental, and nutritional modulation of skin mucus alkaline phosphatase in fish: a review. Fish. Shellfish Immunol. 89, 179–186. doi: 10.1016/j.fsi.2019.03.053
Li T., Li H., Gatesoupe F. J., She R., Lin Q., Yan X. F., et al. (2017). Bacterial signatures of “red-operculum” disease in the gut of crucian carp (Carassius auratus). Microb. Ecol. 74 (3), 510–521. doi: 10.1007/s00248-017-0967-1
Li J., Ni J., Li J., Wang C., Li X., Wu S., et al. (2014). Comparative study on gastrointestinal microbiota of eight fish species with different feeding habits. J. Appl. Microbiol. 117 (6), 1750–1760. doi: 10.1111/jam.12663
Liu B., Guo H. Y., Zhu K. C., Guo L., Liu B. S., Zhang N., et al. (2019). Growth, physiological and molecular responses of golden pompano Trachinotus ovatus (Linnaeus 1758) reared at different salinities. Fish. Physiol. Biochem. 45, 1879–1893. doi: 10.1007/s10695-019-00684-9
Liu B., Guo H. Y., Zhu K. C., Zhu K. C., Guo L., Liu B. S., et al. (2020). Functional characterization of NK-lysin in golden pompano Trachinotus ovatus (Linnaeus 1758). Dev. Comp. Immunol. 107, 103658. doi: 10.1016/j.dci.2020.103658
Liu L., Li C., Su B., Beck B. H., Peatman E. (2013). Short-term feed deprivation alters immune status of surface mucosa in channel catfish (Ictalurus punctatus). PloS One 8, e74581. doi: 10.1371/journal.pone.0074581
Liu X. L., Xi Q. Y., Yang L., Li H. Y., Jiang Q. Y., Shu G., et al. (2011). The effect of dietary panax ginseng polysaccharide extract on the immune responses in white shrimp, litopenaeus vannamei. Fish. Shellfish Immunol. 30, 495–500. doi: 10.1016/j.fsi.2010.11.018
Livak K.J., Schmittgen T.D.. (2001). Analysis of relative gene expression data using real-time quantitative PCR and the 2(−Delta Delta C(T)) method. Methods 25 (4), 402–408. doi: 10.1006/meth.2001.1262
Li X. H., Yan Q. Y., Hu H. J. (2014). Effects of refeeding on the diversity of intestinal microflora in allogynogenetic crucial carp (Carassius auratus gibelio). Acta Hydro. biol. Sin. 38 (5), 854–859.
Li X., Yu Y., Feng W., Yan Q., Gong Y. (2012). Host species as a strong determinant of the intestinal microbiota of fish larvae. J. Microbiol. 50 (1), 29–37. doi: 10.1007/s12275-012-1340-1
Lou B., Mao G. M., Luo J. A., Luo J. A. (2006). Compensatory growth response following period of starvation in spatus macrocephalus. J. Zhejiang Ocean Univ. 25 (4), 385–389. doi: 1008-830X(2006)04-0385-05
Machado C. R., Garofalo M. A., Roselino J. E., Kettelhut I.C., Migliorini R.H. (1988). Effects of starvation, refeeding, and insulin on energy-linked metabolic processes in catfish (Rhamdia hilarii) adapted to a carbohydrate-rich diet. Gen. Comp. Endocrinol. 71 (3), 429–437. doi: 10.1016/0016-6480(88)90272-9
Maclean A., Metcalfe N. B. (2001). Social status, access to food, and compensatory growth in juvenile Atlantic salmon. J. Fish. Biol. 58 (5), 1331–1346. doi: 10.1111/j.1095-8649.2001.tb02290.x
Ma Q. W., Guo H. Y., Zhu K. C., Guo L., Liu B. S., Zhang N., et al. (2021). Dietary taurine intake affects growth and taurine synthesis regulation in golden pompano, Trachinotus ovatus (Linnaeus 1758). Aquaculture 530, 735918. doi: 10.1016/j.aquaculture.2020.735918
Martin S. A. M., Blaney S., Bowman A. S., Houlihan D. (2002). Ubiquitin-proteasome-dependent proteolysis in rainbow trout (Oncorhynchus mykiss): effect of food deprivation. Pflug Arc Eur. J. Phy 445 (2), 257–266. doi: 10.1007/s00424-002-0916-8
Martin S. A. M., Douglas A., Houlihan D. F., Secombes C. J. (2010). Starvation alters the liver transcriptome of the innate immune response in Atlantic salmon (Salmo salar). BMC Genomics 11, 418. doi: 10.1186/1471-2164-11-418
Martinez-Porchas M., Martinez-Cordova L. R., Ramos-Enriquez R. (2009). Cortisol and glucose: reliable indicators of fish stress. Pan-Am J. Aquat. Sci. 4, 158–178.
Metón I., Caseras A., Fernández F., Baanante I. V. (2004). Molecular cloning of hepatic glucose-6-phosphatase catalytic subunit from gilthead sea bream (Sparus aurata): response of its mRNA levels and glucokinase expression to refeeding and diet composition. Comp. Biochem. Physiol. B 138 (2), 145–153. doi: 10.1016/j.cbpc.2004.03.004
Metón I., Fernández F., Baanante I. V. (2003). Short-and long-term effects of refeeding on key enzyme activities in glycolysis-gluconeogenesis in the liver of gilthead seabream (Sparus aurata). Aquaculture 225 (1), 99–107. doi: 10.1016/S0044-8486(03)00281-3
Miglavs I., Jobling M. (1989). Effects of feeding regime on food consumption, growth rates and tissue nucleic acids in juvenile Arctic charr, Salvelinus alpinus, with particular respect to compensatory growth. J. Fish. Biol. 34, 947–957. doi: 10.1111/j.1095-8649.1989.tb03377.x
Morales A. E., Pe A., Abella E., Abellán E., Cardenete G. (2004). Oxidative stress and antioxidant defenses after prolonged starvation in dentex dentex liver. Comp. Biochem. Physiol. C 139, 153–161. doi: 10.1016/j.cca.2004.10.008
Myung K. K., Richard T. L. (1995). Effect of restricted feeding regimens on compensatory weight gain and body tissue changes in channel catfish Ictalurus punctatus in ponds. Aquaculture 135, 285–293. doi: 10.1016/0044-8486(95)01027-0
Namrata S., Sanjay N., Pallavi C. (2011). Effect of starvation on the biochemical composition of freshwater fish channa punctatus. Rrst 3, 17–19.
Navarro I., Gutiérrez J. (1995). Fasting and starvation. Biochem. Mol. Biol. Fishes 4, 393–434. doi: 10.1016/S1873-0140(06)80020-2
Nordlie R. C., Foster J. D., Lange A. J. (1999). Regulation of glucose production by the liver. Annu. Rev. Nutr. 19, 379–406. doi: 10.1146/annurev.nutr.19.1.379
Okada T., Fukuda S., Hase K., Nishiumi S., Izumi Y., Yoshida M., et al. (2013). Microbiota-derived lactate accelerates colon epithelial cell turnover in starvation-refed mice. Nat. Commun. 4, 1654. doi: 10.1038/ncomms2668
Ott S. J., Musfeldt M., Wenderoth D. F., Hampe J., Brant O., Fölsch U. R., et al. (2004). Reduction in diversity of the colonic mucosa associated bacterial microflora in patients with active inflammatory bowel disease. Gut 53 (5), 685–693. doi: 10.1136/gut.2003.025403
Ou Y. J., Liu Z. W. (2007). Starvation and compensatory growth in the young lutjanus sebae. J. Fish. China 31 (3), 323–328.
Peragon J., Barroso J. B., Garcia-Salguero L., Aranda F., de la Higuera M., Lupiáñez J. A., et al. (1999). Selective changes in the protein-turnover rates and nature of growth induced in trout liver by long-term starvation followed by refeeding. Mol. Cell Biochem. 201 (1-2), 1–10. doi: 10.1023/a:1006953917697
Pérez T., Balcázar J. L., Ruizzarzuela I., Halaihel N., Vendrell D., de Blas I., et al. (2010). Host-microbiota interactions within the fish intestinal ecosystem. Mucosal Immunol. 3 (4), 355–360. doi: 10.1038/mi.2010.12
Pérez-Jiménez A., Cardenete G., Hidalgo M. C., García-Alcázar A., Abellán E., Morales A. E. (2012). Metabolic adjustments of Dentex dentex to prolonged starvation and refeeding. Fish. Physiol. Biochem. 38 (4), 1145–1157. doi: 10.1007/s10695-011-9600-2
Pérez-Jiménez A., Guedes M. J., Morales A. E., Oliva-Teles A. (2005). Metabolic responses to short starvation and refeeding in dicentrarchus labrax. Effect Dietary Composition Aquac. 265 (1), 325–335. doi: 10.1016/j.aquaculture.2007.01.021
Peter M., Lv H. R., Jiang X. Q., Liu Y., Hur J., Esbon M., et al. (2020). Effects of starvation on enzyme activities and intestinal microflora composition in loach (Paramisgurnus dabryanus). Aquacult. Rep. 18, 100467. doi: 10.1016/j.aqrep.2020.100467
Pilkis S. J., Granner D. K. (1992). Molecular physiology of the regulation of hepatic gluconeogenesis and glycolysis. Annu. Rev. Physiol. 54 (54), 885–909. doi: 10.1146/annurev.ph.54.030192.004321
Qian B., Xue L., Huang H. (2016). Liver transcriptome analysisof the large yellow croaker (Larimichthys crocea) during fasting by using RNA-seq. PloS One 11, e0150240. doi: 10.1371/journal.pone.0150240
Quast C., Pruesse E., Yilmaz P., Gerken J., Schweer T., Yarza P., et al. (2013). The SILVA ribosomal RNA gene database project: improved data processing and web-based tools. Nucl. Acids Res. 41, 590–596. doi: 10.1093/nar/gks1219
Rescan P. Y., Cam A., Rallière C., Montfort J. (2017). Global gene expression in muscle from fasted/refed trout reveals up-regulation of genes promoting myofibre hypertrophy but not myofibre production. BMC Genomics 18 (1), 447. doi: 10.1186/s12864-017-3837-9
Rescan P. Y., Montfort J., Rallière C., Le Cam A., Esquerré D., Hugot K., et al. (2007). Dynamic gene expression in fish muscle during recovery growth induced by a fasting-refeeding schedule. BMC Genomics 8, 438. doi: 10.1186/1471-2164-8-438
Ringø E., Zhou Z., Vecino J. L. G., Wadsworth S., Romero J., Krogdahl A., et al. (2016). Effect of dietary components on the gut microbiota of aquatic animals. a never-ending story? Aqua. Nutr. 22 (2), 219–282. doi: 10.1111/anu.12346
Rios F. S., Moraes G., Oba E. T., Fernandes M. N., Donatti L., Kalinin A. L., et al. (2006). Mobilization and recovery of energy stores in traíra, Hoplias malabaricus Bloch (Teleostei, erythrinidae) during long-term starvation and after re-feeding. J. Com. Physiol. B 176 (7), 721–728. doi: 10.1007/s00360-006-0098-3
Rojtinnakorn J., Hirono I., Itami T., Takahashi K., Aoki T. (2002). Gene expression in haemocytes of kuruma prawn, Penaeus japonicas, in response to infection with WSSV by EST approach. Fish. Shellfish Immunol. 13, 69–83. doi: 10.1006/fsim.2001.0382
Sakyi E. M., Cai J., Ampofo-Yeboah A., Anokyewaa M. A., Wang Z., et al. (2021). Starvation and re-feeding influence the growth, immune response, and intestinal microbiota of Nile tilapia (Oreochromis niloticus; Linnaeus 1758). Aquaculture 543, 736959. doi: 10.1016/j.aquaculture.2021.736959
Sakyi E. M., Cai J., Tang J., Xia L., Abarikea E. D., et al. (2020). Starvation and re-feeding influence the growth, immune response, and intestinal microbiota of Nile tilapia (Oreochromis niloticus; Linnaeus 1758): Growth measurements, and immune responses. Aquaculture 16, 100621. doi: 10.1016/j.aqrep.2019.100261
Semova I., Carten J. D., Stombaugh J., Mackey L. C., Knight R., Farber S. A., et al. (2012). Microbiota regulate intestinal absorption and metabolism of fatty acids in the zebrafish. Cell Host Microbe 12 (3), 277–288. doi: 10.1016/j.chom.2012.08.003
Sharma J., Dar S. A., Sayani A. N., Langer S. (2017). Effect of stressors on haematological and hormonal parameters of garra gotyla. Int. J. Curr. Microbiol. Appl. Sci. 6, 357–369. doi: 10.20546/ijcmas.2017.605.041
Showkat A. D., Prem P. S., Tincy V., Nazir M. I., Gupta S., Krishna G., et al. (2019). Temporal changes in superoxide dismutase, catalase, and heat shock protein 70 gene expression, cortisol and antioxidant enzymes activity of Labeo rohita fingerlings subjected to starvation and refeeding. Gene 692, 94–101. doi: 10.1016/j.gene.2018.12.058
Sipra M., Tapas C., Mohammad A. N. R., Shimizu S., Matsubara T., Ohta K., et al. (2017). Short-term starvation and realimentation helps stave off edwardsiella tarda infection in red sea bream (Pagrus major). Comp. Biochem. Physiol. B 206, 42–53. doi: 10.1016/j.cbpb.2017.01.009
Starck J. M. (2003). Shaping up: how vertebrates adjust their digestive system to changing environmental conditions. Anim. Biol. 53 (3), 245–257. doi: 10.1163/157075603322539444
Suarez R. K., Mommsen T. P. (1987). Gluconeogenesis in teleost fishes. Can. J. Zool. 65 (8), 1869–1882. doi: 10.1139/z87-287
Su Y. Q., Liu X. G., Yi H. D., Yi B., Chen X., Lai H., et al. (2022). Effects of starvation and refeeding on growth, biochemical composition, enzyme activities and intestine structure of lined seahorses, hippocampus erectus. Aquaculture 548, 737733. doi: 10.1016/j.aquaculture.2021.737733
Sullam K. E., Essinger S. D., Lozupone C. A., O'Connor M. P., Rosen G. L., Knight R., et al. (2012). Environmental and ecological factors that shape the gut bacterial communities of fish: a meta-analysis. Mol. Ecol. 21 (13), 3363–3378. doi: 10.1111/j.1365-294X.2012.05552.x
Tran N. T., Xiong F., Hao Y. T., Zhang J., Wu S.G., Wang G. T., et al. (2018). Starvation influences the microbiota assembly and expression of immunity-related genes in the intestine of grass carp (Ctenopharyngodon idellus). Aquaculture 489, 121–129. doi: 10.1016/j.aquaculture.2018.02.016
Viegas I., Mendes V. M., Leston S., Jarak I., Carvalho R. A., Pardal M. A., et al. (2011). Analysis of glucose metabolism in farmed European sea bass (Dicentrarchus labrax l.) using deuterated water. Comp. Biochem. Physiol. A 160 (3), 341–347. doi: 10.1016/j.cbpa.2011.06.029
Waagbo R., Jorgensen S. M., Timmerhaus G., Breck O., Olsvik P. A. (2017). Short-term starvation at low temperature prior to harvest does not impact the health and acute stress response of adult Atlantic salmon. Peer J. 1–22. doi: 10.7717/peerj.3273
Wang T., Hung C. C. Y., Randall D. J. (2006). The comparative physiology of food deprivation: From feast to famine. Annu. Rev. Physiol. 68, 223–251. doi: 10.1146/annurev.physiol.68.040104.105739
Wang Y., Li C., Qin J. G., Han H. (2009). Cyclical feed deprivation and refeeding fails to enhance compensatory growth in Nile tilapia, Oreochromis niloticus l. Aquac. Res. 40 (2), 204–210. doi: 10.1111/j.1365-2109.2008.02083.x
Wilson P. N., Osbourn D. F. (1960). Compensatory growth after undernutrition in mammals and birds. Biol. Rev. Camb. Philos. Soc. 35 (1), 324–361. doi: 10.1111/j.1469-185X.1960.tb01327.x
Xia J., Lin G., Fu G., Wan Z. Y., LEE M., Wang , et al. (2014). The intestinal microbiome of fish under starvation. BMC Genomics 15, 266. doi: 10.1186/1471-2164-15-266
Xu Z., Regenstein J. M., Xie D., Lu W., Ren X., Yuan J., et al. (2018). The oxidative stress and antioxidant responses of Litopenaeus vannamei to low temperature and air exposure. Fish. Shellfish Immunol. 72, 564–571. doi: 10.1016/j.fsi.2017.11.016
Yang Q., Guo L., Liu B. S., Guo H. Y., Zhu K. C., Zhang N., et al. (2020). Effects of stocking density on the growth performance, serum biochemistry, muscle composition and HSP70 gene expression of juvenile golden pompano Trachinotus ovatus (Linnaeus 1758). Aquaculture 518, 734841. doi: 10.1016/j.aquaculture.2019.734841
Yang Y., Zhou H. Q., Hou L. P., Xing K., Shu H. (2019). Transcriptional profiling of skeletal muscle reveals starvation response and compensatory growth in spinibarbus hollandi. BMC Genomics 20, 938. doi: 10.1186/s12864-019-6345-2
Yan Q., van der Gast C. J., Yu Y. (2012). Bacterial community assembly and turnover within the intestines of developing zebrafish. PloS One 7 (1), e30603. doi: 10.1371/journal.pone.0030603
Zaldúa N., Naya D. E. (2014). Digestive flexibility during fasting in fish: a review. Comp. Biochem. Physiol. A 169, 7–14. doi: 10.1016/j.cbpa.2013.12.006
Zhang M. L., Sun Y. H., Chen K., Yu N., Zhou Z., Chen L., et al. (2014). Characterization of the intestinal microbiota in pacific white shrimp, Litopenaeus vannamei, fed diets with different lipid sources. Aquaculture 434, 449–455. doi: 10.1016/j.aquaculture.2014.09.008
Zhang M. L., Sun Y. H., Liu Y. K., Qiao F., Liu W. T., Du Z., et al. (2016). Response of gut microbiota to salinity change in two euryhaline aquatic animals with reverse salinity preference. Aquaculture 454, 72–80. doi: 10.1016/j.aquaculture.2015.12.014
Zhang X., Zhu Y., Cai L., Wu T. X. (2008). Effects of fasting on the meat quality and antioxidant defenses of market-size farmed large yellow croaker (Pseudosciaena crocea). Aquaculture 280, 136–139. doi: 10.1016/j.aquaculture.2008.05.010
Zhao J., Feng L., Liu Y., Jiang W., Wu P., Jiang J., et al. (2014). Effect of dietary isoleucine on the immunity, antioxidant status, tight junctions and microflora in the intestine of juvenile jian carp (Cyprinus carpio var. jian). Fish. Shellfish Immunol. 41 (2), 663–673. doi: 10.1016/j.fsi.2014.10.002
Keywords: Trachinotus ovatus, starvation, refeeding, transcriptome profiles, intestinal microbiome
Citation: Liu B, Guo H-Y, Liu B-S, Zhang N, Yang J-W, Guo L, Jiang S-G and Zhang D-C (2022) Starvation and refeeding influence the growth, biochemical index, intestinal microbiota, and transcriptomic profiles of golden pompano Trachinotus ovatus (Linnaeus 1758). Front. Mar. Sci. 9:998190. doi: 10.3389/fmars.2022.998190
Received: 19 July 2022; Accepted: 29 September 2022;
Published: 17 October 2022.
Edited by:
Sergio Fernández Boo, University of Porto, PortugalReviewed by:
Mbaye Tine, Gaston Berger University, SenegalCopyright © 2022 Liu, Guo, Liu, Zhang, Yang, Guo, Jiang and Zhang. This is an open-access article distributed under the terms of the Creative Commons Attribution License (CC BY). The use, distribution or reproduction in other forums is permitted, provided the original author(s) and the copyright owner(s) are credited and that the original publication in this journal is cited, in accordance with accepted academic practice. No use, distribution or reproduction is permitted which does not comply with these terms.
*Correspondence: Dian-Chang Zhang, emhhbmdkY2hAc2NzZnJpLmFjLmNu
†These authors have contributed equally to this work
Disclaimer: All claims expressed in this article are solely those of the authors and do not necessarily represent those of their affiliated organizations, or those of the publisher, the editors and the reviewers. Any product that may be evaluated in this article or claim that may be made by its manufacturer is not guaranteed or endorsed by the publisher.
Research integrity at Frontiers
Learn more about the work of our research integrity team to safeguard the quality of each article we publish.