 Haoming Xu
 Guodong Song
 Siqi Yang1,2,3
 Guiling Zhang
 Sumei Liu
- 1Frontiers Science Center for Deep Ocean Multispheres and Earth System and Key Laboratory of Marine Chemistry Theory and Technology, Ministry of Education, Ocean University of China, Qingdao, China
- 2Laboratory for Marine Ecology and Environmental Science, Qingdao National Laboratory for Marine Science and Technology, Qingdao, China
- 3College of Chemistry and Chemical Engineering, Ocean University of China, Qingdao, China
Benthic nitrogen cycling, including nitrification, N-loss, and other nitrogen transformations, plays a crucial role in the marine nitrogen budget. However, studies on benthic nitrogen cycling mainly focus on marginal seas, while attention to the deep ocean, which occupies the largest area of the seafloor, is severely lacking. In this study, we investigate the benthic nitrogen cycling in the Kuroshio Extension region (KE) of the northwest Pacific Ocean at water depths greater than 5,000 m through 15N enrichment slurry incubation and pore-water dissolved oxygen and inorganic nitrogen profiles. The slurry incubation indicates nitrification is the predominant process in benthic nitrogen cycling. The potential nitrification rates are nearly an order of magnitude higher than dissimilatory nitrate reduction. Nitrification and total N-loss flux estimated from pore-water nitrate and ammonium profiles are 6–42 and 5–30 μmol N m−2 d−1, respectively. Generally, anammox is the predominant N-loss process in KE sediment. The temperature gradient experiment indicates that the optimum temperature for anammox and denitrification is 13 and 41°C, respectively, partially explaining anammox as the dominant process for deep-ocean benthic N-loss. Both the low concentration of ammonium in pore-water and the discrepant results between anoxic incubation amended with 15NO3− and 15NH4++14NO3− suggest that ammonium is another limiting factor for benthic anammox. N-loss activity gradually declines with the distance from the Oyashio–Kuroshio transition zone. However, nitrification has the opposite trend roughly. This reveals that the sediment in KE transfers from nitrate sink to source from north to south. This trend is mainly caused by the variation of primary production and the supplement of active organic matter, which is the energy source for microbes and the potential source for ammonium through remineralization. Overall, our results highlight temperature and ammonium as two limiting factors for deep-ocean benthic N-loss and also exhibit a tight coupling relationship between pelagic primary production and the benthic nitrogen cycle in KE.
Introduction
As an essential element for biological growth, reproduction, and evolution, nitrogen limits the primary production of marine phytoplankton, which regulates global atmospheric CO2 levels (Howarth and Marino, 2006; Canfield et al., 2010). Therefore, the study of marine nitrogen biogeochemical cycling has always been a hotspot in studies related to global change (Gruber and Galloway, 2008). Marine sediment is the most active zone for nitrogen turnover processes, where more than 50% of fixed nitrogen loss occurs (Devol, 2015). The benthic nitrogen cycle generally includes the mineralization of organic nitrogen, aerobic nitrification, and anaerobic dissimilatory nitrate reduction (Kuypers et al., 2018; Hutchins and Capone, 2022). The primary nitrogen source of marine sediments is the deposition of particulate organic nitrogen. Mineralization then converts burial organic nitrogen into ammonium, supporting other processes (Thamdrup and Dalsgaard, 2008). The removal of nitrogen relies on two dissimilatory nitrate reduction processes: heterotrophic denitrification (NO3−→ NO2−→ NO → N2O → N2 ) and autotrophic anaerobic ammonium oxidation (anammox, NH4++ NO2−→ N2 ) in the anoxic sediments (Thamdrup and Dalsgaard, 2002), which are collectively known as nitrogen loss processes with a final product of N2. Unlike denitrification and anammox, dissimilatory nitrate reduction to ammonium (DNRA, NO3−→ NO2−→ NH4+ ) converts nitrate to ammonium, which is retained in the aquatic environment in ion form (Tiedje, 1988). Aerobic nitrification (NH4+→ NO2−→ NO3− ), including ammonium and nitrite oxidation processes, occurs in the oxic sediment layer and is linked to mineralization and dissimilatory nitrate reduction (Ward, 2008).
The marine benthic nitrogen cycle has been extensively studied in the last decades with the wide application of the 15N amended incubation experiment and the development of the 15N analysis technique. However, most of these studies focused on marginal seas, while attention to the deep ocean, which covers about 60% of the seafloor, was relatively scarce. N-loss processes have been studied directly in limited deep continental slope and basin sediments with water depths greater than 1,000 m based on 15N incubation (Engström et al., 2009; Trimmer and Nicholls, 2009; Sokoll et al., 2012; Na et al., 2018; Rich et al., 2020). Compared with coastal or continental shelf sediment, although the total nitrogen loss rate is relatively low, the psychrophilic and autotrophic anammox processes seem to show a rather substantial contribution to N-loss with increasing water depth (Dalsgaard et al., 2005; Devol, 2015). Thamdrup et al. (2021) first investigated the benthic N-loss in two hadal trenches, Atacama and Kermadec, with water depths of 7,720–7,915 and 9,300–9,555 m, respectively, which is currently the N-loss result with the greatest water depth reported in the marine sediment. Despite being the deepest part of the ocean, hadal trenches receive both vertical and lateral inputs of organic matter and are believed to be the hotspots for benthic early diagenesis and N-loss processes in deep marine environments (Glud et al., 2021; Thamdrup et al., 2021).
Unlike continental shelves and slopes with relatively shallower overlying water or hadal trenches with abundant organic matter accumulation, in abyssal plain sediment, O2 is thought to be the significant electron acceptor according to the model results because of the low organic matter deposition. Hence, aerobic nitrification is the predominant nitrogen transformation process (Middelburg et al., 1996; Soetaert et al., 1996). The nitrification and N-loss rates were estimated based on pore-water dissolved inorganic nitrogen (DIN), the natural 15N abundance profiles, and benthic DIN fluxes supported the viewpoint above as well (Christensen and Rowe, 1984; Brunnegård et al., 2004; Wankel et al., 2015). Nevertheless, few direct measurements of N cycling processes in abyssal plain sediment using 15N amended incubation have been reported. Therefore, the benthic N cycling behavior and the controlling environmental factors in abyssal plain areas are still unclear.
The Kuroshio Extension region (KE) is located in the North-West of the Pacific Ocean. The submarine topography of KE is mainly an abyssal plain referred to as the Northwest Pacific Basin (Jamieson and Stewart, 2021), which provides an appropriate field for studying benthic nitrogen cycling behavior in the abyssal plain area. In this study, we measured the pore-water dissolved inorganic nitrogen (DIN) profiles and estimated the total rates of nitrification and N-loss. Potential nitrification, anammox, denitrification, and DNRA rates were obtained through oxic and anoxic 15N amended slurry incubation under in situ conditions. Additionally, a temperature gradient anoxic 15N incubation was conducted to investigate the temperature response of denitrification, anammox, and DNRA in the deep ocean. This study provides the first direct measurement of nitrification, denitrification, anammox, and DNRA in KE sediment, and further explores the benthic nitrogen cycling behavior and the environmental factors regulating these processes in abyssal plain areas.
Materials and methods
Station description and sampling procedures
Sampling stations are located in the abyssal plain area of KE (146°12ʹ–151°12ʹ E, 32°24ʹ–41°00ʹ N) with water depths of 5,408–6,011 m (Figure 1 and Table 1). Intense eddy activity and complex currents, which affect nutrient transport, make the pelagic net primary production (NPP) highly variable (Uchiyama et al., 2017; Clayton et al., 2021) and generally decrease from north to south with the distance from the Oyashio–Kuroshio transition region (Figure 1 and Table 1). Sampling and onboard incubation experiments were conducted during the cruise in May and June 2021 by R/V Dongfanghong 3. Sediment was successfully collected using a box corer at five stations (D2, D4, D6, E4, and E10), with visually clear overlying water and an undisturbed sediment surface. Sub-cores were obtained using polycarbonate tubes (length = 30 cm, i. d. = 9.5 cm), sealed with silica gel stoppers. Sediment cores were then transferred to a temperature-controlled incubator and preserved temporarily under the in situ temperature for O2 profile measurement, pore-water sampling, and layered 15N slurry incubation afterward. At Sta. D6, extra surface sediment (about 0–5 cm) was collected for a temperature gradient 15N incubation. A portion of segmented sediment for 15N slurry incubation was collected in zip-lock PE bags and stored at −20°C, subsequently freeze-dried for determination of sediment porosity, total organic carbon (TOC), total nitrogen (TN), and chlorophyll a (Chl-a) contents.
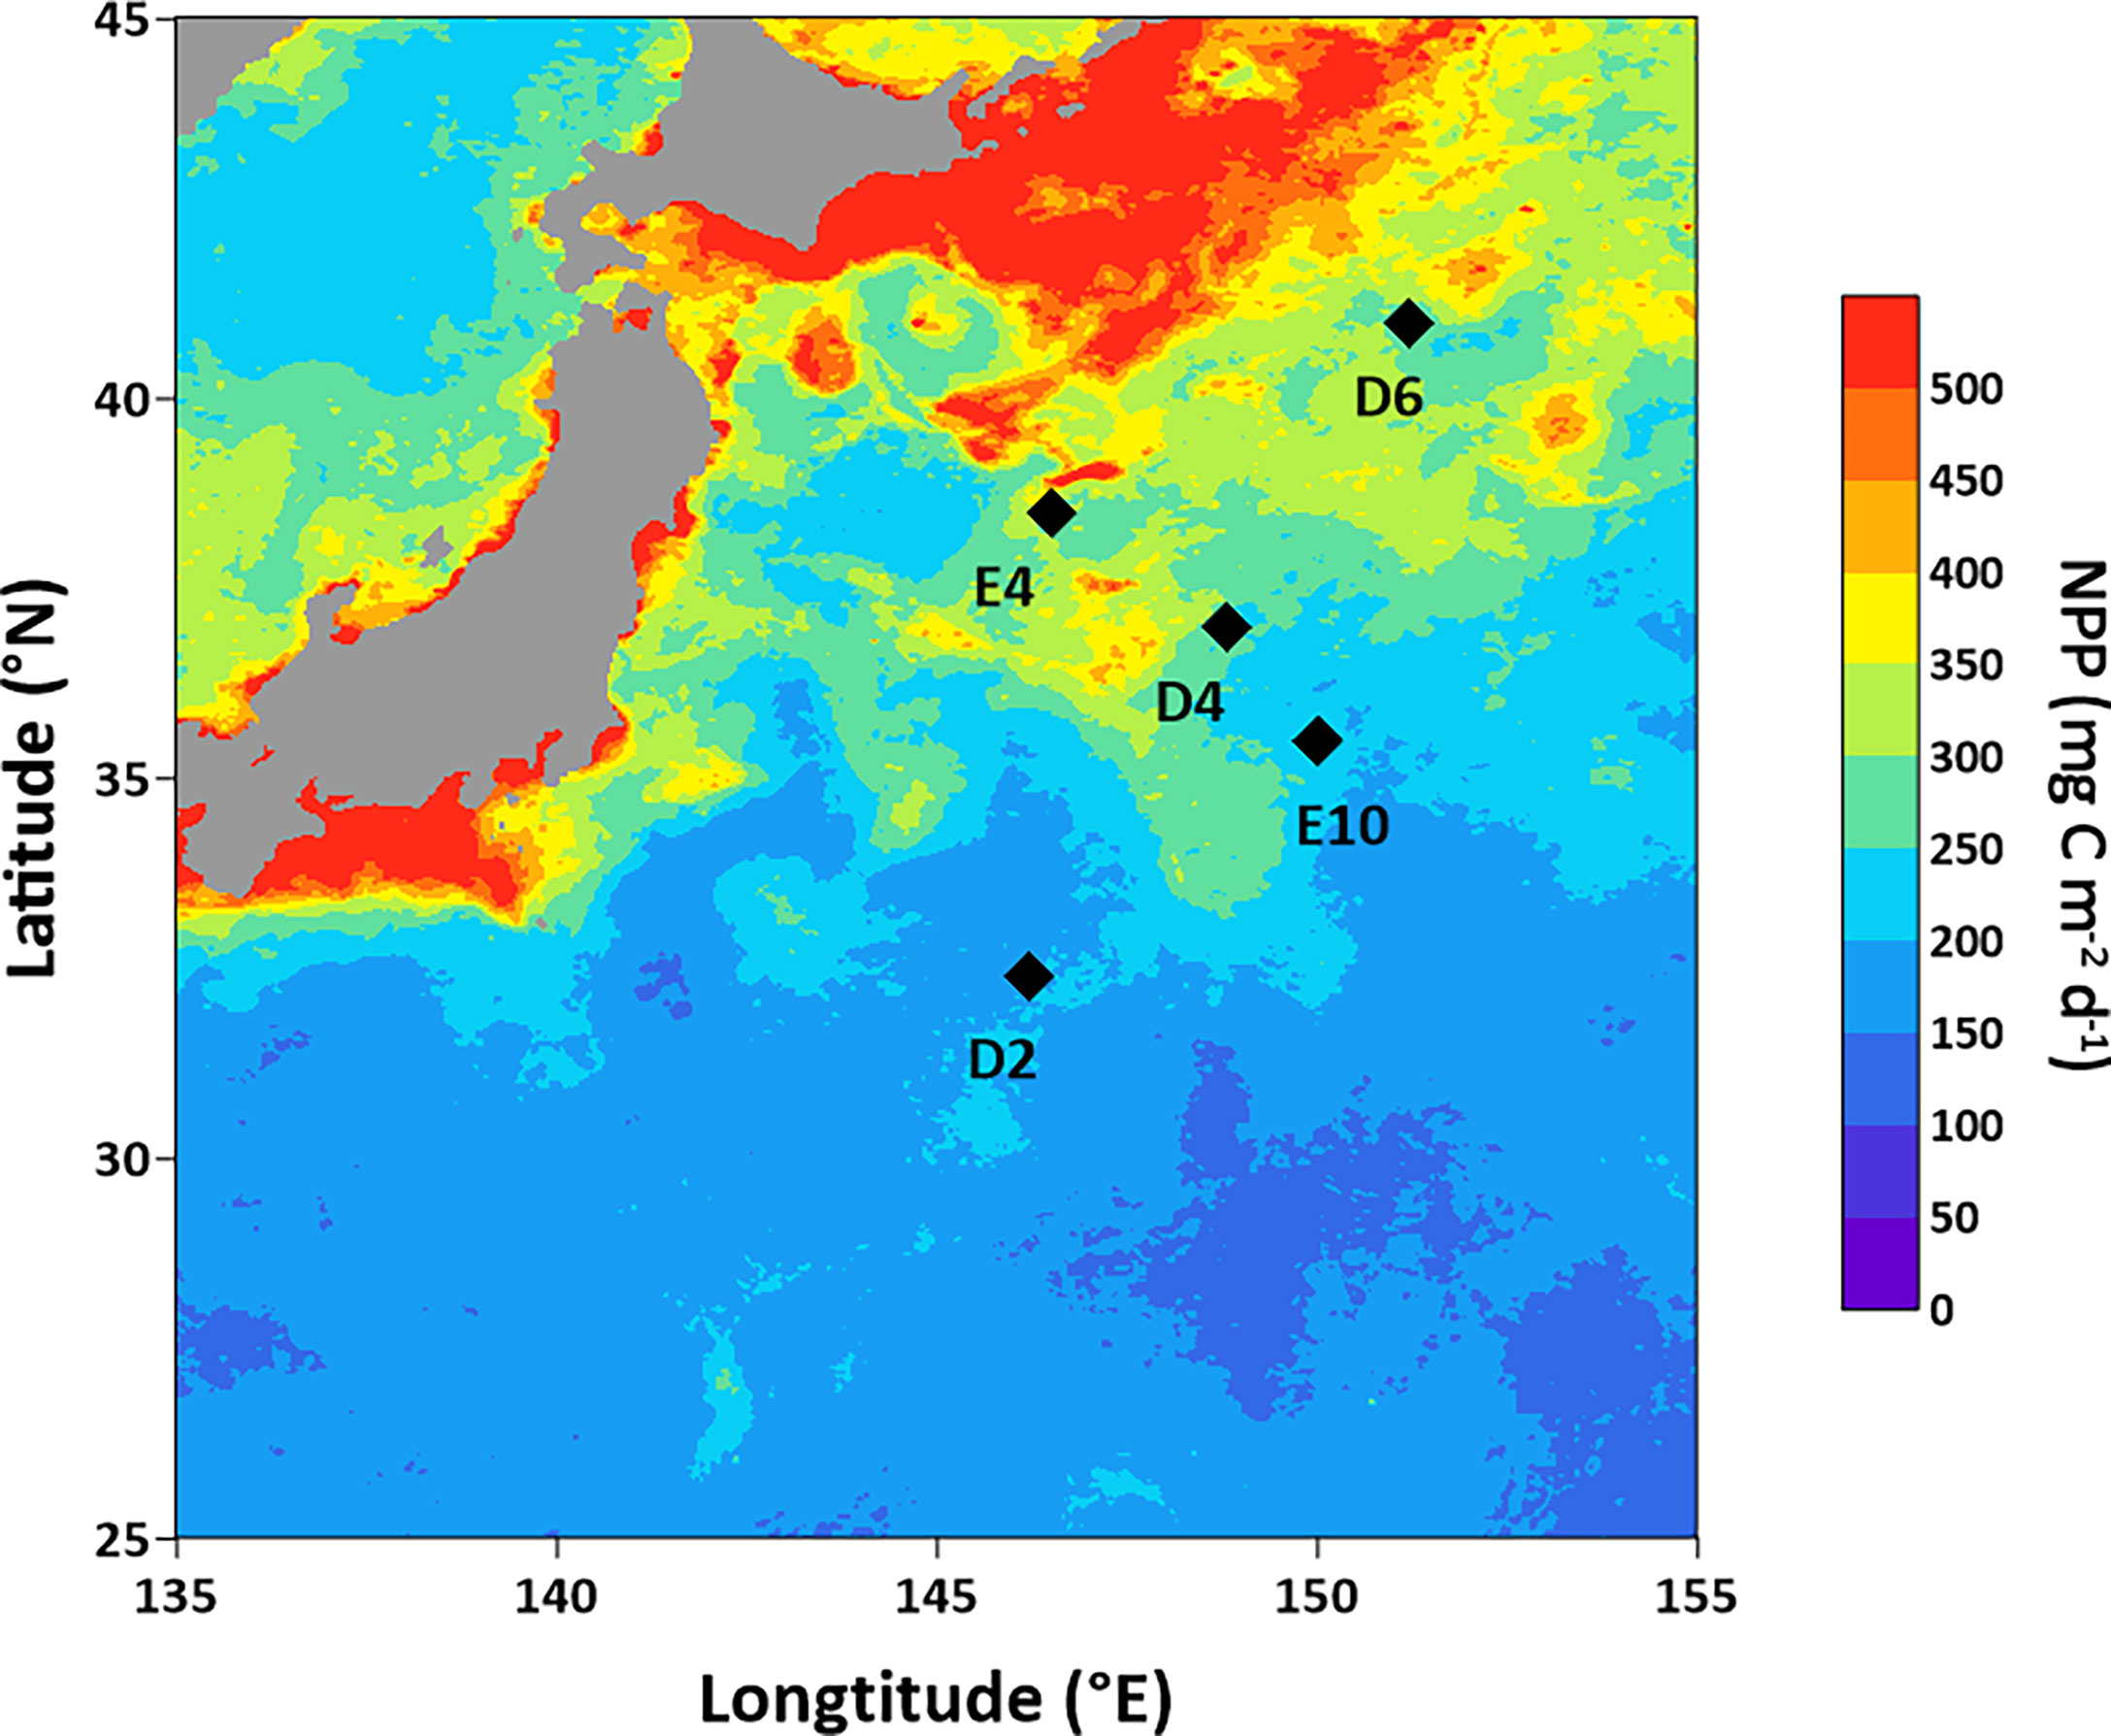
Figure 1 Sampling stations in KE. The NPP distribution is based on the online data of Copernicus Marine Environment Monitoring Service (CMEMS, https://marine.copernicus.eu/).
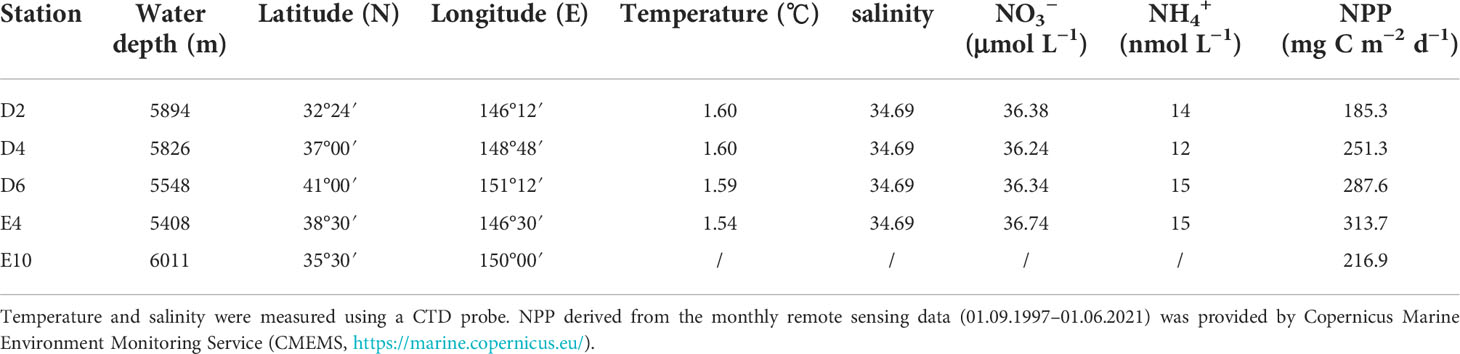
Table 1 Water depth, positions, bottom water temperature, salinity, NO3− and NH4+ concentration, and pelagic net primary production (NPP) at each sampling station.
Sediment O2 profiles were determined in duplicate or triplicate at each station within 2 h after sampling using an oxygen microelectrode (OX-25, Unisense, Denmark) installed on a micromanipulator with a resolution of 200 μm. Sub-cores for pore-water extraction were segmented immediately every 0.5 or 1 cm in the upper 10 cm and 1 cm in the remaining section. Pore-water was extracted using Rhizon samplers as described by Song et al. (2013) and preserved in 15 ml centrifuge tubes under −20°C for DIN (including NO3− , NO2− , and NH4+ ) analysis. Bottom water was collected from about 20–50 m above the seafloor, using Niskin bottles coupled to a Conductivity–Temperature–Depth sensor (CTD)-rosette system at each station, except for E10, where the cast was only down to 1,000 m. Water temperature and salinity were simultaneously measured by CTD. The bottom water for DIN analysis was filtered using 0.7 μm GF/F membranes and stored in polyethylene bottles at −20°C.
15N slurry incubation under in situ temperature
Both oxic and anoxic 15N enrichment slurry incubations under in situ temperature were carried out to determine the potential rates of nitrification and dissimilatory nitrate reduction processes (including denitrification, anammox, and DNRA), respectively. We chose the bag incubation style (Hansen et al., 2000), and the operating procedure of the slurry incubation referred to by Thamdrup and Dalsgaard (2002) and Song et al. (2013) with slight modifications as described below. The division of oxic and anoxic incubation was conducted according to the O2 profile at each station. For Sta. D2, a pore-water O2 profile under 6 cm was not obtained (see Results). Thus, 17–19 and 19–21 cm of sediment were predicted to be anoxic and were used for anoxic 15N enrichment slurry incubation.
For oxic incubation, 20 ml of homogenized sediment and 180 ml of air-flushed bottom water were mixed in a gas-tight bag. The artificial seawater described below was used for Sta. E10. Each bag was amended with 15NH4+ or 15NO2− with the final 15N tracer concentration of about 100 μmol L−1. The slurry was sub-sampled from the incubation bag at five time-points within 72 h at Sta. D2 and 48 h at Sta. D4, D6, E4, and E10, respectively. The sub-samples were preserved in 5.9 ml vials (Labco, United Kingdom) prefilled with 0.1 ml of saturated HgCl2 solution for the determination of 15NOX− (15NO3− and 15NO2− ). Dissolved oxygen in the slurry was determined by the O2 microelectrode mentioned above before the Exetainer bottle cap was tightened to ensure the oxic conditions during the incubation process.
For anoxic incubation, 20 ml of homogenized sediment and 180 ml of He-flushed artificial seawater (35 g NaCl and 0.2 g NaHCO3 in 1 L of purified water, with a nitrate background less than 3 μmol L−1) were mixed in a gas-tight bag. The slurry was preincubated under in situ conditions for 2–4 days to remove the residual O2. The anoxic condition in the incubation bag was confirmed by the O2 microelectrode described above. After the preincubation, each bag was amended with He-flushed 15NO3− or 15NH4++14NO3− stock solution with a final 15N tracer concentration of about 100 μmol L−1. The slurry was sub-sampled from the incubation bag at five time-points within 96 h at Sta. D2 and 48 h at Sta. D4, D6, E4, and E10, respectively. The preservation of the samples was the same as for the aerobic incubation. Nevertheless, the target parameters for the assay were 15N2 (29N2 and 30N2) and 15NH4+ instead of 15NOX−. For DIN analysis, a portion of each sub-sample was filtered using a 0.2 μm syringe filter and stored at −20°C.
Temperature gradient experiment
To investigate the temperature response of dissimilatory nitrate reduction processes in deep-ocean sediment, a temperature gradient anoxic 15N slurry incubation was conducted using the upper 5 cm of sediment at Sta. D6. The incubation and sub-sampling procedures were the same as described above but under 16 different temperature gradients (1, 2, 4, 7, 10, 13, 16, 19, 22, 25, 29, 33, 37, 41, 45, 49 °C) in individual temperature-controlling incubators. The optimal temperature at which denitrification or anammox had the highest potential rate was thought to be the optimal temperature (Topt). The obvious activation energy (Ea) was calculated using the Arrhenius equation according to Dalsgaard and Thamdrup (2002).
Analytical methods
The isotopic ratios of 29N2/28N2 and 30N2/28N2 were determined using a homemade membrane-inlet mass spectrometer (MIMS) according to Kana et al. (1994). The typical precision of the 29N2/28N2 and 30N2/28N2 determinations is 0.1% and 1%, respectively. Concentrations of 29N2 and 30N2 were calculated according to Thamdrup and Dalsgaard (2000). The linear calibration factor α was determined by the standard working solution, which was made using the same salinity of seawater collected in the investigated region at 20 ± 0.01°C using the air equilibrium method (Kana et al., 1994). The concentration of 15NH4+ was determined using a hypobromite oxidation MIMS method (Yin et al., 2014). 15NO2− was first converted to 29N2 by the sulfamic acid reduction method (Granger and Sigman, 2009), then its concentration was determined by the same MIMS described above. 15NOX− was reduced to 15NO2− by the vanadium trichloride method (Schnetger and Lehners, 2014), then its concentration was determined as 15NO2− described above. The concentration of 15NO3− was calculated from the difference between 15NOX− and 15NO2− . The DIN of bottom water, pore-water, and incubation samples was determined by the spectrophotometric method using a nutrient auto-analyzer (AA3, SEAL, United Kingdom), except for the bottom water NH4+ concentration, which was determined by a high-sensitivity fluorescence method (Holmes et al., 1999).
Sediment porosity was calculated from the difference between the wet and dry weight of the sediment, considering the dry sediment density of 2.65 g cm−3 and the seawater density of 1.02 g cm−3. Sediment TOC and TN content were determined using an elemental analyzer (Vario EL III, Elementar, Germany). The precision for TOC and TN determination is 5% (standard sample TOC = 0.56%) and 2% (standard sample TN = 0.06%), respectively. Sediment Chl-a was determined in triplicate using a fluorometric method (Pinckney et al., 1994).
Rate calculations
Benthic O2 and DIN fluxes from profiles were calculated using Fick’s first law of diffusion from the steady state assuming a section with linear O2 and DIN concentration gradient through Equation (1) (Brunnegård et al., 2004; Engström et al., 2009):
where Fsed is the flux in sediment, Ø is the porosity of the sediment, dc/dz is the linear concentration gradient in sediment pore-water; Dsed is the diffusion coefficient in sediment and is calculated by Equation (2) according to Boudreau (1997):
where Dsw is the diffusion coefficient in seawater, obtained by Li and Gregory (1974).
Total nitrification and N-loss rates were estimated from DIN fluxes in sediment (Brunnegård et al., 2004; Engström et al., 2009; Thamdrup et al., 2021). DIN fluxes in the sediment oxic zone (OZ) and anoxic nitrogenous zone (NZ) were calculated separately. The estimations were based on the following assumptions: (1) Nitrate from nitrification supplied the N-loss processes and diffused to the overlying water meanwhile; (2) Downward nitrate flux in NZ was used for N-loss through denitrification and anammox; (3) Upward ammonium flux in NZ was used for anammox. Thus, rates of nitrification, denitrification, anammox, and total N-loss were calculated using Equations (3–6):
where NF, DF, AF, and NLF were the total rate of nitrification, denitrification, anammox, and N-loss from DIN fluxes, respectively; (OZ), (NZ) and (NZ) represents nitrate or ammonium flux in the sediment oxic zone or the anoxic nitrogenous zone.
The potential rates of nitrification, denitrification, anammox, and DNRA were calculated from 15N slurry incubation using the isotope pairing technique (IPT). Equations according to Thamdrup and Dalsgaard (2002) were used in this study without considering the minor influence of DNRA on anammox. Therefore, the potential rates were calculated using Equations (7–12):
where NP1 and NP2 were the potential nitrification rate from 15NH4+ and 15NO2− amended incubation, respectively; DP was the potential denitrification rate from 15NO3− amended incubation; AP1 and AP2 were the potential anammox rates from 15NO3− and 15NH4++14NO3− amended incubation, respectively; DNRAp was the potential DNRA rate from 15NO3− amended incubation; P29, P30, , , and were the production rates of 29N2 , 30N2 , 15NOX− , 15NO3− , and 15NH4+ , respectively; FA, FNI, and FN were the 15N abundance of ammonium, nitrite, and nitrate in the 15N enrichment incubation, respectively.
The relative contribution of anammox to N-loss was calculated using Equation (13):
where A and D were the anammox and denitrification rates, respectively, including potential rates (AP and DP) and rates estimated from DIN fluxes (AF and DF).
Statistical analysis
The significance of 15N2 and 15NOx− production in 15N slurry incubation was tested by linear regression between the 15N concentration and time, with a critical p-value of 0.05. Correlations between potential nitrification or anammox rates and environmental factors (TOC, TN, and Chl-a) were conducted by Pearson correlation with a critical p-value of 0.10. Correlations between total nitrification or NO3− loss rates and water depth or pelagic net primary production (NPP) were conducted by Pearson correlation with a critical p-value of 0.05. All statistical analyses were run using the Sigmaplot software.
Results
Bottom water and sediment characteristics
Bottom water characteristics at all stations are shown in Table 1, except Sta. E10, where the bottom water was not sampled at that time. The bottom water temperature and salinity were all about 2°C and 35 during the cruise, respectively. The nitrate and ammonium concentrations of bottom water at each station varied little (36.24–36.74 μmol L−1 and 12–15 nmol L−1 for nitrate and ammonium, respectively). Four sediment cores from Sta. D2, D4, D6, E10, and surface and bottom sediment from Sta. E4 in the KE were obtained and characterized. The general characteristics of the investigated sediments are shown in Table 2. The porosity of the sediment had an average value of 0.80 ± 0.06 and declined with depth generally. Sediment TOC, TN, and Chl-a content were 0.28%–0.80%, 0.11%–0.19%, and 0.03–2.02 μg g−1, respectively. All generally decreased vertically with sediment depth. Sediment at northern Sta. E4 had the highest organic matter content (TOC = 0.80%; TN = 0.18%; Chl-a = 2.02 ± 0.07 μg g−1) and sediment at southern Sta. D2 had the lowest (TOC = 0.28%; TN = 0.11%; 0.03 ± 0.00 μg g−1). Though the bottom water at different stations varied little, the characteristics of sediments showed a significant discrepancy from north to south in KE.

Table 2 General characteristics of investigated sediments.
Pore-water O2 and dissolved inorganic nitrogen distribution
Pore-water O2 generally decreases with depth and eventually depletes (except at Sta. D2). The penetration depths of O2 at Sta. D4, D6, and E10 were 15, 20, and 50 mm, respectively. While at Sta. D2, the O2 concentration in pore-water can still come up to about 100 μmol L−1 at a depth of 60 mm, the maximum measurement depth for our O2 electrode, and the O2 penetration depth at Sta. D2 was supposed to be far more than 100 mm (Figure 2A). Benthic O2 consumption flux ranged between 867 and 2,017 μmol O2 m−2 d−1 (Table 3) and was highest at the northern station D6, with high pelagic NPP and sediment TOC content. Generally, the penetration depth of O2 gradually increased from north to south in KE, revealing a decrease in benthic O2 consumption as well.
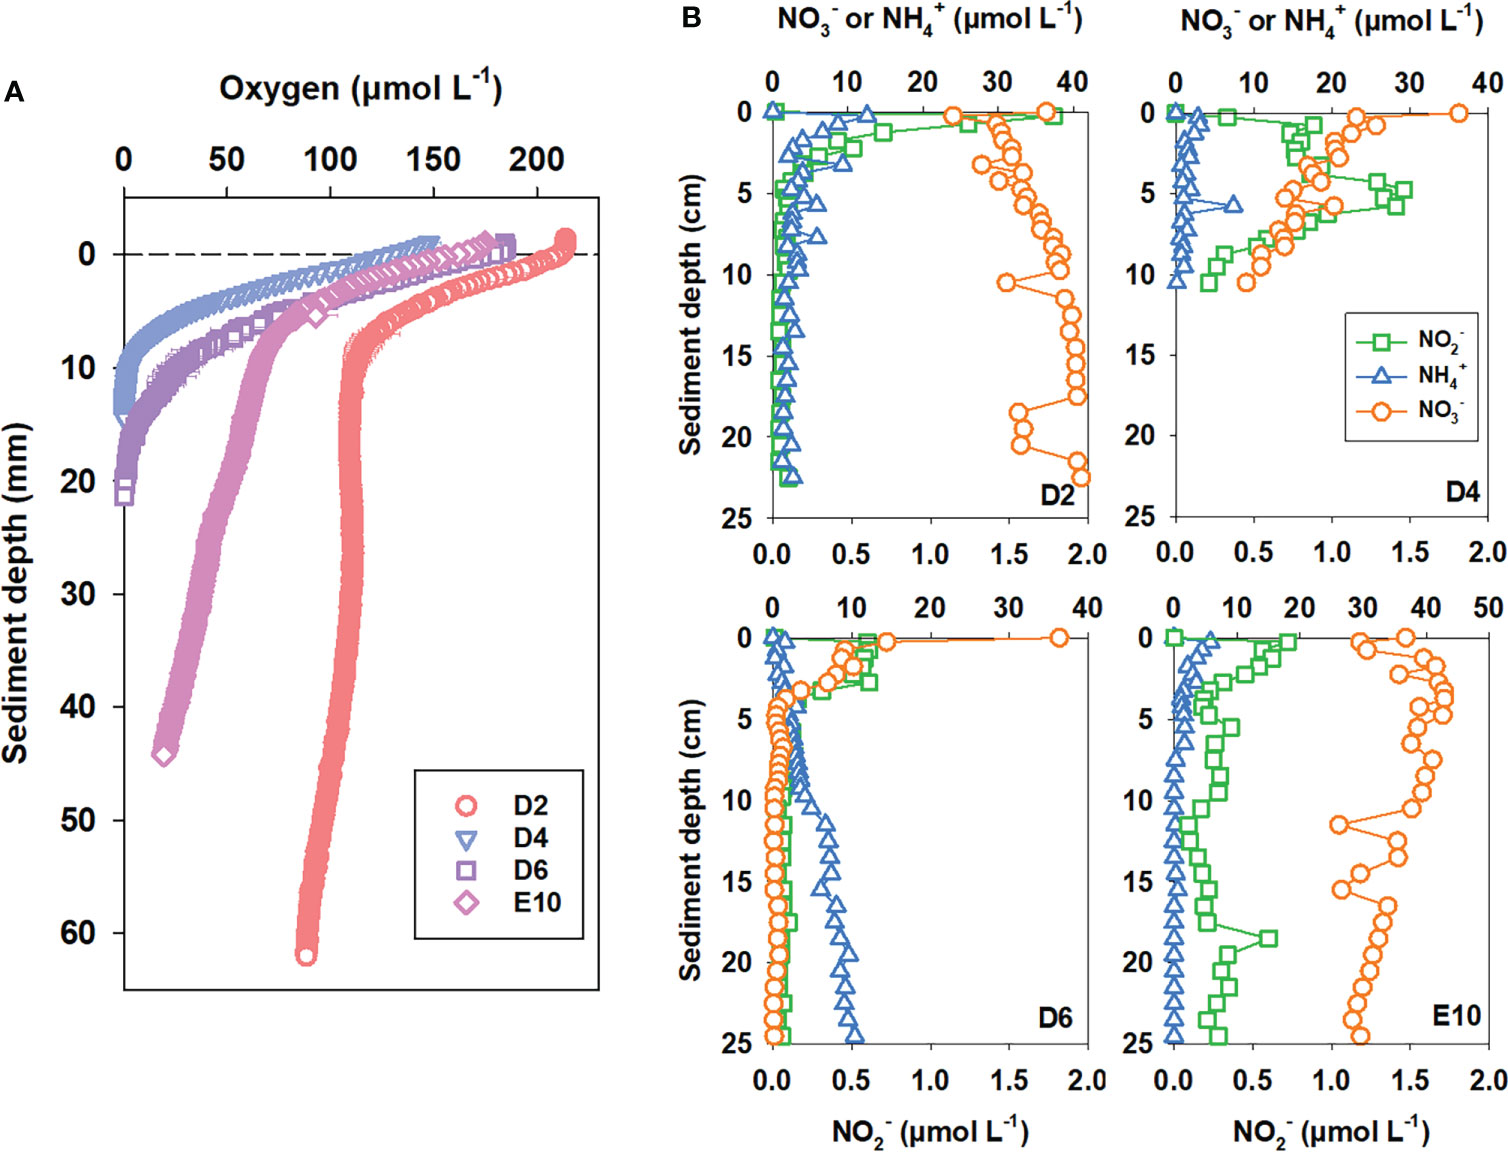
Figure 2 Pore-water (A) O2 and (B) DIN profiles.
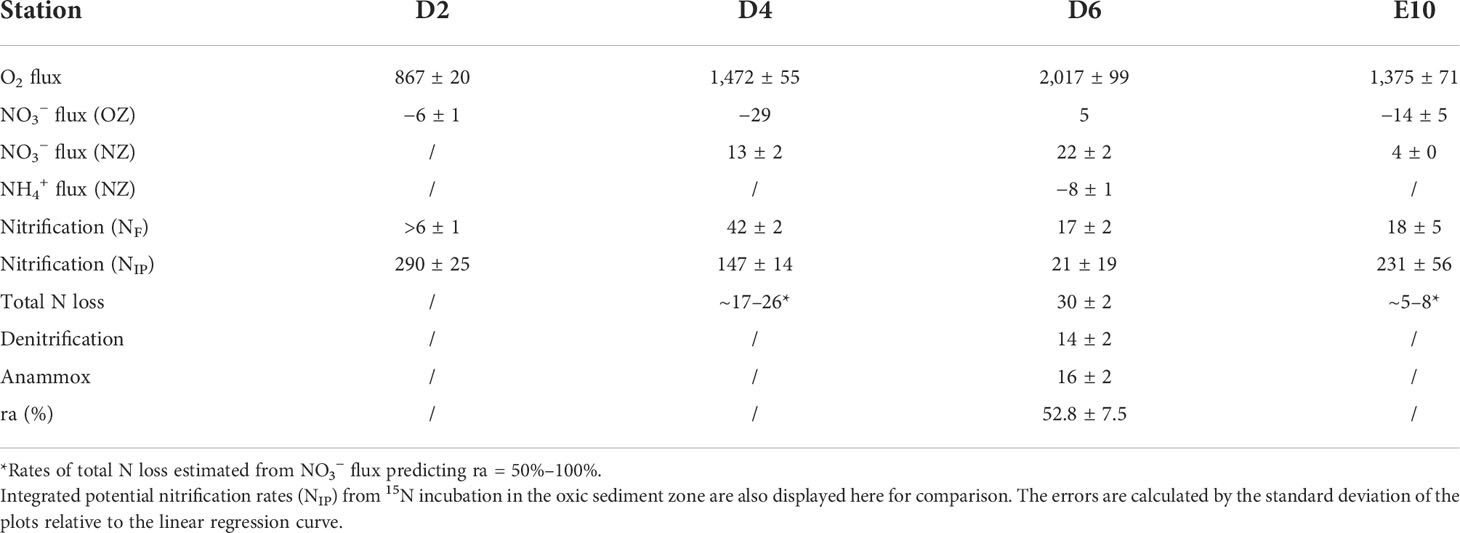
Table 3 O2 fluxes (μmol O2 m−2 d−1) and DIN fluxes (μmol N m−2 d−1) estimated from pore-water profiles and rates of benthic N cycle processes (μmol N m−2 d−1) of each station estimated from DIN fluxes (OZ, oxic zone; NZ, anoxic nitrogenous zone).
The nitrate profiles in sediment pore-water showed distinctly different patterns from south to north at different stations (Figure 2B). For Sta. D2, the southernmost station, nitrate accumulated downward; no consumption was observed for the whole sediment core obtained was oxic; for Sta. D4 and E10, nitrate accumulated in the oxic zone (0–1 cm and 0–5 cm for D4 and E10, respectively) and started to accumulate in the lower anoxic zone. Nitrate was depleted at 15 cm for Sta. D4 still existed at 25 cm with a concentration near 30 μmol L−1 for Sta. E10; for Sta. D6, nitrate was consumed at the beginning and was depleted at 5 cm. Nitrate accumulation at surface sediment was not detected in Sta. D6 for the high-N-loss rates, similar to coastal and shelf sediments. Limited by the sediment sampling method (box corer), we could hardly obtain sediment samples under 30 cm. It might be possible to observe nitrate consumption and even depletion in the deeper layer at stations with low-N-loss activities like Sta. D2 and E10, using a gravity corer. Generally, pore-water nitrate first accumulates in the oxic layer and is then consumed in the anoxic layer. However, the nitrate accumulation layer was relatively thicker in southern KE with lower pelagic primary production.
Unlike the profiles of ammonium in sediment pore-water on the continental shelf of the marginal seas, the profiles of ammonium in sediment pore-water at all three stations on this cruise, except at station D6, showed extreme values in the surface layer (Figure 2B). This result is similar to previous studies in the deep ocean and is likely due to artifacts during the sampling and transportation processes (Hall et al., 2007; Engström et al., 2009). As the sediment depth increased, the concentration of ammonium in the pore-water gradually decreased until it could no longer be detected at the respective depths (Figure 2B). At Sta. D6, the concentration of ammonium in the pore-water showed accumulation with increased sediment depth (Figure 2B). Pore-water ammonium concentrations are maintained at a lower level in KE but higher at northern stations.
DIN fluxes and nitrogen cycling processes rates estimated from pore-water profiles
The estimated nitrate and ammonium fluxes in the oxic and anoxic zones of the sediment at each station, based on pore-water profiles, are shown in Table 3. Nitrate accumulated downward in the oxic zone at Sta. D2, D4, and E10, with fluxes of −6 ± 1, −29, and −14 ± 5 μmol N m−2 d−1, respectively. For Sta. D6, nitrate was consumed in the oxic zone with a flux of 5 μmol N m−2 d−1. Nitrate consumption fluxes at Sta. D4, D6, and E10 in the anoxic zone were 13 ± 2, 22 ± 2, and 4 ± 0 μmol N m−2 d−1, respectively. The downward ammonium accumulation in the anoxic zone was observed only at Sta. D6 with a flux of −8 ± 1 μmol N m−2 d−1.
Nitrification estimated from DIN fluxes at Sta. D4, D6, and E10 was 42 ± 2, 17 ± 2, and 18 ± 5 μmol N m−2 d−1, respectively. For Sta. D2, because of unobserved nitrate consumption, nitrification is supposed to be more than 6 ± 1 μmol N m−2 d−1, the downward nitrate accumulation flux in the oxic zone. Meanwhile, the N-loss rate at Sta. D2 cannot be estimated for the same reason. Sta. D6 is the only station where downward nitrate consumption and ammonium accumulation in anoxic sediment are observed. Thus, denitrification and anammox can be estimated with rates of 14 ± 2 and 16 ± 2 μmol N m−2 d−1, respectively. The relative contribution of anammox to total N-loss (ra) at Sta. D6 is 52.8 ± 7.5%. Due to the relatively higher TOC in sediment at D6, the contribution of anammox as an autotrophic process is supposed to be greater at other stations. Thus, with the prediction of ra of 50%–100%, total N-loss at D4 and E10 is about 17–26 and 5–8 μmol N m−2 d−1, respectively. There is a correlation between total N-loss and pelagic primary production (p = 0.084, confidence coefficient = 0.90), while the correlation for nitrification is not significant (p = 0.407).The N-loss rate estimated from DIN fluxes generally decreases from north to south, while the nitrification rate was relatively higher at the middle station D4.
Oxic 15N slurry incubation experiments under in situ temperature
The linear production of 15NOx− (15NO2− , and 15NO3− ) over time in both 15NH4+ and 15NO2− amended oxic incubations proved the presence of nitrification (including ammonium oxidation and nitrite oxidation) in the oxic sediments of KE (Figures 3A, B). Potential nitrification rates calculated from 15NO2− amended incubations were about 3–18 times higher than 15NH4+ amended incubations (Figure 4A). In 15NH4+ amended incubation, the 15NO2− production rate was lower than 15NO3− at each station, contributing about 0%–45% (Figure 5, average 24 ± 17%) to total ammonium oxidation.
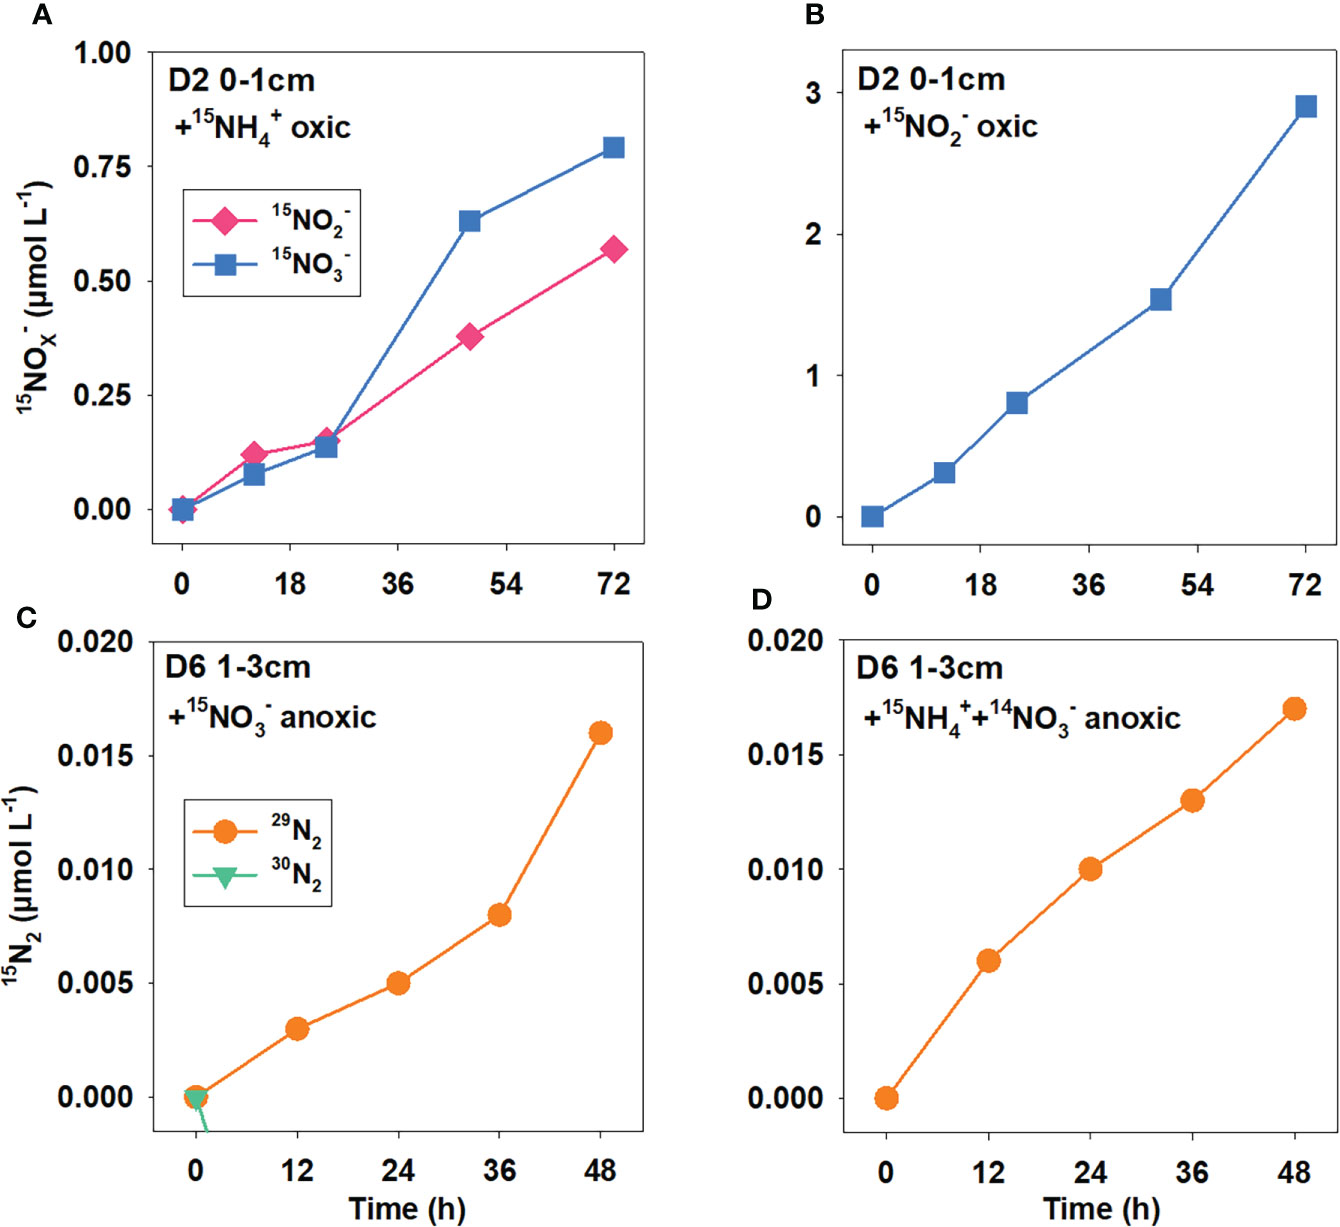
Figure 3 Production of 15NOX− (15NO3− and 15NO2−) and 15N2 (29N2 and 30N2) over time in anoxic and oxic 15N enrichment slurry incubations, respectively. (A) oxic incubation amended with 15NH4+; (B) oxic incubation amended with 15 NO2−; (C) anoxic incubation amended with 15NO3−; and (D) anoxic incubation amended with 15NH4++14NO3−.
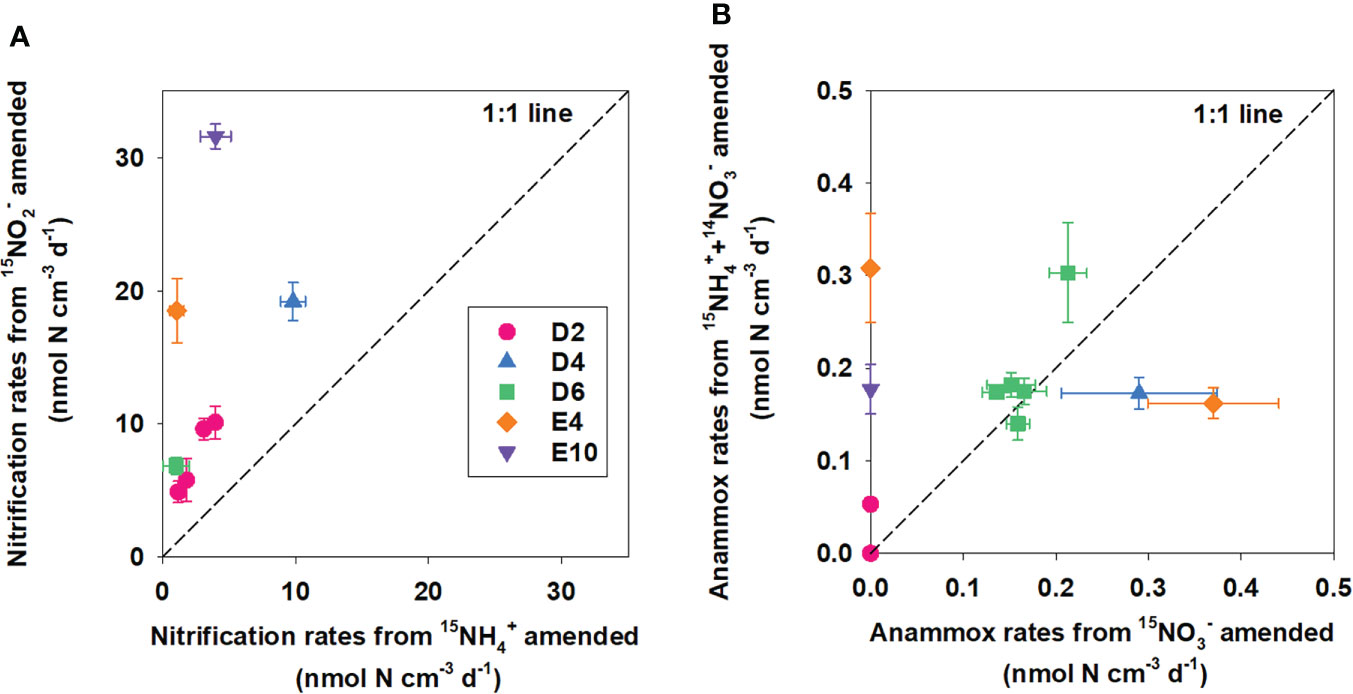
Figure 4 Comparison between (A) potential nitrification rates obtained from oxic incubations amended with 15NH4+ and 15NO2−; (B) potential anammox rates obtained from anoxic incubations amended with 15NO3− and 15NH4++14NO3−.
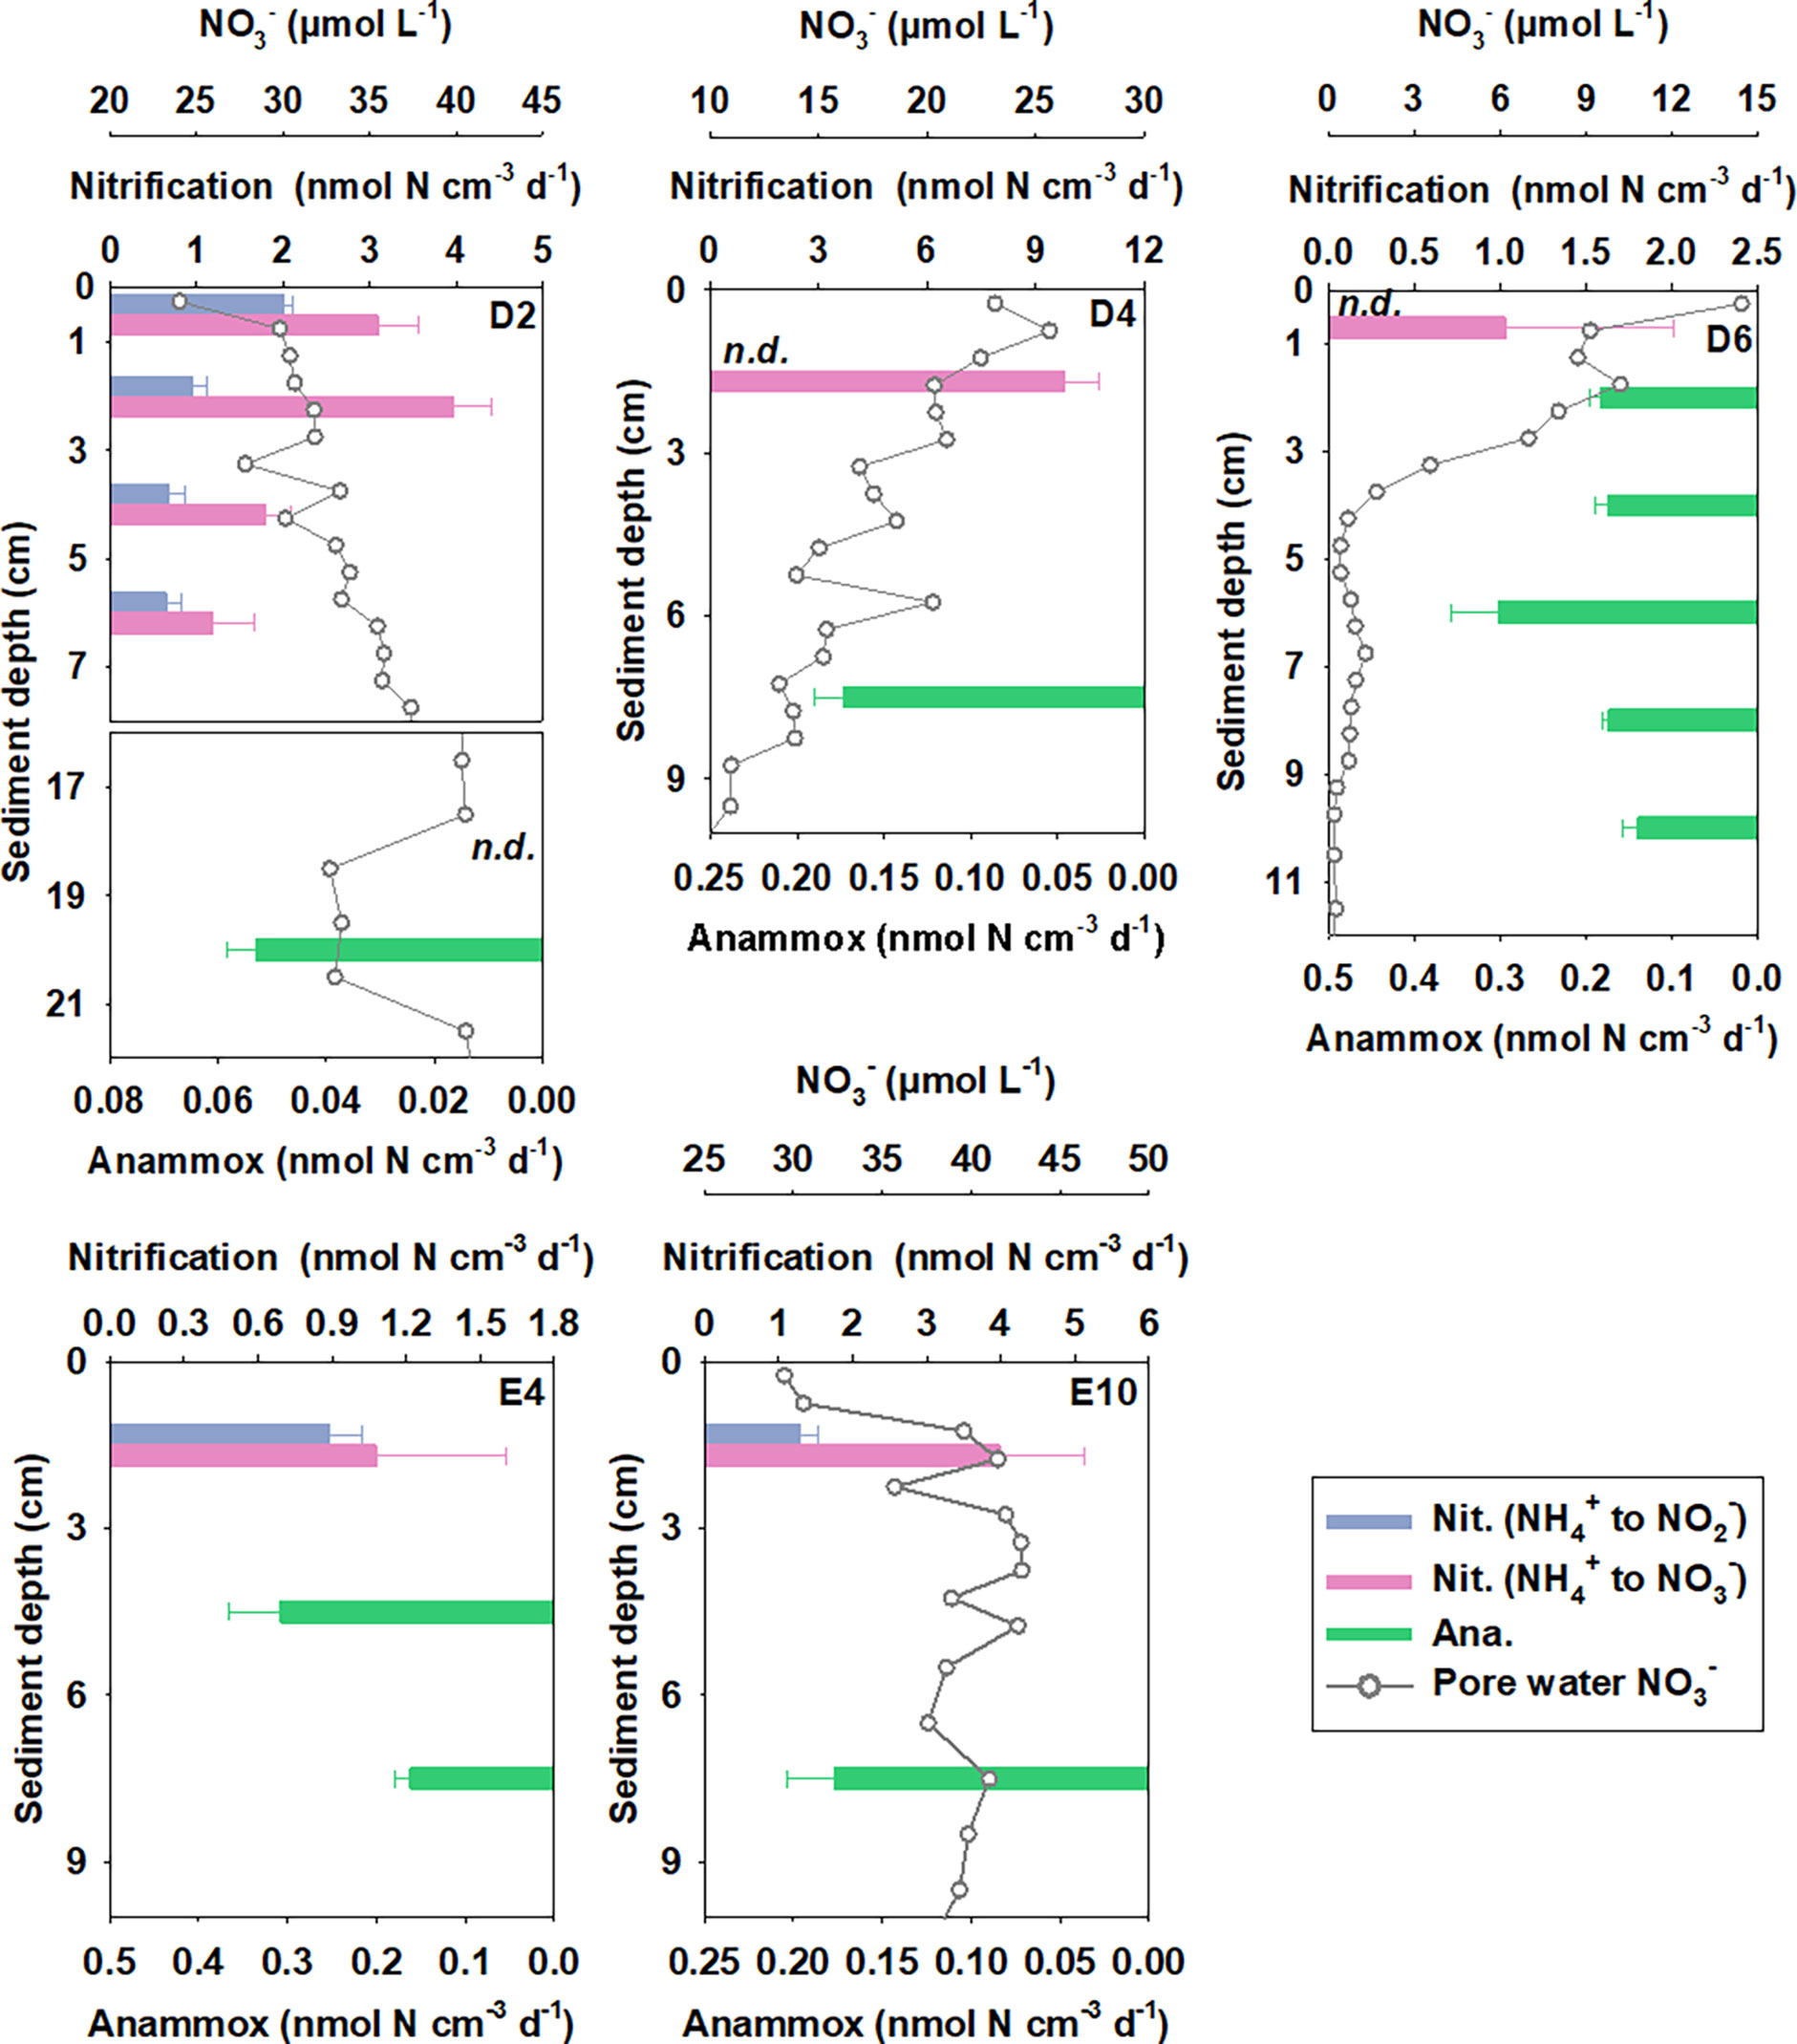
Figure 5 Potential rates of nitrification and anammox in different sediment layers estimated from 15NH4+ amended oxic incubations and 15NH4++14NO3− amended anoxic incubations, respectively. Denitrification is not displayed as it is not detected.
Potential nitrification rates (NH4+ to NO3− ) calculated from 15NH4+ modified incubations varied between 1.03 ± 0.98 and 9.81 ± 0.93 nmol N cm−3 (wet sediment) d−1, with neither a significant correlation with TOC, TN nor Chl-a (Figures 6A–C, p = 0.588, 0.731, and 0.815, respectively). Nitrification activity was highest in near-surface sediment and decreased gradually with depth (Figure 5). Integrated potential nitrification rates from 15N incubation in the oxic sediment zone generally showed an increasing trend from north to south (Table 3), with the distance from the Kuroshio–Oyashio transition region.
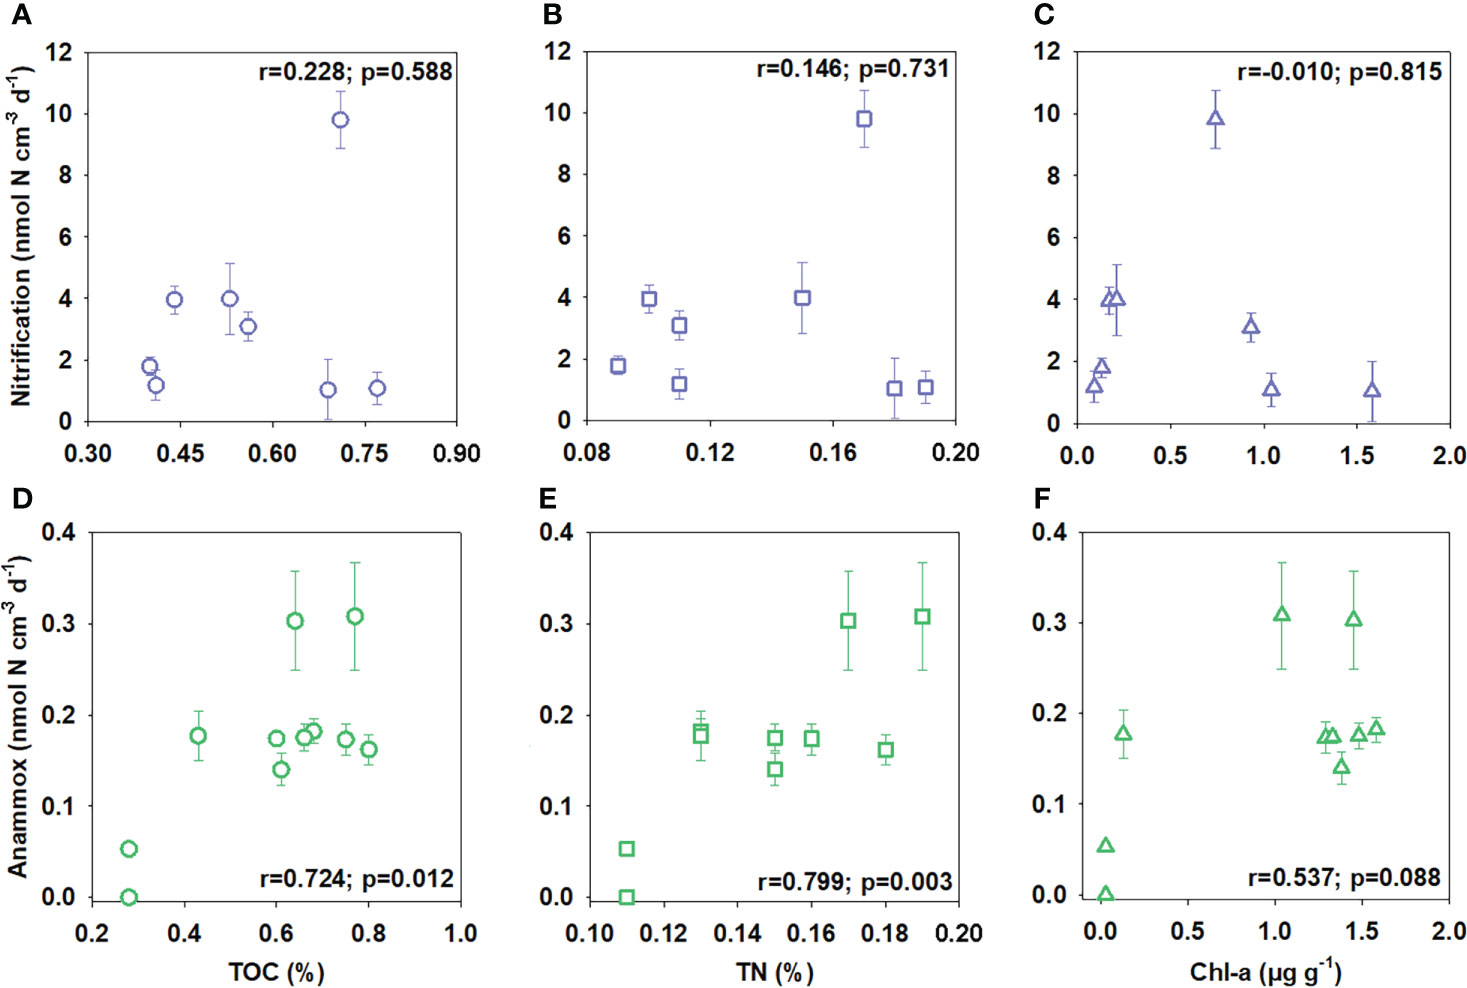
Figure 6 Correlations between TOC (A, D), TN (B, E), and Chl-a (C, F) content in sediment and potential nitrification or anammox rates.
Anoxic 15N slurry incubation experiments under in situ temperature
The linear production of 29N2 over time in 15NH4++14NO3− amended anoxic incubation at each station (except for Sta. D2 17–19 cm) proved the presence of anammox in the anoxic sediments of KE (Figure 3C, D). However, 30N2 and 15NH4+ 15NH4+ were not significantly produced in 15NO3− amended incubation at any station, indicating the deficient activity of denitrification and dissimilatory nitrate reduction to ammonium (DNRA) under in situ conditions. Potential anammox rates calculated from 15NH4++14NO3− incubations were mainly higher than amended (Figure 4B).
Potential anammox rates calculated from 15NH4++14NO3− ranged from 0 to 0.31 ± 0.06 nmol N cm−3 (wet sediment) d−1 with significant linear correlation with TOC, TN, and Chl-a (Figures 6D–F, p = 0.012, 0.003, and 0.088, respectively), showing a decreasing trend from north to the south with the distance from the Kuroshio–Oyashio transition region (Figure 5). For Sta. D6, the maximum anammox rate appeared in the 5–7 cm layer where nitrate was depleted and ammonium started to accumulate, while rates in other layers had little difference. Limited by data of layered potential anammox rates and nitrate penetration depth we obtained, we cannot calculate the integrated potential rate of anammox in the sediment anoxic zone at each station.
Temperature gradient experiment
Potential rates of denitrification and anammox at Sta. D6 increased with temperature at the beginning and started to decrease after the optimal temperature (Topt), which is 41°C for denitrification and 13°C for anammox (Figure 7A). The relative contribution of anammox to N-loss (ra) was highest at low temperatures and decreased with temperature to near zero eventually. The potential DNRA rate rose wavelike before 29°C, and the Topt for DNRA is unidentified (Figure 7B). The apparent activation energy (Ea) calculated by the Arrhenius equation was 174.2 ± 9.6, 54.5 ± 10.2, and 91.9 ± 22.9 kJ mol−1 for denitrification, anammox, and DNRA, respectively. As a whole, the temperature response of denitrification, anammox, and DNRA differed sharply in deep-ocean sediment.
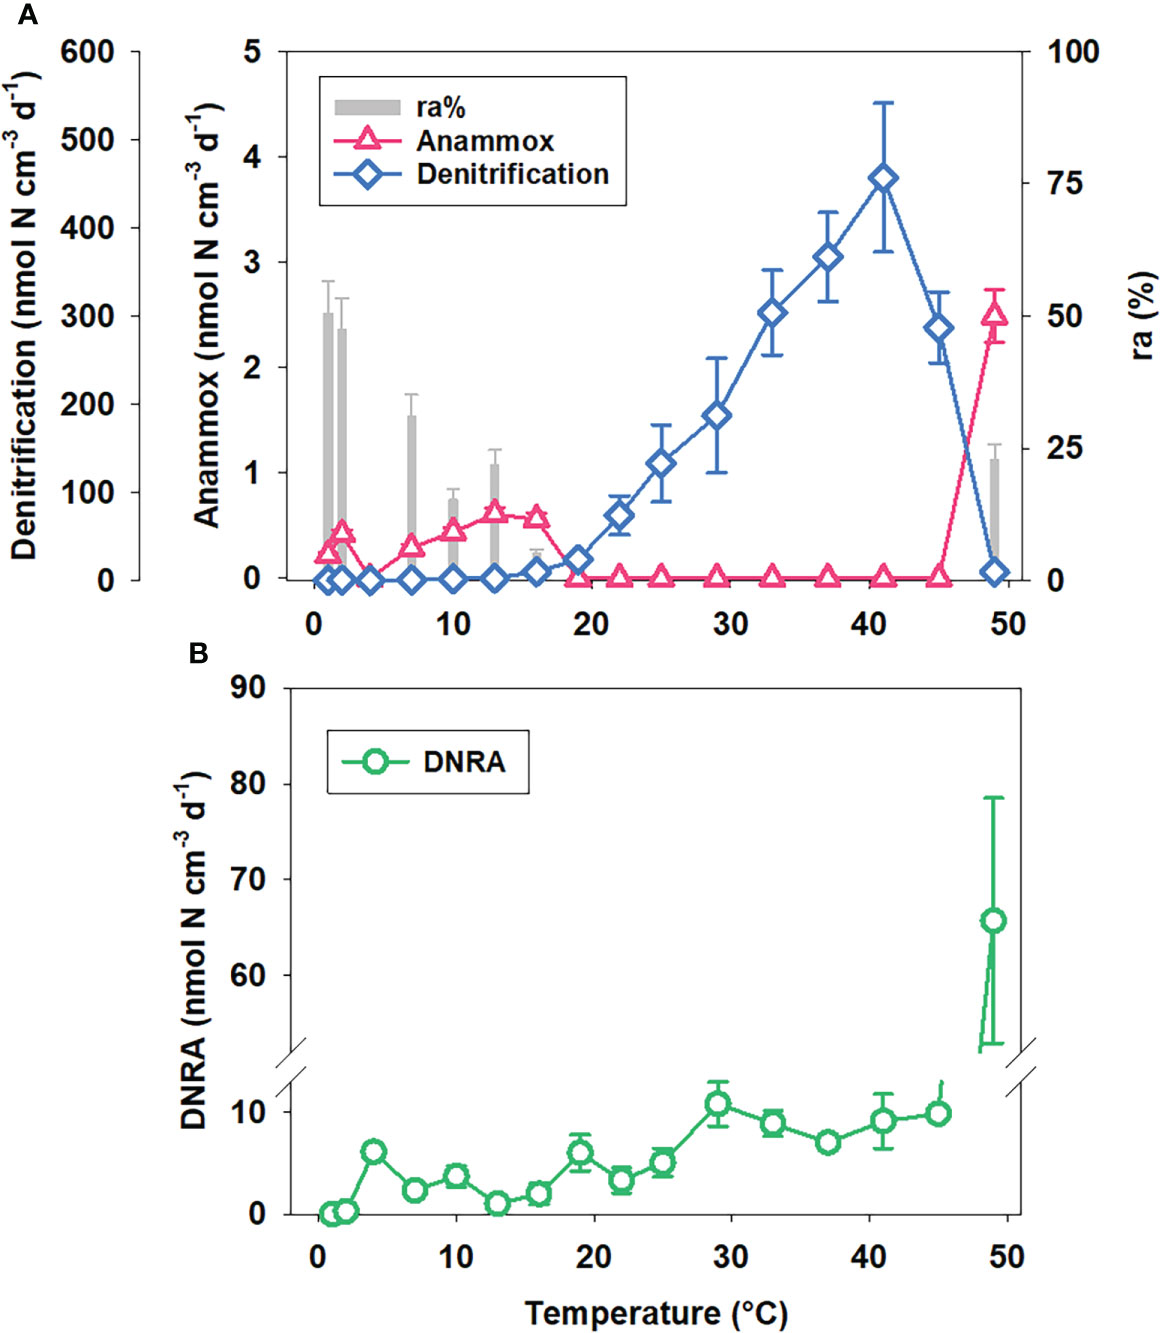
Figure 7 (A) Potential N-loss processes rates and ra and (B) potential DNRA rates at station D6 under different temperatures.
Discussion
Anammox as a predominant process of N loss in KE sediment
Denitrification and anammox are two major fixed inorganic nitrogen removal pathways in marine sediment. The relative contribution of denitrification and anammox to total nitrogen loss, which affects the nitrogen budget, varies in different marine environments. Therefore, it has gained much attention over the last two decades (Devol, 2015; Chen et al., 2021). However, compared to marginal seas, studies on deep-ocean sediment are still scarce. Previous studies on benthic N-loss in the deep marine environment based on DIN flux and 15N slurry and intact core incubation (Table 4) all indicate anammox as a significant N-loss process in deep-sea sediment (most ra >40%). In our results, fluxes of denitrification and anammox are in the same order of magnitude compared to previous studies. It seems to be a consensus that the contribution of anammox has a decreasing trend with the increasing TOC content in sediment because denitrification as a heterotrophic process is enhanced (Dalsgaard et al., 2005). On account of the ra of 52.8% at the station with the highest TOC content in sediment, we predict that anammox is not only a significant but also the predominant process of benthic N-loss in KE, similar to in the Ulleung Basin (Na et al., 2018), and the Atacama and the Kermadec trench (Thamdrup et al., 2021).
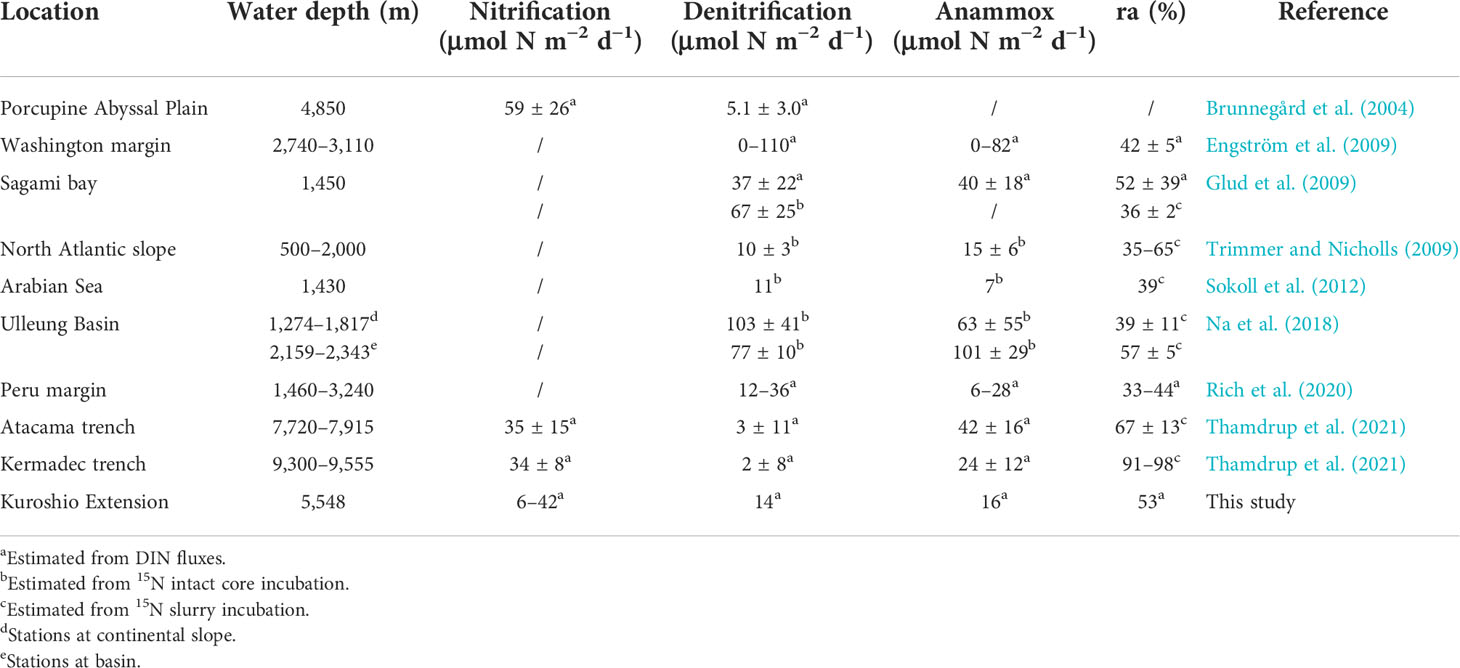
Table 4 Nitrification, denitrification, anammox rates, and ra reported from other deep-ocean sediment (water depth >1,000 m).
On the other hand, meager denitrification (all under the detection limit) in 15N slurry incubation under in situ temperature can partly support the point that anammox is the predominant N-loss process in KE sediment as well. Denitrification is undetected mainly because of the high detection limit of 30N2 for membrane inlet mass spectrometer (MIMS) due to the interference of NO+, whose molecular weight is also 30 produced in quadrupole mass spectrometer (An et al., 2001). Because ra calculated by flux or 15N slurry incubation is approximately the same (Engström et al., 2009; Rich et al., 2020; Thamdrup et al., 2021), we assume that ra is also 52.8% in sediment from Sta. D6 (5–7 cm), where anammox rate is the highest determined by 15N incubation. The highest denitrification rate estimated in this way is about 0.22 nmol N cm−3 (wet sediment) d−1, still far below the detection limit of our MIMS (about 0.66 nmol N cm−3 (wet sediment) d−1 in our home-made MIMS). It might remind us that MIMS is not likely suitable for determining denitrification with low activity in deep-ocean sediment.
Temperature response of deep-ocean benthic dissimilatory nitrate reduction processes
Temperature affecting microbial enzyme activity is critical for dissimilatory nitrate reduction processes (Dalsgaard and Thamdrup, 2002; Brin et al., 2014). In the deep ocean with consistently low temperatures, present studies paid more attention to the effects of substrates like nitrate and organic carbon (Na et al., 2018; Rich et al., 2020), while the temperature responses were always selectively ignored. Our results of the temperature gradient 15N slurry incubation experiment in sediment with a water depth of over 5000 m precisely emphasize temperature as a crucial limiting factor for denitrification, anammox, and DNRA in deep ocean sediment. The lower Topt (13°C) for anammox compared with denitrification confirms that marine anammox bacteria are psychrophile (Van De Vossenberg et al., 2008). It partly explains anammox as the dominant process for deep-ocean benthic N-loss in KE under low in situ temperature (~2°C). The activities of denitrification and DNRA can still increase significantly with temperature, indicating that temperature might be the primary limiting factor rather than substrates for denitrification and DNRA in northern KE with high pelagic primary production and organic matter supplement. The maximum rates of anammox and DNRA at 49°C are most likely non-biological processes for few microorganisms could live under such a high temperature.
We summarize the results of temperature gradient experiments for N-loss processes reported from different marine sediments around the world in Table 5. The Topt (13°C) and Ea (54.5 ± 10.2 kJ mol−1) for anammox in our results are similar to marine sediment from high latitude areas where the temperature is constantly low (Dalsgaard and Thamdrup, 2002; Rysgaard et al., 2004; Canion et al., 2014a, Topt = 9–17°C; Ea = 51–61 kJ mol−1). However, Topt for anammox is slightly lower than sediment from middle or low latitude areas, while Ea is generally higher (Canion et al., 2014a, b; Brin et al., 2017; Tan et al., 2020, Topt = 20–33°C; Ea = 30.1–68.5 kJ mol−1). This result suggests that anammox bacteria may adapt to higher and more variable temperatures. However, Topt (41°C) and Ea (174.2 ± 9.6 kJ mol−1) for denitrification in our results are both surprisingly higher than in other areas (Topt = 17–37°C Ea = 35.8–123.5 kJ mol−1). This result emphasizes the much greater temperature dependence of heterotrophic denitrification bacteria in KE sediment with extremely low in situ temperature, explaining the low activity of benthic denitrification in the deep ocean from another perspective. Interestingly, the benthic denitrification bacteria community does not seem to show good adaption to the low-temperature environment in the deep ocean of KE compared to the results on the Svalbard and Greenland coasts (Rysgaard et al., 2004; Canion et al., 2014a), but the reason for this result is still unclear.
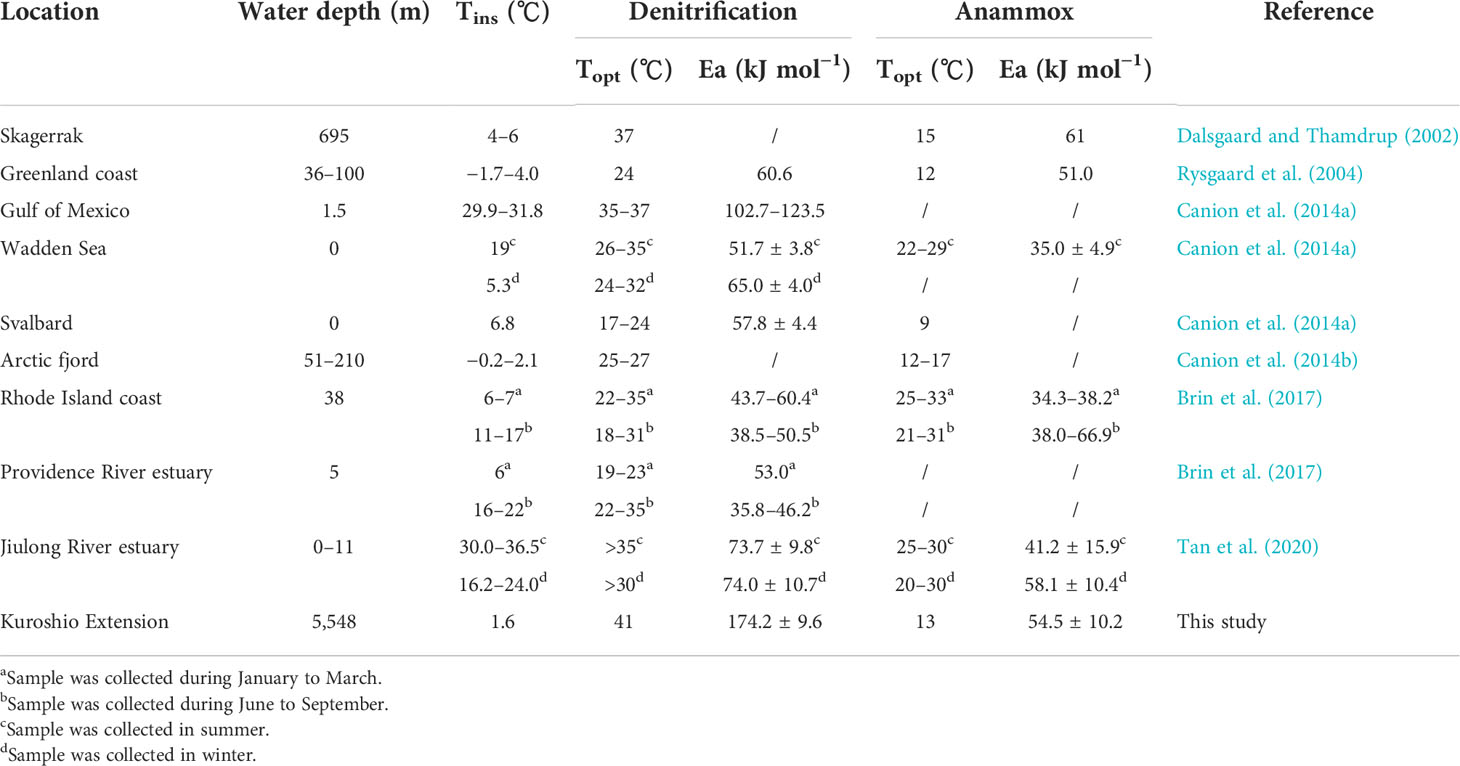
Table 5 Temperature gradient experiments for N-loss processes reported from other sediment (Tins, in situ temperature; Topt, optimal temperature; Ea, apparent activation energy).
Several studies have proved that DNRA can be enhanced with rising temperatures (King and Nedwell, 1984; Dong et al., 2011; Yin et al., 2017). Nevertheless, the results of the temperature gradient experiments reported were rare. The Topt for DNRA in our results is hard to identify for the fluctuant increasing trend before 29°C (Figure 7B), while the temperature gradient incubation over 30 ℃ has never been conducted before. Thus, the Topt for DNRA is still uncertain. The Ea for DNRA in our results (91.9 ± 22.9 kJ mol−1) is comparable to the results reported in urban wetland sediments (50–107 kJ mol−1, Rahman et al., 2019) but much higher than the results in coastal sandy sediments (28 kJ mol−1, Kraft et al., 2014). The temperature dependence of DNRA is between denitrification and anammox in KE sediment (Ea: denitrification >DNRA >anammox). Our result is different from previous results, which indicated that the temperature dependence of denitrification was slightly lower than DNRA (Kraft et al., 2014; Rahman et al., 2019).
Anammox and nitrification limited by ammonium
The concentration of substrates in pore-water is considered to be another significant factor for benthic N cycling processes (Dalsgaard et al., 2005). In continental margin sediment with high nitrate removal and ammonium production from mineralization activity, nitrate can be entirely depleted in the sediment at a few centimeters depth, and its concentration is usually below the half-saturation constant of nitrate (Km_NO3 ) for anammox (2.5 μmol L−1, Lotti et al., 2014). While ammonium accumulates with depth, its concentration in the anoxic layer is generally much higher than Km_NH4 for anammox reported (<5 μmol L−1, Strous et al., 1999). Thus, anammox is mainly limited by nitrate as the electron acceptor of the reaction in continental margin sediment (Gihring et al., 2010; Song et al., 2013; Brin et al., 2014). However, in our results, the low concentration of ammonium in pore-water (<10 μmol L−1) and the discrepant anammox rates determined by anoxic incubation amended with 15NO3− and 15NH4++14NO3− (AP1 and AP2) both suggest that ammonium is the limiting substrate instead of nitrate for benthic anammox in the deep-ocean of KE (Figures 2B, 4B). The addition of ammonium in slurry incubations can significantly enhance anammox (AP2 >AP1), especially for the southern Sta. E10 and D2, which display entirely different characteristics compared to the result of continental margin sediments. The abnormally higher anammox rates detected in 15NO3− than in 15NH4++14NO3− amended incubation at Sta. D4 and E4 are possibly caused by overproduction of 29N2 via undetected denitrification. Despite similar pore-water ammonium profiles having been reported in deep margin and abyssal plain sediment (Christensen and Rowe, 1984; Berelson et al., 1990; Rich et al., 2020; Thamdrup et al., 2021), we first prove the significant influence of ammonium deficiency on anammox using 15N experimental methods. The excellent correlation between potential autotrophic anammox rates and TOC and TN also indicates that the mineralization of organic matter could be a crucial pathway of ammonium supplement under this condition (Figures 6D, E).
It is difficult to demonstrate whether nitrification is limited by ammonium in KE sediment like anammox using the 15N experiment for the excess addition of 15NH4+ in the incubation system. Nevertheless, the comparison between total nitrification estimated from DIN fluxes (NF) and integrated potential nitrification rates (NIP), which respectively represent the genuine rates and potential nitrification activities in the oxic sediment zone, may provide some evidence (Figure 8). A similar comparison has been conducted in the Arabian Sea (Sokoll et al., 2012). NIP is 1–2 orders of magnitude higher than NF in our results, except for Sta. D4 and D6 (NIP/NF = 3.5 and 1.3, respectively), where sediment has a relatively abundant supplement of ammonium, indicating the possible existence of ammonium limitation for nitrification at other stations more or less. Moreover, an exponential decrease in the NIP/NF ratio may also indicate the growing effect of ammonium limitation from southern to northern stations (D2 to D6). It might be the reason why NF has the highest value at the central Sta. D4, where potential nitrification activity and ammonium supplement are relatively high simultaneously. No significant correlation between potential rates of nitrification and either TOC, TN, or Chl-a might indicate that mineralization of organic matter might not be the only ammonium source. However, the ammonium limitation still exists for nitrification. We predict that the release of ammonium by microbes and meiofauna in the surface oxic sediment mentioned above could be another alternative ammonium source (Hall et al., 2007; Engström et al., 2009). Otherwise, the strong benthic O2 consumption could inhibit the growth of nitrification bacteria in the northern KE region (Ward, 2008), which could be the reason for the abnormally low nitrification rates in sediments with high TOC and TN content (Figures 6A, B). Whereas more directly measured benthic nitrification rates in the deep ocean are required to verify the hypotheses above.
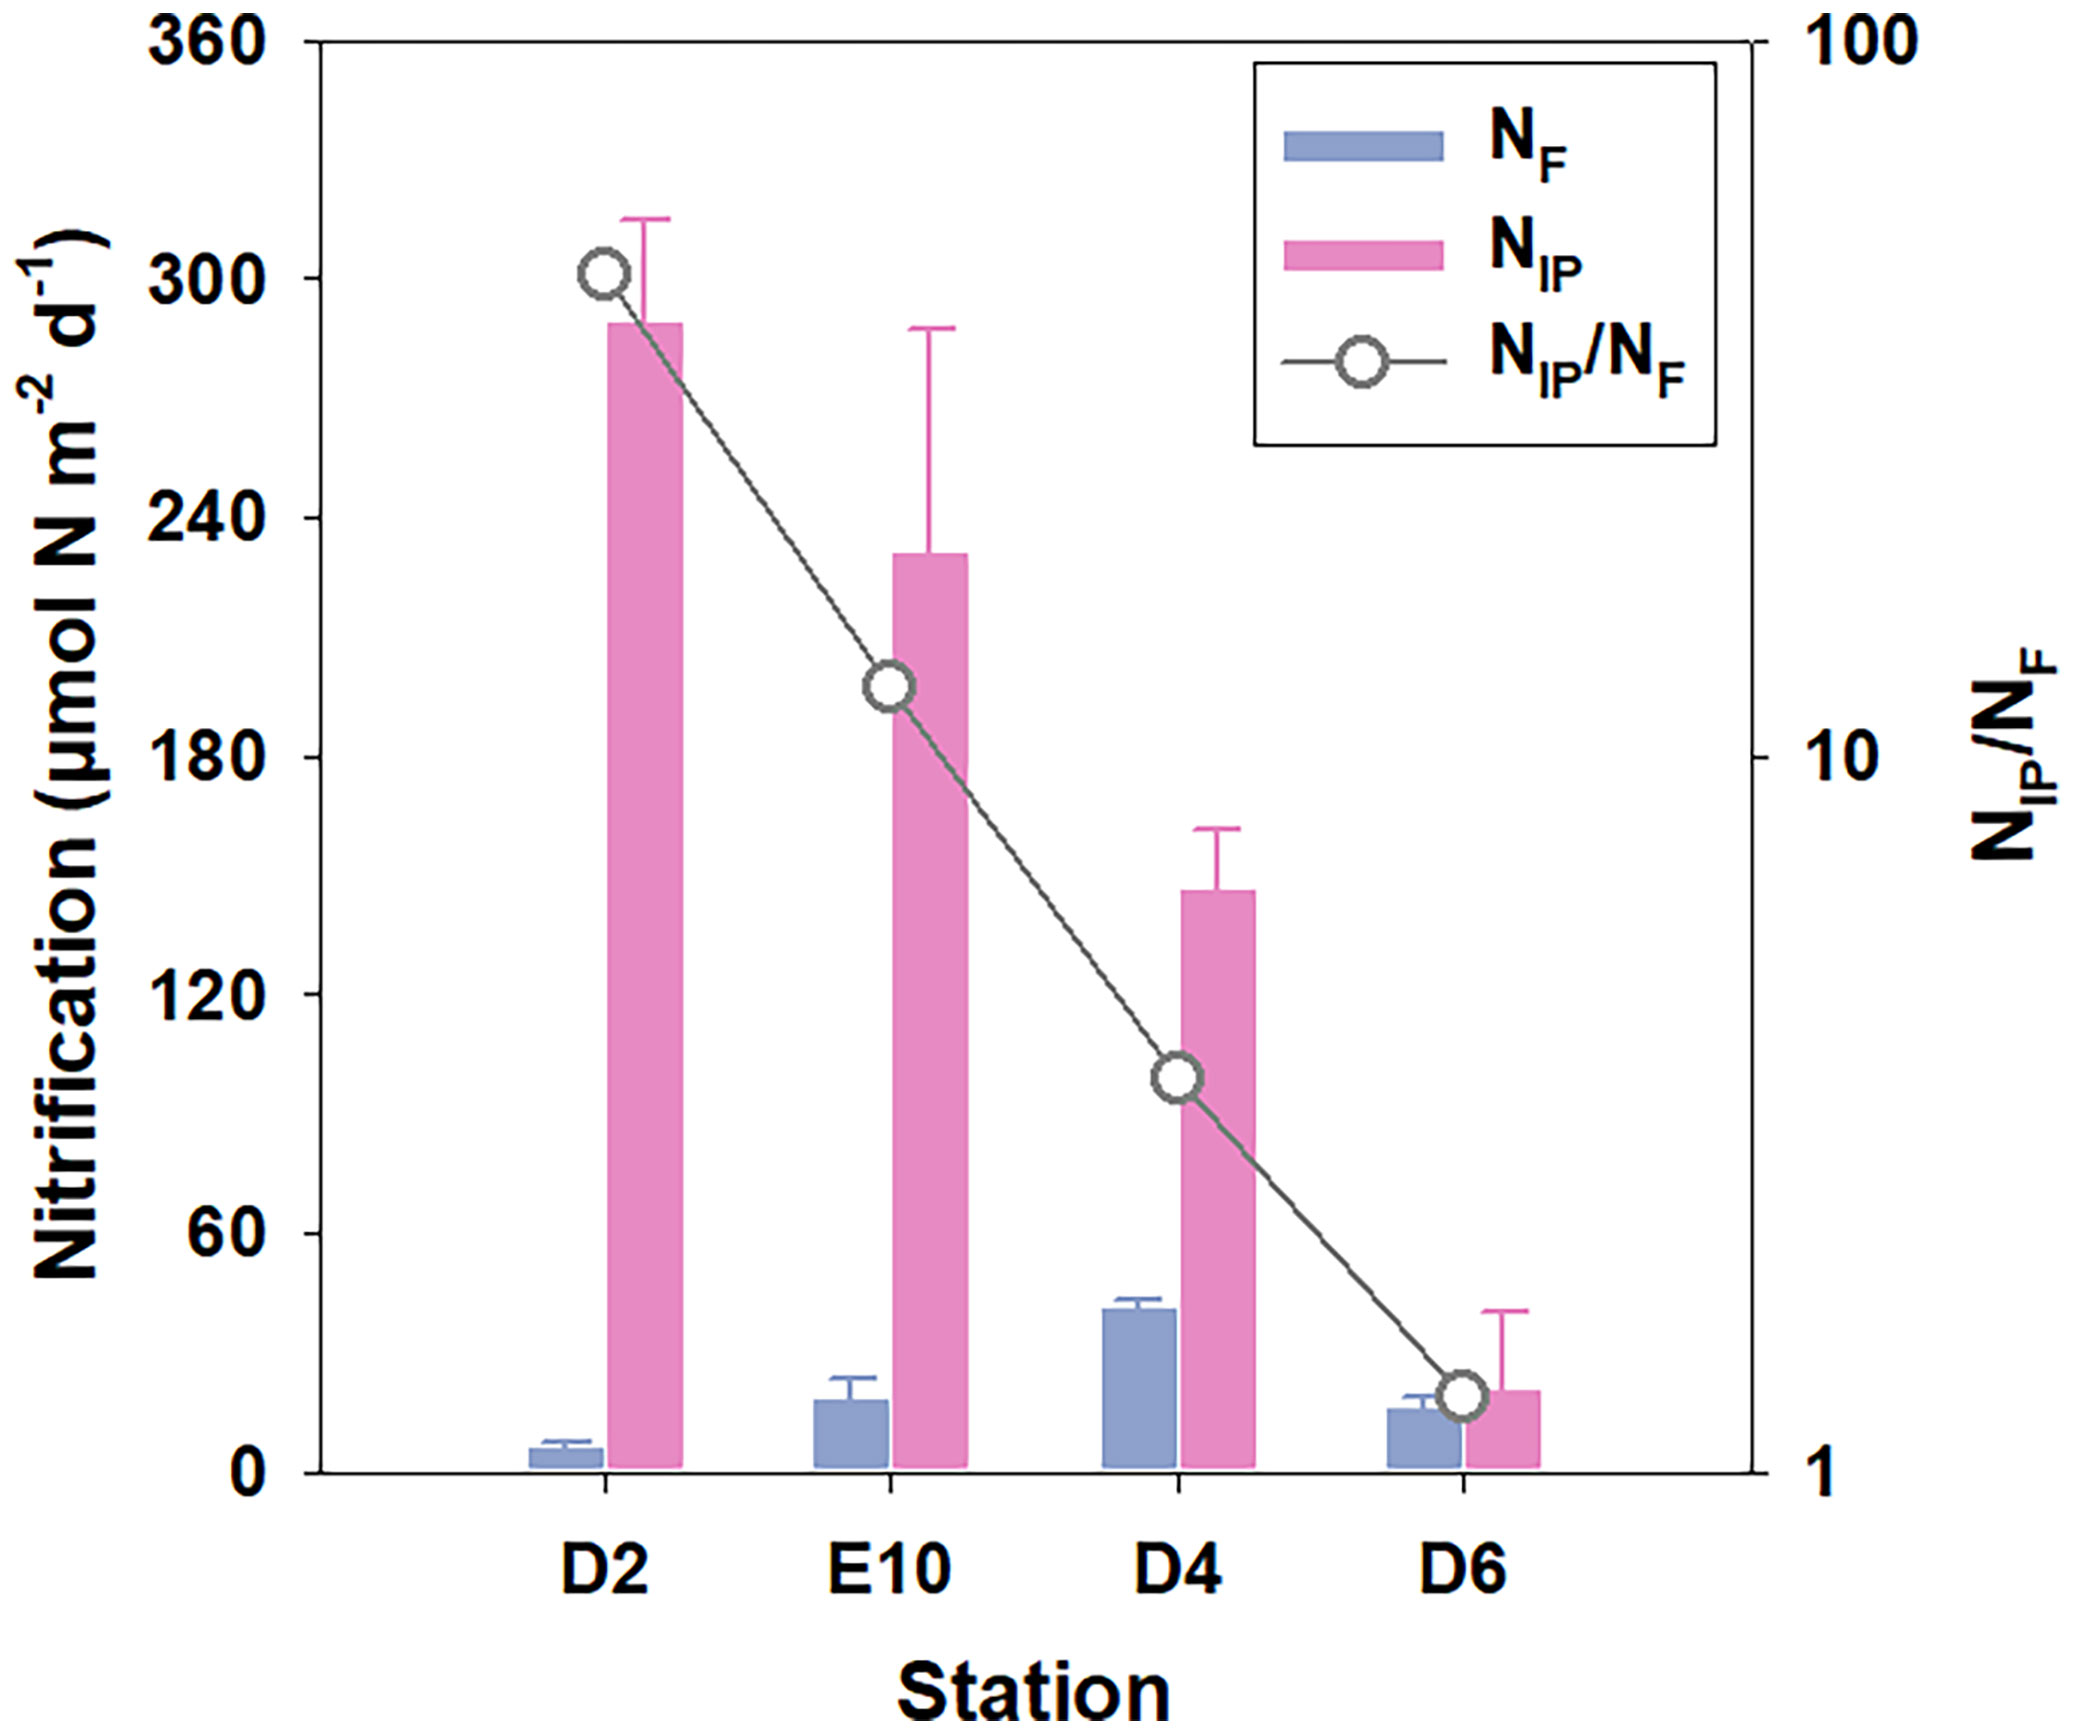
Figure 8 Comparison between total nitrification estimated from DIN fluxes (NF) and integrated potential nitrification in sediment oxic zone (NIP) and the ratio of NIP and NF.
Benthic nitrogen cycling regulated by pelagic primary production in KE
Organic matter plays a crucial role in benthic nitrogen cycling as both an energy source and an electron donor for heterotrophic denitrification, as well as a source of ammonium, which is the substrate for autotrophic anammox and nitrification (Devol, 2015). The organic matter in sediment is mainly derived from the transportation of biogenic elements like carbon via the biological pump, especially for the open ocean, with little effect from human activity (Lutz et al., 2007). Thus, as the first step of the biological pump, pelagic primary production, which transfers inorganic carbon into organic carbon, might also be a critical regulating factor for benthic nitrogen cycling.
Present studies based on satellite and underway observations demonstrate the high variability of NPP in KE (Lin et al., 2014; Clayton et al., 2021), agreeing well with the spatial distribution of total benthic N-loss in our results (Figure 1 and Table 3). In the northern KE (Sta. D6, which might include Sta. E4) with higher NPP, more abundant organic matter stimulates N-loss processes but limits nitrification because of the high O2 consumption via the mineralization process. While in the southern KE (Sta. D4, E10, and D2), less organic matter supplemented, which makes autotrophic aerobic nitrification the predominant nitrogen cycling process. The sediment in KE generally shifts from nitrate sink to source from the north to the south with decreased pelagic NPP (Table 3). Therefore, the pelagic primary production still significantly regulated the benthic N budget and the N cycling behaviors in KE with a water depth of over 5,000 m.
The limited data we obtained during this cruise makes it hard to deeply understand the nitrogen cycling processes in deep ocean sediments regulated by organic matter supplements. Therefore, we extracted the pore-water DIN data of the worldwide continental slope and abyssal plain sediments reported previously. The total nitrification and NO3− loss rates were estimated using the method described in the present study (see Materials and methods). NO3− loss rates (NO3− to N2 by denitrification and anammox) are used here to represent total N-loss activity because pore-water ammonium hardly accumulates with sediment depth, and the upward flux of ammonium cannot be obtained in abyssal plain sediments. The correlation between nitrification or NO3− loss and water depth or NPP is shown in Figure 9. In abyssal plain areas, either benthic nitrification or NO3− loss has a good correlation with NPP (Figures 9B, D, p <0.001). However, the correlations between the two processes and water depth are relatively poor (Figures 9A, C, p = 0.046 and 0.064, respectively), unlike the traditional point claimed (Thamdrup and Dalsgaard, 2002; Dalsgaard et al., 2005; Na et al., 2018). It means pelagic primary production as the production step of the biological pump might play a more crucial role in organic matter supplementing the benthic N cycle in abyssal plain areas with relatively more minor depth variation (Figure 10). While in steep continental slope areas, nitrification or NO3− loss shows a better correlation with water depth than NPP (Figure 9, p = 0.032 or <0.001 for water depth and p = 0.063 or 0.083 for NPP, respectively). For the variation of water depth is much more significant than the horizontal variation of NPP at different stations, the different decomposition levels of produced particulate organic matters during the vertical transportation and burial processes from the surface seawater to the seafloor might have more effect on the benthic N cycle (Figure 10). Our results highlight that benthic nitrogen cycling processes in abyssal plain areas are mainly regulated by pelagic primary production from the perspective of organic matter supplements, helping further understand the deep ocean benthic nitrogen cycle and the global nitrogen budget.
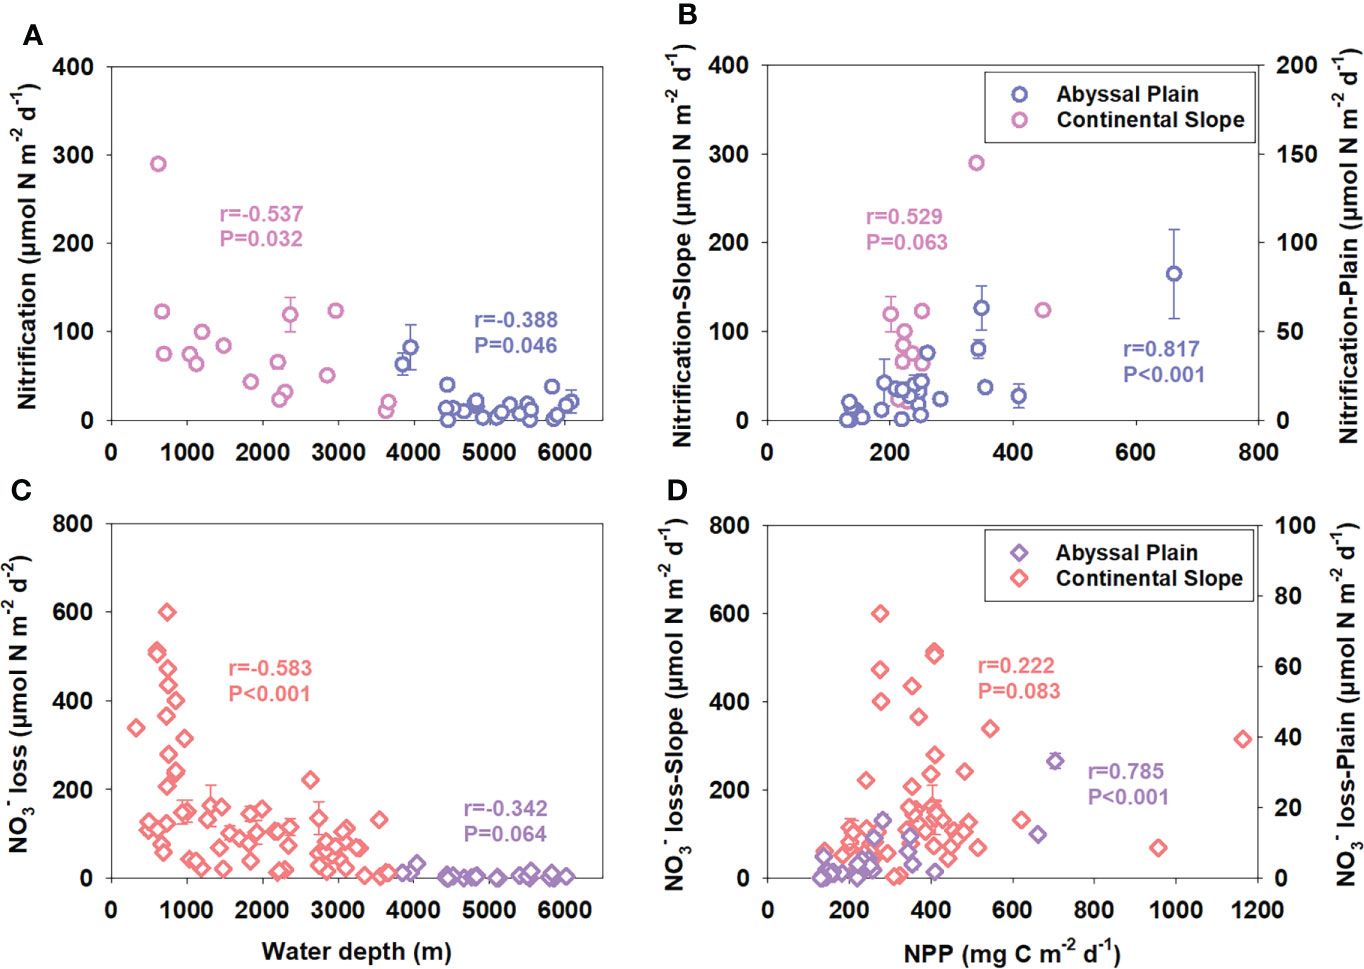
Figure 9 Correlations between water depth (A, C) or pelagic net primary productivity (B, D) and benthic nitrification or NO3− loss rates in worldwide abyssal plains and continental slopes. Stations with water depths over 3,800 m are considered to locate in abyssal plain areas. N cycling rates are estimated from published pore-water NO3− profiles using the method described in this study (Emerson et al., 1980; Christensen and Rowe, 1984; De Lange, 1986; Sorensen et al., 1987; Nath and Mudholkar, 1989; Berelson et al., 1990; Balzer et al., 1998; Grandel et al., 2000; Hensen et al., 2000; Brunnegård et al., 2004; Engström et al., 2009; Jaeschke et al., 2010; Chong et al., 2012; Sokoll et al., 2012; Wankel et al., 2015; Rich et al., 2020; Thamdrup et al., 2021; This study) or are presented directly in the original article estimated via NO3− fluxes obtained by a benthic lander (Jahnke and Jahnke, 2000) or measured using intact core incubation (Na et al., 2018). Pore-water NO3− concentration not shown directly is extracted from the NO3− profile images using WebPlotDigitizer (Version 4.5, https://automeris.io/WebPlotDigitizer).
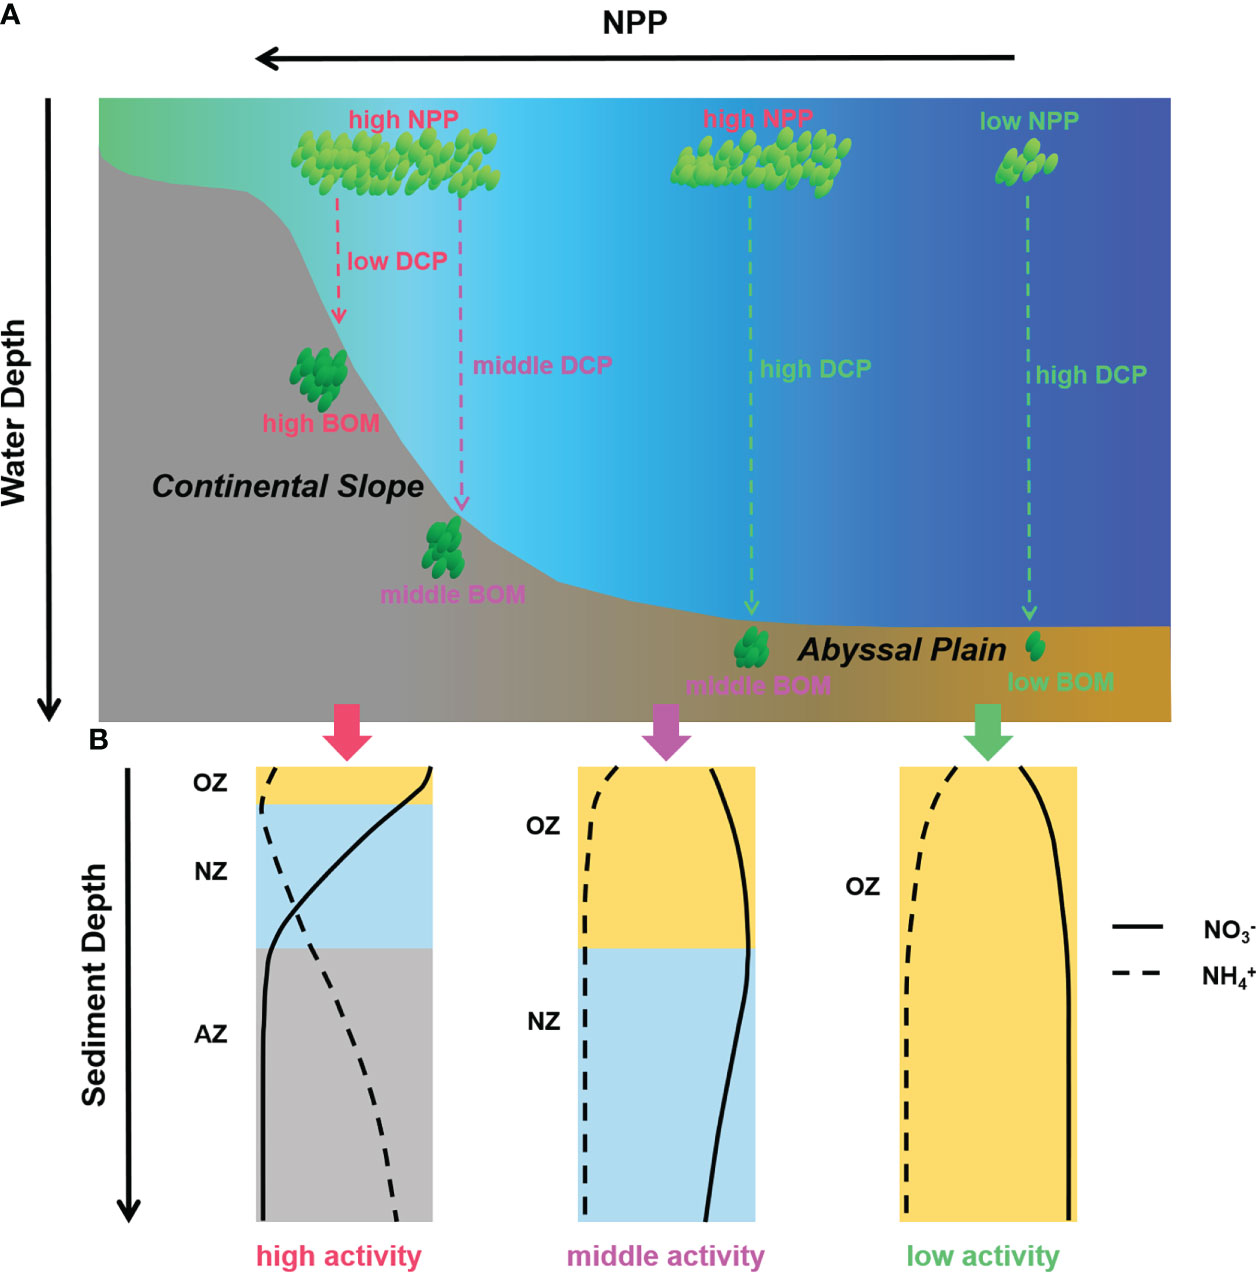
Figure 10 (A) Production, transportation, and burial of organic matters in continental slope and abyssal plain areas and (B) different pore-water nitrate and ammonium profiles and benthic nitrogen cycling behaviors caused by various organic matter supplement conditions. (NPP, net primary production; DCP, decomposition of organic matters; BOM, burial organic matters; OZ, oxic zone; NZ, anoxic nitrogenous zone; AZ, NO3− depleted anoxic zone).
Conclusions
In summary, our results demonstrate the spatial distribution and the limiting environmental factors of benthic nitrogen cycling processes (including nitrification and dissimilatory nitrate reduction) in the deep ocean of the Kuroshio Extension region. The N-loss rate decreases from north to south, while the nitrification rate is relatively higher in the central stations. Anammox is considered to be the predominant N-loss process. The temperature gradient experiment indicates temperature as one of the limiting factors for benthic dissimilatory nitrate reduction processes. Compared to dominant psychrophilic anammox, denitrification with a surprisingly high optimal temperature and apparent activation energy is inhibited in consistently cold deep ocean sediment. Pore-water ammonium concentration is another limiting factor for anammox and nitrification in deep ocean sediment, unlike in margin sediment. The significant correlation between anammox and TOC, TN, and Chl-a indicates that mineralization of organic nitrogen is the primary ammonium source for anammox, while the supplement of ammonium might have other pathways for nitrification. Moreover, benthic N cycling is regulated by pelagic primary production, which produces organic matter and acts as both an energy source and a substrate source in the deep ocean. Overall, benthic N cycling in the deep ocean displays an entirely different feature from the marginal seas. Despite several relative studies that have led us to learn about the deep ocean benthic N cycling generally, however, actual measured data is severely lacking. Some fundamental problems, such as the primary limiting factor of benthic N cycling processes in different deep ocean environments and their global implications, are still unclear and need more experimental evidence in the future.
Data availability statement
The raw data supporting the conclusions of this article will be made available by the authors, without undue reservation.
Author contributions
GS and HX designed the study. HX performed the sampling procedures, onboard experiments and lab analyses with assistance from GS, SY and RZ. HX analyzed the data, wrote the manuscript and prepared the figures and tables. GS, GZ and SL provided comments on data analyses and revised the manuscript. All authors contributed to the article and approved the submitted version.
Funding
This study is financially supported by the National Science Foundation of China (U1806211, 42076035, and 41606093), the Fundamental Research Funds for the Central Universities (202072001), and the Taishan Scholars Programme of Shandong Province.
Acknowledgments
The captains and crew of R/V Dongfanghong 3 are thanked for their help with field sampling. Guoling Zhang, Baichuan Wang, Peiyun Wu, and Haonan Wang are also acknowledged for their help in sample analysis and online NPP data acquisition. We sincerely thank two reviewers for the constructive comments. This is MCTL (Key Laboratory of Marine Chemistry Theory and Technology) contribution #301.
Conflict of interest
The authors declare that the research was conducted in the absence of any commercial or financial relationships that could be construed as a potential conflict of interest.
Publisher’s note
All claims expressed in this article are solely those of the authors and do not necessarily represent those of their affiliated organizations, or those of the publisher, the editors and the reviewers. Any product that may be evaluated in this article, or claim that may be made by its manufacturer, is not guaranteed or endorsed by the publisher.
References
An S., Gardner W. S., Kana T. (2001). Simultaneous measurement of denitrification and nitrogen fixation using isotope pairing with membrane inlet mass spectrometry analysis. Appl. Environ. Microbiol. 67 (3), 1171–1178. doi: 10.1128/AEM.67.3.1171-1178.2001
Balzer W., Helder W., Epping E., Lohse L., Otto S. (1998). Benthic denitrification and nitrogen cycling at the slope and rise of the NW European continental margin (Goban spur). Prog. Oceanogr. 42 (1-4), 111–126. doi: 10.1016/S0079-6611(98)00030-5
Berelson W. M., Hammond D. E., O'neill D., Xu X. M., Chin C., Zukin J. (1990). Benthic fluxes and pore water studies from sediments of the central equatorial north pacific: Nutrient diagenesis. Geochim. Cosmochim. Acta 54 (11), 3001–3012. doi: 10.1016/0016-7037(90)90117-4
Boudreau B. P. (1997). Diagenetic models and their implementation (Vol. 505) (Berlin: Springer). doi: 10.1016/s0264-8172(98)80005-6
Brin L. D., Giblin A. E., Rich J. J. (2014). Environmental controls of anammox and denitrification in southern new England estuarine and shelf sediments. Limnol. Oceanogr. 59 (3), 851–860. doi: 10.4319/lo.2014.59.3.0851
Brin L. D., Giblin A. E., Rich J. J. (2017). Similar temperature responses suggest future climate warming will not alter partitioning between denitrification and anammox in temperate marine sediments. Glob. Change Biol. 23 (1), 331–340. doi: 10.1111/gcb.13370
Brunnegård J., Grandel S., Ståhl H., Tengberg A., Hall P. O. (2004). Nitrogen cycling in deep-sea sediments of the porcupine abyssal plain, NE Atlantic. Prog. Oceanogr. 63 (4), 159–181. doi: 10.1016/j.pocean.2004.09.004
Canfield D. E., Glazer A. N., Falkowski P. G. (2010). The evolution and future of earth’s nitrogen cycle. Science 330 (6001), 192–196. doi: 10.1126/science.1186120
Canion A., Kostka J. E., Gihring T. M., Huettel M., Van Beusekom J. E. E., Gao H., et al. (2014a). Temperature response of denitrification and anammox reveals the adaptation of microbial communities to in situ temperatures in permeable marine sediments that span 50 in latitude. Biogeosciences 11 (2), 309–320. doi: 10.5194/bg-11-309-2014
Canion A., Overholt W. A., Kostka J. E., Huettel M., Lavik G., Kuypers M. M. (2014b). Temperature response of denitrification and anaerobic ammonium oxidation rates and microbial community structure in Arctic fjord sediments. Environ. Microbiol. 16 (10), 3331–3344. doi: 10.1111/1462-2920.12593
Chen J. J., Erler D. V., Wells N. S., Huang J., Welsh D. T., Eyre B. D. (2021). Denitrification, anammox, and dissimilatory nitrate reduction to ammonium across a mosaic of estuarine benthic habitats. Limnol. Oceanogr. 66 (4), 1281–1297. doi: 10.1002/lno.11681
Chong L. S., Prokopenko M. G., Berelson W. M., Townsend-Small A., McManus J. (2012). Nitrogen cycling within suboxic and anoxic sediments from the continental margin of Western north America. Mar. Chem. 128, 13–25. doi: 10.1016/j.marchem.2011.10.007
Christensen J. P., Rowe G. T. (1984). Nitrification and oxygen consumption in northwest Atlantic deep-sea sediments. J. Mar. Res. 42 (4), 1099–1116. doi: 10.1357/002224084788520828
Clayton S., Palevsky H. I., Thompson L., Quay P. D. (2021). Synoptic mesoscale to basin scale variability in biological productivity and chlorophyll in the kuroshio extension region. J. Geophys. Res.-Oceans 126 (11), e2021JC017782. doi: 10.1029/2021JC017782
Dalsgaard T., Thamdrup B. (2002). Factors controlling anaerobic ammonium oxidation with nitrite in marine sediments. Appl. Environ. Microbiol. 68 (8), 3802–3808. doi: 10.1128/AEM.68.8.3802-3808.2002
Dalsgaard T., Thamdrup B., Canfield D. E. (2005). Anaerobic ammonium oxidation (anammox) in the marine environment. Res. Microbiol. 156 (4), 457–464. doi: 10.1016/j.resmic.2005.01.011
De Lange G. J. (1986). Early diagenetic reactions in interbedded pelagic and turbiditic sediments in the nares abyssal plain (western north atlantic): Consequences for the composition of sediment and interstitial water. Geochim. Cosmochim. Acta 50 (12), 2543–2561. doi: 10.1016/0016-7037(86)90209-7
Devol A. H. (2015). Denitrification, anammox, and N2 production in marine sediments. Annu. Rev. Mar. Sci. 7, 403–423. doi: 10.1146/annurev-marine-010213-135040
Dong L. F., Sobey M. N., Smith C. J., Rusmana I., Phillips W., Stott A., et al. (2011). Dissimilatory reduction of nitrate to ammonium, not denitrification or anammox, dominates benthic nitrate reduction in tropical estuaries. Limnol. Oceanogr. 56 (1), 279–291. doi: 10.4319/lo.2011.56.1.0279
Emerson S., Jahnke R., Bender M., Froelich P., Klinkhammer G., Bowser C., et al. (1980). Early diagenesis in sediments from the eastern equatorial pacific, i. pore water nutrient and carbonate results. Earth Planet. Sci. Lett. 49 (1), 57–80. doi: 10.1016/0012-821X(80)90150-8
Engström P., Penton C. R., Devola A. H. (2009). Anaerobic ammonium oxidation in deep-sea sediments off the Washington margin. Limnol. Oceanogr. 54 (5), 1643–1652. doi: 10.4319/lo.2009.54.5.1643
Gihring T. M., Lavik G., Kuypers M. M., Kostka J. E. (2010). Direct determination of nitrogen cycling rates and pathways in Arctic fjord sediments (Svalbard, Norway). Limnol. Oceanogr. 55 (2), 740–752. doi: 10.4319/lo.2010.55.2.0740
Glud R. N., Berg P., Thamdrup B., Larsen M., Stewart H. A., Jamieson A. J., et al. (2021). Hadal trenches are dynamic hotspots for early diagenesis in the deep sea. Commun. Earth Environ. 2 (1), 1–8. doi: 10.1038/s43247-020-00087-2
Glud R. N., Thamdrup B., Stahl H., Wenzhoefer F., Glud A., Nomaki H., et al. (2009). Nitrogen cycling in a deep ocean margin sediment (Sagami bay, Japan). Limnol. Oceanogr. 54 (3), 723–734. doi: 10.4319/lo.2009.54.3.0723
Grandel S., Rickert D., Schlüter M., Wallmann K. (2000). Pore-water distribution and quantification of diffusive benthic fluxes of silicic acid, nitrate and phosphate in surface sediments of the deep Arabian Sea. Deep-Sea Res. Part II-Top. Stud. Oceanogr. 47 (14), 2707–2734. doi: 10.1016/S0967-0645(00)00046-1
Granger J., Sigman D. M. (2009). Removal of nitrite with sulfamic acid for nitrate n and O isotope analysis with the denitrifier method. Rapid Commun. Mass Spectrom. 23 (23), 3753–3762. doi: 10.1002/rcm.4307
Gruber N., Galloway J. N. (2008). An earth-system perspective of the global nitrogen cycle. Nature 451, 293–296. doi: 10.1038/nature06592
Hall P. O., Brunnegård J., Hulthe G., Martin W. R., Stahl H., Tengberg A. (2007). Dissolved organic matter in abyssal sediments: Core recovery artifacts. Limnol. Oceanogr. 52 (1), 19–31. doi: 10.4319/lo.2007.52.1.0019
Hansen J. W., Thamdrup B., Jørgensen B. B. (2000). Anoxic incubation of sediment in gas-tight plastic bags: A method for biogeochemical process studies. Mar. Ecol.-Prog. Ser. 208, 273–282. doi: 10.3354/meps208273
Hensen C., Zabel M., Schulz H. D. (2000). A comparison of benthic nutrient fluxes from deep-sea sediments off Namibia and Argentina. Deep-Sea Res. Part II-Top. Stud. Oceanogr. 47 (9-11), 2029–2050. doi: 10.1016/S0967-0645(00)00015-1
Holmes R. M., Aminot A., Kérouel R., Hooker B. A., Peterson B. J. (1999). A simple and precise method for measuring ammonium in marine and freshwater ecosystems. Can. J. Fish. Aquat. Sci. 56 (10), 1801–1808. doi: 10.1139/f99-128
Howarth R. W., Marino R. (2006). Nitrogen as the limiting nutrient for eutrophication in coastal marine ecosystems: Evolving views over three decades. Limnol. Oceanogr 51 (1part2), 364–376. doi: 10.4319/lo.2006.51.1_part_2.0364
Hutchins D. A., Capone D. G. (2022). The marine nitrogen cycle: New developments and global change. Nat. Rev. Microbiol. 20, 401–414. doi: 10.1038/s41579-022-00687-z
Jaeschke A., Abbas B., Zabel M., Hopmans E. C., Schouten S., Sinninghe Damstéa J. S. (2010). Molecular evidence for anaerobic ammonium-oxidizing (anammox) bacteria in continental shelf and slope sediments off northwest Africa. Limnol. Oceanogr. 55 (1), 365–376. doi: 10.4319/lo.2010.55.1.0365
Jahnke R. A., Jahnke D. B. (2000). Rates of c, n, p and Si recycling and denitrification at the US mid-Atlantic continental slope depocenter. Deep-Sea Res. Part I-Oceanogr. Res. Pap. 47 (8), 1405–1428. doi: 10.1016/S0967-0637(99)00118-1
Jamieson A. J., Stewart H. A. (2021). Hadal zones of the northwest pacific ocean. Prog. Oceanogr. 190, 102477. doi: 10.1016/j.pocean.2020.102477
Kana T. M., Darkangelo C., Hunt M. D., Oldham J. B., Bennett G. E., Cornwell J. C. (1994). Membrane inlet mass spectrometer for rapid high-precision determination of N2, O2, and ar in environmental water samples. Anal. Chem. 66 (23), 4166–4170. doi: 10.1021/ac00095a009
King D., Nedwell D. B. (1984). Changes in the nitrate-reducing community of an anaerobic saltmarsh sediment in response to seasonal selection by temperature. Microbiology 130 (11), 2935–2941. doi: 10.1099/00221287-130-11-2935
Kraft B., Tegetmeyer H. E., Sharma R., Klotz M. G., Ferdelman T. G., Hettich R. L., et al. (2014). The environmental controls that govern the end product of bacterial nitrate respiration. Science 345 (6197), 676–679. doi: 10.1126/science.1254070
Kuypers M. M., Marchant H. K., Kartal B. (2018). The microbial nitrogen-cycling network. Nat. Rev. Microbiol. 16 (5), 263–276. doi: 10.1038/nrmicro.2018.9
Li Y., Gregory S. (1974). Diffusion of ions in sea water and in deep-sea sediments. Geochim. Cosmochim. Acta 38 (5), 703–714. doi: 10.1016/0016-7037(74)90145-8
Lin P., Chai F., Xue H., Xiu P. (2014). Modulation of decadal oscillation on surface chlorophyll in the kuroshio extension. J. Geophys. Res.-Oceans 119 (1), 187–199. doi: 10.1002/2013JC009359
Lotti T., Kleerebezem R., Lubello C., Van Loosdrecht M. C. M. (2014). Physiological and kinetic characterization of a suspended cell anammox culture. Water Res. 60, 1–14. doi: 10.1016/j.watres.2014.04.017
Lutz M. J., Caldeira K., Dunbar R. B., Behrenfeld M. J. (2007). Seasonal rhythms of net primary production and particulate organic carbon flux to depth describe the efficiency of biological pump in the global ocean. J. Geophys. Res.-Oceans 112, C10011. doi: 10.1029/2006JC003706
Middelburg J. J., Soetaert K., Herman P. M., Heip C. H. (1996). Denitrification in marine sediments: A model study. Glob. Biogeochem. Cycle 10 (4), 661–673. doi: 10.1029/96GB02562
Na T., Thamdrup B., Kim B., Kim S. H., Vandieken V., Kang D. J., et al. (2018). N2 production through denitrification and anammox across the continental margin (shelf–slope–rise) of the ulleung basin, East Sea. Limnol. Oceanogr. 63 (S1), S410–S424. doi: 10.1002/lno.10750
Nath B. N., Mudholkar A. V. (1989). Early diagenetic processes affecting nutrients in the pore waters of central Indian ocean cores. Mar. Geol. 86 (1), 57–66. doi: 10.1016/0025-3227(89)90018-2
Pinckney J., Papa R., Zingmark R. (1994). Comparison of high-performance liquid chromatographic, spectrophotometric, and fluorometric methods for determining chlorophyll a concentrations in estaurine sediments. J. Microbiol. Methods 19 (1), 59–66. doi: 10.1016/0167-7012(94)90026-4
Rahman M., Grace M. R., Roberts K. L., Kessler A. J., Cook P. L. (2019). Effect of temperature and drying-rewetting of sediments on the partitioning between denitrification and DNRA in constructed urban stormwater wetlands. Ecol. Eng. 140, 105586. doi: 10.1016/j.ecoleng.2019.105586
Rich J. J., Arevalo P., Chang B. X., Devol A. H., Ward B. B. (2020). Anaerobic ammonium oxidation (anammox) and denitrification in Peru margin sediments. J. Mar. Syst. 207, 103122. doi: 10.1016/j.jmarsys.2018.09.007
Rysgaard S., Glud R. N., Risgaard-Petersen N., Dalsgaard T. (2004). Denitrification and anammox activity in Arctic marine sediments. Limnol. Oceanogr. 49 (5), 1493–1502. doi: 10.4319/lo.2004.49.5.1493
Schnetger B., Lehners C. (2014). Determination of nitrate plus nitrite in small volume marine water samples using vanadium (III) chloride as a reduction agent. Mar. Chem. 160, 91–98. doi: 10.1016/j.marchem.2014.01.010
Soetaert K., Herman P. M., Middelburg J. J. (1996). A model of early diagenetic processes from the shelf to abyssal depths. Geochim. Cosmochim. Acta 60 (6), 1019–1040. doi: 10.1016/0016-7037(96)00013-0
Sokoll S., Holtappels M., Lam P., Collins G., Schlüter M., Lavik G., et al. (2012). Benthic nitrogen loss in the Arabian Sea off Pakistan. Front. Microbiol. 3. doi: 10.3389/fmicb.2012.00395
Song G. D., Liu S. M., Marchant H., Kuypers M. M., Lavik G. (2013). anammox, denitrification and dissimilatory nitrate reduction to ammonium in the East China Sea sediment. Biogeosciences 10 (11), 6851–6864. doi: 10.5194/bg-10-6851-2013
Sorensen J., Jorgensen K. S., Colley S., Hydes D. J., Thomson J., Wilson T. R. S. (1987). Depth localization of denitrification in a deep-sea sediment from the Madeira abyssal plain 1. Limnol. Oceanogr. 32 (3), 758–762. doi: 10.4319/lo.1987.32.3.0758
Strous M., Kuenen J. G., Jetten M. S. (1999). Key physiology of anaerobic ammonium oxidation. Appl. Environ. Microbiol. 65 (7), 3248–3250. doi: 10.1128/AEM.65.7.3248-3250.1999
Tan E., Zou W., Zheng Z., Yan X., Du M., Hsu T. C., et al. (2020). Warming stimulates sediment denitrification at the expense of anaerobic ammonium oxidation. Nat. Clim. Change 10 (4), 349–355. doi: 10.1038/s41558-020-0723-2
Thamdrup B., Dalsgaard T. (2000). The fate of ammonium in anoxic manganese oxide-rich marine sediment. Geochim. Cosmochim. Acta 64 (24), 4157–4164. doi: 10.1016/S0016-7037(00)00496-8
Thamdrup B., Dalsgaard T. (2002). Production of N2 through anaerobic ammonium oxidation coupled to nitrate reduction in marine sediments. Appl. Environ. Microbiol. 68 (3), 1312–1318. doi: 10.1128/AEM.68.3.1312-1318.2002
Thamdrup B. O., Dalsgaard T. (2008). “Nitrogen cycling in sediments,” in Microbial Ecology of the Oceans, ed. D. L. Kirchman (Hoboken, NJ: John Wiley & Sons, Inc.), 527–567. doi: 10.1002/9780470281840.ch14
Thamdrup B., Schauberger C., Larsen M., Trouche B., Maignien L., Arnaud-Haond S., et al. (2021). Anammox bacteria drive fixed nitrogen loss in hadal trench sediments. Proc. Natl. Acad. Sci. U. S. A. 118 (46), e2104529118. doi: 10.1073/pnas.2104529118
Tiedje J. M. (1988). Ecology of denitrification and dissimilatory nitrate reduction to ammonium,” in Environmental Microbiology of Anaerobes, ed. A. J. B. Zehnder, (New York, NY: John Wiley & Sons), 179–244. doi: 10.1016/b978-0-12-160280-2.50014-6
Trimmer M., Nicholls J. C. (2009). Production of nitrogen gas via anammox and denitrification in intact sediment cores along a continental shelf to slope transect in the north Atlantic. Limnol. Oceanogr. 54 (2), 577–589. doi: 10.4319/lo.2009.54.2.0577
Uchiyama Y., Suzue Y., Yamazaki H. (2017). Eddy-driven nutrient transport and associated upper-ocean primary production along the kuroshio. J. Geophys. Res.-Oceans 122 (6), 5046–5062. doi: 10.1002/2017JC012847
Van De Vossenberg J., Rattray J. E., Geerts W., Kartal B., Van Niftrik L., Van Donselaar E. G., et al. (2008). Enrichment and characterization of marine anammox bacteria associated with global nitrogen gas production. Environ. Microbiol. 10 (11), 3120–3129. doi: 10.1111/j.1462-2920.2008.01643.x
Wankel S. D., Buchwald C., Ziebis W., Wenk C. B., Lehmann M. F. (2015). Nitrogen cycling in the deep sedimentary biosphere: Nitrate isotopes in porewaters underlying the oligotrophic north Atlantic. Biogeosciences 12 (24), 7483–7502. doi: 10.5194/bg-12-7483-2015
Ward B. B. (2008). “Nitrification in marine systems,” in Nitrogen in the marine environment, 2nd Edition (San Diego: Academic Press, Elsevier), 199–261.
WebPlotDigitizer. (2022). WebPlotDigitizer (Version 4.5). Available at: https://automeris.io/WebPlotDigitizer (Accessed July 12, 2022).
Yin G., Hou L., Liu M., Liu Z., Gardner W. S. (2014). A novel membrane inlet mass spectrometer method to measure 15NH4+ for isotope-enrichment experiments in aquatic ecosystems. Environ. Sci. Technol. 48 (16), 9555–9562. doi: 10.1021/es501261s
Keywords: benthic nitrogen cycling, Kuroshio Extension region, abyssal plain, nitrification, denitrification, anammox, DNRA
Citation: Xu H, Song G, Yang S, Zhu R, Zhang G and Liu S (2022) Benthic nitrogen cycling in the deep ocean of the Kuroshio Extension region. Front. Mar. Sci. 9:997810. doi: 10.3389/fmars.2022.997810
Received: 19 July 2022; Accepted: 01 September 2022;
Published: 23 September 2022.
Edited by:
Jing Zhang, University of Toyama, JapanCopyright © 2022 Xu, Song, Yang, Zhu, Zhang and Liu. This is an open-access article distributed under the terms of the Creative Commons Attribution License (CC BY). The use, distribution or reproduction in other forums is permitted, provided the original author(s) and the copyright owner(s) are credited and that the original publication in this journal is cited, in accordance with accepted academic practice. No use, distribution or reproduction is permitted which does not comply with these terms.
*Correspondence: Guodong Song, Z3NvbmdAb3VjLmVkdS5jbg==