 Hongjun Guan
 Yu Wang
 Aiwu Zhao
- School of Management Science and Engineering School of Management Science and Engineering, Shandong University of Finance and Economics, Jinan, China
Under strict resource and environmental constraints, improving the overall green efficiency of the industrial chain is crucial to the sustainable development of the marine ship industry. Based on the data of 40 listed companies in the industry chain from 2015 to 2019, the meta-frontier framework and three-stage epsilon based measure (EBM) model are employed to study the green technical efficiency (GTE) in each link of the industry chain and the technical gap between each link. The impact of the external environment on GTE, the main reasons hindering the development of GTE, and the ways to improve GTE are also discussed for policy reference. The results show that: (1) under the meta-frontier, the GTEs of the whole industry chain and the composed links are all high and rising year by year. (2) There are obvious green technological development gaps among the links of the industry chain. The GTEs are ranked as the upstream>the downstream>the midstream. (3) The inefficiencies of green technology (GTEI) in the upstream and downstream of the industry chain come from endogenous hindrance, while the GTEI of the midstream is due to exogenous hindrance. (4) The external environment has a significant influence on the development of GTE in the industrial chain. Highly open and innovative external environment can effectively reduce the input redundancy. (5) After eliminating the external influencing factors and random interferences, the actual GTE of the industrial chain is only 0.4 or so, with more serious imbalance among the three links. Therefore, it is important for the marine ship industry chain to optimize the allocation of innovation resources and cultivate an open and shared innovation environment.
Introduction
China’s marine ship industry chain has a relatively large share in the marine economy. According to the Statistical Bulletin of China’s Marine Economy in 2020, the marine ship industry in the upstream and midstream of the industry chain accounted for 3.9% of the added value of the marine economy in 2020, and the downstream marine engineering and construction industry and marine transportation industry accounted for 4.05% and 19.3%, respectively. China’s marine ship industry chain has become an important part of the marine economy. With the implementation of a series of policies such as “Ocean Power” and “Blue Economy”, the development of marine economy has been widely concerned. Further promoting the high-quality development of marine ship industry chain is of great significance to promote the prosperity and strengthen the development force of marine economy.
However, while developing the marine ship industry chain, we need to pay attention to the fact that the pollution caused by ships as marine transportation to the environment cannot be underestimated. The oily sewage discharged by the ships during the sea voyage is poisonous to the marine biological resources; the exhaust gas produced by burning energy pollutes the atmosphere and so on. Moreover, because of the wide range of ships sailing at sea and the mobility of water bodies, the pollution caused by them is also characterized by mobility and boundlessness, and one pollution may affect several areas, which causes great difficulties to environmental management. Therefore, promoting the transformation and upgrading of marine ship industry chain to green industry chain is the top priority today when advocating the protection of marine environment and ensuring the sustainable use of marine resources.
The core impetus for the transformation and upgrading of marine ship industry chain to green industry chain comes from the technological innovation of the industry chain, especially the green technological innovation. Compared with traditional technological innovation, green technological innovation can simultaneously balance economic benefits and environmental protection (Yuan and Chen, 2019). Through green technology innovation, ships use cleaner energy or improve the conversion efficiency of energy in order to reduce the emission of pollutants and achieve the purpose of energy saving and emission reduction, and protect the marine environment.
China’s marine ship industry chain is also constantly pursuing green technology innovation, including optimization of ship type and recycling of ship materials. However, there are still obvious problems in the process of transformation and upgrading, such as the green innovation development of marine supporting equipment is relatively backward, the design concept of green ships is not advanced enough, and marine raw materials are not environmentally friendly enough (Zhang et al., 2016). In order to realize the transformation and upgrading of China’s marine ship industry chain, it is necessary to solve the drawbacks and obstacles existing in each link. However, there are relatively few studies on the green technology development of China’s marine ship industry chain, and the existing studies mainly focus on green ship manufacturing in the midstream of the industry chain (Zheng et al., 2020; Wang et al., 2022). Therefore, this paper starts from the perspective of the whole industry chain, take the green technology efficiency (GTE) of the industry chain as the landing point, conduct an in-depth study on the green development of China’s marine ship industry chain, analyze the level of green technology innovation in each link of the industry chain and the gap between them, and explore the influence of the external environment on the green technology innovation of the industry chain and the deep reasons that hinder the green technology development of the industry chain.
Literature review
Research on the green technology efficiency in industry chain
When scholars study green development, there are several research perspectives, the first one is to conduct research from the perspective of eco-efficiency, such as studying the eco-efficiency development level of the industrial chain in a certain region of China (Li et al., 2015; Tian, 2021). The second kind of research is conducted from the perspective of green innovation efficiency, including studying the green innovation efficiency of industrial enterprises (Zhang et al., 2022), studying the green innovation efficiency of a certain region (Dong et al., 2021), and studying the green innovation efficiency of a certain industry (Liu and An, 2022). There are few studies on the green technological efficiency of the marine ship industry chain in existing studies. Most of the studies related to the marine ship industry chain in the literature have been conducted on an individual link of the industry chain, for example, the development status of the ship-supporting industry in upstream of the marine ship industry chain (Zhang and Quan, 2016), measured the efficiency of the shipbuilding industry in the midstream of the industry chain (Liu et al., 2017; Li et al., 2017; Zhou and Guan, 2019), and analyzed the development history of the marine equipment manufacturing industry in the downstream of the industry chain (Tang et al., 2016).
By combing through the literature, we found that there are few studies on the GTE of the whole marine ship industry chain, and the literature on measuring the technological gap of each link of the industry chain is even more lacking. Therefore, this paper chooses to study the GTE development of the industry chain from the perspective of the whole industry chain to enrich the research content of the marine ship industry chain.
The existing methods for calculating the GTE of industrial chains consist of two main types, one is parametric and the other is non-parametric. The parametric statistical methods include stochastic frontier analysis (SFA), least squares regression estimation (OLS), etc. These methods are used by first setting the determined function parameters. The limitations of parametric methods are gradually exposed as efficiency research deepens because the specific functional form cannot correctly describe the relationship between multiple inputs and multiple outputs. In the face of this situation, the non-parametric method has been adopted by scholars for its feature of not requiring specific function parameters to be set. The representative non-parametric method is data envelopment analysis (DEA), which has been developed with various types of derivative models and can be adapted to various efficiency measurement scenarios. Fried et al. (2002) further proposed a three-stage DEA model combining DEA and SFA methods to make up for the shortcomings of the non-parametric method, which cannot eliminate environmental influences and statistical errors.
The traditional three-stage DEA model uses the CCR or BCC model to measure the efficiency in the first stage. In the second stage, the stochastic frontier analysis (SFA) method is used to eliminate environmental impact factors and random interference items. Then in the third stage, the CCR or BCC model is used again to calculate the adjusted efficiency value (Fried et al., 2002). One of the limitations of the traditional three-stage DEA model is that the CCR and BCC models are radial models, which are scaled down in the same proportion when adjusting inputs and outputs. Therefore, the non-radial model SBM was proposed (Tone, 2001), scholars combined SBM with three-stage DEA to construct a three-stage SBM. So that the inputs and outputs can be adjusted according to different proportions.
With the gradual development of the DEA model, the epsilon based measure (EBM) model containing both radial distance function and non-radial distance function was proposed (Tone and Tsutsui, 2010), which can better handle the adjustment of inputs and outputs. Therefore, this paper uses the EBM model to replace the CCR or BCC model in the three-stage DEA model, and constructs a three-stage EBM model to calculate the GTE of the industrial chain.
Application of the meta-frontier framework
Scholars have used a variety of DEA models to study the efficiency of industrial chains, including the three-stage DEA model (Luo and Lai, 2021), the network DEA model (Liu and Qu, 2015; Yang and Wang, 2018), the generalized DEA model (Li et al., 2020), and so on. These DEA models construct the production frontier by putting all decision-making units (DMUs) together. The efficiency level of the DMU is measured according to the distance of the DMU from the production frontier. However, there are limitations in measuring the efficiency of the industrial chain using only DEA-related models. This is because industrial chains are made up of multiple industrial sectors interlinked with each other. Different types of industries have distinct industrial characteristics because of different technological development environments, in other words, there is technological heterogeneity between industries. Therefore, when measuring the efficiency of industries in each link of the industrial chain, if we measure the efficiency of multiple industries based on the same production frontier and do not consider the influence of technical heterogeneity, it may lead to some bias in the results. Therefore, this paper introduces the meta-frontier framework into the study of efficiency of industrial chains to investigate the comparative differences of efficiency of industrial chains under the two cases of considering technical heterogeneity and not considering technical heterogeneity.
The meta-frontier framework (Battese and Rao, 2002; O’Donnell et al., 2008) enables the construction of group frontiers by grouping DMUs, which first constructs the same production frontier for all DMUs, called the meta-frontier, and then constructs the group frontier for each group of DMUs, called the group frontier. In addition, the two efficiency values of DMU reflect its actual production level under the group frontier and its potential production level under the meta-frontier, so by comparing the efficiency values of the DMUs in the two production frontiers, the gap between the actual and potential production levels can be known.
Scholars have combined the meta-frontier framework with DEA models and Malmquist index models to study the efficiency of various industries and regions. There are two main grouping methods involved, the first one is grouping DMUs by geographical location. For example, when studying the efficiency of technological innovation and green development in various regions of China, the 31 provinces of China are divided into three groups according to the geographical environment: eastern, central, and western, to study the overall efficiency development and the differences in efficiency between different groups (Wang et al., 2017; Sun et al., 2018; Zhang and Xue, 2021; Han and Zhou, 2022). The second one is to divide different industries into groups according to the industry’s nature. For example, when conducting research from the micro level, different enterprises are divided into domestic enterprises, sino-foreign joint ventures, and foreign-funded enterprises according to their nature (Xiao et al., 2015; Chen and Yao, 2021). The third one is to combine multiple division methods, such as combining industry type with geographic location (Li et al., 2010), or industry size with geographic location (Liu et al., 2020), to achieve a more detailed group division of DMUs and to study the efficiency differences among different groups more comprehensively.
Through combing the literature, we found that the meta-frontier framework is relatively little applied in the study of industry chain efficiency, therefore, this method is cited in this paper to measure the GTE of the marine ship industry chain. Considering the technological heterogeneity between the enterprises in the upstream, midstream, and downstream of the industry chain, we divide groups according to the different links of the chain and study the GTE levels of each link of the chain and the differences between the two efficiencies under the meta-frontier and the group frontier, respectively.
Research methods and data
Three-stage EBM model
Stage 1: Using the EBM model to measure the GTE of the upstream, midstream, and downstream of the industrial chain. Since this paper measures the GTE of the industrial chain based on enterprise data and analyzes the minimization of input at the current output level, the input-oriented super-EBM model is adopted. The model structure is as follows:
We assume that there are a total of n DMUs, and each DMU has m inputs and s outputs. ρ is the green technical efficiency value of the k th DMU, xik is the input of the i th item of the k th DMU, yrk is the output of the r th item of the k th DMU. θ is the planning parameter of the radial model. ϵx determines whether the model is biased toward the radial model or the non-radial model parameter, it takes a value in the [0,1] interval. When its value is 0, the model can be considered a radial model, and when its value is 1, the model can be considered a non-radial model. In this paper, we use the research results of Tone and Tsutsui (2010) to calculate ϵx . λj is the linear combination coefficient of the DMU, is the relaxation variable of the i th input index. refers to the weight of the i th input index, .
Stage 2: According to Fried et al. (2002), the SFA regression model is constructed to estimate the effect of environmental influences on each input slack variable, using input slack variables as explanatory variables and external environmental influences as explanatory variables. It is assumed that there are p environmental influence factors Zj=[Z1j,…,Zpj] , then the regression equation is constructed as follows.
Where Sij denotes the i th input slack variable of DMU j . βi=[β1i,…,βpi] is the vector of regression parameters of the environmental influences on the input slack variables. The vij is the random error term, . uij is the management inefficiency term, and ; vij and uij are mutually independent. , and γi is the share of the management inefficiency term in the total variance, and γi larger indicates that the management inefficiency term is responsible for a higher proportion of the inefficiency in the DMU.
Complete the above regression analysis to obtain the estimated values of βi , and the step of adjusting the input slack variables is started. First, calculate the estimated values and of the random error term vij and the management inefficiency term uij , drawing here from Luo and Lai (2021).
XA,ij is the i th adjusted input of DMU j , the Xij is the i th pre-adjusted input of DMU j ., and . φ and Φ represent the probability density function and distribution function of the standard normal distribution, respectively.
Stage 3: The EBM model is applied again to calculate the GTE of industry chain after adjustment, and the data utilized are the adjusted input indicators and the original output indicators. In this way, the GTE of the marine ship industry chain is obtained excluding environmental influences and random disturbances.
Meta-frontier framework
The types of industries in the upstream, midstream, and downstream of the marine ship industry chain are different, and there is obvious industry heterogeneity. If all the DMUs in upstream, midstream, and downstream are placed on the same production frontier when measuring GTE, it will lead to some deviations in the calculation results and cannot reflect the true level of GTE of each link of the industry chain. Therefore, this paper introduces the meta-frontier framework based on the three-stage EBM model (Battese and Rao, 2002; O’Donnell et al., 2008), divides the industries into three groups, calculates the group-frontier green technical efficiency values (GGTE) and meta-frontier green technical efficiency (MGTE) values of each link of the industrial chain, and explores the gap between the actual green production level and potential green production level.
Step 1: Construct a meta-frontier for all DMUs in the ungrouped case. Suppose that the input and output of the DMUs are (x,y) , which is composed of m -dimensional vector x and s -dimensional vectors y . Suppose that the technological set of all DMUs is Tm , Tm={(x,y): x≥0, y≥0;x→y} .
The corresponding input-output set of all DMUs is Pm , and for a given input variable x , define Pm(x)={y: (x,y)∈Tm} , then the upper bound of Pm is meta-frontier. We use an input-oriented model, and the DMU is committed to input minimization under the meta-frontier, therefore, the input-oriented meta-distance function is set as:
Then the green technical efficiency of the DMUs under the meta-frontier isMGTEm(x,y) =[Dm(x,y)]−1 , and 0≤MGTEm≤1 .
Step 2: Construct the group frontier. According to the location of the DMUs in the industry chain, DMUs are divided into three groups: upstream, midstream and downstream.
The group technologies set constituted by the DMUs in each group is Tk , Tk={(x,y): x≥0, y≥0;x→y in group}, k=1, 2, 3 . The corresponding input-output set is Pk(x) ={y: (x,y)∈Tk}, k=1, 2, 3 . The upper bound of the input-output set of each group is the group frontier. Then the input-oriented group-distance function under the group frontier can be set as:
Similarly, the green technical efficiency of the DMUs under the group-frontier GGTEk(x,y) exists in the relationship of 0≤GGTEk(x,y) =[Dk(x,y)]−1≤1 .
Step 3: Calculate the difference between the MGTE and the GGTE. Since the meta-frontier curve is the data envelope curve of all group-frontier curves (as shown in Figure 1), there is a relationship between the common technology set and the group technology set as follows: . And for all DMUs, there is Dm(x,y)≥Dk(x,y) , so there is MGTEm(x,y) ≤GGTEk(x,y) The difference between the GGTE and the MGTE of the same DMU is called the technical gap radio, denoted by TGRk.
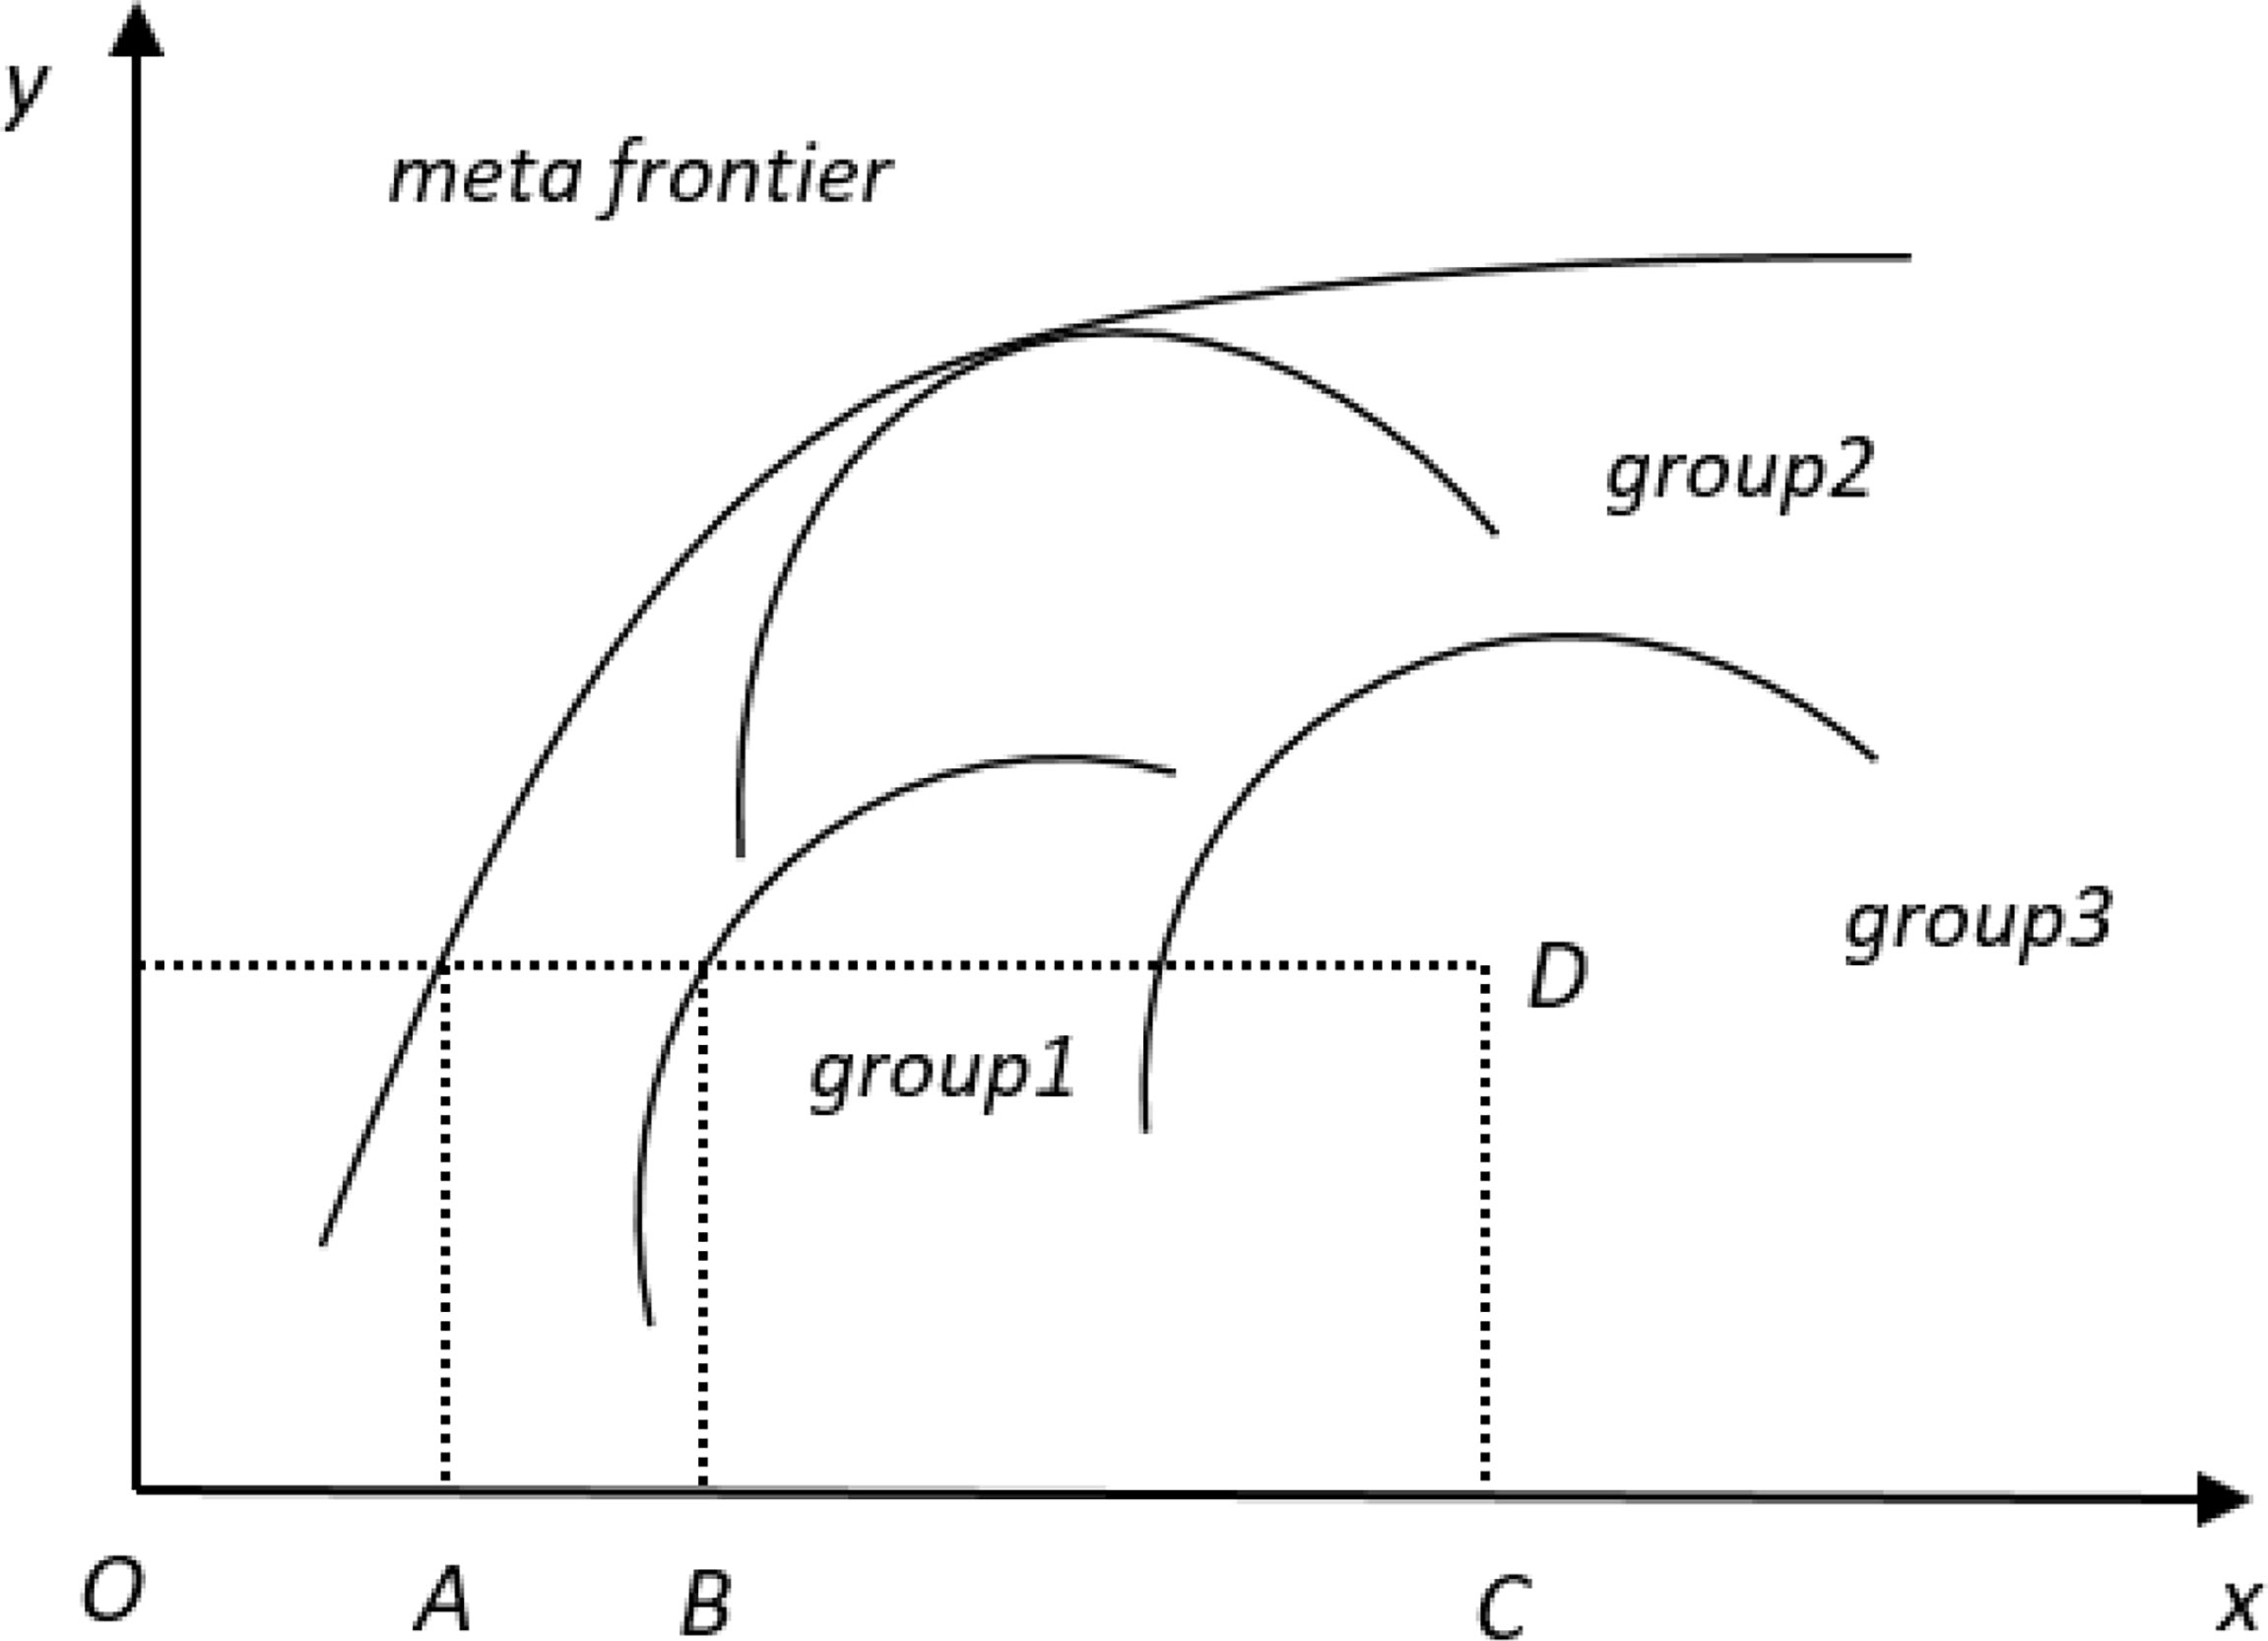
Figure 1 Meta-frontier curve and group-frontier curves.
TGRk∈[0, 1] , the larger its value, the closer the GGTE of the DMU is to the MGTE, indicating that the gap between the actual and potential production levels of the DMU is smaller (Xiao et al., 2015).
At the same time, the TGR can also be represented according to the line segments in Figure 1, taking the DMU D of the group1 as an example, its meta-frontier efficiency MGTEm=OA/OC , its group-frontier efficiency GGTEk=OB/OC , so its TGRk(x,y) == OA/OB . By this expression, we can also see that TGR can reflect whether it is reasonable to divide all DMUs into different groups, the smaller the TGR value, the more necessary (Li and Ma, 2014).
We draw on the practices of Chiu et al. (2012) and Xiao et al. (2015), the GTE is further decomposed to clarify the main causes of efficiency deficit in each link of the industry chain. According to the available studies, the GTE deficit is mainly caused by two aspects, the first one is caused by the technological gap existing between the group frontier and the meta-frontier, and this efficiency deficit is referred to as an exogenous hindrance. Improving this efficiency deficit requires improving the environment in which the group is located. The second cause of the efficiency deficit is the low level of management decisions of the enterprises within the group, which is considered as an endogenous impediment and can be improved by enhancing their own management level. In this paper, we use GTEI to denote the green technical inefficiency of each link of the industry chain, TGRI denote the efficiency deficit caused by exogenous impediment, and MI denote the efficiency deficiency caused by endogenous hindrance. Then the relationship between them is as follows.
Data sources and indicator selection
This paper combines the structure of the marine ship industry chain in previous studies (Tan and Yan, 2011; Su et al., 2016) and divides the marine ship industry chain into upstream, midstream, and downstream. Upstream includes raw material producers such as steel, non-ferrous metals, and composite materials needed for ship manufacturing, as well as marine auxiliary equipment producers and ship design enterprises. Midstream is mainly ship-manufacturing enterprises. Downstream includes shipping enterprises, marine engineering construction enterprises, marine engineering equipment manufacturing enterprises and national defense and military service enterprises. Considering the completeness of the data, this paper finally collected a total of 40 listed enterprises in the upstream, midstream and downstream of the marine ship industry chain. Among them, 28 are upstream enterprises, 4 are midstream enterprises and 8 are downstream enterprises. These enterprise annual report data from 2015-2019 are used as analysis materials. The enterprise annual report data are obtained from the database of CSMAR and CNRDS, and the environmental impact factors data are obtained from the website of the National Bureau of Statistics.
In this paper, input indicators and output indicators are selected from the aspects of the enterprise’s operation capacity and green innovation capability. The operating capability of an enterprise is reflected by its daily production and operation, so the main business cost, management cost and the number of employees are selected as input indicators; the output indicators are the main business revenue and total profit of an enterprise. The green innovation capability of the enterprise is expressed by the technological innovation ability of the enterprise, so the R&D capital investment and the number of R&D personnel are selected as input indicators; the output indicators are the number of green patent applications and the number of patent applications. The descriptive statistics of the input and output indicators are shown in Table 1.
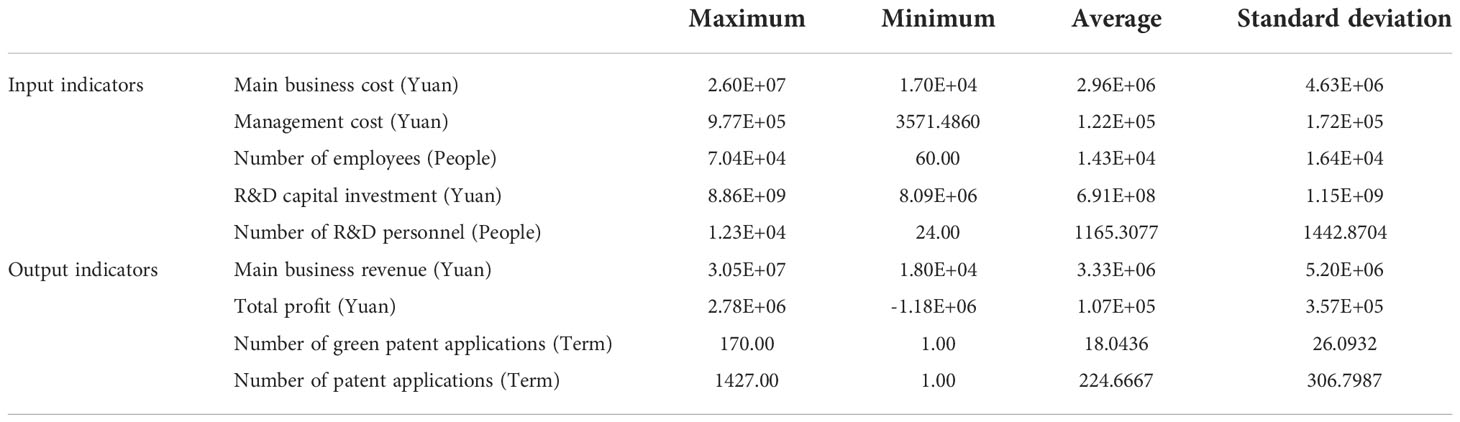
Table 1 Descriptive statistics of input and output indicators.
In this paper, the environmental influencing factors affecting the development of GTE of China’s marine ship industry chain are selected from three aspects: economic environment, policy environment and innovation environment, respectively. The economic environment includes regional GDP level, regional export dependency (Total regional foreign exports/Total regional foreign imports and exports×100%), and regional industrial structure (Value added of secondary industry/Regional GDP×100%). The policy environment includes the percentage of financial science and technology expenditure (Financial science and technology expenditure/Total financial expenditure×100%). The innovation environment includes regional technology market turnover and the number of patents per 10,000 people. The descriptive statistics of environmental influencing factors are shown in Table 2.
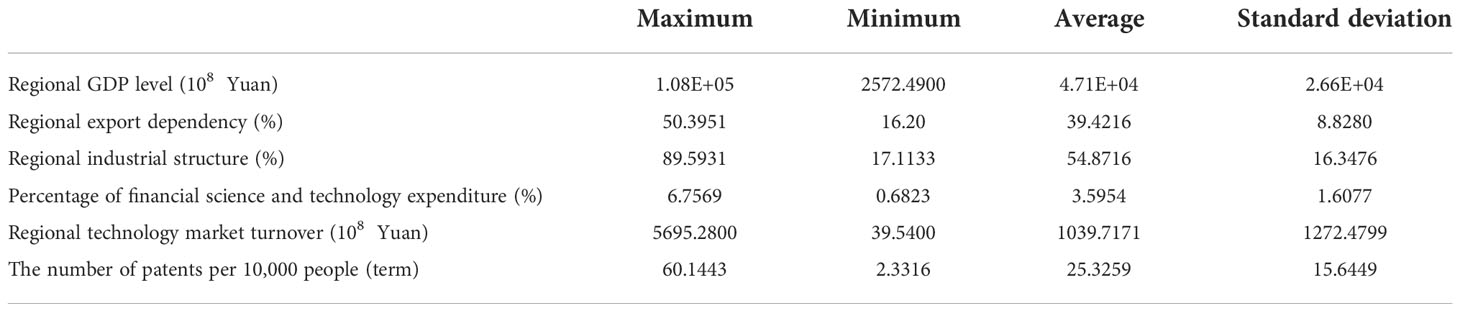
Table 2 Descriptive statistics of environmental influencing factors.
Empirical Analysis
GTE of the industry chain before adjustment
Figure 2 shows the development trend of GTE of the industry chain average and each link under the meta-frontier, and it can be found that the GTE values are distributed within the interval of [0.75,0.95] during the period of 2015-2019, which is at a relatively high efficiency level and shows a continuous upward development trend. The distribution of the curves of each link in the industry chain varies widely, while the GTE curve of upstream is distributed above the average GTE curve of the industry chain, with an efficiency level of about 0.9, ahead of the GTE curves of midstream and downstream. The reasons for this are, this paper thinks, firstly, related to the sample data selected in this paper, and secondly, because the upstream enterprises of the industry chain cover raw material production enterprises such as steel production and non-ferrous metal smelting, which are heavy industrial enterprises and are subject to strong policy constraints on environmental protection and bear heavy green tasks, so they invest more financial and material resources in green innovation and development, so the GTE of the upstream is higher than other links. The GTE curve of the midstream has been distributed below all curves, and the GTE value is far lower than the average GTE value of the industry chain, only at the medium-high efficiency level, far behind the upstream and downstream. The midstream shipbuilding enterprises have a long way to go to complete the green technical upgrading.
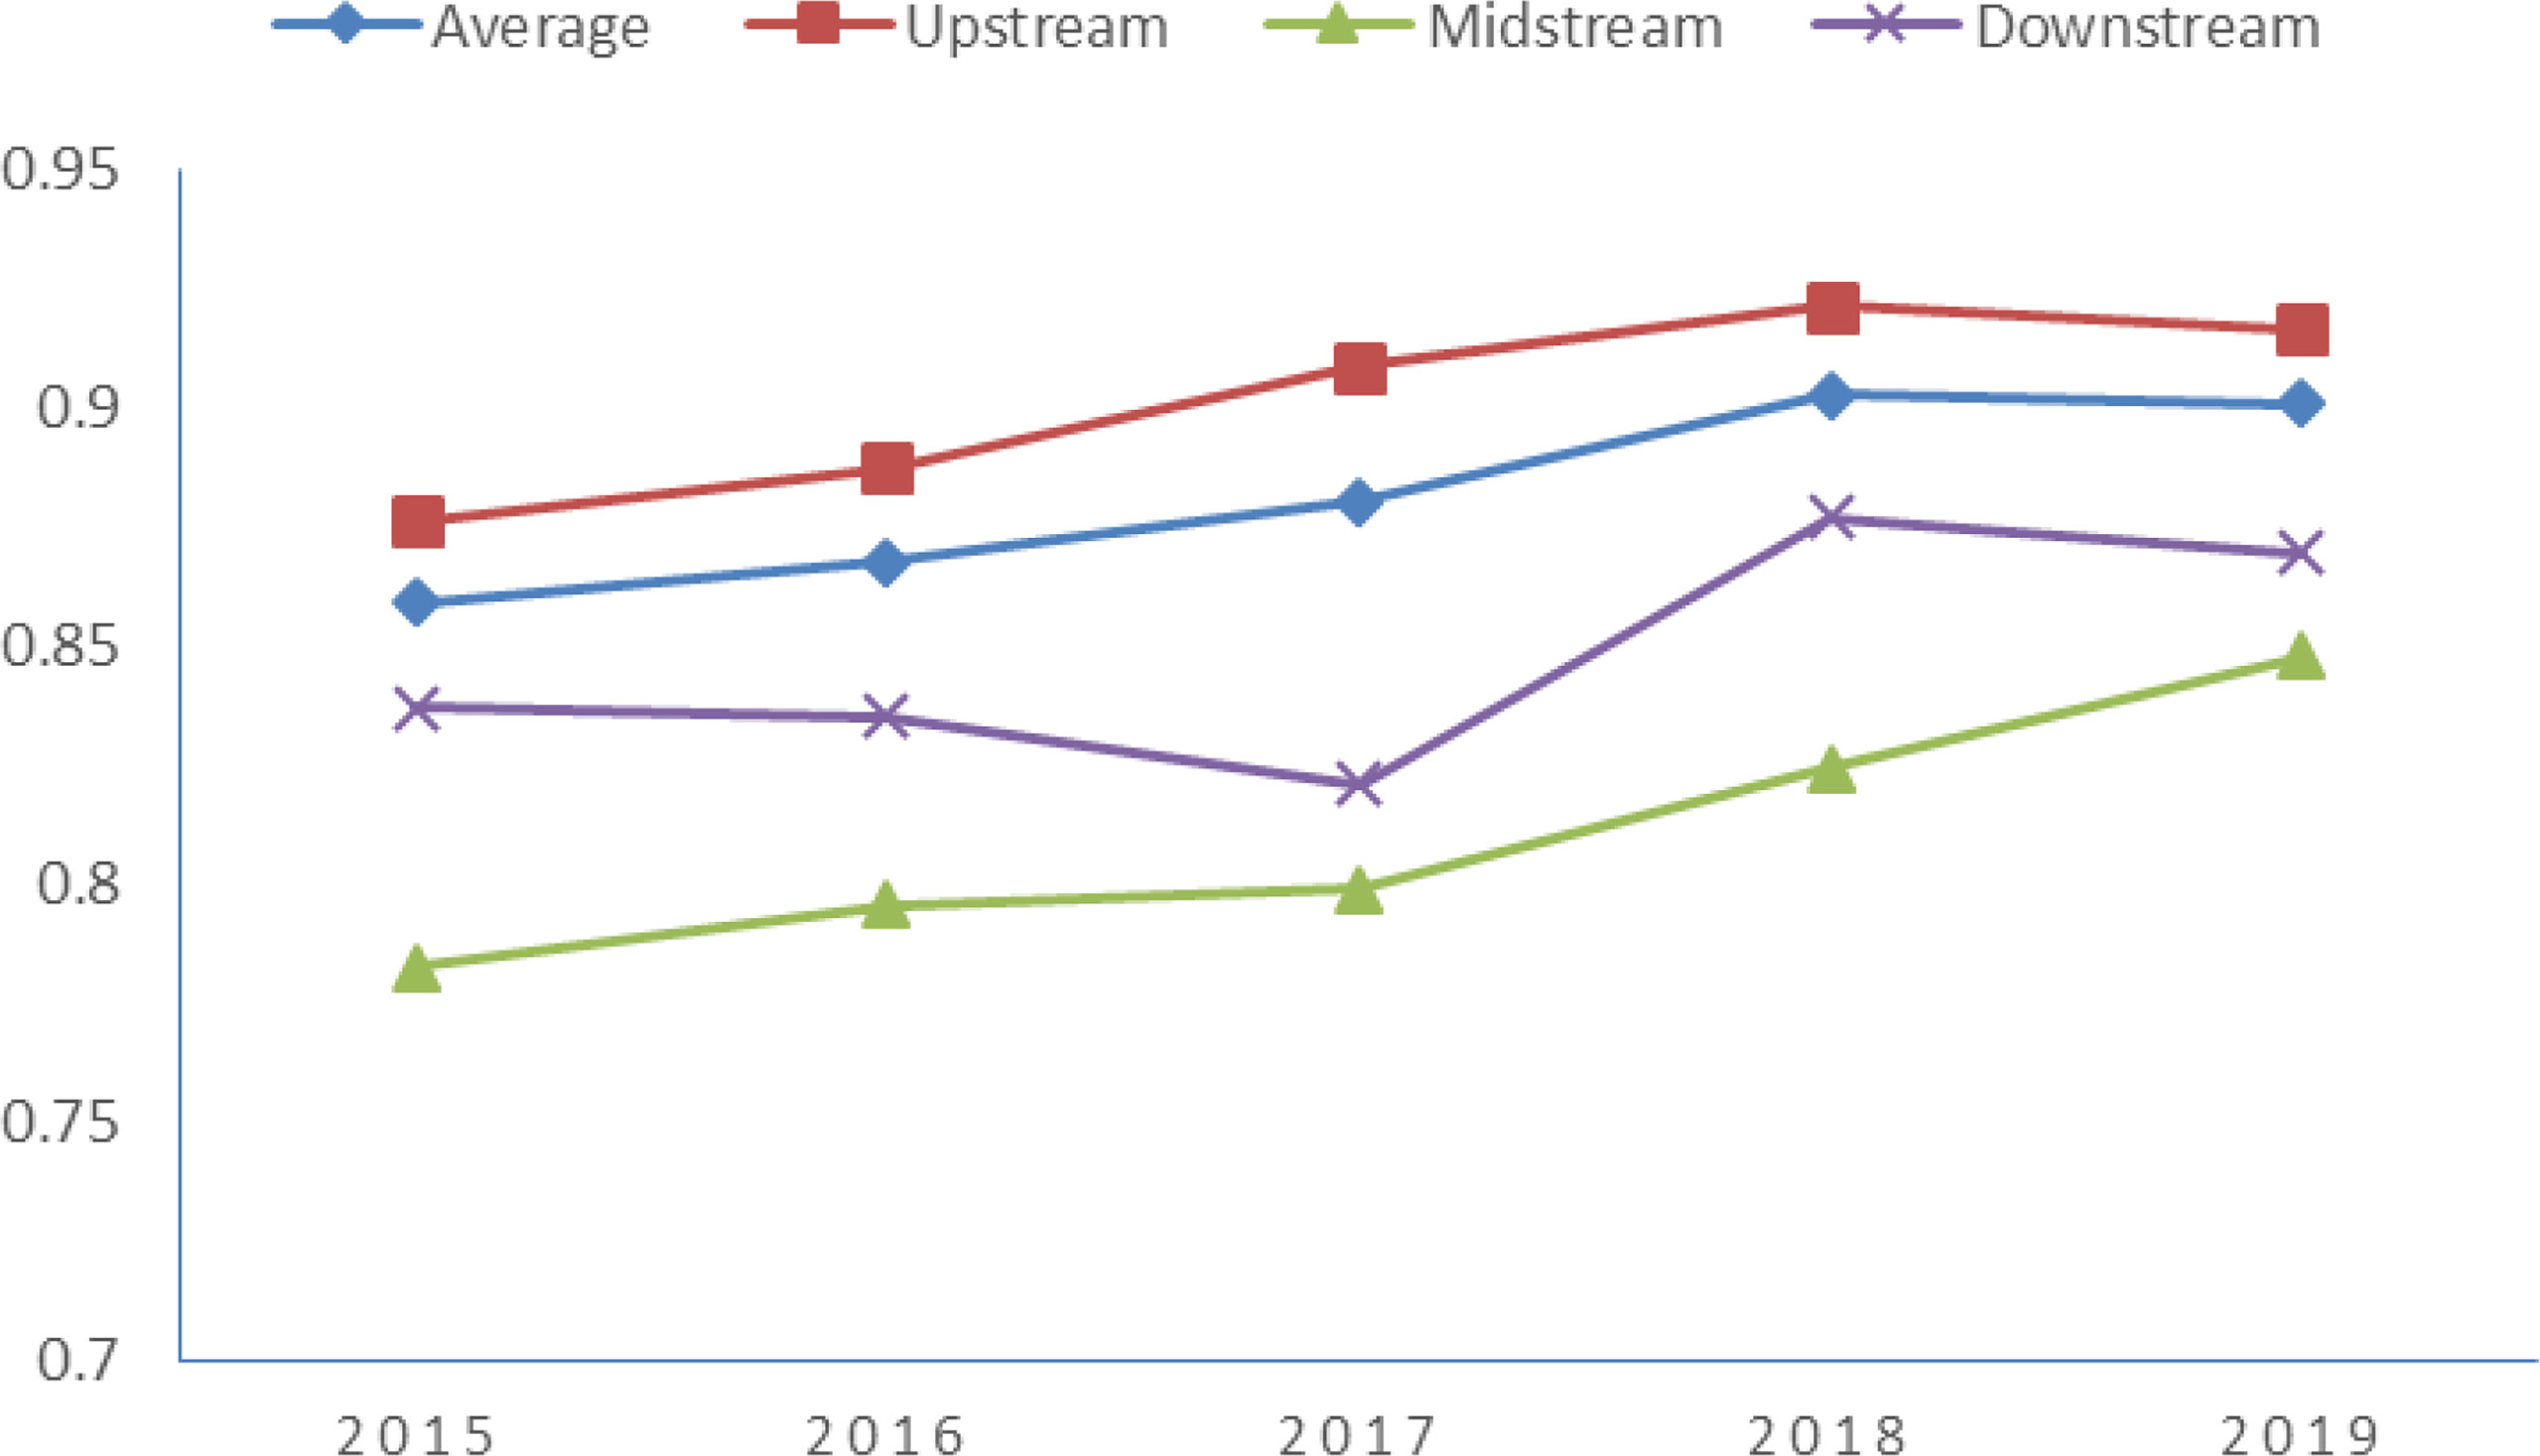
Figure 2 GTE values for the average and each link of the industry chain under the meta-frontier, 2015-2019.
Under the meta-frontier, the level of green technology in the upstream represents the frontier level of green development in the whole industry chain, and the level of green technology in the midstream and downstream lags behind the upstream. However, there is obvious technological heterogeneity among industries in different links, and it is necessary to group each link of the industry chain and measure the GTE based on the group frontier. Table 3 shows the MGTE and GGTE of the upstream, midstream and downstream of China’s marine ship industry chain from 2015 to 2019. It can be found that the MGTE value of upstream is very close to its GGTE value, and the GGTE is ahead of the MGTE by a small margin. The GGTE value of the midstream is much higher than its MGTE value, and the efficiency values are above 0.9, which has reached a relatively high level of green technical efficiency. According to the average value of midstream MGTE from 2015-2019, there is still about 0.19 room for improvement in the midstream, but according to the average value of midstream GGTE, the room for improvement in the midstream is only about 0.05. Similarly, the GGTE of the downstream of the industry chain is higher than its MGTE. This confirms that the technological heterogeneity between industries in each link of the chain is strong, and the GTE of the midstream and downstream measured under the meta-frontier is underestimated.
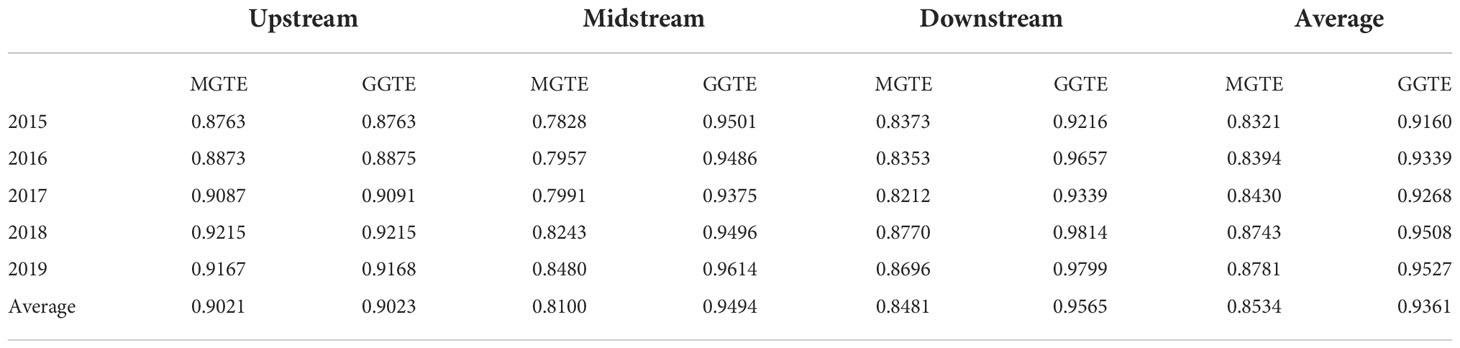
Table 3 MGTE and GGTE values of each link of the industrial chain in 2015-2019.
The gap between the MGTE of each link of the industry chain and the GGTE is further discussed by using the TGR, which reflects the gap between the actual green technical level and the potential green technical level, as shown in Figure 3. It can be seen that the overall TGR of the three links are relatively high, all above 0.8, which means the gap between the actual green technology level and the potential green technology level of each link is not very large. Specifically, the TGR of upstream is always 1, which is absolutely ahead of midstream and downstream. It indicates that the gap between the actual green development level and the potential green development level of the upstream is very small, and its technology level and management level are in the absolute leading position in the industry chain. The TGR of midstream and TGR of downstream are close and there is no significant increase trend between 2015 and 2019.
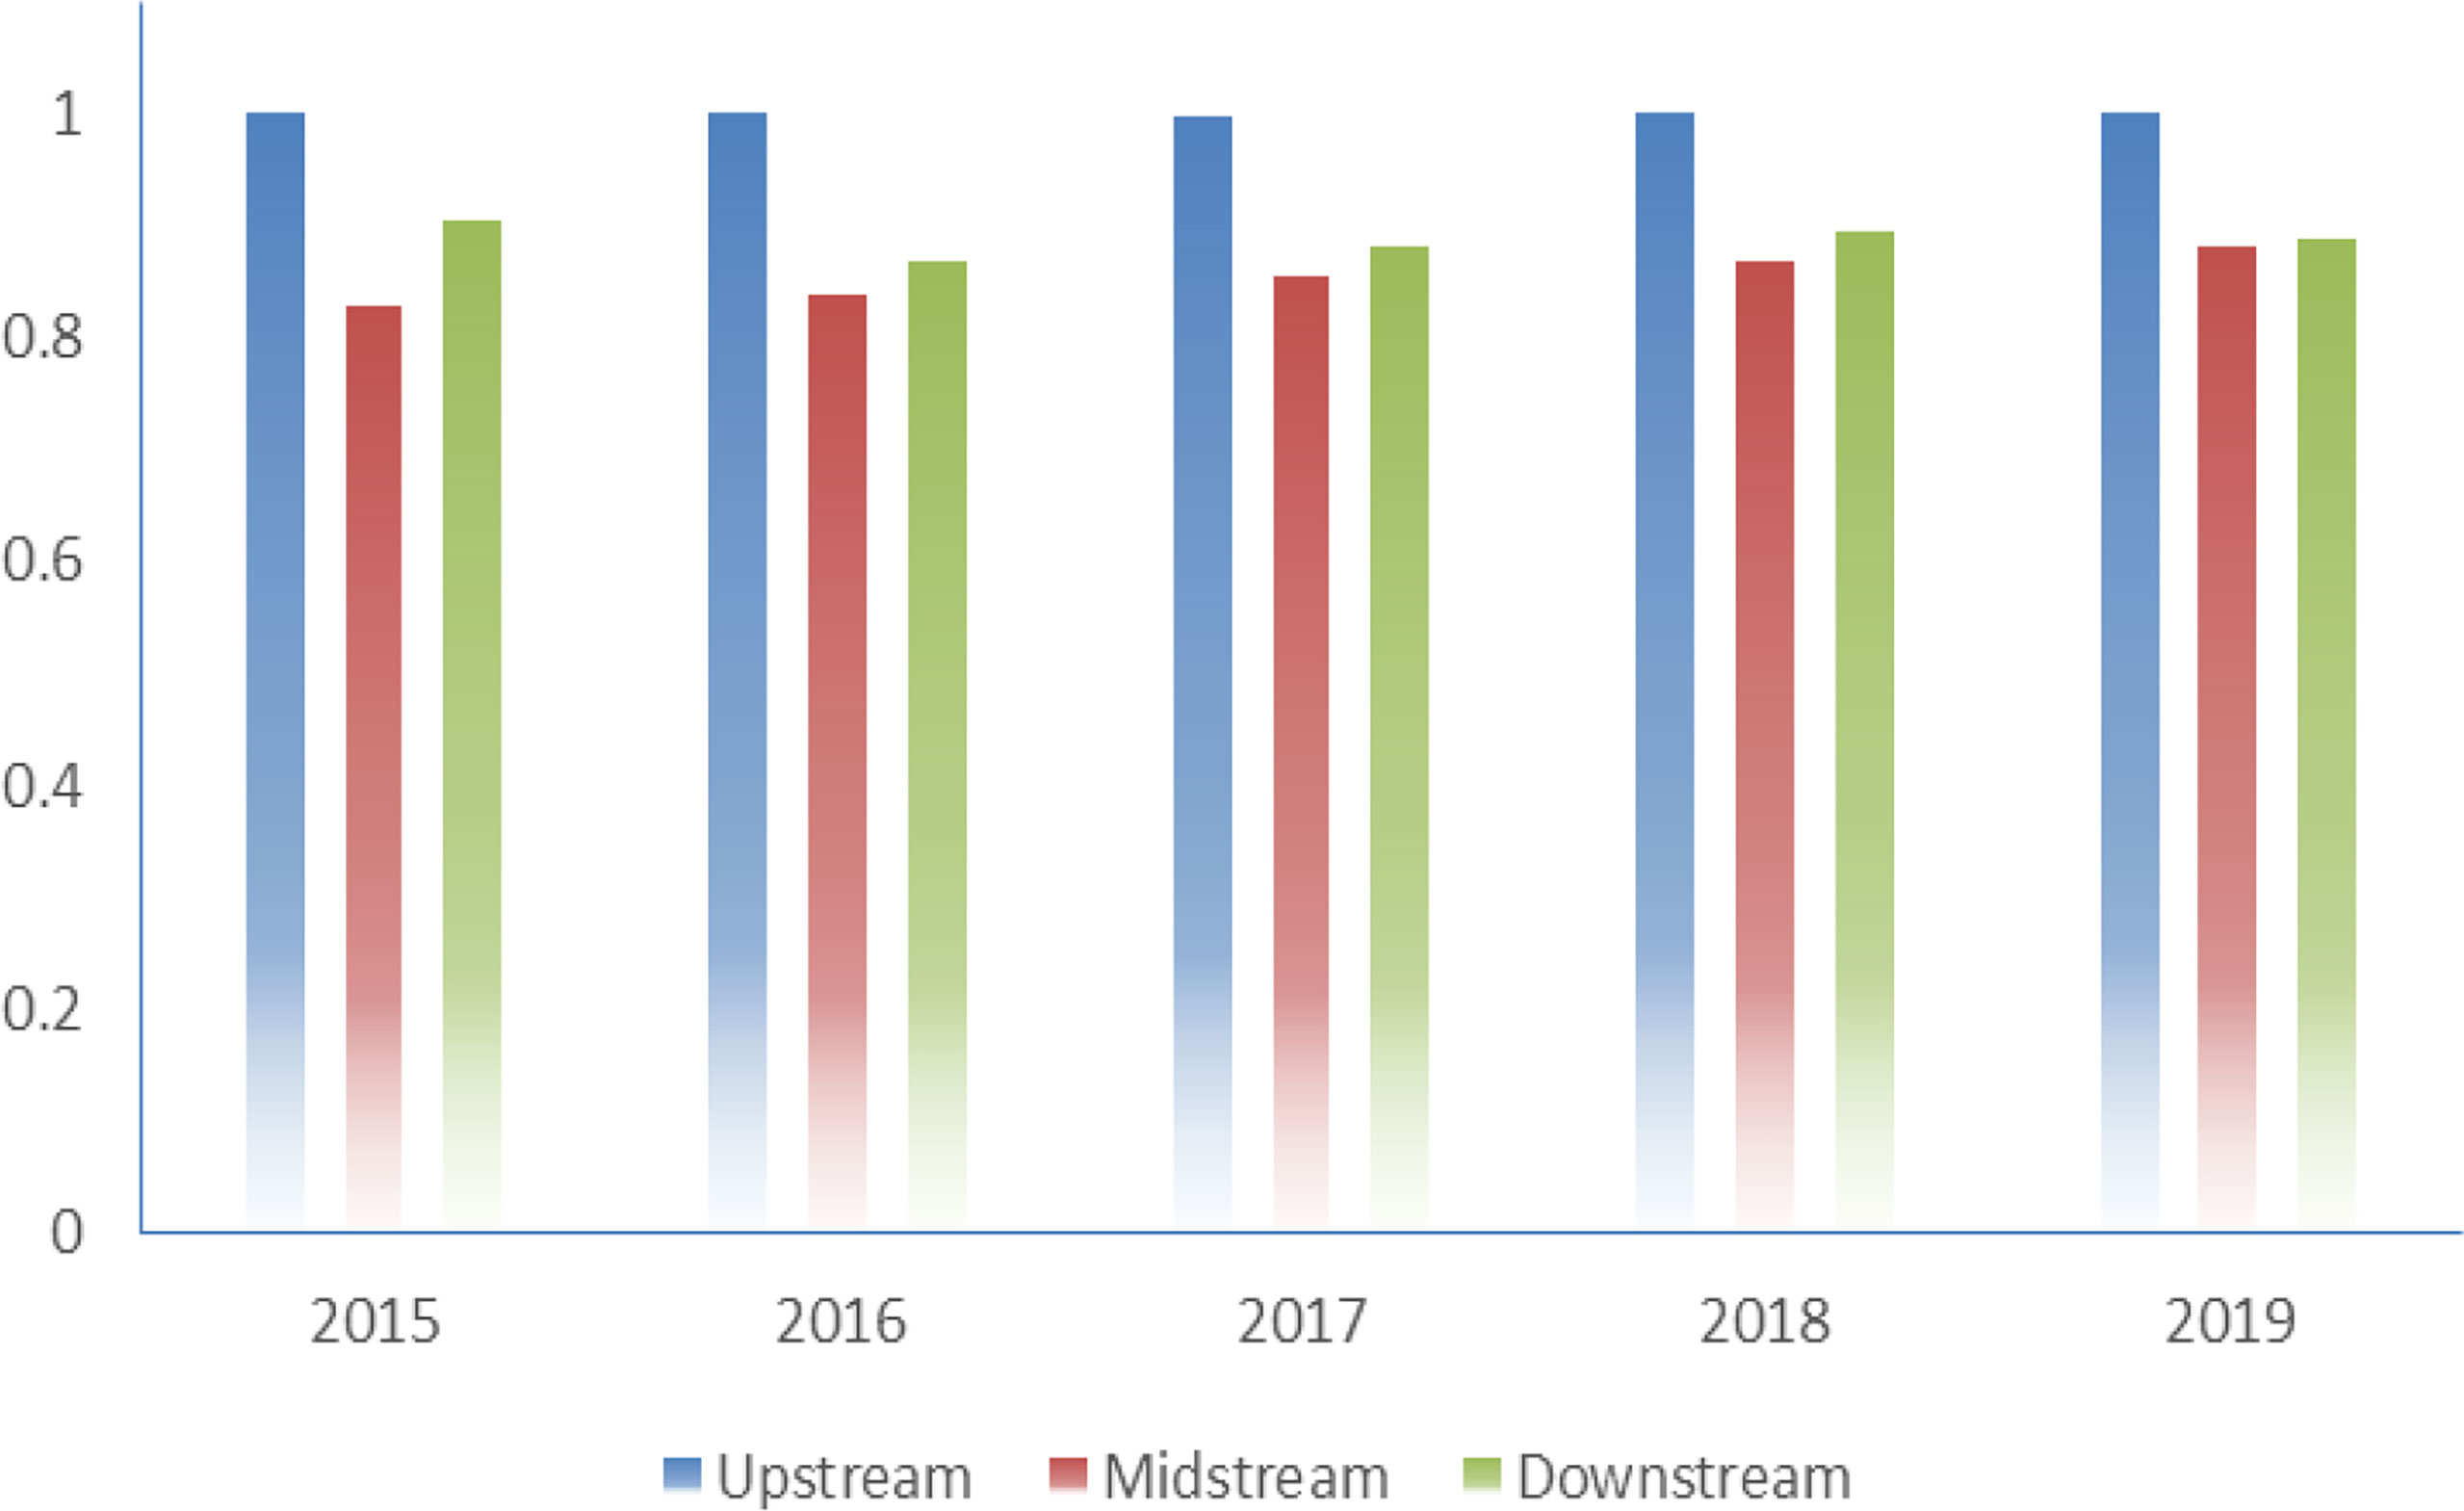
Figure 3 TGR for each link of the industry chain, 2015-2019.
Using the two-by-two subtraction of each link to further measure the green technology gap between each link, as shown in Figure 4, the technology gap between upstream and midstream is the largest, but from the development trend, the green technology gap between upstream and midstream is decreasing year by year. Although green technology gap between the upstream and downstream of the industry chain is relatively large and volatile, there is no obvious downward trend. The green technology gap between the three links reflects that the gap between the midstream and other links is the largest, and it is the part of the industry chain with the lowest level of green technology. This paper thinks that it is more difficult for midstream ship manufacturing enterprises to carry out green technology innovation than upstream and downstream enterprises. Firstly, because the R&D of new materials and new energy used in ship manufacturing is long and difficult, and it is hard to obtain innovation results in a short period of time. Secondly, the global ship market is highly competitive, and the major ship manufacturing countries hold the core technology of green ship and new ship research and development in their respective hands. China needs to rely on its own strength to figure out the innovation, which further increases the difficulty of green technology innovation. For all that, the green technology development gap between each link of the industry chain must be paid attention to because the industry chain, as an orderly system, needs the upstream, midstream and downstream to make progress together in green technology development in order to realize the overall transformation and upgrading. The technology gap between midstream and other links is too large, which will inevitably hinder the development of China’s marine ship industry chain.
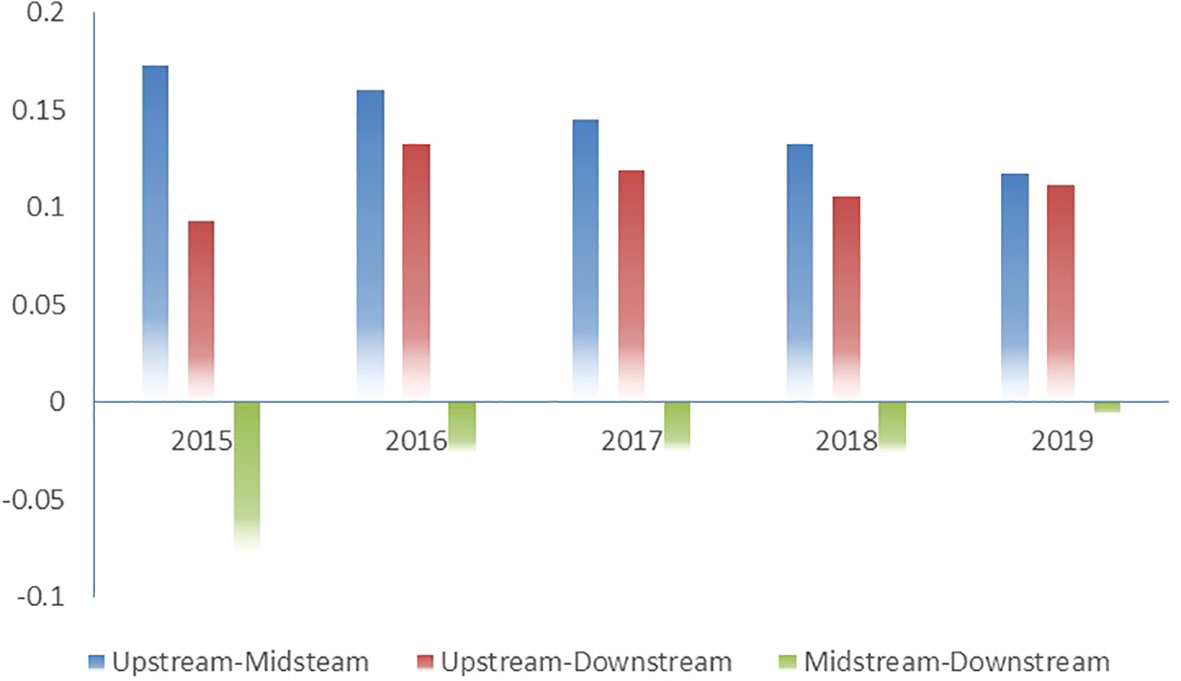
Figure 4 Technology gap between industry chain links, 2015-2019.
To explore the causes of GTEI in each link of the industry chain, this paper further decomposes the GTEI into TRGI and MI, and the decomposition results are shown in Table 4. The overall observation reveals that the degree of GTEI in the upstream, midstream and downstream of the industry chain is low, among which the mean value of GTEI in the upstream is 0.0979, and the main cause is MI, which accounts for 99.83%. This indicates that the GTEI in the upstream is overwhelmingly due to the low level of enterprise management decisions and unreasonable resource allocation. Therefore, for upstream enterprises, improving the management level and optimizing resource allocation are the key tasks to improve the GTE deficiency. The GTEI in the midstream and downstream contributes more to the TGRI, accounting for more than 70%, which indicates that the GTEI in the two segments is mainly due to the poor external technical environment, but this exogenous hindrance is difficult to improve in a short period of time. Therefore, for the midstream and downstream, strengthening technological innovation and breaking technical barriers are the keys to promoting GTE.
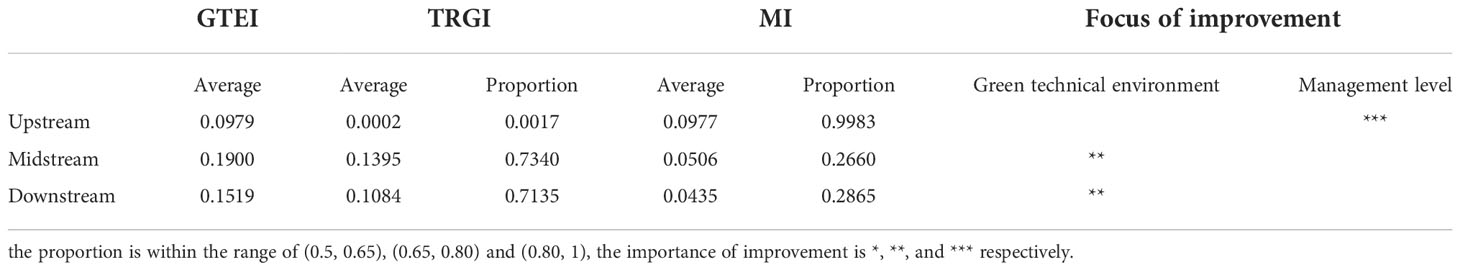
Table 4 Decomposition of GTEI values for each link of the industry chain.
Figure 5 further shows the development trend of TRGI and MI of each link of the industry chain. Overall, the TRGI and MI of the three links decreased to different degrees during 2015-2019. The external technical environment and their own management level of each link of the industry chain have improved. However, the TRGI curves of upstream TRGI, midstream TRGI and downstream are the most scattered in the graph, which again indicates that the uncoordinated green technology level among the three links is the main reason that hinders the overall GTE of the industry chain. The second thing that needs to be focused on is that the problem of low management level and resource mismatch is more serious in upstream enterprises than in other links. Therefore, new management organization methods need to be introduced to stimulate upstream enterprises to reform the drawbacks in the existing management system.
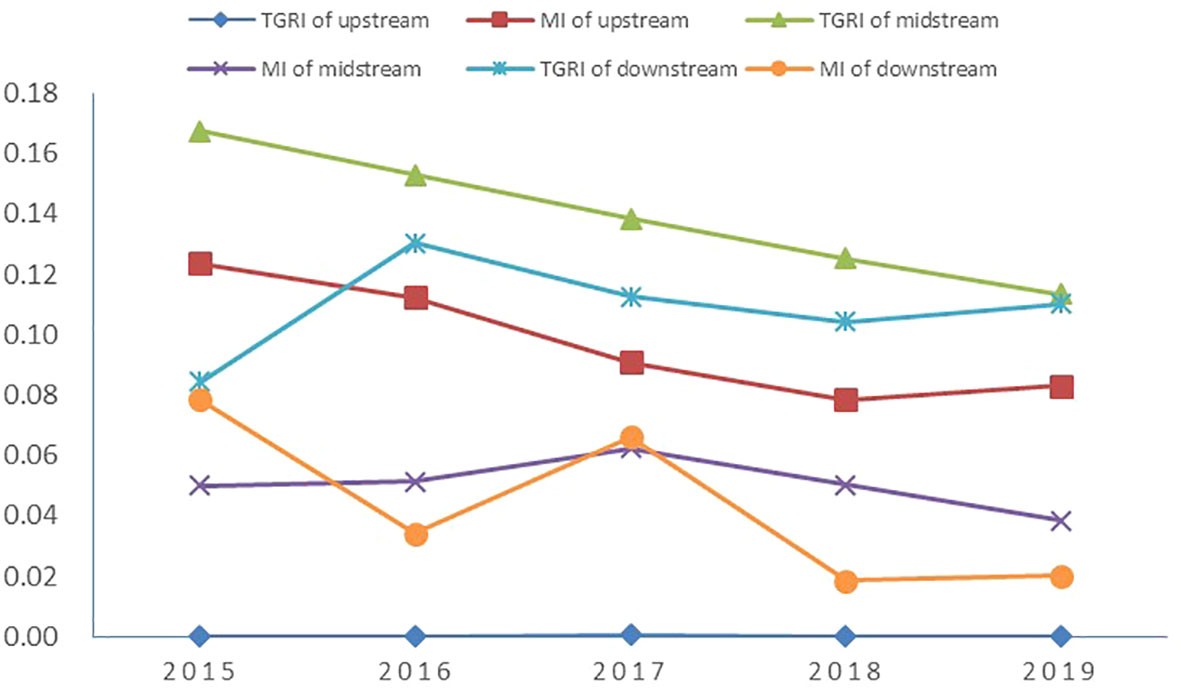
Figure 5 Development trends of TGRI and MI in each link of the industrial chain.
Adjustment phase
The GTE values of the industry chain before adjustment contain the influence of external environmental factors and random disturbance terms, and there may be measurement errors, so the input slack variables are adjusted using SFA to remove the influence of external environment and random disturbance terms, and the results are shown in Table 5. It can be observed that most of the regression coefficients of environmental influences on input slack variables in the table pass the significance test, indicating that there is a significant influence of external environment on input redundancy; the likelihood ratio LR values of the model are all significant at the 1% level, indicating that the model setting is more reasonable.
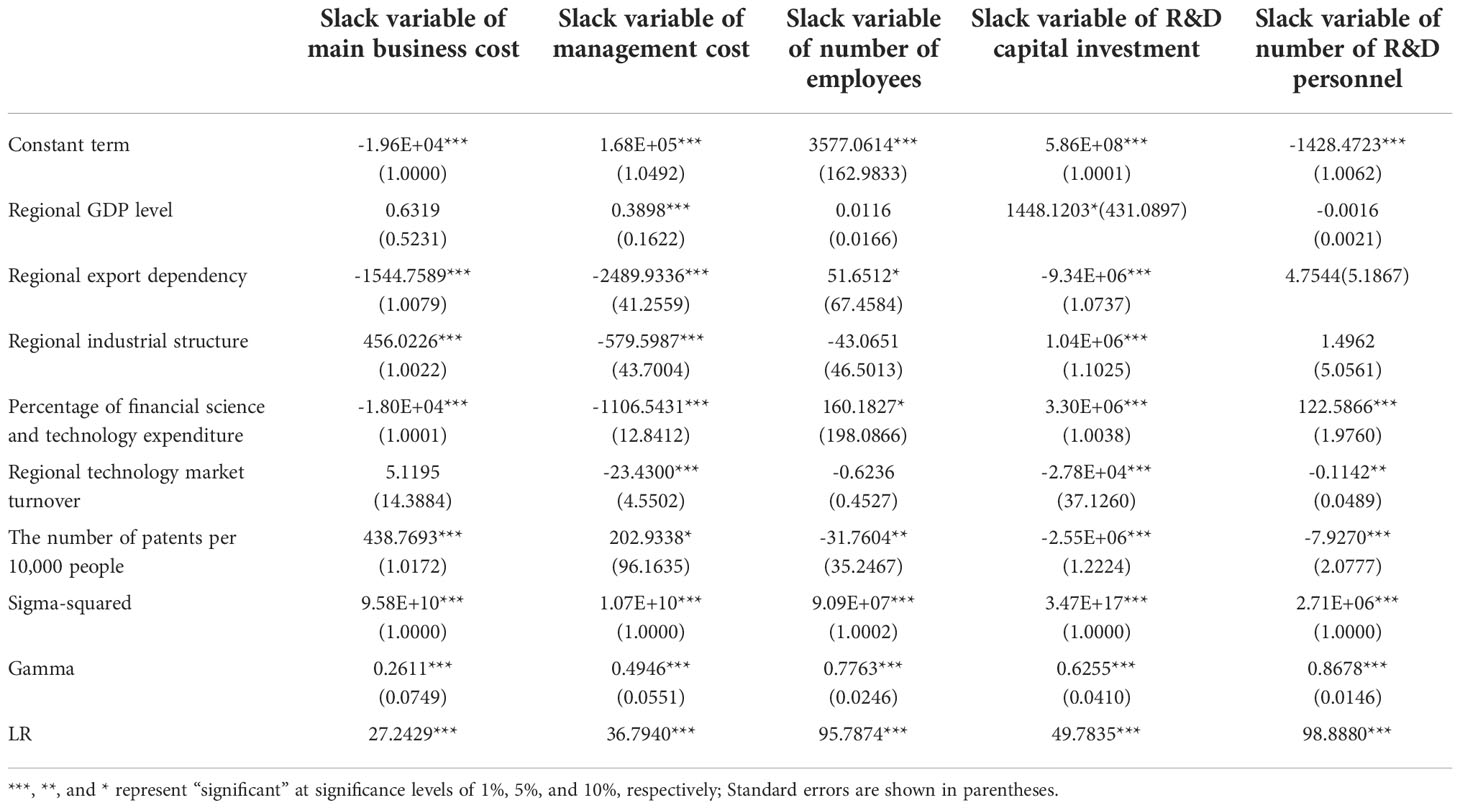
Table 5 SFA regression results.
The effect of environmental influences on input slack variables is the opposite of their effect on efficiency. Therefore, the sign of each regression coefficient can be used to find the part of the external environment that hinders the improvement of the GTE of the industry chain. By this, we can find out the external environmental dynamics that promote the development of efficiency. Analyzing Table 5, it can be found that high regional export dependency can effectively reduce the redundancy of various inputs, which indicates that the marine ship industry chain is more dependent on a highly open regional environment. The reason is that the frequent trade between the region and foreign countries can drive the inflow of advanced green technology and management experience from abroad, which is conducive to the regional marine ship industry to learn advanced technology and management experience from abroad and make up for its own shortage. In addition, the regional technology market turnover and the number of patents per 10,000 people can also effectively reduce the input redundancy of the industry chain, which indicates that a good innovation environment can significantly help the industry chain to improve its GTE. This is because a good innovation environment can provide more external support for green technological innovation and management innovation of industrial chain enterprises, give them confidence and encourage them to reform the shortcomings of their own system through management innovation, so as to enhance their market competitiveness through technological innovation.
GTE of the industry chain after adjustment
After the adjustment of input slack variables in the second stage, the GTE of the industry chain average and each link were re-measured under the meta-frontier. The development trend of MGTE of the industry chain as a whole and each link from 2015 to 2019 is shown in Figure 6. It can be found that the GTE curves of the industry chain as a whole and each link under the meta-frontier in Figure 6 are significantly different from Figure 2, and the GTE level of the whole and each link shows a significant decline, falling between [0.3,0.55], which is at a low-efficiency level. This indicates that the GTE of the industry chain is seriously overestimated and the measurement results are distorted without excluding the external environmental influence factors. However, the GTE of the industry chain as a whole shows an obvious upward trend, and this paper thinks that the reason is that during 2015-2019, China carried out key reforms in the 13th “Five-Year Plan” to address the problem of overcapacity in the shipbuilding industry, enhance the degree of industrial agglomeration through mergers and acquisitions, and improve the redundancy of resource inputs. At the same time, China accelerated the transformation and upgrading of the shipbuilding industry, advanced to high-end ships and green ships, improve its own green technological innovation ability and enhance market competitiveness.
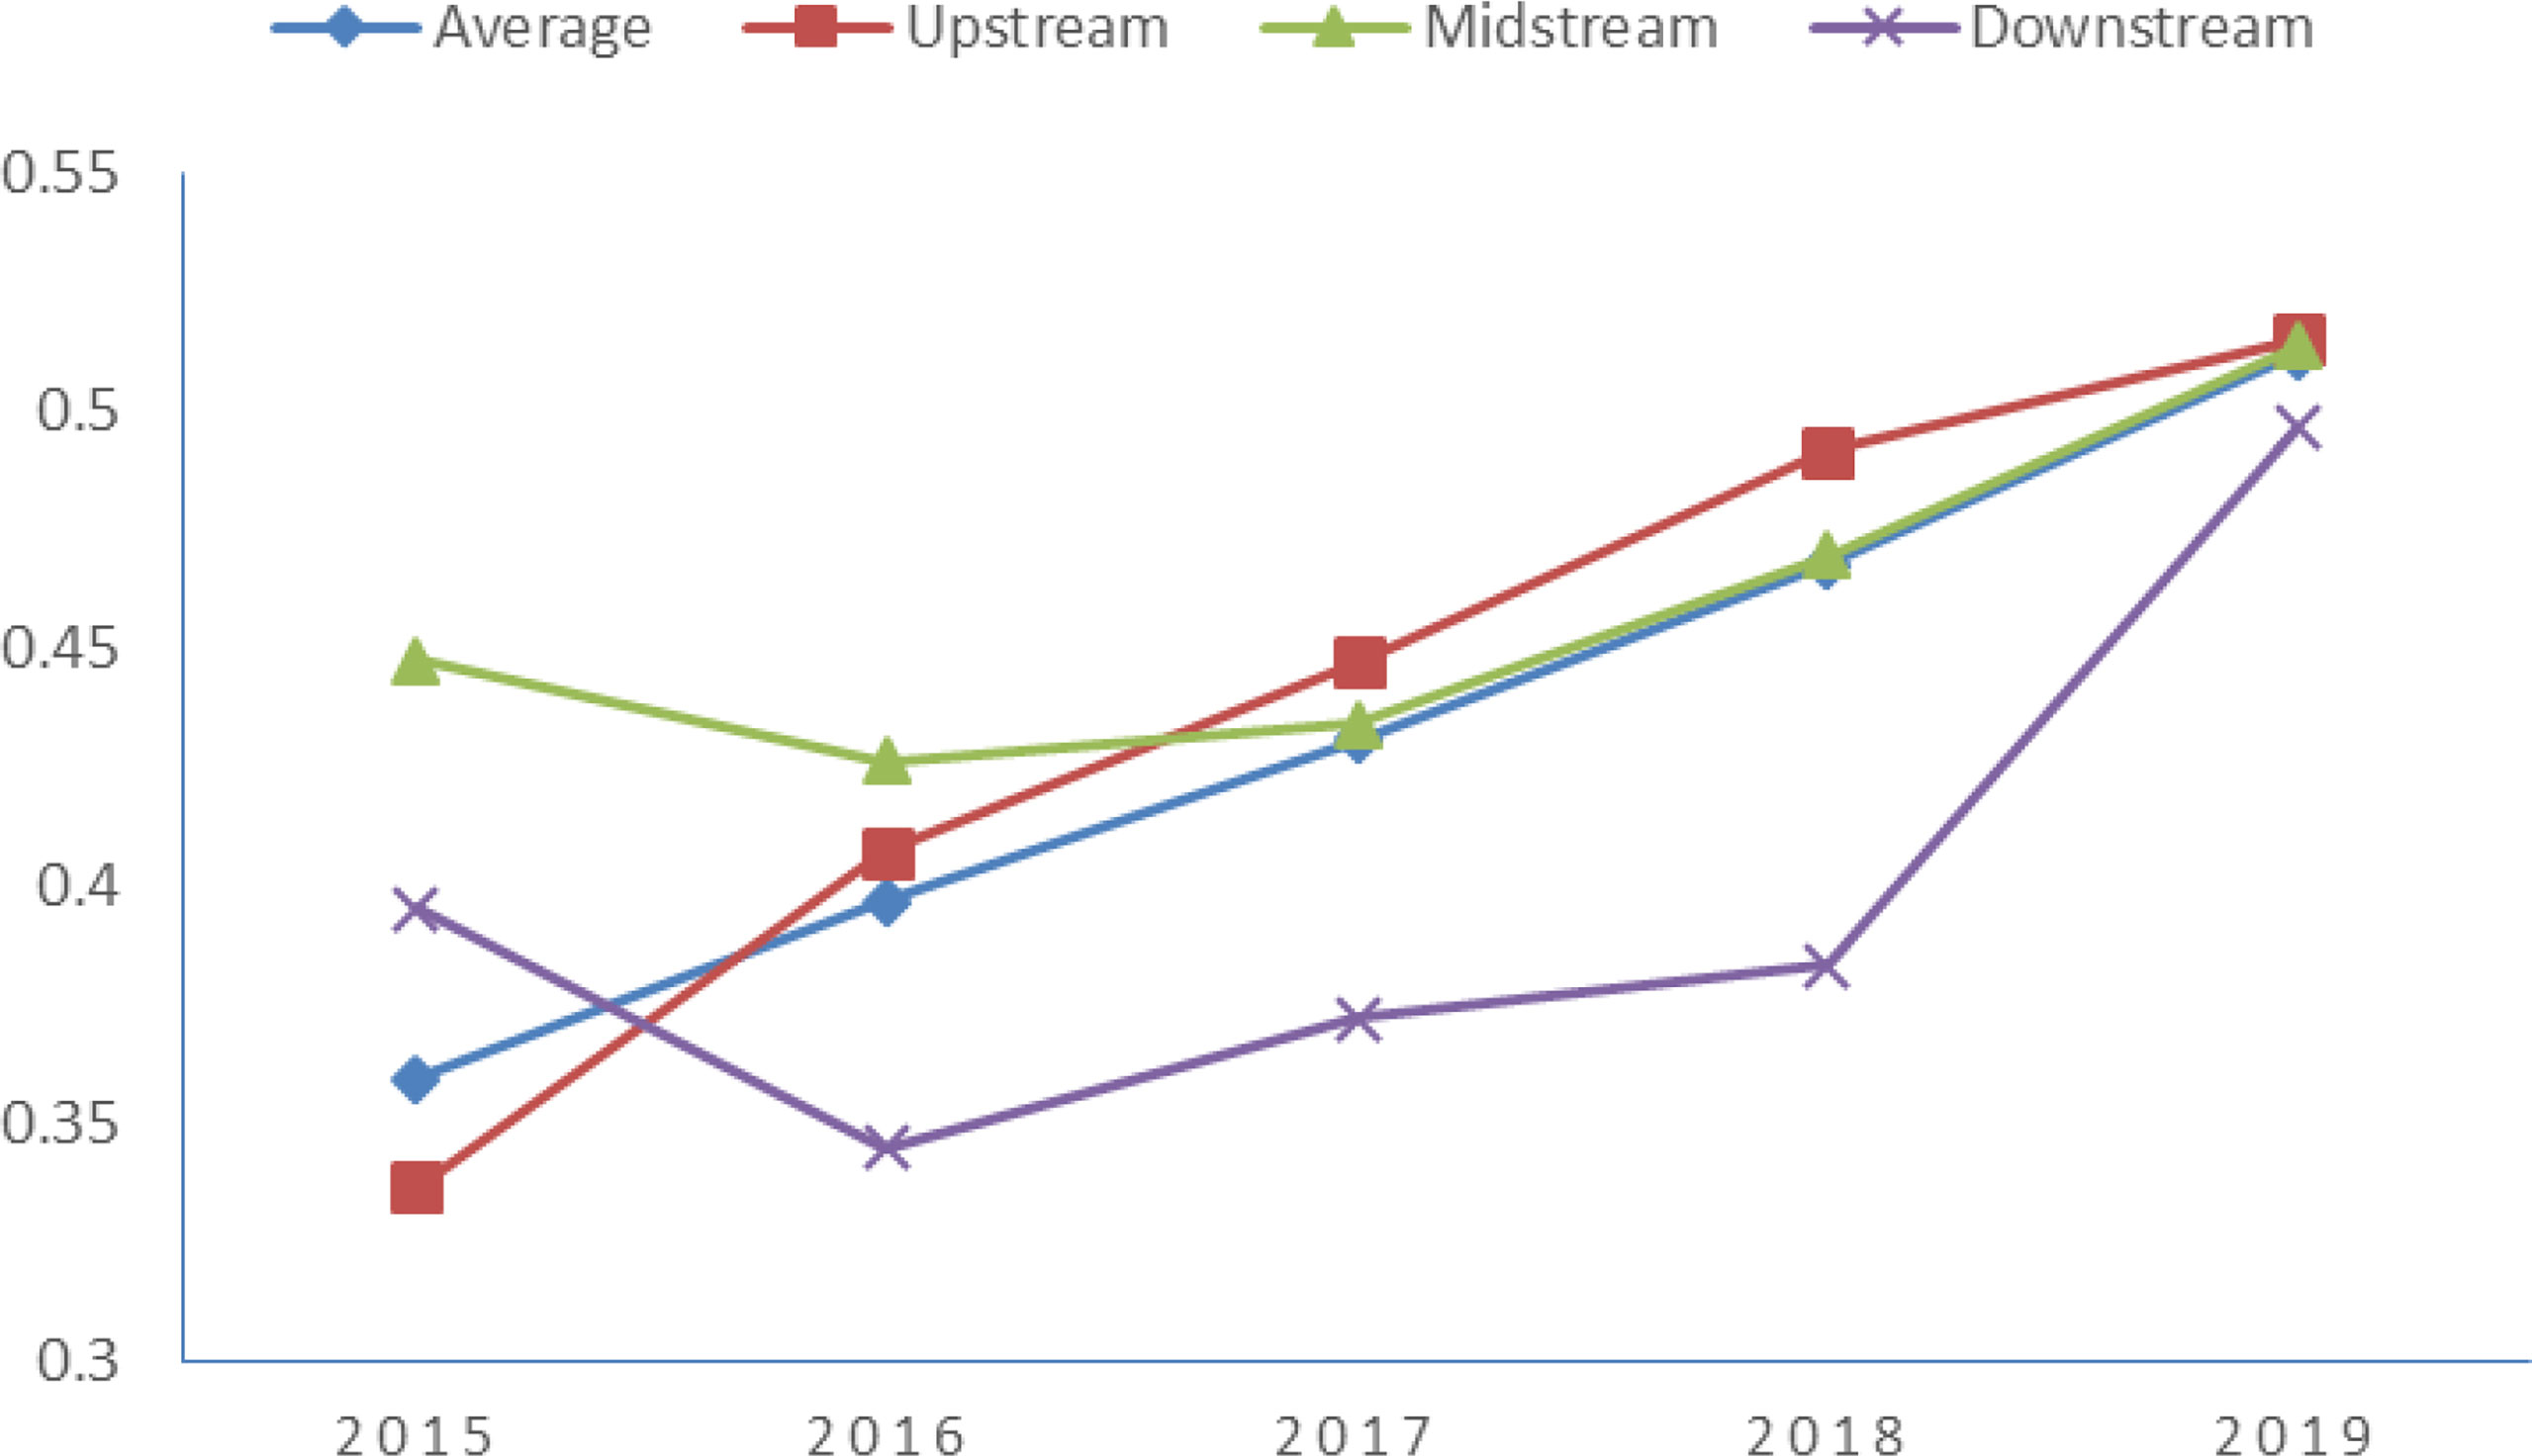
Figure 6 GTE of the average and each link of the industry chain under meta-frontier after adjustment, 2015-2019.
Table 6 shows the MGTE and GGTE of each link of the industry chain after adjustment, in which the values of MGTE and GGTE in the upstream are significantly reduced, from the high-efficiency level of about 0.8 before adjustment to the low-efficiency level of about 0.4. But in the midstream, the decline of GGTE is not significant, and it still remains at the medium-high efficiency level. To investigate the reason, this paper thinks that the reason is that the listed enterprises in the midstream are all old shipbuilding enterprises established for many years and of large scale, with perfect management systems, experienced operations, strong anti-risk ability, and relatively less influenced by the outside world.
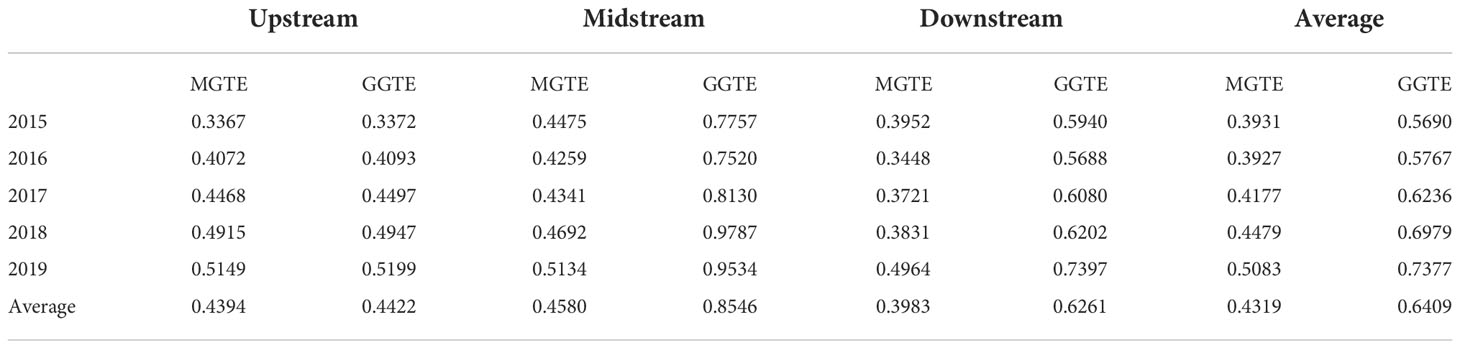
Table 6 MGTE value and GGTE value of each link of the industrial chain after adjustment in 2015-2019.
Figure 7 shows the adjusted TGR of each link. Compared with the pre-adjustment period, the TGR in the upstream does not change significantly, and the value is close to 1. The actual green technology level is close to the potential green technology level. But the TGR in the midstream and downstream is significantly reduced. Combined with the analysis of Table 6, the reason for this phenomenon is that the decline of GGTE in midstream and downstream is smaller than the decline of MGTE, so the value of TGR in midstream and downstream is small. Figure 8 shows the adjusted technology gap among the links of the industry chain, and it can be found that the technology gap among the links has increased significantly compared with that before the adjustment. The green technology gap of upstream-midstream and midstream-downstream has a tendency to expand significantly. That means the imbalance in the development of green technology level among the links of the industry chain has increased.
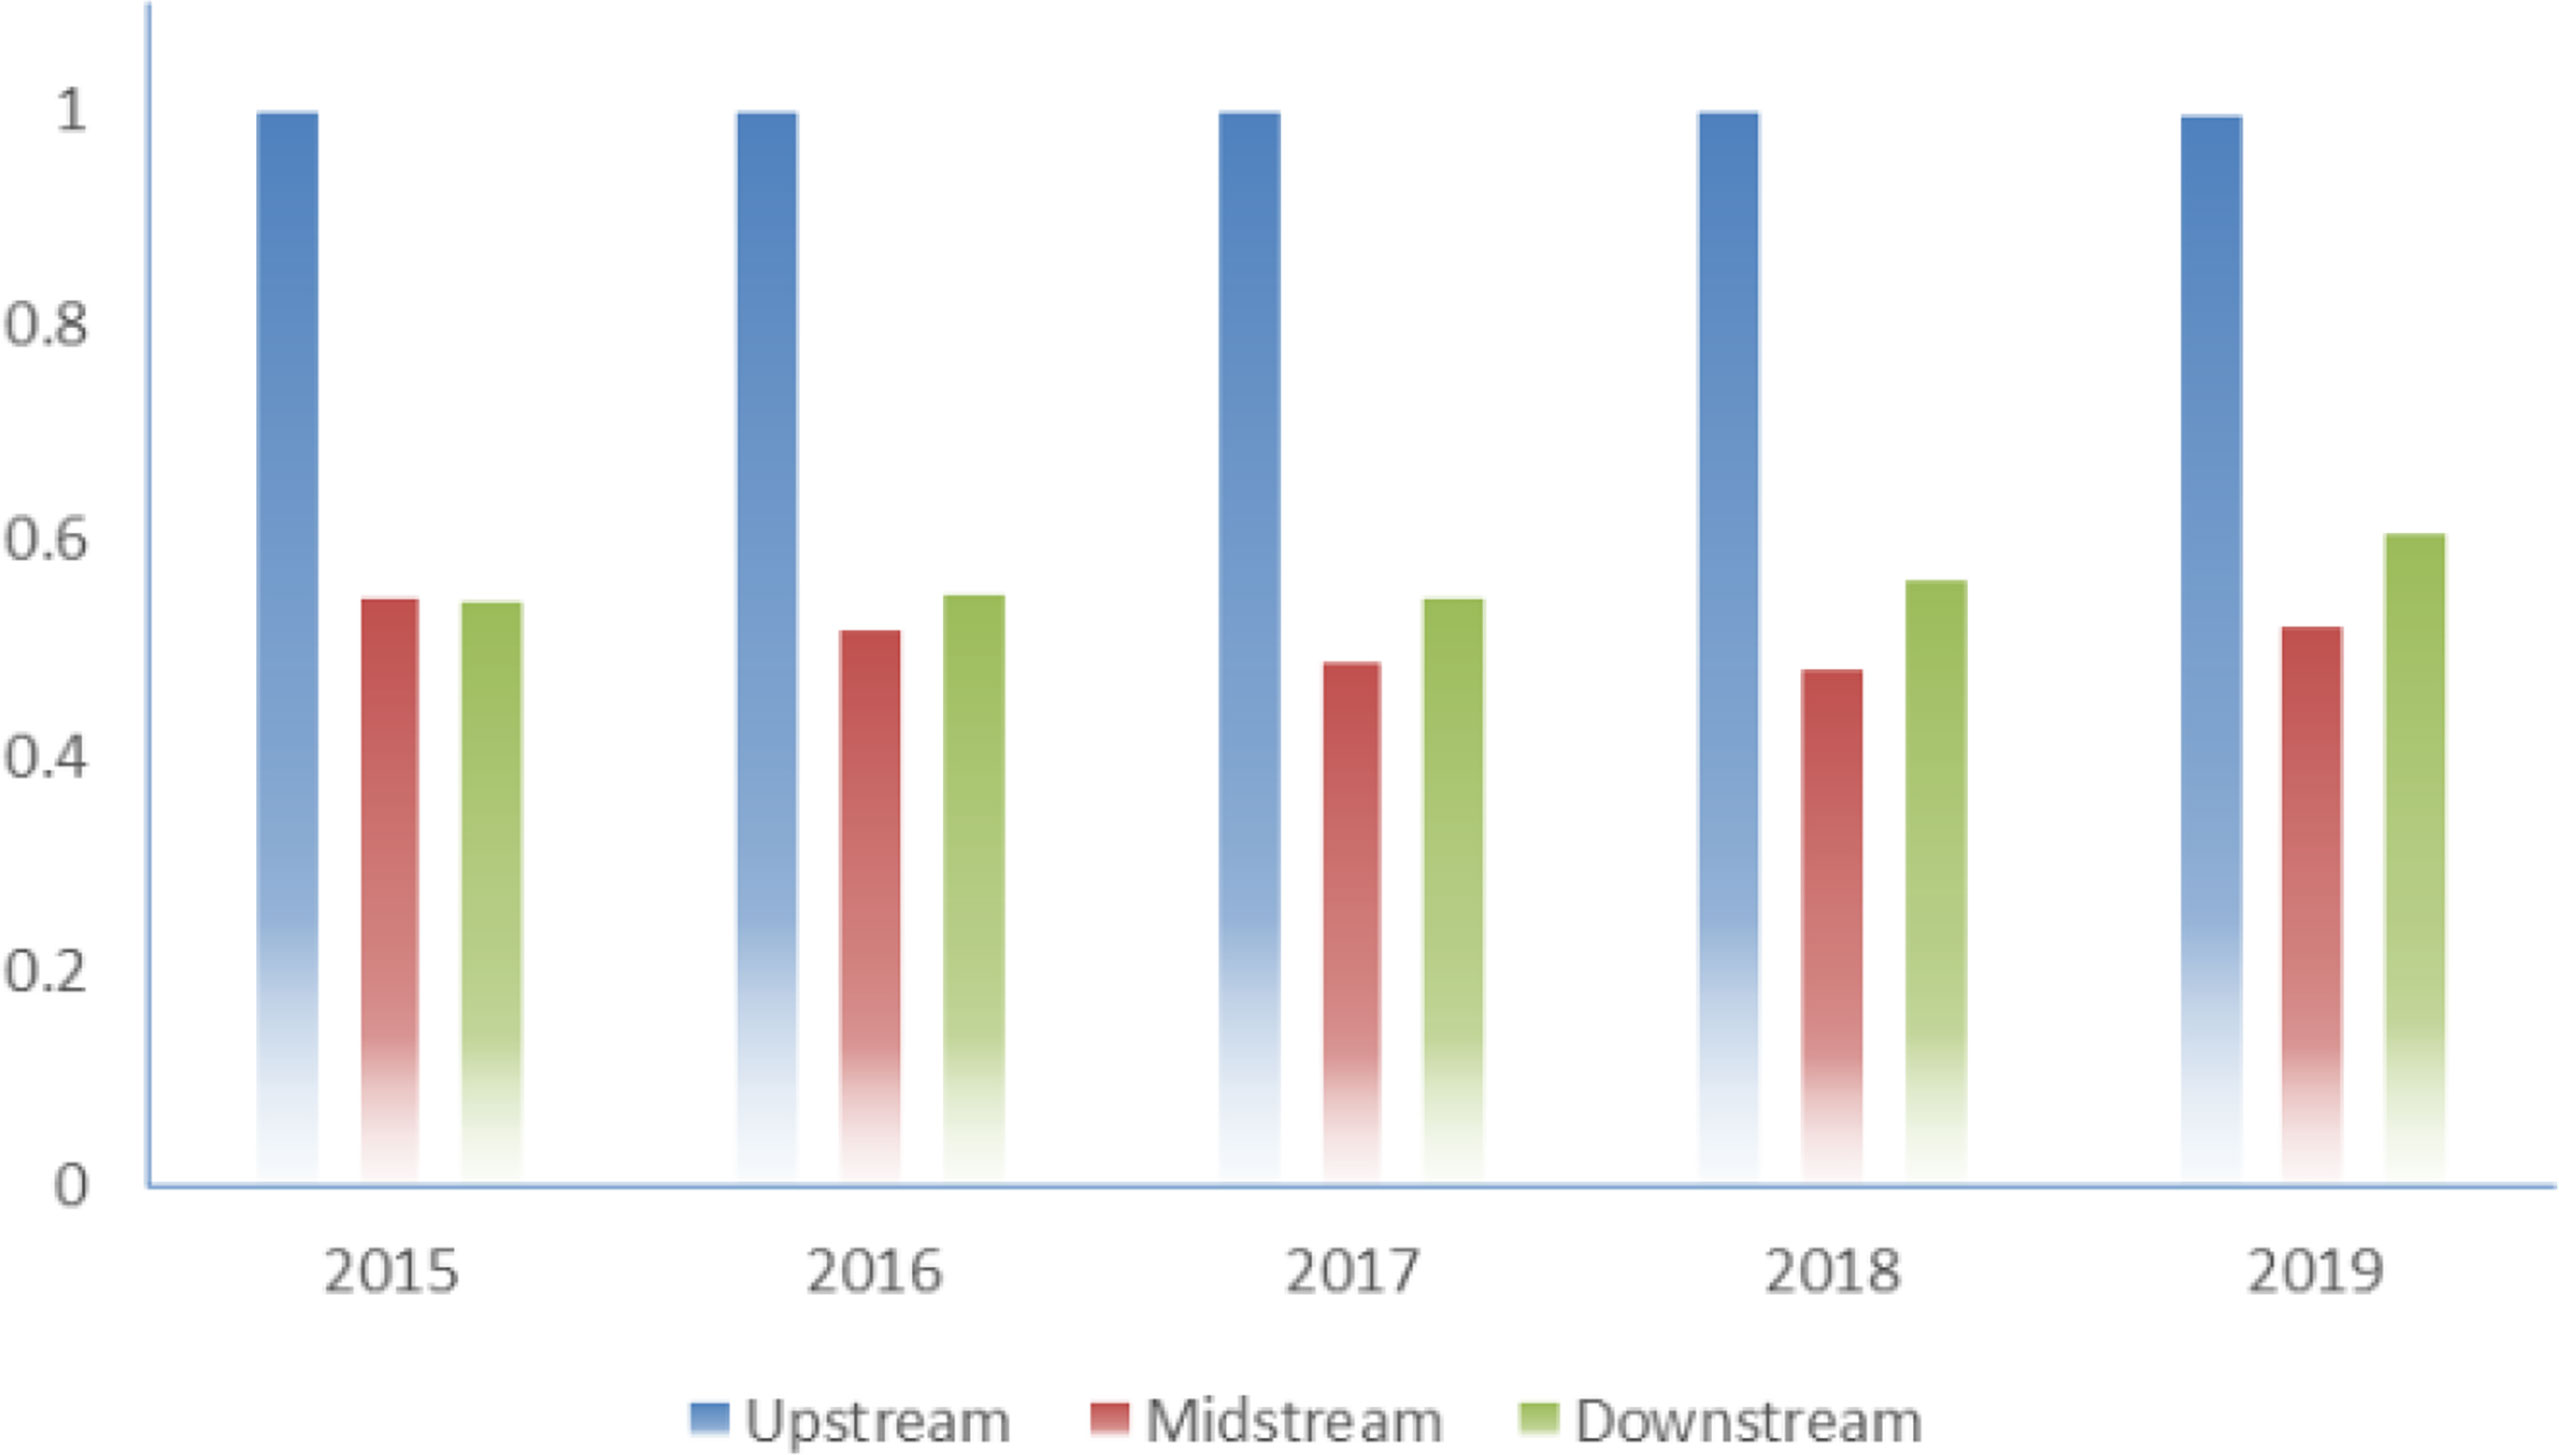
Figure 7 TGR for each link of the industry chain after adjustment, 2015-2019.
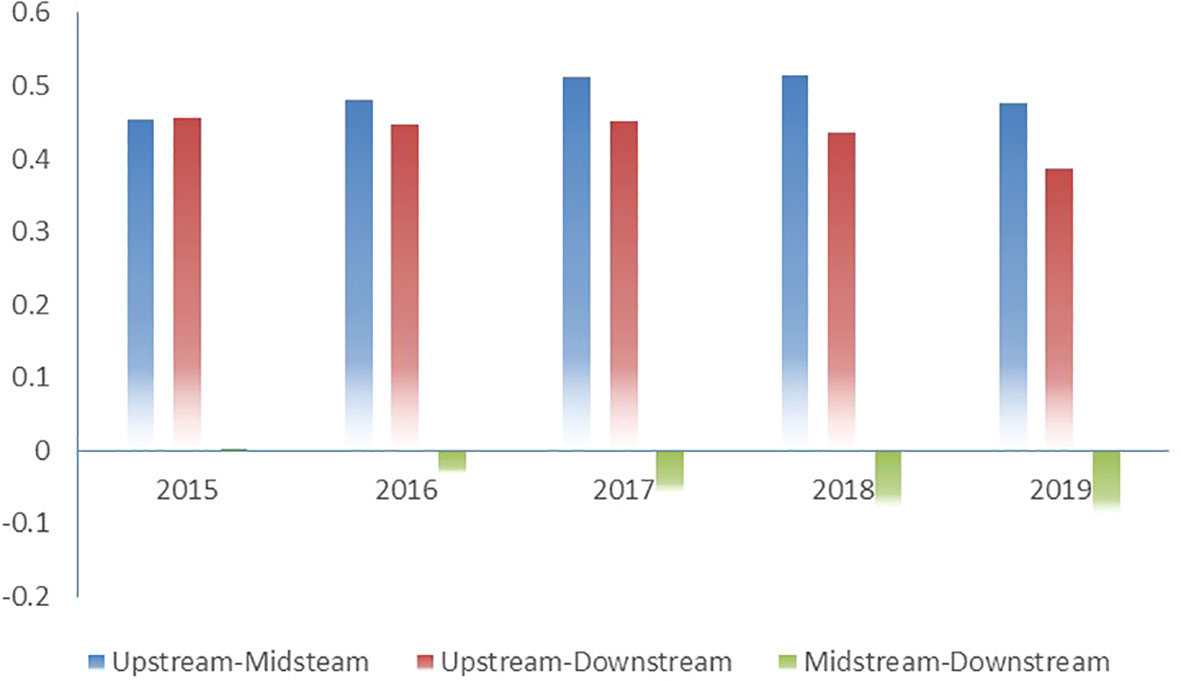
Figure 8 Technology gap between industry chain links after adjustment, 2015-2019.
According to the adjusted GTE values of each link of the industrial chain, the level of GTEI and the reasons causing the GTEI deficiency are analyzed, and the decomposition results are shown in Table 7. As can be seen from the table, the mean values of GTEI in the upstream, midstream and downstream of the industry chain have increased significantly. The causes of GTEI in the upstream and midstream are consistent with those before adjustment. There is no significant change. But the main reason causing GTEI in the downstream after the adjustment becomes MI, which means that the downstream should not only, but also strengthen the low level of management decisions and uncoordinated resource allocation leading to large input redundancy, which in turn affects the efficiency improvement of industrial green development. It means that for downstream industries, in addition to focusing on introducing new production technologies and equipment and improving the green technology environment, it is also important to focus on improving the management decisions of the enterprises themselves. The adjusted TGRI and MI development trends of each link of the industry chain from 2015-2019 are shown in Figure 9, which shows that the midstream TGRI and the downstream TGRI show an increasing trend instead of decreasing, in contrast to the decreasing trend of other curves. This reflects that the external green technical environment in the midstream and downstream of the industry chain has not improved or even further deteriorated.
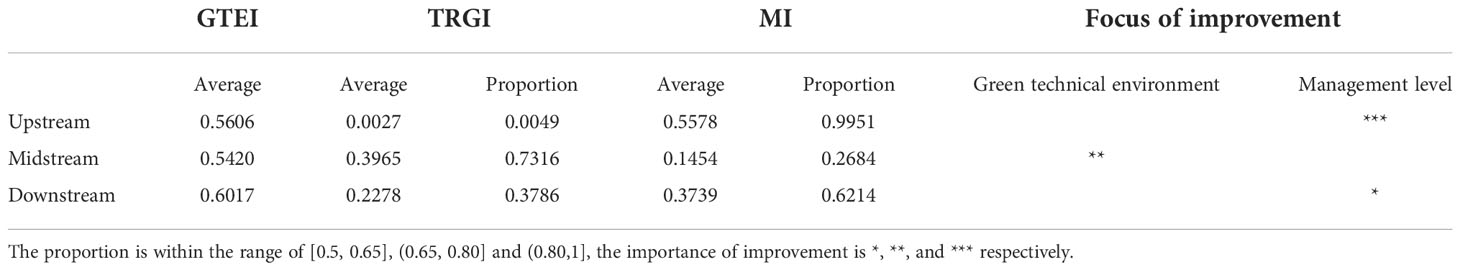
Table 7 Decomposition of GTEI values for each link of the industry chain after adjustment.
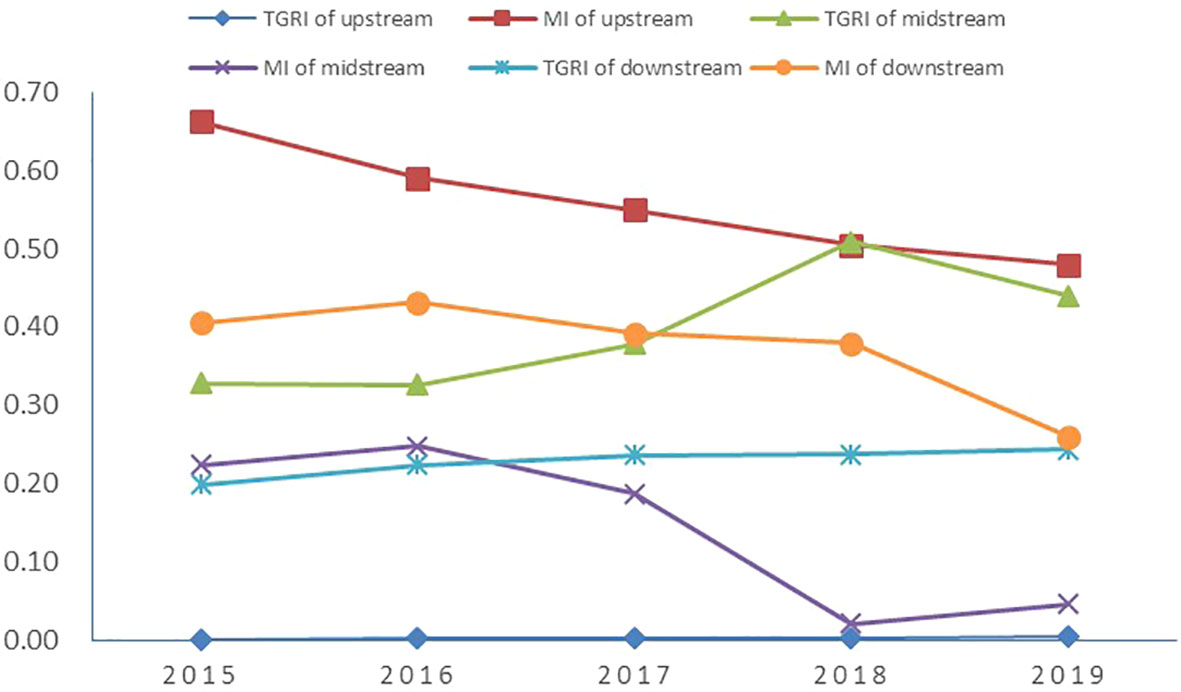
Figure 9 Development trends of TRGI and MI for each link of the industry chain after adjustment, 2015-2019.
Conclusions and recommendations
Conclusions
In this paper, we use meta-frontier framework and three-stage EBM models to investigate the GTE of the industry chain, explore the differences in GTE of each link of the industry chain under the meta-frontier and group-frontier, and analyze the causes of GTEI and the degree of influence of the external environment. It is found that (1) from 2015 to 2019, the level of MGTE of the industry chain as a whole and each link is high, and the overall trend is upward. However, the development of GTE among the links of the industry chain reflects a non-equilibrium. The actual green production level of the upstream is very close to the potential green production level and represents the frontier of GTE development of the industry chain; the downstream is second; the midstream, on the other hand, has a relatively low level of GRE, and its TGR is around 0.8, which becomes the weak point of GTE development of the industry chain. (2) Decomposition of GTEI reveals that there are obvious differences in the reasons for the lack of GTE in each link of the industry chain. The GTEI in the upstream is mainly due to the low level of management decisions and unreasonable resource allocation; the midstream and downstream are mainly due to the low level of green technology and the poor external technical environment. (3) By analyzing the influence of environmental influencing factors on input slack variables, it is found that the external environment has a significant influence on the GTE of the industrial chain. A better economic environment, policy environment and innovation environment in the region where the industrial chain is located can effectively reduce the capital input redundancy and labor input redundancy of the industrial chain, stimulate the innovation vitality of the industry, reform the backward production and serious pollution links in the industry, and then improve the GTE of the industrial chain. (4) After excluding the external environmental influence factors, the MGTE and GGTE of each link in the industry chain decrease, which indicates that the GTE of the industry chain is seriously overestimated without excluding the environmental influence factors. The adjusted GTE level of the industry chain is only about 0.3, and there is a large room for improvement. The green technology gap of each link of the industrial chain is further expanded. The main obstacles for the industrial chain to realize the transformation and upgrading to a green industrial chain are the low management level in the upstream and downstream, the unreasonable resource allocation, and the obvious green technology gap between the midstream and other links.
Policy recommendations
The imbalance of GTE development in the marine ship industry chain is serious, and the main reason for the GTEI is the low level of enterprise management decision and poor technical innovation ability, so we should focus on solving the shortcomings and problems of the industry chain in these two aspects.
(1) For upstream and downstream enterprises with low levels of GTE due to low management levels and imbalanced resource allocation, they should reform the shortcomings of their own management systems while stabilizing their existing green technology levels. Firstly, promote the system innovation and reform of large and established enterprises in upstream and downstream industries, streamline redundant organizational structures, improve organizational management efficiency, and prevent enterprises from tailing off. Second, to address the problem of overcapacity caused by rapid expansion at the beginning of the industrial chain, the government should properly guide industries to adjust their industrial structure through mergers and reorganizations, and direct the flow of resources to sectors with shortages. In addition, in order to promote the synchronous development of each link of the industry chain and narrow the gap of green technology among the links. It should strengthen the communication and collaboration among the links, expand the cooperation channels of enterprises in each link of the industry chain, promote the flow of information, technology, and other elements in each link of the industry chain, and drive the midstream industry to develop collaboratively with the development power of upstream and downstream in order to build a strong and solid marine ship industry chain.
(2) The main reason that hinders the midstream from improving the efficiency of green technology is its low level of green technology, resulting in a large gap between the actual green production level and the potential green production level. Therefore, for midstream enterprises, green technology innovation is an important way to improve green technology inefficiency. Firstly, promote close cooperation between enterprises and R&D institutions and university teams in the region, strengthen breakthroughs in important and difficult technologies, enhance industrial technology innovation capacity, and narrow the technical efficiency gap with other parts of the industrial chain through technological progress. Secondly, focus on supporting the innovation projects of technology-leading enterprises in the industry, accelerate the R&D and application of green ships and high-end ships, introduce foreign advanced energy-saving and emission reduction technologies, and enhance the innovation power in the R&D of green ships. In addition, it should fully implement the enterprise innovation incentive policy, encourage large and medium-sized enterprises to carry out green technology innovation through tax relief policy and financial allocation, and stimulate the innovation vitality of enterprises; through government procurement, allocation of environmental protection tasks, etc., guide enterprises to make efforts to new environmental protection product innovation and march to the high-end product market.
(3) The government should give full play to its role in guiding enterprises’ green technology innovation and management system reform, strengthen exchanges between large enterprises and small and medium-sized enterprises, drive the development of medium and low-level enterprises through the circulation of talent, technology, and other factor resources, and help them break through the bottleneck of green technology efficiency development. At the same time, the government should create a good innovation environment in the region, improve the construction of facilities for scientific and technological research and development, and stimulate the innovation vitality of enterprises in the industrial chain. In addition, the government should increase its efforts to attract investment, strengthen trade and exchange with the outside environment, introduce advanced foreign energy-saving and environmental protection technologies and experiences, and guide the industrial chain enterprises in the region to learn and improve. In addition to increasing the supervision of environmental pollution behavior in the industrial agglomeration area, strengthening the supervision of energy saving and emission reduction of industrial chain enterprises, and accelerating the pace of transformation and upgrading of industrial chain to green industrial chain.
Data availability statement
The original contributions presented in the study are included in the article/supplementary material. Further inquiries can be directed to the corresponding authors.
Author contributions
HG: Project support, framework design, idea provision. YW: Data collection, article writing. AZ: AI Article revision, format modification. All authors contributed to the article and approved the submitted version.
Funding
This research was funded by“the Major Special Projects of National Social Science Fund”,China (Grant No. 19ZDA080)
Conflict of interest
The authors declare that the research was conducted in the absence of any commercial or financial relationships that could be construed as a potential conflict of interest.
Publisher’s note
All claims expressed in this article are solely those of the authors and do not necessarily represent those of their affiliated organizations, or those of the publisher, the editors and the reviewers. Any product that may be evaluated in this article, or claim that may be made by its manufacturer, is not guaranteed or endorsed by the publisher.
References
Battese G. E., Rao D. S. P. (2002). Technology gap of efficiency and a stochastic meta-frontier function. Int. J. Business Economics 1 (2), 87–93. Available at: https://ijbe.fcu.edu.tw/assets/ijbe/past_issue/No.01-2/pdf/vol_1-2-1.pdf.
Chen F., Yao W. (2021). Research on the efficiency of scientific and technological innovation of enterprises with different nature in zhejiang province based on heterogeneous technology. Sci. Technol. Manage. Res. 41 (01), 77–85. doi: 10.3969/j.issn.1000-7695.2021.01.012
Chiu C. R., Liou J. L., Wu P. I., Fang C. L. (2012). Decomposition of the environmental inefficiency of the meta-frontier with undesirable output. Energy Economics 34 (5), 1392–1399. doi: 10.1016/j.eneco.2012.06.003
Dong H., Li X., Zhang R. (2021). Spatial-temporal characteristics and driving factors of green innovation efficiency in guangdong-Hong Kong-Macao greater bay area. Economic Geogr. 41 (05), 134–144. doi: 10.15957/j.cnki.jjdl.2021.05.015
Fried H. O., Lovell C. A. K., Schmidt S. S., Yaisawarng S. (2002). Accounting for environmental effects and statistical noise in data envelopment analysis. J. productivity Anal. 17 (1), 157–174. doi: 10.1023/A:1013548723393
Han J., Zhou L. (2022). Regional heterogeneity and factor decomposition of green development efficiency. Stat Decision 38 (14), 39–44. doi: 10.13546/j.cnki.tjyjc.2022.14.008
Li H., He H., Shan J., Cai J. (2020). Research on technology innovation efficiency of china’s IC industry eliminating the influence of non-operating factors: Analysis based on generalized GRA-DEA and tobit. J. Ind. Eng. Eng. Manage. 34 (02), 60–70. doi: 10.13587/j.cnki.jieem.2020.02.007
Li X., Li S., Zhang S. (2010). Single factor efficiency analysis in high-tech and non-High-Tech industry innovative activities. China Ind. Economics 05, 68–77. doi: 10.19581/j.cnki.ciejournal.2010.05.00
Li J., Ma X. (2014). The utilization efficiency of industrial water under the dual constraints of resource and environment–an empirical study based on SBM-undesirable and meta-frontier model. J. Natural Resour. 29 (06), 920–933. doi: 10.11849/zrzyxb.2014.06.002
Liu J., An K. (2022). “Evaluation of green innovation efficiency of china's tourism industry and analysis of influencing factors under the “Double carbon. Coal.” J. Southwest Minzu Univ. (Humanities Soc. Science) 43 (10), 29–40.
Liu Y., Li R., Zhu K., Song Y. (2020). Measurement and analysis of environment efficiency of pig breeding in China under technology heterogeneity? World Agric. 11), 43–53. doi: 10.13856/j.cn11-1097/s.2020.11.006
Liu C., Qu Q. (2015). Research into the efficiency evaluation of non-ferrous metal industry based on network DEA model. China Min. Magazine 24 (S2), 40–44.
Liu H., Shi Y., Zeng C. (2017). Spatial layout and development strategy of the ship-related industry in China. Economic Geogr. 37 (08), 99–107. doi: 10.15957/j.cnki.jjdl.2017.08.013
Li Y., Wang Q., Fu L., Wang C. (2015). Evaluation research on economic efficiency and ecological efficiency in forest products industry ecological industry chain: An empirical analysis based on the three stage DEA model in heilongjiang province. Ecol. Economy 31 (11), 51–55.
Li G., Zhang G., Liu J. (2017). Regional differences and convergence analysis of technical efficiency of shipbuilding industry in China. Shipbuilding China 58 (02), 165–177.
Luo X., Lai D. (2021). Measuring and comparing the efficiency of the whole industry chain of rare earths from the perspective of industry chain extension: Based on three-stage DEA model. Sci. Decision Making 06), 104–121. doi: 10.3773/j.issn.1006-4885.2021.06.104
O’Donnell C. J., Rao D. S. P., Battese G. E. (2008). Meta-frontier frame works for the study of firm -level efficiency and technology ratios. Empirical Economics 34), 231–255. doi: 10.1007/s00181-007-0119-4
Sun Z., Ma Q., Zhao S. (2018). Temporal and spatial evolution of green efficiency of water resources in China and its convergence analysis. Prog. Geogr. 37 (07), 901–911. doi: 10.18306/dlkxjz.2018.07.004
Su Y., Wang F., An X. (2016). Coupling mechanism and coupling degree measurement model of shipbuilding industry cluster. Polish Maritime Res. 23 (S1(91), 78–85. doi: 10.1515/pomr-2016-0049
Tang M., Qiu X., Hu F., Chen C. (2016). Research on the development of china’s marine equipment industry. Strategic Study CAE 18 (02), 72–75. doi: 10.15302/J-SSCAE-2016.02.008
Tan S., Yan K. (2011). Evaluation research of China regional shipbuilding competitiveness in global value chain. J. Ind. Technological Economics 30 (05), 24–30. doi: 10.3969/j.issn.1004-910X.2011.05.005
Tian J. (2021). Evaluation of eco-efficiency of Chinese industrial systems –based on industrial chain perspective. Stat Decision 37 (15), 96–99. doi: 10.13546/j.cnki.tjyjc.2021.15.021
Tone K. (2001). A slacks-based measure of efficiency in data envelopment analysis. Eur. J. Operational Res. 130 (3), 498–509. doi: 10.1016/j.ejor.2008.05.027
Tone K., Tsutsui M. (2010). An epsilon-based measure of efficiency in DEA–a third pole of technical efficiency. European Journal of Operational Research 207 (3), 1554–1563. doi: 10.1016/j.ejor.2010.07.014
Tu N., Xie R., Wang X. (2020). Study on the transformation efficiency of china’s non-ferrous metal industrial chain. China Min. magazine 29 (02), 32–39. doi: 10.12075/j.issn.1004-4051.2020.02.006
Wang K., Meng X., Yang B. (2017). Ecological pressure, ecological technology gap and regional eco-economic efficiency–an empirical analysis based on china’s provincial panel data from 2006 to 2015. J. Shanxi Univ. Finance Economics 39 (12), 1–14. doi: 10.13781/j.cnki.1007-9556.2017.12.001
Wang N., Sun Y., Wang T. (2022). Green ship technology application and development. Ship Eng. 44 (04), 54–57+63. doi: 10.13788/j.cnki.cbgc.2022.04.10
Xiao R., Wang Z., Qian L. (2015). Research on different nature enterprise innovation efficiency in the perspective of technology gap. J. Quantitative Technological Economics 32 (10), 38–55. doi: 10.13653/j.cnki.jqte.2015.10.003
Yang L., Wang X. (2018). The efficiency of non-ferrous metals industry chain in China and influencing factors–two-stage analysis based on network DEA model. Reformation Strategy 34 (11), 102–109. doi: 10.16331/j.cnki.issn1002-736x.2018.11.017
Yuan Y., Chen J. (2019). Environmental regulation, green technology innovation and the transformation and upgrading of china’s manufacturing industry. Stud. Sci. Sci. 37 (10), 1902–1911.
Zhang C., Quan X. (2016). The bottleneck of the development of china’s marine engineering equipment manufacturing industry and upgrade path. Economic Rev. J. 08), 95–100. doi: 10.16528/j.cnki.22-1054/f.201608095
Zhang F., Xue H. (2021). Spatiotemporal characteristics of industrial total factor water resource efficiency based on green development. Resour. Sci. 43 (05), 964–973. doi: 10.18402/resci.2021.05.10
Zhang L., Zhang Y., Liang Y. (2022). The measurement and evaluation of green technology innovation efficiency of industrial enterprises in China: Analysis based on network super SBM-malmquist model. J. Technol. Economics 41 (07), 13–22.
Zhang X., Zhao F., Wang C., Zeng X., Zhao J. (2016). Research on the development strategy of green ship technology. Strategic Study CAE 18 (02), 66–71. doi: 10.15302/J-SSCAE-2016.02.007
Zheng J., Liu C., Lin Z. (2020). Low carbon development of green ships and related strategies. Strategic Study CAE 22 (06), 94–102. doi: 10.15302/J-SSCAE-2020.06.012
Zhou Z., Guan H. (2019). Analysis of total factor productivity and influencing factors in china’s shipbuilding industry: Based on industrial environment perspective. Ocean Dev. Manage. 36 (01), 114–120.
Appendix
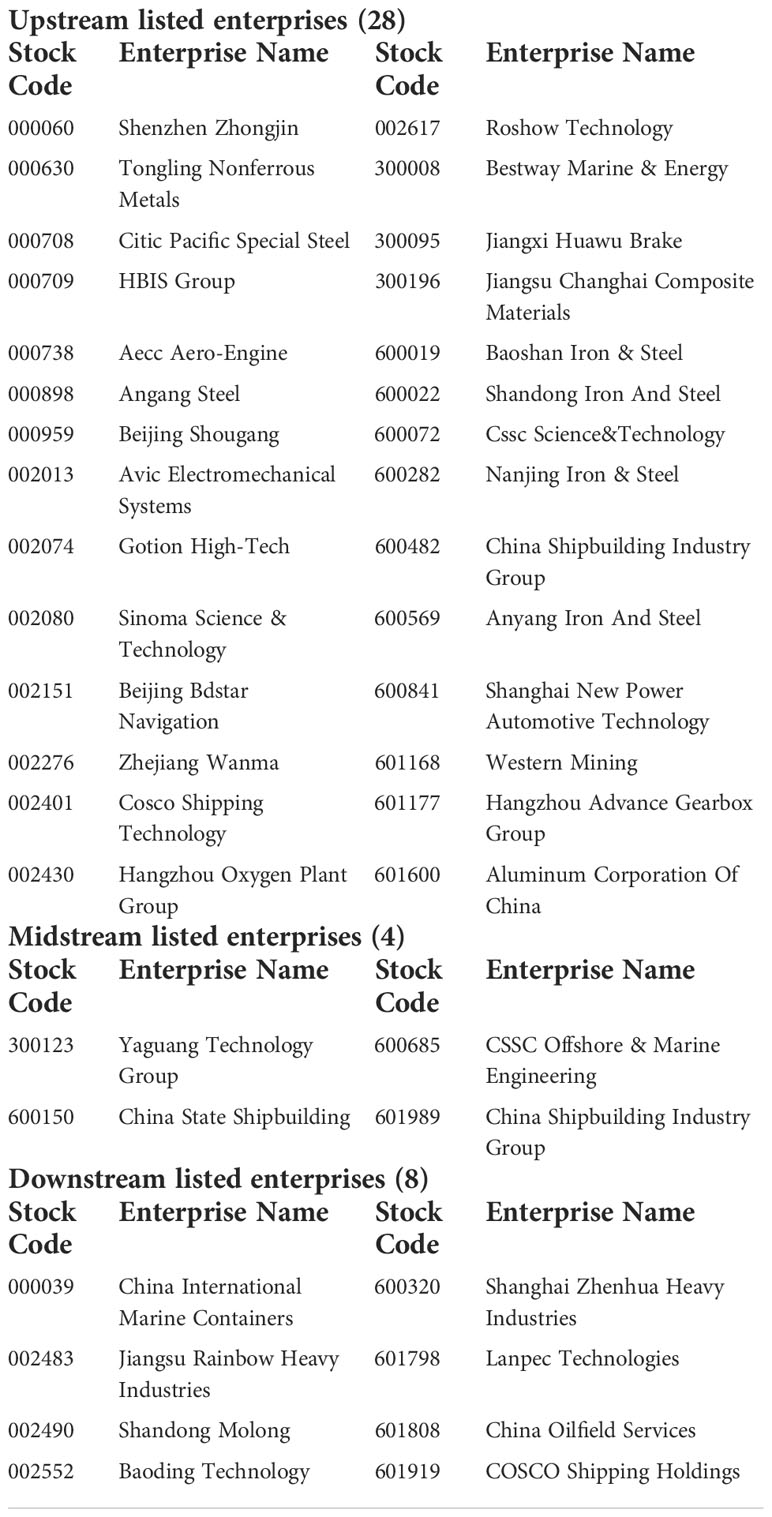
Note 1: The list of 40 listed enterprises in China’s marine ship industry chain used in this paper.
Keywords: marine ship industry chain, meta-frontier framework, three-stage EBM model, green technology efficiency, technological heterogeneity
Citation: Guan H, Wang Y and Zhao A (2022) A study on green technology efficiency of China’s marine ship industry chain based on meta-frontier framework and three-stage EBM model. Front. Mar. Sci. 9:996919. doi: 10.3389/fmars.2022.996919
Received: 18 July 2022; Accepted: 02 November 2022;
Published: 23 November 2022.
Edited by:
Hsuan-Shih Lee, National Taiwan Ocean University, TaiwanReviewed by:
Ya Chen, Hefei University of Technology, ChinaChristian T. K.-H. Stadtlander, Independent researcher, Destin, Florida, United States
Copyright © 2022 Guan, Wang and Zhao. This is an open-access article distributed under the terms of the Creative Commons Attribution License (CC BY). The use, distribution or reproduction in other forums is permitted, provided the original author(s) and the copyright owner(s) are credited and that the original publication in this journal is cited, in accordance with accepted academic practice. No use, distribution or reproduction is permitted which does not comply with these terms.
*Correspondence: Hongjun Guan, amp4eWdoakAxMjYuY29t; Aiwu Zhao, YWl3dXpoQDEyNi5jb20=