 Abdallah S. Salah1,2*
 Sahar H. El-Nagar3
 Ahmed Elsheshtawy2,4Ibtesam Al-Dhuayan5Alamira Marzouk Fouad6
 Mashael M. Alnamshan5Hossam I. Kadira4Nouf K. Alaqeel5Set A. El-Shobokshy7
 Mustafa Shukry8
 Hanan H. Abd-Elhafeez9*
- 1Department of Aquaculture, Faculty of Aquatic and Fisheries Sciences, Kafrelsheikh University, Kafrelsheikh, Egypt
- 2Institute of Aquaculture, University of Stirling, Stirling, United Kingdom
- 3Department of Animal Wealth Development, Faculty of Veterinary Medicine, Kafrelsheikh University, Kafrelsheikh, Egypt
- 4Department of Fish Processing and Biotechnology, Faculty of Aquatic and Fisheries Sciences, Kafrelsheikh University, Kafrelsheikh, Egypt
- 5Department of Biology, College of Science, Imam Abdulrahman Bin Faisal University, Dammam, Saudi Arabia
- 6Aquatic Animals Medicine and Management, Faculty of Veterinary Medicine, Assiut University, Assiut, Egypt
- 7Department of Nutrition and Veterinary Clinical Nutrition, Faculty of Veterinary Medicine, Alexandria University, Alexandria, Egypt
- 8Department of Physiology, Faculty of Veterinary Medicine, Kafrelsheikh University, Kafrelsheikh, Egypt
- 9Department of Cell and Tissues, Faculty of Veterinary Medicine, Assiut University, Assiut, Egypt
This study explored the growth efficiency and the intracellular pathways by which Cnicus benedictus extract (CBE) acts. It investigated the antioxidant effects and efficacy of CBE as a fish supplement in attenuation of Aeromonas hydrophila in Oreochromis niloticus fish. Mono-sex Nile tilapia fish (n = 225) were randomly allocated to five groups in triplicate aquaria (n = 3 tanks per group, 15 fish per tank, with 120 L of water per tank) with a daily water exchange rate of 20%. After adaption for 2 weeks and body weight measuring, the experimental groups were fed isonitrogenous and isocaloric diets with different dosages of the ethanolic extract of C. benedictus for 10 weeks. The five groups were identified as the control group (CBE0.0), which was fed on the basal diet, while the second (CBE0.1), the third (CBE0.2), the fourth (CBE0.4), and the fifth (CBE0.6) groups were fed the basal diet supplemented with 0.1%, 0.2%, 0.4%, and 0.6% of C. benedictus extract, respectively. After the 10-week feeding trial was completed, the fish were inoculated with the PCR-identified pathogenic A. hydrophila in a challenge trial which lasted 15 days. A. hydrophila, one of the septicemic bacteria, causes severe economic losses, high mortality rates, and hemorrhages in Nile tilapia and other cultured freshwater fishes worldwide. The CBE was found to significantly increase the body mass, weight gain, and the specific growth rate, as well as the protein efficiency ratio of the fish. Increased survival percentage, accompanied by post challenge lymphocytosis with decreased liver enzyme levels, increased total protein, and improved kidney function markers were also seen. Additionally, CBE supplementation showed significant increases in phagocytic activity, phagocytic index, and lysosomal activity post challenge, accompanied by increases in antioxidant activity and the mRNA expression of cytokines genes hsp70 and tlr7 mRNA. The desirable effects of CBE treatment were confirmed by a histopathological examination of the height of intestinal villi and enterocytes lining the middle intestine and increases in the size of liver cells. We conclude that CBE increases the growth performance and modulates the antioxidant, inflammatory, stress, and immune-related genes in Nile tilapia. Moreover, the dietary inclusion of 0.42–0.47% CBE showed a better protective effect with the A. hydrophila challenge.
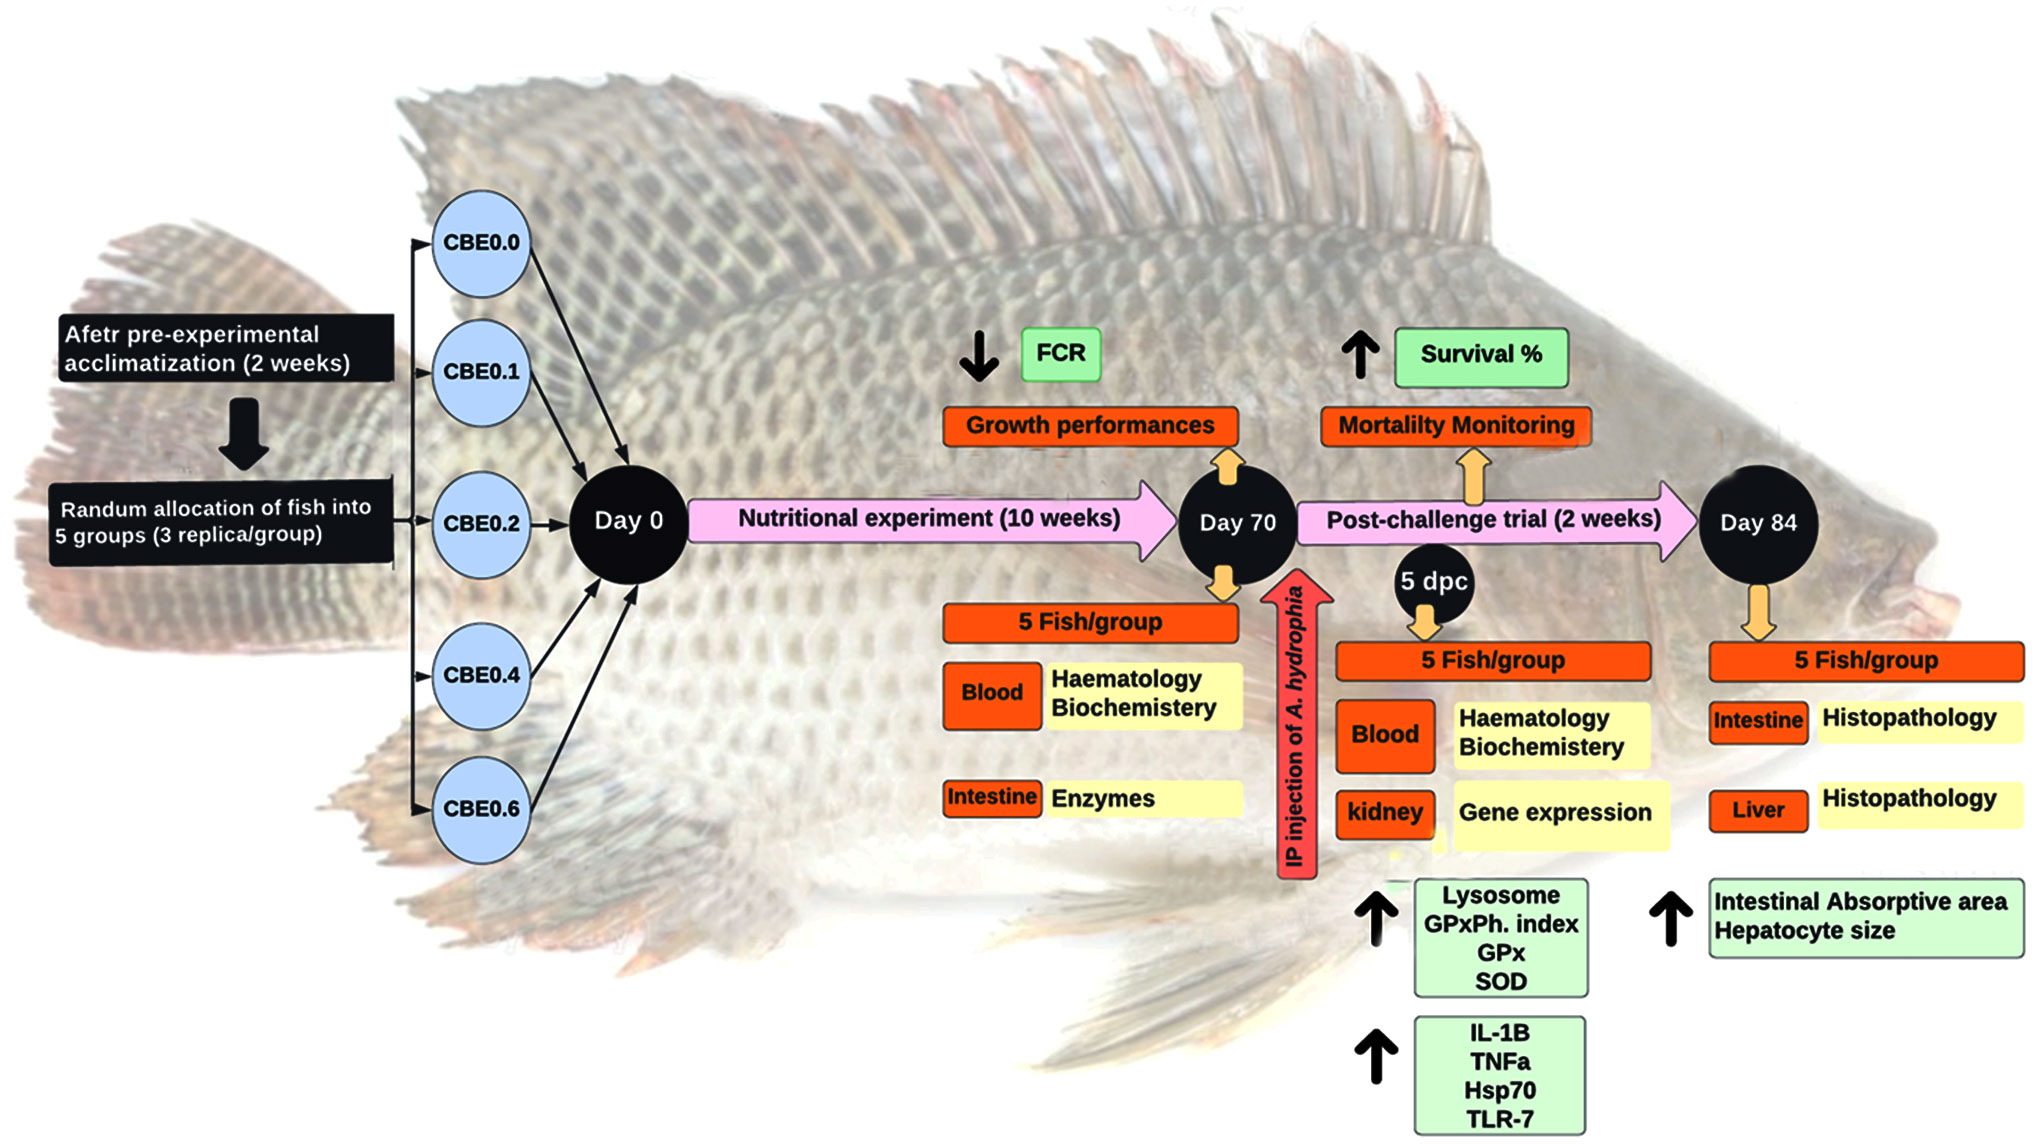
Graphical Abstract
1 Introduction
Fish feeds have improved in quality recently due to the addition of various plant ingredients. Using plant supplements enhances the growth performance of diverse fish species, lowers the feed conversion ratio, and improves survival rates. Biodegradable and non-toxic plant extracts hold great promise because they are healthy for fish and the environment and are relatively inexpensive (Erol-Florian et al., 2011). Currently, there is a lack of knowledge about the nutrigenomic pathways that explain the effects of plant supplements on the growth and health of various fish species, although some herbal additives have been used in aquaculture in place of antibiotics (Sharif Rohani et al., 2017).
Recent challenges affecting the growth of aquaculture include feed costs, pollution, climate change, poor water quality, and pathogenic invasion (Boyd et al., 2020). Bacterial infections are a significant concern for farmers, affecting production and profitability (Arunkumar et al., 2020). Septicemia caused by the pathogen Aeromonas hydrophila is lethal in cases of severe illness (Ashour et al., 2020). A. hydrophila therefore causes significant financial harm and is one of the threats to the long-term viability of aquaculture, which must be addressed (Igbinosa et al., 2017). Bacterial infections in aquaculture have traditionally been treated with antibiotics (Zhao et al., 2020), but these present risks to human health and the environment and delivering the necessary dosages of chemotherapy to all diseased fish in a pond are difficult, particularly in developing nations (Chen et al., 2020). As a result, antibiotics are not always a viable option for dealing with the expansion of infection, and beneficial additives in aquaculture are advocated as partial substitutes for antibiotics (Abdel-Latif et al., 2021; Diab et al., 2022). The ideal dosages, durations, and feeding schedules of these feed additives affect their effectiveness and must be identified (Elumalai et al., 2020).
The Asteraceae family includes Cnicus benedictus L., sometimes known as St. Benedict’s thistle or blessed thistle. C. benedictus L. is native to Turkey, where it is widespread, and is also found in other Mediterranean countries (Lucini et al., 2016). These plants contain secondary metabolites, including glycosides, bioactive azo compounds, flavonoids (silymarin), and rosmarinic acid (Rosmarin). These metabolites are used to treat lung and colon malignancies and hepatitis (Ahmed–Belkacem et al., 2010). Polyphenols contain several components, including phenolic acids, flavonoids, procyanidins, anthocyanins, tannins, and lignins, and make up a large family of natural chemicals. Antioxidant, antimicrobial, antiviral, antitumor, and anti-inflammatory properties are only a few physiological and non-physiological properties observed in these compounds (Can et al., 2017). The phenolic content of each plant species is linked to their bioactive qualities (Can et al., 2015). Polyphenols can function as reducing, scavenging, chelating, coagulating, stabilizing, stimulating, and surfactant agents, and have antibacterial properties as well. Hence, they can be used in various applications (Can et al., 2015). Flavonolignans, abundant in milk thistle and containing flavonoids such as silibinin A, silibinin B, isosilibinin A, and isosilibinin B, make up the silymarin combination (Yıldız et al., 2013).
Amaroidcninin, a primary component of C. benedictus L., has been used to treat anorexia because it promotes the release of saliva and gastric fluids (Van Wyk, 2015). The leaves, stems, and flowers of the blessed thistle have been a traditional “bitter” tonic used to stimulate appetite and digestion. It also contains various nutrients, minerals, and trace elements. C. benedictus L. has been shown to have antibacterial, cytotoxic, anti-inflammatory, wound healing, and bile boosting properties, and has been shown to aid digestion in prior research (Al-Snafi, 2016a). The anti-inflammatory effects of C. benedictus has been shown to suppress nuclear factor κB and inducible nitric oxide synthase (iNOS) and decrease reactive oxygen species (ROS) (Erel et al., 2011). It has been employed to return normal liver function, promote the body’s bile secretion, and aid digestion and detoxification (Al-Snafi, 2016b).
This study was designed to examine the effect of a C. benedictus extract on growth efficiency and the intracellular pathways by which it acts, by investigating the antioxidants, immunity, histopathological changes, and the expression of immune-related genes in Oreochromis niloticus fish challenged with A. hydrophila.
2 Materials and methods
2.1 Ethical approval
This trial was conducted at the Department of Aquaculture, Faculty of Aquatic and Fisheries Sciences, Kafrelsheikh University, Egypt, for 12 weeks during 2021. The university’s animal care and use committee approved the trial protocol (Number: IAACUC-KSU-2021-01).
2.2 Microwave-assisted ethanolic extraction of C. benedictus leaves
Dried C. benedictus leaf powder (400 g, 0.07 ± 0.01 g water/g dry sample) was well blended, sieved through a 100-mm mesh, and stored in a polyethylene bag until it was used in the extraction process. Next, 12 g of the leaf powder was added to 200 mL of 60% ethyl alcohol solvent (solvent/solid ratio = 16.7) in a 250 mL flask for 90 min. The mixture was then irradiated in a microwave oven (D100N30, Adexa Direct, Ltd., Rugby, England) for 5 min according to published protocol (Mirzapour et al., 2010; Karami et al., 2015). The extraction process was repeated until the required volume was obtained for the entire experiment. The obtained extract was then filtered using Whatman No. 1 filter paper (Whatman Intl., Ltd., Maidstone, UK) before drying using rotatory evaporation at 40°C with reduced pressure for the optimum removal of solvent (BUCHI Rotavapor™, Fisher Scientific UK Ltd., Loughborough, UK).
The Cluj-Napoca Botanic Garden in Romania, voucher specimen 665998 of C. benedictus, was used for analyses. A tested high-performance liquid chromatography mass spectrometry (HPLC-MS) technique was used for the measurement of components (Albu et al., 2017; Paun et al., 2019).
2.3 Experimental design and fish husbandry
A total of 225 mono-sex Nile tilapia fish (12.51 ± 0.14 g/fish; mean ± SE) were arbitrarily allocated to five groups stocked in aquariums (n = 3 tanks per group, 15 fish per tank, and water capacity of 120 L per tank) with a 20% daily water exchange rate. After adaption for 2 weeks and initial body weight measurement, the experimental groups were fed isonitrogenous and isocaloric diets (Table 1) with different dosages of the ethanolic extract of C. benedictus for 10 weeks.
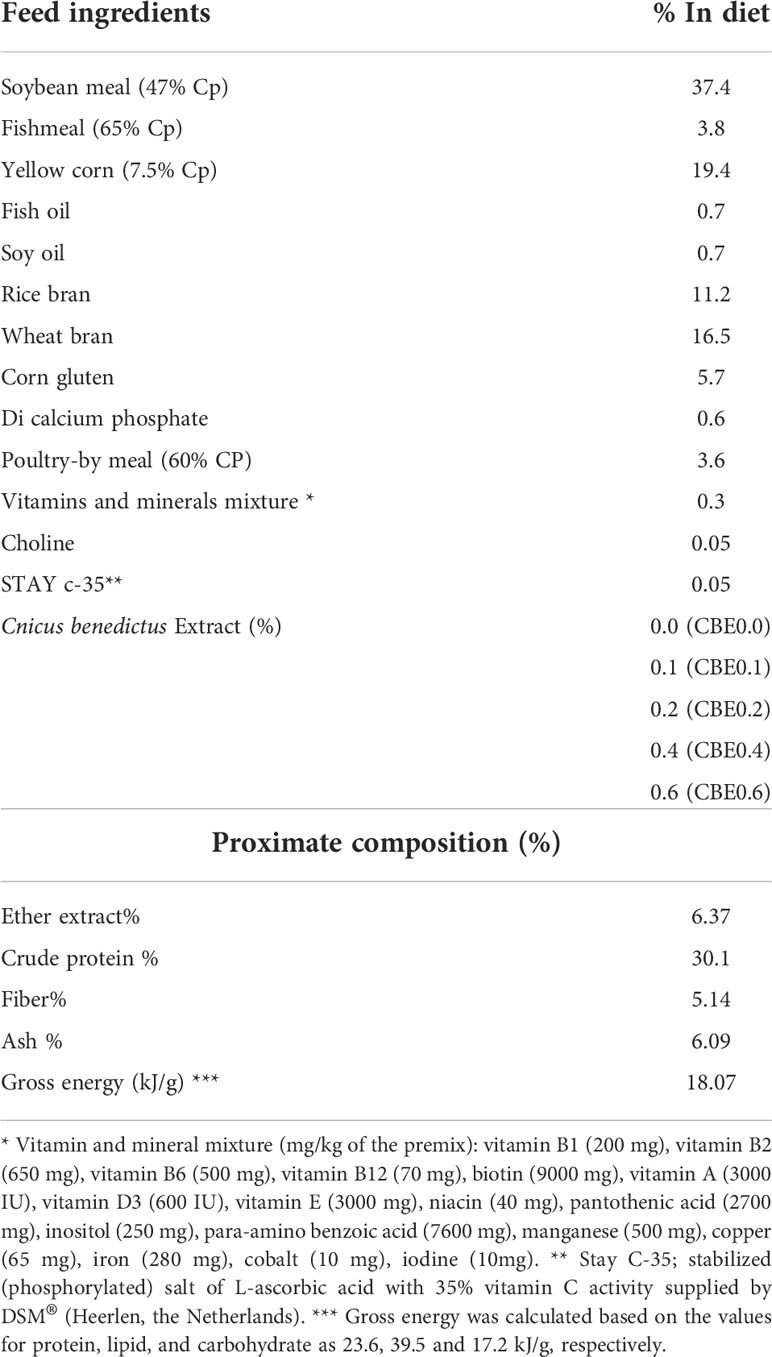
Table 1 Feed ingredients and proximate analysis of the experimental diets.
The five groups were identified as the control group (CBE0.0), which was fed the basal diet, while the second (CBE0.1), third (CBE0.2), fourth (CBE0.4), and fifth (CBE0.6) groups were fed the basal diet supplemented with 0.1%, 0.2%, 0.4%, and 0.6% of C. benedictus extract, respectively, twice daily (08:00 and 16:00 h) to apparent satiation. Water quality parameters were monitored throughout the trial and are reported in Table 2.
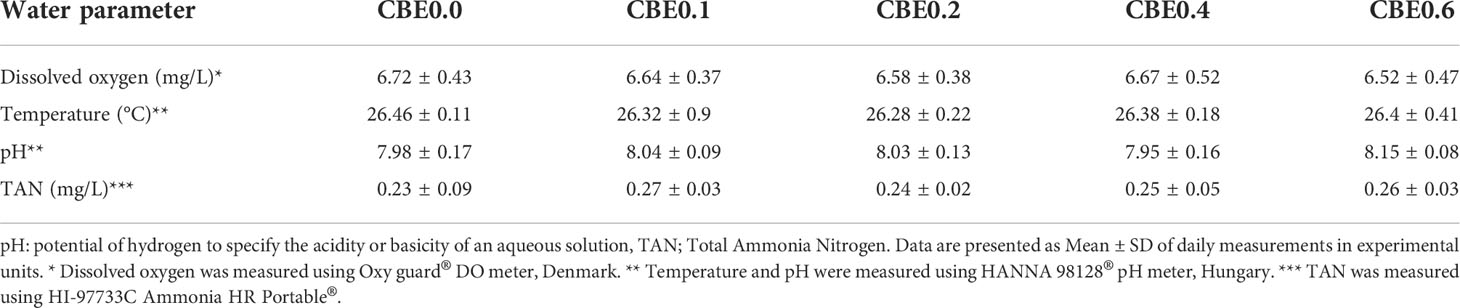
Table 2 Water parameters under experimental conditions.
2.4 Bacterial challenge
To induce the microbial challenge after the 10-week feeding trial, fish were inoculated with PCR-identified pathogenic A. hydrophila, obtained from the Microbiology Research Center, Cairo University. Each fish in the challenged group was intraperitoneally inoculated with 0.2 mL bacterial suspension/fish of 1.3 × 10⁸ CFU/mL of A. hydrophila strain as a sublethal dose to trigger the immune response, following a published protocol (Moustafa et al., 2020). The challenge trial lasted for 15 days with daily monitoring and mortality reporting.
2.5 Fish sampling
Individual fish were weighed to estimate growth parameters at the end of the feeding trial. Five randomly selected fish per group were anesthetized using 150 mg/L MS-222® (Sigma-Aldrich Corp., St. Louis, MO, USA) to obtain blood and intestine samples (Shukry et al., 2022). Blood samples were obtained from the caudal vein using sterile syringes and sub-divided into two parts. The first portion was transferred into a heparinized tube for hematological assays. Simultaneously, the second portion was kept in a 2-mL Eppendorf tube for serum separation to evaluate the total serum proteins (colorimetric Biuret protein assay), albumin (BCG dye-binding colorimetric assay), globulins, triglycerides (coupled enzymatic colorimetric assay), cholesterol (enzymatic rate assay), glucose (hexokinase assay method), ALT (coupled enzyme assay), AST (coupled enzyme assay), creatinine (Cayman’s creatinine colorimetric Assay), and blood urea nitrogen (diacetyl-monoxime colorimetric method) using the standard methods (Arneson and Brickell, 2007). Anterior intestinal samples were dissected for a digestive enzyme assay (amylase and lipase). Five days post challenge, serum samples (three samples/replicate) were collected to evaluate lysosome activity, phagocytic activity (phagocytosis assay), phagocytic index, superoxide dismutase (SOD) activity, and malondialdehyde levels (MDA colorimetric assay).
Additionally, at Five days post challenge, head kidney samples (three samples/replicate) were dissected, transferred into sterile 2-mL Eppendorf tubes, shocked in liquid nitrogen, and maintained at −80°C for further evaluation of the differential expressions of immune genes in interleukin 1 beta (il1b), tumor necrosis factor a (tnfa), heat shock cognate 70-kd protein (hsp70), and toll-like receptor 7 (tlr7). Liver and intestinal samples were fixed for further histological investigation, detailed in section 2.7.
2.6 Growth performance parameters and somatic indices
The following growth parameters were estimated according to Yassine et al. (2021): Weight gain (%) = (Final weight - Initial weight) × 100/Initial weight. Specific growth rate (SGR; % day-1) = (Ln (final weight) - Ln (initial weight) × 100)/t (in days), where Ln is the natural logarithm reading, and duration is 70 days of feeding. Feed Conversion Ratio (FCR) = feed intake (g)/weight gain (g). Protein Efficiency Ratio (PER) = live weight gain (g)/dry protein intake (g).
2.7 Hepatic and intestinal histological analysis
2.7.1 A. Sample collection and fixation
The fish were evaluated histologically at the end of the experimental period. Six fish from each treatment were anesthetized using 150 mg/L MS-222® (Sigma-Aldrich Corp., St. Louis, MO, USA) (Shukry et al., 2022) and sacrificed to collect the intestine and liver for histopathological examination. After each fish was sacrificed, the entire liver and crosss section of the middle intestine were removed, cut to separate them, and preserved in a fixative solution for 24 h.
Samples were fixed using the following three fixatives:
1. Serra’s fixative was utilized to quickly fix samples for light microscopy.
2. Small liver tissue samples were fixed in formal calcium for lipid staining while frozen.
3. The Karnovsky fixative was utilized for transmission electron microscopy (Morris, 1965). This fixative utilized 10 ml of 25% paraformaldehyde, 10 mL of 50% glutaraldehyde, 50 mL of phosphate-buffered saline, and 30 mL of distilled water.
2.7.2 B. Sample preparation and fixation of paraffin-embedding blocks
Samples were fixed using Serra’s fixative. The fixative included 100% ethanol, 40% formaldehyde, and glacial acetic acid in the proportions 60: 30: 10 (Massoud et al., 2021). The fixing time at 4°C was approximately 24 h. The following procedures were used to prepare the samples for light microscopy. The fixed samples were cleaned with 70% ethanol alcohol over 3 days. The samples were dehydrated with ethanol alcohol (80% for 1 h, 90% for 1 h, 100% I and 100% II for 30 min each). They were then cleaned for two days each in methyl benzoate I and II. Each paraffin paraplast change, paraffin I, paraffin II, and paraffin III, took 1 h to embed. Each paraffin-embedded block was cut into 5–7-µm slices and mounted on glass slides (Leica RM2125 Microtome, Leica Biosystems, Inc., Nussloch, Germany). The slides were kept dry and maintained in a 40°C incubator.
2.7.3 C. Histochemical staining on paraffin sections
This study employed a variety of strains, including Periodic acid–Schiff reaction, Alcian blue (pH 2.5) (PAS), and Sudan Black B stains. These staining protocols were conducted according to published procedures (Suvarna et al., 2013). Mercury bromophenol blue for total protein stain was conducted as described by Naik (2002).
2.7.4 D. Alkaline phosphatase and lipase enzyme histochemistry
Both alkaline phosphatase and lipase enzyme histochemistry were conducted on frozen sections using the following method. A 0.5-cm3 sample from the liver and intestine was obtained. After formal calcium fixation, materials were soaked in an optimal cutting temperature compound (OCT compound) overnight in a refrigerator at 4°C, then stored at −20°C for cryosectioning. Histochemistry staining for alkaline phosphatase and lipase enzymes in the liver and histochemistry in the intestine was conducted as described by (Suvarna et al., 2013).
2.7.5 E. Acridine orange dye used to stain paraffin-cutting sections
Acridine orange is a cationic dye that can identify secretory vesicles and acidic lysosomes through staining of protein-containing membranous vesicles including membrane-bound acidic compartments. The metachromatic reaction of Acridine orange relates to the liberation of green and red fluorescence and combines with membrane-bound vesicles to produce orange or red colors. The method is based on previous findings, (Hoff et al., 1985) with modifications (Abd-Elhafeez et al., 2021), and the Acridine orange staining and the staining process have been detailed by El-Sherry et al. (2022) and Soliman et al. (2022a).
2.7.6 F. Semi-thin and ultra-thin section sample processing for transmission electron microscopy
Approximately 1-cm3 specimens from the intestine were used for semi-thin sections 1–2 mm in length, which were fixed overnight at 4°C using Karnovsky’s fixative (Karnovsky, 1965). These were processed according to Anwar et al. (2021) and Soliman et al. (2022).
Toluidine blue was used to stain semi-thin sections (1 mm) cut with an ultramicrotome Ultracut E (Leica Biosystems, Inc., Nussloch, Germany) (Suvarna et al., 2013). In the electron microscopy unit of Assiut University, ultrathin sections of the ileum were obtained using an ultramicrotome (ibid) stained with uranyl acetate and lead citrate (Reynolds, 1963) and examined using JEOL 100CX II transmission electron microscopy (TEM) (Georgia Institute of Technology, Atlanta, GA, USA).
2.7.7 G. Measurements of histomorphometric characteristics in the intestine and liver
Various histomorphometric features, such as villus height and width, enterocyte heights, migratory leucocytes, and the number of goblet cells in a villus, were measured using light microscopic semi-thin images of the intestines from three fishes from each group. The microvilli length was determined using TEM images. Various histomorphometric features, such as the hepatocyte and the nucleus areas, were measured on semi-thin images of the liver using light microscopy. Measurements were evaluated using Image J (http://fiji.sc/Fiji).
2.8 RNA extraction, cDNA synthesis, and quantitative real-time PCR assay
Total RNA from head kidney samples (5 days post-challenge) was extracted from 100 mg of tissue using the TRIzol reagent (iNtRON Biotechnology, Seongnam-Si, Korea) following manufacturer instructions. The quality and quantity of the RNA yield were confirmed using NanoDrop™ 2000/2000c spectrophotometers (Thermo Fisher Scientific, Waltham, MA, USA). The quality of extracted RNA was evaluated based on the A260/A280 ratio, followed with integrity assurance by electrophoresis, in which randomly selected RNA samples were run on a denaturing agarose gel stained with ethidium bromide (EtBr). The presence of sharp and clear molecular bands of 28S and 18S rRNA and the observation that the 28S rRNA band was approximately twice as intense as those of the 18S rRNA were substantiating evidence of extract integrity.
For cDNA synthesis, 2 μg of total RNA from each sample was reverse-transcribed using cDNA synthesis (iNtRON Biotechnology, Seongnam-Si, Korea) according to manufacturer procedures. Gene expression profiling was conducted in a Mic-qPCR thermocycler (Bio-Molecular Systems, Upper Coomera, Australia) with a 25-μl reaction volume. The qPCR mix contained 12.5 μl of 2× SYBR Green/no-ROX rtPCR master mix (SensiFAST cDNA kit, Bioline AgroSciences, Ltd., Little Clacton, UK), 2 μl of cDNA template, 1 μl of the forward primer, and 1 μl of the reverse primer with 8.5 μl of nuclease-free water. The gene-specific primers were designed using the online software Primer3 (Untergasser et al., 2012) (Table 3). The qPCR reaction involved preliminary denaturation at 95°C for 10 min, followed by 40 cycles of 15 s each at 95°C, 35 s at the specific annealing temperature as detailed in Table 3, and an extension of 20 s at 72°C. To ensure primer specificity, a melt curve with 0.5°C increments in the temperature range of 65°C–95°C was performed at the end of the qPCR reaction. The amplification efficiency was estimated based on the qPCR slope using the formula: E = 10−1/Slope (Rasmussen, 2001). Normalization of qPCR data was performed using the geometric averaging of the two reference genes used in this study: cell division cycle 34 homolog gene (cdc34) and beta actin gene (actb) to calculate the fold change accurately. The relative expression of the target genes was calculated comparing to the expression of internal control genes (Pfaffl, 2001).
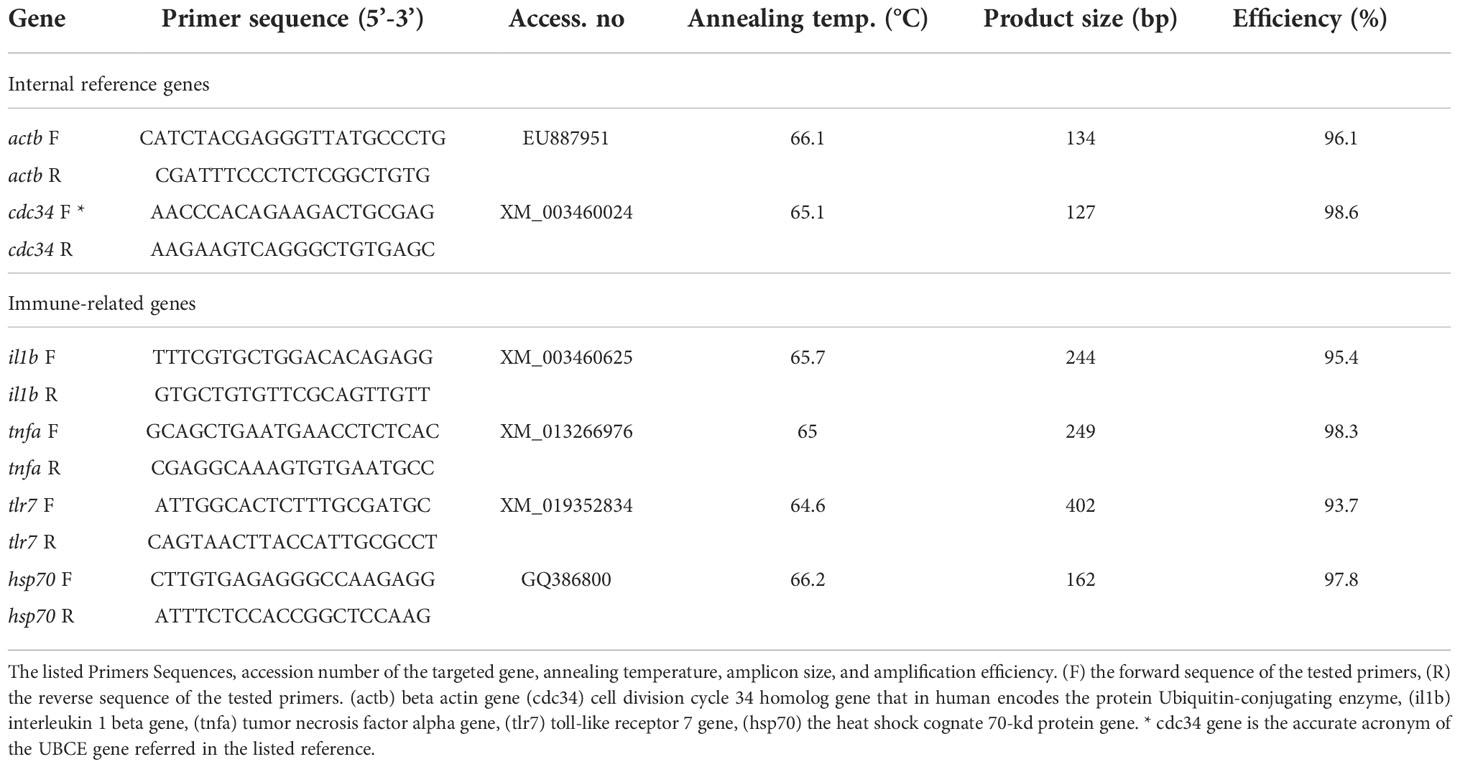
Table 3 Primers Sequences and qRT-PCR conditions.
2.9 Statistical analysis
Data were expressed as mean ± standard error of the mean. Prior to analysis, data were tested for normality and variance homogeneity using Shapiro–Wilk’s and Levene’s tests, respectively (p <.05). The growth performance data, biochemical analysis, relative gene expression, and histomorphometric measurements were analyzed using one-way ANOVA, followed by Tukey’s multiple comparison test (p <.05) to evaluate the differential response of experimental groups to the tested dosages of CBE in terms of mean differences. Pre- and post-challenge hematological data were subjected to two-way ANOVA with Tukey’s multiple comparison test (p <.05) to demonstrate the effect of CBE dosage, infection, and their interaction on the hematological performance of the fish. Quadratic polynomial regression analysis was conducted to interpolate the optimum supplementation levels of CBE for growth and immune performance (Ghalwash et al., 2022). The survival data distribution from the challenge trial was evaluated using Kaplan–Meier curves (Mantel-Cox test) during the 2-week challenge period, as well as the significance differences between groups at p <.05. The statistical analysis was conducted using GraphPad Prism (version 9.1, GraphPad Software, San Diego, CA, USA).
3 Results
3.1 Effects on body weight and feed utilization
Results revealed that there was a significant increase (p <.01) in final body weight, weight gain, and the specific growth rate, as well as in PER in the treated groups compared with the control group, with a noticeable increase in treated group 3 (CBE0.2) body weight. Among the treated groups, a significant reduction in FCR was seen compared with the control, as shown in Table 4. Polynomial-regression-based interpolation of the growth performance in terms of final body weight (FBW) and protein efficiency rate (PER) revealed that the optimum growth enhancing dosage was 0.31%–0.32% of CBE in Nile tilapia feed (Figure S1).
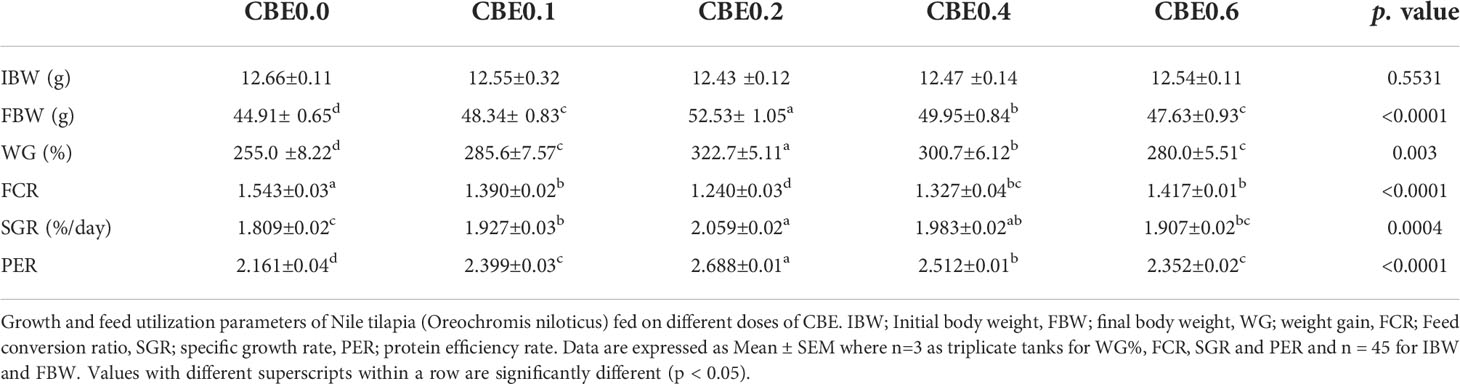
Table 4 Growth and feed utilization parameters of Nile tilapia (Oreochromis niloticus) fed on different doses of for 10 weeks.
3.2 Hematological and biochemical parameters effects
Table 5 shows that in the pre-infection challenge there were significant increases in the RBC count in group 3 compared with the other treated groups. There were no significant changes pre- or post-infection observed for Hb concentration, PCV, MCV, or MCH. In the post-infection challenge, there were substantial increases in the total leukocyte count in group 3 and group 4 relative to the other treated groups. Additionally, there were significant increases in the lymphocyte concentrations in groups 3, 4, and 5, in addition to other treated groups, as shown in Table 5. Table 6 shows that there were significant increases in the total protein in groups 3 and 4 compared with the other treated groups, and there were substantial decreases in the glucose and cholesterol levels in group 5 relative to the other treated groups, with no significant variation seen in the different treated groups relative to the control. Additionally, Table 6 shows that there were substantial decreases in the AST, ALT, creatinine, and urea nitrogen in groups 4 and 5, relative to the other treated groups.
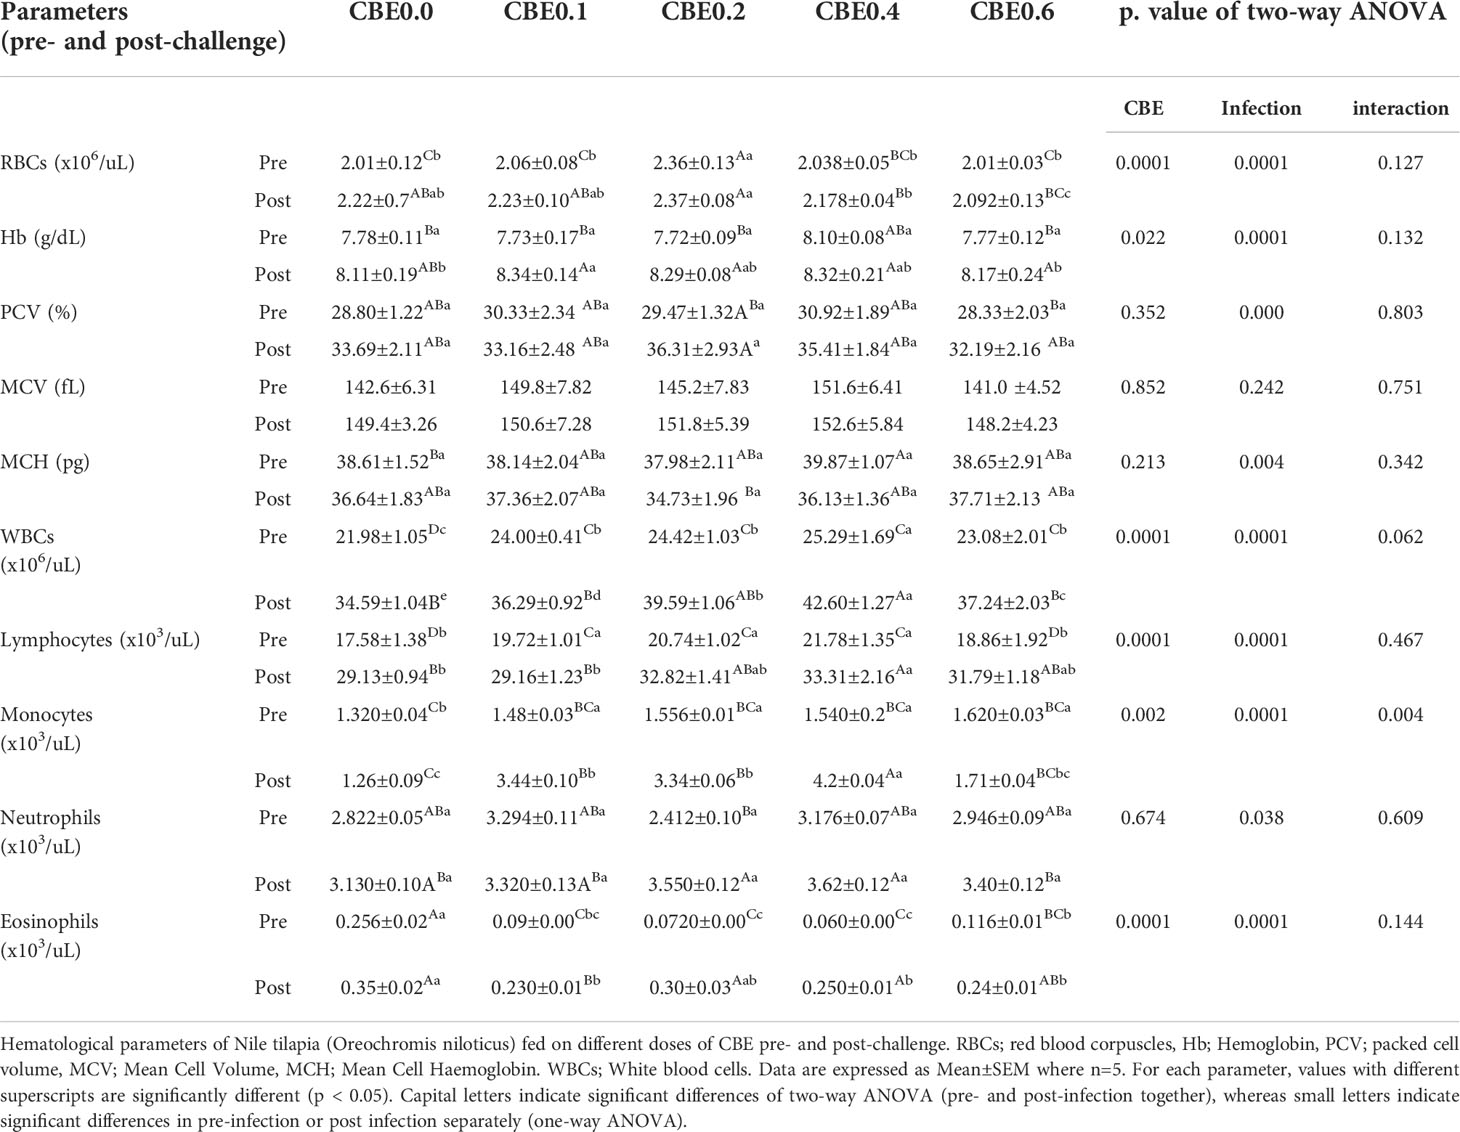
Table 5 Hematological parameters of Nile tilapia (Oreochromis niloticus) fed on different doses of CBE for 10 weeks pre- and post-challenge.
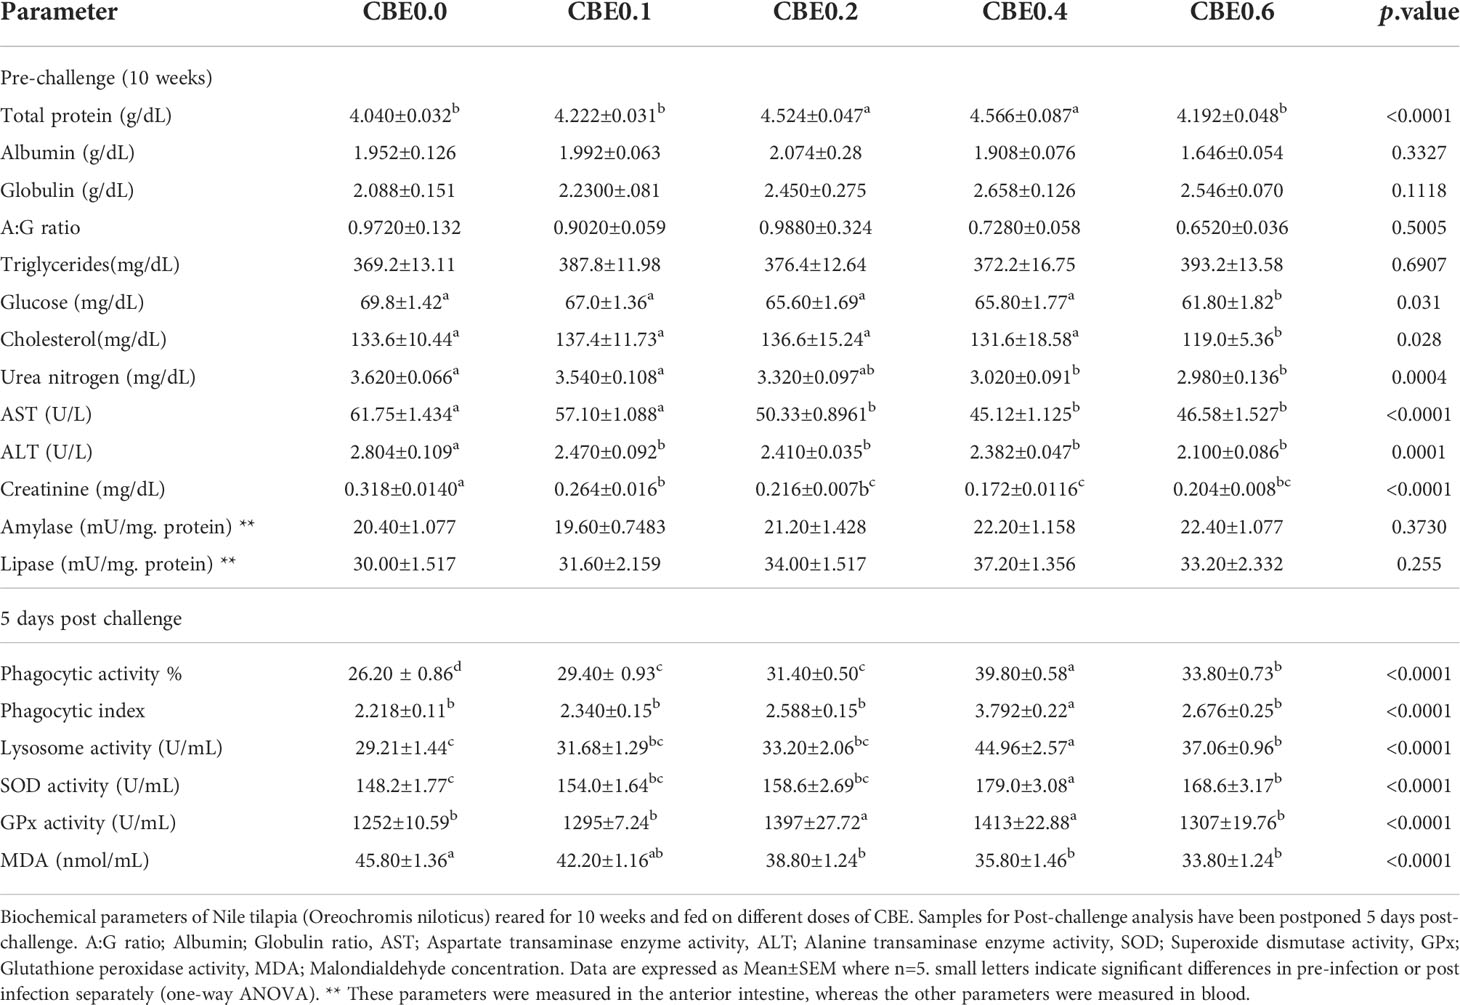
Table 6 Biochemical parameters of Nile tilapia (Oreochromis niloticus) reared for 10 weeks and fed on different doses of CBE.
Post-challenge results revealed significant increases in the phagocytic activity and index in the treated groups compared with the control, with substantial increases observed in the lysosomal activity in the treated groups and noticeable gains in groups 4 and 5. SOD activity significantly increased in groups 4 and 5 compared with the other treated groups. In contrast, glutathione peroxidase (GPx) activity showed substantial increases in groups 3 and 4, and a decreased level of MDA was seen in treated groups relative to the control.
Polynomial-regression-based interpolation of immune performance in terms of white blood cell count, lymphocytic count, and immunoglobulins, and phagocytic, lysosome, and superoxide dismutase activities revealed that the optimum immune-performance dosage was 0.42%–0.47% CBE in Nile tilapia feed (Figure S1).
3.3 Cumulative survival percentage
Figure 1 shows that the cumulative survival percentage increased significantly in group 4, followed by group 5. These were followed by group 3 and group 2 when compared to the control group at 15 days post challenge.
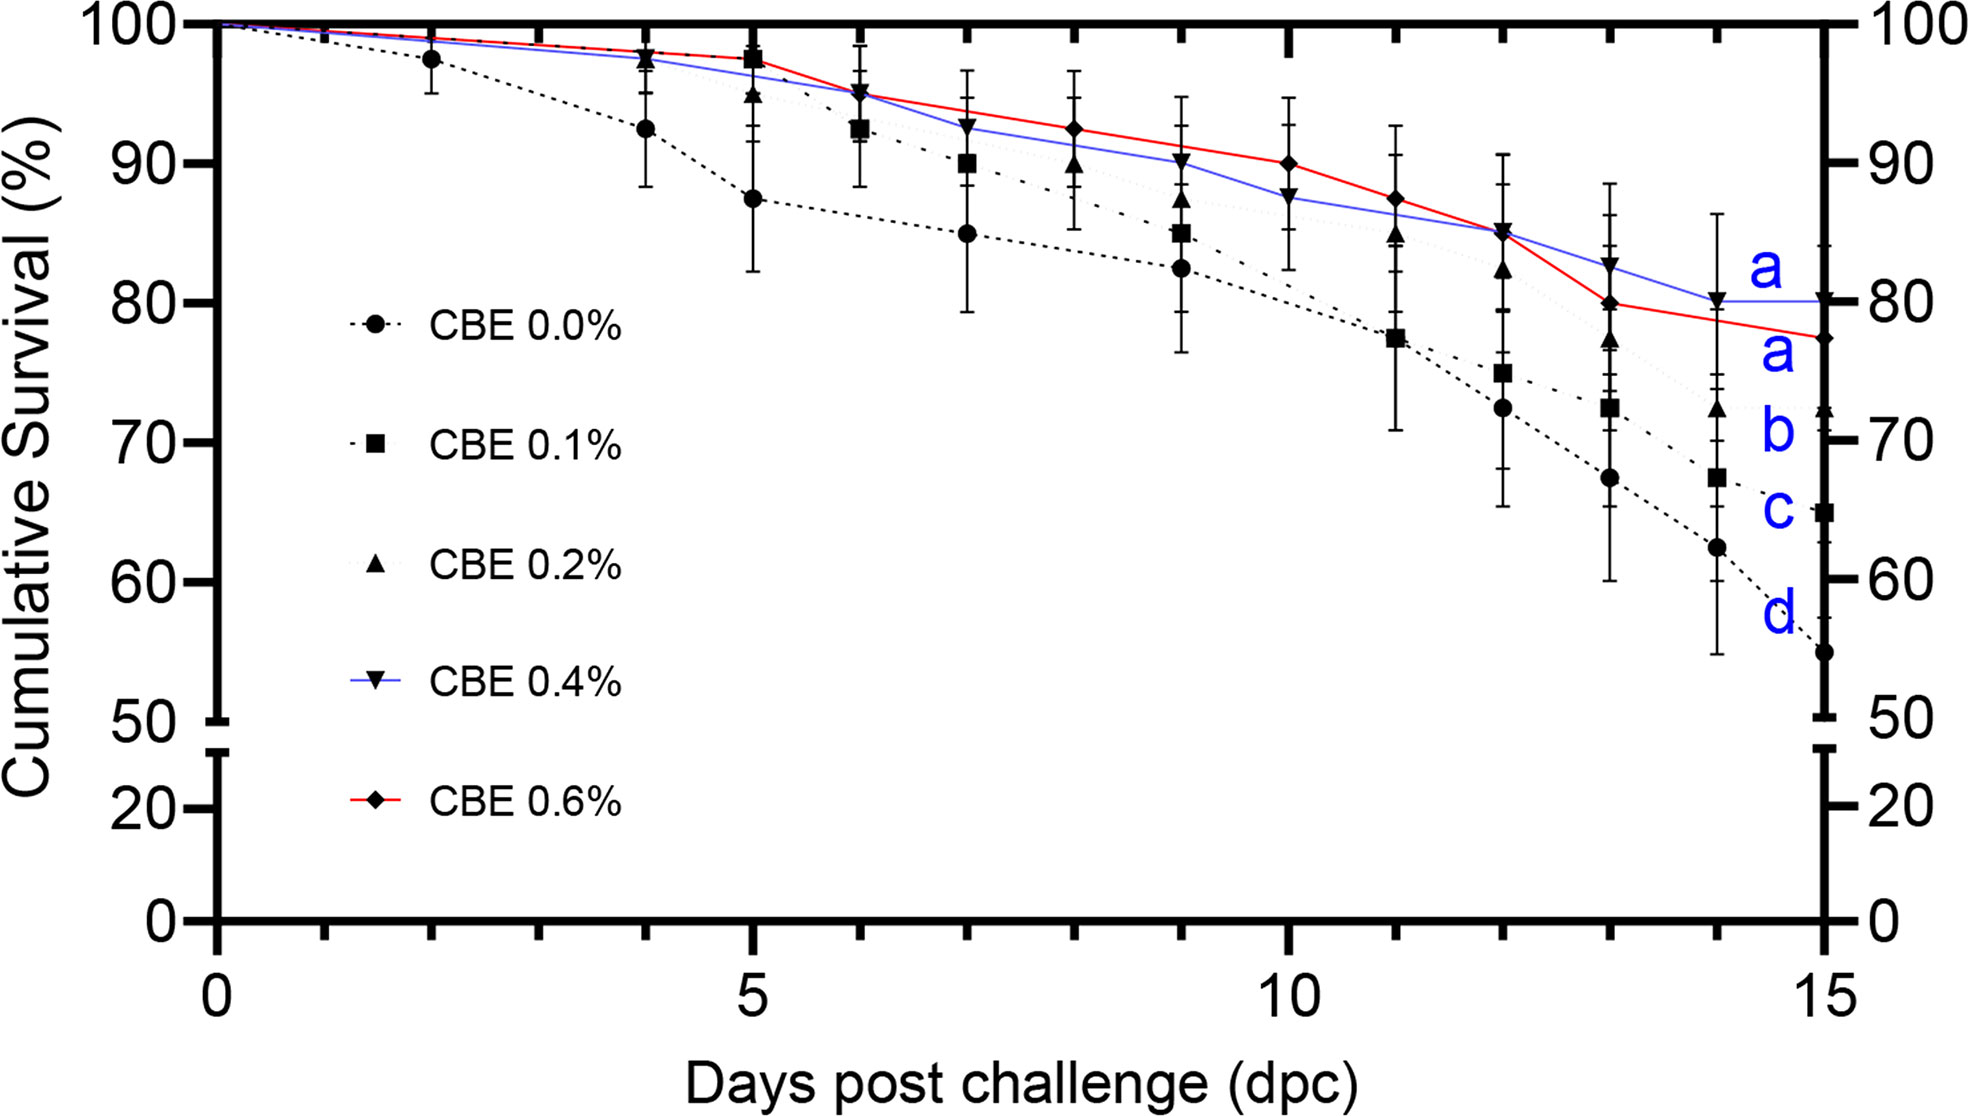
Figure 1 The cumulative survival analysis in Nile tilapia groups fed different doses of CBE along 2 weeks post challenge with Aeromonas hydrophila, represented by Kaplan–Meier regression curves. Significance letters (a, b, c, and d) demonstrate the significantly different survival percent (p < 0.05) at the end of the challenge trial.
3.4 Gene expression
Data showed a significant upregulation in the mRNA expression of il1b (2.7- to 5.2-fold dose-dependent upregulation) and tnfa (4.3- to 6.8-fold dose-dependent upregulation) five days post challenge in the treated groups compared with the control, and substantial increases were observed in groups 4 and 5 compared with the other groups. hsp70 and tlr7 mRNA expression showed significant upregulation in the treated groups compared with the control five days post infection, up to seven- and five- fold increases, respectively, without an evident dose-dependent upregulation manner (Figure 2).
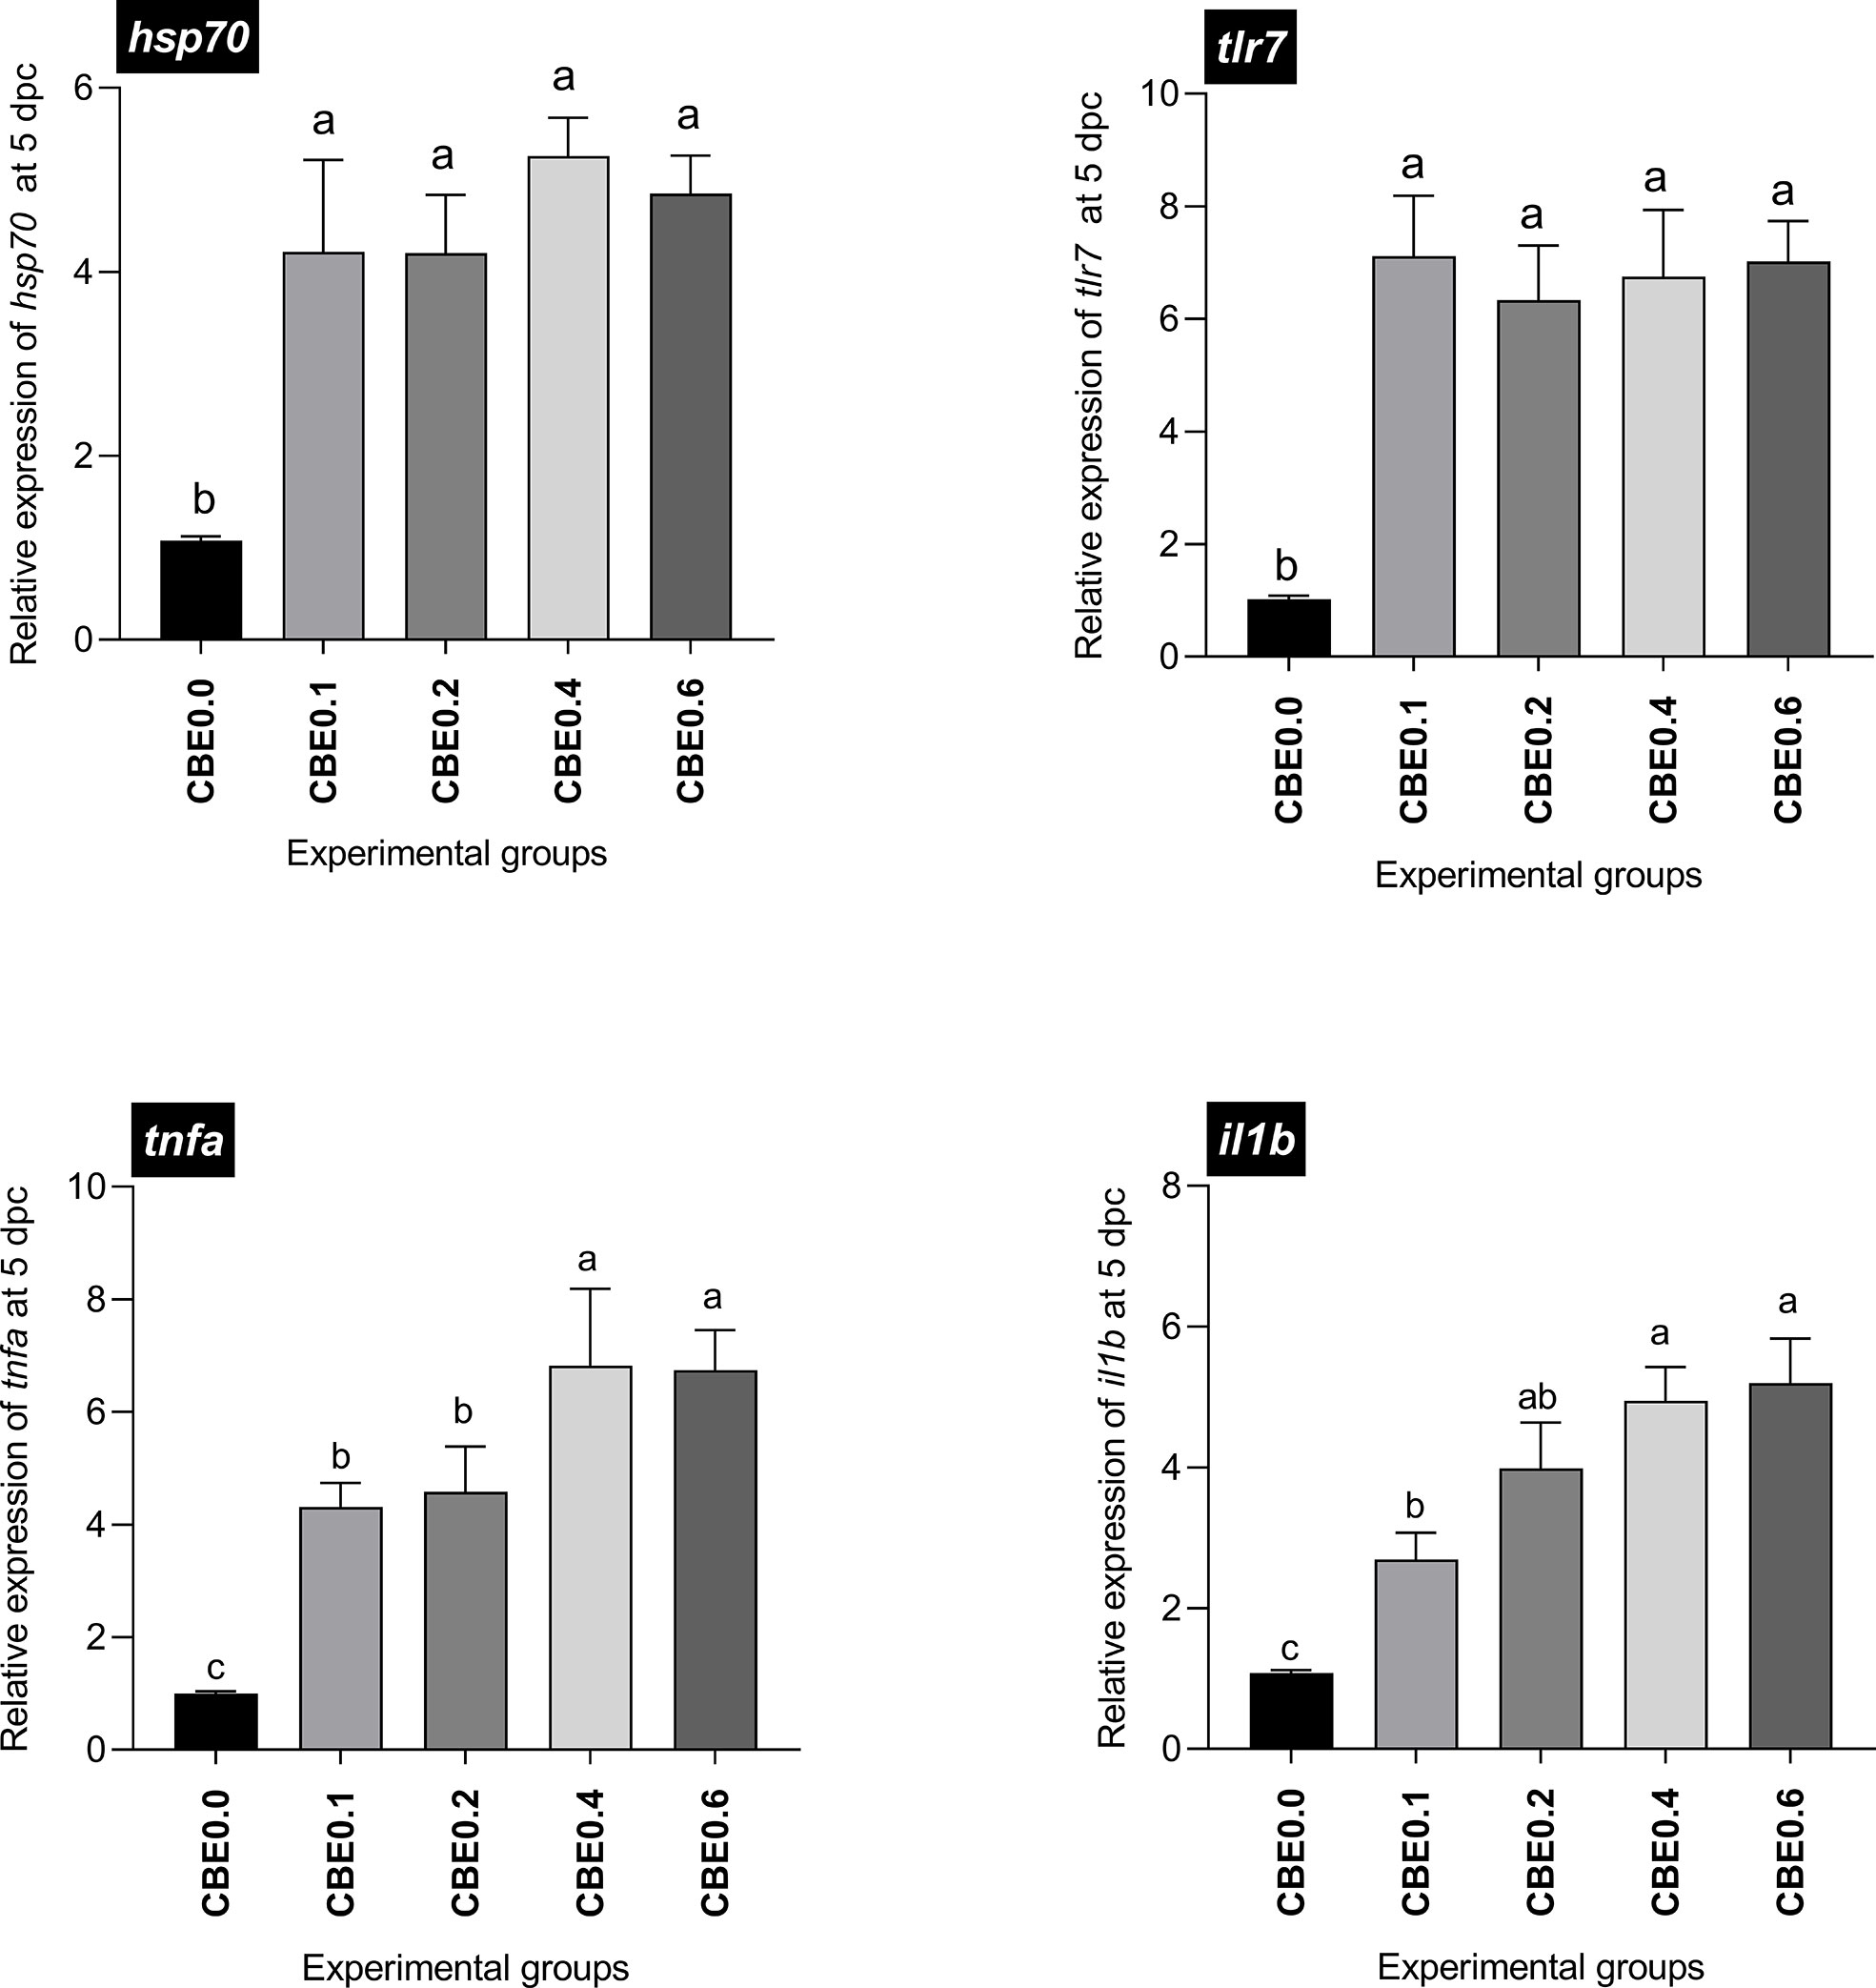
Figure 2 Differential expression of immune-related genes in Nile tilapia groups fed different doses of CBE for10 weeks, sampled at 5 days post challenge with Aeromonas hydrophila. il1b, Interleukin 1 beta; tnfa, tumor necrosis factor alpha; tlr7, toll like receptor-7; hsp70, the heat shock cognate 70-kd protein. Columns (experimental groups) with different superscript letters in the same figure are significantly different (p ≤ 0.05).
3.5 Histopathological examination of intestine and liver
A. Intestine
Light microscopy investigation
The histological pattern of the intestinal structures was close to the standard in all the experimental groups, indicating no inflammation. Using paraffin sections and semi-thin sections, the height of intestinal villi and enterocytes lining the middle intestine were found to have increased in the treated groups in response to various CBE dosages compared with control samples (Figures 3, 4). The number of migratory leucocytes within the enterocytes and absorbed lipoids also increased in the enterocytes of the treated groups (Figure 3). Goblet cells increased in the treated groups compared with the control group (Figure 4).
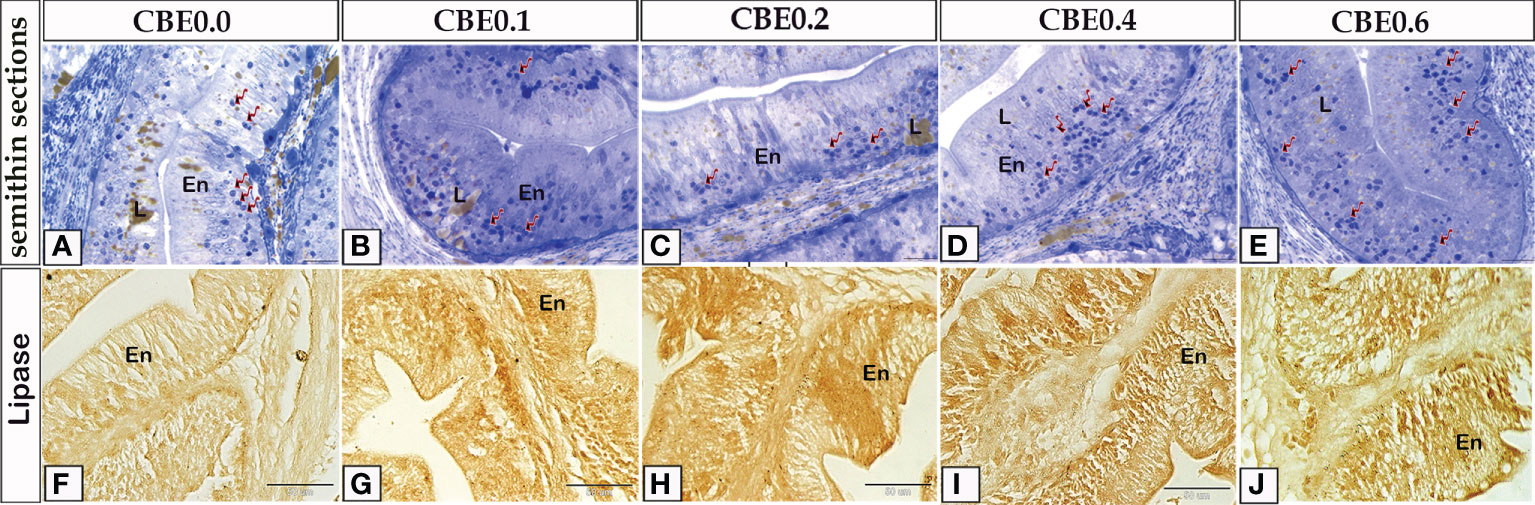
Figure 3 Semithin sections (A-E) stained with toluidine blue and frozen sections (F-J) stained with lipase enzyme histochemistry revealed the variation of enterocytes high lining the middle intestine in response to feeding on varied CBE dosages. (A-E) The height of enterocytes (En) increased in the treatment groups as compared to the control group. Inside the enterocytes, there is an increase in migratory leucocytes (arrows) and lipid (L) content. (F-J) increased lipase enzyme staining in enterocytes of treated groups vs. the control group.
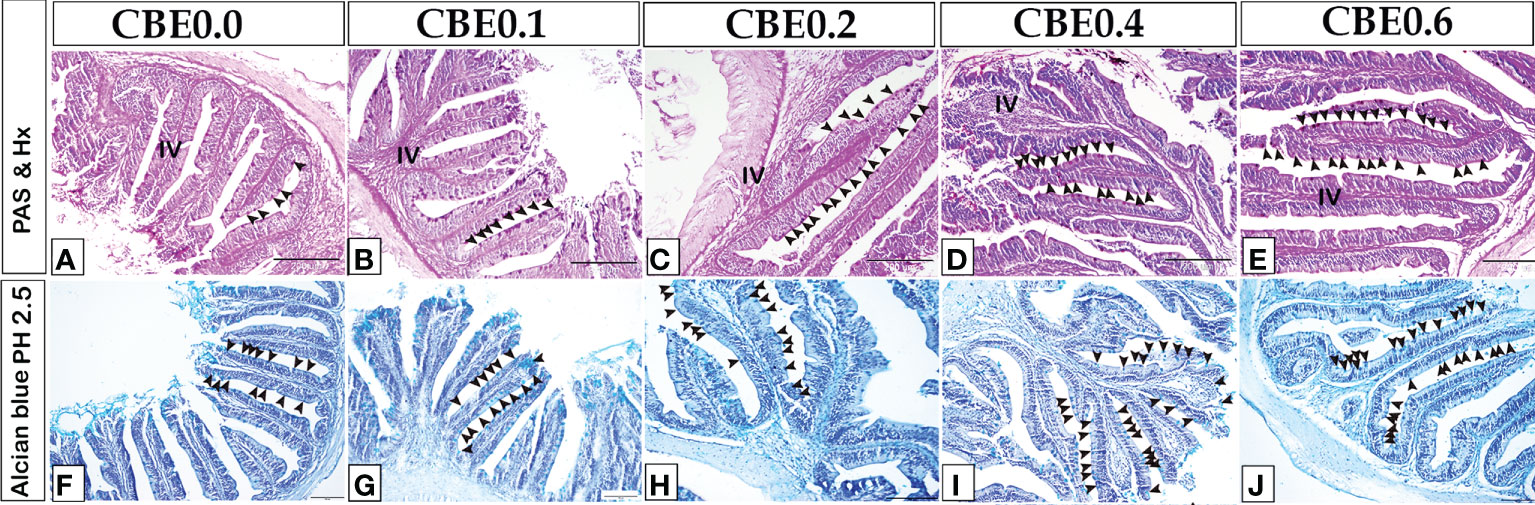
Figure 4 The number of goblet cells and the height of intestinal villi increased in response to various CBE dosages, as shown by paraffin sections of the middle intestine stained with PASHX (A–E) for neutral mucin in goblet cells and Alcian blue pH 2. 5 (F-J) for acid mucin inside the goblet cell.
Transmission electron microscopy investigation
According to TEM analysis, enterocytes from control samples contained a little smooth endoplasmic reticulum and small amounts of lipids, mitochondria, and endocytotic vesicles. The link between them was the Occulden Junction (Figures 5A, B, 6A, B, 7A). Group I enterocytes have a different ultrastructure, with smoother endoplasmic reticulum and mitochondria (Figures 5C, D, 6C, D). Group II enterocytes showed greater lipid absorption and well-developed smooth endoplasmic reticulum. The number of migratory leucocytes was seen to have increased, and mitochondria increased in the cytoplasm of enterocytes. The smooth endoplasmic reticula, which appeared as concentric lamellar bodies, surrounded lipid droplets (Figures 5E, F, 6E, F). Group III enterocytes had more mitochondria, smooth endoplasmic reticula, and endocytotic vesicles than group II. The number of migratory leucocytes were increased (Figures 5G, H, 6G, H), and compared with group IV, group VI enterocytes had more mitochondria, smooth endoplasmic reticula, and endocytotic vesicles (Figures 5I, J, 6I, J).
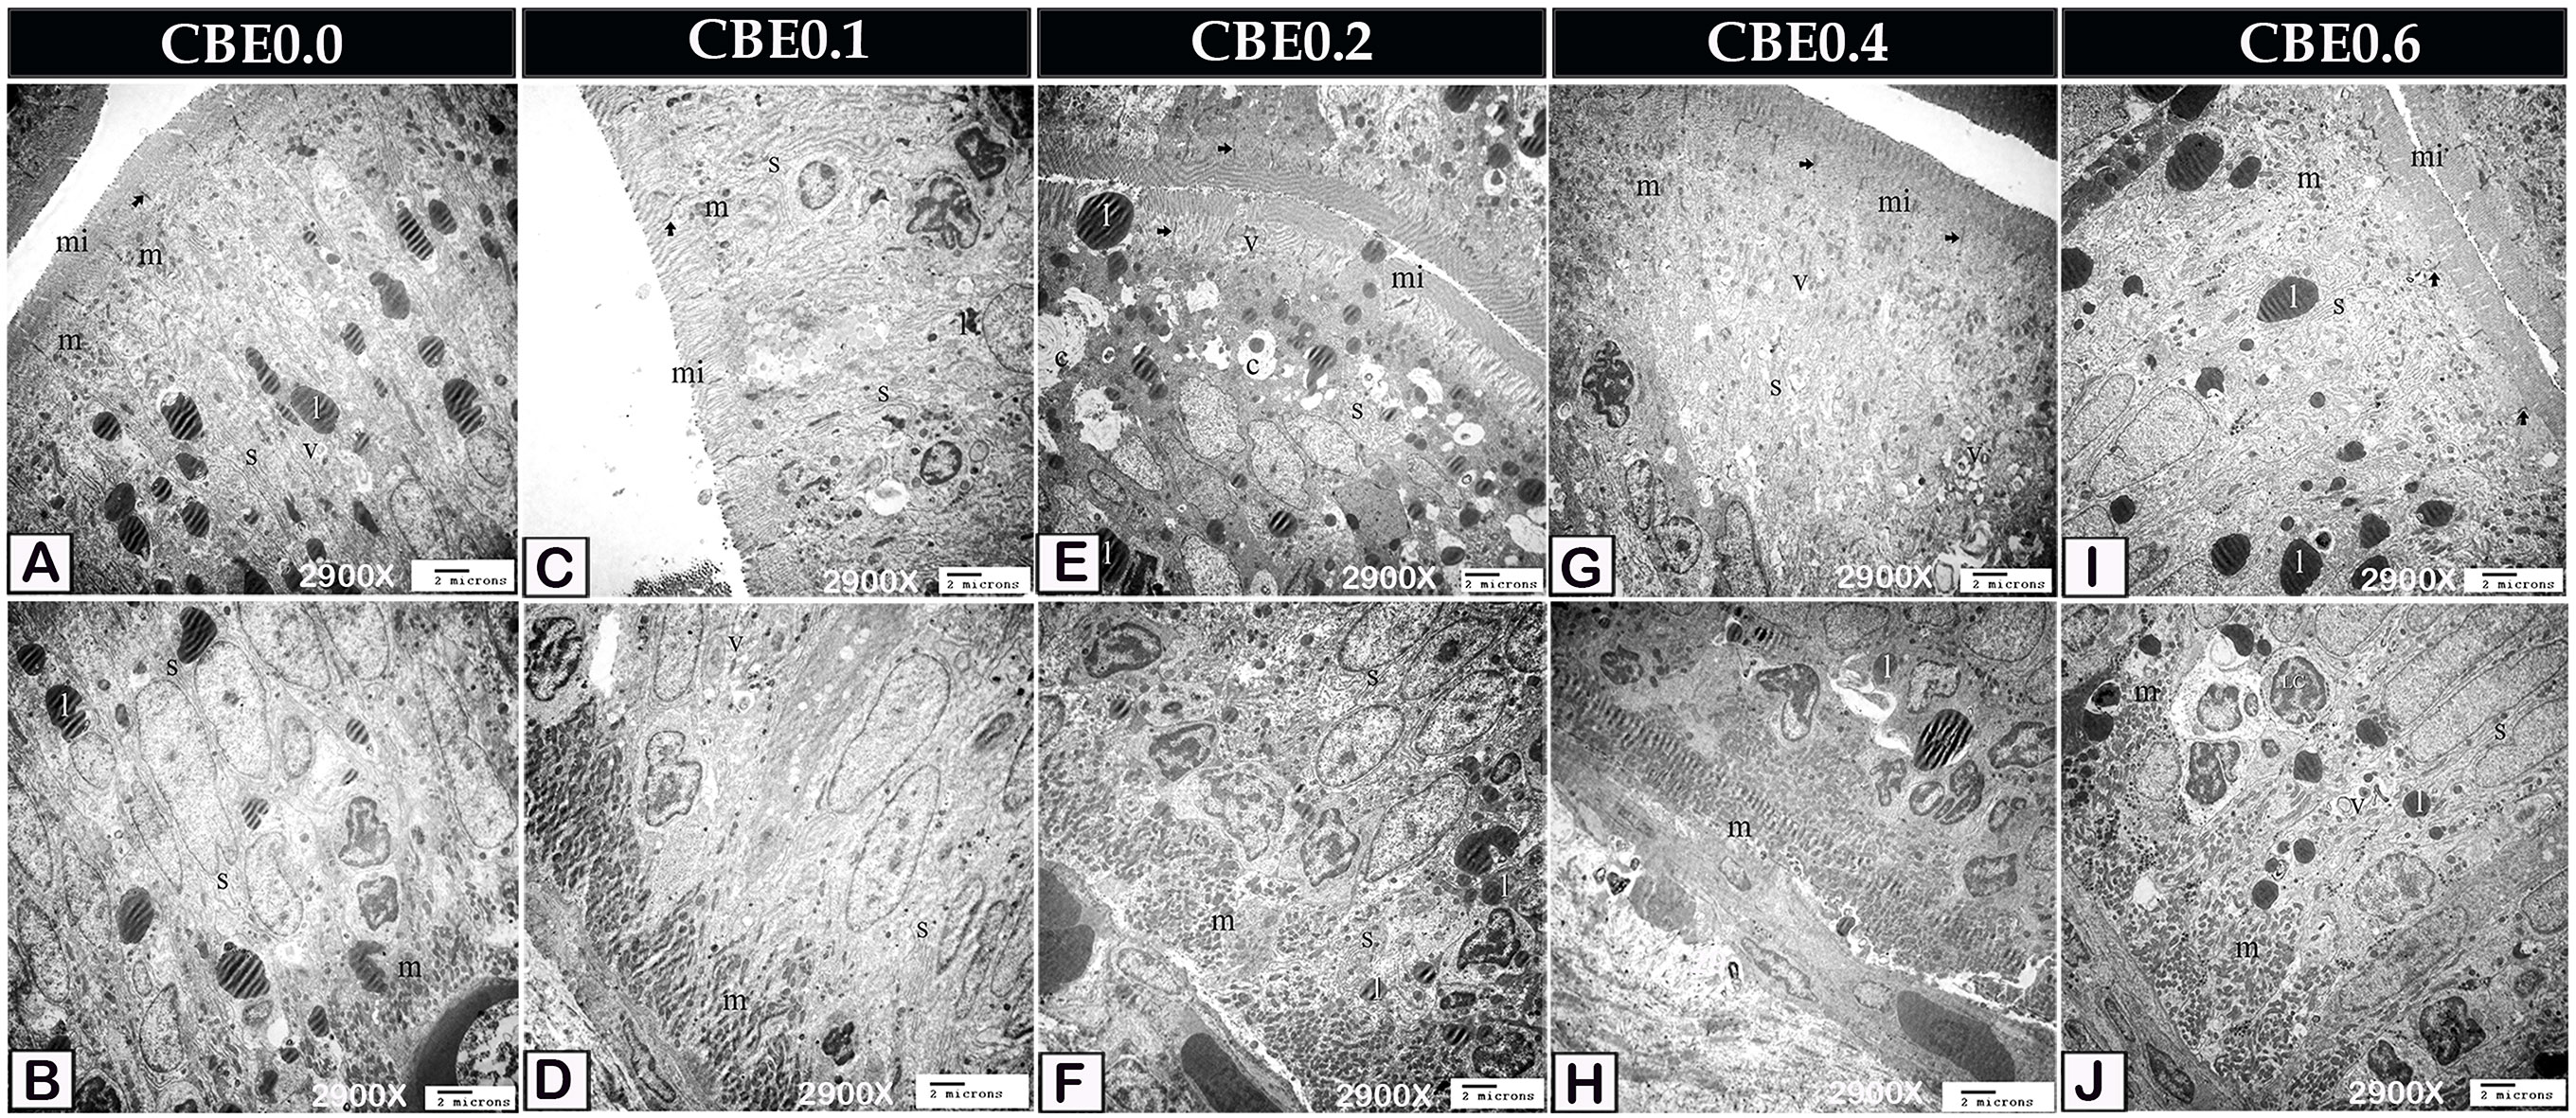
Figure 5 Transmission electron micrograph showing ultra-structural changes of the enterocytes in response to feed on different doses of CBE. (A, B) The smooth endoplasmic reticulum (s), a little amount of lipid (l), mitochondria (m), and endocytotic vesicles were found in control enterocytes (v). Note the occulden junction (arrow), as well as the microvilli (mi). (C, D) Group I enterocytes have ultrastructure modification, with smoother endoplasmic reticulum (s) and mitochondria (m). Endocytotic vesicles (v), lipid (l), occulden junction (arrow), microvilli (mi) (v). (E, F) Enterocytes in group II absorbed a significant amount of lipid (l) and had a well-developed smooth endoplasmic reticulum (s). Increase migrating leucocytes (LC). The lipid droplet was enveloped in concentrated lamellar bodies by smooth endoplasmic reticulum (c). In the cytoplasm, mitochondria were detected in greater densities. Microvilli, endocytotic vesicles (v), and the occulden junction (arrow) are all apparent (mi). (G, H) Migratory leucocytes increased mitochondria (m), smooth endoplasmic reticulum (s), and endocytotic vesicles (v) in the enterocytes of group IV (LC). Take note of the occulden junction (arrow). (I, J) Compared to group enterocytes, group VI had more mitochondria (m), smooth endoplasmic reticulum (s), and IV, endocytotic vesicles (v). Increase the number of migratory leucocytes (LC). Take note of the occulden junction (arrow).
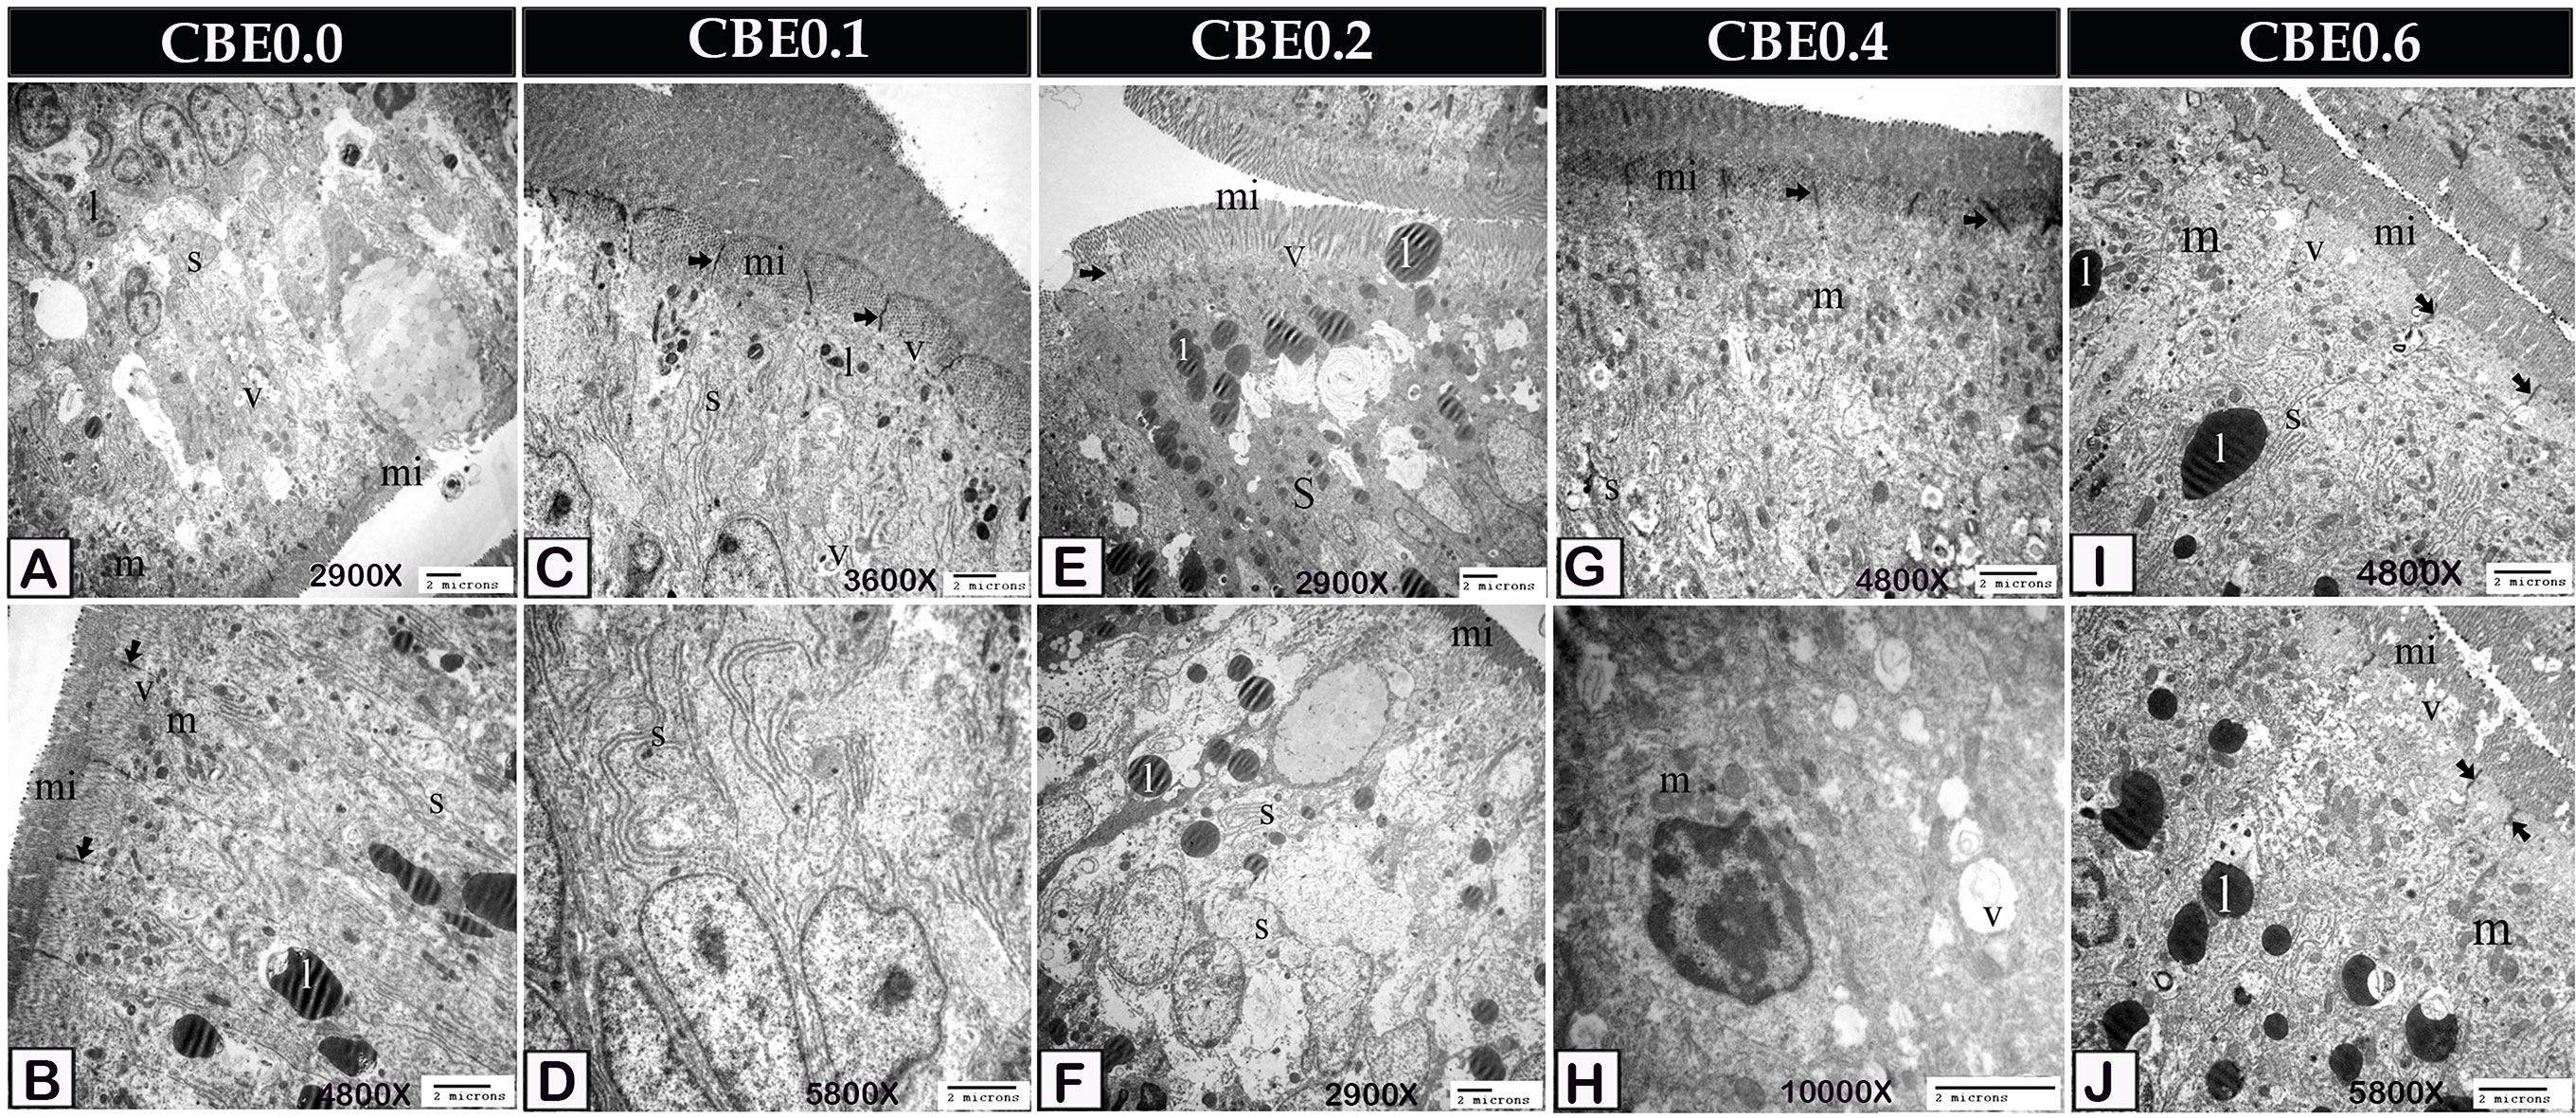
Figure 6 Transmission electron micrograph showing ultra-structural changes of the enterocytes in response to feeding on different doses of CBE. (A, B) Enterocytes of control samples contained the smooth endoplasmic reticulum (s), a small amount of lipid (l), mitochondria (m), endocytotic vesicles (v). Note the occulden junction (arrow), microvilli (mi). (C, D) Enterocytes of group I exhibited morphological changes. The smooth endoplasmic reticulum (s) became more prominent and increased the absorption of lipid (l). Note the occulden junction (arrow), microvilli (mi), endocytotic vesicles (v). (E, F) Enterocytes of group II had a large amount of absorbed lipid (l) and well-developed smooth endoplasmic reticulum (s). Note the occulden junction (arrow), microvilli (mi), endocytotic vesicles (v). (G, H) Enterocytes of group IV increased the mitochondria (m), smooth endoplasmic reticulum (s), and endocytotic vesicles (v). Note the occulden junction (arrow). (I, J) Enterocytes of group VI increased the mitochondria (m), smooth endoplasmic reticulum (s) and endocytotic vesicles (v) compared to group IV. Note the occulden junction (arrow).
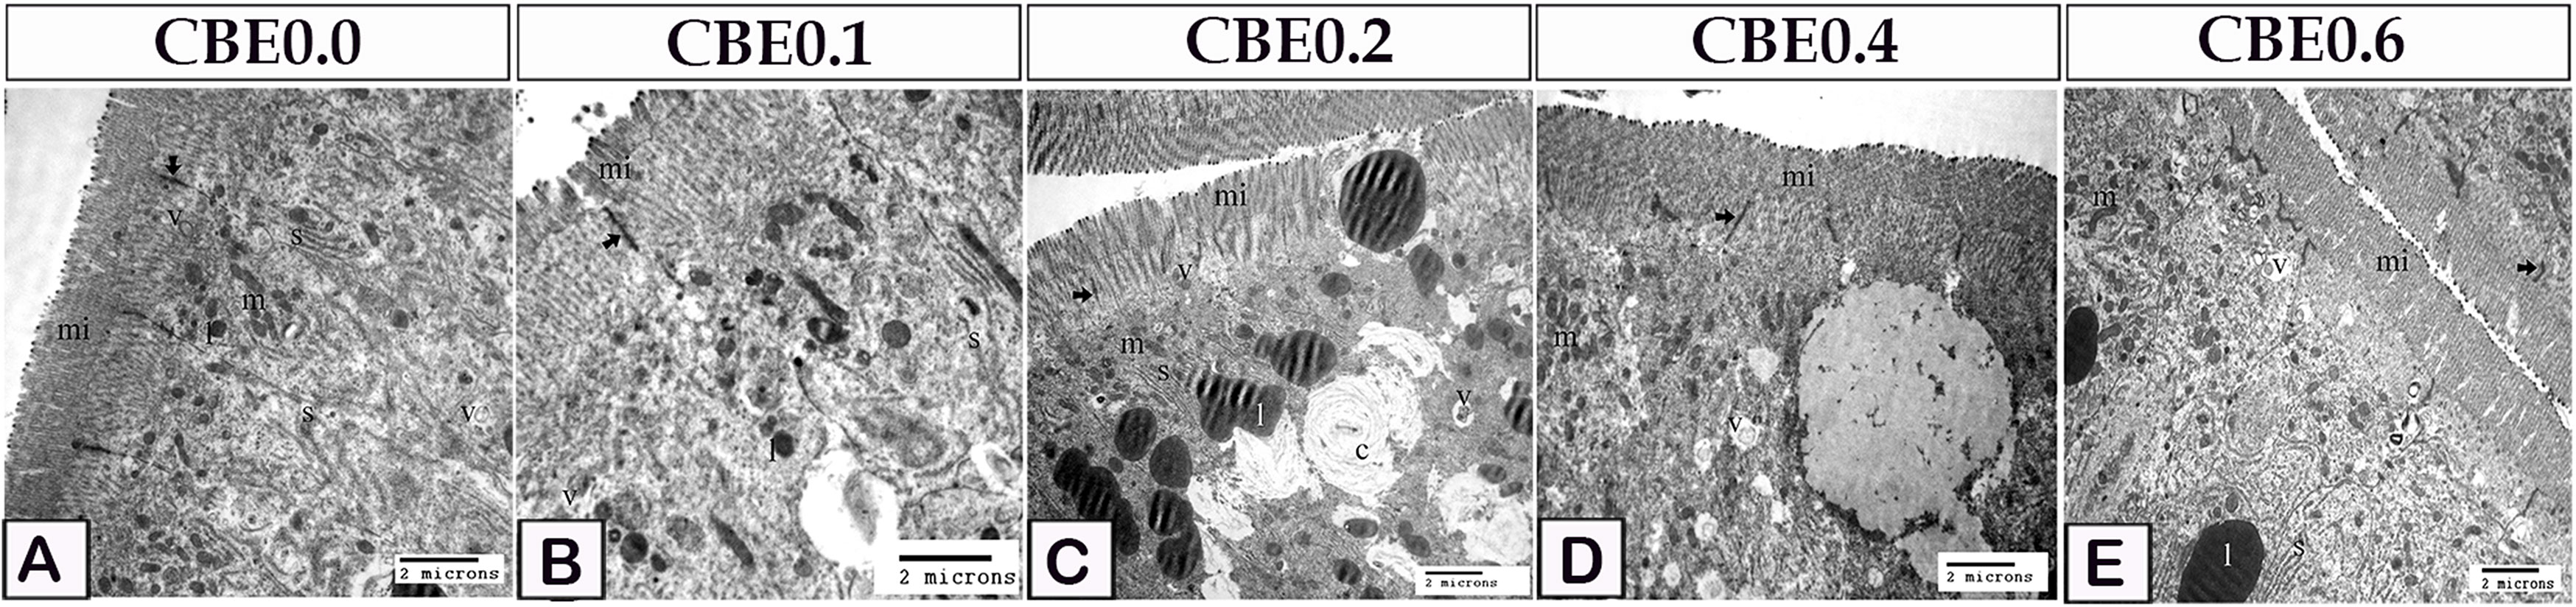
Figure 7 Transmission electron micrograph showing microvilli modifications in response to feed on different doses of CBE. (A) The smooth endoplasmic reticulum (s), lipid (l), mitochondria (m), and endocytotic vesicles (v) were seen in control enterocytes. Note the occulden junction (arrow), as well as the microvilli (mi). (B) Microvilli (mi) height increased in group I enterocytes. Endocytotic vesicles (v), lipid (l), mitochondria (m), and smooth endoplasmic reticulum occulden junction (arrow). (C) Microvilli height was higher in group II enterocytes than in group (I) Concentric lamellar bodies (c) composed of smooth endoplasmic reticulum which enclosed the lipid droplet. Note the smooth endoplasmic reticulum (s), lipid (l), mitochondria (m), (s) endocytotic vesicles (v). occulden junction (arrow). (D) When compared to group II, enterocytes in group IV had higher microvilli height. Note the smooth endoplasmic reticulum (s), lipid (l), mitochondria (m), endocytotic vesicles (v). occulden junction (arrow). (E) Microvilli height in group VI enterocytes was higher than in group IV. Note the smooth endoplasmic reticulum (s), lipid (l), mitochondria (m), endocytotic vesicles (v). occulden junction (arrow).
In group I enterocytes, the microvilli height was increased (Figure 7B). Enterocytes in group II had longer microvilli than those in group I. The lipid droplets were enveloped in the smooth endoplasmic reticula and appeared as concentrated lamellar bodies (Figure 7C). Enterocytes in group IV had greater microvilli height than those in group II (Figure 7D). Enterocytes from group VI had longer microvilli than those from group IV (Figure 7E).
B. Liver
Light microscopy investigation
Using an LM, an increase in liver cell size was found in the treated groups compared with the control group using semi-thin sections stained with toluidine blue (Figures 8A-E). An increase in lipid content inside liver cells in the treated groups compared with the control group was discovered utilizing histochemical staining (Figures 8F-J).
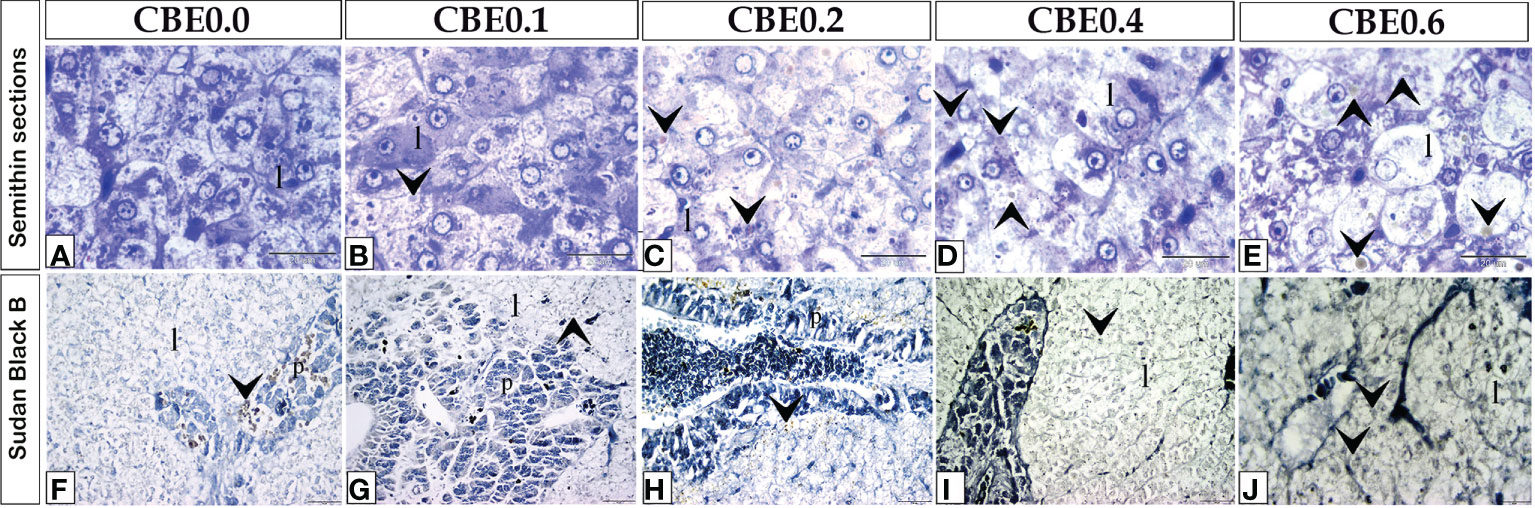
Figure 8 Semithin sections (A–E) stained with toluidine blue and frozen sections (F–J) stained with Sudan Black B revealed the variation of hepatocyte size and lipid content in response to feed on varied CBE dosages. (A–E) Increase in the size of liver cells (l) in the treated groups as compared to the control group. (F–J) Within the liver cells (I), fat content increased in the treated groups compared to the control group.
Compared with the control group, carbohydrate and protein accumulation in liver cells increased in the treated groups (Figure 9). Compared with the control group, the treated groups had higher levels of alkaline phosphatase and lipase (Figure 10). Additionally, when the treated groups were compared with the control group, the Acridine orange stain revealed increased secretory activity within the liver cells (Figure 11).
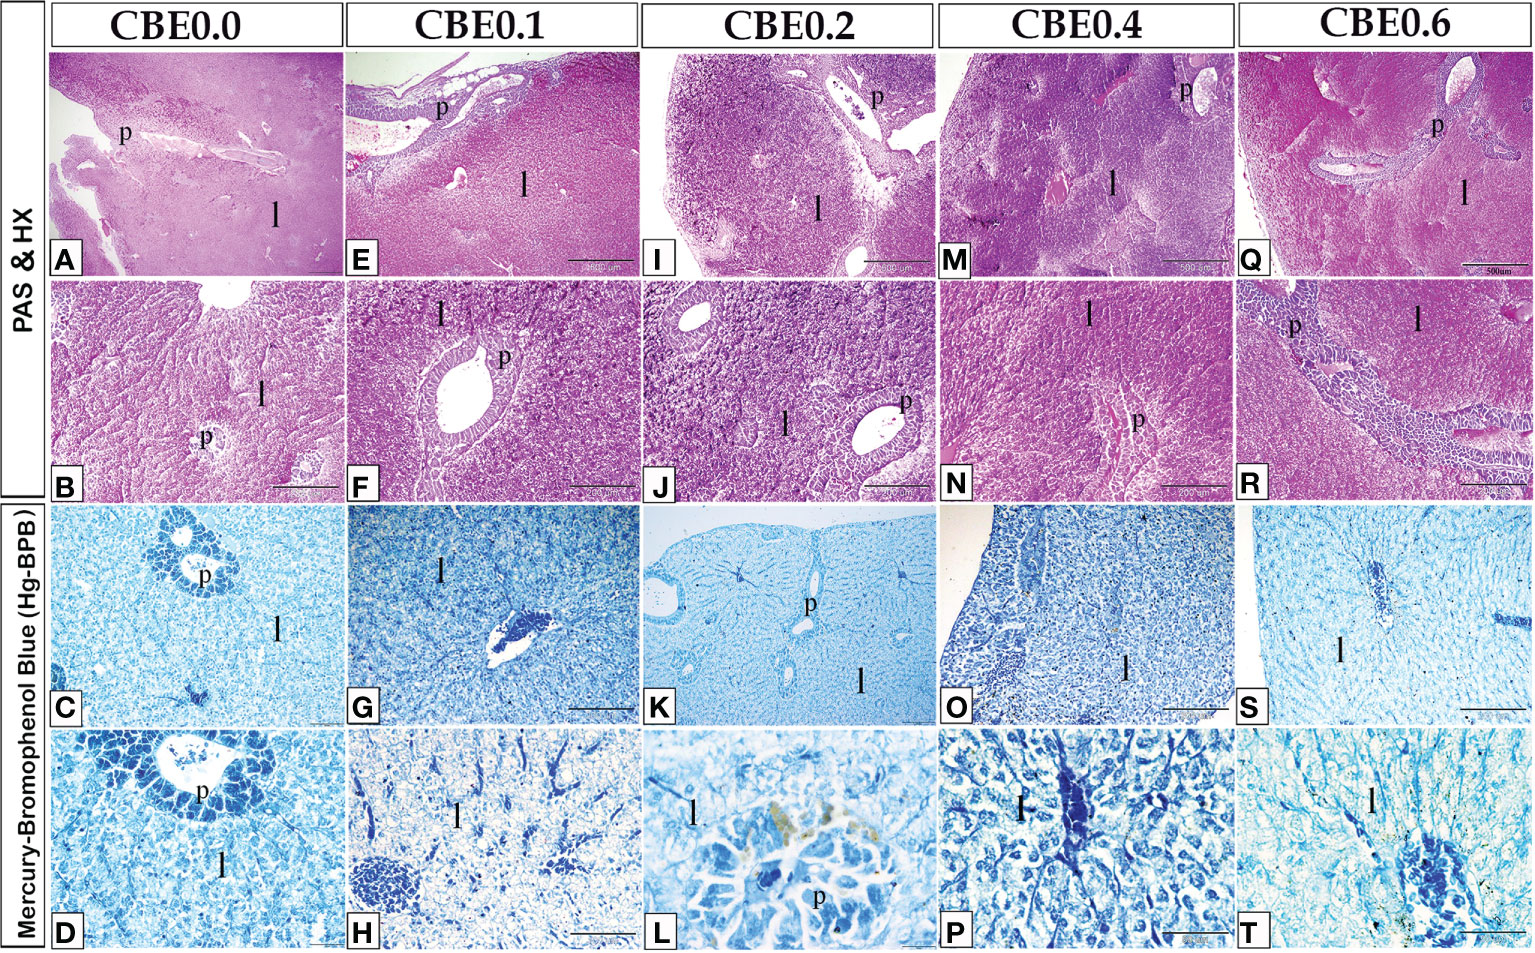
Figure 9 Paraffin sections of liver stained with PAS-HX (photos A, B, E, F, I, J, M, N, Q, R) for glycogen or carbohydrate content staining and MercuryBromophenol (photos C, D, G, H, K, L, O, P, S, T) for protein staining. The treatment groups showed an increase in glycogen or carbohydratecontent staining and Mercury Bromophenol blue protein staining when compared to the control group.
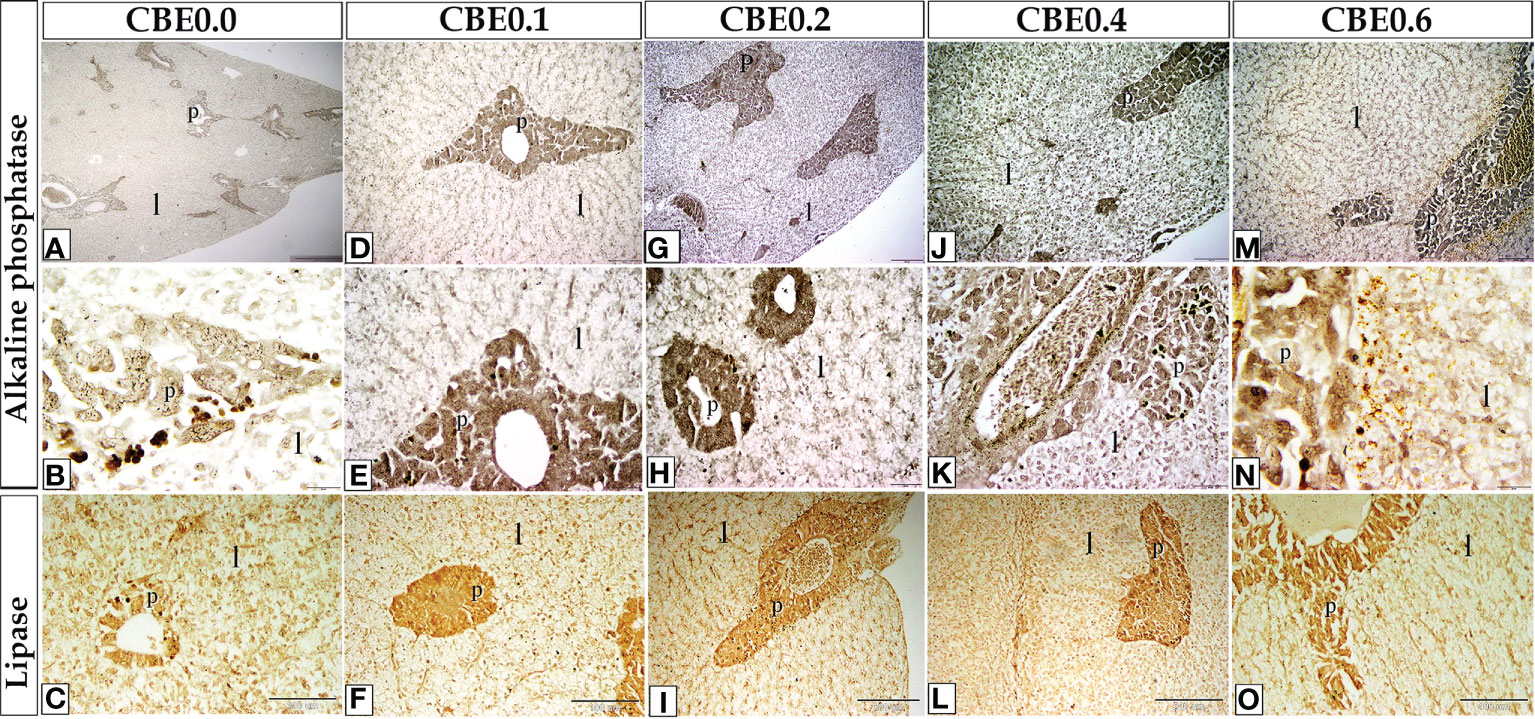
Figure 10 The staining affinity of frozen sections of liver stained with alkaline phosphatase (A–N) and lipase enzymes (C, F, I, L, O) varied in response to different dosages of CBE. When compared to the control group, the treatment groups demonstrated an increase in alkaline phosphatase and lipase content staining within the liver cells (l) and pancreas (S).
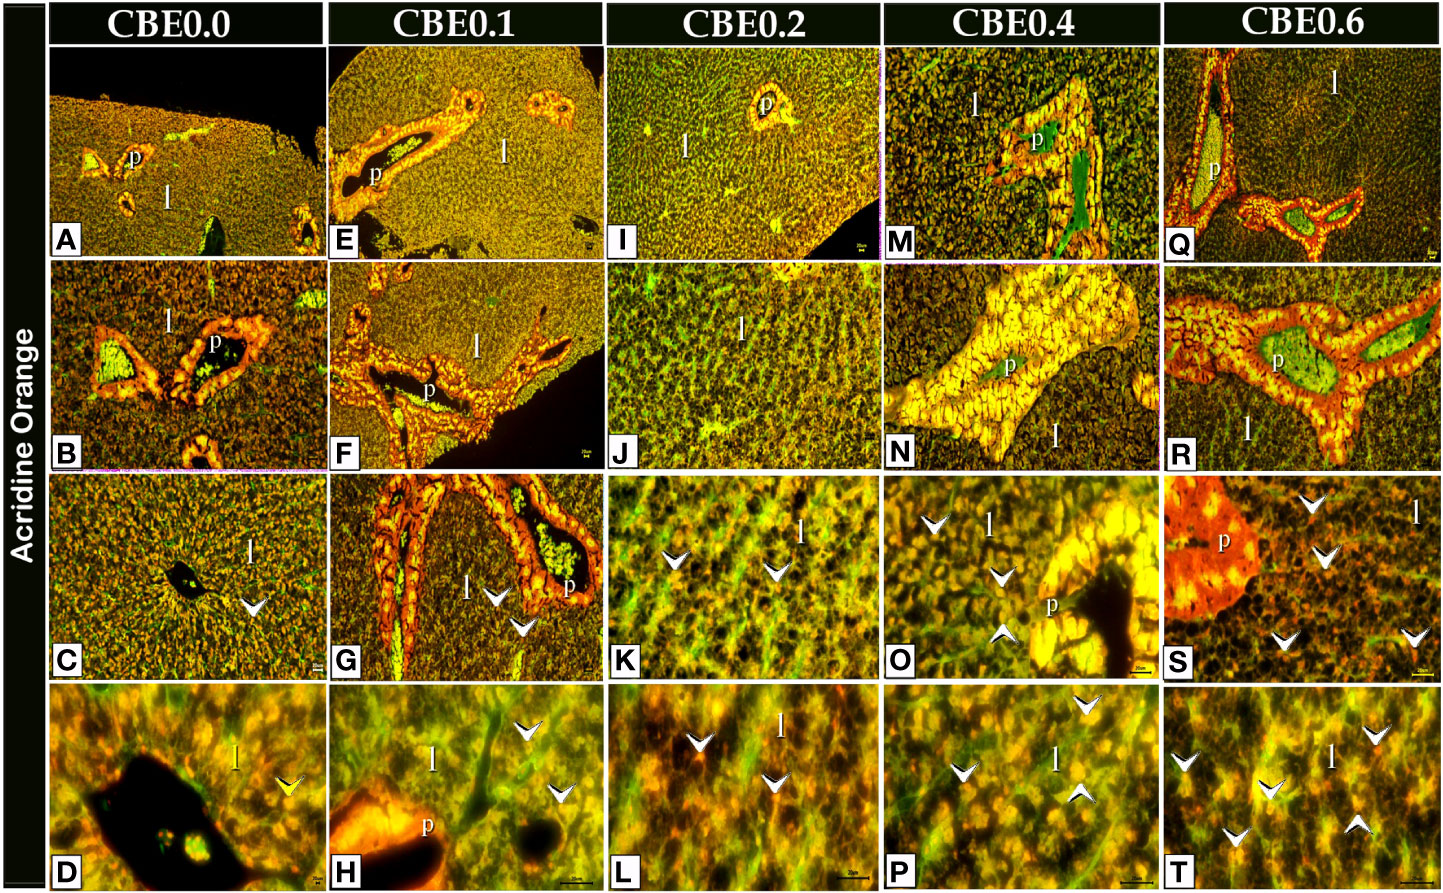
Figure 11 Acridine orange-stained paraffin sections of liver cells (A-T) revealing secretory secretions in response to different doses of CBE on feed. When compared to the control group, the treated groups had more secretory secretions (arrowheads) within the liver cells (l).
Histomorphometrical measurements
The mean length of the intestinal villi (mm) in the middle intestine showed a highly significant difference (p <.01) between the different treated groups. The greatest length was recorded in group CBE0.2, and the shortest length was recorded in group CBE0.0. There was a highly significant difference between group CBE0.1 and CBE0.4, and other treated groups, but no significant difference was recorded between group CBE0.0 and CBE0.6 (Table 7 and Figure 12). In parallel, the width of the villi at the tip (mm) showed a highly significant difference (p <.01) between the different treated groups. The mean width of the villi showed a gradual incremental change from group CBE0.0 to group CBE0.4, while the lowest value was recorded in group CBE0.6. There was a highly significant difference between groups CBE0.1 and CBE0.6, and groups CBE0.3 and CBE0.4 (Table 7 and Figure 12).
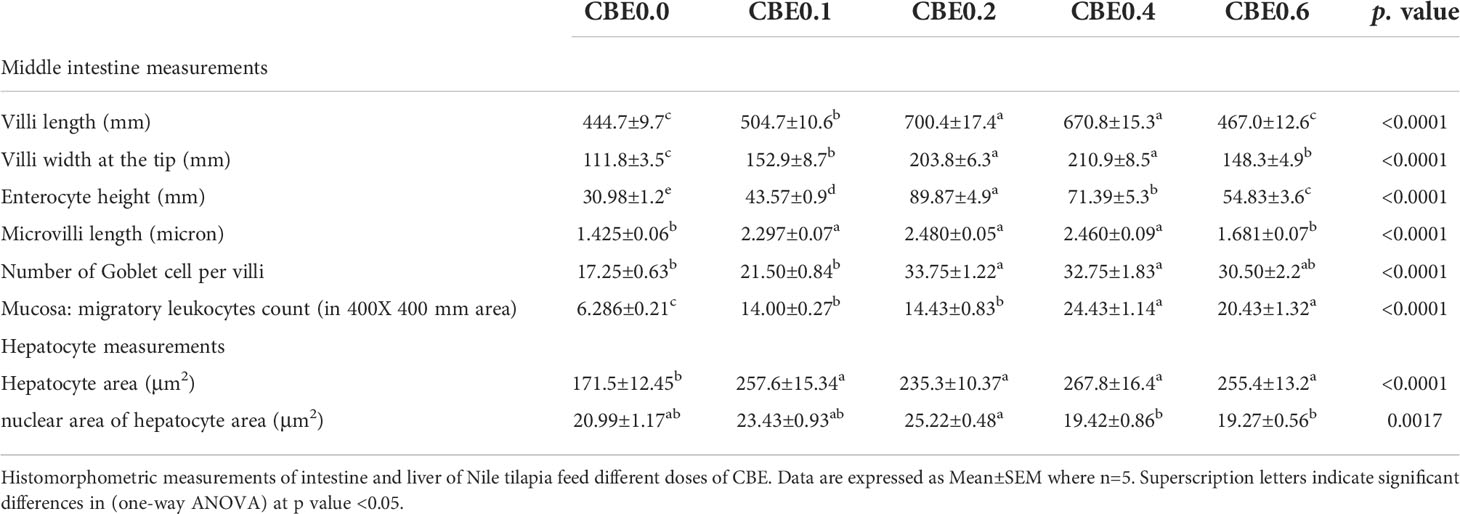
Table 7 Histomorphometric measurements of intestine and liver in Nile tilapia groups feed on different doses of CBE for 10 weeks.

Figure 12 Morphometric analysis of intestine in Nile tilapia groups fed different doses of CBE for 10 weeks. (A) The mean length of the intestinal villi (mm) in the middle intestine. (B) The middle intestine villi width at the tip. (C) Enterocytes high at the middle intestine. (D) Microvilli length at the middle intestine. (F) Migratory leukocyte counts in a 400-mm2 field. (E) Number of Goblet cells per villi. Columns with different superscript letters in the same figure are significantly different (p ≤0.05) between different groups.
Enterocyte height (mm) varied between the different groups. The maximum height of the Enterocytes (mm) was observed in group CBE0.2, and the lowest value was recorded in CBE0.0. There was a highly significant difference between the treated groups (Table 7 and Figure 12). The mean length of the microvilli varied between the different groups, and the shortest length was recorded in CBE0.0, and the greatest length was in group CBE0.2. There was a highly significant difference (p <.01) between groups CBE0.0, CBE0.6, CBE0.1, CBE0.2, and CBE0. 4, but no significant difference between groups CBE0.0 and CBE0.6. (Table 7, Figure 12).
The mean number of goblet cells per villi varied between groups. The lowest number of goblet cells was recorded in group CBE0.0; the greatest number was in group CBE0.2. There was a highly significant difference (p <.01) between groups CBE0.0, CBE0.1, and CBE0.6, and groups CBE0.2 and CBE0.04. No significant differences were found between groups CBE0.0 and CBE0.1, and CBE0.6 (Table 7 and Figure 12).
The mean number of migratory leukocytes was highly significantly different (p <.01) between groups. The lowest number was recorded in CBE0.0 and the highest was in group CBE0.4. There was a highly significant difference (p <.01) between groups CBE0.0, CBE0.1, CBE0.2, and CBE0.4 and CBE0.06. A significant difference was also recorded between groups CBE0.0 and CBE0.1, and CBE0.2. No significant differences were recorded between groups CBE0.1 and CBE0.2, and groups CBE0.4 and CBE0.6 (Table 7 and Figure 12). We found that the treated groups hepatocyte and nuclear areas increased more than those of the control. The mean hepatocyte area and nuclear area of hepatocyte are highly significant between different group (Figure 13).
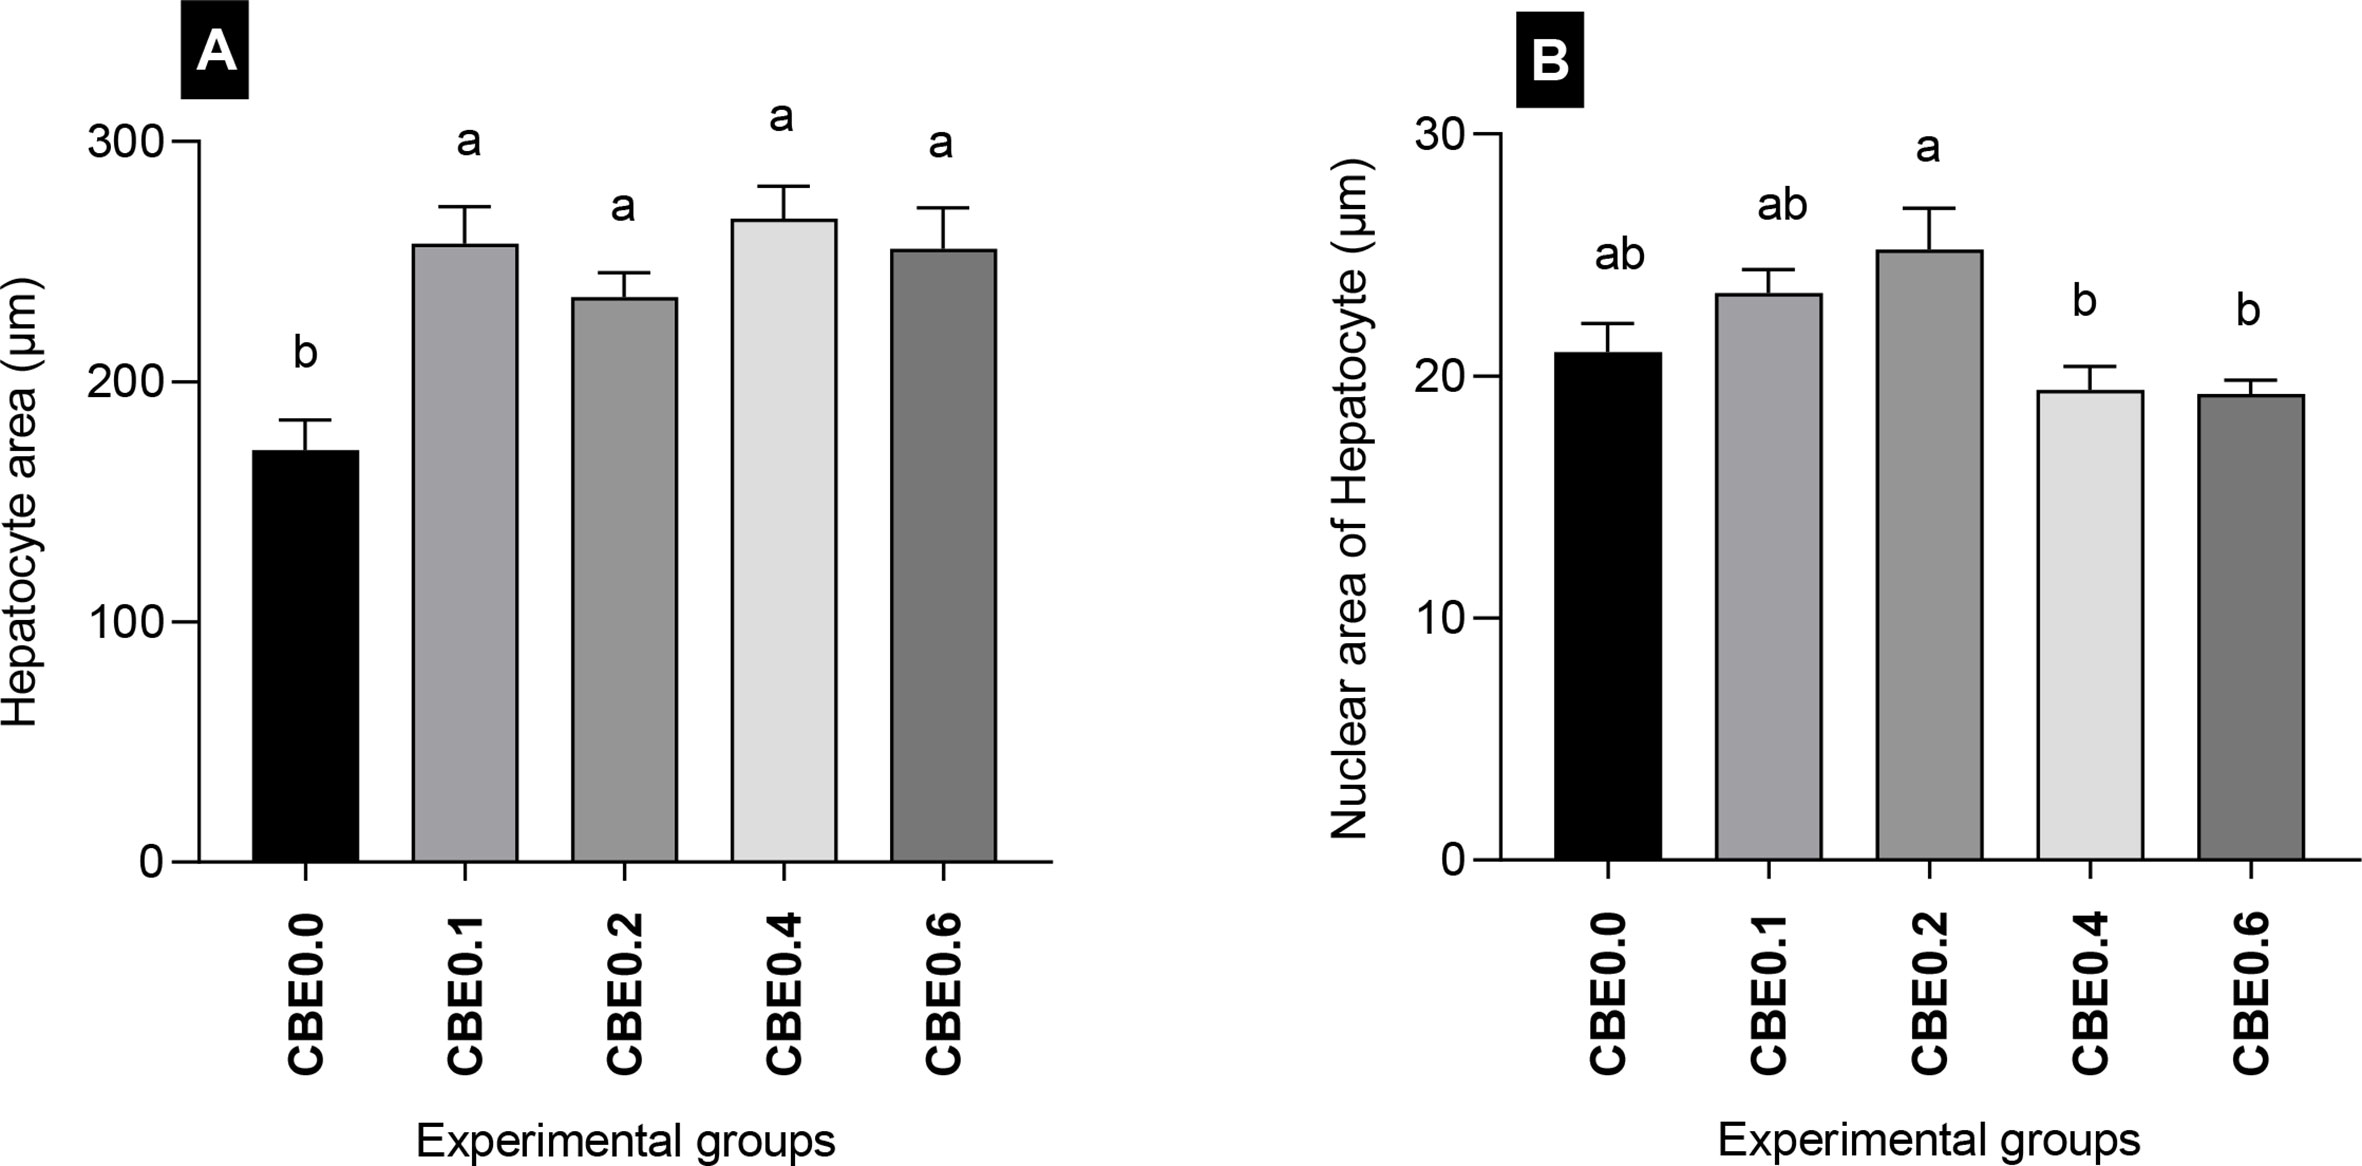
Figure 13 Morphometric analysis of liver in Nile tilapia groups fed different doses of CBE for 10 weeks. (A) The mean hepatocyte area (μm). (B) Nuclear area of hepatocytes (μm). Columns with different superscript letters in the same figure are significantly different (p ≤ 0.05) between different groups.
4 Discussion
To meet the rising demand for animal protein in human nutrition, aquaculture has emerged as one of the world’s most quickly expanding food sectors. However, the rise of pathogens and disease prevalence, unsanitary disposal of aquatic pollution, rising costs of feed, and other problems pose great threats to this vital sector (Abdel-Latif et al., 2021). Therefore, scientists have been working to develop innovative ideas and approaches to combat these problems and enhance the health of aquaculture.
This study found that groups treated with the C. benedictus extract (CBE) showed significant increases in growth performance and PER compared with the control, accompanied by decreased FCR. This result is consistent with that of Koshinski et al. (2018) which showed that rainbow trout (Oncorhynchus mykiss) grew more quickly in a supplemented group which was fed C. benedictus extract. This resulted from improved digestion and detoxification due to increased bile flow, a key to this strategy (Al-Snafi, 2016b). This result appeared along with increased survival rate and concurred with other studies. C. benedictus extract has been shown to stimulate appetite and digestion, and there may be a link between improved fish development and feed utilization, increased feed intake, and enhanced fish performance due to feed appeal or palatability.
The use of hematological and biochemical testing in fish health evaluations is strongly recommended based on the findings of this study. Group 3 (CBE0.4) showed significant increases in the RBC count compared with other treated groups in the pre-infection challenge. In contrast, there were substantial increases in the total leukocyte counts in groups 3 and 4 compared with other treated groups in the post-infection challenge. Additionally, there were significant increases in the lymphocyte concentrations in groups 3, 4, and 5, and in the other treated groups. This result concurred with a previous study (Al-Snafi, 2016a) which showed that C. benedictus had antibacterial, cytotoxic, and anti-inflammatory effects which contributed to recovery following A. hydrophilia infection. This supported our finding that Nile tilapia given CBE had more significant RBC and WBC levels than control fish, suggesting that CBE affected their hematological functions.
Similarly, data in the present study showed that CBE significantly increased total protein and was accompanied by decreases in AST, ALT, creatinine, and urea nitrogen with no change in glucose concentration between the treated groups and the control in the pre-infected challenge. These results concurred with other studies (Al-Snafi, 2016a) which found no statistical difference in glucose levels and decreased urea and creatinine levels accompanied by increased total protein in rainbow trout. There may be structural changes in the liver that diminish aminotransferase activity and reduce deamination capability, thus increasing plasma protein concentrations (Chen et al., 2020). Additionally, these data proved that liver enzymes were significantly decreased. These findings indicate that C. benedicta extract has a beneficial influence on liver health.
Post-challenge results revealed that CBE significantly increased the phagocytic activity and phagocytic index and substantially increased the lysosomal activity in the treated groups, with noticeable gains in groups 4 and 5. These results confirmed the recovery effect of CBE following A. hydrophilia infection. Additionally, CBE significantly increased the antioxidant activity through increased SOD and GPx activity, with decreased MDA levels in the CBE groups. These effects may result from the cnicin content of C. benedicta which hinders NF-κB synthesis in PMA-induced SW1353 cells. Additionally, in LPS-induced macrophages (Erel et al., 2011), cnicin also suppresses the inflammatory mediator iNOS which reflects the immunomodulatory effect of CBE (Demiroz et al., 2018). A number of phenolics and flavonoids in CBE have a significant ferric-reducing antioxidant power (FRAP), 2,2 diphenyl-1-picrylhydrazyl free radical scavenging activity, as well as xanthine oxidase inhibitor characteristics (Can et al., 2017). Furthermore, CBE contains substantial polyphenols with antioxidant and scavenging activities (Paun et al., 2019).
As a result of its phytochemicals, including flavonoids, tannins, lignans, sesquiterpene lactones, and other triterpenoids, essential and volatile oils in C. benedicta have been shown to contribute to its antimicrobial, anticancer, and other therapeutic properties, as well as its anti-inflammatory and antioxidant properties (Mabona and Van Vuuren, 2013; Paun et al., 2019). This supported our finding that CBE supplementation upregulates the mRNA expression of il1b and tnfa 5 days post challenge and counteracts the effects of A. hydrophila. Additionally, we found that CBE-treated groups showed significant regulation of hsp70 and tlr7 mRNA expression. In fish, hsp70, the most important and prominent HSP, is a common method to stimulate protein production. An increase in GSH via the upregulation of the hsp70 gene was assumed to provide cellular protection against ROS (Mehlen et al., 1996). Additionally, co-supplementation with CBE modified the level of increased hsp70 mRNA expression. This could be attributed to reduced oxidative stress in the livers of O. niloticus. Examining immune-related gene expression patterns is another way to evaluate the effects of CBE. Toll-like receptors (TLR), the most well-known cell surface receptors, play an important role in pathogen identification and early host defense against pathogen invasion (Akira and Takeda, 2004). CBE-supplemented groups had significantly higher levels of tlr7 gene expression at 5 days post challenge, which suggested the role of CBE at the molecular level against pathogens and A. hydrophila infection in some way by altering the gene expression of molecules that could be its intended targets.
Histology and histopathological data demonstrated that the length and width of intestinal villi increased in the treatment groups compared with the control. The increase in villus breadth and height is critical for food absorption and utilization (Shalata et al., 2021), and enterocytes play a crucial role in nutrient absorption and gut immunity (Standen et al., 2015). Simultaneously, LM and TEM findings demonstrated that enterocytes in the treated groups were more structurally and functionally developed, with more developed smooth endoplasmic reticula, mitochondria, and cytoplasmic vesicle count with higher microvilli. The treated groups’ mean lengths of enterocytes and microvilli were more functionally developed than those of the control. In the histochemical examination of enzyme activity, lipase levels increased in the treated groups. Digestive enzyme activation in the gut has been shown to improve the digestive capacity of the gut (Pirarat et al., 2011; Salam et al., 2021), and notably, both LM and TEM data revealed that the treated groups had more smooth endoplasmic reticula than the control. Increased lipid absorption is linked to the smooth endoplasmic reticulum’s shape and development, which houses the monoacylglycerol pathway enzymes required for fat digestion (Gurr et al., 2016). Treated groups showed an increase in the number of endocytotic vesicles, which absorb glucose and protein (Standen et al., 2015), and increased goblet cell activity. This could be due to the improved enterocytes’ metabolic activities. We also found that the number of migratory leucocytes was higher in the treated groups. Finally, the intestine plays an essential function in fish immunity and infection prevention (Salinas, 2015), and the nutritional balance in fish is critical for gut immunity and fish health (Ahmadifar et al., 2019).
The liver is involved in the metabolism and storage of lipids, carbohydrates, and proteins (Matulić et al., 2020). Hepatocytes make up approximately 80% of the parenchyma of the fish liver. Hepatocytes are loaded with glycogen and fat under normal conditions (Picoli et al., 2019), and our microscopy findings revealed that the treated groups had more fat, protein, and carbohydrate content than the controls. Additionally, enzyme activity such as lipase and alkaline phosphate increased in the treated groups. We found that the treated groups’ hepatocyte and nuclear areas increased more than those of the control. The increase in hepatocyte area indicates that the hepatocytes’ storage capacity has increased (Campos et al., 2008). Rašković et al. (2011) demonstrated that lipid and glycogen content in hepatocytes, the hepatocytes’ nuclear area, and the hepatocytes’ surface area were considered essential indicators of liver metabolic activity.
5 Conclusion
This study confirmed a significant improvement in growth performance, hematological factors, immune-related parameters, and antioxidant and anti-inflammatory activity associated with CBE supplementation in fish feed. This indicated a beneficial response through the stimulation of digestion, the creation of an antioxidant defense, and by generating immune system components. Subsequently, the immune status of O. niloticus was promoted, and the immunosuppressive impact of A. hydrophila was modulated, thereby providing a promising feed supplement for O. niloticus aquaculture. This is the first report that investigated the intracellular molecular pathways of CBE.
Data availability statement
The original contributions presented in the study are included in the article/Supplementary Material. Further inquiries can be directed to the corresponding authors.
Ethics statement
This study was reviewed and approved by The Kafrelsheikh university’s animal care and use committee has approved the trial protocol (Number: IAACUC-KSU-2021-01).
Author contributions
AS, SE-N, AE, AF and HA-E conceived and designed the research. AS, SE-N, AE, AF, HK, MS and HA-E conducted the experiments. AS, HK, SE-N, SE-S, MS and HA-E contributed new reagents or analytical tools. AS, HA-E, HK and SE-S analyzed the data. HA-E, AS, SE-N, AE, AF, HK, MS and HA wrote the manuscript. Final editing, revision, comment responses, were contributed to by HA-E,AS, IA-D, MA and NA. All authors contributed to the article and approved the submitted version.
Funding
All authors contributed to the funding of the paper. This research received no external funding.
Acknowledgments
The authors gratefully acknowledge their careful English editing provided by EKB editing service, which significantly enhanced the manuscript.
Conflict of interest
The authors declare that the research was conducted in the absence of any commercial or financial relationships that could be construed as a potential conflict of interest.
Publisher’s note
All claims expressed in this article are solely those of the authors and do not necessarily represent those of their affiliated organizations, or those of the publisher, the editors and the reviewers. Any product that may be evaluated in this article, or claim that may be made by its manufacturer, is not guaranteed or endorsed by the publisher.
Supplementary material
The Supplementary Material for this article can be found online at: https://www.frontiersin.org/articles/10.3389/fmars.2022.993616/full#supplementary-material
References
Abd-Elhafeez H. H., Soliman S. A., Attaai A. H., Abdel-Hakeem S. S., El-Sayed A. M., Abou-Elhamd A. S. (2021). Endocrine, stemness, proliferative, and proteolytic properties of alarm cells in ruby-red-fin shark (Rainbow shark), epalzeorhynchos frenatum (Teleostei: Cyprinidae). Microscopy Microanalysis 27, 1251–1264. doi: 10.1017/S1431927621012265
Abdel-Latif H. M., Hendam B. M., Shukry M., El-Shafai N. M., El-Mehasseb I. M., Dawood M. A., et al. (2021). Effects of sodium butyrate nanoparticles on the hemato-immunological indices, hepatic antioxidant capacity, and gene expression responses in Oreochromis niloticus. Fish Shellfish Immunol. 119, 516–523. doi: 10.1016/j.fsi.2021.10.039
Ahmadifar E., Moghadam M. S., Dawood M. A., Hoseinifar S. H. (2019). Lactobacillus fermentum and/or ferulic acid improved the immune responses, antioxidative defence and resistance against Aeromonas hydrophila in common carp (Cyprinus carpio) fingerlings. Fish shellfish Immunol. 94, 916–923. doi: 10.1016/j.fsi.2019.10.019
Ahmed–Belkacem A., Ahnou N., Barbotte L., Wychowski C., Pallier C., Brillet R., et al. (2010). Silibinin and related compounds are direct inhibitors of hepatitis c virus RNA-dependent RNA polymerase. Gastroenterology 138, 1112–1122. doi: 10.1053/j.gastro.2009.11.053
Akira S., Takeda K. (2004). Toll-like receptor signalling. Nat. Rev. Immunol. 4, 499–511. doi: 10.1038/nri1391
Albu C., Eremia S. A., Penu R., Vasilescu I., Litescu S. C., Radu G.-L. (2017). Characterization of the phenolics and free radical scavenging of romanian red wine. Analytical Lett. 50, 591–606. doi: 10.1080/00032719.2016.1192641
Al-Snafi A. E. (2016a). The pharmacological activities of Cuminum cyminum-a review. IOSR J. Pharm. 6, 46–65.
Al-Snafi A. E. (2016b). The constituents and pharmacology of Cnicus benedictus-a review. Pharm. Chem. J. 3, 129–135.
Anwar S. M., Abd-Elhafeez H. H., Abdel-Maksoud F. M., Abdalla K. E. (2021). Morph-anatomic and histochemical study of the ileum of goose (Alopochen egyptiacus) with special references to immune cells, mucous and serous goblet cells, telocytes, and dark and light smooth muscle fibers. Microscopy Res. Technique 84, 1328–1347.
Arunkumar M., Lewisoscar F., Thajuddin N., Pugazhendhi A., Nithya C. (2020). In vitro and in vivo biofilm forming vibrio spp: A significant threat in aquaculture. Process Biochem. 94, 213–223. doi: 10.1016/j.procbio.2020.04.029
Ashour M., Mabrouk M. M., Ayoub H. F., El-Feky M. M., Zaki S. Z., Hoseinifar S. H., et al. (2020). Effect of dietary seaweed extract supplementation on growth, feed utilization, hematological indices, and non-specific immunity of Nile tilapia, Oreochromis niloticus challenged with Aeromonas hydrophila. J. Appl. Phycology 32, 3467–3479. doi: 10.1007/s10811-020-02178-1
Boyd C. E., D'abramo L. R., Glencross B. D., Huyben D. C., Juarez L. M., Lockwood G. S., et al. (2020). Achieving sustainable aquaculture: Historical and current perspectives and future needs and challenges. J. World Aquaculture Soc. 51, 578–633. doi: 10.1111/jwas.12714
Campos M. G., Bogdanov S., De Almeida-Muradian L. B., Szczesna T., Mancebo Y., Frigerio C., et al. (2008). Pollen composition and standardisation of analytical methods. J. Apicultural Res. 47, 154–161. doi: 10.1080/00218839.2008.11101443
Can Z., Baltaş N., Keskin S., Yıldız O., Kolaylı S. (2017). Properties of antioxidant and anti-inflammatory activity and phenolic profiles of Şevketi bostan (Cnicus benedictus l.) cultivated in Aegean region from Turkey. Turkish J. Agriculture-Food Sci. Technol. 5, 308–314.
Can Z., Yildiz O., Sahin H., Turumtay E. A., Silici S., Kolayli S. (2015). An investigation of Turkish honeys: their physico-chemical properties, antioxidant capacities and phenolic profiles. Food Chem. 180, 133–141. doi: 10.1016/j.foodchem.2015.02.024
Chen J., Sun R., Pan C., Sun Y., Mai B., Li Q. X. (2020). Antibiotics and food safety in aquaculture. J. Agric. Food Chem. 68, 11908–11919. doi: 10.1021/acs.jafc.0c03996
Demiroz T., Albayrak G., Nalbantsoy A., Gocmen B., Baykan S. (2018). Anti-inflammatory properties of centaurea calolepis boiss. and cnicin against Macrovipera lebetina obtusa (Dwigubsky, 1832) and Montivipera xanthina (Gray, 1849) venoms in rat. Toxicon 152, 37–42. doi: 10.1016/j.toxicon.2018.07.016
Diab A. M., Shokr B. T., Shukry M., Farrag F. A., Mohamed R. A. (2022). Effects of dietary supplementation with green-synthesized zinc oxide nanoparticles for Candidiasis control in Oreochromis niloticus. Biol. Trace Element Res. 200, 4126–4141. doi: 10.1007/s12011-021-02985-8
El-Sherry T. M., Abd-Elhafeez H. H., Sayed M. (2022). New insights into sperm rheotaxis, agglutination and bundle formation in sharkasi chickens based on an in vitro study. Sci. Rep. 12, 1–15. doi: 10.1038/s41598-022-17037-x
Elumalai P., Kurian A., Lakshmi S., Faggio C., Esteban M. A., Ringø E. (2020). Herbal immunomodulators in aquaculture. Rev. Fisheries Sci. Aquaculture 29, 33–57. doi: 10.1080/23308249.2020.1779651
Erel S. B., Karaalp C., Bedir E., Kaehlig H., Glasl S., Khan S., et al. (2011). Secondary metabolites of centaurea calolepis and evaluation of cnicin for anti-inflammatory, antioxidant, and cytotoxic activities. Pharm. Biol. 49, 840–849. doi: 10.3109/13880209.2010.551538
Erol-Florian G., Şara A., Molnar F., Benţea M. (2011). The influence of some phytoadditives on growth performances and meat quality in rainbow trout (Oncorhynchus mykiss). Anim. Sci. Biotechnologies 44, 13–18.
Ghalwash H. R., Salah A. S., El-Nokrashy A. M., Abozeid A. M., Zaki V. H., Mohamed R. A. (2022). Dietary supplementation with Bacillus species improves growth, intestinal histomorphology, innate immunity, antioxidative status and expression of growth and appetite-regulating genes of Nile tilapia fingerlings. Aquaculture Res. 53, 1378–1394. doi: 10.1111/are.15671
Gurr MI, Harwood JL, Frayn KN, Murphy DJ, Michell RH. Lipids: biochemistry, biotechnology and health John Wiley & Sons, 6th Edition, 448 Pages. 2016.
Hoff R., Newman D., Staneck J. (1985). Bacteriuria screening by use of acridine orange-stained smears. J. Clin. Microbiol. 21, 513–516. doi: 10.1128/jcm.21.4.513-516.1985
Igbinosa I. H., Beshiru A., Odjadjare E. E., Ateba C. N., Igbinosa E. O. (2017). Pathogenic potentials of Aeromonas species isolated from aquaculture and abattoir environments. Microbial pathogenesis 107, 185–192. doi: 10.1016/j.micpath.2017.03.037
Karami Z., Emam-Djomeh Z., Mirzaee H. A., Khomeiri M., Mahoonak A. S., Aydani E. (2015). Optimization of microwave assisted extraction (MAE) and soxhlet extraction of phenolic compound from licorice root. J. Food Sci. Technol. 52, 3242–3253. doi: 10.1007/s13197-014-1384-9
Koshinski R., Velichkova K., Sirakov I., Stoyanova S. (2018). Growth performance, biochemical blood parameters and meat quality of rainbow trout (Oncorhynchus mykiss w.) fed with cnicus benedictus l. extract. Trakia J. Sci. 16, 301.
Lucini L., Kane D., Pellizzoni M., Ferrari A., Trevisi E., Ruzickova G., et al. (2016). Phenolic profile and in vitro antioxidant power of different milk thistle [Silybum marianum (L.) gaertn.] cultivars. Ind. Crops Products 83, 11–16. doi: 10.1016/j.indcrop.2015.12.023
Mabona U., Van Vuuren S. (2013). Southern African medicinal plants used to treat skin diseases. South Afr. J. Bot. 87, 175–193. doi: 10.1016/j.sajb.2013.04.002
Massoud D., Lao-Pérez M., Ortega E., Burgos M., Jiménez R., Barrionuevo F. J. (2021). Divergent seasonal reproductive patterns in syntopic populations of two murine species in southern Spain, Mus spretus and Apodemus sylvaticus. Animals 11, 243. doi: 10.3390/ani11020243
Matulić D., Barišić J., Aničić I., Tomljanović T., Safner R., Treer T., et al. (2020). Growth, health aspects and histopathology of brown bullhead (Ameiurus nebulosus l.): replacing fishmeal with soybean meal and brewer’s yeast. Sci. Rep. 10, 1–16. doi: 10.1038/s41598-020-57722-3
Mehlen P., Kretz-Remy C., Preville X., Arrigo A.-P. (1996). Human hsp27, Drosophila hsp27 and human alphaB-crystallin expression-mediated increase in glutathione is essential for the protective activity of these proteins against TNFalpha-induced cell death. EMBO J. 15, 2695–2706. doi: 10.1002/j.1460-2075.1996.tb00630.x
Mirzapour M., Hamedi M., Rahimipanah M. (2010). Sunflower oil stabilization by persian walnut leaves extract during oven storage test. Food Sci. Technol. Res. 16, 443–446. doi: 10.3136/fstr.16.443
Morris J. K. (1965). A formaldehyde glutaraldehyde fixative of high osmolality for use in electron microscopy. J. Cell Biol. 27, 1A–149A.
Moustafa E. M., Dawood M. A., Assar D. H., Omar A. A., Elbialy Z. I., Farrag F. A., et al. (2020). Modulatory effects of fenugreek seeds powder on the histopathology, oxidative status, and immune related gene expression in Nile tilapia (Oreochromis niloticus) infected with aeromonas hydrophila. Aquaculture 515, 734589. doi: 10.1016/j.aquaculture.2019.734589
Naik V. M. (2002) Monad and polyad pollens ontogeny and histochemistry. Available at: http://hdl.handle.net/10603/95415.
Paun G., Neagu E., Moroeanu V., Albu C., Savin S., Lucian Radu G. (2019). Chemical and bioactivity evaluation of eryngium planum and cnicus benedictus polyphenolic-rich extracts. BioMed. Res. Int. 12:3692605. doi: 10.1155/2019/36926058
Pfaffl M. W. (2001). A new mathematical model for relative quantification in real-time RT-PCR. Nucleic Acids Res. 29, e45. doi: 10.1093/nar/29.9.e45
Picoli F., Lopes D. L. D. A., Zampar A., Serafini S., Freccia A., Veronezi L. O., et al. (2019). Dietary bee pollen affects hepatic–intestinal histomorphometry of Nile tilapia fingerlings. Aquaculture Res. 50, 3295–3304. doi: 10.1111/are.14287
Pirarat N., Pinpimai K., Endo M., Katagiri T., Ponpornpisit A., Chansue N., et al. (2011). Modulation of intestinal morphology and immunity in nile tilapia (Oreochromis niloticus) by lactobacillus rhamnosus GG. Res. veterinary Sci. 91, e92–e97. doi: 10.1016/j.rvsc.2011.02.014
Rašković B., Stanković M., Marković Z., Poleksić V. (2011). Histological methods in the assessment of different feed effects on liver and intestine of fish. J. Agric. Sci. (Belgrade) 56, 87–100. doi: 10.2298/JAS1101087R
Reynolds E. S. (1963). The use of lead citrate at high pH as an electron-opaque stain in electron microscopy. J. Cell Biol. 17, 208. doi: 10.1083/jcb.17.1.208
Salam M. A., Islam M., Paul S. I., Rahman M., Rahman M. L., Islam F., et al. (2021). Gut probiotic bacteria of barbonymus gonionotus improve growth, hematological parameters and reproductive performances of the host. Sci. Rep. 11, 1–24. doi: 10.1038/s41598-021-90158-x
Salinas I. (2015). The mucosal immune system of teleost fish. Biology 4, 525–539. doi: 10.3390/biology4030525
Shalata H. A., Bahattab O., Zayed M. M., Farrag F., Salah A. S., Al-Awthan Y. S., et al. (2021). Synergistic effects of dietary sodium butyrate and spirulina platensis on growth performance, carcass composition, blood health, and intestinal histomorphology of Nile tilapia (Oreochromis niloticus). Aquaculture Rep. 19, 100637. doi: 10.1016/j.aqrep.2021.100637
Sharif Rohani M., Haghighi M., Bazari Moghaddam S. (2017). Study on nanoparticles of aloe vera extract on growth performance, survival rate and body composition in Siberian sturgeon (Acipenser baerii). Iranian J. Fisheries Sci. 16, 457–468.
Shukry M., Albogami S., Gewaily M., Amer A. A., Soliman A. A., Alsaiad S. M., et al. (2022). Growth performance, antioxidative capacity, and intestinal histomorphology of grey mullet (Liza ramada)–fed dietary zinc nanoparticles. Biol. Trace Element Res. 200, 2406–2415. doi: 10.1007/s12011-021-02844-6
Soliman S. A., Emeish W. F., Abdel-Hafeez H. H. (2022a). Lactoferrin improves the immune response and resistance of silver carp, a hematological, light (histochemical and immunohistochemical), fluorescent, and scanning electron microscopic study. Microscopy Res. Technique 85(11), 3565–3581. doi: 10.1002/jemt.24208
Soliman S. A., Sobh A., Ali L. A., Abd-Elhafeez H. H. (2022b). Two distinctive types of telocytes in gills of fish: A light, immunohistochemical and ultra-structure study. Microscopy Res. Technique 85(11):3653–3663. doi: 10.1002/jemt.24218
Standen B., Rodiles A., Peggs D., Davies S., Santos G., Merrifield D. (2015). Modulation of the intestinal microbiota and morphology of tilapia, oreochromis niloticus, following the application of a multi-species probiotic. Appl. Microbiol. Biotechnol. 99, 8403–8417. doi: 10.1007/s00253-015-6702-2
Suvarna S., Layton C., Bancroft J. (2013). “The hematoxylins and eosin,” in Bancroft’s theory and practice of histological techniques, 7th ed (London, UK: Churchill Livingstone), 172–186.
Untergasser A, Cutcutache I, Koressaar T, Ye J, Faircloth B.C, Remm M, et al. Primer3—new capabilities and interfaces, Nucleic Acids Research. 40 (15), e115. doi: 10.1093/nar/gks596
Van Wyk B.-E. (2015). A review of commercially important African medicinal plants. J. ethnopharmacology 176, 118–134. doi: 10.1016/j.jep.2015.10.031
Yassine T., Khalafalla M. M., Mamdouh M., Elbialy Z. I., Salah A. S., Ahmedou A., et al. (2021). The enhancement of the growth rate, intestinal health, expression of immune-related genes, and resistance against suboptimal water temperature in common carp (Cyprinus carpio) by dietary paraprobiotics. Aquaculture Rep. 20, 100729. doi: 10.1016/j.aqrep.2021.100729
Yıldız O., Can Z., Saral Ö., Yuluğ E., Öztürk F., Aliyazıcıoğlu R., et al. (2013). Hepatoprotective potential of chestnut bee pollen on carbon tetrachloride-induced hepatic damages in rats. Evidence-Based complementary Altern. Med. 2013. doi: 10.1155/2013/461478
Zhao L., Cui C., Liu Q., Sun J., He K., Adam A. A., et al. (2020). Combined exposure to hypoxia and ammonia aggravated biological effects on glucose metabolism, oxidative stress, inflammation and apoptosis in largemouth bass (Micropterus salmoides). Aquat. Toxicol. 224, 105514. doi: 10.1016/j.aquatox.2020.105514
Keywords: antioxidant, fish, growth promotion, herbal extract, immunostimulant, survival
Citation: Salah AS, El-Nagar SH, Elsheshtawy A, Al-Dhuayan I, Fouad AM, Alnamshan MM, Kadira HI, Alaqeel NK, El-Shobokshy SA, Shukry M and Abd-Elhafeez HH (2022) Exploring the multimodal role of Cnicus benedictus extract in the modulation of growth, hematobiochemical, histopathological, antioxidative performance, and immune-related gene expression of Oreochromis niloticus challenged with Aeromonas hydrophila. Front. Mar. Sci. 9:993616. doi: 10.3389/fmars.2022.993616
Received: 13 July 2022; Accepted: 11 October 2022;
Published: 17 November 2022.
Edited by:
Gonzalo Martinez-Rodriguez, Department of Marine Biology and Aquacuture (CSIC), SpainReviewed by:
Ahmed Farouk Basuony Abdelhamid, Al-Azhar University, EgyptGhasem Mohammadi, Iranian Fisheries Research Organization, Iran
Chang’an Wang, Heilongjiang River Fisheries Research Institute (CAFS), China
Mehdi Soltani, Murdoch University, Australia
Copyright © 2022 Salah, El-Nagar, Elsheshtawy, Al-Dhuayan, Fouad, Alnamshan, Kadira, Alaqeel, El-Shobokshy, Shukry and Abd-Elhafeez. This is an open-access article distributed under the terms of the Creative Commons Attribution License (CC BY). The use, distribution or reproduction in other forums is permitted, provided the original author(s) and the copyright owner(s) are credited and that the original publication in this journal is cited, in accordance with accepted academic practice. No use, distribution or reproduction is permitted which does not comply with these terms.
*Correspondence: Hanan H. Abd-Elhafeez, aGhubnp6OTFAYXVuLmVkdS5lZw==; Abdallah S. Salah, YS5zLnNhbGFoQHN0aXIuYWMudWs=