 Haobo Zhang
 Yuan Li2
 Xiaoyan Wang
95% of researchers rate our articles as excellent or good
Learn more about the work of our research integrity team to safeguard the quality of each article we publish.
Find out more
ORIGINAL RESEARCH article
Front. Mar. Sci. , 16 September 2022
Sec. Marine Fisheries, Aquaculture and Living Resources
Volume 9 - 2022 | https://doi.org/10.3389/fmars.2022.992377
Environmental DNA (eDNA) is becoming a potentially valuable survey technique to monitor marine organisms, especially when the research spans wide-ranging temporal or spatial dimensions. Pampus echinogaster plays an important role in China’s marine fisheries. However, the stock of P. echinogaster is gradually declining, so the fishery protection and management of P. echinogaster are becoming crucial. To achieve the non-invasive and large-scale monitoring of P. echinogaster, we developed a specific quantitative real-time PCR (qPCR) method based on eDNA technology. Results showed that positive signals of P. echinogaster eDNA were successfully detected at 36 sites (82% of the total) in the East China Sea. Significant differences in eDNA concentrations between the southern and northern stations in the East China Sea suggested differences between the life histories of P. echinogaster in these two sea areas. The hotspot was found around the central areas of the East China Sea, especially around the Taizhou seawater (Jiaojiang Estuary). Vertical distribution showed that the eDNA hotspots were primarily concentrated in the middle and upper layers (0–40 m). The distribution results of eDNA hotspots were similar to those of previous findings through motor–trawl capture, indicating the validity of the eDNA results. The relationship between environmental factors and the eDNA concentration showed that was significantly correlated with the P. echinogaster eDNA concentration. Overall, our study indicated that the eDNA approach was an effective survey method and can be used as a monitoring tool. We advocate this monitoring approach as supplementary means to guide the management and conservation of large-scale sea areas and thus enable the initially surveying to provide the best information about species-specific distribution.
Fishery resources are closely linked to human well-being (Rudolph et al., 2020), so implementing the sustainable development of marine fisheries resources is urgent (Worm et al., 2009; Hoegh-Guldberg and Bruno, 2010; McClanahan et al., 2015). Biomonitoring is an essential tool for fishery-resource management. Accordingly, rapid and accurate understanding of the distribution of fishery resources is essential for aquatic biological protection and fishery-management strategies. Traditional fisheries surveys often rely on physical methods, such as trapping, netting, and trawling. However, traditional methods are time consuming and have other drawbacks, including high cost, low catch rates of target organisms, and severe environmental damage (Smart et al., 2016; Maruyama et al., 2018). Moreover, identifying species is difficult, especially in the case of cryptic, new, and closely related species (Thomsen et al., 2012). These limitations greatly hinder the implementation of fishery management strategies.
Environmental DNA (eDNA) techniques are extensively used in distribution and biomass studies (Lacoursière-Roussel et al., 2016; Itakura et al., 2019; Salter et al., 2019). eDNA is the DNA fragments released by organisms from tissues, cells, or metabolites into the environment (Thomsen and Willerslev, 2015). Species presence/absence or biodiversity could be detected through specific techniques (e.g., quantitative real-time PCR (qPCR) and high-throughput sequencing) (Deiner et al., 2017; Coble et al., 2019). eDNA technology has overcome many disadvantages over traditional methods and has brought unprecedented innovation to aquatic distribution surveys (Jerde et al., 2011; Dejean et al., 2012; Smart et al., 2016). This technology is widely used in conservation biology and ecology (Rees et al., 2014; Barnes and Turner, 2015). Numerous studies have shown a positive correlation between DNA concentration and estimated population density based on conventional monitoring (Thomsen et al., 2012; Miya et al., 2015; Thomsen and Willerslev, 2015; Spear et al., 2020). eDNA has found great application in the monitoring of species, such as those that are invasive (Ficetola et al., 2008; Jerde et al., 2011; Smart et al., 2016; Wang et al., 2022), endangered (Sigsgaard et al., 2015; de Souza et al., 2016; McKelvey et al., 2016), and rare and closely related (Thomsen et al., 2012; Thomsen and Willerslev, 2015; Boussarie et al., 2018). Non-invasive species monitoring survey at extensive geographic scales is another major advantage of eDNA. In previous studies, eDNA for species monitoring has been successfully applied in the East China Sea, the Great Lakes, and the wide western coastal areas from the United States to Canada (Tucker et al., 2016; Doi et al., 2021; Wang et al., 2022). The eDNA approach has great potential for application in fishery management.
Pelagic fish are an important trophic link in the marine ecosystem, serving as an important forage base for many ecologically and commercially important species, as well as a target fishery species (Pikitch et al., 2012). As an essential marine pelagic economic fish in the Pacific Ocean, researches have been conducted many studies on the distribution of Pampus echinogaster. Yamada et al. (1995; 2009) and Nakabo (2002) suggest that only four species of pomfret exist in the Yellow Sea and East China Sea, namely the Pampus echinogaster, the Pampus punctatissimus, the Pampus chinensis and the Pampus cinereus. Based on morphological characteristics and DNA barcoding, Li et al. (2019) concluded that the P. echinogaster is distributed in the waters of the Nel’ma Bight and the northwestern coast of Sakhalin, Japan, the Korean Peninsula, the Bohai Sea, the Yellow Sea, the East China Sea, and the northern South China Sea. A recent study has also confirmed the above view by combining the mitochondrial whole-genome sequences of five pomfret species (Yan and Cheng, 2020). P. echinogaster usually spawn in the summer and the young are subsequently fattened on coastal bait. In autumn and winter when water temperatures drop, they migrate to deeper waters to overwinter. The following spring, with the strengthening of warm currents in Taiwan, the fish migrate again to spawn in the waters near the estuaries offshore (Zhou and Li, 2018).
Since 1999, the yield of pomfret in the East China Sea has remained above 20 × 104 t, basically dominated by P. echinogaster (The Fishery Bureau of the Ministry of Agriculture, 1999-2012; Zhou and Li, 2018). However, with the development of fishing technology and the exploitation of marine biological resources, the fishing of P. echinogaster has intensified. Furthermore, marine pollution is becoming severe, leading to a continuous decrease in P. echinogaster resources. Fishing and catch rates of P. echinogaster decline yearly, with the total catch of Pampus falling to 19 × 104 t in 2020 (Fishery and Fishery Administration of the Ministry of Agriculture and Rural Areas et al., 2020). P. echinogaster populations show accelerated growth and reproduction, gradual miniaturization of the population and decreased individual length and body weight (Yang et al., 2006; Zhang, 2007). P. echinogaster faces a dilemma of rapid depletion of its resources. Therefore, understanding the distribution and biomass in the East China Sea is urgent to protect it better.
This study aimed to develop an eDNA-based assay for P. echinogaster in water samples to assess its distribution throughout the East China Sea. The relationship between P. echinogaster eDNA distribution and environmental factors was analyzed to understand its habitat preferences. Our research results can guide aquatic conservation and fishery management.
The sample collection area is located at 120.93°E–125.90°E, 26.07°N–32.34°N in the East China Sea. The collection period was 14–24 May 2019. According to the measured depths of the sampling sites, a total of 178 samples were collected from 44 sites (Figure 1 and Table S1). The maximum depth sampled was 100.8 m. Niskin bottles (24×20 L) with SBE 911 Plus Conductivity-temperature-depth (CTD) system (Sea-Bird Scientific, USA) were used to collect seawater samples, which were subsequently stored in sterile disposable plastic bags (3.5 L). Each one-liter seawater was vacuum filtered through 0.45 μm-pore-size glass fiber filters (Xingya Purification Materials Company, Shanghai, China) and a negative control was set up. Filters were wrapped in aluminum foil and stored in 2 mL cryogenic tubes (Sangon Biotech, Shanghai, China) in liquid nitrogen at -196°C. Then, the filtered samples were collected, transported to the laboratory, and stored at -80°C until further eDNA extraction. All filtering equipment was immersed in 10% bleach solution for 10 min and then rinsed thoroughly with tap water, with a final rinse using commercially purified water (Wahaha, China). A separate pair of disposable gloves was used for each sample.
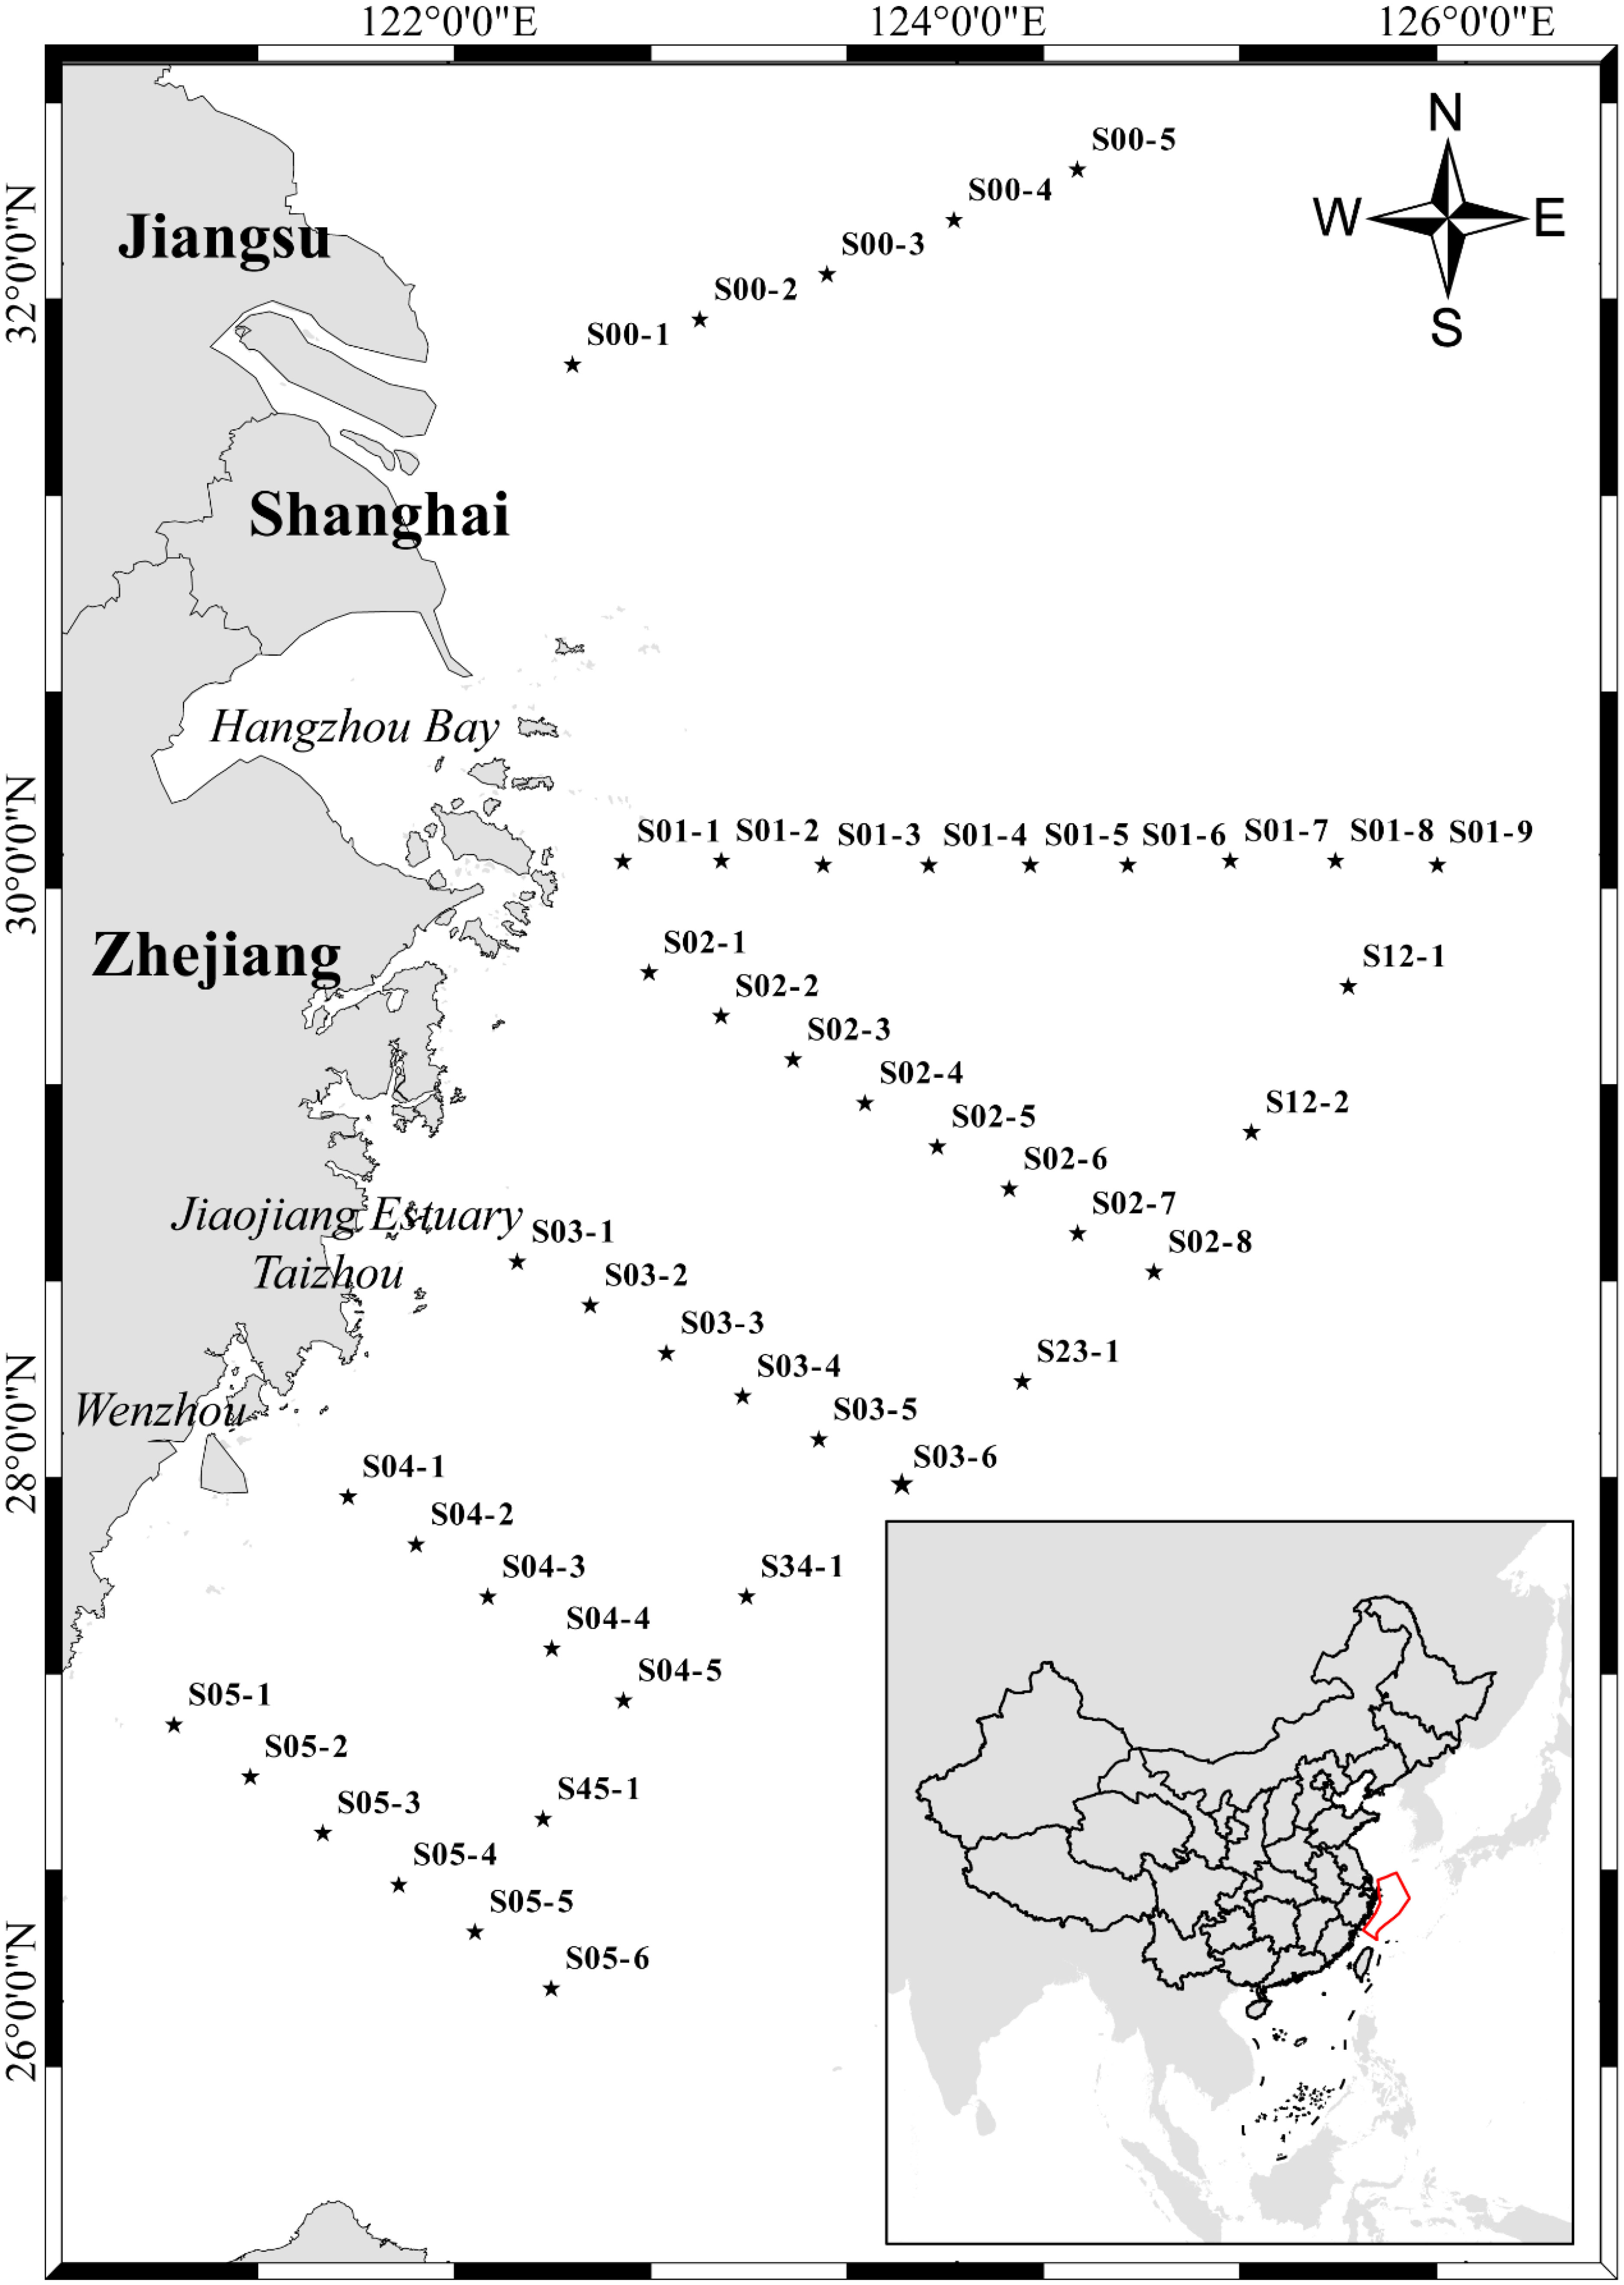
Figure 1 Map of the study area and sampling locations. The star point represents the station. The station name is marked in the top right corner of each station. Pentagrams indicate stations.
In this study, we used the Cyt-b sequences of Pampus argenteus, Pampus cinereus, Pampus chinensis, Pampus punctatissimus, and Pampus minor, which were closely related to the taxonomy of P. echinogaster, for the comparison and design of specific primers and TaqMan probe for P. echinogaster. The sequences were downloaded from the NCBI. The design method was as described in our previous study (Wang et al., 2020). The specificity of primers and TaqMan probe were verified in silico and in vitro.
eDNA extraction was performed according to a previously developed eDNA method (Wang et al., 2022). Specifically, the eDNA trapped on the filters obtained from the East China Sea was extracted using a DNeasy Blood & Tissue kit (Qiagen, Hilden, Germany). The inhibitors were removed using a OneStep PCR Inhibitor Removal Kit (Zymo Research, Orange County, California, USA). Then, real-time PCR was conducted through two-step cycling protocols. The reagents used were 10 μL of TaqmanTM Fast Advanced Master Mix (Thermo Fisher Scientific), 0.4 μL of each primer (10 μM), 0.2 μL of TaqMan probe (10 μM), 4 μL of eDNA template, and 5 μL of PCR-grade water (Sangon, Shanghai, China). All samples were taken in triplicate. To monitor contamination, negative controls (pure water as template) were also analyzed with the same protocol.
Environmental variables such as total depth, water-sampling depth, temperature, salinity (Practical salinity units, PSU), oxygen, turbidity, chlorophyll, , , , , and were determined and supplied by the First Institute of Oceanography Ministry of Natural Resources.
All statistical analyses were performed using R software version 4.1.2. “pheatmap” is a heatmap package that is rigorous in graphics drawing and parameter modification. “ggbiplot” is an R package tool for visualization of perform principal component analysis (PCA) results. The Kruskal–Wallis test was used to assess statistical differences in eDNA concentrations between water layers and between stations. Environmental factors in relation to logarithm-transformed eDNA concentrations (i.e., ln([eDNA]+1)) were calculated using the “pheatmap” package. The “ggbiplot” package was used for PCA.
The sampling stations and spatial distribution were visualized using ArcMap10.8, Sufer 15 and Ocean Data view 4 software.
A set of P. echinogaster-specific primers and probe were developed to amplify a 125 bp sequence based on Cyt-b. P. echinogaster primers and probe were designed. The primers were as F: 5′-AGATGTCGTTCTGAGGAGCTACC-3′, R: 5′-GAATCGGGTTAGGGTGGCAT-3′. The TaqMan probe was as: 5′-FAM-TCATTACCAATCTTCTATCCGC-MGB-3′. Figure 2 shows the full sequence amplified and the sequence of the closely related species with P. echinogaster.
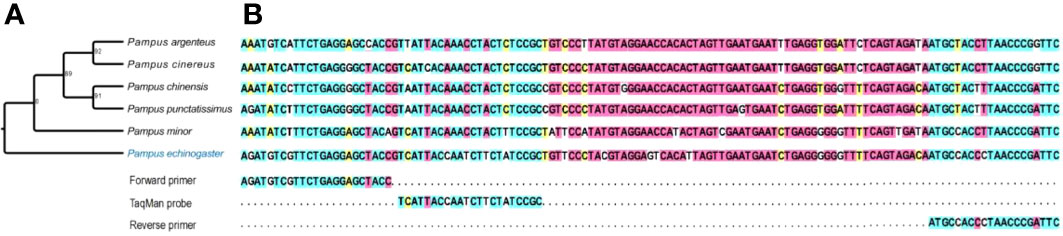
Figure 2 Phylogenetic tree of P. echinogaster based on Cyt-b sequences (A) and aligned with its closely related species (B).
The primers and TaqMan probe were tested in silico (primer blast tool in NCBI) and in vitro (DNA extracted from P. echinogaster and its taxonomy relative species tissue). Results showed that the primers and probe were highly specific and amplified only the target species.
Ten‐fold serial dilutions of the plasmid standard, ranging from 8.0 × 10⁷ copies/μL to 8.0 × 101 copies/μL, were analyzed in triplicate to produce a linear calibration curve for this range when the cycle threshold (Ct) was plotted against the logarithm of the target concentration. The qPCR assay had an average amplification efficiency of 95.90% (range 94.16%–97.63%) and an average R2 value of 0.996 (range: 0.994–0.998) for the standard curve. Positive signals were detected in 68 out of 178 samples, accounting for 38.20% of the total. All extraction negative controls showed no positive amplification, indicating the absence of contamination during DNA extraction. The limit of detection was 3.2 copies/4 μL sample, and the limit of quantification was 32 copies/4 μL sample for P. echinogaster.
Amongst the 178 water samples collected at 44 stations, 68 water samples (or 38.20% of all) showed positive signals. No significant difference existed in eDNA concentration between stations and layers. A series of stations labeled S02 was used as a line to divide the stations into a northern half and a southern half. Statistical analysis revealed significant differences in eDNA concentrations between the northern and southern halves of the stations (chi-squared = 10.119, df = 1, p-value = 0.001467< 0.01). The eDNA hotspots of P. echinogaster were primarily concentrated around the southern half of the S03-1 (Taizhou), S03-2, S02-6, and S02-7 (g-h in Figure 3). The eDNA in the northern half was primarily concentrated at the offshore side at 123° E–125° E, in 0–40 m water depth (a-c and i-k in Figure 3). The southern half of the eDNA hotspot was mostly found in the 0–20 m shallow nearshore areas from 122° E-123°E (Figures 3D–F). Considering the vertical influence of the sampled water column on eDNA, the water layers were divided into five according to the station depth, with higher eDNA concentrations detected in layers 1 and Layer 3 (Figure 4). However, the differences between the different layers were not significant. Except for layer 2, most eDNA hotspots were concentrated in the southern half. The distribution characteristics of P. echinogaster may be related to the habitat preferences and life history.
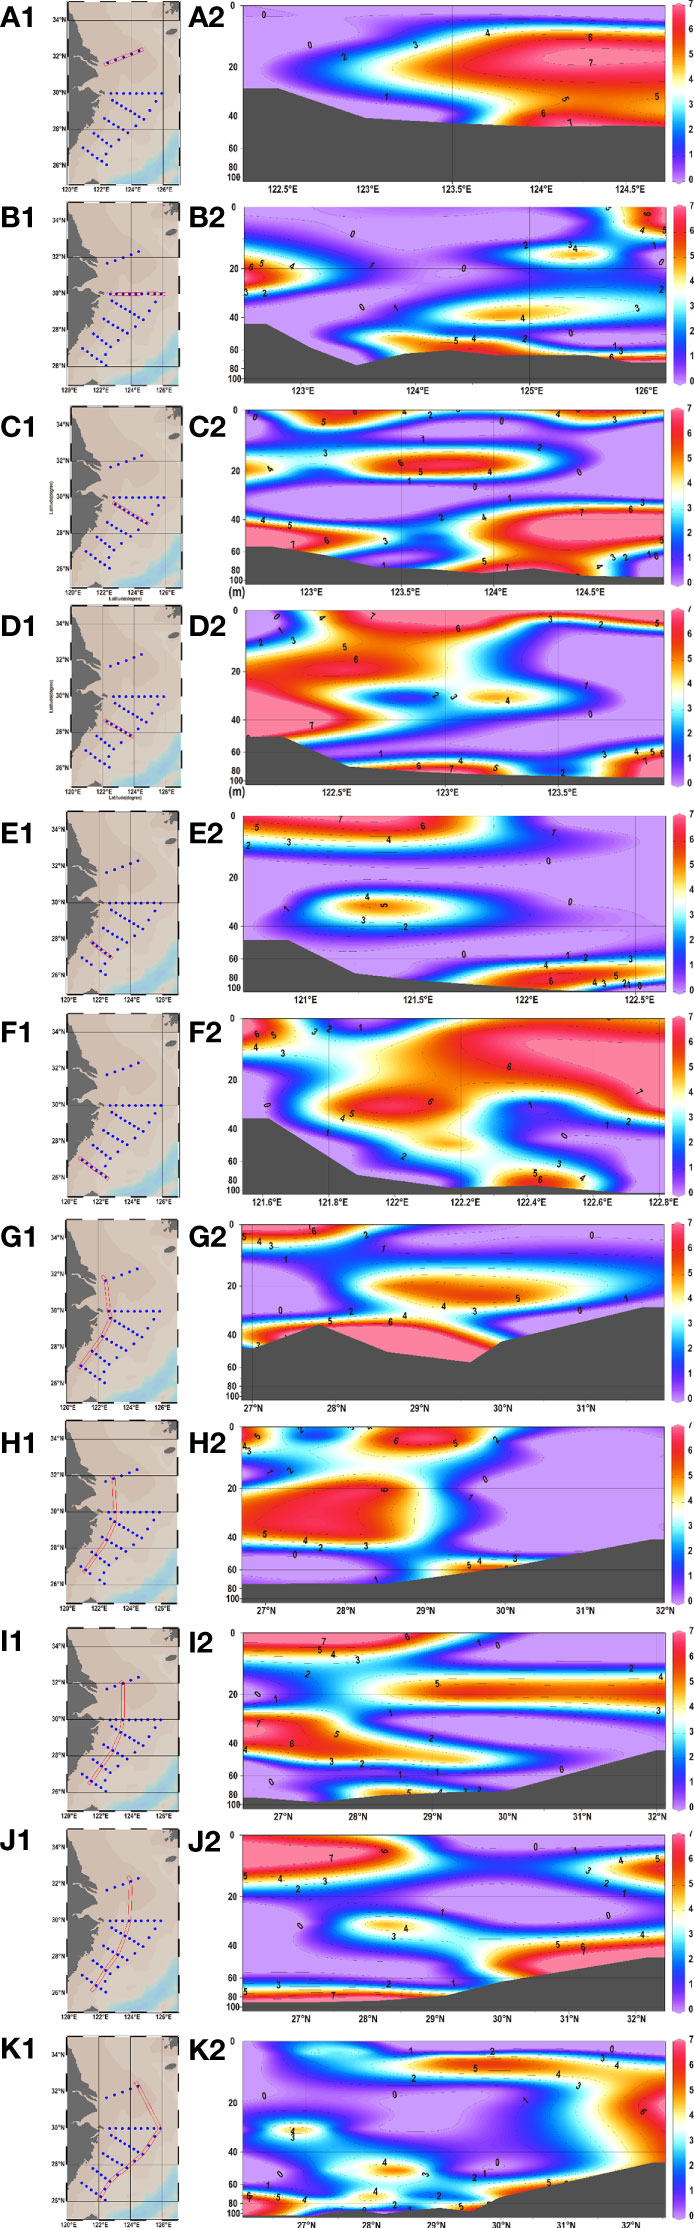
Figure 3 Vertical distributions of P. echinogaster eDNA along different longitude and latitude sections in the East China Sea. Figures (A–F) and (J–G) show the eDNA distribution for different latitudinal and longitudinal sections, respectively. Log-transformed eDNA concentration values are indicated by color gradients. The dark gray areas indicate the sea bottom.
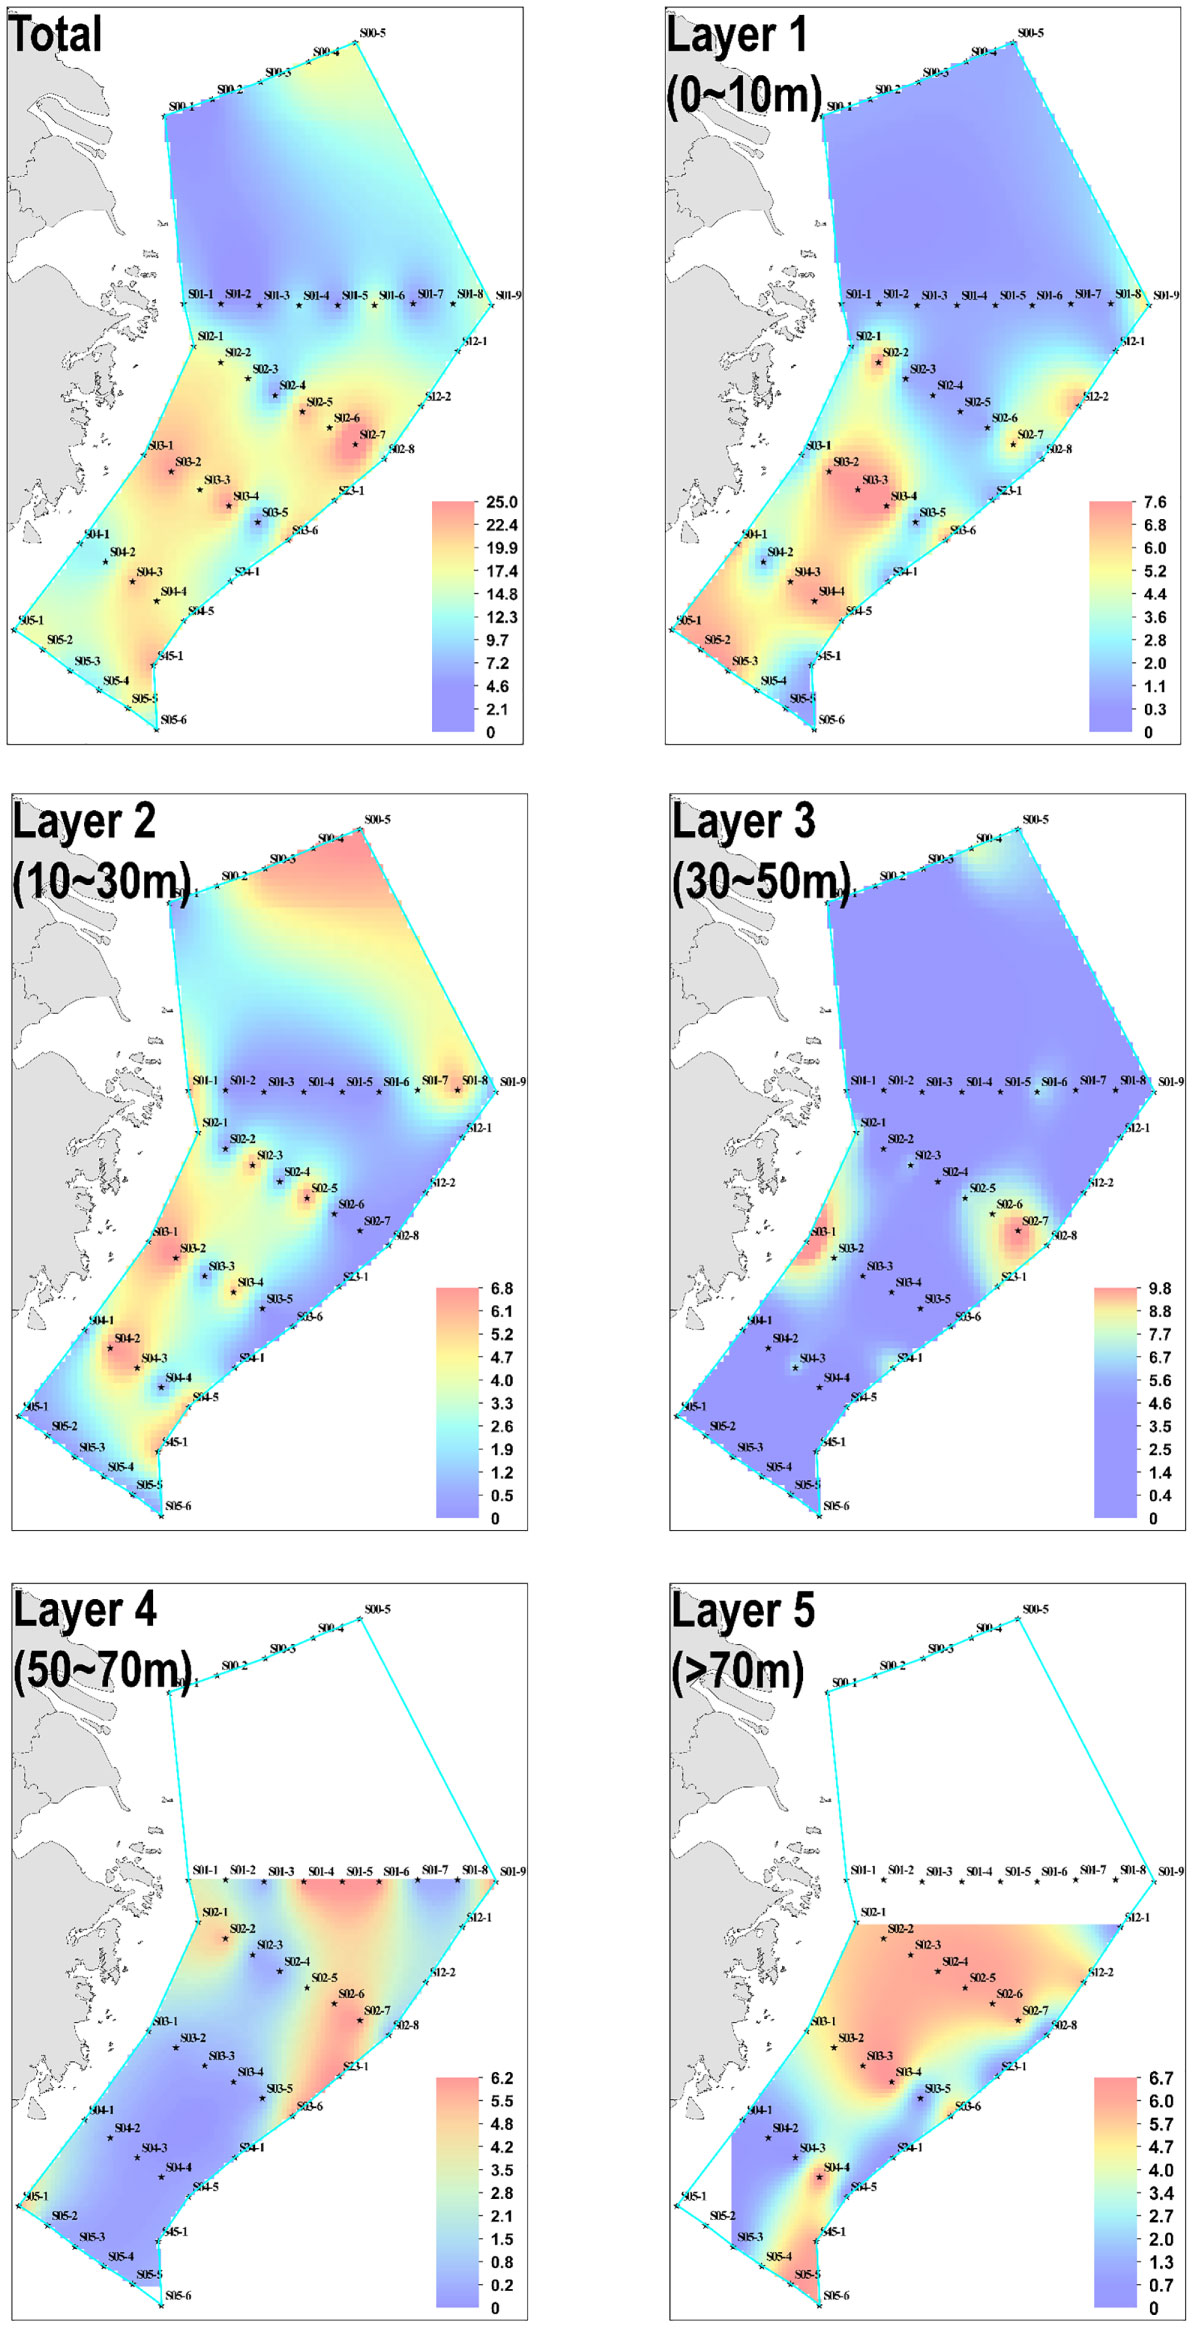
Figure 4 Horizontal distribution of P. echinogaster eDNA in the East China Sea. Layers 1–5 show the distribution of eDNA in different water layers, and the total is the sum of the eDNA concentrations of the five water layers. Cool to warm colors represent low to high concentrations of eDNA.
PCA is a technique to reduce the dimensionality of large datasets’ increasing interpretability whilst simultaneously minimizing information loss (Jolliffe and Cadima, 2016). Samples’ environmental variables were reduced into two principal components and represented as a two-dimensional plot (Figure 5A). PC1 explained 29.9% and PC2 explained 28.2%. PC1 was primarily explained by , , , and temperature, which represented nutrition. PC2 was primarily explained by salinity, oxygen, depth, total depth, and chlorophyll, which represented locations and layers. The groupings of P. echinogaster presence and absence detected with eDNA largely overlapped.
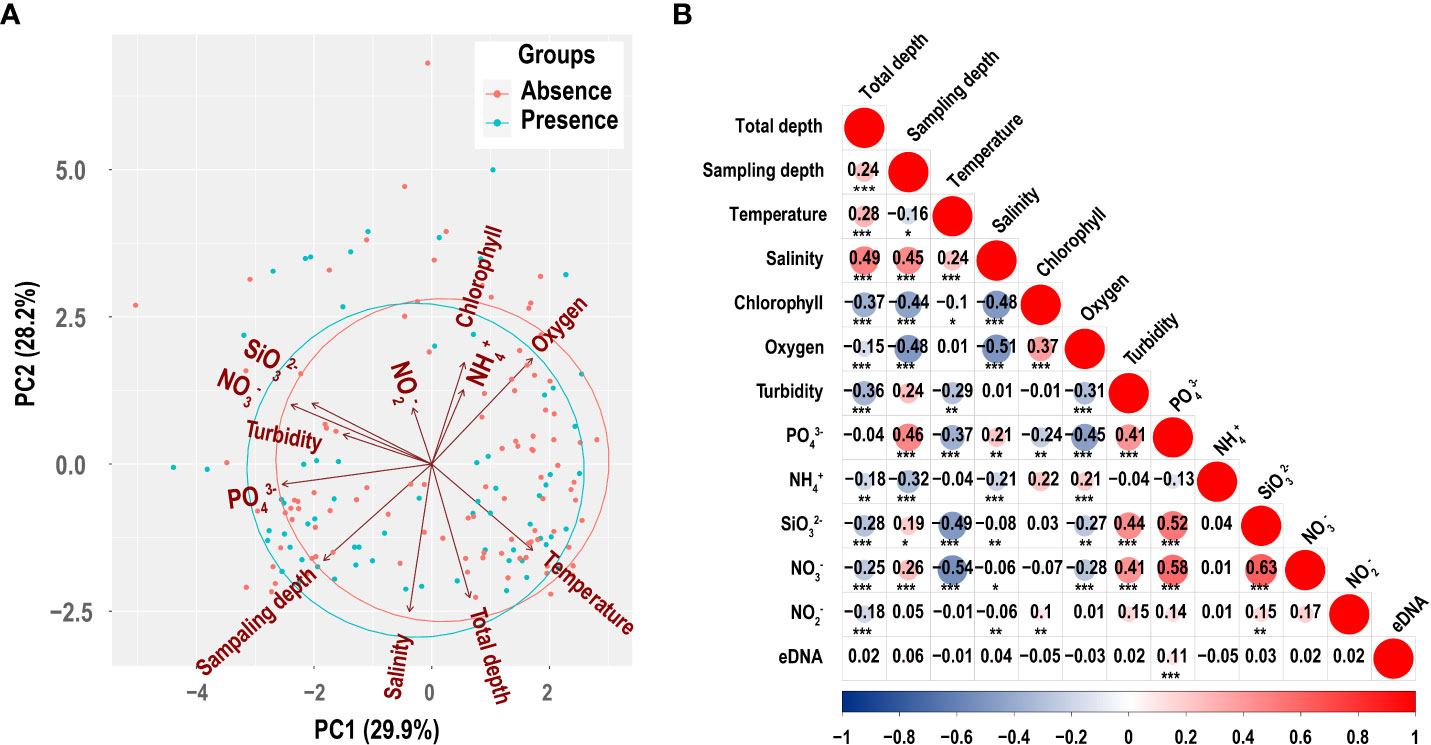
Figure 5 Principal component analysis (PCA) of environmental factors (A) and the correlation between environmental factors with the concentration of P. echinogaster eDNA (B). Numbers indicate correlation coefficients between variables. Circle size is proportional to correlation. In addition, red circles represent positive correlation and blue represent negative correlation. The significance level is marked with * (0.05< p ≤ 0.1), ** (0.01< p ≤ 0.05), and *** (p ≤ 0.01).
Amongst all environmental factors, most environmental factors were significantly correlated with one another, but only showed a significant positive correlation with eDNA concentration (Figure 5B). Figure 6 shows the corresponding relationship between P. echinogaster eDNA concentration of the positive samples and environmental variables. Except for , the values of other environmental variables were more concentrated, with the variation intervals of chlorophyll, , , and concentrated in 0–1.25 μmol/L, oxygen (3.75–5.0 mg/L), (0–10 μmol/L), salinity (30–35‰), temperature (15–25°C), and turbidity (0–5 NTU). The highest number of positive eDNA samples, 16 samples, was found in the 0–10 water depth range.
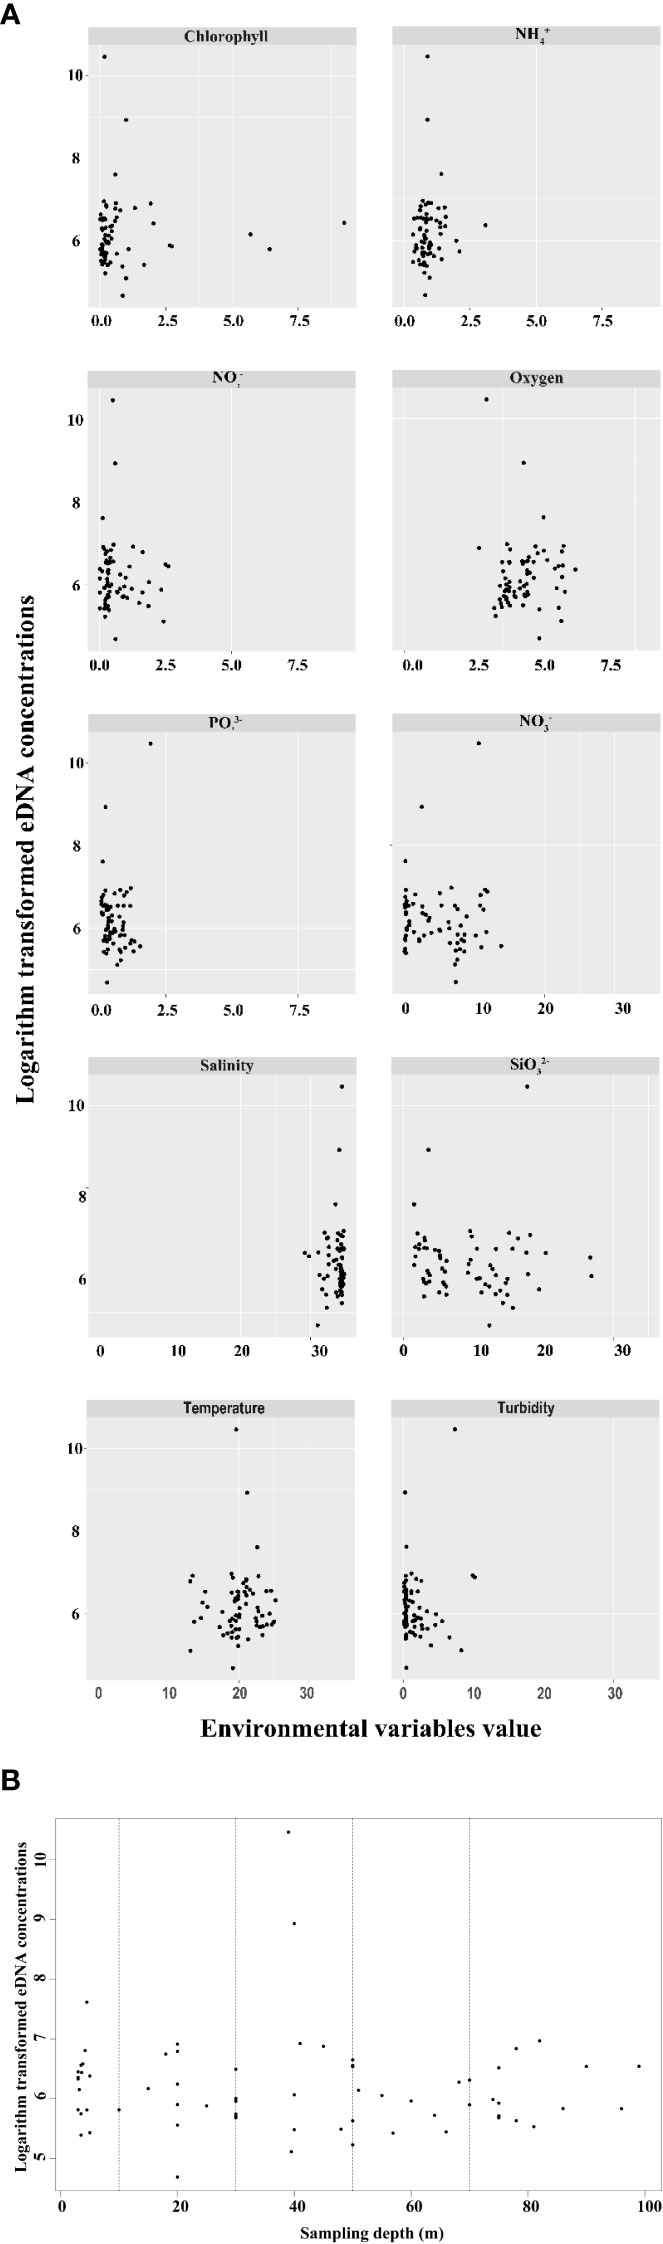
Figure 6 Scatter plot of the relationship between the positive sites of P. echinogaster eDNA and environmental variables. The x-axis represents environmental variables (A) and sampling depth (B). The y-axis represents logarithm-transformed eDNA concentrations. Black spots denote sampling sites.
We used an eDNA approach to demonstrate P. echinogaster distribution in the East China Sea. The biomass and distributions reflected by the eDNA were consistent with previous P. echinogaster surveys conducted using traditional methods in the East China Sea (Yamada et al., 2007). This finding indicated the validity of the eDNA approach and its great application. The East China Sea has two major P. echinogaster populations, namely, a northern population along the Jiangsu coast and a southern population along the Zhejiang coast, with the Yangtze River estuary as the boundary (Yamada et al., 2007). The northern population spawns primarily from Haizhou Bay to the Yangtze River estuary. The spawning period is from July to August. The southern population spawns earlier than the northern one, usually between April and June, with a peak in May (Zhou and Li, 2018). Spawning grounds are primarily concentrated in the coastal area of Zhejiang and Fujian (Zhou and Li, 2018). Our survey coincided with the peak spawning period of the southern population. eDNA showed eDNA hotspots near the coast of Taizhou and Wenzhou (S03-1 and S03-2). Additionally, significant differences existed in eDNA concentrations between the south and north. All these results were supported by the findings of previous trawl surveys (Yamada et al., 2007). However, compared with trawling methods, the eDNA method used in the current work enabled the investigation of species distribution over large areas of flowing water through only a few sampling points, with significant savings in time and cost (Jerde et al., 2011; Smart et al., 2016). The eDNA method can also monitor species distributions in the ocean at large scales in the absence of invasion (Tucker et al., 2016; Doi et al., 2021; Wang et al., 2022). These features confer eDNA with more potential for development in large lotic water scenarios. Continuous improvement in current eDNA monitoring methods is needed (Goldberg et al., 2013; Jane et al., 2015; Hansen et al., 2018; Hinlo et al., 2018; Tillotson et al., 2018; Shogren et al., 2019; Duda et al., 2020; Spence et al., 2020; Antognazza et al., 2021). Nevertheless, given the disadvantages of traditional survey methods, eDNA remains a new and improved survey tool that can be used for large-scale surveys at an early stage of research.
The paucity of spawning ground data hinders the effective development and implementation of fish-stock assessment and management strategies (Erisman et al., 2015). Thus, the identification of P. echinogaster spawning grounds can guide the development of resource-recovery strategies. In the natural environment, P. echinogaster spawning sites are often near the estuary of rivers and in areas where salt and fresh water alternate (Zhou and Li, 2018). With the long flooding period in the Jiaojiang estuary, nutrients are abundant in the waters of this area, resulting in more plankton and other organisms at the bottom of the food chain (Guo et al., 2004; Chen, 2014). This sea area provides rich bait resources for P. echinogaster growth. Research on the biology of P. echinogaster has also shown that juveniles are more abundant in the south-central Zhejiang waters (Wenzhou and Taizhou) (Wang, 2020). Accordingly, we speculated that the nearshore of south-central Zhejiang was the main spawning grounds for the southern population of P. echinogaster. In the future, a reserve could be established for this area to better restore its resources. Developments in molecular analysis techniques can greatly improve the measurement of spawning events and help us understand the dynamics of spawning and fertilization in nature. However, there are still many uncertainties in predicting fish spawning grounds through eDNA. For example, the buoyancy of cells can cause gametes to sink to greater depths or float to the surface, which may affect the eDNA signal (Falkenberg et al., 2016; Hayer et al., 2020). High-flow environments reduce the concentration of eggs, which also challenges the accuracy of eDNA (Jerde et al., 2016; Shogren et al., 2017). In addition, other factors such as temperature, photoperiod, egg activity and growth levels can also affect spawning and related spawning activity (Erickson et al., 2016; Bayer et al., 2019). These complex factors should therefore be carefully considered when using eDNA to assess spawning events in fish.
eDNA reportedly has a residence time of several hours in the marine environment (Murakami et al., 2019). The eDNA approach has also been suggested for shorter period surveys (Doi et al., 2017). Notably, the behavior of the animals themselves alters the occurrence/presence of eDNA. For example, seasonal and vertical migrations may be affected by hydrodynamic movements that affect animal behavior. These behavior changes may in turn affect the eDNA signal (Croll et al., 2005; Schadewell and Adams, 2021). P. echinogaster is a migratory fish in the middle and upper layers (Oh et al., 2010). In summer, after spawning, they disperse in the coastal bait fattening. At the end of autumn, the water temperature drops and the population migrates offshore to deeper water for overwintering. In winter, they primarily reside in deeper waters offshore. In spring, the strengthening of the warm current in Taiwan causes the fish to migrate offshore into reef waters for spawning (Zhou and Li, 2018). Our results reflect the migratory route and life history of P. echinogaster (e.g., the positive eDNA signals in deep waters off the northern distal coast may reflect the spawning migratory Jiangsu population, and the southern inshore eDNA hotspot may be provided by juveniles). However, more research is needed to corroborate the results of eDNA analysis because studies on the complex ocean environment that do not consider life history or migration route cannot lead to conclusions about precise distribution and abundance.
Many environmental variables can influence the distribution of marine species (Schlaff et al., 2014; Tommasi et al., 2017). Understanding the interaction of environmental factors with the species is essential to study their potential distribution and resource conservation. In the present study, PCA analysis was performed by conducting 12 environmental variables per sampling site in relation to the presence/absence of P. echinogaster eDNA. Results showed that the group of presence and absence detected with eDNA largely overlapped. It may be related to the strong environmental adaptability of P. echinogaster and indicates that other factors may affect the distribution and aggregation behavior of P. echinogaster and its wide distribution in the East China Sea. Amongst the measured environmental factors, only was significantly positively correlated with eDNA concentration. This finding indicated that P. echinogaster had high adaptability to the environment and can survive its various types (Yamada et al., 2007). In addition to the proven influence of abiotic factors, other organisms in the ocean also affect the distribution and amount of eDNA (Salter, 2018). eDNA can be spread as well as to areas through the diet of predators (Guilfoyle and Schultz, 2017). Therefore, further characterizing the role that biotic factors play on eDNA and how they interact with environmental variables is an important link to using eDNA method for the implementation of marine fish resource management and conservation.
In this study, despite the relatively high detection rate of eDNA at many sampling sites, the information on the spatial resolution of these assays is uncertain. The eDNA method does not provide details of individuals of the target species such as length, weight and growth stage (Deutschmann et al., 2019; Kasai et al., 2021; Wang et al., 2022). We are therefore unable to determine whether these positive signals are from larvae or adult fish. Uncertainties still remain, such as how the various currents affect the transport, degradation and dilution of eDNA in lotic systems, and how the probability of detection varies with distance from the eDNA source (Jane et al., 2015; Hansen et al., 2018; Duda et al., 2020; Spence et al., 2020). It is for these reasons that careful consideration of the ecological details of eDNA is essential in the specific application (Bohmann et al., 2014; Rees et al., 2014; Thomsen and Willerslev, 2015; Goldberg et al., 2016; Fukaya et al., 2021).
The original contributions presented in the study are included in the article/Supplementary Material. Further inquiries can be directed to the corresponding author.
HZ, data curation, formal analysis, writing of original draft, software, methodology, and validation. YL, TG, and LZ, writing (reviewing and editing). XW, supervision, software, methodology, writing (reviewing and editing), funding acquisition, and project administration. All authors contributed to the article and approved the submitted version.
This study was funded by the National Natural Science Foundation of China (41806180), the Science and Technology Project of Zhoushan (2022C41010), the Province Key Research and Development Program of Zhejiang (2021C02047) and the Shared Voyage Program of the National Natural Science Foundation of China in the East China Sea (NORC2019-02, Xiangyanghong 18).
We are also grateful to the researchers of the First Institute of Oceanography Ministry of Natural Resources for measuring environmental data.
The authors declare that the research was conducted in the absence of any commercial or financial relationships that could be construed as a potential conflict of interest.
All claims expressed in this article are solely those of the authors and do not necessarily represent those of their affiliated organizations, or those of the publisher, the editors and the reviewers. Any product that may be evaluated in this article, or claim that may be made by its manufacturer, is not guaranteed or endorsed by the publisher.
The Supplementary Material for this article can be found online at: https://www.frontiersin.org/articles/10.3389/fmars.2022.992377/full#supplementary-material
Antognazza C. M., Britton J. R., De Santis V., Kolia K., Turunen O. A., Davies P., et al. (2021). Environmental DNA reveals the temporal and spatial extent of spawning migrations of European shad in a highly fragmented river basin. Aquat. Conserv.: Mar. Freshw. Ecosyst. 31 (8), 2029–2040. doi: 10.1002/aqc.3601
Barnes M. A., Turner C. R. (2015). The ecology of environmental DNA and implications for conservation genetics. Conserv. Genet. 17 (1), 1–17. doi: 10.1007/s10592-015-0775-4
Bayer S. R., Countway P. D., Wahle R. A. (2019). Developing an eDNA toolkit to quantify broadcast spawning events of the sea scallop Placopecten magellanicus: Moving beyond fertilization assays. Mar. Ecol. Prog. Ser. 621, 127–141. doi: 10.3354/meps12991
Bohmann K., Evans A., Gilbert M. T., Carvalho G. R., Creer S., Knapp M., et al. (2014). Environmental DNA for wildlife biology and biodiversity monitoring. Trends Ecol. Evol. 29 (6), 358–367. doi: 10.1016/j.tree.2014.04.003
Boussarie G., Bakker J., Wangensteen O. S., Mariani S., Bonnin L., Juhel J. B., et al. (2018). Environmental DNA illuminates the dark diversity of sharks. Sci. Adv. 4 (5), eaap9661. doi: 10.1126/sciadv.aap9661
Coble A. A., Flinders C. A., Homyack J. A., Penaluna B. E., Cronn R. C., Weitemier K. (2019). eDNA as a tool for identifying freshwater species in sustainable forestry: A critical review and potential future applications. Sci. Total Environ. 649, 1157–1170. doi: 10.1016/j.scitotenv.2018.08.370
Croll D. A., Marinovic B., Benson S., Chavez F. P., Nancy. B., Ternullo R., et al. (2005). From wind to whales: Trophic links in a coastal upwelling system. Mar. Ecol. Prog. Ser. 289, 117–130. doi: 10.3354/meps289117
Deiner K., Bik H. M., Machler E., Seymour M., Lacoursiere-Roussel A., Altermatt F., et al. (2017). Environmental DNA metabarcoding: Transforming how we survey animal and plant communities. Mol. Ecol. 26 (21), 5872–5895. doi: 10.1111/mec.14350
Dejean T., Valentini A., Miquel C., Taberlet P., Bellemain E., Miaud C. (2012). Improved detection of an alien invasive species through environmental DNA barcoding: The example of the American bullfrog Lithobates catesbeianus. J. Appl. Ecol. 49 (4), 953–959. doi: 10.1111/j.1365-2664.2012.02171.x
de Souza L. S., Godwin J. C., Renshaw M. A., Larson E. (2016). Environmental DNA (eDNA) detection probability is influenced by seasonal activity of organisms. PloS One 11 (10), e0165273. doi: 10.1371/journal.pone.0165273
Deutschmann B., Muller A. K., Hollert H., Brinkmann M. (2019). Assessing the fate of brown trout (Salmo trutta) environmental DNA in a natural stream using a sensitive and specific dual-labelled probe. Sci. Total Environ. 655, 321–327. doi: 10.1016/j.scitotenv.2018.11.247
Doi H., Pochon X., Zaiko A., Fletcher L. M., Laroche O., Wood S. A. (2017). Wanted dead or alive? Using metabarcoding of environmental DNA and RNA to distinguish living assemblages for biosecurity applications. PloS One 12 (11), e0187636. doi: 10.1371/journal.pone.0187636
Doi H., Ramón-Laca A., Wells A., Park L. (2021). A workflow for the relative quantification of multiple fish species from oceanic water samples using environmental DNA (eDNA) to support large-scale fishery surveys. PloS One 16 (9), e0257773. doi: 10.1371/journal.pone.0257773
Duda J. J., Hoy M. S., Chase D. M., Pess G. R., Brenkman S. J., McHenry M. M., et al. (2020). Environmental DNA is an effective tool to track recolonizing migratory fish following large-scale dam removal. Environ. DNA 3 (1), 121–141. doi: 10.1002/edn3.134
Erickson R. A., Rees C. B., Coulter A. A., Merkes C. M., McCalla S. G., Touzinsky K. F., et al. (2016). Detecting the movement and spawning activity of bigheaded carps with environmental DNA. Mol. Ecol. Resour. 15 (4), 957–965. doi: 10.1111/1755-0998.12533
Erisman B., Heyman W., Kobara S., Ezer T., Pittman S., Aburto-Oropeza O., et al. (2015). Fish spawning aggregations: Where well-placed management actions can yield big benefits for fisheries and conservation. Fish Fish. 18 (1), 128–144. doi: 10.1111/faf.12132
Falkenberg L. J., Havenhand J. N., Styan C. A. (2016). Sperm accumulated against surface: A novel alternative bioassay for environmental monitoring. Mar. Environ. Res. 114, 51–57. doi: 10.1016/j.marenvres.2015.12.005
Ficetola G. F., Miaud C., Pompanon F., Taberlet P. (2008). Species detection using environmental DNA from water samples. Biol. Lett. 4 (4), 423–425. doi: 10.1098/rsbl.2008.0118
Fishery and Fishery Administration of the Ministry of Agriculture and Rural Areas, National Aquatic Technology Promotion Terminal, Fisheries, Chinese Society of Fisheries (2020). China fishery statistical yearboo (Beijing, China: China Agriculture Press).
Fukaya K., Murakami H., Yoon S., Minami K., Osada Y., Yamamoto S., et al. (2021). Estimating fish population abundance by integrating quantitative data on environmental DNA and hydrodynamic modelling. Mol. Ecol. 30 (13), 3057–3067. doi: 10.1111/mec.15530
Goldberg C. S., Sepulveda A., Ray A., Baumgardt J., Waits L. P. (2013). Environmental DNA as a new method for early detection of new Zealand mudsnails (Potamopyrgus antipodarum). Freshw. Sci. 32 (3), 792–800. doi: 10.1899/13-046.1
Goldberg C. S., Turner C. R., Deiner K., Klymus K. E., Thomsen P. F., Murphy M. A., et al. (2016). Critical considerations for the application of environmental DNA methods to detect aquatic species. Methods Ecol. Evol. 7 (11), 1299–1307. doi: 10.1111/2041-210x.12595
Guilfoyle M. P., Schultz M. T. (2017). The contribution of doublecrested cormorants (Phalacrocorax auritus) to silver carp (Hypophthalmichthys molitrix) DNA loads in the Chicago area waterway system. J. Great Lakes Res. 43, 1181–1185. doi: 10.1016/j.jglr.2017.09.008
Guo B. H., Huang Z. Z., Li P. Y., Ji W. D., Liu G. Y., Xu J. P. (2004). Marine environment in China offshore and adjacent seas (Beijing, China: China Ocean Press).
Hansen B. K., Bekkevold D., Clausen L. W., Nielsen E. E. (2018). The sceptical optimist: Challenges and perspectives for the application of environmental DNA in marine fisheries. Fish Fish. 19 (5), 751–768. doi: 10.1111/faf.12286
Hayer C.-A., Bayless M. F., George A., Thompson N., Richter C. A., Chapman D. C. (2020). Use of environmental DNA to detect grass carp spawning events. Fishes 5 (3), 27. doi: 10.3390/fishes5030027
Hinlo R., Lintermans M., Gleeson D., Broadhurst B., Furlan E. (2018). Performance of eDNA assays to detect and quantify an elusive benthic fish in upland streams. Biol. Invasion 20 (11), 3079–3093. doi: 10.1007/s10530-018-1760-x
Hoegh-Guldberg O., Bruno J. F. (2010). The impact of climate change on the world’s marine ecosystems. Science 328 (5985), 1523–1528. doi: 10.1126/science.1189930
Itakura H., Wakiya R., Yamamoto S., Kaifu K., Sato T., Minamoto T. (2019). Environmental DNA analysis reveals the spatial distribution, abundance, and biomass of Japanese eels at the river-basin scale. Aquat. Conserv.: Mar. Freshw. Ecosyst. 29 (3), 361–373. doi: 10.1002/aqc.3058
Jane S. F., Wilcox T. M., McKelvey K. S., Young M. K., Schwartz M. K., Lowe W. H., et al. (2015). Distance, flow and PCR inhibition: eDNA dynamics in two headwater streams. Mol. Ecol. Resour. 15 (1), 216–227. doi: 10.1111/1755-0998.12285
Jerde C. L., Mahon A. R., Chadderton W. L., Lodge D. M. (2011). “Sight-unseen” detection of rare aquatic species using environmental DNA. Conserv. Lett. 4 (2), 150–157. doi: 10.1111/j.1755-263X.2010.00158.x
Jerde C. L., Olds B. P., Shogren A. J., Andruszkiewicz E. A., Mahon A. R., Bolster D., et al. (2016). Influence of stream bottom substrate on retention and transport of vertebrate environmental DNA. Environ. Sci. Technol. 50 (16), 8770–8779. doi: 10.1021/acs.est.6b01761
Jolliffe I. T., Cadima J. (2016). Principal component analysis: A review and recent developments. Philos. Trans. R. Soc. A-Math. Phys. Eng. Sci. 374 (2065), 20150202. doi: 10.1098/rsta.2015.0202
Kasai A., Yamazaki A., Ahn H., Yamanaka H., Kameyama S., Masuda R., et al. (2021). Distribution of Japanese eel Anguilla japonica revealed by environmental DNA. Front. Ecol. Evol. 9. doi: 10.3389/fevo.2021.621461
Lacoursière-Roussel A., Rosabal M., Bernatchez L. (2016). Estimating fish abundance and biomass from eDNA concentrations: Variability among capture methods and environmental conditions. Mol. Ecol. Resour. 16 (6), 1401–1414. doi: 10.1111/1755-0998.12522
Li Y., Zhou Y., Li P., Gao T., Lin L. (2019). Species identification and cryptic diversity in Pampus species as inferred from morphological and molecular characteristics. Mar. Biodivers. 49 (6), 2521–2534. doi: 10.1007/s12526-019-00976-6
Maruyama A., Sugatani K., Watanabe K., Yamanaka H., Imamura A. (2018). Environmental DNA analysis as a non-invasive quantitative tool for reproductive migration of a threatened endemic fish in rivers. Ecol. Evol. 8 (23), 11964–11974. doi: 10.1002/ece3.4653
McClanahan T., Allison E. H., Cinner J. E. (2015). Managing fisheries for human and food security. Fish Fish. 16 (1), 78–103. doi: 10.1111/faf.12045
McKelvey K. S., Young M. K., Knotek W. L., Carim K. J., Wilcox T. M., Padgett-Stewart T. M., et al. (2016). Sampling large geographic areas for rare species using environmental DNA: A study of bull trout Salvelinus confluentus occupancy in western Montana. J. Fish Biol. 88 (3), 1215–1222. doi: 10.1111/jfb.12863
Miya M., Sato Y., Fukunaga T., Sado T., Poulsen J. Y., Sato K., et al. (2015). MiFish, a set of universal PCR primers for metabarcoding environmental DNA from fishes: Detection of more than 230 subtropical marine species. R. Soc. Open Sci. 2 (7), 150088. doi: 10.1098/rsos.150088
Murakami H., Yoon S., Kasai A., Minamoto T., Yamamoto S., Sakata M. K., et al. (2019). Correction to: Dispersion and degradation of environmental DNA from caged fish in a marine environment. Fish. Sci. 85 (6), 1109–1109. doi: 10.1007/s12562-019-01341-z
Nakabo T. (2002). Fishes of Japan with pictorial keys to the species (II), second edition (Kanagawa, Japan: Tokai University Press).
Oh C. W., Na J. H., Kim J. K. (2010). Population biology of Korean pomfret Pampus echinogaster (Basilewsky 1855) (Perciformes: Stromateidae) on the western coast of Korea, Yellow Sea. Anim. Cells Syst. 13 (1), 83–89. doi: 10.1080/19768354.2009.9647197
Pikitch E. K., Rountos K. J., Essington T. E., Santora C., Pauly D., Watson R., et al. (2012). The global contribution of forage fish to marine fisheries and ecosystems. Fish Fish. 15 (1), 43–64. doi: 10.1111/faf.12004
Rees H. C., Maddison B. C., Middleditch D. J., Patmore J. R. M., Gough K. C., Crispo E. (2014). Review: The detection of aquatic animal species using environmental DNA - a review of eDNA as a survey tool in ecology. J. Appl. Ecol. 51 (5), 1450–1459. doi: 10.1111/1365-2664.12306
Rudolph T. B., Ruckelshaus M., Swilling M., Allison E. H., Osterblom H., Gelcich S., et al. (2020). A transition to sustainable ocean governance. Nat. Commun. 11 (1), 3600. doi: 10.1038/s41467-020-17410-2
Salter I. (2018). Seasonal variability in the persistence of dissolved environmental DNA (eDNA) in a marine system: The role of microbial nutrient limitation. PloS One 13 (2), e0192409. doi: 10.1371/journal.pone.0192409
Salter I., Joensen M., Kristiansen R., Steingrund P., Vestergaard P. (2019). Environmental DNA concentrations are correlated with regional biomass of Atlantic cod in oceanic waters. Commun. Biol. 2, 461. doi: 10.1038/s42003-019-0696-8
Schadewell Y., Adams C. I. M. (2021). Forensics meets ecology – environmental DNA offers new capabilities for marine ecosystem and fisheries research. Front. Mar. Sci. 8. doi: 10.3389/fmars.2021.668822
Schlaff A. M., Heupel M. R., Simpfendorfer C. A. (2014). Influence of environmental factors on shark and ray movement, behaviour and habitat use: A review. Rev. Fish Biol. Fish. 24 (4), 1089–1103. doi: 10.1007/s11160-014-9364-8
Shogren A. J., Tank J. L., Andruszkiewicz E., Olds B., Mahon A. R., Jerde C. L., et al. (2017). Controls on eDNA movement in streams: Transport, retention, and resuspension. Sci. Rep. 7 (1), 5065. doi: 10.1038/s41598-017-05223-1
Shogren A. J., Tank J. L., Egan S. P., Bolster D., Riis T. (2019). Riverine distribution of mussel environmental DNA reflects a balance among density, Transport, and removal processes. Freshw. Biol. 64 (8), 1467–1479. doi: 10.1111/fwb.13319
Sigsgaard E. E., Carl H., Møller P. R., Thomsen P. F. (2015). Monitoring the near-extinct European weather loach in Denmark based on environmental DNA from water samples. Biol. Conserv. 183, 46–52. doi: 10.1016/j.biocon.2014.11.023
Smart A. S., Weeks A. R., Rooyen A. R., Moore A., McCarthy M. A., Tingley R., et al. (2016). Assessing the cost-efficiency of environmental DNA sampling. Methods Ecol. Evol. 7 (11), 1291–1298. doi: 10.1111/2041-210x.12598
Spear M. J., Embke H. S., Krysan P. J., Vander Zanden M. J. (2020). Application of eDNA as a tool for assessing fish population abundance. Environ. DNA 3 (1), 83–91. doi: 10.1002/edn3.94
Spence B. C., Rundio D. E., Demetras N. J., Sedoryk M. (2020). Efficacy of environmental DNA sampling to detect the occurrence of endangered coho salmon (Oncorhynchus kisutch) in Mediterranean-climate streams of california’s central coast. Environ. DNA 3 (4), 727–744. doi: 10.1002/edn3.175
The Fishery Bureau of the Ministry of Agriculture (1999-2012). China fisheries yearbook (in Chinese) (Beijing, China: China Agriculture Press).
Thomsen P. F., Kielgast J., Iversen L. L., Wiuf C., Rasmussen M., Gilbert M. T., et al. (2012). Monitoring endangered freshwater biodiversity using environmental DNA. Mol. Ecol. 21 (11), 2565–2573. doi: 10.1111/j.1365-294X.2011.05418.x
Thomsen P. F., Willerslev E. (2015). Environmental DNA – an emerging tool in conservation for monitoring past and present biodiversity. Biol. Conserv. 183, 4–18. doi: 10.1016/j.biocon.2014.11.019
Tillotson M. D., Kelly R. P., Duda J. J., Hoy M., Kralj J., Quinn T. P. (2018). Concentrations of environmental DNA (eDNA) reflect spawning salmon abundance at fine spatial and temporal scales. Biol. Conserv. 220, 1–11. doi: 10.1016/j.biocon.2018.01.030
Tommasi D., Stock C. A., Hobday A. J., Methot R., Kaplan I. C., Eveson J. P., et al. (2017). Managing living marine resources in a dynamic environment: The role of seasonal to decadal climate forecasts. Prog. Oceanogr. 152, 15–49. doi: 10.1016/j.pocean.2016.12.011
Tucker A. J., Chadderton W. L., Jerde C. L., Renshaw M. A., Uy K., Gantz C., et al. (2016). A sensitive environmental DNA (eDNA) assay leads to new insights on ruffe (Gymnocephalus cernua) spread in north America. Biol. Invasion 18 (11), 3205–3222. doi: 10.1007/s10530-016-1209-z
Wang Y. (2020). A preliminary on the biological characteristics of Pampus echinogaster in southern Zhejiang (Shanghai, China: Shanghai Ocean University).
Wang X., Lu G., Zhao L., Yang Q., Gao T. (2020). Assessment of fishery resources using environmental DNA: Small yellow croaker (Larimichthys polyactis) in East China Sea. PloS One 15 (12), e0244495. doi: 10.1371/journal.pone.0244495
Wang X., Zhang H., Lu G., Gao T. (2022). Detection of an invasive species through an environmental DNA approach: The example of the red drum Sciaenops ocellatus in the East China Sea. Sci. Total Environ. 815, 152865. doi: 10.1016/j.scitotenv.2021.152865
Worm B., Hilborn R., Baum J. K., Branch T. A., Collie J. S., Costello C., et al. (2009). Rebuilding global fisheries. Science 325 (5940), 578–585. doi: 10.1126/science.1173146
Yamada U., Tagawa M., Hoshino K., Zhang B. (2009). Names and illustrations of fishes from the East China Sea and the Yellow Sea–Japanese/Chinese/Korean (Tokyo, Japan: Overseas Fishery Cooperation Foundation of Japan).
Yamada U., Tagawa M., Iric T., Hoshino K. (1995). Names and illustrations of fishes from the East China Sea and the Yellow Sea (Tokyo, Japan: Overseas Fishery Cooperation Foundation of Japan).
Yamada U., Tokimura M., Hiroshi H., Nakabo T. (2007). Fishes and fisheries of the East China and Yellow seas (Kanagawa: Tokai University Press).
Yan Y., Cheng Q. (2020). Study on molecular taxonomy of genus Pampus based on the complete mitochondrial genome structure. Mar. Fish. 44 (1), 31–44. doi: 10.13233/j.cnki.mar.fish.20211116.001
Yang W., Li J., Yue G. (2006). Multiplex genotyping of novel microsatellites from silver pomfret (Pampus argenteus) and cross-amplification in other pomfret species. Mol. Ecol. Notes 6, 1073–1075. doi: 10.1111/j.1471-8286.2006.01438.x
Zhang Q. (2007). The fishery resources and its sustainable utilization in the East China Sea region (Shanghai, China: Fudan University).
Keywords: Pampus echinogaster, qPCR, environmental DNA, distribution, East China Sea
Citation: Zhang H, Li Y, Zhong L, Gao T and Wang X (2022) Using environmental DNA method to clarify the distribution of Pampus echinogaster in the East China Sea. Front. Mar. Sci. 9:992377. doi: 10.3389/fmars.2022.992377
Received: 12 July 2022; Accepted: 30 August 2022;
Published: 16 September 2022.
Edited by:
Brett W. Molony, Oceans and Atmosphere (CSIRO), AustraliaReviewed by:
Doojin Hwang, Chonnam National University, South KoreaCopyright © 2022 Zhang, Li, Zhong, Gao and Wang. This is an open-access article distributed under the terms of the Creative Commons Attribution License (CC BY). The use, distribution or reproduction in other forums is permitted, provided the original author(s) and the copyright owner(s) are credited and that the original publication in this journal is cited, in accordance with accepted academic practice. No use, distribution or reproduction is permitted which does not comply with these terms.
*Correspondence: Xiaoyan Wang, d2FuZ3hpYW95YW5AempvdS5lZHUuY24=
Disclaimer: All claims expressed in this article are solely those of the authors and do not necessarily represent those of their affiliated organizations, or those of the publisher, the editors and the reviewers. Any product that may be evaluated in this article or claim that may be made by its manufacturer is not guaranteed or endorsed by the publisher.
Research integrity at Frontiers
Learn more about the work of our research integrity team to safeguard the quality of each article we publish.