 Jia-Jang Hung
 Wan-Tzu Lu2†
 Yen-Hui Lin
 Laodong Guo
95% of researchers rate our articles as excellent or good
Learn more about the work of our research integrity team to safeguard the quality of each article we publish.
Find out more
ORIGINAL RESEARCH article
Front. Mar. Sci. , 23 November 2022
Sec. Marine Biogeochemistry
Volume 9 - 2022 | https://doi.org/10.3389/fmars.2022.988340
This article is part of the Research Topic Carbon Dynamics in Freshwater, Coastal and Oceanic Ecosystems in Response to the SDG Goals View all 12 articles
This study examined the physical and biogeochemical processes that determine the spatial and summer/winter distributions of dissolved organic matter (DOM) and chromophoric dissolved organic matter (CDOM) in the Taiwan Strait (TS). The hydrological conditions in the TS varied between early summer and winter because of differences in terrestrial input as well as input from the poleward South China Sea Water (SCSW) during the warm summer and the strong, nutrient-rich, equatorward China Coastal Water (CCW) in winter. Concentrations of dissolved organic carbon (DOC) ranged from 60 to 100 μM-C in early summer and from 70 to 144 μM-C in winter. The average stoichiometric ratio of DOC : DON:DOP was high (353:49:1) in the land-source impacted zones and low (168:21:1) in the SCSW-laden areas, both of which are higher than the Redfield ratio. The concentrations of DOC and nutrients were higher in the western TS (on the coast of China) than in the eastern TS (on the coast of Taiwan), and the highest concentrations were mostly found in the Minjiang River plume, reflecting the profound effects of freshwater input in early summer and CCW inflow in winter. The absorption and emission characteristics of the CDOM varied to a large extent with locations because of the mixing of the shelf water with different source waters. Although the absorption coefficient (aCDOM(325)) and fluorescence intensity of the terrestrial humic-like CDOM (Ft: Ex/Em= 260/400-460) were both strongly inversely correlated with salinity, as an optical tracer, Ft may be more effective than aCDOM(325) in examining the mixing among source waters, given that aCDOM(325) may be subject to various photobleaching effects in the TS. Ft was also significantly correlated with the concentrations of terrestrially derived nitrate and nitrite (N+N) and silicate. The results of factor analysis elucidated the complexity of the hydrological and biological processes that affect the distributions of DOM and CDOM in the TS.
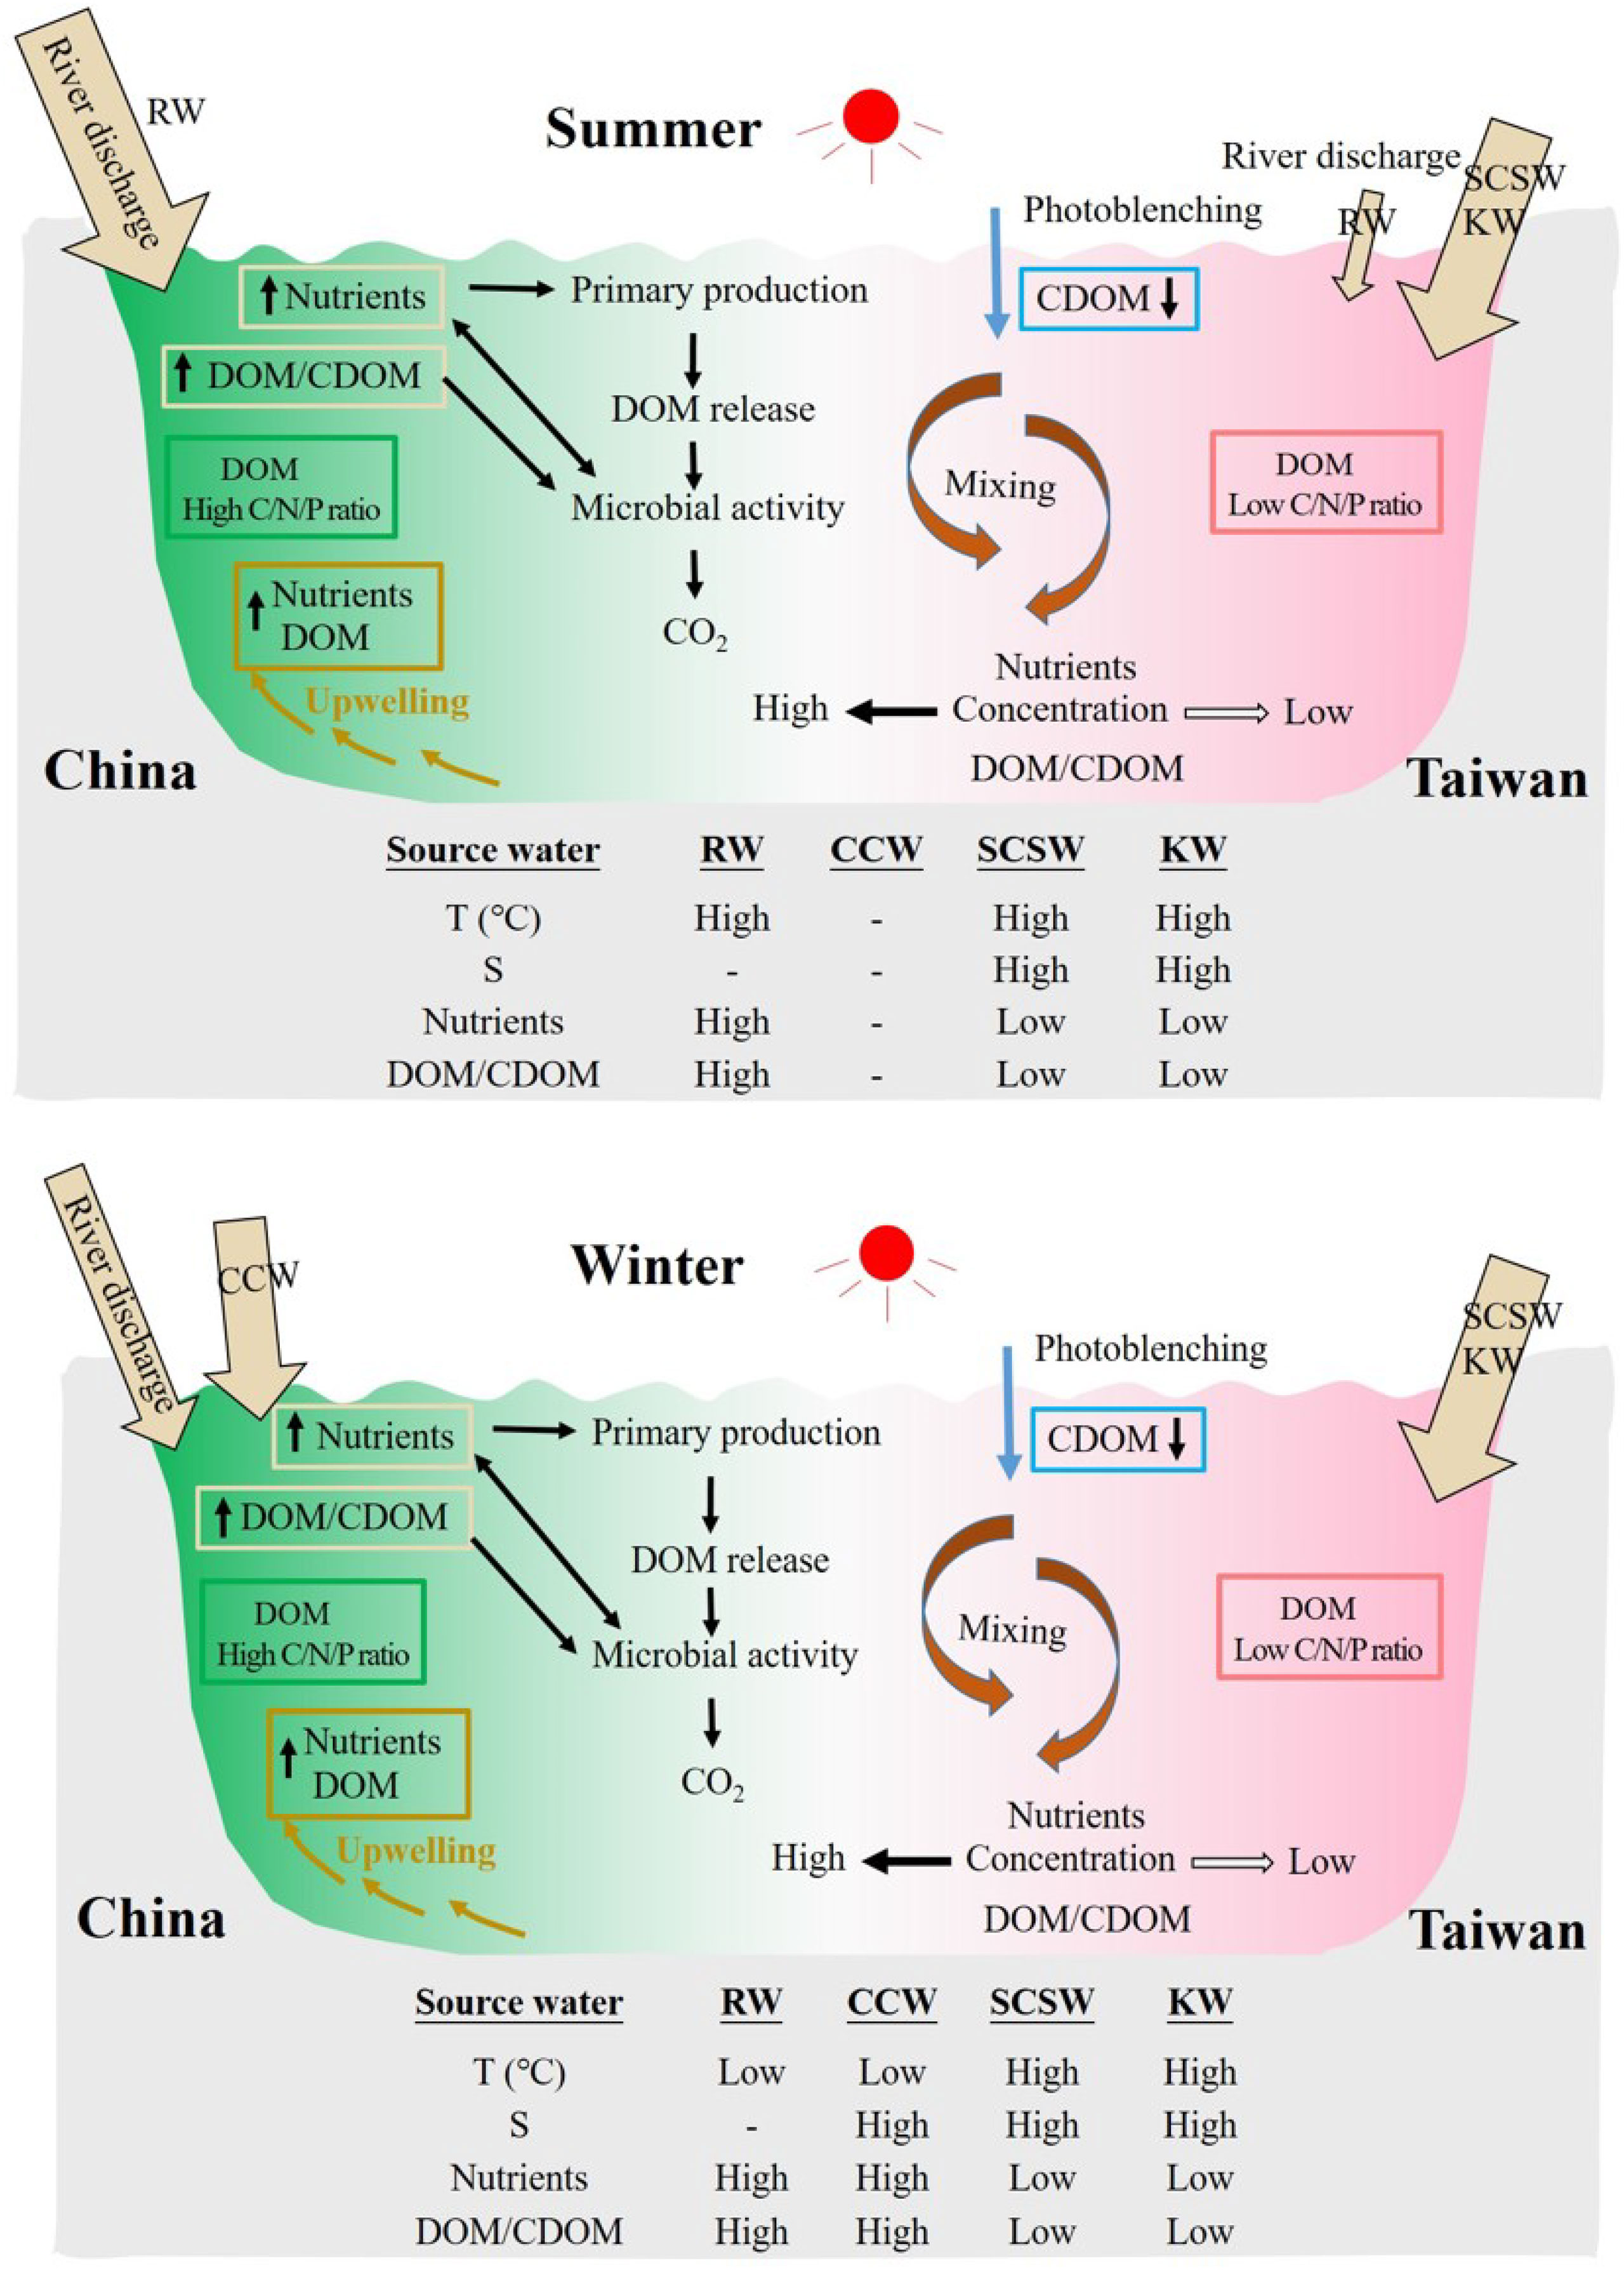
Graphical Abstract
Dissolved organic carbon (DOC; for abbreviations, please refer to Table 1) comprises the largest pool (680−700 Pg C) of reduced carbon in the hydrosphere and is comparable in mass to atmospheric CO2 (Hansell, 2002; Calleja et al., 2019). DOC plays a key role in carbon cycles and is also critical for nutrient transformation and availability in oceans (Abell et al., 2000; Hansell, 2002; Barron and Duarte, 2015; Hansell and Carlson, 2015). A growing body of evidence has revealed that the quality rather than total concentration of DOC is crucial to microbial metabolism and carbon transfer within oceans and at the boundaries between the atmosphere and oceans (Amon et al., 2001; Benner, 2002; Stepanauskas et al., 2005; Raimbault et al., 2008). Although substantial progress has been made in understanding the reactivity and bioavailability of marine dissolved organic matter (DOM), numerous properties of DOM, especially its chemical composition and optical properties, have not been fully explored in different coastal environments and thus warrant further investigation (Abdulla et al., 2013; Stedmon and Nelson, 2015; Riedel et al., 2016). The chemical composition is also critical for the lability of DOM, and the bioavailability and recycling of DOM are generally dependent on the source, regional and global circulations, and external and oceanic forcing (Hansell, 2002; Benner, 2002; Stepanauskas et al., 2005; Hansell et al., 2012).
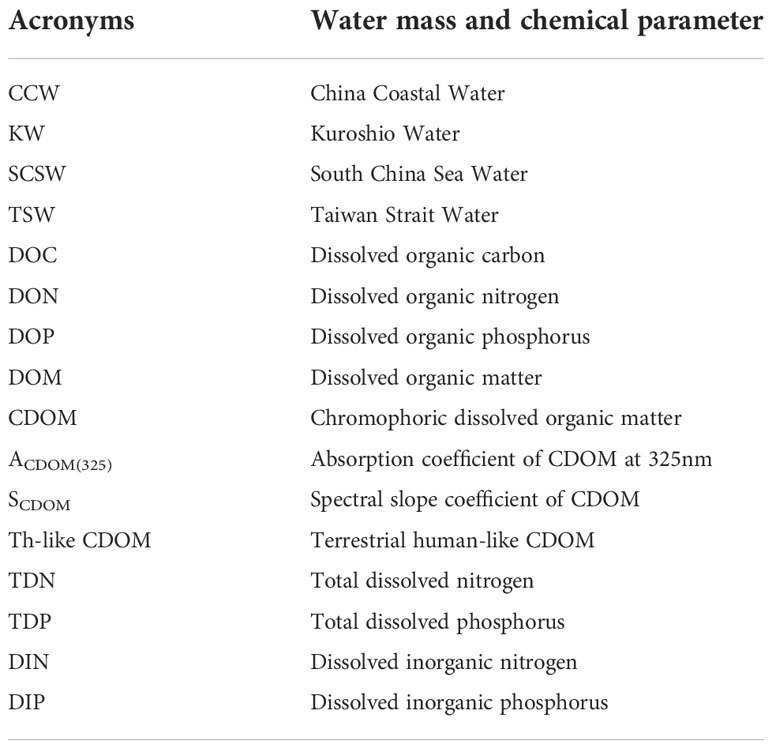
Table 1 Acronyms used in this study.
The most notable characteristic of DOM in marginal seas, in addition to its derivation from productive regions, may be how it is strongly affected by continental input. The reactivity of terrestrial DOM is generally considered more biologically refractory than that of marine DOM (Guo et al., 1995; Benner, 2002; Abdulla et al., 2013). In addition, the large input of terrestrial DOM may profoundly affect the biogeochemical cycles of carbon-related elements as well as satellite-derived primary productivity in oceans. The sources, sinks, and lability of DOM in marginal seas are complex and poorly understood because they are associated with boundary exchanges, and turbulent mixing and a lack of a clear vertical gradient. Although analyses of the molecule-level composition of DOM are useful for understanding the function and reactivity of DOM, the techniques employed in such analyses are usually not straightforward and require expensive equipment.
As an alternative to these analyses, spectroscopic methods have been widely used to characterize the sources and chemical features of DOM. Chromophoric DOM (CDOM), which can absorb solar radiation in aquatic environments, comprises a large proportion of the bulk DOM pool. The molecular structures of CDOM can be excited using a specific wavelength of radiation and subsequently emit a longer wavelength of radiation as fluorescence, and oceanographers can use such features to identify the sources and evaluate the quality of DOM (Coble, 1996; McKnight et al., 2001; Coble, 2007; Jaffė et al., 2008; Abdulla et al., 2013; Stedmon and Nelson, 2015). The reactivity of CDOM to sunlight may also result in the remineralization of DOM and produce several reactive products and elements that can be used by biota (Miller and Zepp, 1995; Obernosterer and Benner, 2004; Norman et al., 2011). Although the absorption of ultraviolet light can prevent damage to organisms, the absorption of visible light interferes with the estimation of concentrations of satellite-derived chlorophyll in coastal and marginal seas (Blough and Del Vecchio, 2002; Siegel et al., 2002; Romera-Castillo et al., 2011; Dutkiewicz et al., 2019). The fates of DOM and CDOM and their effects on ecosystems in marginal seas are crucial.
The Taiwan Strait (TS) is a shallow marginal sea separating the main island of Taiwan from mainland China and serves as a major connection between the South China Sea (SCS) and the East China Sea (ECS). The seasonal variations in river discharge, seawater circulation, flow patterns, and transport rates in the TS are highly pronounced. Numerous studies and reviews (Jan et al., 2002; Chen, 2003; Wang et al., 2003; Wu and Hsin, 2005; Jan et al., 2006; Chen et al., 2010; Hu et al., 2010; Jan et al., 2010; Hong et al., 2011; Huang et al., 2020) have proposed various seawater transport modes and budgets since Wyrtki (1961) investigated the transport between the SCS and TS in summer (0.5−1.0 Sv northward, 1Sv = 106 m3s-1) and in winter (0.5 Sv southward). The major circulatory features of the TS are a northward current in the eastern TS in summer and a southward current in the western TS in winter. The currents and transport in the TS are generally modulated by monsoon forcing and topographic variations (Jan et al., 2002; Hu et al., 2010). The source waters of the eastern current of the TS in the summer and other seasons are the SCS Water (SCSW) and intruding Kuroshio water (KW), respectively, and that of the western current is the colder and fresher China Coastal Water (CCW) driven southward by the northeast monsoon (Jan et al., 2002). Jan et al. (2006) estimated that the northward transport through the TS ranges from 1.16 to 2.34 Sv between March and August. Findings related to the seasonal variations in seawater volume transport have remained consistent. However, in a summary report, Hu et al. (2010) reported that the volume transport through the TS in summer and winter was approximately 2.3±0.82 Sv and 0.8±0.96 Sv northward, respectively.
In addition to seawater circulation and transport, the TS may also play a key role in the transfer of chemical constituents between the SCS and ECS. (Chen and Sheu, 2006; Chen, 2008) investigated the nutrient contributions of the TS and their benefits for primary productivity in the ECS in summer. Regarding DOM biogeochemistry in the TS, some studies have reported that the biogeochemical processes and budgets of DOC and CDOM depend not only on physical circulation and boundary transport, but also on local upwelling and continental input in the western TS and its associated estuaries (Du et al., 2010; Guo et al., 2011; Hong et al., 2011). However, few studies have focused on the biogeochemical processes of DOM and CDOM across the entire strait. To address this research gap, this study investigated the physical and biogeochemical processes that affect the distributions and fates of DOM and CDOM for a better understanding of the connection between DOM and CDOM characteristics and the variability of water properties and hydrological conditions in the TS.
The sampling stations in the study area are shown in Figure 1. In early summer (ORII CR1353, 05/20−25/2006), surface seawater samples were collected from the entire TS (Stations 1−33). In winter (ORI CR889, 02/11−13/2009), samples were collected from the stations along the coast of China and from two strait-crossing transects located respectively on the northernmost and southernmost parts of TS. An additional experiment was performed at the Gaoping Estuary in southern Taiwan (Figure 1C) to examine the mixing behavior of terrestrial DOM and CDOM from riverine and oceanic waters.
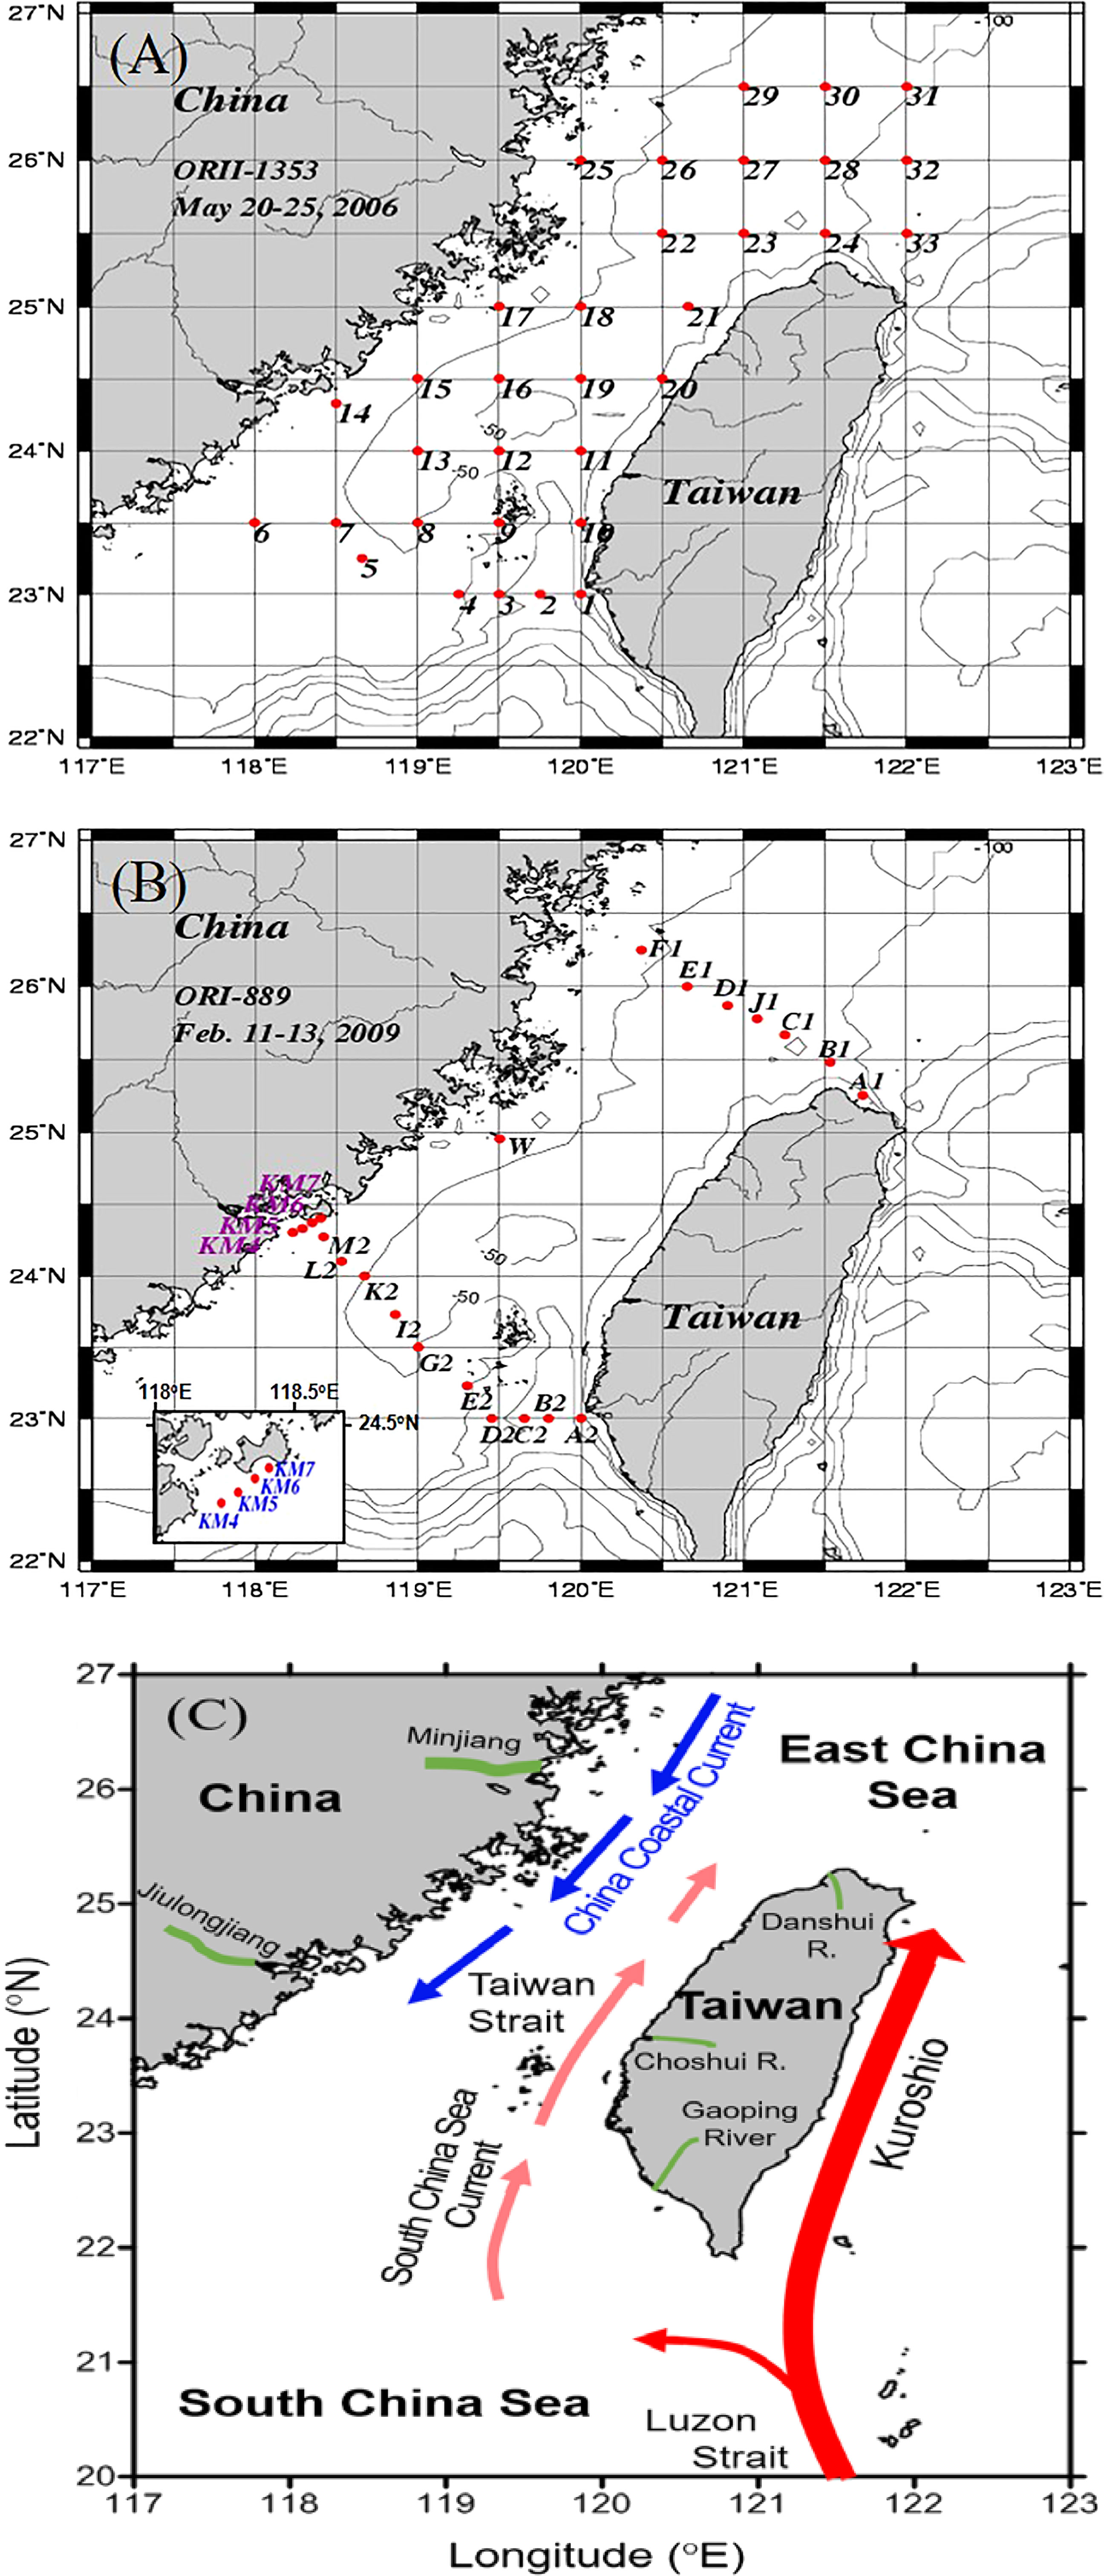
Figure 1 Study area and sampling locations in the Taiwan Strait in early summer (A, Stations 1−33, ORII CR1353) and winter (B, ORI CR889). Arrows represent the regional circulation patterns associated with the Taiwan Strait (C). Different sizes of red and light red arrows represent the difference in warm, saline, and current strength for Kuroshio Current and South China Sea Current, respectively. The blue arrow indicates cold and less saline China Coastal Current during winter. The discharge of river water is shown by the different width of short green line in southeast China and Taiwan. The Kuroshio intrusion into the South China Sea (SCS) tends to be stronger in winter than in summer (Wu et al., 2017), and the China Coastal Current and SCS Current prevail in winter and in summer, respectively (Jan et al., 2002; Hu et al., 2010).
The seawater samples were collected using cleaned 10-L Niskin bottles mounted on a CTD/Rosette. The CTD and attached probes were used to record the temperature (T), salinity (S), fluorescence, and transmission data. The irradiances of both the surface and subsurface was measured using a PAR sensor (OSP2001, Biospherical Instruments, San Diego, USA). The euphotic depth was defined as the depth at which the light intensity was 1% of the surface irradiation. Dissolved oxygen samples were pickled immediately after the seawater samples were collected, and the concentrations were determined by measuring the absorbance of total iodine in the pickled samples after acidification (Pai et al., 1993). Chlorophyll a (Chl-a) was extracted from the filtered particulates with 90% acetone and measured fluorometrically (10AU Fluorometer, Turner Designs) using the non-acidification method (Welschmeyer, 1994).
DOC and particulate organic carbon (POC) in seawater were separated by the filtration of seawater samples through precombusted GF/F (Whatman) glass-fiber filters immediately after seawater collection, according to the published procedures (Hung et al., 2000; Hung et al., 2003). After filtration, the filters were sealed in cleaned petri-dishes and stored in the frozen condition before being transferred to thelaboratory. The filters were then dried in an oven at 60 °C for POC determination. Aliquot of the filtered seawater was acidified with HCl (0.4%, v/v) and stored in cleaned glass bottles until the measurement of DOC in the laboratory. DOC was measured with the method of high-temperature catalytic oxidation using the Shimadzu TOC-5000A analyzer (Hung et al., 2003; Hung et al., 2007). Consensus reference materials (41-44 μM C) provided by Dr. D. A. Hansell from the University of Miami were regularly checked to ensure data quality. POC was measured with a C/N/S analyzer (Thermo Scientific Flash 2000) following carbonate removal from the filtered particulates (Hung et al., 2007; Hung et al., 2008).
Dissolved organic nitrogen (DON) was determined from the difference between total dissolved nitrogen (TDN) and dissolved inorganic nitrogen (DIN). TDN was measured with the high temperature oxidation and chemiluminescent detection (Antek N/S analyzer) with reproducibility within ±7% for seawater (n = 9) (Hung et al., 2008), while the DIN was determined according to the procedures described in the following section. Dissolved organic phosphorus (DOP) was determined by the difference between dissolved inorganic phosphate (DIP) and total dissolved phosphorus (TDP) that was measured by the UV-persulfate oxidation and colorimetric method (Ridal and Moore, 1990). Reproducibility of TDP measurement in seawater (n = 9) was ±6%.
Dissolved inorganic nitrogen (NO3−+NO2−+NH4+, herein DIN) and phosphate (PO43-, or DIP) and silicate (H4SiO4, or DSi) were determined colorimetrically (Grasshoff et al., 1983) using a UV-Vis spectrophotometer (Hitachi U-2000) equipped with a module of flow injection analysis (Pai and Riley, 1994) with an exception of NH4+ determination. The concentration of NH4+ was determined with an indophenol blue method using a spectrophotometer (Hitachi U-3030, 5-cm quartz cell) according to Pai et al. (2001).
The CDOM absorption spectra were determined using a spectrophotometer (Hitachi U-3310), employing a 10-cm optical quartz cell and Milli-Q water as a blank. The data were corrected for scattering and baseline fluctuation by subtracting each spectrum from the mean value of absorption at 600-700 nm (Bricaud et al., 1981; Green and Blough, 1994). To minimize the inner filter effect, those samples having an absorbance greater than 0.05 (325 nm) were properly diluted with Mill-Q water before measurements. Absorption coefficients, aCDOM(λ), were calculated using the following equation,
Where ACDOM(λ) is the absorbance over the pathlength L at the wavelength λ. The absorption of CDOM at 325 nm was used as a proxy for CDOM concentration (Nelson et al., 2007; Swan et al., 2009). The spectra were then fit to an exponential function, using a nonlinear least squares fitting routine (NLF) over the range 280–500 nm,
Where λ0 is a reference wavelength and S is the spectral slope.
The measurements of CDOM fluorescence were carried out using a fluorescence spectrometer (Hitachi F-4500), employing a 1-cm optical (quartz) cell and Milli-Q water as a blank. The excitation-emission matrix (EEM) was derived from the emission scans between 200 and 600 nm (λem = 200−600 nm) at 5 nm intervals and the excitation increased from 200 to 500 nm (λex = 200−500 nm) at 5nm intervals (Coble. 1996). A solution of 10 μg/l of quinine sulfate (qs) in 0.5 M H2SO4(aq) was employed as a standard with sulfuric acid (0.5M) used as the blank, thus the fluorescence of qs (Fqs) was the mean value recorded from excitation at 355 nm (λex) and emission at 430−450 nm (λem). The sample fluorescence (FS) recorded through the same excitation-emission (Ex/Em) condition as the standard was normalized to the fluorescence of standard to give a fluorescence unit (FI.U. = 10 × FS/Fqs). The assignment of peaks at various Ex/Em (nm) was adapted from the previous report (Coble, 1996). The peak A (260/400−460 nm) was the terrestrial humic substances peak, peak C (320−360/420−460 nm) was the terrestrial fulvic substances peak, peak M (290−310/370−410 nm) was the marine fulvic substances peak, and peak T (275/340 nm) was the proteinaceous substances peak. Although the parallel factor analysis (PARAFAC) was widely used for identifying components and gave a EEM interpretation (Stedmon et al., 2003; Murphy et al., 2008; Hong et al., 2012; Stedmon and Nelson, 2015; Carr et al., 2019), we simply pick Coble’s assigned peaks particularly peak A as an index of terrestrial humic source. Seawater samples were also measured for the concentration of total suspended matter (TSM) according to methods reported by (Hung et al., 2007; Hung et al., 2008).
Water samples were taken along a salinity gradient in the Gaoping Estuary located in southwestern Taiwan (Figures 1C, 8A) during the dry (winter) season when the estuary was in well-mixed conditions. Salinity was measured using a portable conductivity/salinity meter (WTW, LF-320) with a resolution of 0.01 salinity unit. DOC, aCDOM(325), and terrestrial humic-like (Th-like) CDOM were measured according to methods described in the above sections. DOC and Th-like CDOM were plotted against salinity to elucidate their mixing behavior.
Because of the co-varying nature of the measured variables for a specific season in the TS, a multivariate analysis method, the factor analysis, was performed for the analysis of data collected from the cruise CR 1353 (early summer) or the cruise CR889 (winter) using the statistical software SYSTAT 11. The total variance explained by each factor was employed to elucidate the major associated physical and biogeochemical processes.
Figure 2A presents the surface distribution of salinity in the TS in early summer. The salinity generally increased from 26.79 on the coast of mainland China (in the western TS) to 34.2 on the coast of Taiwan (in the eastern TS). The surface temperature distribution (figure not shown) followed the similar pattern, increasing from 20.7°C on the coast of China to 24.7°C on the coast of Taiwan. Accordingly, the temperature−salinity (T−S) diagram reveals that the seawater conditions at the stations in the study area were characterized by low temperature and salinity (Figure 2B), likely resulting from freshwater input mainly from the Minjiang and Jiulongjiang rivers in the early stages of high river discharge (Hong et al., 2012; Zhang et al., 2015), or from the remnants of the southward CCW from the previous winter. The T−S diagram also reveals that seawater conditions at the stations located in the central region of the TS and on the coast of Taiwan had high temperature and salinity and properties between those of the KW and SCSW, which likely resulted from the mixing of the shelf water and the SCSW (Figure 2C). The contribution of the intruding KW would have been limited because of weak Kuroshio intrusion (Wu et al., 2017). The T−S diagram (Figures 3A, B) reveals that, during winter, the SCSW and intruding KW mixed in the southern end of eastern TS, but likely mixing between TS water and coastal water in the northern end of the eastern TS. Chen and Sheu (2006) contended that these saline waters (S >33.00) are present year-round along the eastern TS as the intermittent northward flow of the SCSW and Kuroshio branch current. The waters in the western TS were dominated by the nutrient-rich CCW, identified on the basis of its low temperature (<15.6°C) and salinity (<32.57), which appears to come from the north. The distributions of various waters in different seasons observed in here are consistent with those observed in previous studies (Jan et al., 2002; Chen, 2003; Chen et al., 2010; Hu et al., 2010; Jan et al., 2006; Hong et al., 2011). Despite the samplings were carried out in two seasons under different years, the different circulation patterns occurring between summer and winter were yearly persistent in the TS (Jan et al., 2002; Chen et al., 2010; Hu et al., 2010; Chen et al., 2021).
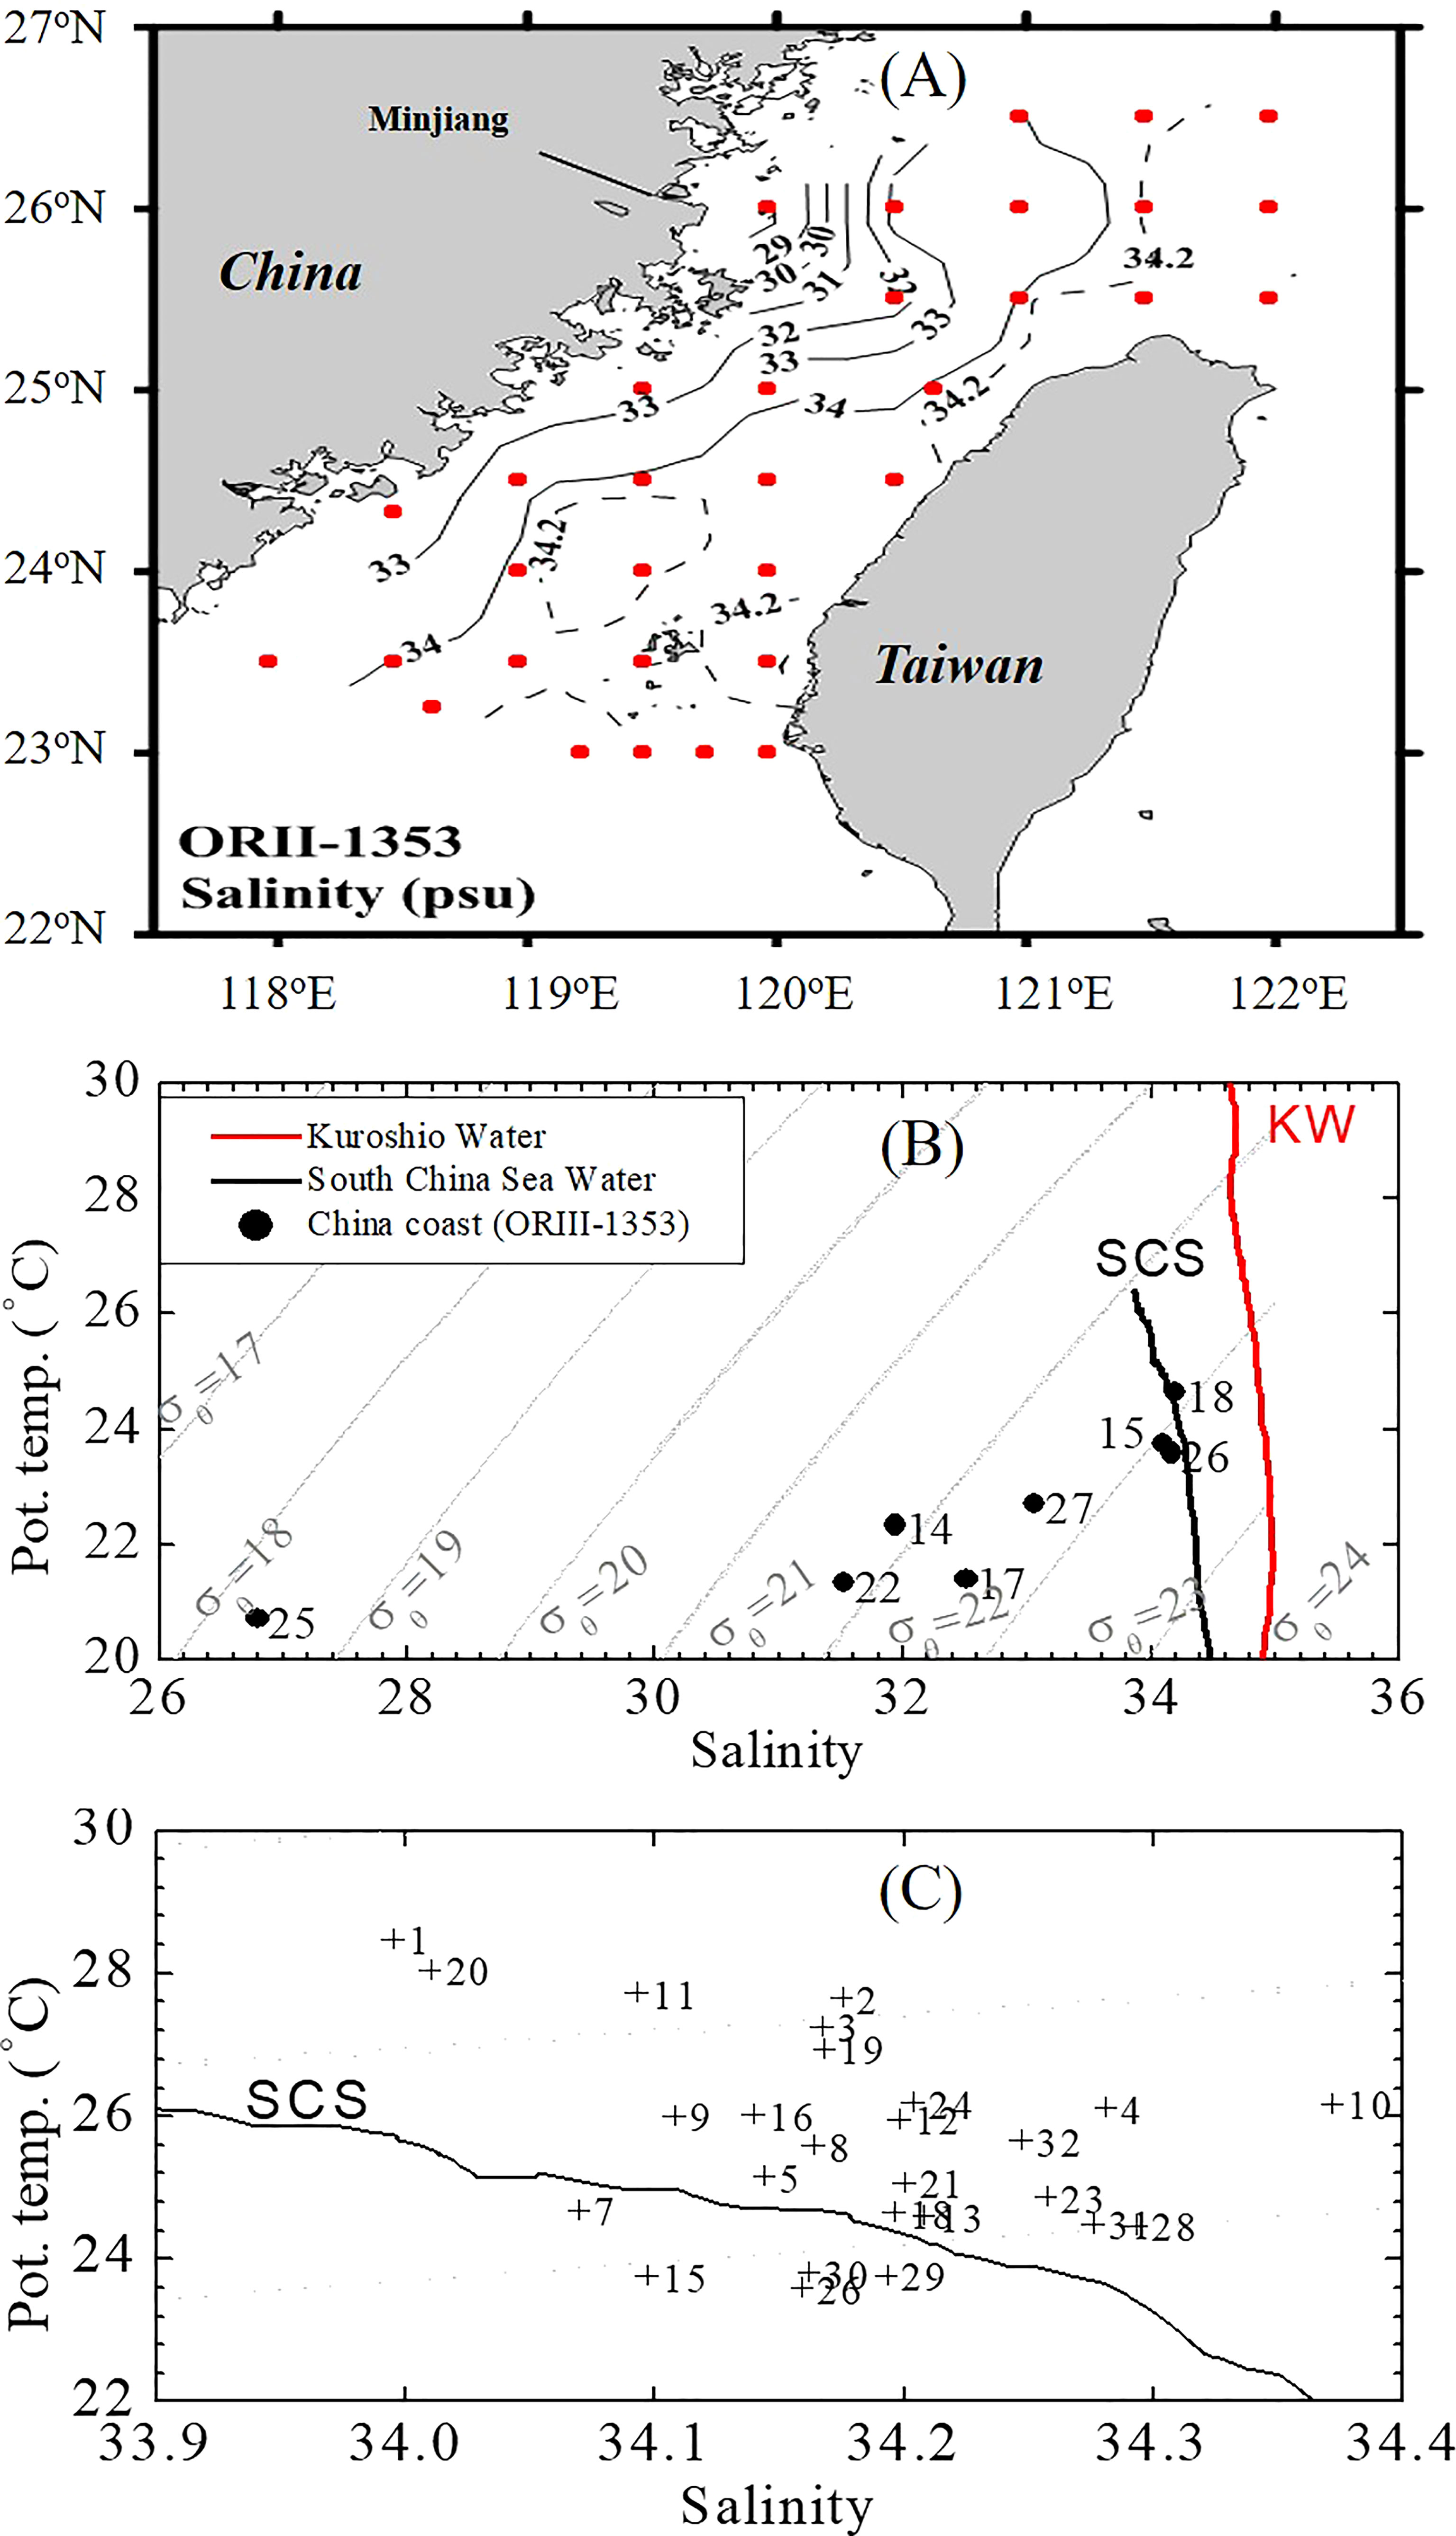
Figure 2 Spatial distribution of salinity in surface waters of the TS in early summer (A; Cruise CR1353) and plots of the temperature−salinity (T−S) relationship at sampling stations located in the western TS (on the coast of China, B) and the central and eastern TS (on the coast of Taiwan, C) in early summer (CR1353). The “KW” and “SCS” curves represent the typical T−S features of the Kuroshio Water (KW) and SCS Water (SCSW), respectively. The KW and SCSW represent typical waters collected from the western Philippine Sea and SCS central basin, respectively.
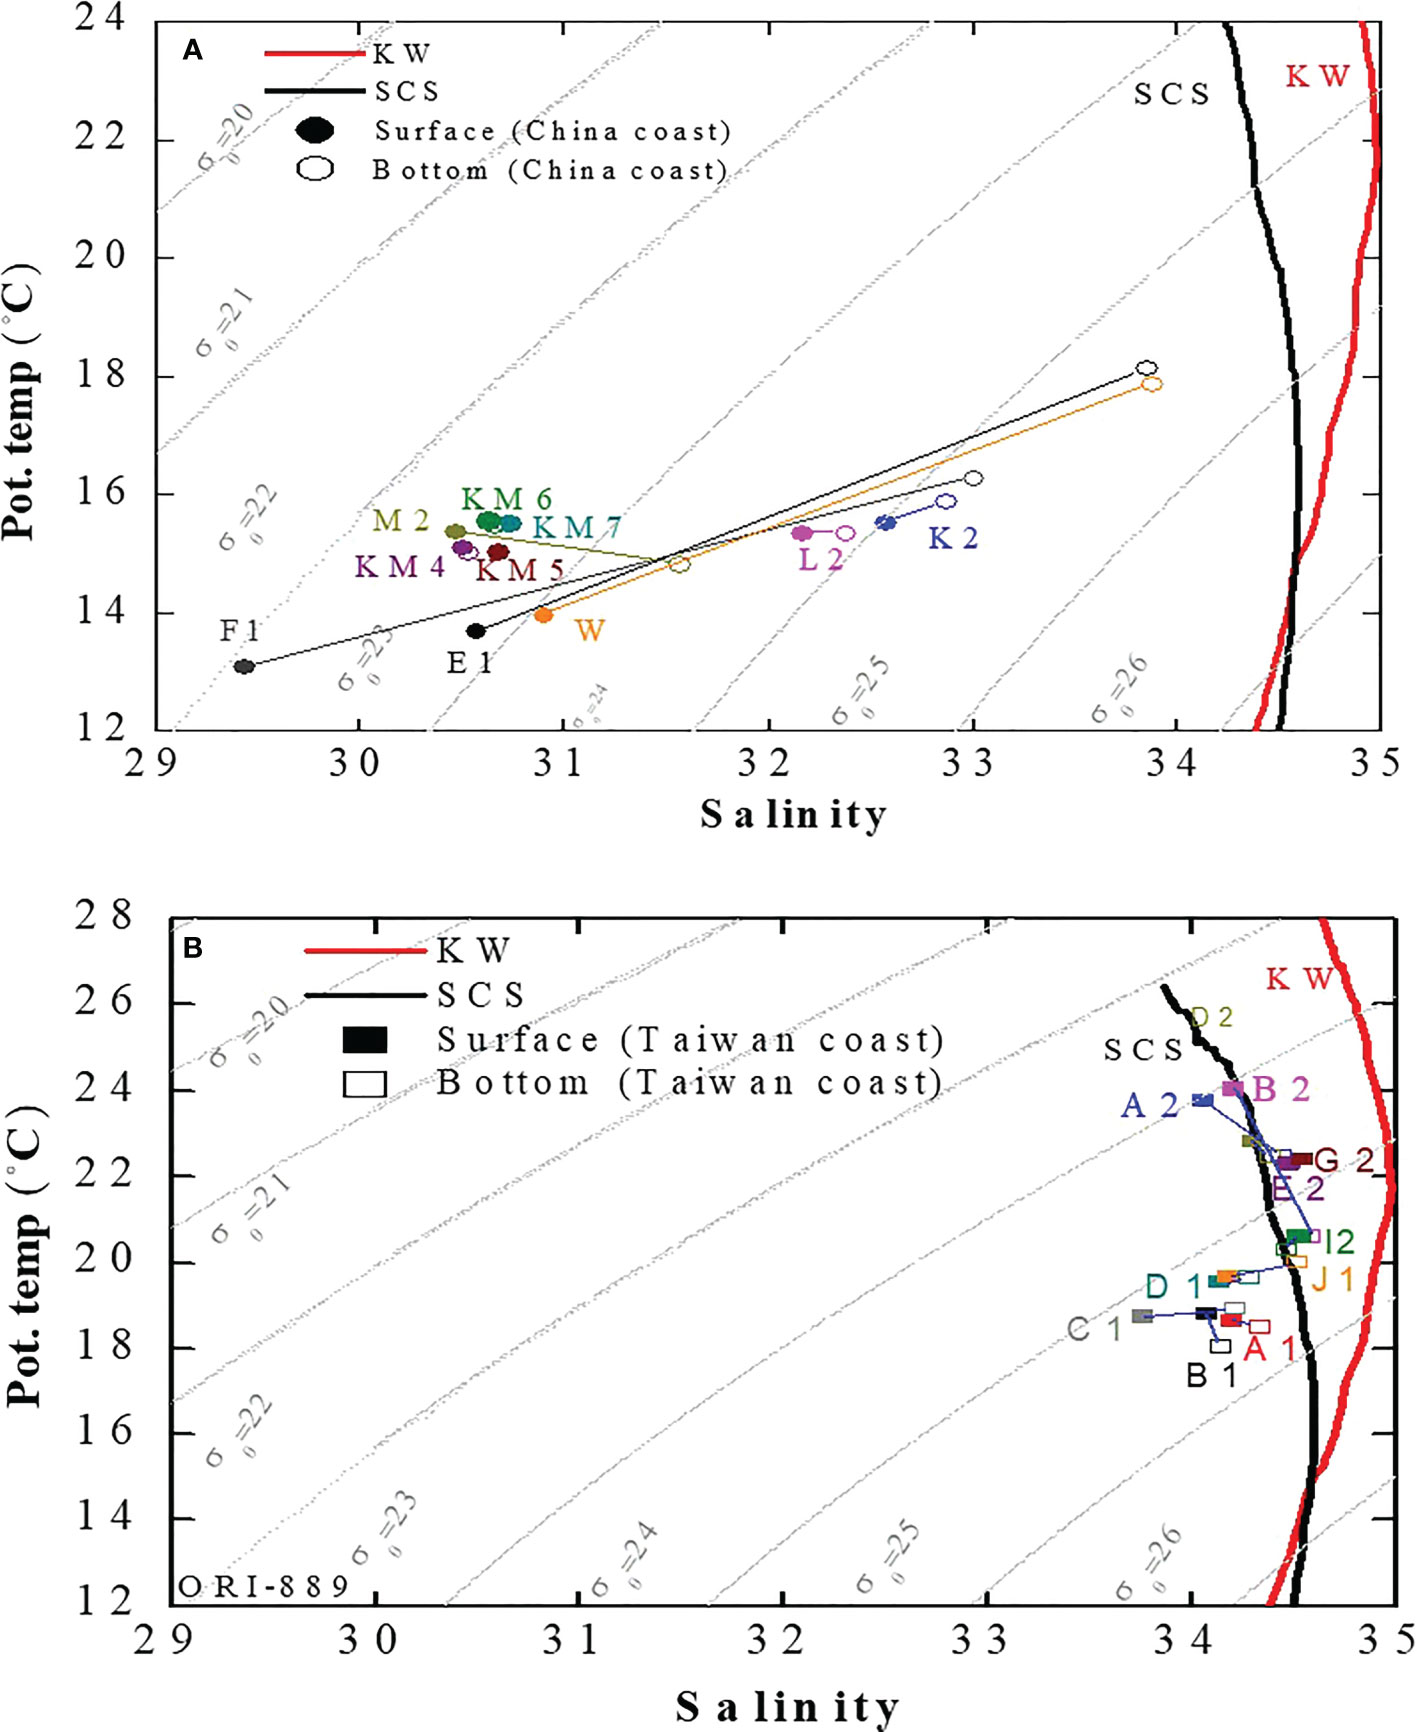
Figure 3 Schematic plots of T−S relationships for surface and bottom waters collected from stations located in the western TS (on the coast of China) (A) and the central and eastern TS (on the coast of Taiwan, B) in winter. The surface and bottom waters at each station are connected by dotted lines. The “KW” and “SCS” curves represent the typical T−S features of the KW and SCSW, respectively. The KW and SCSW represent typical waters collected from the western Philippine Sea and SCS central basin, respectively.
Figure 4A illustrates the surface concentrations of nitrate and nitrite (N+N) in the TS in early summer, which ranged from 0.01 to 1.35 μM and from 0.01 to 5.51 μM in the eastern and western TS, respectively. The surface concentrations of dissolved silicate ranged from 2.0 to 7.2 μM and from 1.8 to 22.4 μM in the eastern and western TS, respectively (Figure 4B). The concentrations of NH4+ (not shown) were generally lower than 1.0 μM, except for the station located on the Minjiang River plume (Station 25) where the concentration was as high as 2 μM. The distribution of DIP was similar to those of NH4+, ranging from 0.05 to 0.42 μM with the highest concentration at Station 25. The concentrations of NH4+, N+N, DIP, and silicate were consistently higher in the western TS than in the eastern TS, with the highest concentrations consistently occurring at Station 25.
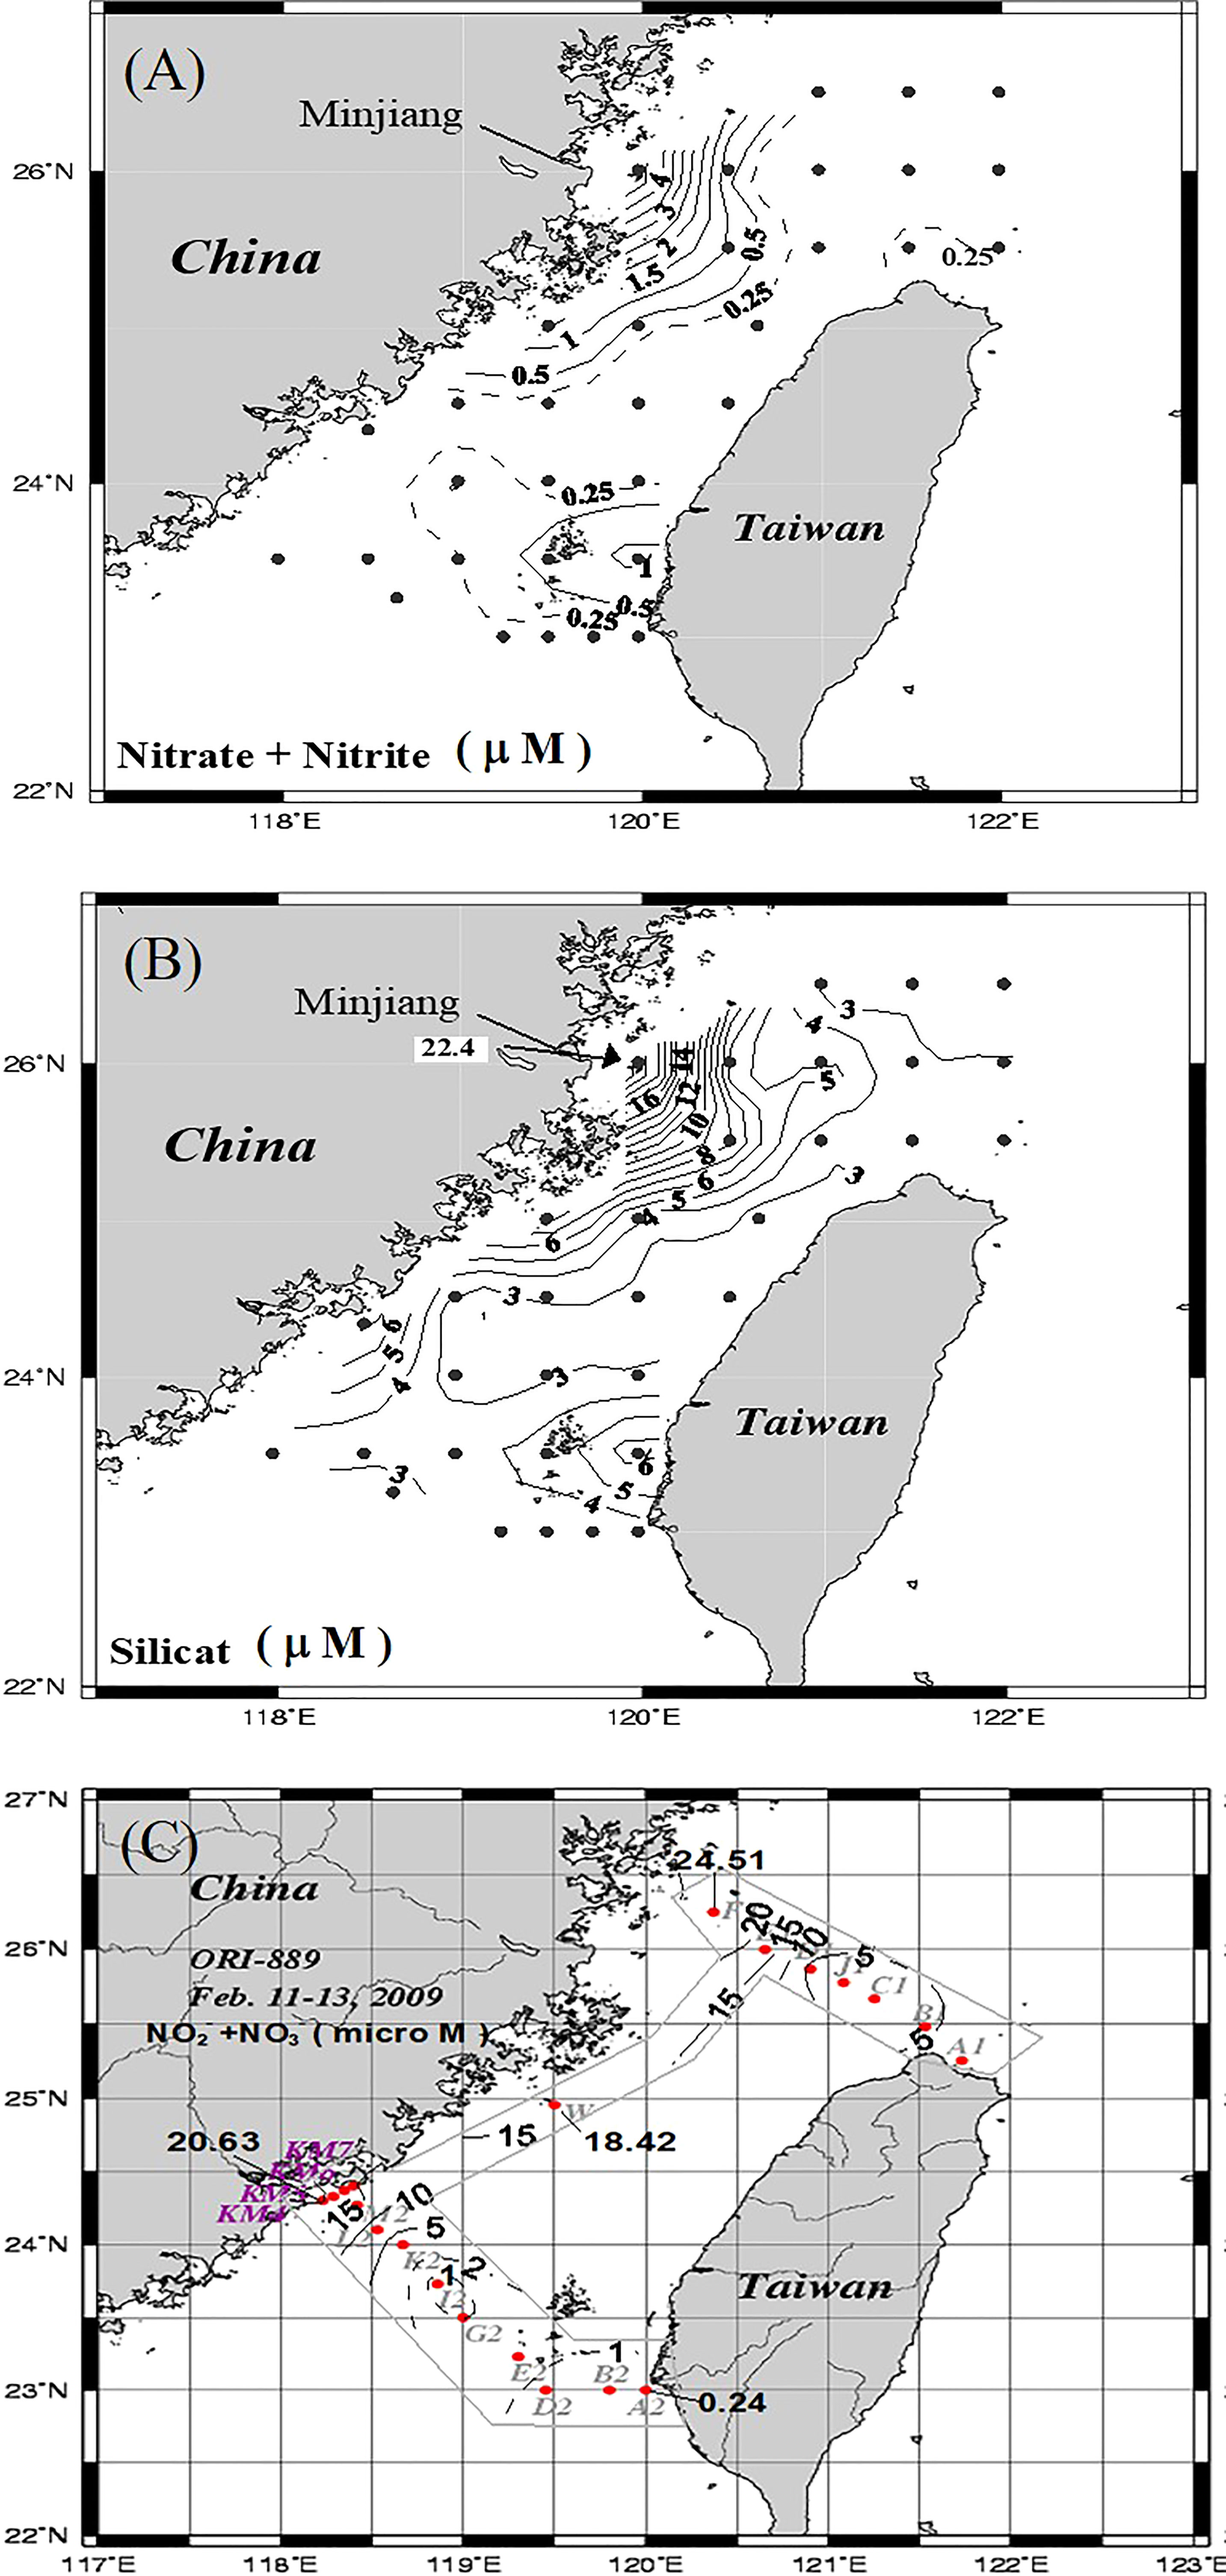
Figure 4 Spatial distributions of N+N (A) and silicate (B) concentrations in surface waters of the TS in early summer (CR1353), and of N+N concentrations in surface waters in winter [(C) CR889]. The concentrations of N+N and sampling stations in winter (C) were given with black and gray color, respectively.
Despite the lack of available sampling stations in most of the central and eastern TS in winter, the concentrations of N+N increased from 0.24 μM in the eastern TS to 24.5 μM in the western TS, with the highest concentration occurring at Station 25 (Figure 4C). The concentrations of DIP ranged from 0.07 to 0.49 μM and 0.02 to 0.91 μM in the eastern and western TS, respectively (figure omitted). The concentrations of silicate ranged from 1.92 to 11.0 μM and from 5.00 to 29.5 μM in the eastern and western TS, respectively (figure omitted). Similar to the conditions in early summer, the concentrations of N+N, DIP, and silicate were higher in the western TS than in the eastern TS. This difference was particularly notable in winter, when the southward flow of the CCW was most pronounced. The distribution patterns of nutrients result from river input in early summer and the effects of the nutrient-rich CCW on the western TS, which contrast considerably with the effects of the oligotrophic SCSW and intruding KW on the eastern TS in early summer and winter.
The concentrations of DOC, dissolved organic nitrogen (DON), and dissolved organic phosphorus (DOP) in the TS ranged from 60 to 120 μM, 2.92 to 13.8 μM, and 0.07 to 0.38 μM, respectively, in early summer (Figure 5). The concentrations of DOC and DON were slightly higher in the western TS than in the eastern TS; however, the concentrations of DOP were largely confined to the range of 0.2 – 0.3 μM. The highest concentrations of DOC, DON, and DOP were consistently observed in the Minjiang River plume in early summer, reflecting the strong effects of river discharge on DOM distributions. DOP was depleted relative to DOC and DON, with the average DOC:DON:DOP ratio being approximately 330:46:1, which is significantly higher than the Redfield ratio (106:16:1), indicating potential N- and P-limited in the study area. All the DON/DOP ratios fell between the highest (50) and lowest (16) boundaries (Figure 6), which may have corresponded to the largest effects of terrestrial and biological origins, respectively. In addition to DOM, the highest concentrations of nutrients and total suspended matter (TSM) were also observed near the Minjiang River plume, which also had the lowest salinity among the sampling stations. The results suggested that the hydrological conditions and DOM distributions in the TS were considerably affected by terrestrial input, given that the monthly discharge in the Minjiang River peaked in May in 2006 (Zhang et al., 2015). The stations with the impacts of SCSW and KW generally had low concentrations of DOC and DON, except for a few spots near estuaries in the east side of the TS. The surface concentrations of DOP, however, were highest close to the source waters of the SCSW and KW (Hung et al., 2007).
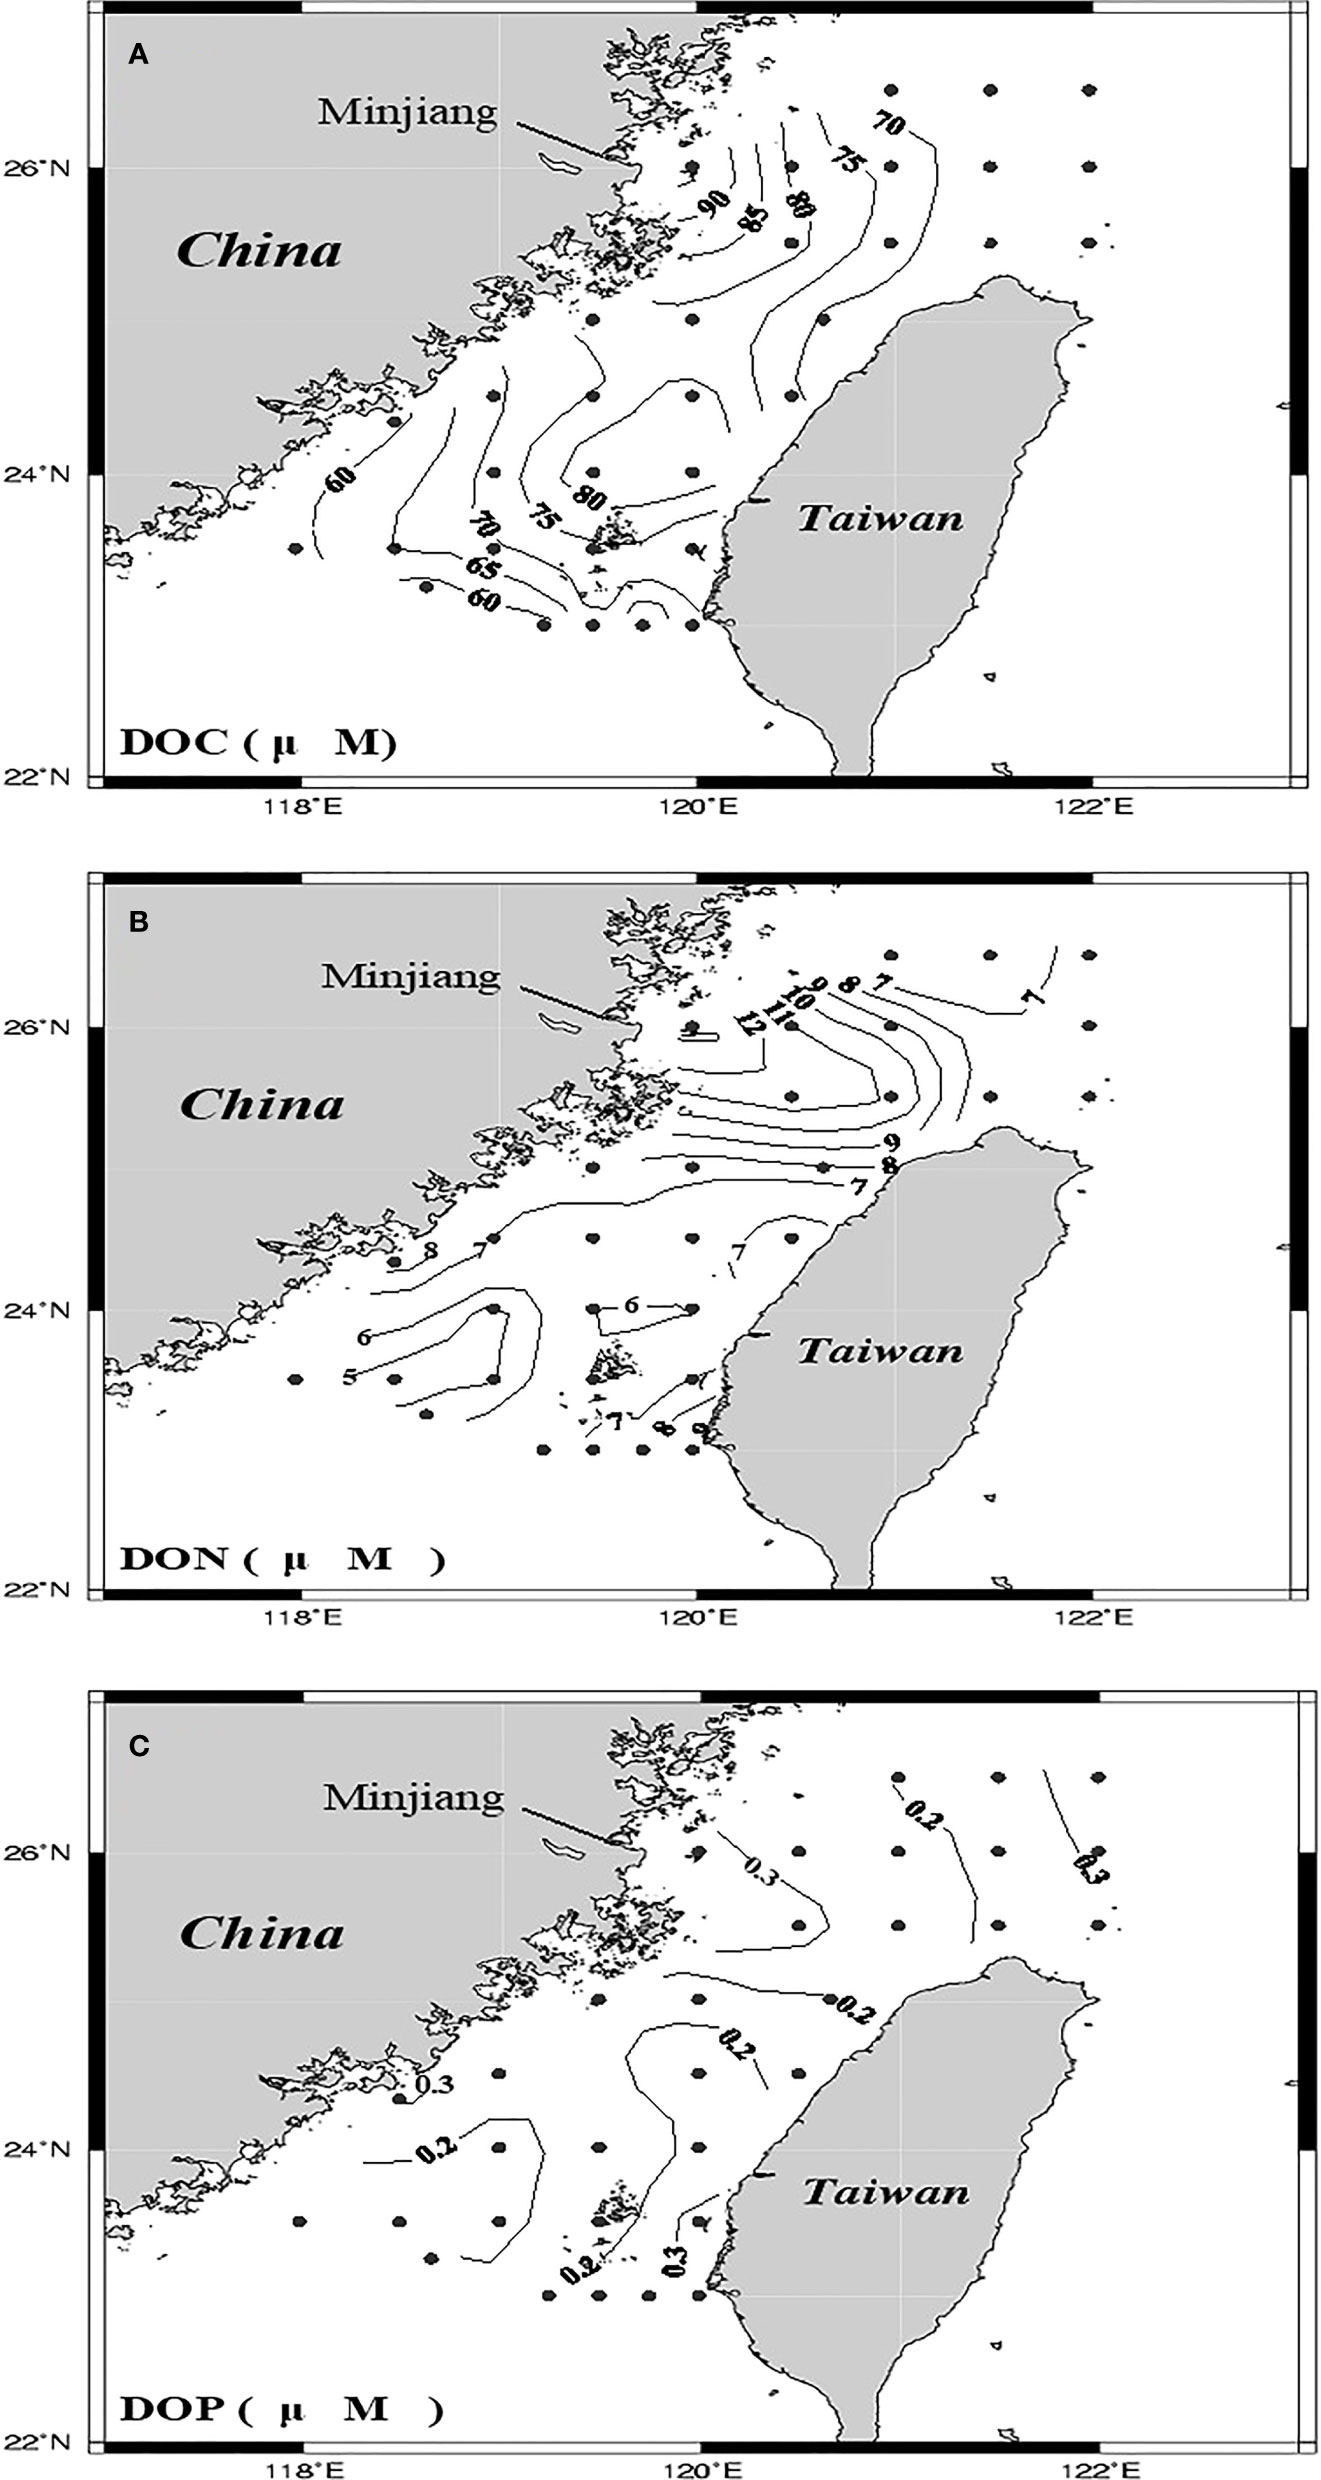
Figure 5 Spatial distributions of DOC (A), DON (B), and DOP (C) concentrations in surface waters of the TS in early summer (CR1353).
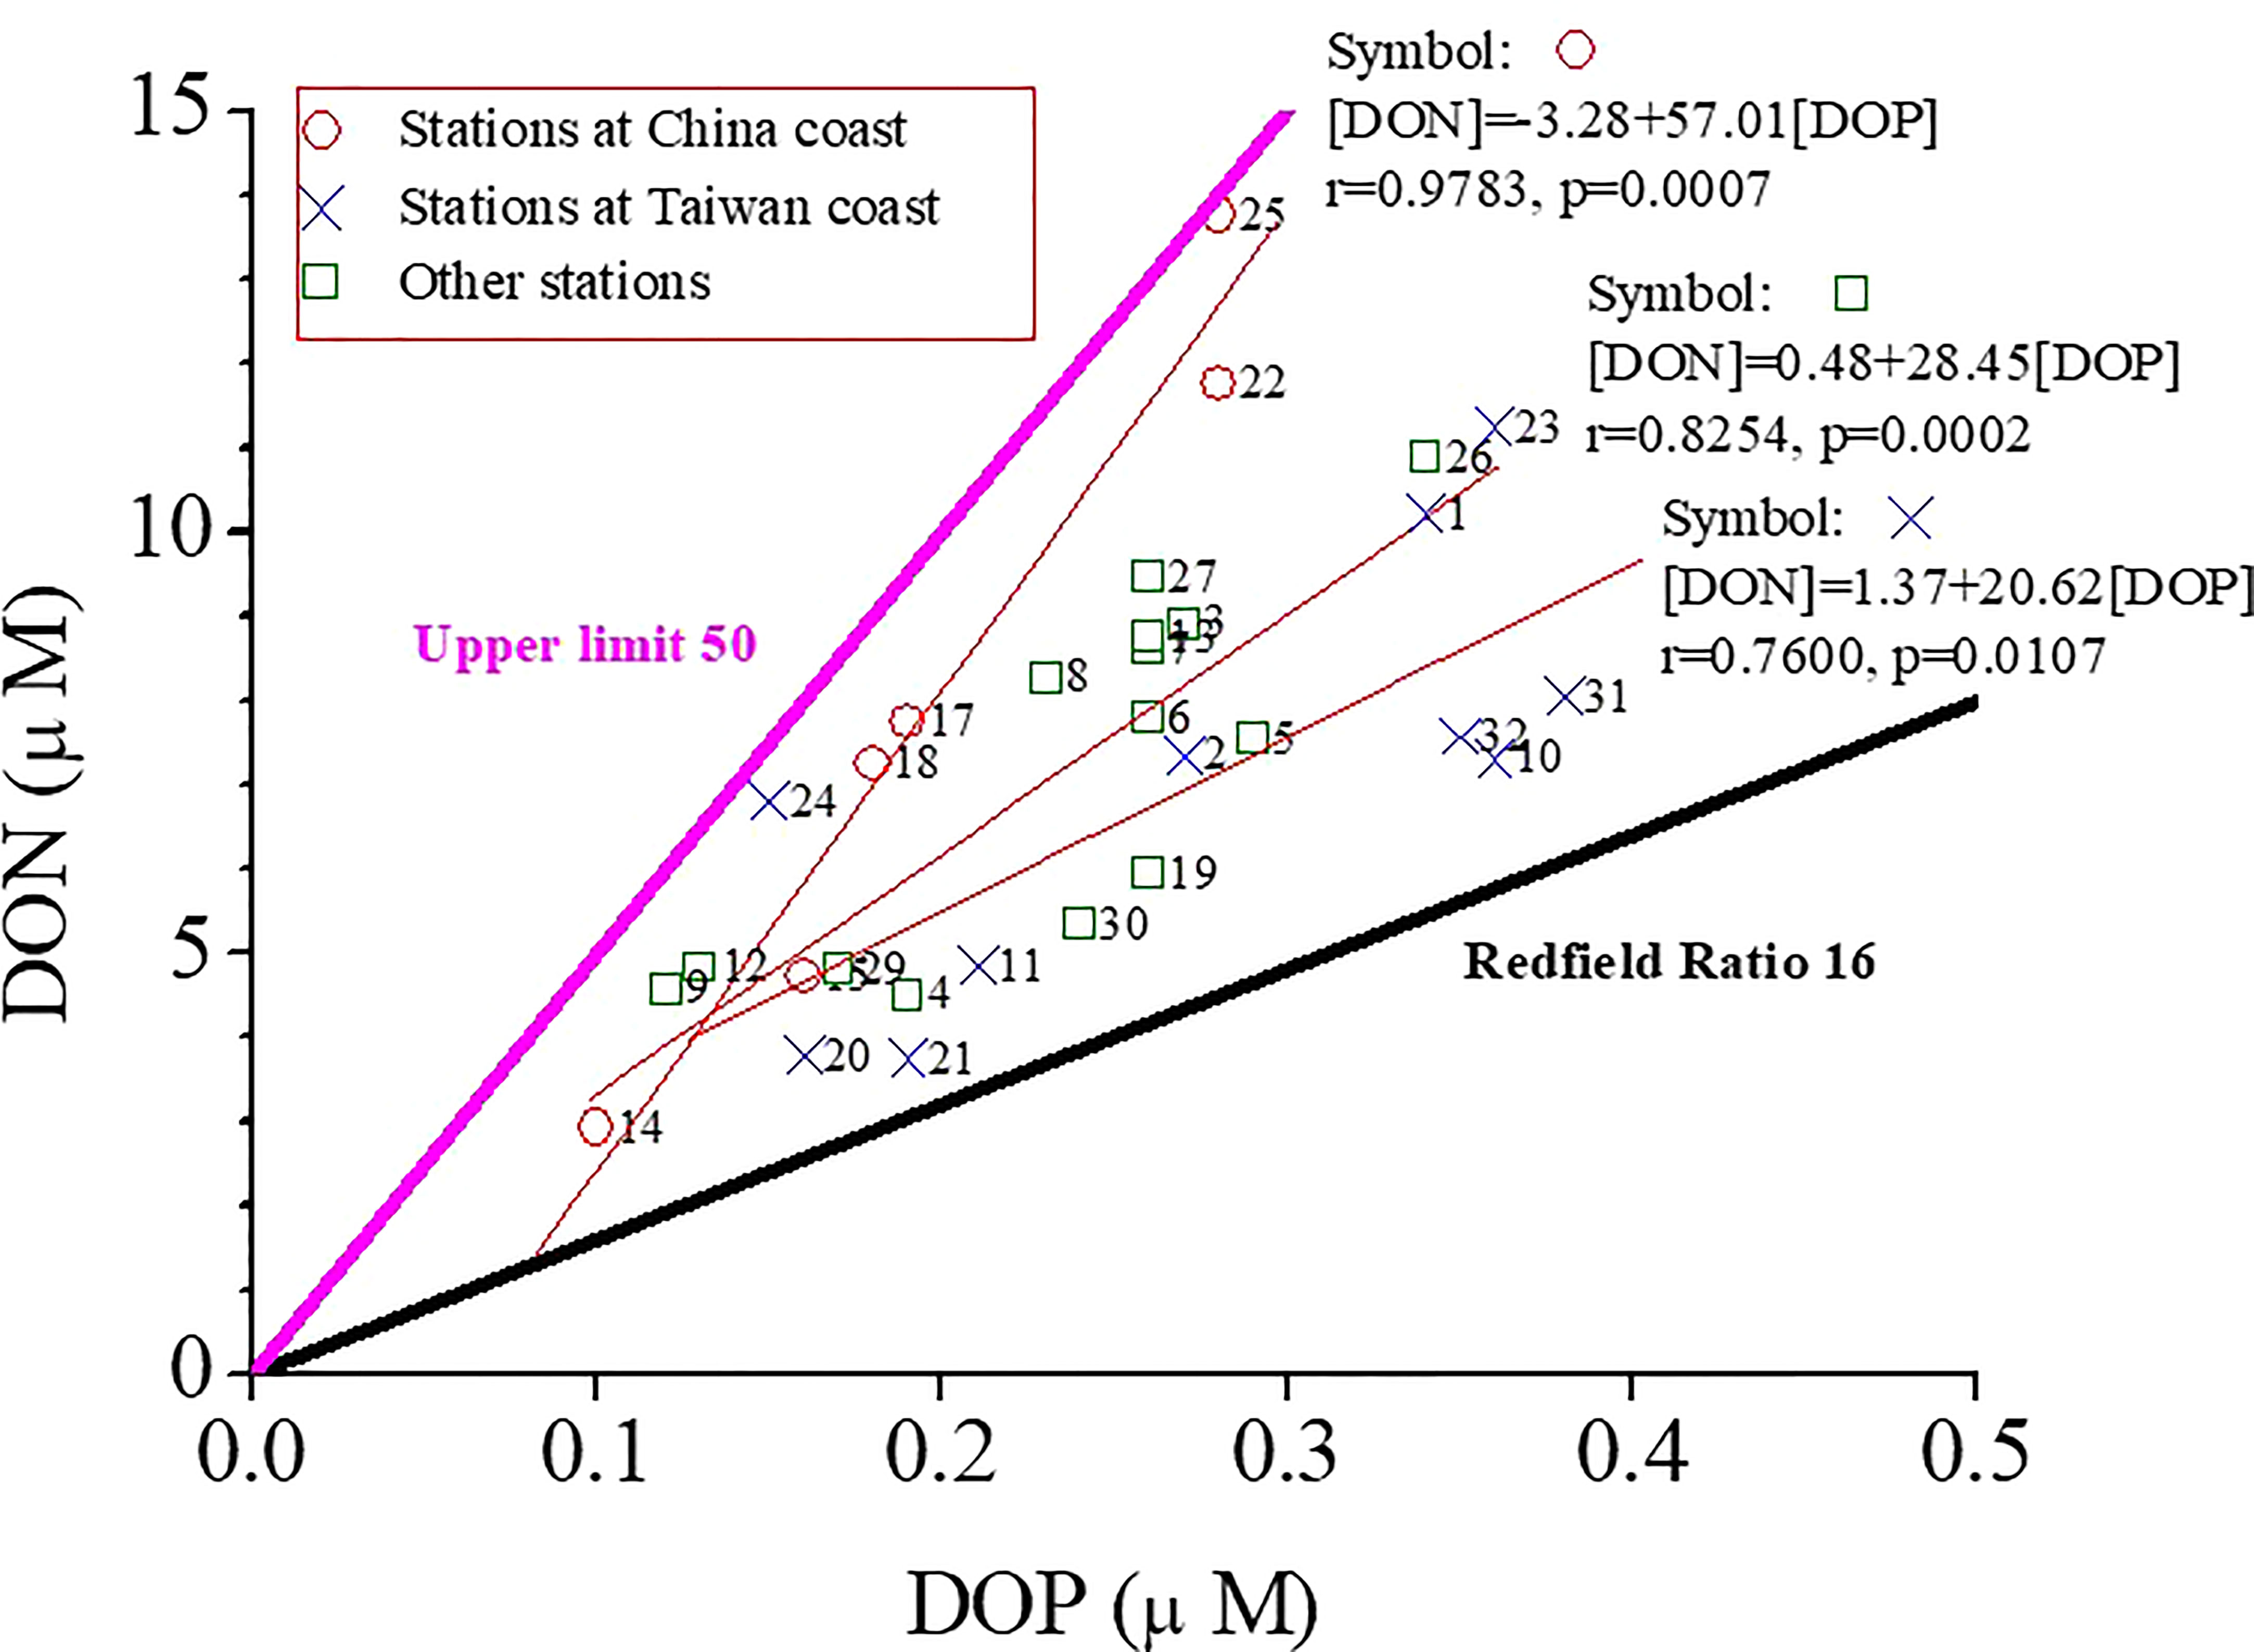
Figure 6 Scatter plots of DON and DOP concentrations in TS surface waters in early summer. The DON : DOP ratios ranged from 16 (Redfield ratio) to 50 (upper limit) and were roughly grouped as three ratios (20.62 [×], 28.45 [□], 57.01 [○]), increasing from the coast of Taiwan (20.62) to the coast of China (57.01).
The concentrations of DOC in winter (72−83 μM, data not shown) was much lower than that in early summer in the western TS, where the water was dominated by the southward CCW, a local spot near the Kinmen Islands (144 μM, see Figure 1B for the location) was the exception. The concentrations ranged from 70 to 110 μM in the eastern TS, which are relatively high (90 – 110 μM) near the coast of Taiwan along the northern transect where the water mixed with upwelled water and was characterized by high concentrations of nutrients and Chl-a. The concentrations of DOC were low (70 – 71 μM) in the eastern TS along the southern transect where the water was dominated by the SCSW and KW. The stoichiometric relationship of DOC, DON and DOP in winter could not be derived because DON and DOP data for winter were unavailable.
The distributions of aCDOM(325) and spectral slope (S) values in the TS are illustrated in Figure 7. In early summer, the aCDOM(325) values were higher in the western TS (0.4 – 0.6 m−1) than in the eastern TS (0.2 – 0.3 m−1; Figure 7A), corresponding to the relatively low S values (0.018 – 0.020 nm−1) in the western TS and relatively high S values (0.019 – 0.021 nm−1) in the eastern TS (Figure 7B). The highest aCDOM(325) value (0.6 m−1) and lowest S value (0.018 nm−1) occurred at the Minjiang River plume (Figures 7A, B). These results strongly suggest that terrestrial input, derived mainly from the Minjiang and Jiulongjiang rivers (China), with higher aCDOM(325) and higher apparent DOM molecular weight (or lower S values), affected the western TS. The CDOM data from the stations near the coast of Taiwan did not reflect a considerable effect of terrestrial input because the river runoff from Taiwanese rivers during the sampling period was relatively small. The high S values at Stations 5 and 6 indicate that a strong photobleaching effect (Figure 7B) occurred in waters shallower than 20 m.
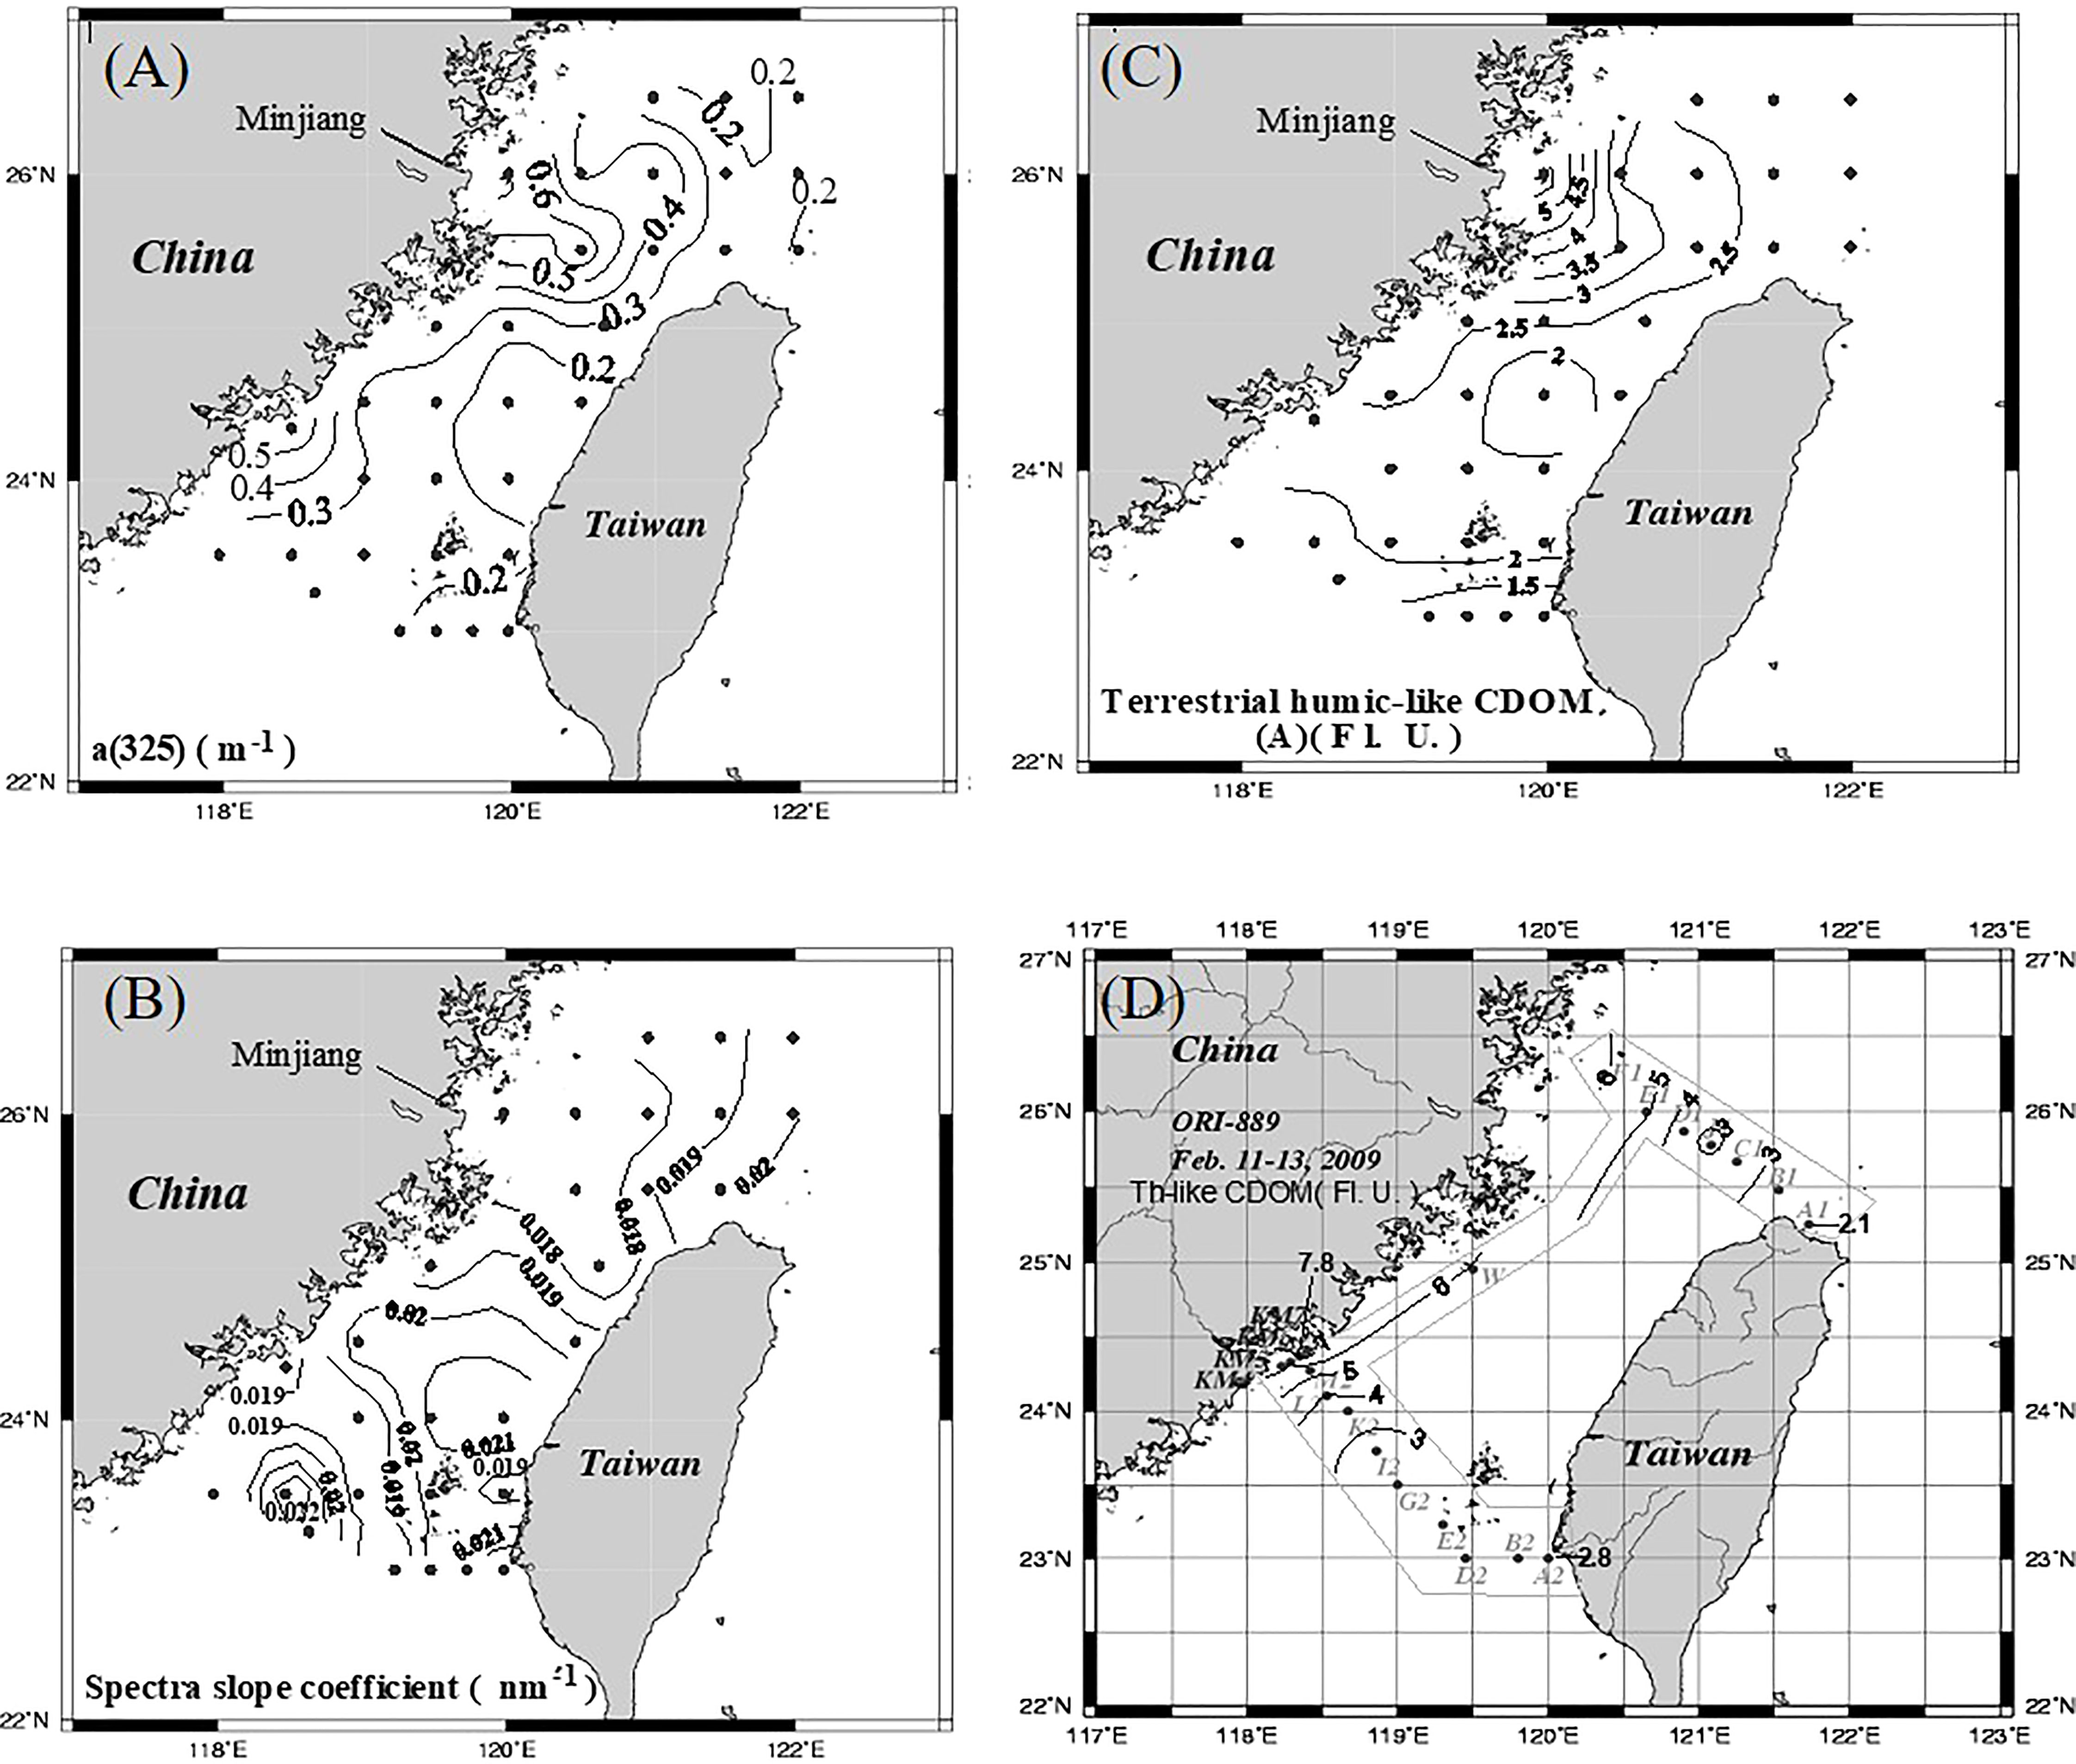
Figure 7 Spatial distributions of CDOM absorption coefficient values (A), CDOM spectral slope coefficient values (B), and terrestrial humic-like (Th-like) CDOM concentrations (C) in TS surface waters in early summer (CR 1353), and spatial distribution of Th-like CDOM concentrations in TS surface waters (D) in winter (CR 889).
The aCDOM(325) values in the western TS in winter (0.6–1.53 m−1; figure omitted) were higher than those in early summer (0.4 – 0.6 m−1). This may have resulted from the sources of CDOM between early summer and winter. The aCDOM(325) values in the eastern TS in early summer (0.2– 0.3 m−1) did not differ considerably from those in winter (0.2– 0.4 m−1). In general, the S values were slightly higher or lower in DOM molecular weight in winter than in early summer, but the spatial distributions of the S values were similar, with lower values in the western TS and higher values in the eastern TS.
Regarding CDOM fluorescence, concentrations of terrestrial Th-like CDOM were closely examined in this study because Th-like CDOM is generally regarded as an indicator of terrestrial input. The distributions of Th-like CDOM are illustrated in Figures 7C, D. The spatial distribution of fluorescence intensity increased significantly from the eastern TS to the western TS both in early summer (Figure 7C) and winter (Figure 7D). The highest value occurred in the Minjiang River plume in early summer and in the Minjiang and Jiulongjiang river plumes in winter, reflecting the contributions of terrestrial sources from the two rivers as well as those of the CDW. Yang et al. (2019) discovered that the Minjiang River exported the largest amount of DOC among the rivers adjacent to the TS, with 72% of annual flux occurring in spring and summer. They also reported the increased river export of terrestrial aromatic and high molecular weight constitutes in summer. The signal intensity of Th-like CDOM was small in the eastern TS in both seasons because the amount of discharge from the rivers on the main island of Taiwan was relatively small.
The geochemical and optical properties of DOM and CDOM have been used to trace or understand the mixing behaviors of water masses in estuarine and oceanic waters (Matsuoka et al., 2012; Yang et al., 2013; Yu et al., 2016). To evaluate the mixing behavior of terrestrial DOC (Figure 8B) and Th-CDOM (Figure 8C), the Gaoping River Estuary (Figure 8A) under well-mixed conditions was examplified to trace sources and fates of DOC and Th-CDOM in the TS. In addition to a conservative mixing behavior, the significant correlation between a(325) (an indicator of CDOM concentration) and fluorescence intensity of the Th-CDOM (Figure 8D) indicates that Th-CDOM is the main component of terrestrial CDOM. Yang et al. (2013) also reported a negative linear correlation between a350 and salinity in most estuaries in western Taiwan. Although limited data have been used to investigate mixing conditions in estuaries in southeast China, Yi et al. (2014) discovered a negative correlation between a350 and salinity in the Jiulong River estuary. Hong et al. (2012) reported that the mixing of land and local pollution sources with seawater determines the distribution of CDOM in the Jiulong River estuary. Therefore, the conservative mixing behavior of terrestrial CDOM may be used to trace the distribution and fate of CDOM in the TS.
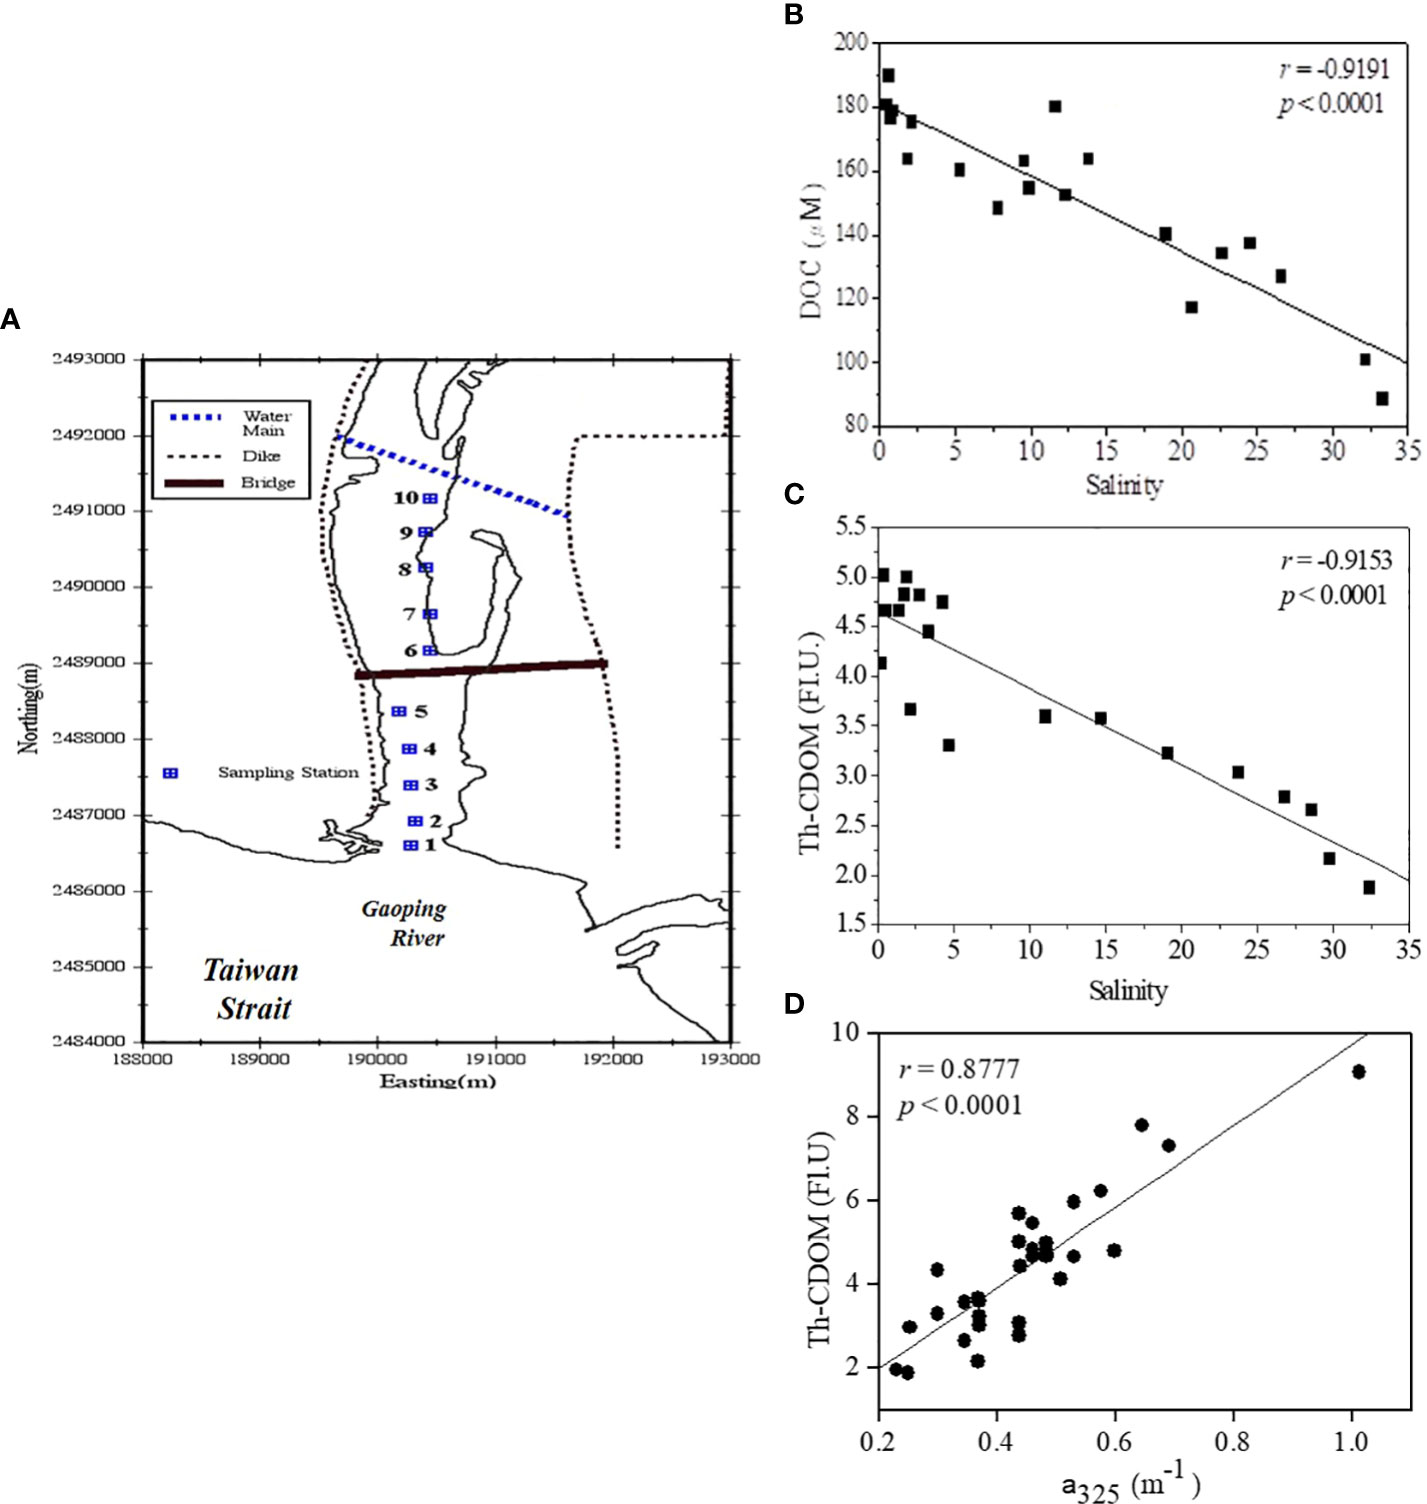
Figure 8 Sampling locations (A) and conservative mixing evidences of DOC (B) and Th-like CDOM [(C), EX/EM: 320−360 nm/420−460 nm] in the Gaoping Estuary (Taiwan). The correlation is highly significant between CDOM absorption coefficient values and CDOM (Th-CDOM) fluorescence intensity (D) in the experiment.
The concentration of N+N varied inversely but not strictly linearly with salinity in early summer and winter (Figure 9), indicating the roles of terrestrial and human sources in determining the elevated surface concentrations of N+N in early summer and of pollution and CCW in determining the N+N concentrations in winter. Zhang et al. (2004, 2015) attributed the recent increase in pollution and hypoxic conditions in the Minjiang Estuary to increased agricultural activity and wastewater input. The surface concentrations of N+N were generally low in early summer except for those at stations close to the Minjiang plume (e.g., Station 25). The inverse relationship of phosphate-salinity was similar to that of (N+N)-salinity, but the relationship of silicate-salinity was stronger than that of (N+N)-salinity because of silicate being derived mainly from terrestrial sources (figures omitted). The high concentration of nutrients at Station 10 (see Figure 1A for location, concentration not shown) relative to those at the neighbouring stations was likely caused by the upwelling of the northward SCSW rather than by river input because of the high salinity (34.37) and relatively low temperature. The response of N+N concentration to changes in salinity in winter was sharper than in early summer, mainly because of the effect of the Changjiang Dilute Water (CDW) being carried southward by the China Coastal Current, particularly on the coast of China. The CDW generally has a salinity of 30−32 and high concentrations of N+N (>18 μM) even in the middle of the coast of China (Chen et al., 2021), causing the TS (especially near the coast of China) to have a higher N+N concentration in winter than in early summer. Figure 10 illustrates the sharp gradients of seawater temperatures, which increased from the coast of China to the coast of Taiwan coast (from 14°C at Station F1 to 19°C at Station A1; Figure 10A) and the concentrations of N+N, which decreased from the coast of China to the coast of Taiwan (from 20 μM at Station F1 to 6 μM at Station A1; Figure 10C) along the northern transect. Similar conditions occurred in the southern section (Figures 10B, D), with temperatures increasing from the coast of China to the coast of Taiwan (from 15°C at Station M2 to 22.6°C at Station D2) and concentrations of N+N decreasing from the coast of China to the coast of Taiwan (from14 μM at Station M2 to 1 μM at Station D2), although temperatures and N+N concentrations were generally higher and lower, respectively, in the southern section than in the northern section. These results indicate the effect of the CDW, with a low temperature and high concentrations of nutrients, on the western TS in winter. The distribution patterns of phosphate and silicate (data not shown) were similar to that of N+N in both early summer and winter; however, the variations in silicate concentration between early summer and winter at a given salinity were smaller, likely because the silicate contribution of rivers was higher in early summer than in winter.
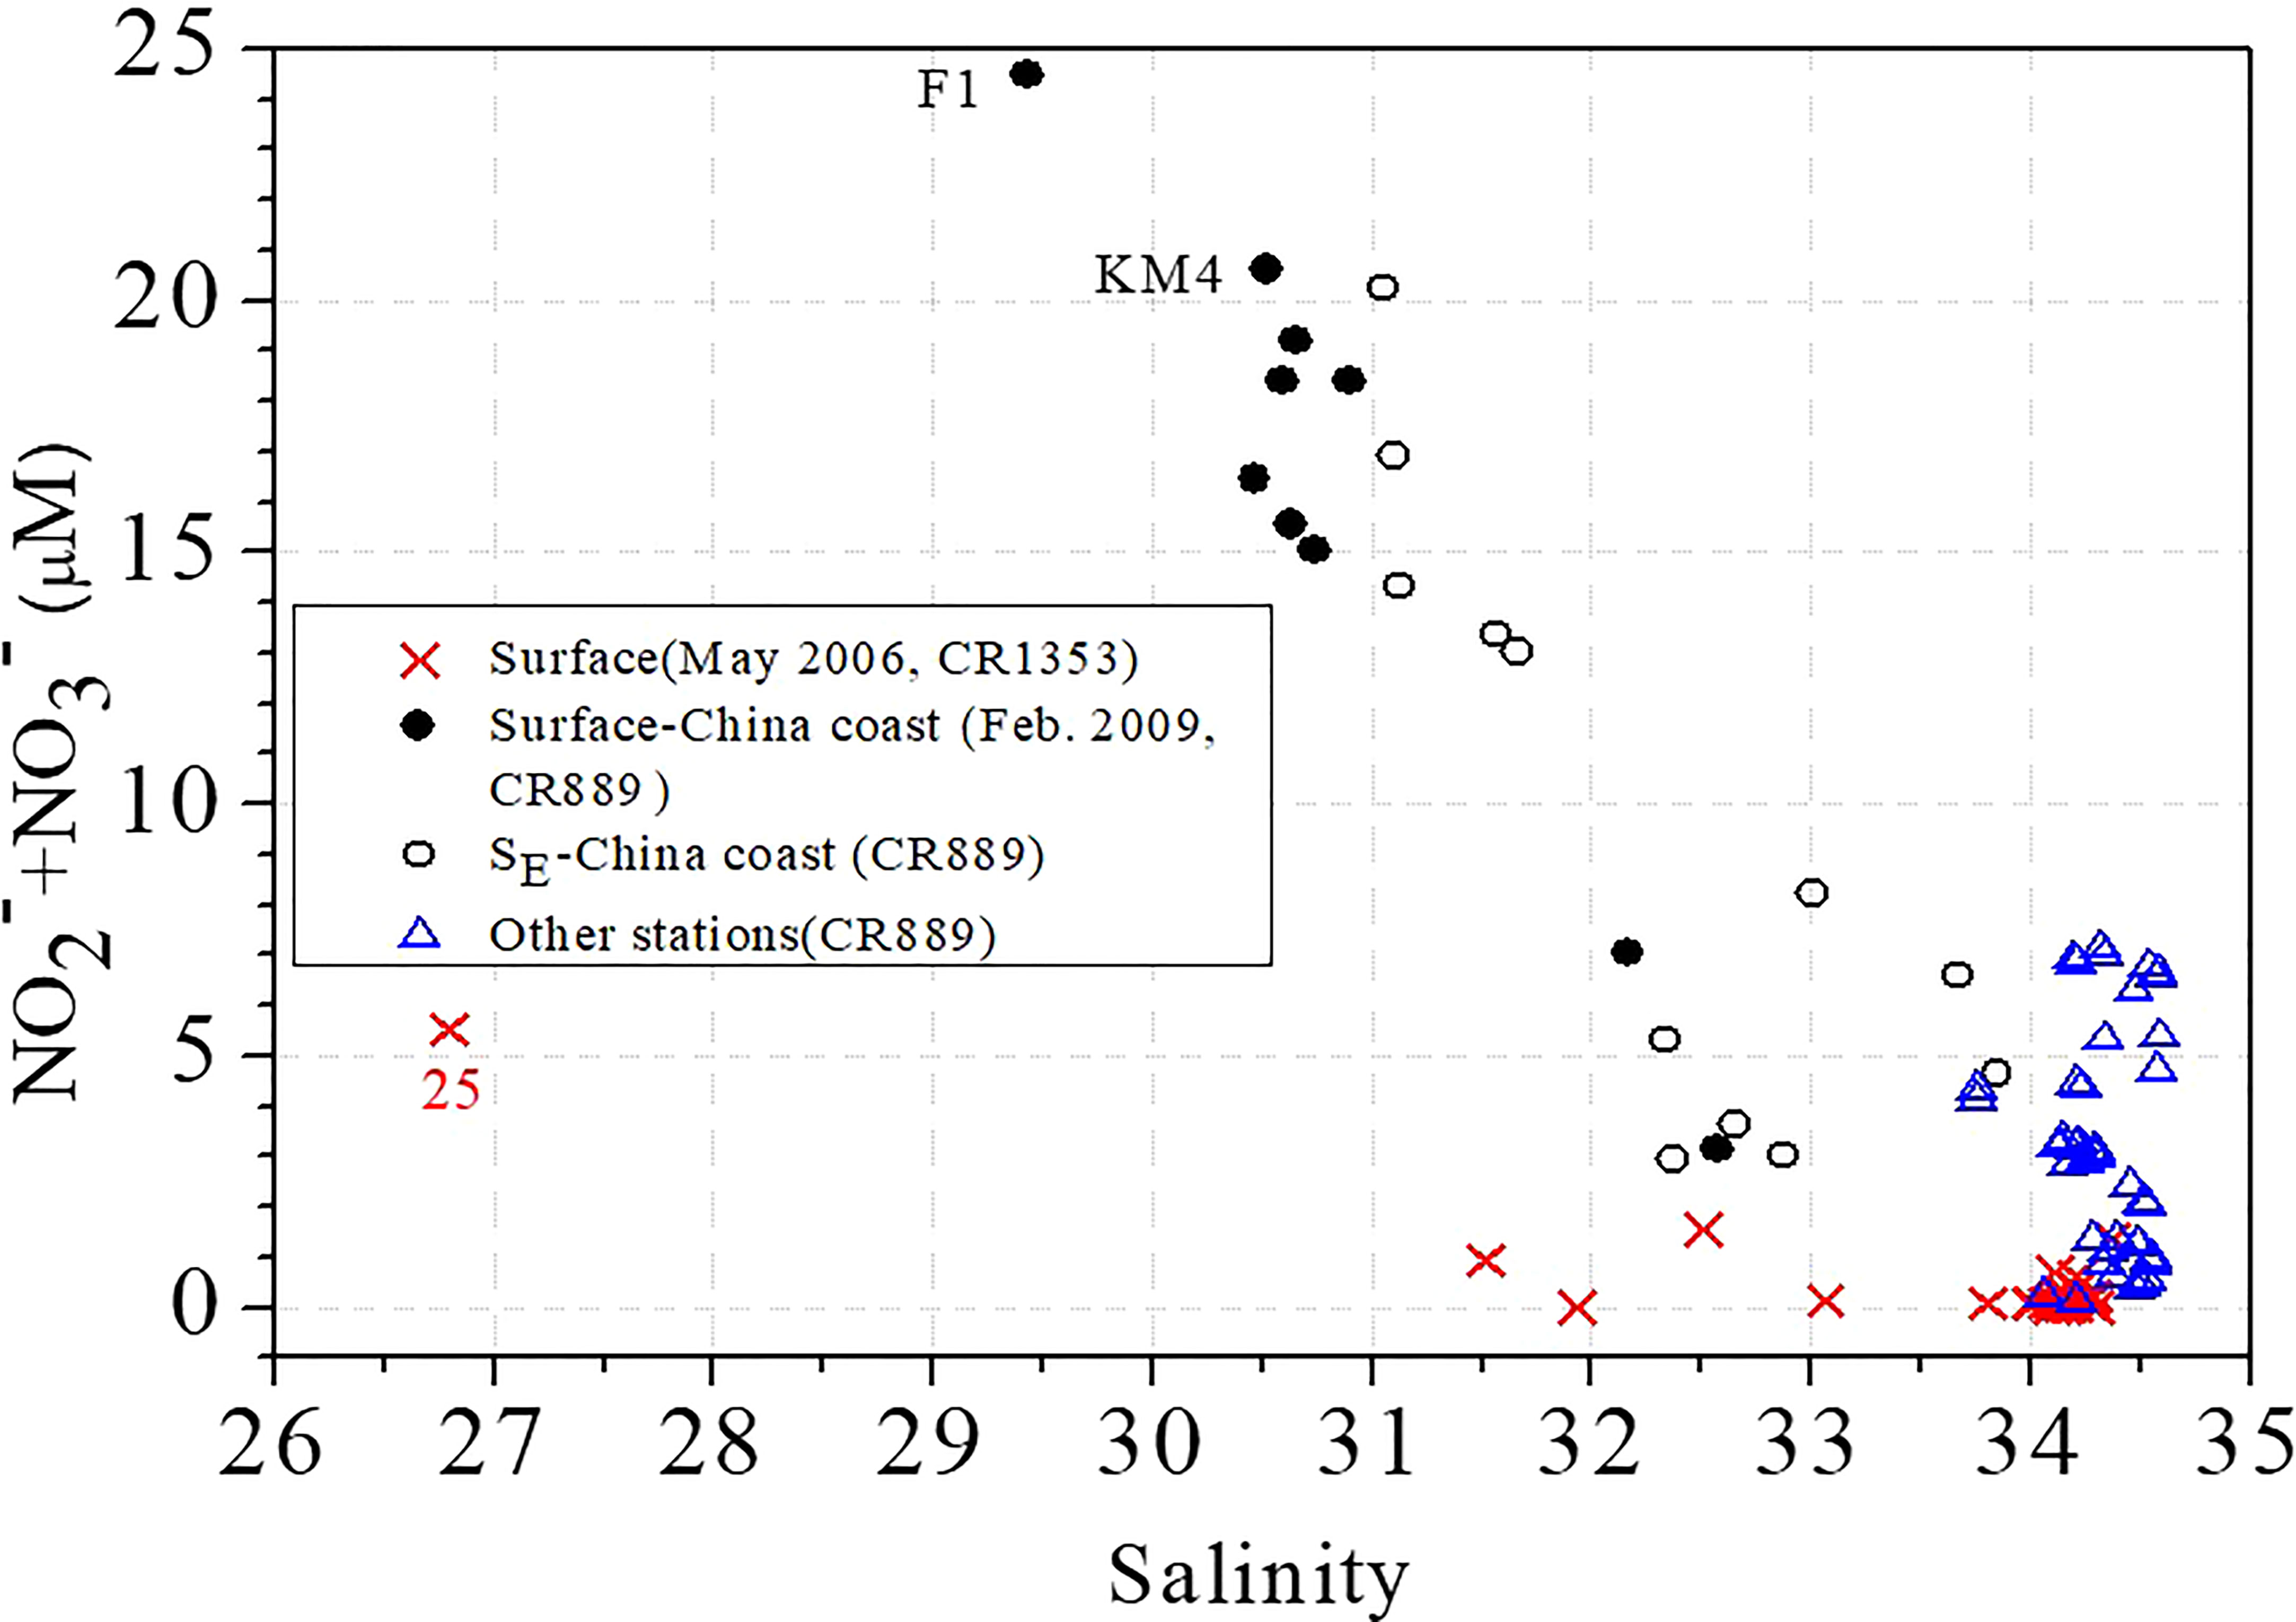
Figure 9 Schematic plot of N+N concentrations and salinity in early summer (×, CR1353) and winter (other icons, CR889) in the TS. SE-China coast is surface-excluded samples in the coast of China. The sampling stations with particularly low salinity and high N+N concentrations (25, F1, KM4) are noted.
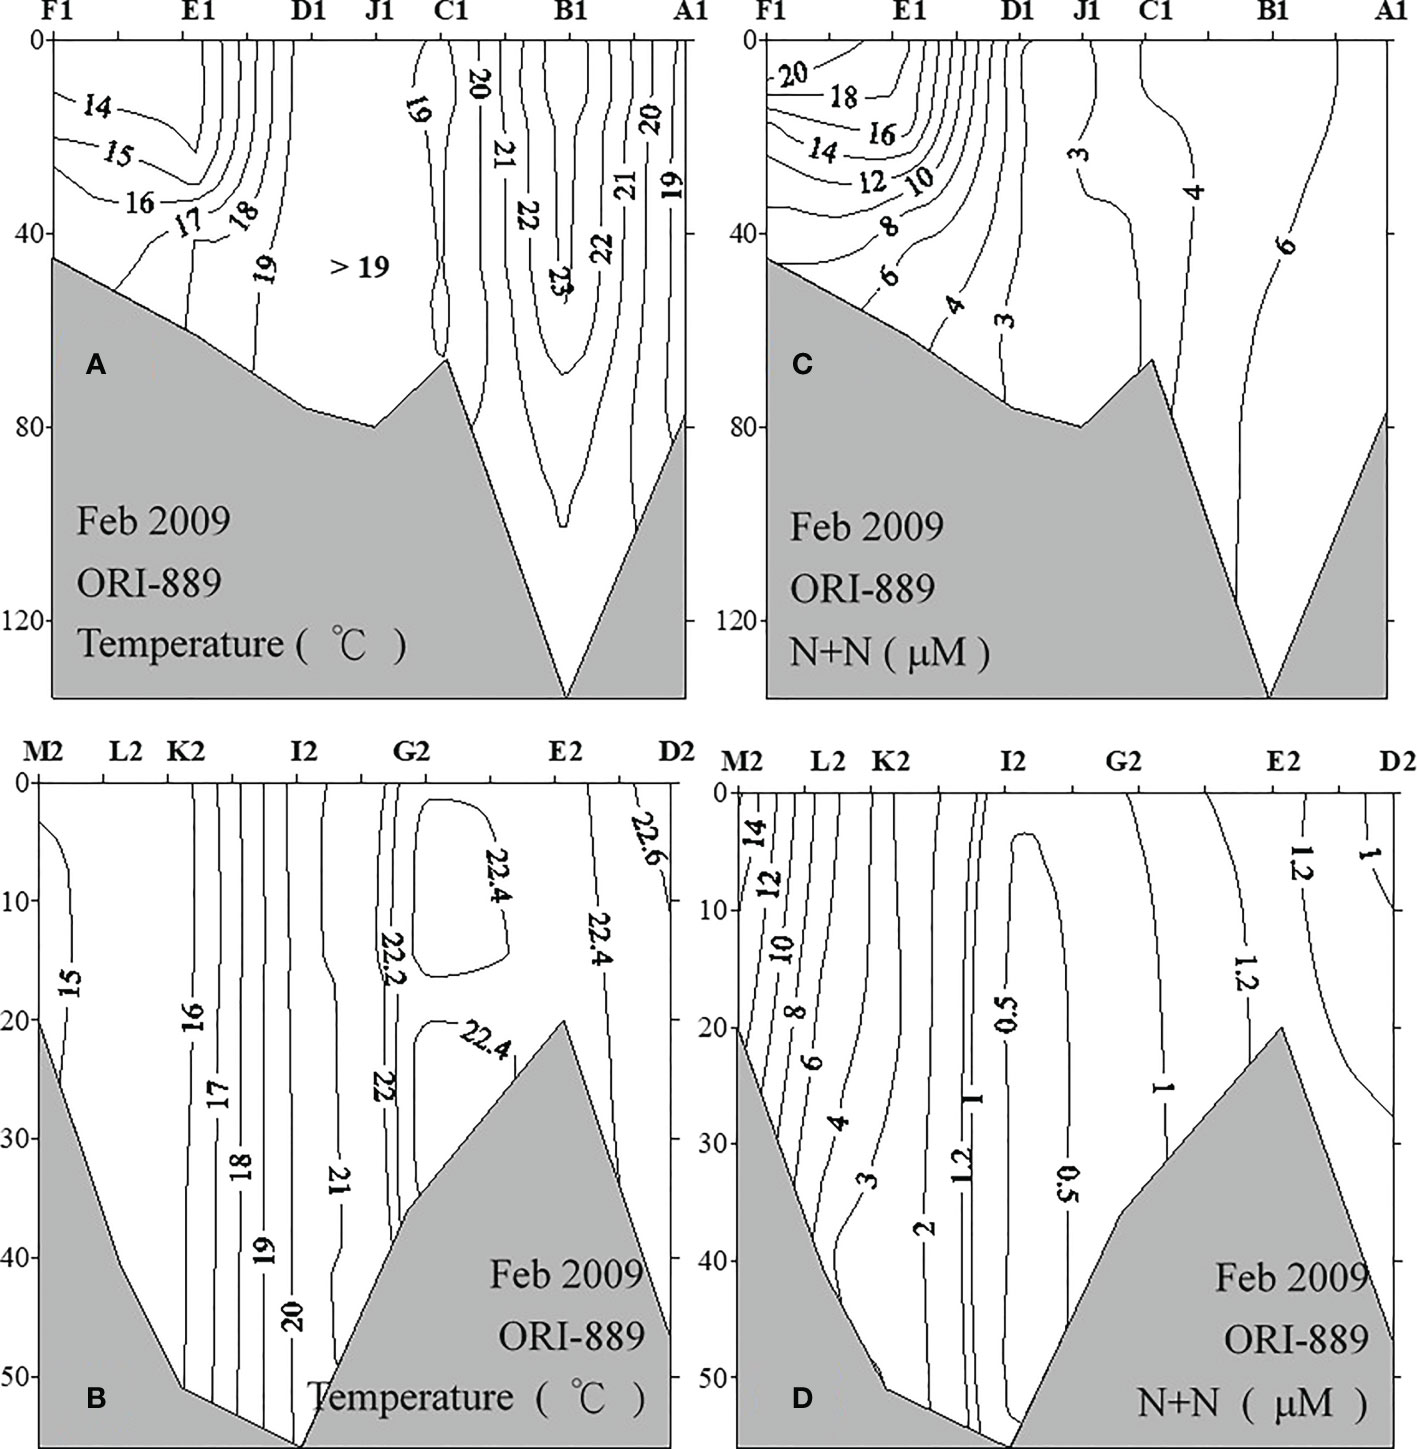
Figure 10 Temperature and N+N contours in the profiles of water samples from along the northern (A, C; upper panel) and southern (B, D; lower panel) TS-crossing transects in winter (Feb. 2009).
The concentration of DOC was inversely correlated with salinity except for at a few stations with particularly high DOC concentrations (Figure 11) but was weakly correlated with Chl-a (data not shown), indicating that the distributions of DOC in early summer and winter were likely determined primarily by terrestrial input and hydrological processes rather than by biological processes. The concentrations of DOC at a given salinity were comparable between early summer and winter, because the contribution of DOC from the CDW was lower in winter. The especially high concentration at KM6 (see location in Figure 1B) and moderately high concentration at A1 in winter were likely caused by pollution in the Jiulongjiang River plume (at KM6) and in water close to the Damshui Estaury in Taiwan (at A1). DON was also inversely correlated with salinity, but DOP concentrations were not strongly correlated with salinity and exhibited little spatial variation in early summer. Unfortunately, DON and DOP data were not collected during winter for further comparisons. The relatively high DOC : DON:DOP ratio (353:49:1) at Station 25 reflects the effect of terrestrial DOM in the Minjiang River plume in early summer. However, the ratios at Station 10 (186:20:1) and Station 31 (168:21:1) were significantly lower and closer to the Redfield ratio, indicating that the DOM at these stations was mainly derived from biological sources. This is because Stations 10 and 31 are located in the upwelling zone and have higher concentrations of nutrients than those at neighboring stations. In general, the DON : DOP ratios were largely confined to the ranges between 16 (lower limit, the Redfield ratio) and 50 (upper limit) in early summer and can be roughly grouped as three zones (with DON/DOP ratios of 20.6, 28.5, and 57.0) increasing from the coast of Taiwan to the coast of China (Figure 6), following a pattern opposite to that of nutrient distribution.
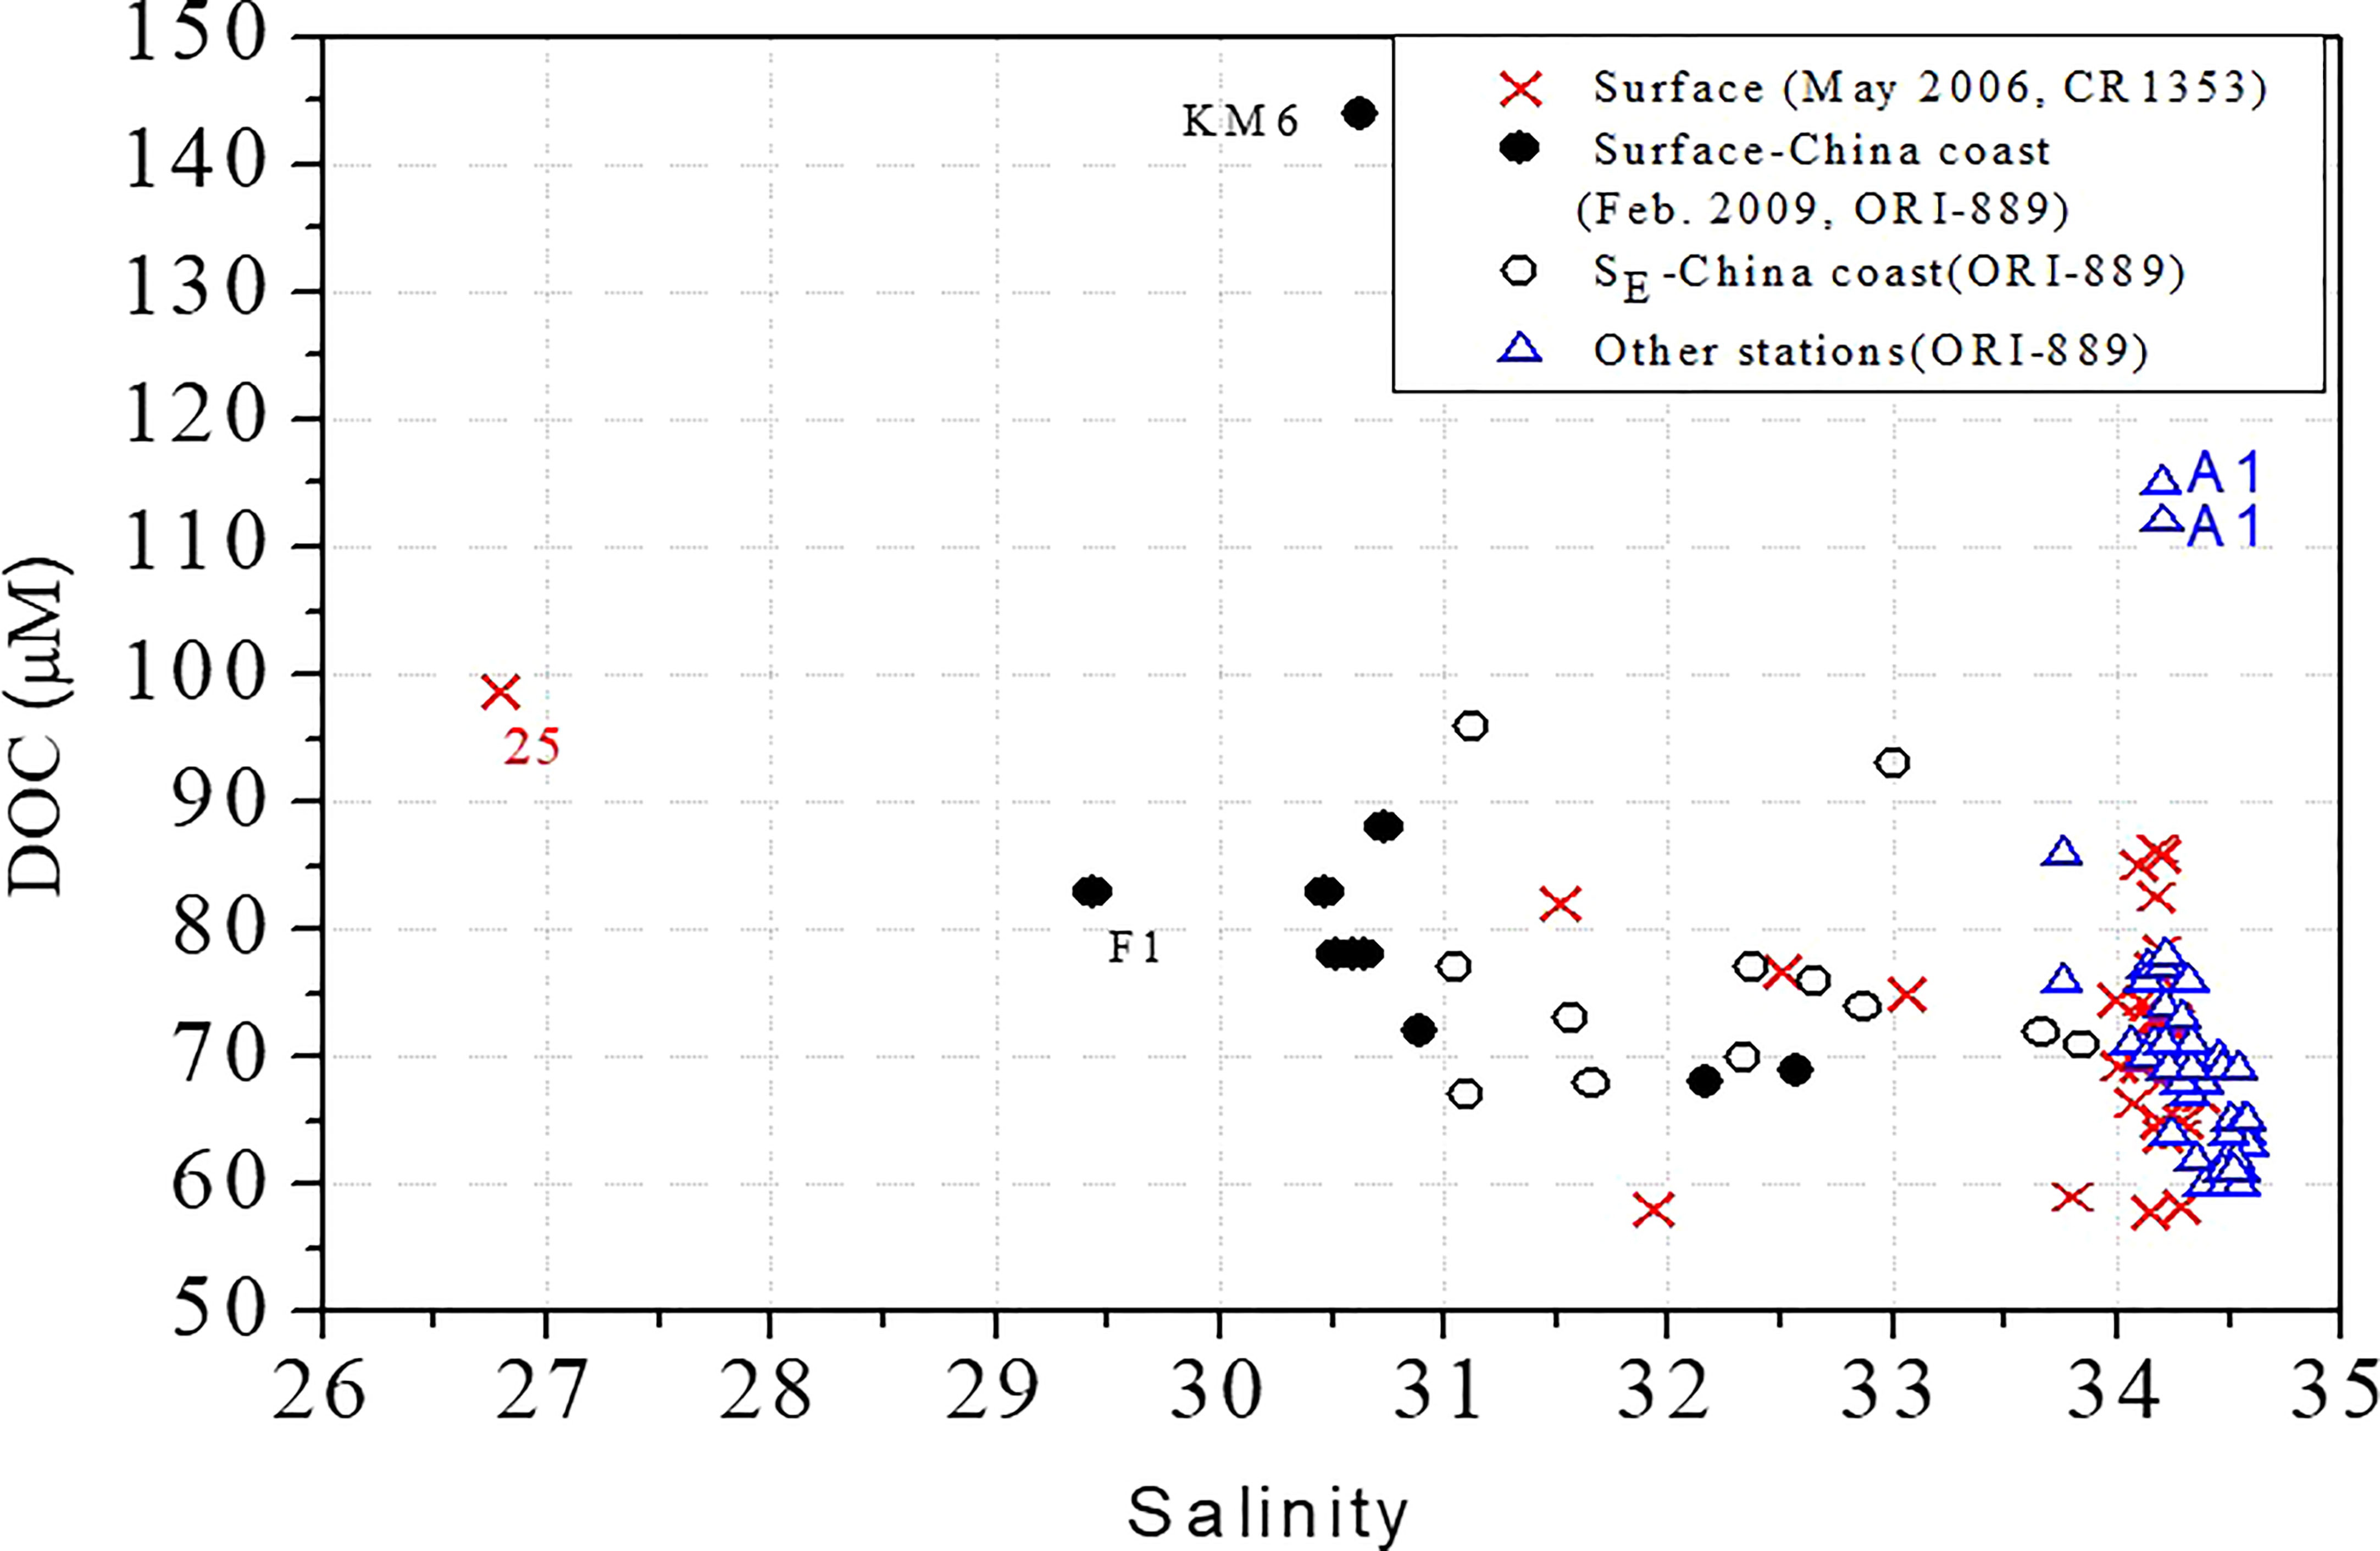
Figure 11 Relationship between DOC and salinity in early summer (×, CR1353) and winter (other icons, CR889) in the TS. SE-China coast is surface-excluded samples in the coast of China. The sampling stations with particularly low salinity and high DOC concentrations (25, F1, KM6, A1) are noted.
Th-like CDOM was significantly and negatively correlated with salinity (Figure 12) in early summer, suggesting that Th-like CDOM in the TS is mainly derived from terrestrial input. The concentrations of marine-like and Th-like CDOM (data omitted) were also significantly correlated (r = 0.8445, p<0.0001), indicating that terrestrial nutrient input supports biological productivity and serves as a source of marine-like CDOM. Although aCDOM(325) did not behave conservatively (because it was affected by multiple sources and was subject to a photobleaching effect), the fluorescence intensity of Th-like CDOM was significantly inversely correlated with salinity (r = −0.8051, p<0.0001) in the TS. This indicates that Th-like CDOM can be effectively used as an optical tracer for predicting the mixing of source waters (the CDW, Minjiang Water, S SCSW, and KW). The validity of Th-like CDOM as an optical tracer is also supported by the significant relationship between salinity and Th-like CDOM concentrations (r = −0.9153, p<0.0001) in the Gaoping Estuary under well-mixed conditions (Figure 8C). In early summer, the KW and SCSW have the highest salinity and lowest Th-like CDOM concentrations and the CDW and Minjiang Water have the lowest salinity highest Th-like CDOM concentrations. Therefore, salinity and Th-like CDOM concentrations of samples from the TS are scattered linearly between the highest and lowest values.
The distribution profiles of Th-like CDOM along the northern and southern TS-crossing transects (Figures 13A, B) reveal a clear decreasing trend in Th-like CDOM concentration from the western TS to the eastern TS and from the surface to the bottom of the sea. The pattern indicates that the distribution of Th-like CDOM in the TS is determined primarily by mixing between the CDW and the KW in winter. Therefore, Th-like CDOM is inversely correlated with salinity (r = −0.7896, p<0.0001; Figure 12), and Th-like CDOM can be effectively used as an optical tracer for water mixing in the TS.
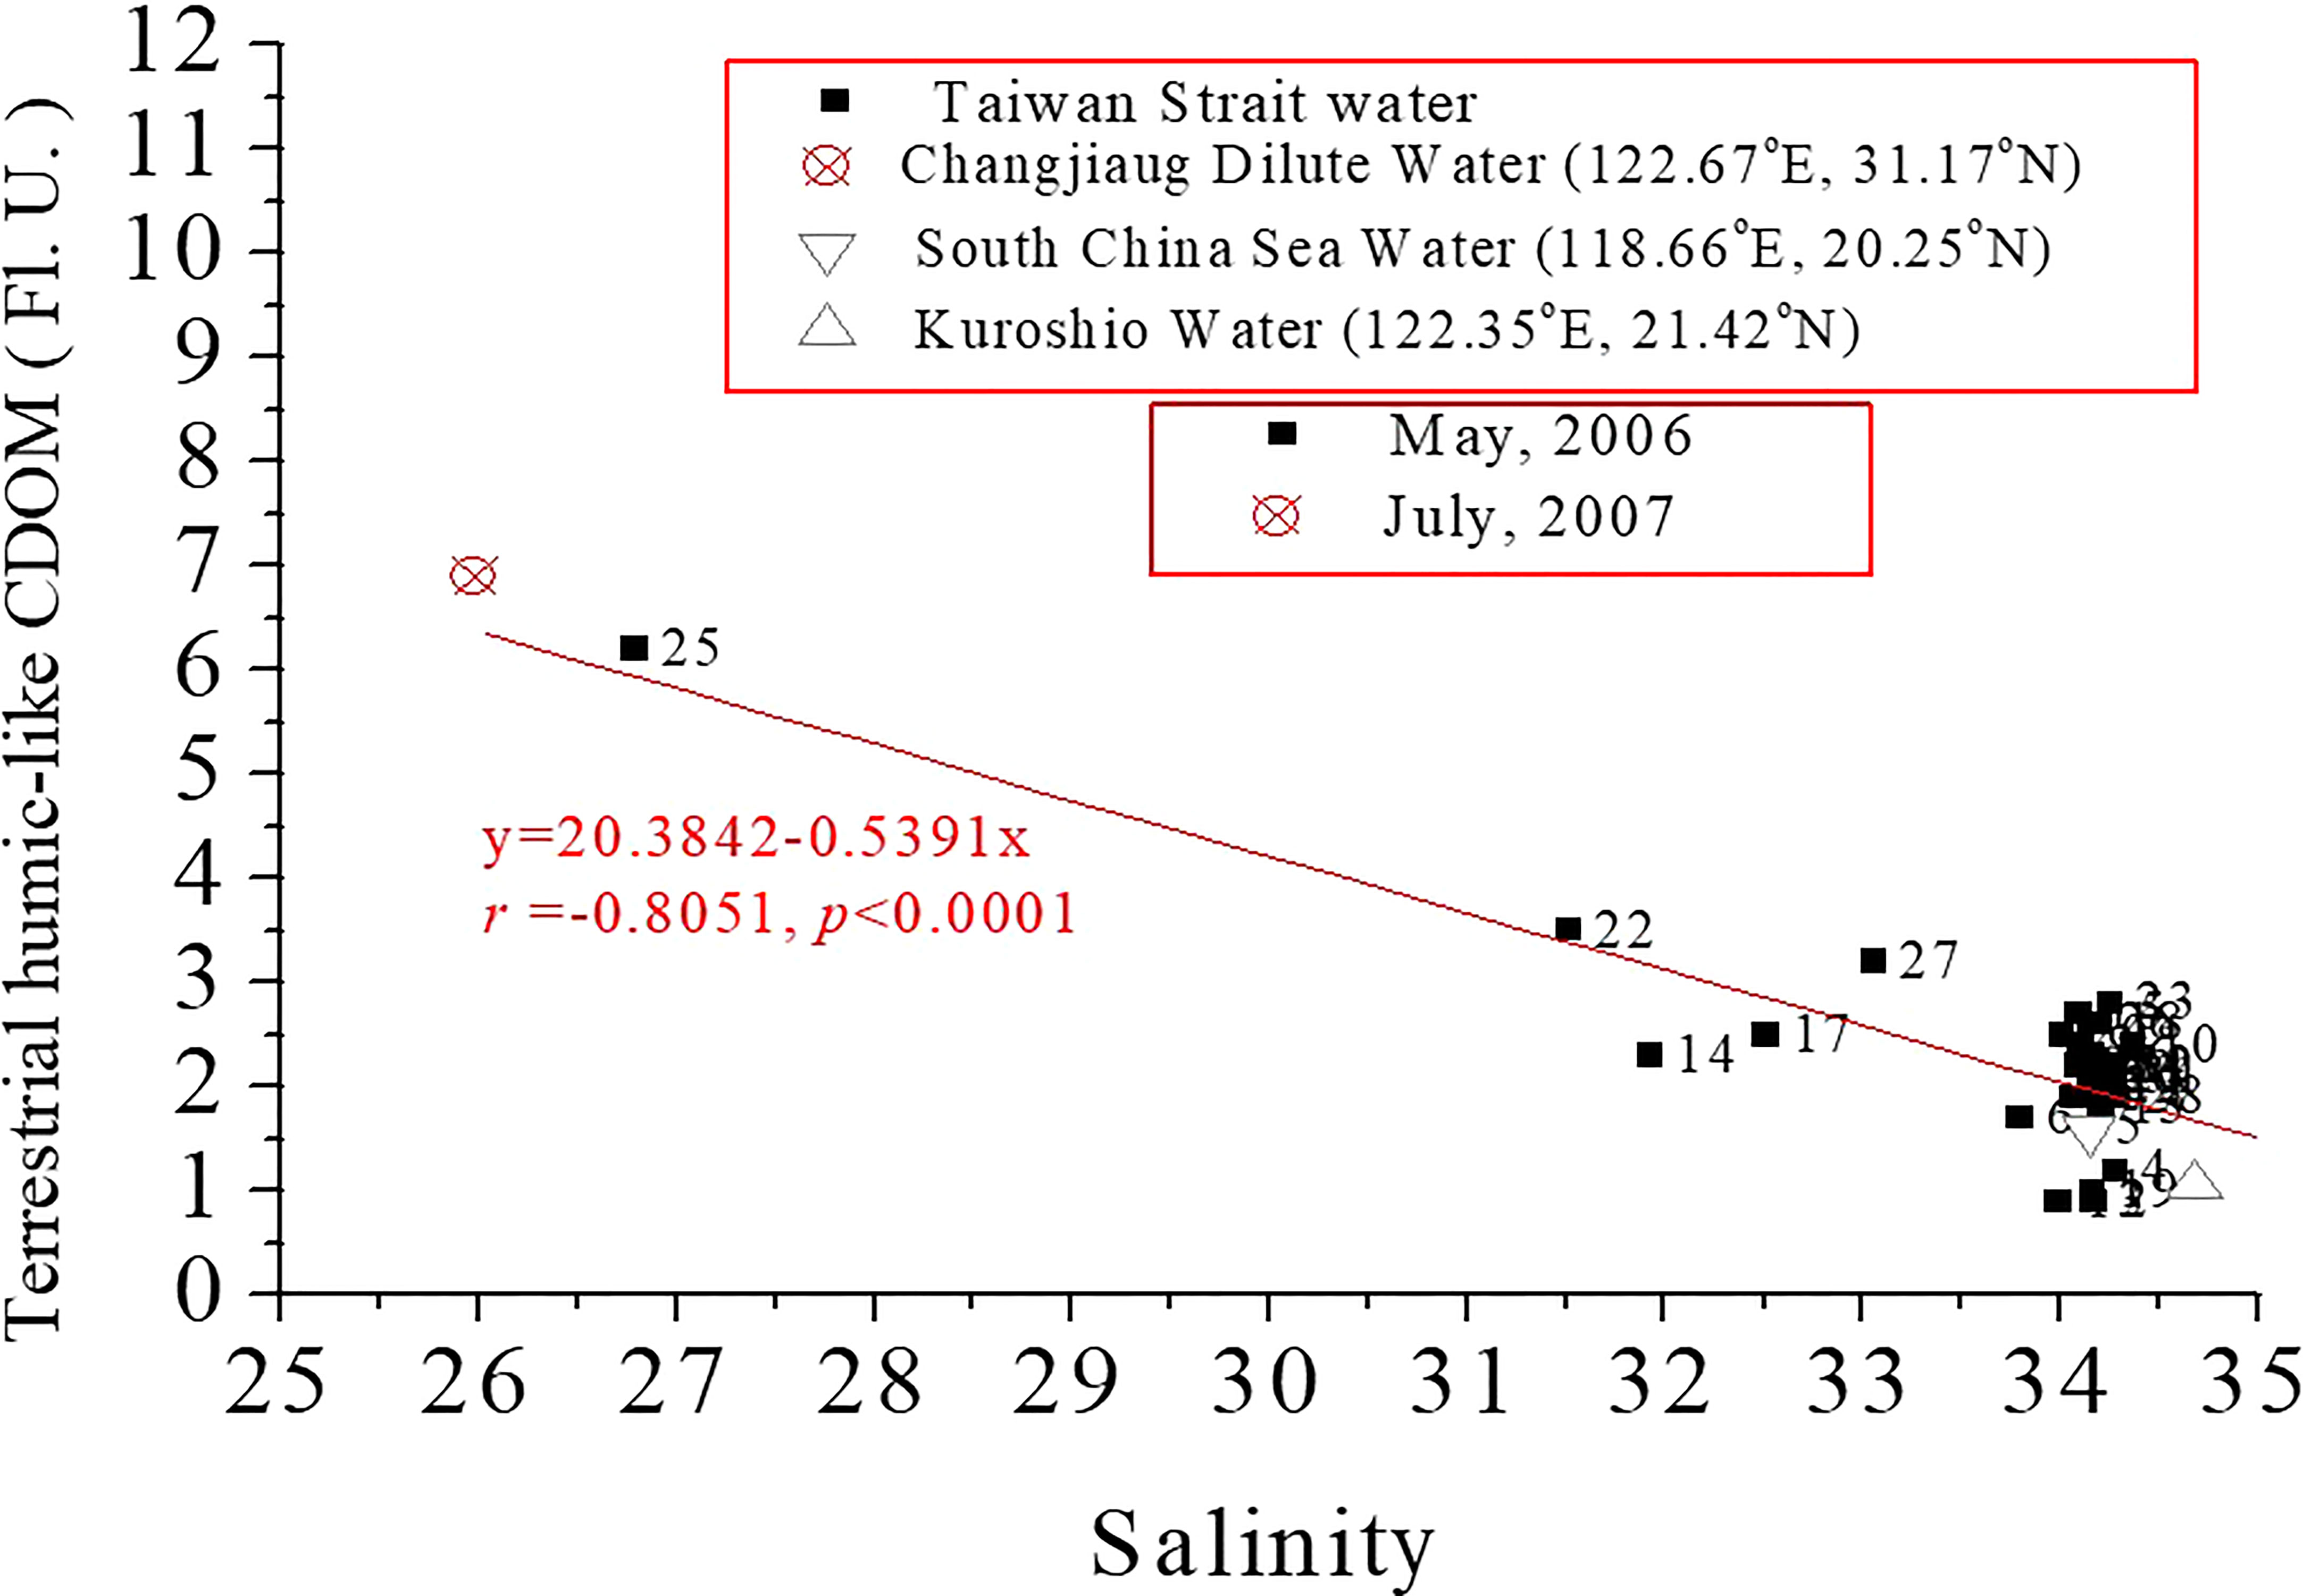
Figure 12 Inverse correlation between Th-like CDOM and salinity in TS surface waters in early summer season.
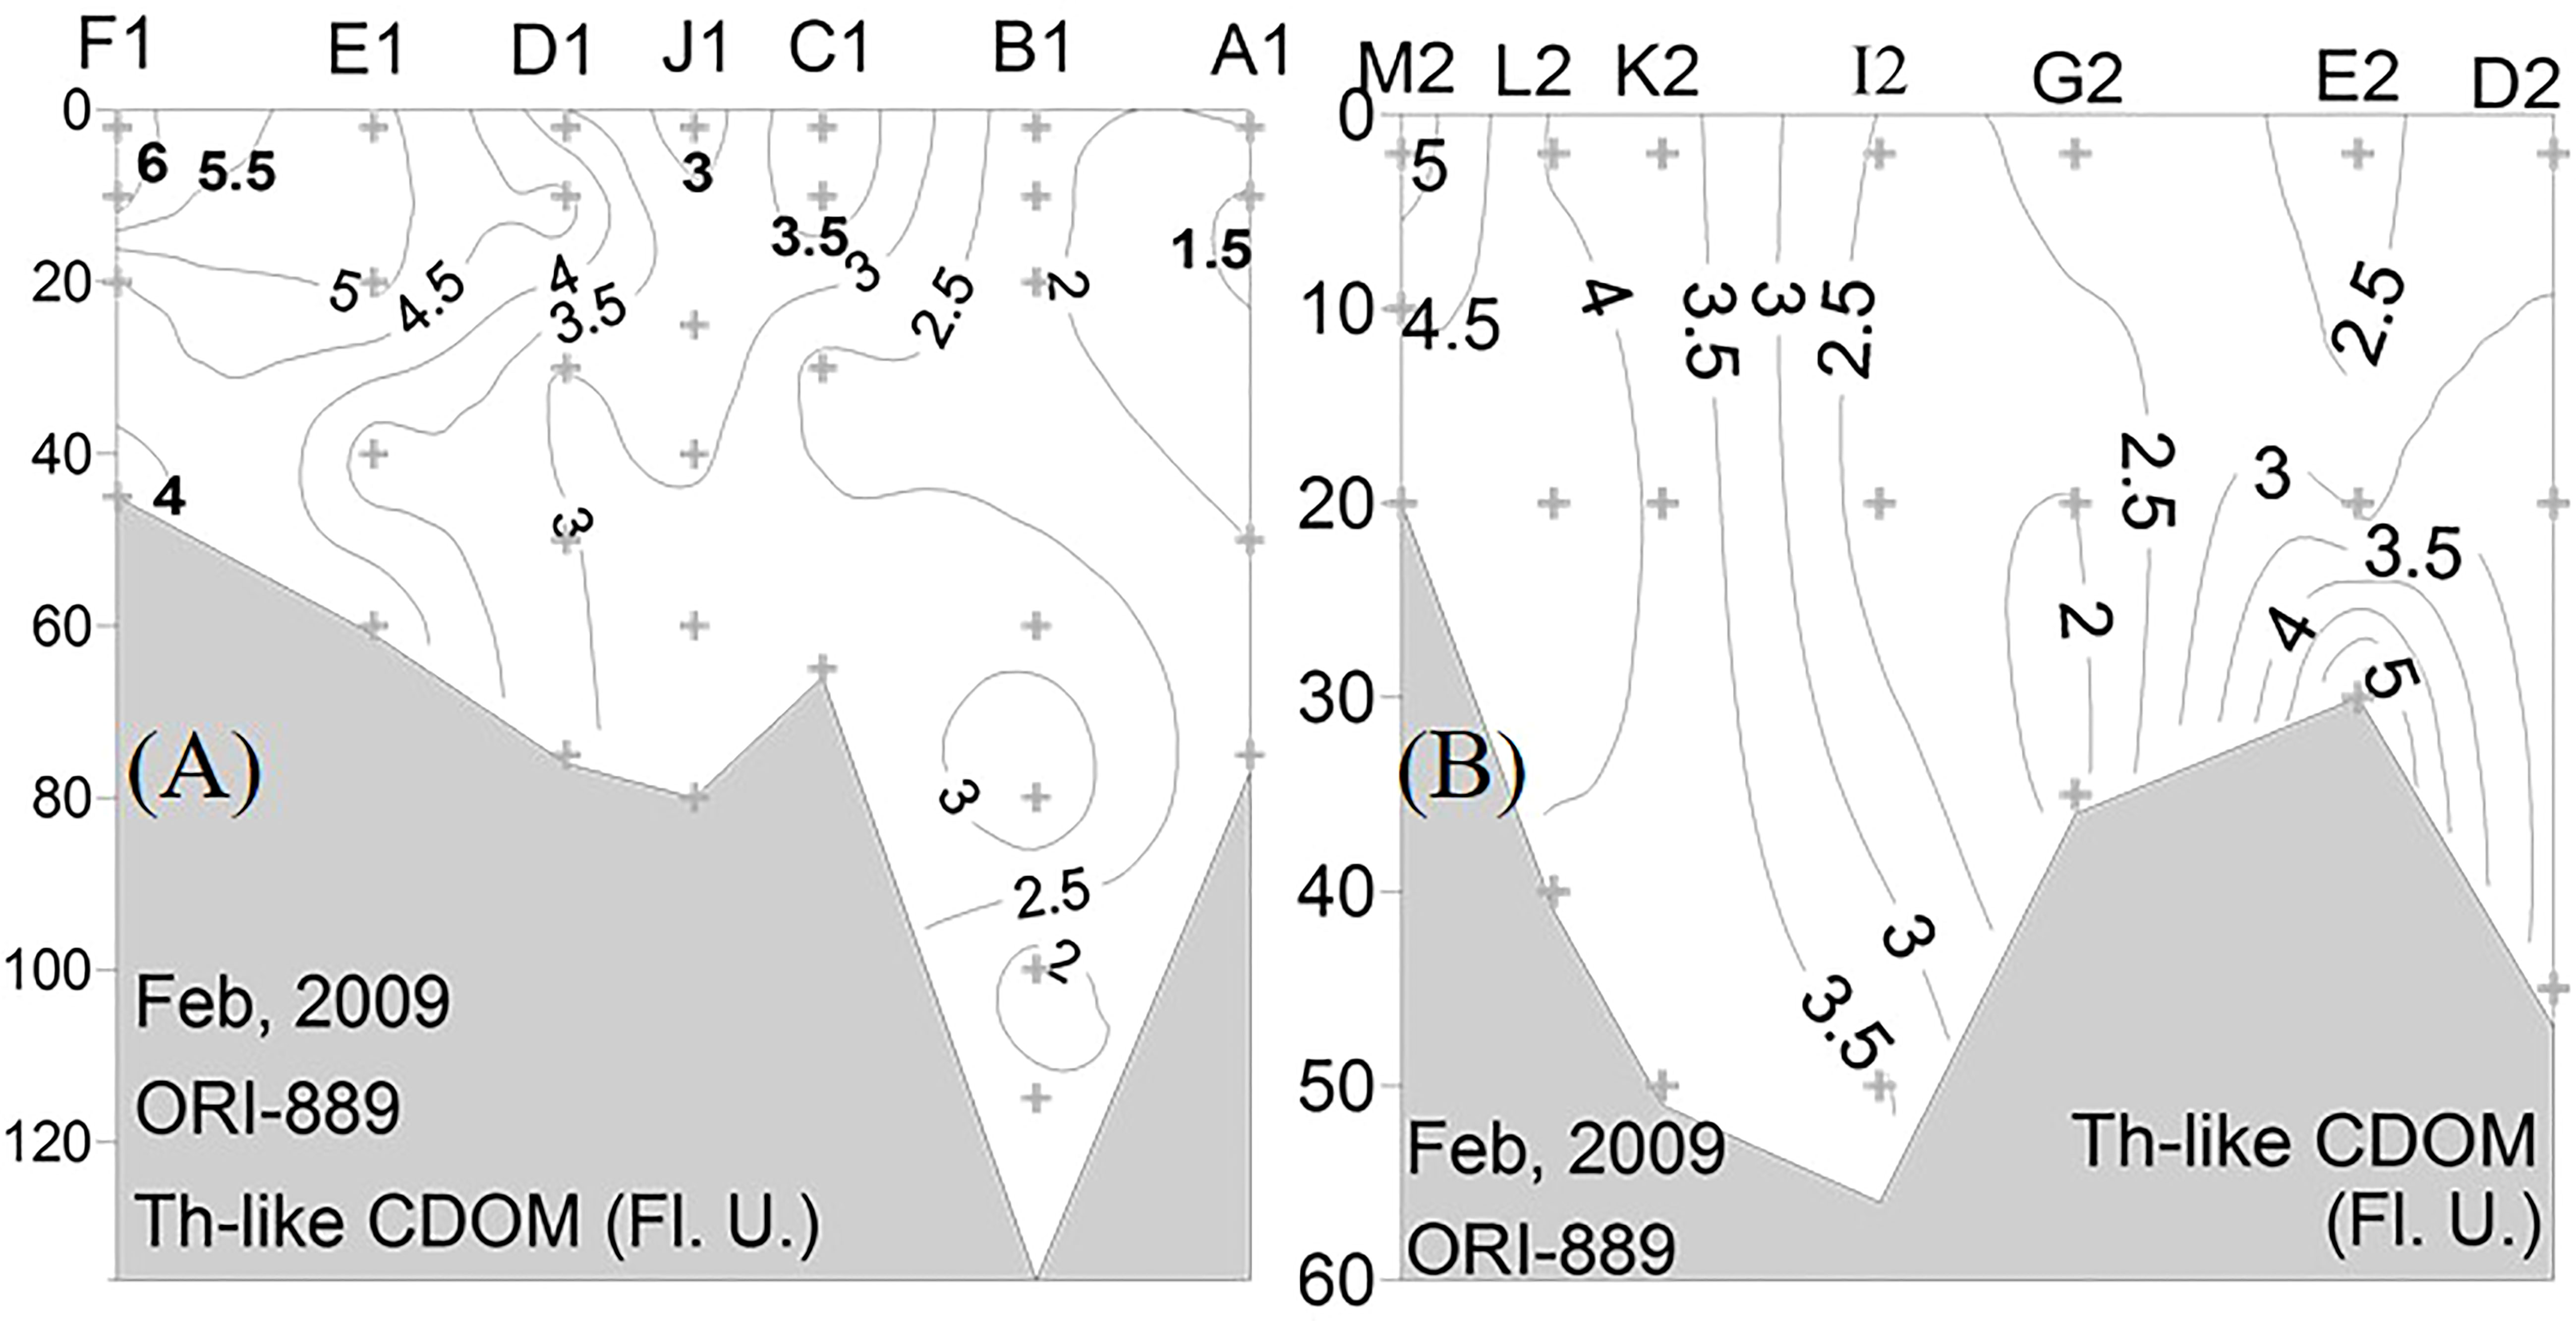
Figure 13 Distributions of Th-like CDOM along the northern (A) and southern (B) TS-crossin transects in winter.
To further elucidate the processes and factors affecting the DOM and CDOM distributions in the TS, factor analysis was used to investigate potential statistical associations among physical and biogeochemical parameters and potential cause-and-effect relationships between such parameters and fates of DOM and CDOM in the TS. The results of the factor analysis (Table 2) indicated that Factor 1 explained 31.6% of the variance in temperature; salinity; and silicate, N+N, terrestrial and marine humic-like CDOM, DOC, and POC concentrations. The concentrations of DOC and CDOM were significantly correlated with those of terrestrial-derived indicators, and the distributions of DOC and CDOM in the TS in early summer are likely controlled primarily by hydrological conditions and physical processes. The Factor 2, which was principally associated with parameters related to biological productivity, could explain 21.7% of the variance in the selected parameters. Chl-a was positively correlated with tryptophan-like CDOM and a(325) but inversely correlated with temperature and salinity. This is likely because the western TS receives fresh water and nutrients that fuel primary productivity and has a lower temperature than does the eastern TS influenced considerably by the SCSW and the warm intruding KW. The variance in DON and DOP concentrations may be associated with biological activity and thus determined by physical and biological processes. Factors 3−5 were less important, explaining only 13.762%, 12.295%, and 8.263% of the variance, respectively. The variance associated with Factors 3–5 was likely associated with the subsurface upwelling around Station 10; biological excretion of DON and DOP; and recycling of DOC, NH4+, and tyrosine-like CDOM, respectively (Table 2). Yang et al. (2016) did find a close relationship between apparent oxygen utilization (AOU) and DOM parameters, including DOC and protein-like CDOM in the east TS, suggesting for the influence of microbial activities on the dynamics of DOM. In total, the five factors explained approximately 90% of the variance.
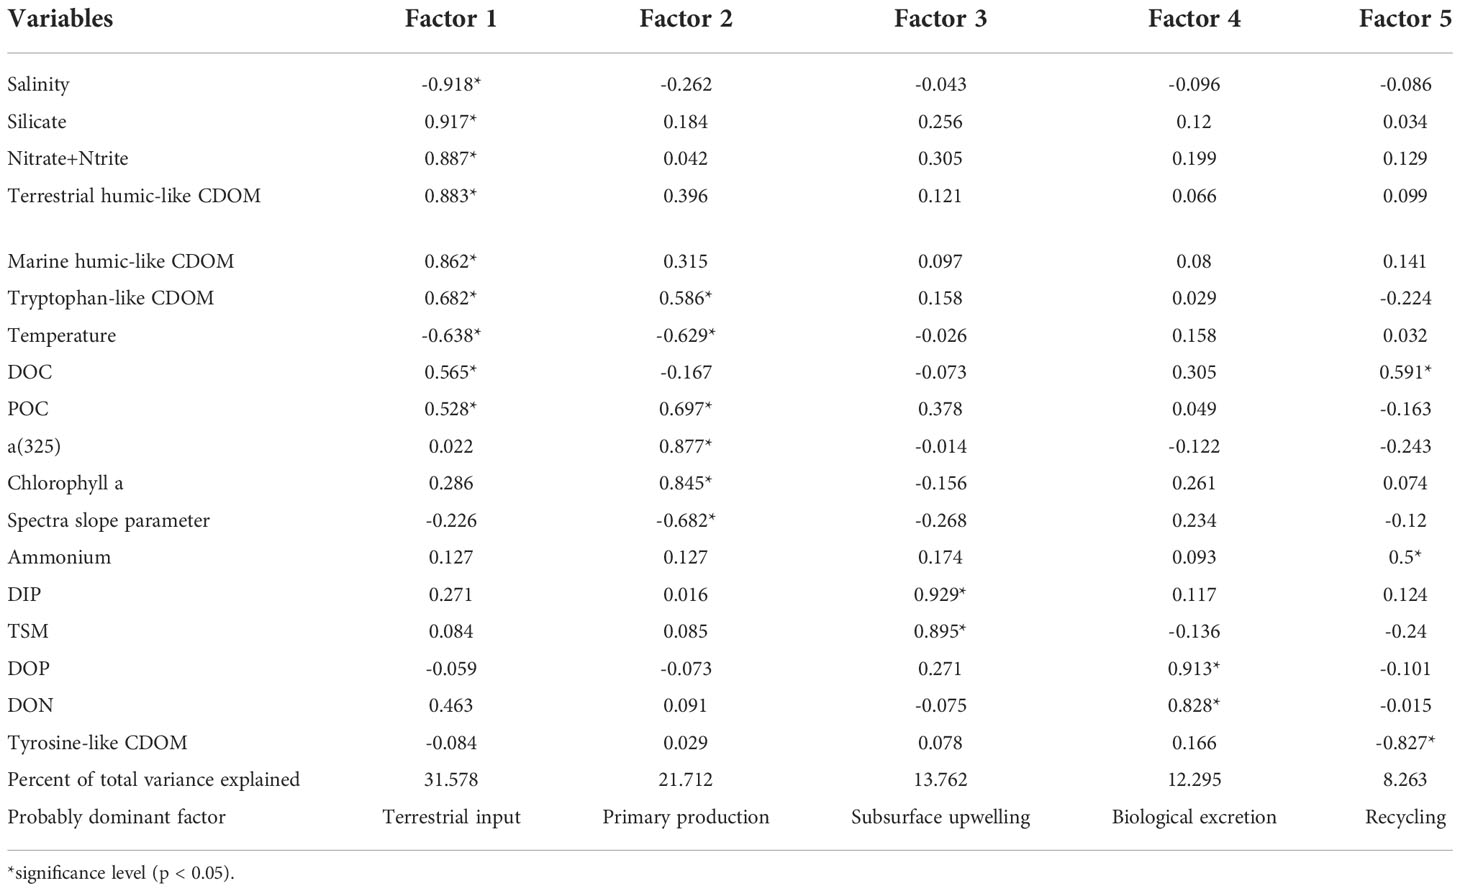
Table 2 Factor matrix of hydrological and biogeochemical variables in the TS in early summer (CR1353).
Factor analysis was also performed for the data collected in winter. The results were highly similar to those obtained in the factor analysis of data collected in early summer. Factors 1−5 explained 23.096%, 19.012%, 14.682%, 9.616%, and 10.670% of the variance in the parameters, respectively accounting for approximately 80% of the total variance. Factor 1 explains considerably less variance in the parameters in winter because of the lower amount of terrestrial input.
The distributions of nutrients, DOM, and CDOM in the TS are mainly controlled by local input of polluted river water mixed with the poleward SCSW and Kuroshio branch current (which have low nutrient, DOM, and CDOM concentrations) in early summer and by the CDW (which has high nutrient, DOM, and CDOM concentrations) and the intruding KW in winter. Because of the unique characteristics and conservative behavior of Th-like CDOM in different source waters, Th-like CDOM can be used as an effective optical tracer to examine the mixing of source waters, including the CDW, Minjiang Water, SCSW, and KW, in the TS. The factor analysis performed in the present study revealed the relative importance of hydrological and biogeochemical processes in determining the distributions of nutrients, DOM, and CDOM in the TS in early summer and winter.
The original contributions presented in the study are included in the article/supplementary material. Further inquiries can be directed to the corresponding author.
J-JH conducted the experiment and data analysis and wrote the manuscript. W-TL conducted sample collection and analysis and data analysis. H-MY performed mixing experiment in the Gaoping Estuary. Y-HL performed data analysis and manuscript preparation. LG performed data discussion and reviewed the draft manuscript. All authors contributed to the article and approved the submitted version.
This study was supported by the National Science Council and Ministry of Science and Technology, Taiwan, Republic of China (NSC 100-2621-M110-002, MOST 106-2611-M-110-015-, MOST 111-2611-M-110-016) and the “Aim for the Top University Plan” of the National Sun Yat-sen University and Ministry of Education, Taiwan, ROC (06C030203).
The authors would like to thank Dr. KT Jiann and Dr. CTA Chen for acting as the chief scientists and helping for sampling in Cruises ORII CR 1393 and ORI CR889, respectively. Thanks are extended to YL Kuo, FH Lee and YC Yeh for their assistance in sampling and the analyses.
The authors declare that the research was conducted in the absence of any commercial or financial relationships that could be construed as a potential conflict of interest.
All claims expressed in this article are solely those of the authors and do not necessarily represent those of their affiliated organizations, or those of the publisher, the editors and the reviewers. Any product that may be evaluated in this article, or claim that may be made by its manufacturer, is not guaranteed or endorsed by the publisher.
Abdulla H. A. N., Minor E. C., Dias R. F., Hatcher P. G. (2013). Transformations of the chemical compositions of high molecular weight DOM along a salinity transect: Using two dimensional correlation spectroscopy and principal component analysis approaches. Geochim. Cosmochim. Acta 118, 231246. doi: 10.1016/j.gca.2013.03.036
Abell J., Emerson S., Renaud P. (2000). Distributions of TOP, TON and TOC in the north pacific subtropical gyre: Implications for nutrient supply in the surface ocean and remineralization in the upper thermocline. J. Mar. Res. 58, 203–222. doi: 10.1357/002224000321511142
Amon R. M. W., Fitznar H.-P., Benner R. (2001). Linkages among the bioreactivity, chemical composition, and diagenetic state of marine dissolved organic matter. Limnol. Oceanogr. 46, 287297. doi: 10.4319/lo.2001.46.2.0287
Barron C., Duarte C. M. (2015). Dissolved organic pools and export from the coastal ocean. Glob. Biogeochem. Cycle 29 (10), 1725–1738. doi: 10.1002/2014GB005056
Benner R. (2002). “Chemical composition and reactivity,” in Biogeochemistry of marine dissolved organic matter. Eds. Hansell D. A., Carlson C. A. (Amsterdam: Academic Press), 5990.
Blough N. V., Del Vecchio R. (2002). “Chromophoric dissolved organic matter (CDOM) in the coastal environment,” in Biogeochemistry of marine dissolved organic matter. Eds. Hansll D. A., Carlson C. A. (San Diego: Academic Press), 509546.
Bricaud A., Morel A., Prieur L. (1981). Absorption of dissolved organic matter of the sea (yellow substance) in the UV and visible domains. Limnol. Oceanogr. 26 (1), 43–53.
Calleja M. L. I., Al-Otaibi N., Morán X. A. G. (2019). Dissolved organic carbon contribution to oxygen respiration in the central red Sea. Sci. Rep. 9, 4690. doi: 10.1038/s41598-019-40753-w
Carr N., Davis C. E., Blackbird S., Danniels L. R., Preece C., Woodward M., et al. (2019) Seasonal and spatial variability in the optical characteristics of DOM in a temperate shelf sea. Prog. Oceanogr. 177, 101929. doi: 10.1016/j.pocean.2018.02.025
Chen C. T. A. (2003). Rare northward flow in the Taiwan strait in winter: A note. Cont. Shelf. Res. 23, 387391. doi: 10.1016/S0278-4343(02)00209-1
Chen C. T. A. (2008). Distributions of nutrients in the East China Sea and the south China Sea connection. J. Oceanogr. 66, 737–751. doi: 10.1007/s10872-008-0062-9
Chen C.-T. A., Bai Y., Huang T.-H., He X., Chen H.-W., Yu S. (2021). Southward spresding of the changjiang diluted water in the la niña spring of 2008. Sci. Rep. 11:307. doi: 10.1038/s41598-020-79634-y
Chen C. T. A., Jan S., Huang T.-H., Tseng Y.-H. (2010). Spring of no kuroshio intrusion in the southern Taiwan strait. J. Geophys. Res. 115, C08011. doi: 10.1029/2009JC005804
Chen C. T. A., Sheu D. D. (2006). Does the Taiwan warm current originate in the Taiwan strait in wintertime? J. Geophys. Res. 111, C04005. doi: 10.1029/2005JC003281
Coble P. G. (1996). Characterization of marine and terrestrial DOM in seawater using excitation-emission matrix spectroscope. Mar. Chem. 51, 325346. doi: 10.1016/0304-4203(95)00062-3
Coble P. G. (2007). Marine optical biogeochemistry: the chemistry of ocean color. Chem. Rev. 107, 402418. doi: 10.1021/cr050350+
Du C., Shang S., Dong Q., Hu C., Wu J. (2010). Characteristics of chromophoric dissolved organic matter in the nearshore waters of the western Taiwan strait. Estu. Coast. Shelf. Sci. 88, 350356. doi: 10.1016/j.ecss.2010.04.014
Dutkiewicz S., Hickman A. E., Jahn O., Henson S., Beaulieu C., Monier E. (2019). Ocean colour signature of climate change. Nat. Commun. 10, 578. doi: 10.1038/s41467-019-08457-x
Grasshoff K., Ehrhardt M., Kremling K. (1983). Methods of seawater analysis (Weinheim: Verlag Chemie), 419 p.
Green S. A., Blough N. V. (1994). Optical absorption and fluorescence properties of chromophoric dissolved organic matter in natural waters. Limnol. Oceanogr. 39, 19031916. doi: 10.4319/lo.1994.39.8.1903
Guo L., Santschi P. H., Warnken K. W. (1995). Dynamics of dissolved organic carbon (DOC) in oceanic environments. Limnol. Oceanogr. 40, 1392–1403. doi: 10.4319/lo.1995.40.8.1392
Guo W., Yang L., Hong H., Stedmon C. A., Wang F., Xu J., et al. (2011). Assessing the dynamics of chromophoric dissolved organic matter in a subtropical estuary using parallel factor analysis. Mar. Chem. 124, 125–133. doi: 10.1016/j.marchem.2011.01.003
Hansell D. A. (2002). “DOC in the global ocean carbon cycle,” in Biogeochemistry of marine dissolved organic matter. Eds. Hansell C. A., Carlson C. A. (Amsterdam: Academic Press), 685716.
Hansell D. A., Carlson C. A. (2015). “DOM sources, sinks, reactivity, and budgets,” in Biogeochemistry of marine dissolved organic matter. Eds. Hansell D. A., Carlson C. A. (Amsterdam: Academic Press), 65126.
Hansell D. A., Carlson C. A., Schlitzer R. (2012). Net removal of major marine dissolved organic carbon fractions in the subsurface ocean. Glob. Biogeochem. Cycle. 26, GB1016. doi: 10.1029/2011GB004069
Hong H., Chai F., Zhang G., Huang B., Jiang Y., Hu J. (2011). An overview of physical and biogeochemical processes and ecosystem dynamics in the Taiwan strait. Cont. Shelf. Res. 31, S3S12. doi: 10.1016/j.csr.2011.02.002
Hong H., Yang L., Guo W., Wang F., Yu X. (2012). Characterization of dissolved organic matter under contrasting hydrologic regimes in a subtropical watershed using PARAFAC model. Biogeochem. 109, 163–174. doi: 10.1007/s10533-011-9617-8
Huang T.-H., Chen C.-T. A., Bai Y., He X. (2020). Elevated primary productivity triggered by mixing in the quasi-cul-de-sac Taiwan strait during the NE monsoon. Sci. Rep. 10:7846. doi: 10.1038/s41598-020-64580-6
Hu J. Y., Kawamura H., Li C. Y., Hong H. S., Jiang Y. W. (2010). Review on current and seawater volume transport through the Taiwan strait. J. Oceanogr. 66, 591610. doi: 10.1007/s10872-010-0049-1
Hung J.-J., Chen C.-H., Gong G.-C., Sheu D. D., Shiah F.-K. (2003). Distributions, stoichiometric patterns and cross-shelf exports of dissolved organic matter in the East China Sea. Deep-Sea Res. II. 50, 11271145. doi: 10.1016/S0967-0645(03)00014-6
Hung J.-J., Hung C. S., Su H.-M. (2008). Biogeochemical responses to the removal of maricultural structures from an eutrophic lagoon (Tapong bay) in Taiwan. Mar. Environ. Res. 65, 1–17. doi: 10.1016/j.marenvres.2007.07.003
Hung J.-J., Lin P.-L., Liu K.-K. (2000). Dissolved and particulate organic carbon in the southern East China Sea. Cont. Shelf. Res. 20, 545569. doi: 10.1016/S0278-4343(99)00085-0
Hung J.-J., Wang S.-M., Chen Y.-L. (2007). Biogeochemical controls on distributions and fluxes of dissolved and particulate organic carbon in the northern south China Sea. Deep-Sea Res. II. 54, 1486–1503. doi: 10.1016/j.dsr2.2007.05.006
Jaffė R. D., McKnight D., Maie N., Cory R., McDowell W. H., Campbell J. L. (2008). Spatial and temporal variations in DOM composition in ecosystems: The importance of long-term monitoring of optical properties. J. Geophys. Res. 113, G04032. doi: 10.1029/2008JG000683
Jan S., Sheu D. D., Kuo H.-M. (2006). Water mass and throughflow variability in the Taiwan strait. J. Geophys. Res. 111, C12012. doi: 10.1029/2006JC003656
Jan S., Tseng Y.-H., Dietrich D. E. (2010). Sources of water in the Taiwan strait. J. Oceanogr. 66, 211221. doi: 10.1007/s10872-010-0019-7
Jan S., Wang J., Chern C.-S., Chao S.-Y. (2002). Seasonal variations of the circulation in the Taiwan strait. J. Mar. System. 35, 249268. doi: 10.1016/S0924-7963(02)00130-6
Matsuoka A., Bricaud A., Benner R., Para J., Sempéré R., Prieur L., et al. (2012). Tracing the transport of colored dissolved organic matter in water masses of the southern Beaufort Sea: relationship with hydrographic characteristics. Biogeosci 9, 925940. doi: 10.5194/bg-9-925-2012
McKnight D. M., Boyer E. W., Westerhoff P. K., Doran P. T., Kulbe T., Andersen D. T. (2001). Spectrofluorometric characterization of dissolved organic matter for indication of precusor organic material and aromaticity. Limnol. Oceanogr. 46, 3848. doi: 10.4319/lo.2001.46.1.0038
Miller W. L., Zepp R. G. (1995). Photochemical production of dissolved inorganic carbon from terrestrial organic matter: Significance to the oceanic organic carbon cycle. Geophys. Res. Lett. 22, 417420. doi: 10.1029/94GL03344
Murphy K. R., Stedmon C. A., Waite T. D., Ruiz G. M. (2008). Distinguishing between terrestrial and autochthonous organic matter sources in marine environments using fluorescence spectroscopy. Mar. Chem. 108, 40–58. doi: 10.1016/j.marchem.2007.10.003
Nelson N. B., Siegel D. A., Carlson C. A., Swan C., Smethie W. M., Khatiwala S. (2007). Hydrography of chromophoric dissolved organic matter in the north Atlantic. Deep-Sea Res. 54, 710–731. doi: 10.1016/j.dsr.2007.02.006
Norman L., Thomas D. N., Stedmon C. A., Cranskog M. A., Papadimitrious S., Krapp R. H., et al. (2011). The characteristics of dissolved organic matter (DOM) and chromophoric dissolved organic matter (CDOM) in anarctic sea ice. Deep-Sea Res. II. 58, 1075–1091.
Obernosterer I., Benner R. (2004). Composition between biological and photochemical processes in the mineralization of dissolved organic carbon. Limnol. Oceanogr. 49 (1), 117–124.
Pai S.-C., Gong G.-C., Liu K.-K. (1993). Determination of dissolved oxygen in seawater by direct spectrophotometry of total iodine. Mar. Chem. 41, 343351. doi: 10.1016/0304-4203(93)90266-Q
Pai S. C., Riley J. P. (1994). Determination of nitrate in presence of nitrite in natural water by flow injection analysis with a non-quantitative on-line cadmium reactor. Inter. J. Environ. Anal. Chem. 57, 263277. doi: 10.1080/03067319408027460
Pai S. C., Tsau Y. J., Yang T. (2001). pH and buffering capacity problems involved in the determination of ammonia in saline water using the indophenol blue spectrophotometric method. Anal. Chim. Acta 434, 209216. doi: 10.1016/S0003-2670(01)00851-0
Raimbault P., Garcia N., Cerutti F. (2008). Distribution of inorganic and organic nutrients in the south pacific ocean - evidence for long-term accumulation of organic matter in nitrogen-depleted waters. Biogeosci. 5, 281–298. doi: 10.5194/bg-5-281-2008
Ridal J. J., Moore R. M. (1990). A re-examination of the measurement of dissolved organic phosphorus in seawater. Mar. Chem. 29, 1931. doi: 10.1016/0304-4203(90)90003-U
Riedel T., Zark M., Vähätalo A. V., Niggemann J., Spencer R. G. M., Hemes P. J., et al. (2016). Molecular signatures of biogeochemical transformations in dissolved organic matter from ten world rivers. Front. Earth Sci. 4. doi: 10.3389/feart.2016.00085
Romera-Castillo C., Nieto-Cid M., Castro C. G., Marrase C., Largier J., Barton E. D., et al. (2011). Fluorecence: Absorption ratio- tracing photochemical and microbial degradation processes affecting colored dissolved organic matter in a coastal system. Mar. Chem. 125, 2638. doi: 10.1016/j.marchem.2011.02.001
Siegel D. A., Maritorena S., Nelson N. B., Hansell D. A., Lorenzi-Kayser M. (2002). Global distribution and dynamics of colored dissolved and detrital organic materials. J. Geophys. Res. 107(C12), 3228. doi: 10.1029/2001JC000965
Stedmon C. A., Markager S., Bro R. (2003). Tracing dissolved organic matter in aquatic environments using a new approach to fluorescence spectroscopy. Mar. Chem. 82, 239254. doi: 10.1016/S0304-4203(03)00072-0
Stedmon C. A., Nelson N. B. (2015). “The optical properties and signatures of DOM in the ocean,” in Biogeochemistry of marine dissolved organic matter. Eds. Hansell D. A., Carlson C. A. (London: Academic Press), 481508.
Stepanauskas R., Moran M. A., Bergamasch B. A., Hollibaugh J. T. (2005). Sources, bioavailabitity, and photoreactivity of dissolved organic carbon in the Sacramento-San Joaquin river delta. Biogeochem. 74, 131–149. doi: 10.1007/s10533-004-3361-2
Swan C. M., Siegel D. A., Nelson N. B., Carlson C. A., Nasir E. (2009). Biogeochemical and hydrographic controls on chromophoric dissolved organic matter distribution in the pacific ocean. Deep-Sea Res. I. 56, 2175–2192. doi: 10.1016/j.dsr.2009.09.002
Wang Y. H., Jan S., Wang D. P. (2003). Transports and tidal current estimates in the Taiwan strait from shipboard ADCP observation–2001). Estu. Coast. Shelf. Sci. 57, 193–199. doi: 10.1016/S0272-7714(02)00344-X
Welschmeyer N. A. (1994). Fluormetric analysis of chlorophyll a on the presence of chlorophyll b and pheopigments. Limnol. Oceanogr. 39, 19851992. doi: 10.4319/lo.1994.39.8.1985
Wu C. R., Hsin Y. C. (2005). Volume transport through the Taiwan strait: A numerical study. Terrest. Atmos. Ocean. Sci. 16 (2), 377–391. doi: 10.3319/TAO.2005.16.2.377(Oc)
Wu C.-R., Wang Y.-L., Lin Y.-F., Chao S.-Y. (2017). Intrusion of the kuroshio into south and East China seas. Sci. Rep. 7:7895. doi: 10.1038/s41598-017-08206-4
Wyrtki K. (1961). “Physical oceanography of the southeast Asian waters,” in Scientific results of marine investigations of the south China Sea and the gulf of Thailand, vol. vol 2. (California: Scripps Institution of Oceanography), 195p.
Yang L., Cheng Q., Zhuang W.-E., Wang H., Chen W. (2019). Seasonal changes in the chemical composition and reactivity of dissolved organic matter at the land-ocean interface of a subtropical river. Environ. Sci. pollut. Res. 26, 2459524608. doi: 10.1007/s11356-019-05700-2
Yang L., Chen C.-T. A., Lui H.-K., Zhuang W.-E., Wang B.-J. (2016). Effects of microbial transformation on dissolved organic matter in the east Taiwan strait and implications for carbon and nutrient cycling. Est. Coast. Shelf. Sci. 180, 5968. doi: 10.1016/j.ecss.2016.06.021
Yang L., Hong H., Chen C.-T. A., Guo W., Huang T.-H. (2013). Chromophoric dissolved organic matter in the estuaries of populated and mountainous Taiwan. Mar. Chem. 157, 1223. doi: 10.1016/j.marchem.2013.07.002
Yi Y., Zheng A., Guo W., Yang L., Chen D. (2014). Optical properties of estuarine dissolved organic matter using cross-flow ultrafiltration. Acta Oceanol. Sin. 33, 2229. doi: 10.1007/s13131-014-0451-4
Yu X., Shen F., Liu Y. (2016). Light absorption properties of CDOM in the changjiang (Yangtze) estuarine and coastal waters: An alternative approach for DOC estimation. Estu. Coast. Shelf. Sci. 181, 302311. doi: 10.1016/j.ecss.2016.09.004
Zhang Z. L., Hong H. S., Zhou J. L., Yu G. (2004). Phase association of polycyclic aromatic hydrocarbons in the minjiang river estuary, China. Sci. Total. Environ. 323, 71–86. doi: 10.1016/j.scitotenv.2003.09.026
Keywords: DOM, CDOM, nutrients, spatial distribution, optical tracer, factor analysis, Taiwan Strait
Citation: Hung J-J, Lu W-T, Yang H-M, Lin Y-H and Guo L (2022) Biophysical controls on spatial and summer/winter distributions of total and chromophoric dissolved organic matter in the Taiwan Strait. Front. Mar. Sci. 9:988340. doi: 10.3389/fmars.2022.988340
Received: 07 July 2022; Accepted: 27 October 2022;
Published: 23 November 2022.
Edited by:
Jeng-Wei Tsai, China Medical University, TaiwanCopyright © 2022 Hung, Lu, Yang, Lin and Guo. This is an open-access article distributed under the terms of the Creative Commons Attribution License (CC BY). The use, distribution or reproduction in other forums is permitted, provided the original author(s) and the copyright owner(s) are credited and that the original publication in this journal is cited, in accordance with accepted academic practice. No use, distribution or reproduction is permitted which does not comply with these terms.
*Correspondence: Jia-Jang Hung, aHVuZ2pqQG1haWwubnN5c3UuZWR1LnR3
†These authors have contributed equally to this work
Disclaimer: All claims expressed in this article are solely those of the authors and do not necessarily represent those of their affiliated organizations, or those of the publisher, the editors and the reviewers. Any product that may be evaluated in this article or claim that may be made by its manufacturer is not guaranteed or endorsed by the publisher.
Research integrity at Frontiers
Learn more about the work of our research integrity team to safeguard the quality of each article we publish.