 Xiaoyu Jian
 Shuwen Zhang
 Qibin Lao
 Fajin Chen
 Peng Huang
 Chunqing Chen
 Qingmei Zhu
- 1Institute of Marine Science, Shantou University, Shantou, China
- 2Guangdong Provincial Key Laboratory of Marine Disaster Prediction and Protection, Shantou University, Shantou, China
- 3College of Ocean and Meteorology, Guangdong Ocean University, Zhanjiang, China
The mixing of different water masses is important for local physical and biogeochemical processes as well as for ecosystems in the ocean. In this study, a new dataset of stable water isotopes (δD and δ18O) combined with temperature–salinity profiles was used to quantitatively understand the mixing of water masses in the Pearl River Estuary (PRE) and the adjacent northern South China Sea (SCS). Based on hydrographic characteristics and the isotope–salinity relationships in the water column, three water masses, namely, low isotopic values (<1.5‰ for δD and <0‰ for δ18O) with a salinity of <33.20 for PRE water (PREW), high isotopic values (>2.0‰ for δD and >0.6‰ for δ18O) with a salinity of >34.60 for SCS Kuroshio Branch (SCSKB), and higher isotopic values (>3.0‰ for δD and <0.4‰ for δ18O) with a salinity of >33.30 for SCS water (SCSW), were identified in the PRE and the adjacent SCS. The mixing of the three water masses in the PRE and the adjacent SCS was mainly from SCSW (71%), followed by the SCSKB (23%), and the proportion of PREW only accounted for 6%. However, different water layers and regions are affected differently by these three water masses. The surface water is mainly influenced by the PREW, whereas the subsurface water is mainly influenced by the intrusion of SCSKB (100–300 m). The mixing process of water masses in the west side of the study area (<115°E) is mainly contributed by the SCSW (86%), whereas the contributions of PREW and SCSKB are only 4% and 10%, respectively. By contrast, the mixing of water masses in the east side (>115°E) is mainly influenced by the Kuroshio intrusion (50%). This study reveals that dual water isotopes are exquisitely sensitive to determine the complex hydrological process in the PRE and the adjacent SCS, and water masses on marine environment should deserve more attention.
Introduction
The mixing of water masses plays an important role in the storage and redistribution of freshwater, heat, and biogenic elements, and may have a large impact on the local marine ecology (Legrande and Schmidt, 2006; Oka and Qiu, 2012; Lian et al., 2016; Lao et al., 2022a; Zhuang et al., 2022). For example, transport of different water masses with the substances will lead to a change in biogeochemical processes after mixing, thus affecting the carbon and nitrogen cycle, and climate change (Deshpande et al., 2013; Durack, 2015; Wang et al., 2017; Xu et al., 2018; Yu et al., 2022). Thus, the study of water mass processes contributes to a better understanding of the impact of marine biogeochemical processes and marine primary productivity (Xu et al., 2018; Lao et al., 2022a).
Traditionally, temperature–salinity (T–S) relationships have been used to distinguish the characteristics of marine water masses for a long time (Helland-Hansen and Nansen, 1926; Harvey, 1982), and are still widely used recently (Xie et al., 2011; Liu et al., 2017; Karati et al., 2019). However, such traditional method has some limitations to trace the mixing of water masses because the salinity and temperature are not the characteristic of water itself (Bigg and Rohling, 2000; Lao et al., 2022a). It is difficult to identify the mixing of water masses with the same salinity in the oceans, particularly in the coastal areas (Lao et al., 2022a and Lao et al., 2022b). In coastal waters, water masses are mixed from different freshwater masses, and these water masses may have similar or even the same temperature and salinity, thus making it difficult to distinguish their contribution (Bigg & Rohling, 2000; Lao et al., 2022a and Lao et al., 2022b). By contrast, δ18O and δD are properties of the water itself, and they are less influenced by biogeochemical processes (Lian et al., 2016; Jin et al., 2018; Chen et al., 2020b; Lao et al., 2022a). They have a sensitive signal, which could be modified by physical processes, such as precipitation, runoff input, evaporation, advection, or upwelling (Craig and Gordon, 1965; Rohling, 2007; Lian et al., 2016). The response of δ18O and salinity to physical processes is similar, which is lower in freshwater and higher in seawater (Benetti et al., 2017). In addition, the δ18O and δD both decrease with increased freshwater flushing/precipitation and increase with evaporation/seawater intrusion (Frew et al., 2000; Deshpande et al., 2013; Richardson et al., 2018). Thus, the composition of different water masses would have different δD–δ18O and δ18O–salinity relationships, which can indicate the degree of complexation of different water masses with each other (Sengupta et al., 2013; Benetti et al., 2017; Kumar et al., 2018; Chen et al., 2020b). Moreover, since isotopes are less influenced by biogeochemical processes, the contribution of water masses can be quantified using stable isotope mixing models (Chen et al., 2020b; Wu et al., 2021; Lao et al., 2022a). For example, the water mass processes are quantitatively identified between the western Pacific Ocean and the South China Sea (SCS) (>3,700 m) by using the dual water isotopes combined with temperature–salinity profiles (Wu et al., 2021). In the coastal oceans, the mixing of different water sources and the intrusion of the high salinity to the coastal waters (Lian et al., 2016; Chen et al., 2020b), and their impacts on the groundwater (Tran et al., 2019; Zhang et al., 2022) and coastal ecological environment, such as the distribution of nutrient and primary productivity (Lao et al., 2022a) and the mariculture activities (Lao et al., 2022b), were also identified by the dual water isotopes. Thus, the isotope tool has been successfully used to track the movement and mixing of water masses (Legrande and Schmidt, 2006; Deshpande et al., 2013; Sengupta et al., 2013; Lian et al., 2016; Benetti et al., 2017; Chen et al., 2020b).
The Pearl River Estuary (PRE) is located at the southern end of the Chinese mainland, and it is the largest river in south China (Fang and Wang, 2022). The mixing of water masses in the PRE and the adjacent northern SCS is quite complex, which is not only influenced by the river diluted water and SCS water (Chen et al., 2022), but also influenced by the saline Kuroshio intrusion (Wu et al., 2021). Based on the dual water isotopes combined with the salinity, the proportion of Kuroshio intrusion into the northern SCS through the Luzon Strait was quantified, which accounts for 15%. The mixing of three water masses, the Pearl River freshwater, the SCS water, and the Kuroshio water, has a great impact on the regional ecosystem (Chen et al., 2019). For example, the Kuroshio intrusion into the SCS formed a strong front due to interactions with northern SCS water, which has supplied external high Chl a and nutrients in the subsurface SCS water and increasing phytoplankton productivity in the frontal area (Deshpande et al., 2013; Wang et al., 2017; Xu et al., 2018). In addition, there are varying degrees of seawater backflow to the PRE each year (Liu et al., 2017; Liu et al., 2019). In the northern SCS, the intrusion of the Kuroshio subsurface water to the continental slope was identified by using seawater δ18O (Chen et al., 2020b). Based on the δ18O–salinity relationship, the SCS Warm Current in the northeastern SCS mainly originated from the upslope deflection of the slope current formed by the Kuroshio subsurface water intrusion into the SCS, rather than from the west segment of the SCS Warm Current formed to the Hainan Island (Chen et al., 2020b). In the PRE, by using dual water isotopes, the study suggested that the saline groundwater mainly originated from the seawater intrusion in the past, whereas the fresh groundwater was mainly from the modern meteoric precipitation recharge (Wu et al., 2020). However, in the PRE and the adjacent SCS with complex hydrodynamic forces, there is still no quantitative understanding of the mixing of different water masses, which will provide a better understanding of the impact of the biogeochemical processes and the impact of the water mass composition on the primary productivity of the ocean (Xu et al., 2018).
In this study, we present a new dataset of dual water isotopes (δ18O and δD), temperature, and salinity in the water column of the PRE during fall (September) in 2015. We attempted to identify and quantify the mixing of different water masses in the PRE and the adjacent northern SCS. This study will provide a deeper understanding of the physical processes in the PRE and the adjacent northern SCS, providing a new insight into the impact of water mass mixing on biogeochemical processes of the marginal sea.
Materials and methods
Study area and sampling
During fall (September) 2015, a cruise was carried out in the PRE and adjacent northern SCS. A total of 24 stations on three sections were sampled in the study area (Figure 1). Seawater samples (a total of 108) were collected in the water column for given depths (i.e., 0.5, 5, 25, 50, 75, 100, 150, 200, 300, 500, and 800 m) using a rosette sampler fitted with 10-L Niskin bottles. The pretreatment of seawater samples refers to that of Lao et al. (2022a). The seawater samples for dual water isotopes were filtered through acetate membranes (0.45 µm pore size) to avoid the influence of bio-processes on water isotopes after sampling. The filtrate was transferred to a precleaned high-density polyethylene bottle, and the bottle was wrapped by a parafilm (PM-996, USA) to reduce biological effects and avoid isotopic fractionation by volatilization of the water, and then stored at −20°C for analysis. Seawater temperature, salinity, and depth were measured using a CTD (SBE911, Seabird) on site.
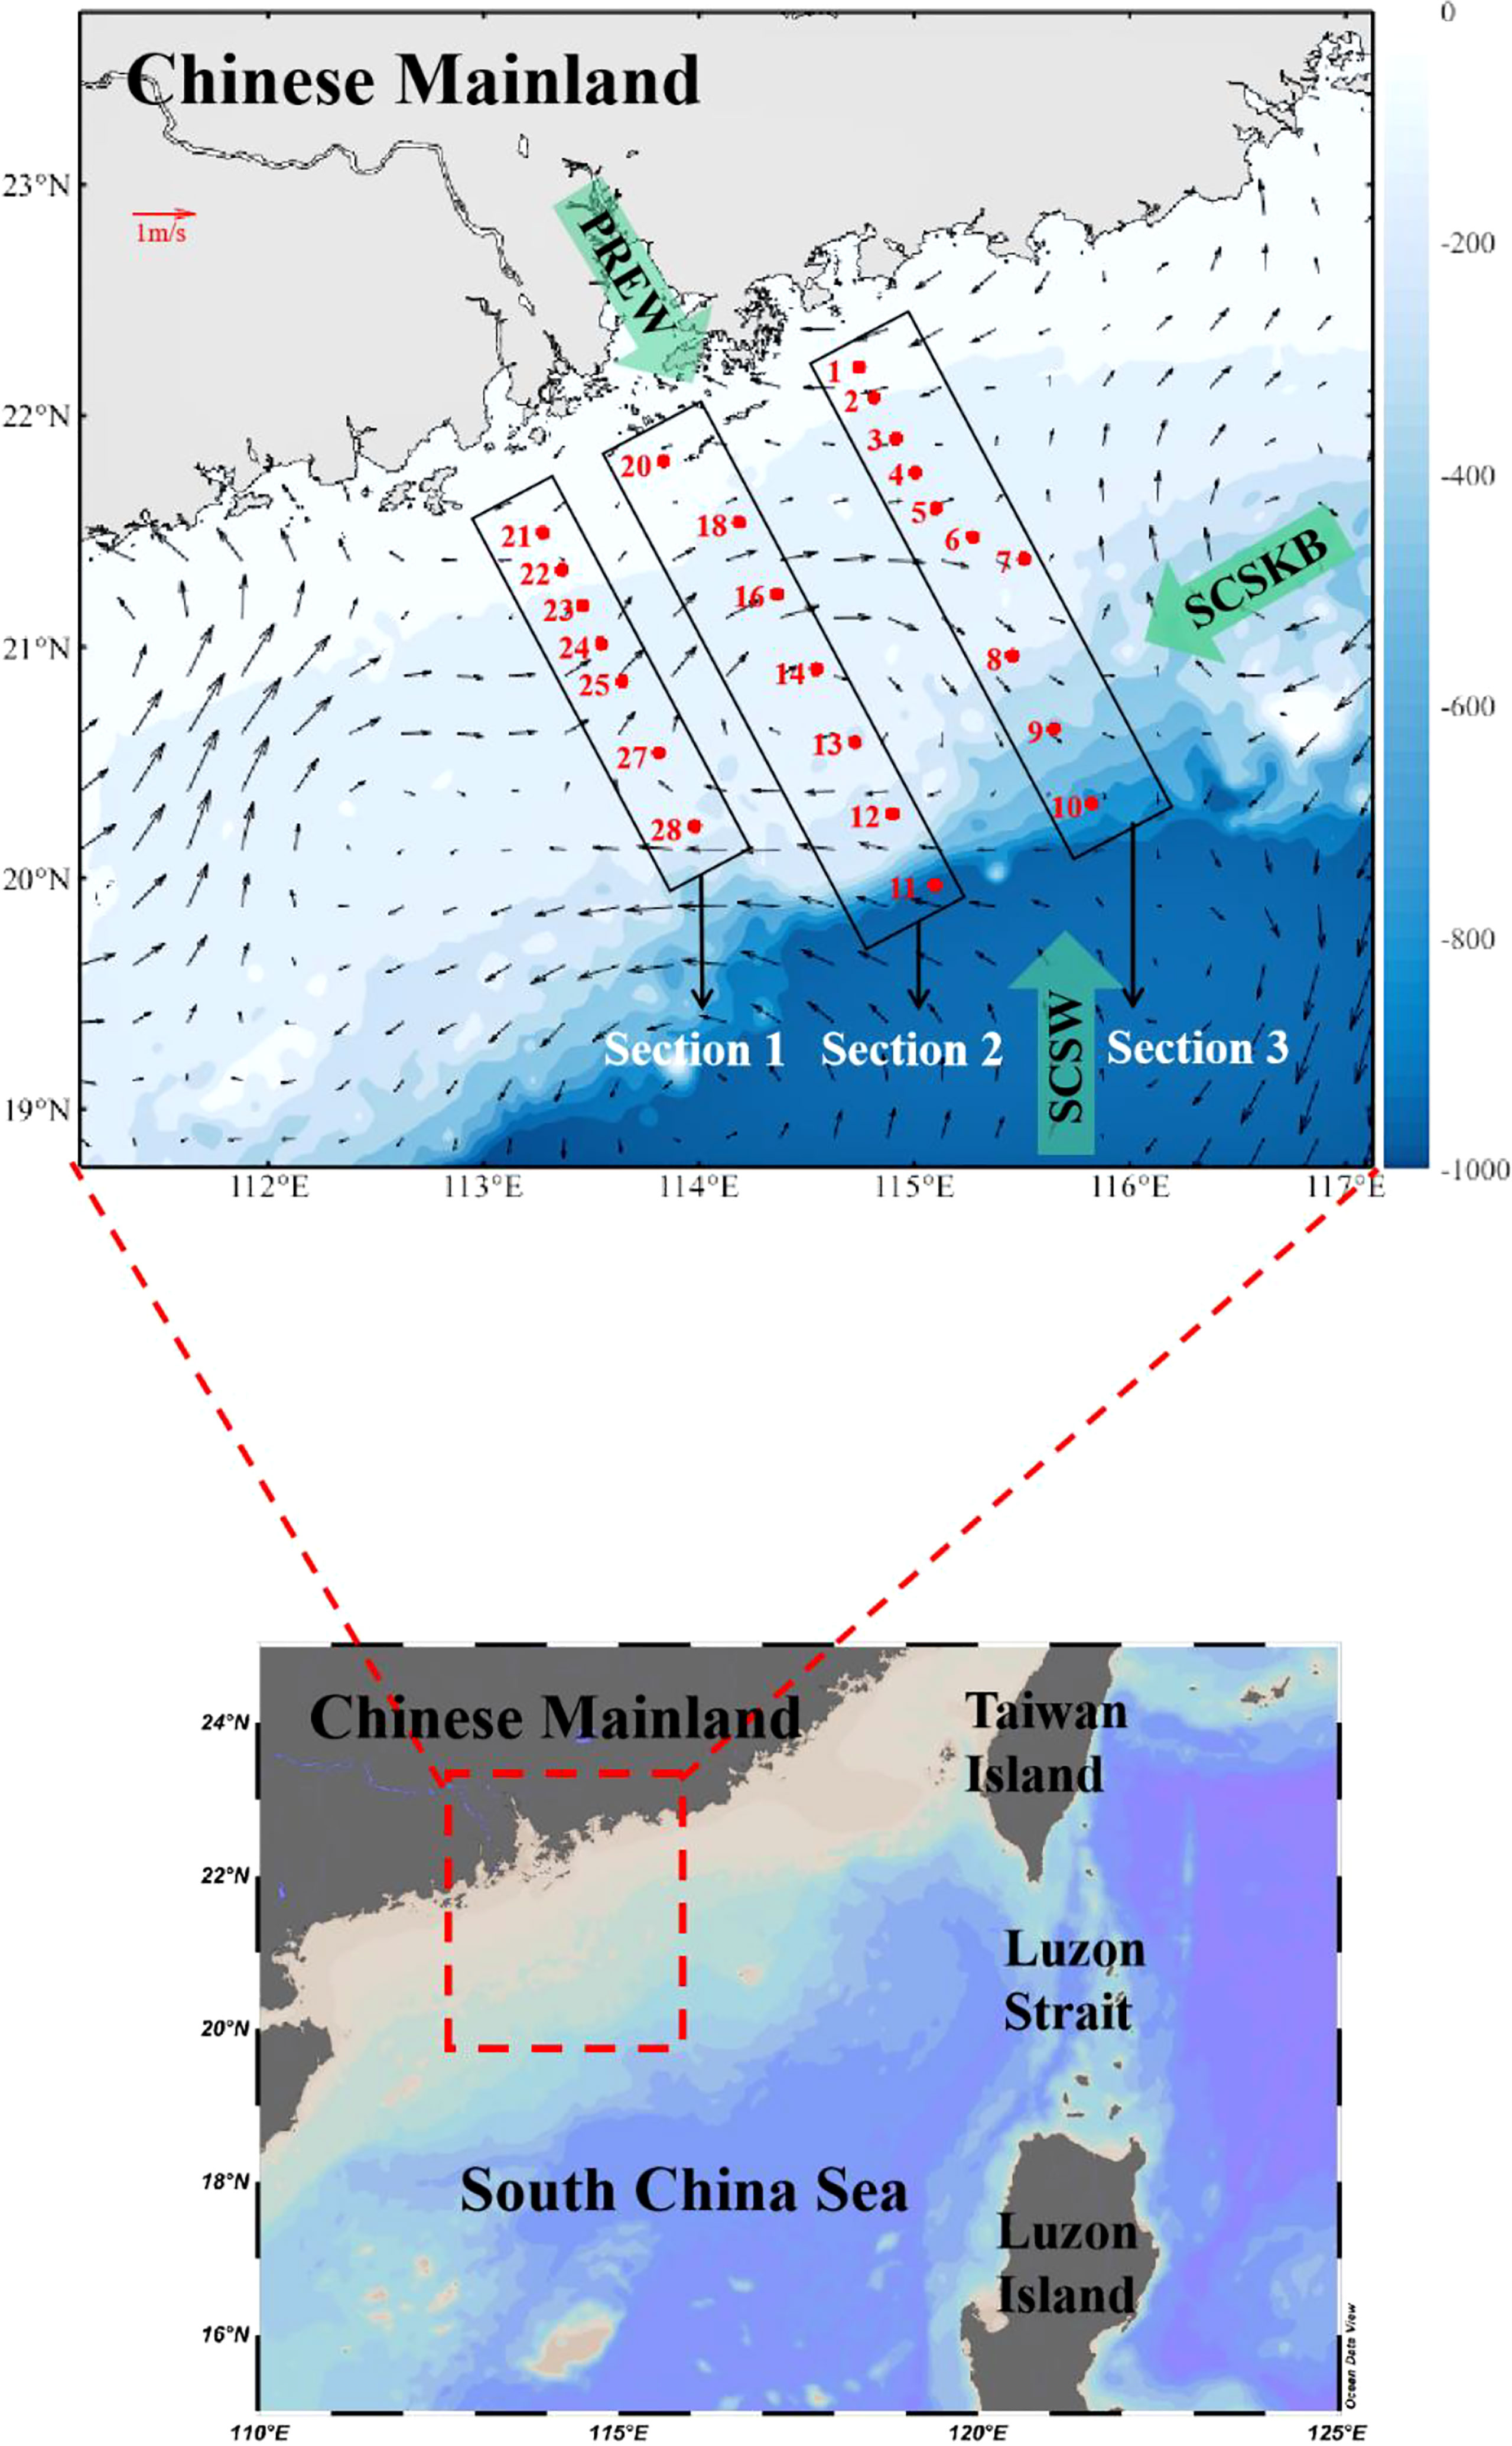
Figure 1 Sampling stations in the Pearl River Estuary during September 2015.The surface current vectors were also plotted. PREW, Pearl River flushing water; SCSW, South China Sea water; SCSKB, South China Sea Kuroshio Branch.
Stable isotope measurement
The most abundant isotope pairs in seawater are the ratios of the stable isotopes of hydrogen, i.e., 2H and 1H, and the stable isotopes of oxygen, i.e., 18O and 16O. The ratios are reported in unit of per mill (i.e., ‰) deviations from Vienna Standard Mean Ocean Water (V-SMOW), denoted δD and δ18O:
where Rsample and RV-SMOW indicate the ratio of 18O/16O and D/H (i.e., 2H/1H, 2H also named deuterium with acronym of D) of the sample and V-SMOW, respectively.
The seawater samples for δ18O and δD were measured by using the equilibration method. The detailed process can be found in Lao et al., 2022a and Lao et al., 2022b). In brief, samples were equilibrated with H2 or CO2, and the equilibrated gas was measured by an elemental analysis isotope ratio mass spectrometer (Gasbench II-IRMS) (Gasbench II interfaced with a 253 plus mass spectrometer). For the analysis of seawater for δD, platinum (Pt) catalyst (200 μl) was added to the samples, and the H2 (2% H2/He) was introduced to ensure that D/H in water and D/H in H2 are in isotopic equilibrium. The procedure of the equilibrium of δD was at 28°C for 40 min. The analysis of the seawater sample for δ18O, CO2 (1% CO2/He) is introduced into a 500-μl sample to ensure that 18O/16O in water and 18O/16O in CO2 are in isotopic equilibrium. The procedure of the equilibrium of δ18O was at 24°C for 24 h. During the measurement, a standard sample (δ18OV-SMOW for 0‰ and δDV-SMOW, VSMOW2 for 0‰) was inserted every 12 samples to confirm the stability of the instrument. Based on the results of each standard sample, the precision and accuracy calculated for δ18O were 0.1‰ and ±0.1‰, respectively. The precision and accuracy calculated for δD were 0.6‰ and ±0.5‰, respectively.
The Bayesian mixing model
The proportion of contribution from different water masses can be quantified by using a Bayesian stable isotope mixing model. The details of the model are as follows (Moore and Semmens, 2008):
where Xij and Sjk represent the δ18O and δD of a mixed water sample and isotope signature values of water mass sources, respectively; Sjk represents normal distribution with standard deviation ωjk and mean deviation μjk; Pk represents the proportion of different water masses; cjk represents the fractionation factor for δD and δ18O of different water masses, normally distributed, with mean λjk and standard deviation τjk; ϵjk represents the residual error of the addition of an unquantified change between samples, normally distributed, with mean 0 and standard deviation σj. Since the δ18O and δD in seawater are less affected by biogeochemical processes (Fairbanks, 1982; Hattori, 1997; Lian et al., 2016; Wang et al., 2018), the Bayesian mixing model was successfully applied to quantify the mixing contribution of water masses (Lao et al., 2022a and Wu et al., 2021; Lao et al., 2022b). The advantage of the Bayesian mixing model compared to other methods, such as the model MixSIR, is the residual error term in the form of standard deviation included in the model (Jackson et al., 2009).
Results
Hydrography properties
The vertical distributions of temperature and salinity along the three sections are shown in Figure 2. A thermal stratification can be clearly seen in the PRE and the adjacent northern SCS. Temperature decreased gradually with depth in the water column, with the highest temperature of 30.33°C in the surface and the lowest temperature of 5.32°C in the bottom.
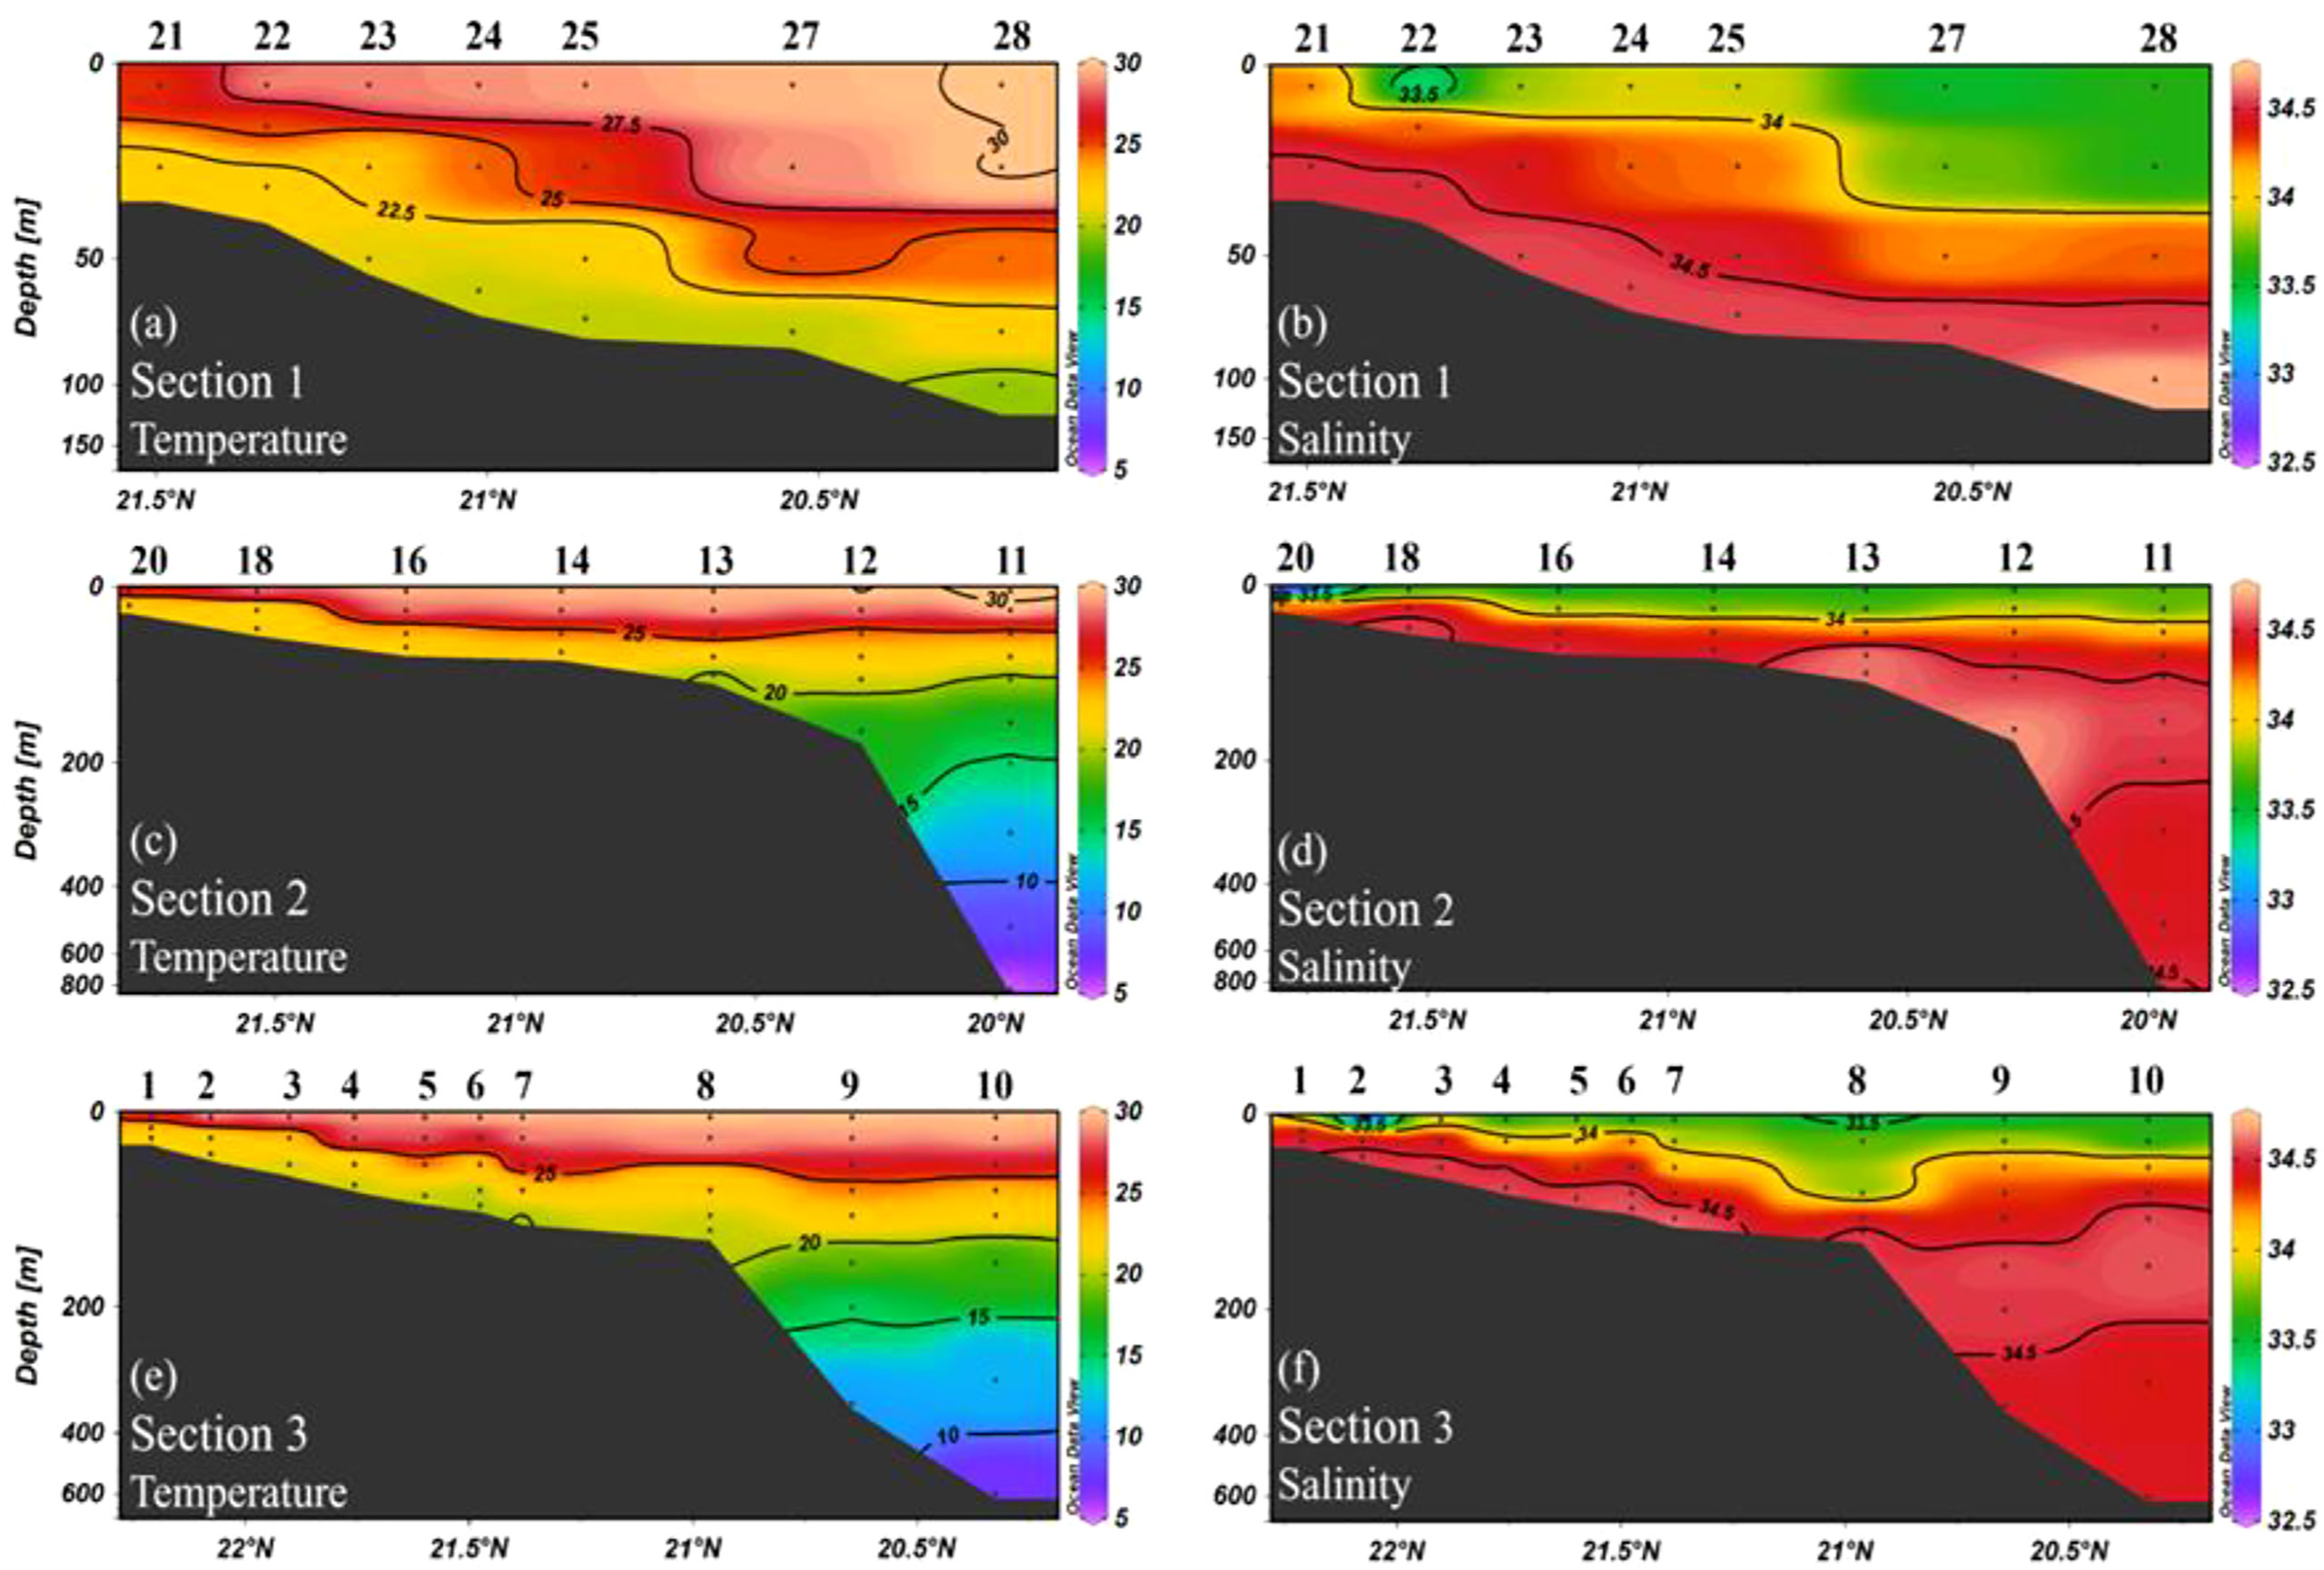
Figure 2 Vertical distribution of temperature and salinity in three sections as defined in Figure 1. Note that the depth scale is not linear where the upper 400 m was stretched.
The salinity is characterized by low salinity in the surface layer (minimum salinity value of 32.35) and high salinity in the bottom layer. Notably, the maximum salinity is presented in the subsurface layer (maximum salinity value of 34.71), with an average of 34.16. The lowest salinity (<33.5) was found in the nearshore area of Sections 2 and 3 (Figure 2). The high temperature (>25°C) and low salinity (<34) in the surface water extend from the nearshore area to the outer sea, suggesting that this may be influenced by the coastal diluted water. However, in the subsurface water of the offshore area, the higher salinity and temperature may be influenced by the Kuroshio intrusion in the northern SCS (Chen et al., 2020b; Wu et al., 2021).
Stable isotope distributions
δ18O and δD ranged from −0.2‰ to 0.9‰ and from −6.7‰ to 18.5‰, with an average value of 0.3‰ and 5.5‰, respectively. The distribution of δ18O and δD exhibited a wide range spanning the surface and middle layers (both maximum and minimum values occur in the middle layer or in both the middle and surface layers) (Figures 3, 4); lower values were found in the nearshore areas whereas higher values were found in the offshore areas (Figure 3). Similar to the distribution of salinity, δ18O and δD showed lower values in the surface water and higher values in the mid and bottom water. In addition, lower values were found in the nearshore area, whereas higher values were found in the offshore area. Notably, significantly high δ18O values were found in the offshore area of Section 3, which may be influenced by the Kuroshio water intrusion since the Kuroshio water was characterized by significantly positive δ18O in the eastern Luzon Strait (Wu et al., 2021).
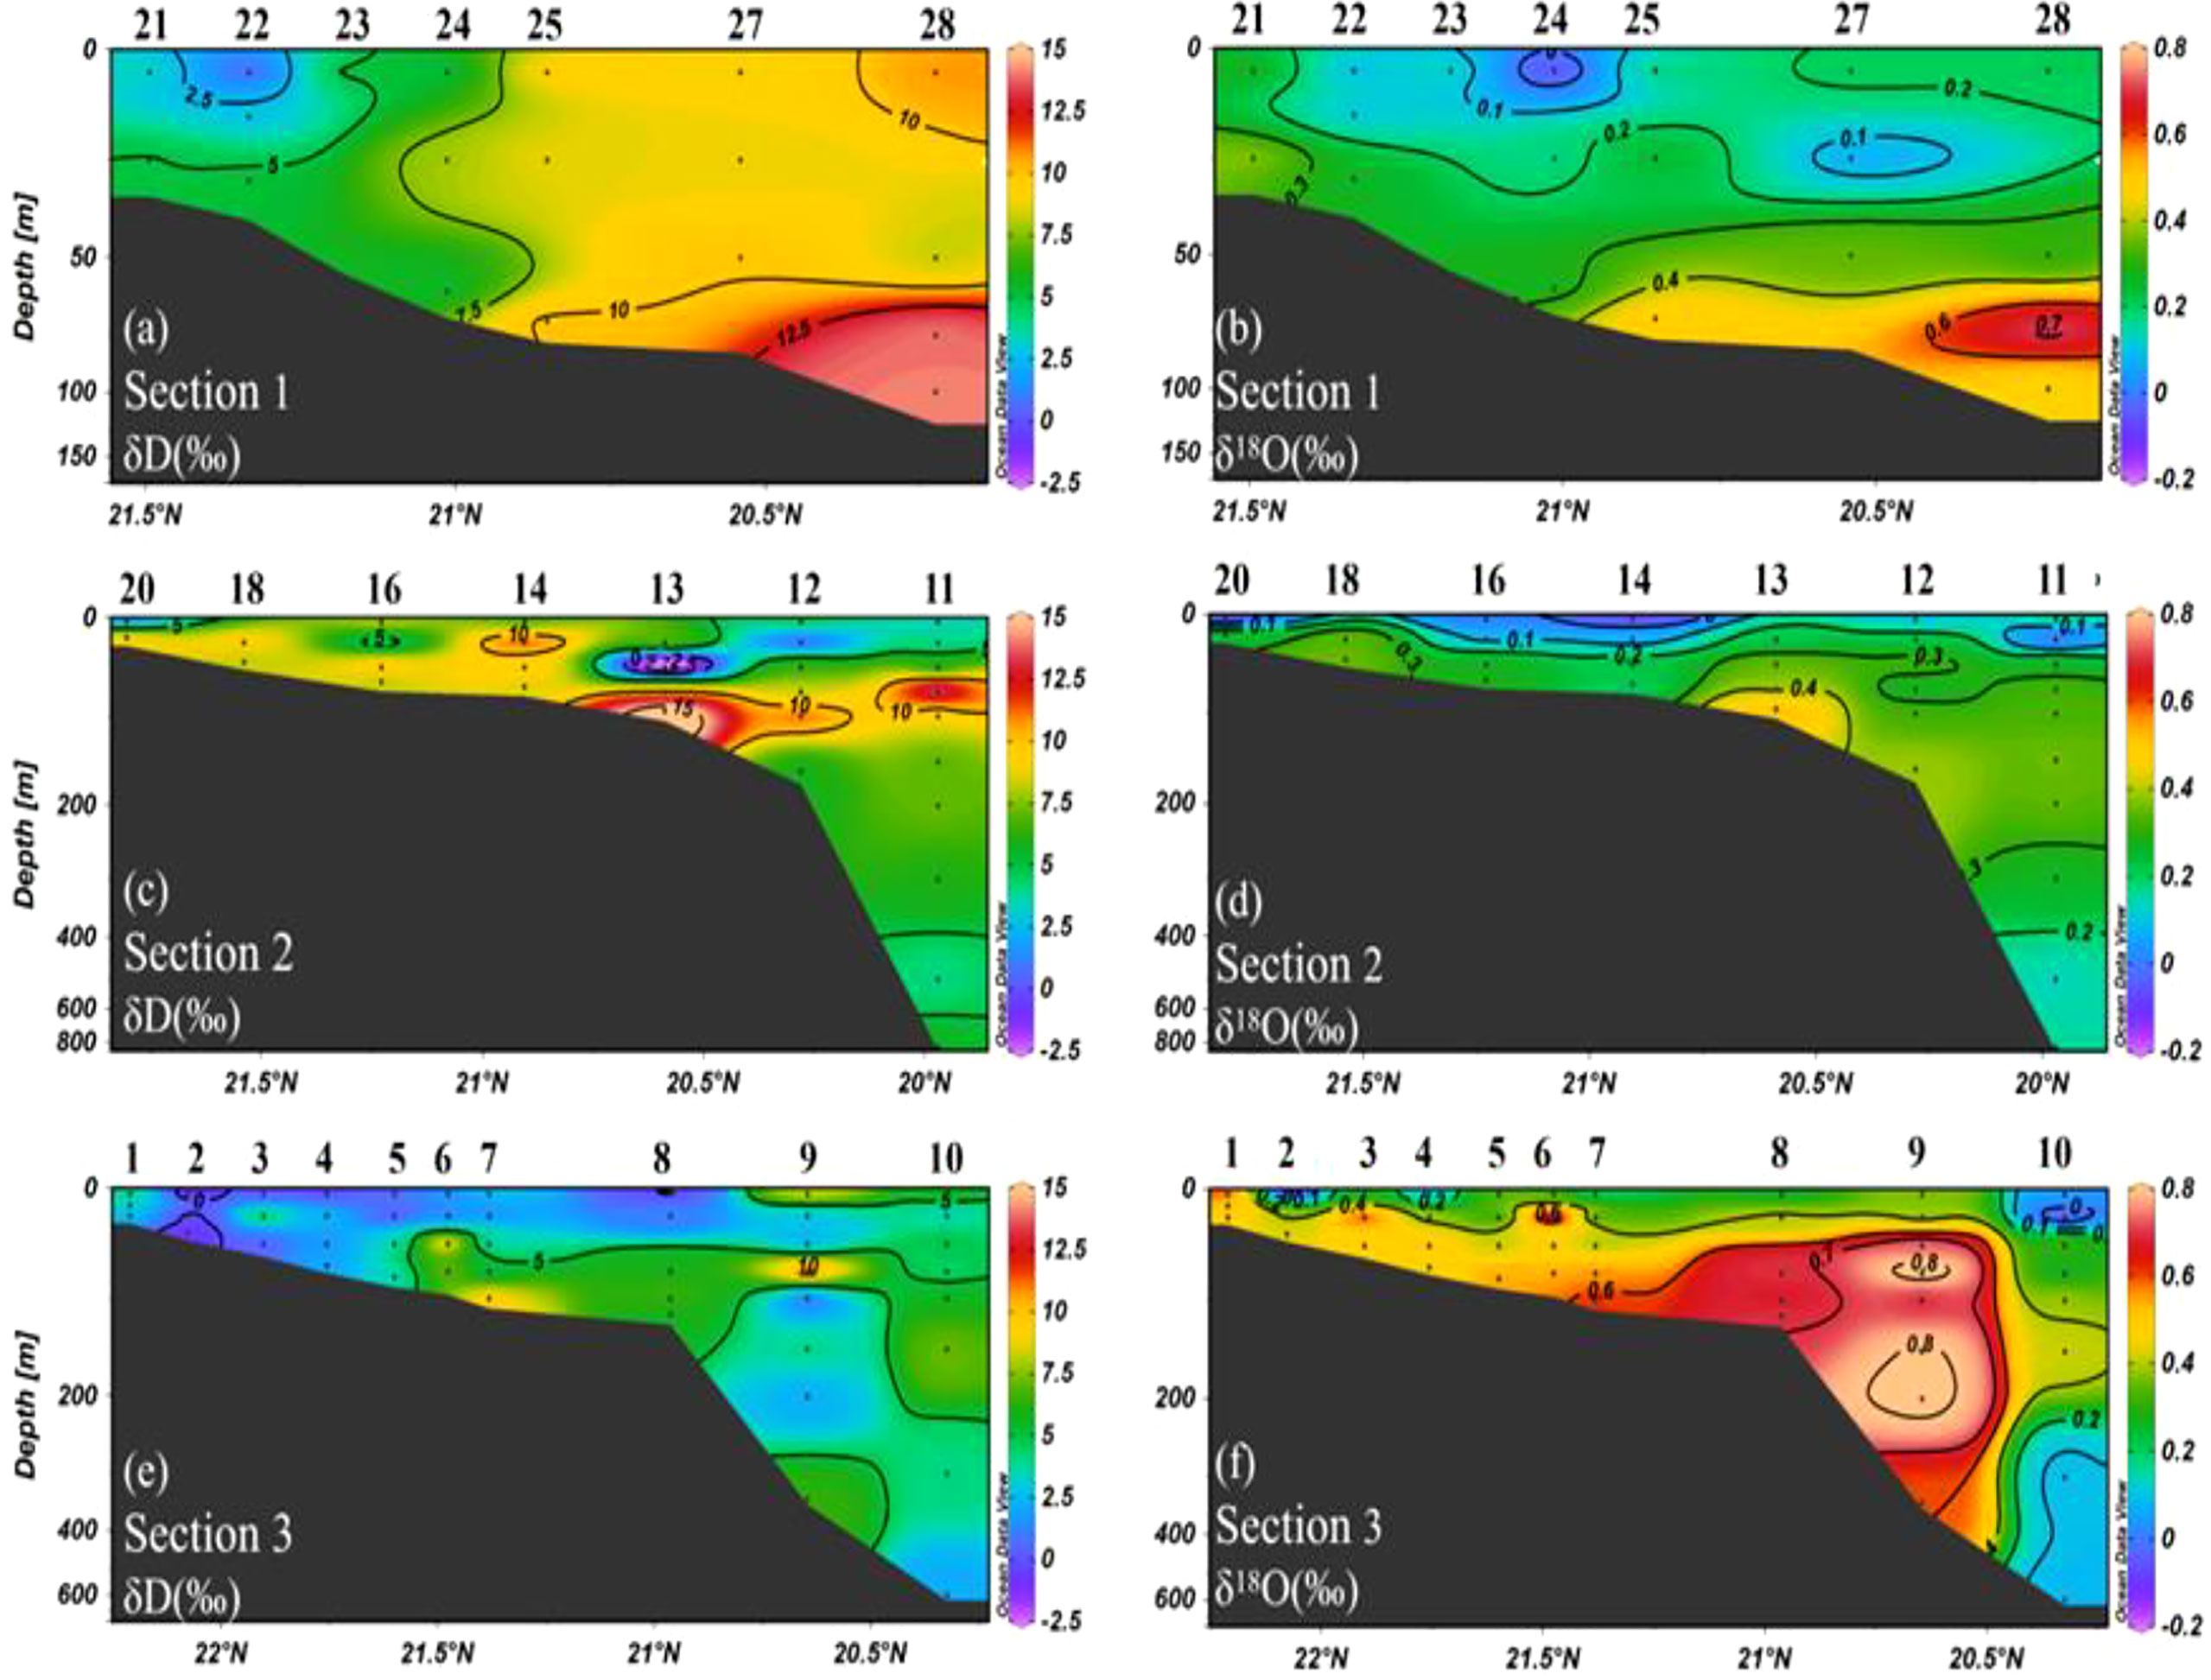
Figure 3 Vertical distribution of δ18O and δD in three sections as defined in Figure 1. Note that the depth scale is not linear where the upper 400 m was stretched.
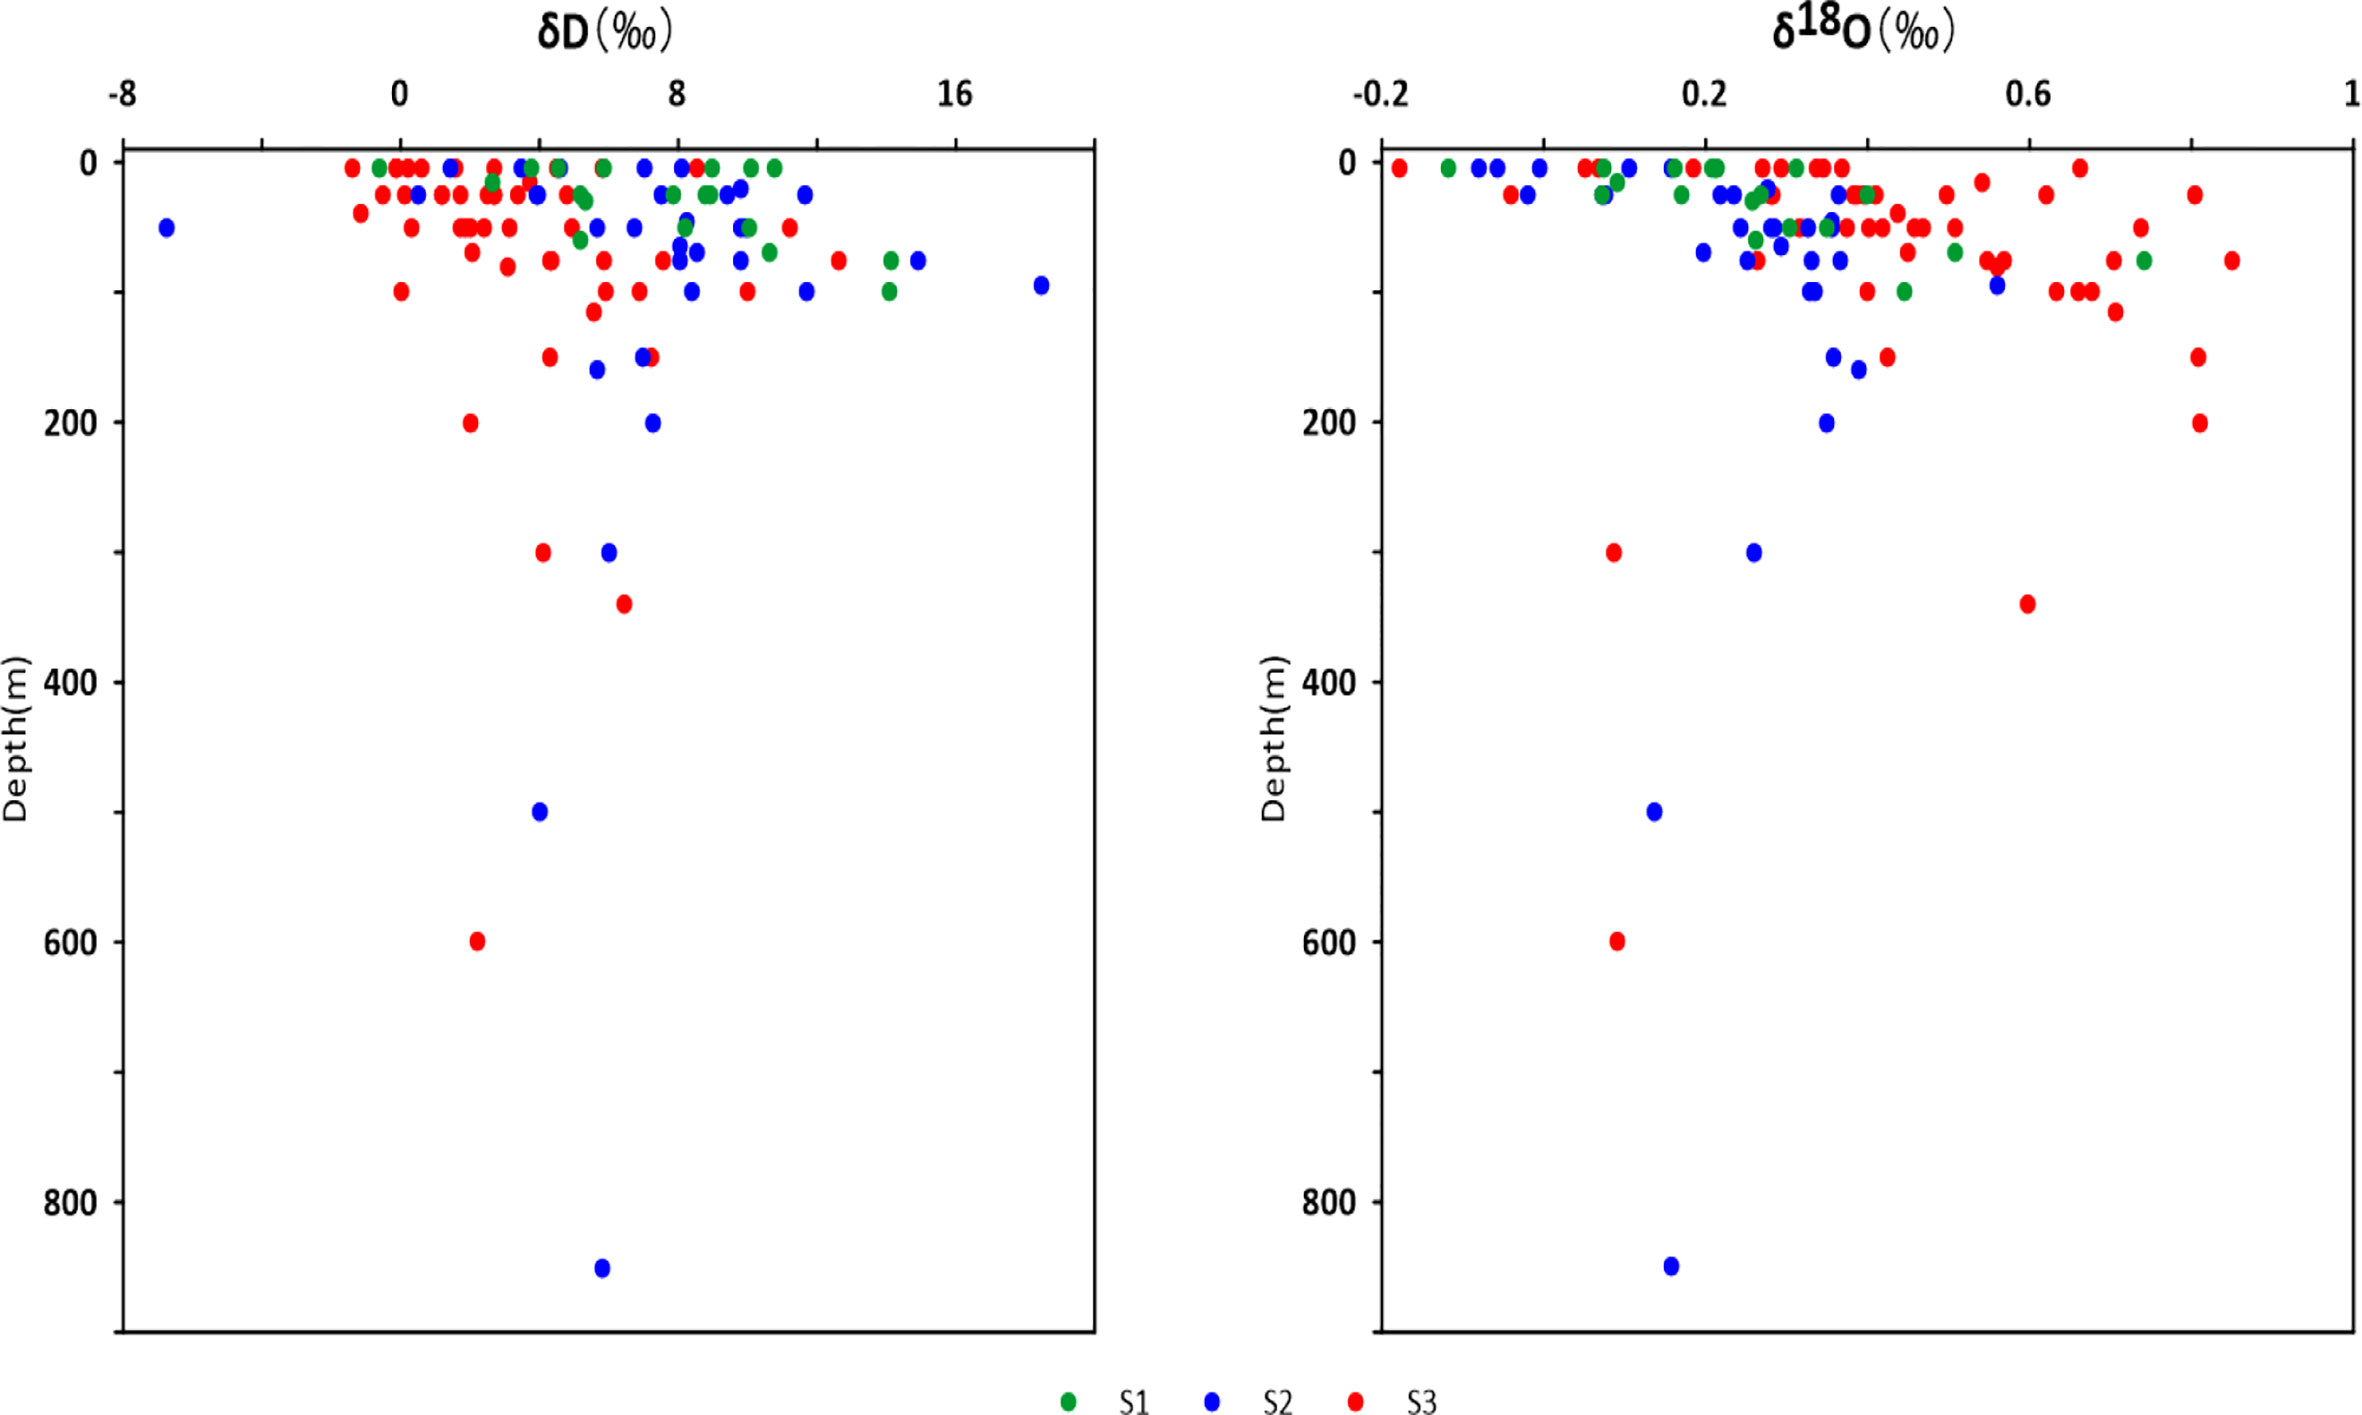
Figure 4 Vertical profiles of δ18O and δD in the three sections of the PRE and the adjacent SCS.
Identification of water masses in the PRE and the adjacent northern SCS
Based on the salinity, temperature, and stable oxygen and hydrogen isotope of the PRE, three water masses can be identified that affect the PRE and adjacent northern SCS waters (Figure 5). The PRE flushing water is derived from continental runoff with high temperature (>26.5°C) but low salinity (<33.2) and isotope values (<1.5‰ for δD and <0‰ for δ18O), forming PREW end-member. The bottom water of the SCS is mainly derived from the northern part of the SCS, with low-temperature (<10°C) but high-salinity water (>33.30), forming South China Sea bottom water (SCSBW) end-member. A further water mass, with high salinity (>34.6) and isotope values (>2.0‰ for δD and >0.6‰ for δ18O), is located in the subsurface layer. The salinity and isotopic characteristics of this water mass follow those of the Kuroshio waters (Chen et al., 2020a; Wu et al., 2021), forming SCSBW end-member.
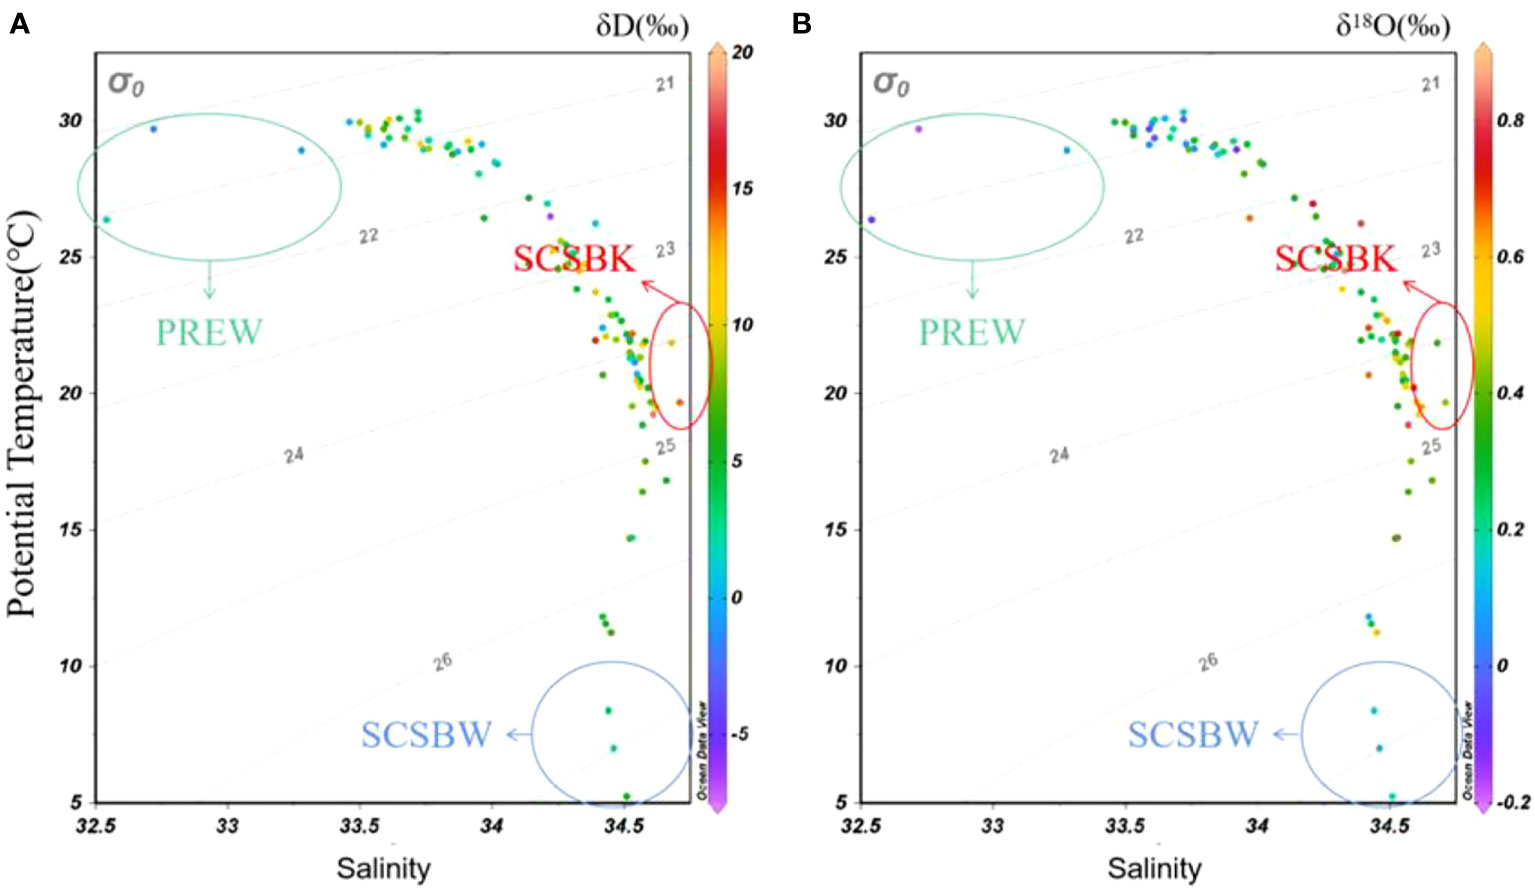
Figure 5 Plots of potential temperature (°C) versus salinity for water column of the Pearl River Estuary. Colors indicate (A) δD and (B) δ18O values. Three water masses, PREW, SCSKB, and SCSDW, were also marked with ellipses. PREW, Pearl River flushing water; SCSKB, South China Sea Kuroshio Branch; SCSBW, South China Sea bottom water.
Isotope–salinity/isotope relationships
The correlation of δD–δ18O, δD–salinity, and δ18O–salinity relationships for the three sections is shown in Figure 6. Those relationships exhibited higher slopes in Sections 1 and 2, and lower slope in Section 3. These indicated that the water mass processes were similar between Sections 1 and 2, while Section 3 was significantly different from the two sections. The vertical distribution of δD and δ18O in Section 3 is also noticeably different from the other two sections, which also indicates that the water mass process in Section 3 is significantly different from the other two sections (Figure 4). Section 3 is located to the east of the PRE and probably more affected by the Kuroshio intrusion than Sections 1 and 2.
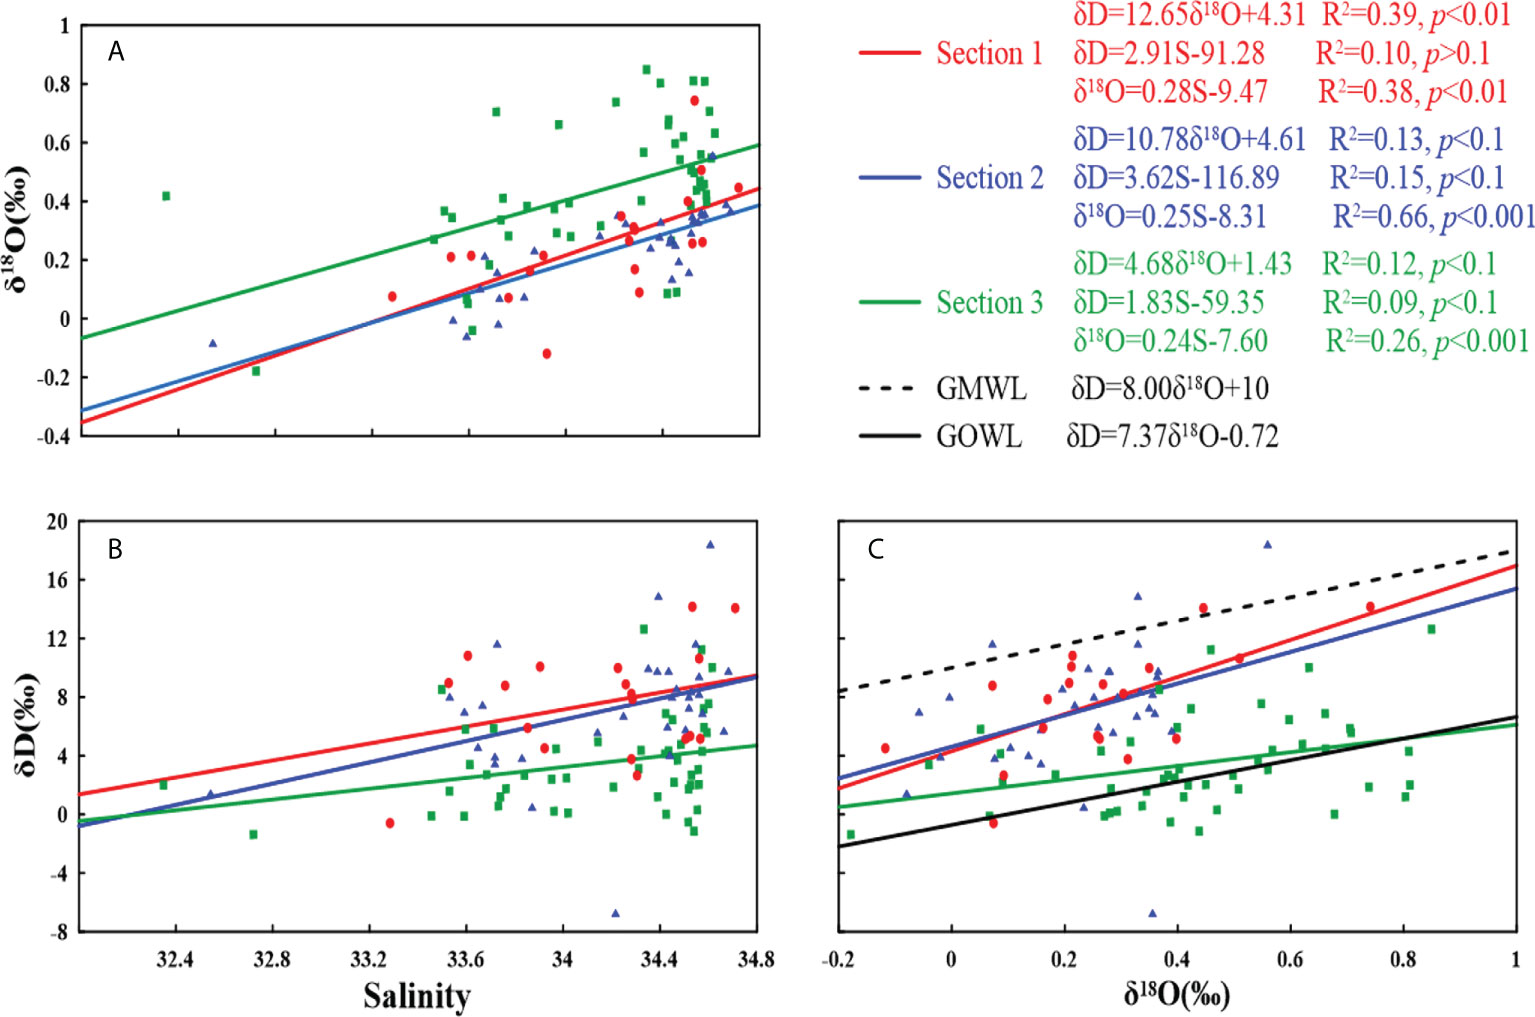
Figure 6 (A) δ18O vs. salinity, (B) δD vs. salinity, and (C) δD–δ18O relationship for selected sections as defined in Figure 1. The GMWL was from Craig (1961); the GOWL was from Rohling (2007).
Discussion
δD–δ18O and δ18O–salinity in different sections
In Section 1, the significant correlation of δ18O–salinity (δ18O = 0.28S-9.47; R2 = 0.38, p < 0.01) and δD–δ18O (δD = 12.65δ18O+4.31; R2 = 0.39, p < 0.01) was found (Figures 6A, C). A high-slope but low-intercept δ18O–salinity relationship indicated the influence of the strong overland runoff or strong rainfall (Lao et al., 2022a and Singh et al., 2010; Kumar and Ramesh, 2016; Kumar et al., 2018; Lao et al., 2022b). In addition, the slope of observed δD–δ18O is significantly higher than that of the global meteoric water line (GMWL: δD = 8.00δ18O+10) (Craig, 1961) and the global ocean water line (GOWL: δD = 7.37δ18O-0.72) (Rohling, 2007), indicating that this section is mixed with freshwater or high rainfall, or both (Figure 6C). Notably, lower temperature and higher salinity compared to the surface water at the other stations were found in the coastal water (Station 21) of Section 1, which is similar to the subsurface water column characteristics of the others (Figures 2A, D). This may be because the coastal upwelling transports to the subsurface waters (Xia et al., 2018). Nevertheless, the overall influence of coastal currents in western Guangdong is more important in freshwater (Ying et al., 2003). Thus, the surface salinity decreased in outer Station 21 (Figure 2B). The vertical distribution of salinity showed less influence of intrusion of high-salinity seawater, which may be due to the shallow sampling depth (less than 200 m). High values of salinity and δ18O were found at the base of Station 28, but due to the shallowness of the station, it is difficult to determine whether these two high values originated from SCSKB or not. Thus, the mixing of water masses in Section 1 is mainly influenced by PREW and SCSW (offshore).
Section 2 is slightly different from Section 1, and the coastal water (Station 20) is characterized by low temperatures and low salinity (Figures 2C, D), indicating a significant impact from PREW. The slope of δD–δ18O (δD = 10.78δ18O+4.61; R2 = 0.13, p < 0.1) for this section is higher than GMWL and GOWL (Figure 6C), indicating the presence of freshwater or heavy rainfall. However, the slope of the δ18O–salinity (δ18O = 0.25S-8.31; R2 = 0.66, p < 0.001) in Section 2 is slightly lower than that in Section 1, indicating that in addition to freshwater input, this section is also influenced by the saline water intrusion. This also supports the view that the PREW is more likely to flow to the west of the PRE (Ying et al., 2003; Lao et al., 2019a) and, as a result of the influence on Section 1, which is located to the west, is more significant. However, it is also possible that this is due to the greater depth of the station in Section 2 (up to 850 m), which is more affected by the high salinity of seawater. High salinity values (>34.5) and high δ18O values (>0.4‰) were observed at the bottom (100–150 m) at Stations 12 and 13 (Figures 2D, 4D); this may be due to the intrusion of SCSKB into the subsurface and intermediate layers with high salinity and high δ18O water. Offshore stations are affected by the SCSW on both the surface and bottom layers. Thus, the mixing process of water masses in Section 2 is mainly influenced by PREW, SCSW, and SCSKB (offshore).
In Section 3, the salinity of the water is relatively high compared to the other two sections from the coast to offshore (Figure 2F), with an average of 34.13. The slope of δD–δ18O (δD = 4.68δ18O+1.43; R2 = 0.12, p < 0.1) for this section is lower than GMWL and GOWL (Figure 6C), indicating intrusion of high-salinity seawater or strong evaporation, or both. In addition, compared to the other two sections, the slope of δD–δ18O is relatively lower. The low slope and high intercept of the δ18O–salinity (δ18O = 0.24S-7.6; R2 = 0.26, p < 0.001) regression line for Section 3 indicated that water mass processes in this section are mainly influenced by high-salinity seawater (Figure 6C). Section 3 is located on the eastern side of the PRE, while PREW is more likely to flow to the west (Lao et al., 2019a; Chen et al., 2021). These indicate that the effect of PREW may be less on Section 3. The offshore stations (Stations 7–10) in Section 3 showed a high salinity and δ18O at 100 m to 150 m (Figures 2F, 4F), indicating a significant influence of SCSKB in the subsurface of the section, particularly at a depth of 100–340 m in Station 9, which exhibited the highest salinity (average of 34.49) and δ18O value (average of 0.7‰). Notably, the δ18O values in Station 9 were still higher than the Kuroshio end-member in the surface and subsurface water of the eastern Luzon Strait (Wu et al., 2021). There may be two reasons for this phenomenon. Firstly, after the Kuroshio Water intruded into the northern SCS, the continuous evaporation of seawater led to isotopic fractionation during water transportation. The cruise is carried out in summer (June and July), which is during the rainy season and has a large rainfall (Wu et al., 2021). However, the cruise in this study was carried out in fall (September), during which rainfall decreased and seawater volatilization gradually increased. Secondly, the formation of typhoon will carry away a large amount of moisture on the sea surface and transport it to remote areas (Chen et al., 2021; Lao et al., 2022a). Those processes lead to the continuous evaporation of seawater during the Kuroshio water transportation in the SCS. There are two typhoons generated in SCS during September 2015, namely, Vamcon and Mujigae (Chen et al., 2021). Thus, the Kuroshio water may have been fractionated after entering the SCS, resulting in a higher δ18O value in this study than that in the previous study (Wu et al., 2021). Thus, the mixing process of water masses in Section 3 is different from Sections 1 and 2, which is mainly influenced by SCSW and SCSKB.
Deuterium excess in the PRE
The deuterium excess (d-excess = δD-8×δ18O) is a derived parameter that depends on kinetic fractionation processes of isotopes associated with evaporation (Deshpande et al., 2013). The d-excess in continental runoff is about 10‰, while in seawater, it is about 0‰ (Kumar et al., 2018). Even small inputs from continental sources or evaporation of seawater can lead to d-excess values >0‰. Only kinetic fractionation during evaporation can result in low d-excess values; 0.5‰ can be considered a critical value higher than which the mixing of water masses can be considered not significantly influenced by evaporation or precipitation (Deshpande et al., 2013). The sampling period was September; the runoff was still higher during that period, while the mean value of the d-excess in the surface waters of the Pearl River Estuary was 3.08‰. In addition, d-excess showed no correlation with δ18O in the three sections (Figure 7). This suggested a relatively lower effect of kinetic evaporation on seawater in the study area. Thus, the mixing processes of the water masses in the PRE and the adjacent northern SCS are mainly influenced by coastal water in PRE and higher-salinity seawater from SCS and SCSKB.
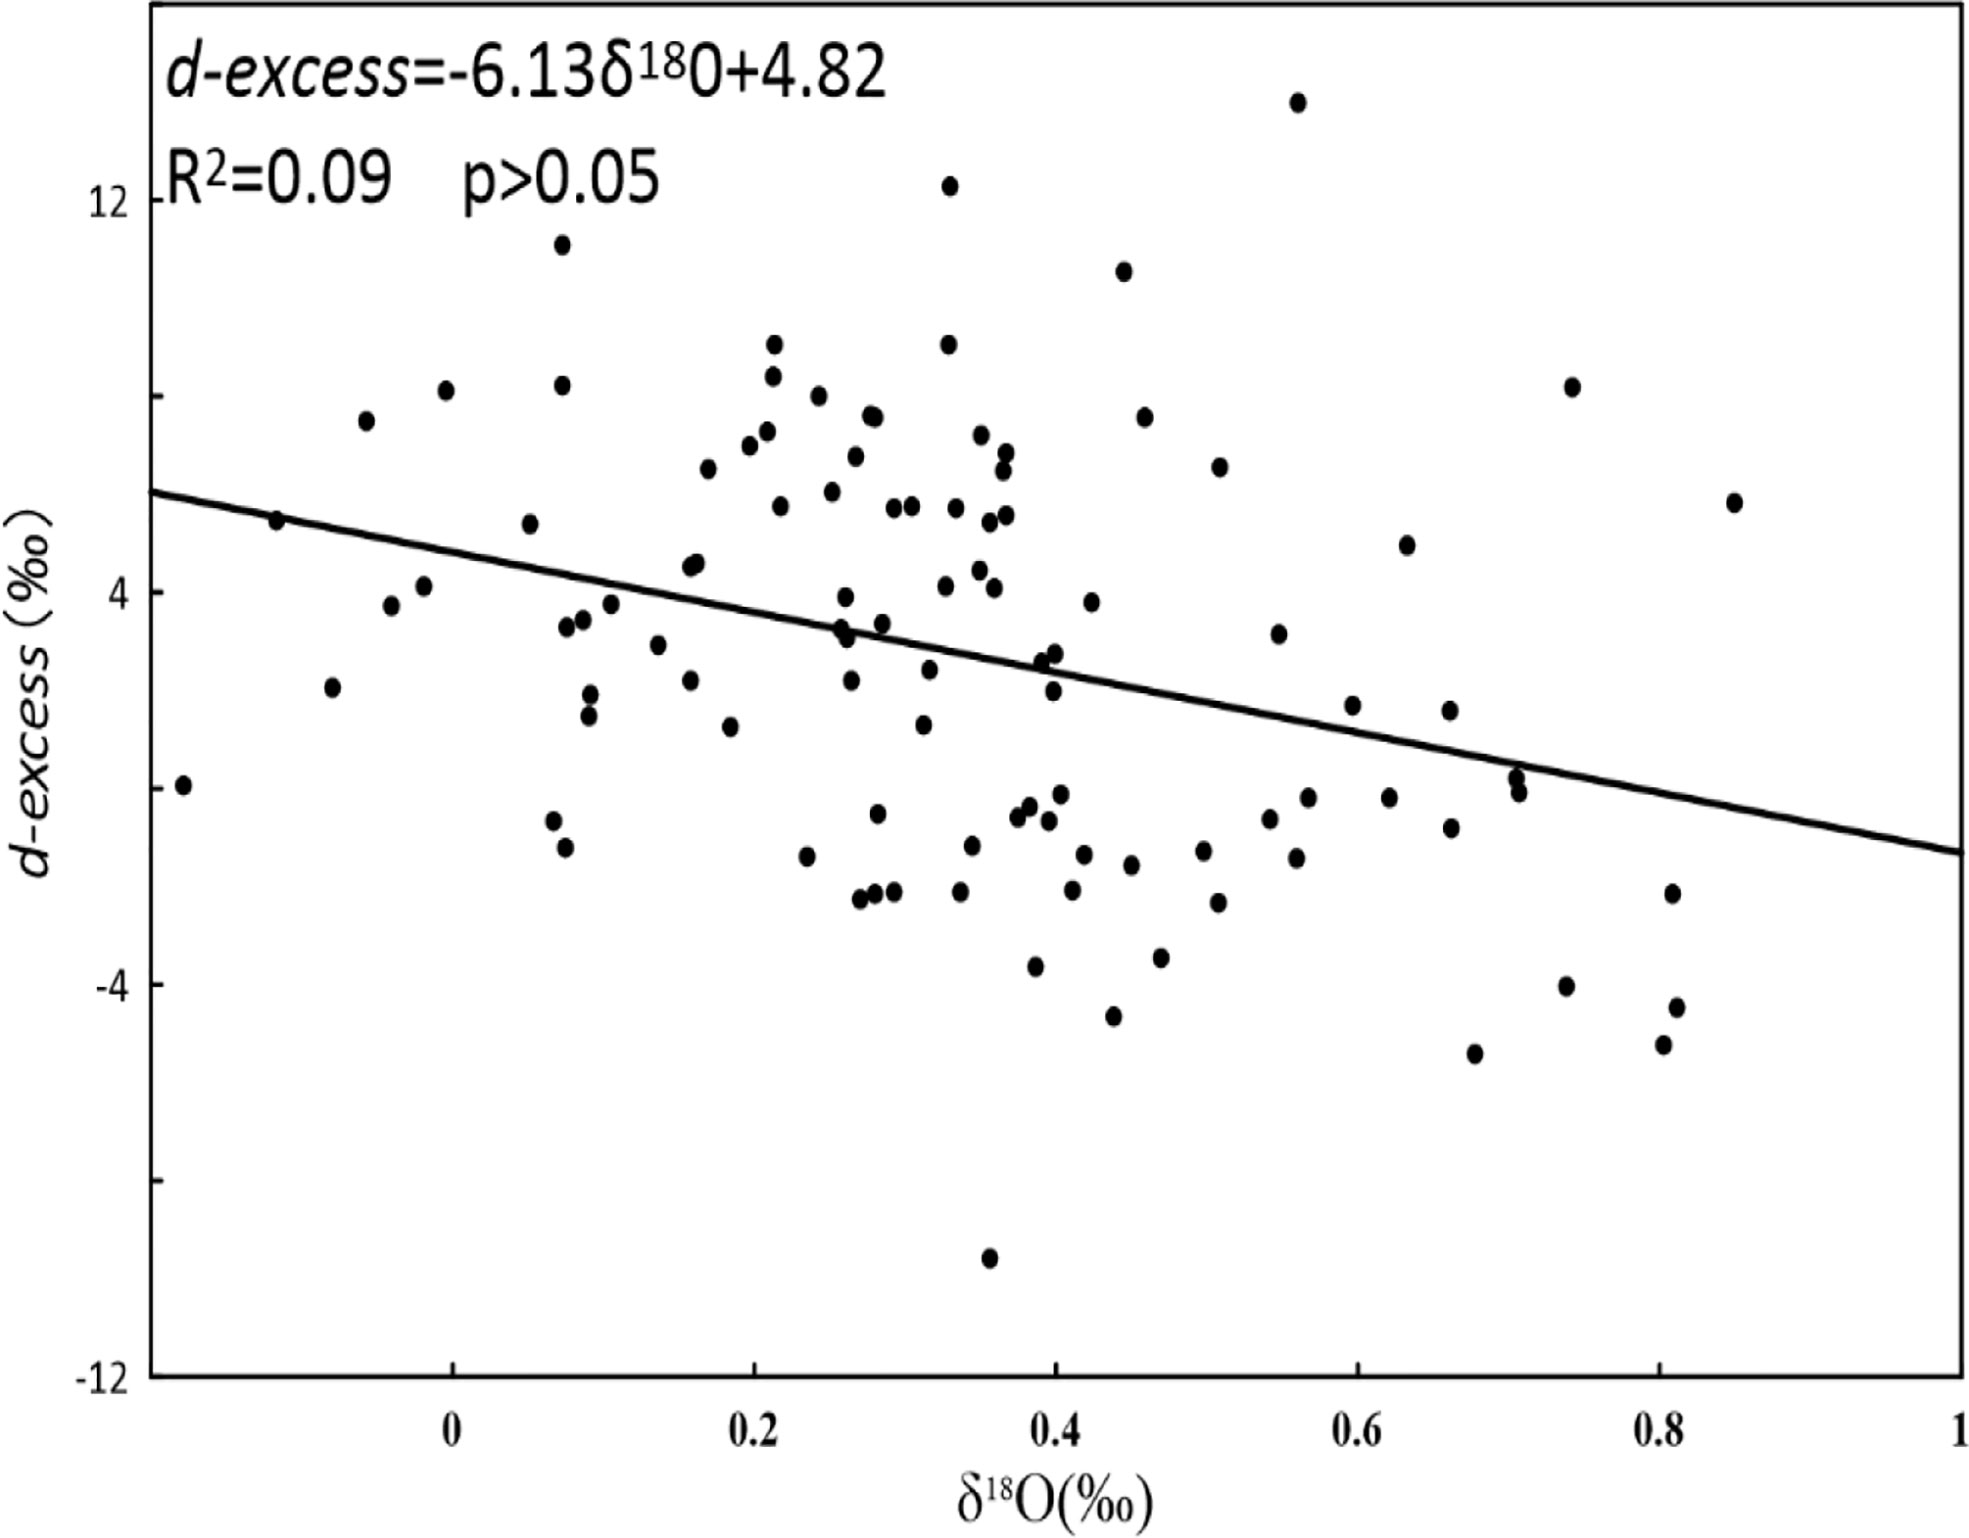
Figure 7 d-excess–δ18O relationship for seawater samples collected in different sections.
Quantification of different water masses and their contributions
As discussed above, the mixing in Section 3 is different from Sections 1 and 2. The seawater in Section 3 may be more influenced by the mixing with SCSW and SCSKB, while Sections 1 and 2 are influenced by the mixing of the three water masses. It is not appropriate to use the Bayesian stable isotope mixing model to quantify the contribution of different water masses if isotopic fractionation is present. However, the dual water isotopes are conservative and less influenced by biological processes (Lian et al., 2016; Jin et al., 2018; Chen et al., 2020a; Lao et al., 2022a and Lao et al., 2022b); thus, the δ18O–salinity and δD–δ18O relationships have been used to determine the mixing of ocean water with runoff, large-scale ocean mixing, sea ice, and glacier melting (Bigg and Rohling, 2000; Benetti et al., 2017). In addition, we found that the correlation between d-excess and δ18O was weak, indicating the lower influence of kinetic fractionation. Thus, we believe that the variation of isotopic compositions and relationships of δ18O–S and δD–δ18O is mainly influenced by the mixing processes of different water masses, and the Bayesian approach can be used to calculate the relative contribution of different water masses based on the isotopic characteristics of each end-member. To quantify the contribution of mixing between different water masses in the study area, Station 20 characterized by the lowest surface water salinity was selected as a PREW end-member; Station 11 has lower water temperatures but higher salinity at depths of 200–850 m and is very far from the coast, so the 200–850 m of this station was selected as the SCSW end-member; Station 9 with high salinity and isotopic values of water at 100–340 m was selected as the SCSKB end-member. Since d-excess and δ18O are not correlated, indicating little effect from kinetic fractionation, it is feasible to calculate the contribution of different water masses by using dual water isotopes in the Bayesian mixing model. The hydrological and isotopic characteristics of the three end-members are summarized in Table 1. The isotopic values from the three end-members were used to calculate the proportion of the mixing water masses in the PRE and the adjacent northern SCS. The results are presented in Figure 8. The results showed that the seawater mainly contributed from the SCSW (accounting for 71%), followed by the SCSKB (accounting for 23%), while the contribution of PREW only accounted for 6%. However, in Section 3, the seawater mainly contributed from SCSKB (accounting for 50%), which was significantly higher than that in Sections 1 and 2. This suggested that the Kuroshio intruded into the northern SCS has a great impact on Section 3, but has a lesser impact on the other two sections. This result is consistent with a previous study that suggested that the Kuroshio water could intrude the continental slope in the southwestern Taiwan Strait (about 117°E) (Chen et al., 2020b). Moreover, the SCS water in the southwestern Taiwan Strait mainly originated from the upslope deflection of the slope current formed by the Kuroshio water intrusion into the SCS, but not from the west segment of the SCS water formed to the east of Hainan Island (Chen et al., 2020b). However, this study found that the great impact of the Kuroshio intrusion can even reach 115.5°E (in Section 3), which brings a new understanding to the influence of the Kuroshio intrusion into the northern SCS.
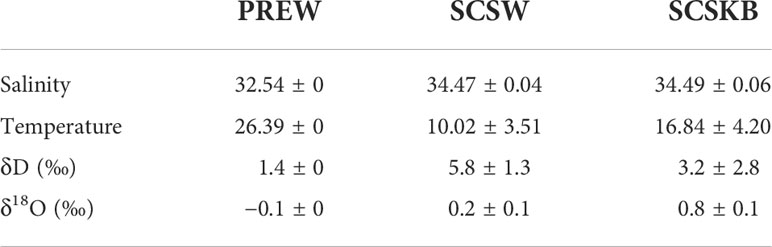
Table 1 The isotopic characteristics of the PREW, SCSW, and SCSKB in the PRE and the adjacent northern SCS.
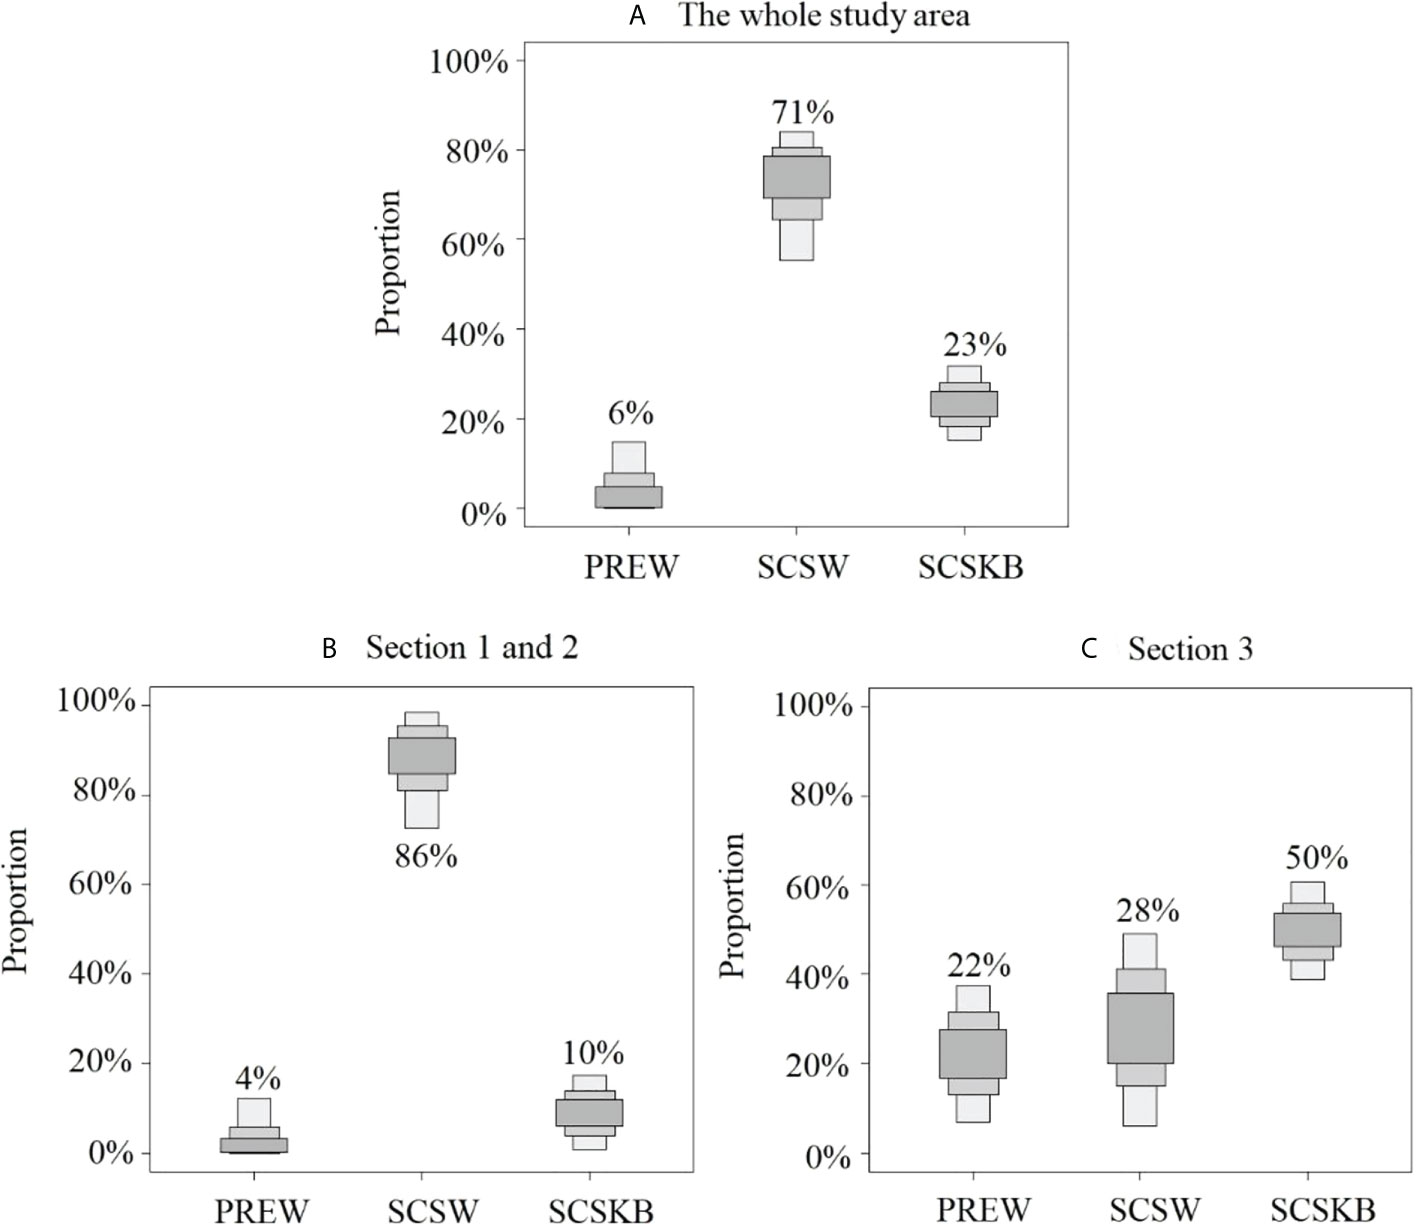
Figure 8 Proportional contribution of different water masses to the seawater of the PRE and the adjacent northern SCS. (A) The whole study area; (B) Section 1 and 2; (C) Section 3.
The implications of the water masses mixing in the local environment
In this study, we investigated the mixing of water masses in the PRE and the adjacent SCS according to the relationship between δD, δ18O, and salinity. The mixing of water masses in the PRE and adjacent SCS is mainly contributed by SCSW (71%), SCSKB (23%), and PREW (6%). The characteristics of high temperature but low salinity and low isotope values of PREW are mainly influenced by the surface water. The influence of SCSW water on the mixing of water masses in the PRE and the adjacent SCS is mainly through surface intrusion from the bottom of the offshore. The SCSKB that originated from the Kuroshio with high salinity and high isotopic values is mainly influenced by the subsurface water (100–300 m). In the PRE, the signal of the SCSKB water was weak, because of the high density with high temperature and high salinity sinking to the subsurface layer (100–300 m) after intrusion of the Kuroshio Branch into SCS. However, this study found that the signals of the Kuroshio Branch were only captured in the east of 115°E (Section 3) (the contribution of Kuroshio water accounting for 50%), whereas the west of 115°E (Sections 1 and 2) was mainly affected by the PREW (mainly in the surface water) and SCSW. The mixing of different water masses with the elements carried by the transportation processes may greatly impact environmental factors and local marine ecosystems (Lao et al., 2022a and Lao et al., 2022b). For example, the high absorption and fluorescence of dissolved organic matter (CDOM and FDOM) in the subsurface layer of SCS were mainly modulated by the Kuroshio intrusion (Wang et al., 2017). In addition, a stable input of external nutrients from different water masses, such as the West Guangdong coastal current and SCS water, was observed to sustain primary production in the Beibu Gulf throughout the year (Lao et al., 2022a). However, a high nutrient supplied from the West Guangdong coastal current to the Beibu Gulf during the dry season also resulted in the frequent algal blooms in the central gulf (Lao et al., 2022a). By contrast, as the dominant water source during the rainy seasons, the coastal current in the Beibu Gulf can input a large number of land-based pollutants into the coastal oceans (Lao et al., 2019b; Lao et al., 2022a), thereby intensifying water pollution, such as eutrophication (Lao et al., 2021). Moreover, increasing intrusion of high-salinity water has altered the mariculture activities in the coastal bays because it increased the salinity and seriously retained the pollutants of freshwater in the coastal bays (Lao et al., 2022b). Thus, the results of this study also provide a new idea for the study of physical dynamic and biogeochemical cycles in this region.
Conclusion
This study presents a new dataset, including δD and δ18O, for the water mass processes from the PRE and the adjacent northern SCS. Based on hydrographic observations and the relationship between isotopes of hydrogen, oxygen, and salinity in the water column, we have identified and quantified the mixing processes in the water column at PRE and the adjacent northern SCS. The seawater in the PRE and the adjacent northern SCS is significantly influenced by PREW (6%), SCSKB (23%), and SCSW (71%). However, the influence of PREW mainly occurred in the surface water, whereas the SCSKB with high salinity and high isotopic values is mainly influenced by the subsurface water (100–300 m). The mixing process of water masses in Sections 1 and 2 is similar, which is mainly contributed by the SCSW (86%), while the contribution of PREW and SCSKB is only 4% and 10%, respectively. By contrast, the mixing process of water masses in Section 3 is mainly influenced by the Kuroshio intrusion (50%). In addition, this study found that the great impact of the Kuroshio intrusion can reach 115.5°E (in Section 3), which brings a new understanding to the influence of the Kuroshio intrusion into the northern SCS.
Data availability statement
The original contributions presented in the study are included in the article/supplementary materials. Further inquiries can be directed to the corresponding author.
Author contributions
SZ was responsible for the conceptualization. XJ and QL prepared and wrote the original draft. XJ, QL and FC wrote, reviewed, and edited the manuscript. PH were responsible for the data curation. XJ, CC, QZ were responsible for the experimental operation. XJ, CC were responsible for field sampling. FC and SZ funded the acquisition. All authors contributed to the article and approved the submitted version.
Acknowledgments
We would like to thank Professor Jie Xu for his support in collecting water samples. This work was supported by the National Natural Science Foundation of China (92158201 and U1901213), the Scientific Research Start-Up Foundation of Shantou University (NTF20006), the Innovation and Entrepreneurship Project of Shantou (2021112176541391), and the Guangdong Natural Science Foundation of China (2019B1515120066).
Conflict of interest
The authors declare that the research was conducted in the absence of any commercial or financial relationships that could be construed as a potential conflict of interest.
Publisher’s note
All claims expressed in this article are solely those of the authors and do not necessarily represent those of their affiliated organizations, or those of the publisher, the editors and the reviewers. Any product that may be evaluated in this article, or claim that may be made by its manufacturer, is not guaranteed or endorsed by the publisher.
References
Benetti M., Reverdin G., Aloisi G., árny Erla S. R. (2017). Stable isotopes in surface waters of the Atlantic ocean: Indicators of ocean-atmosphere water fluxes and oceanic mixing processes. J. Geophys. Res. Oceans. 122 (6), 4723–4742. doi: 10.1002/2017JC012712
Bigg G. R., Rohling E. J. (2000). An oxygen isotope data set for marine waters. J. Geophys. Res.: Ocean. 105 (C4), 8527–8535. doi: 10.1029/2000JC900005
Chen F., Deng Z., Lao Q., Bian P., Jin G., Zhu Q., et al. (2022). Nitrogen cycling across a salinity gradient from the pearl river estuary to offshore: Insight from nitrate dual isotopes. J. Geophys. Res.: Biogeosci. 127 (5), e2022JG006862. doi: 10.1029/2022JG006862
Chen F., Huang C., Lao Q., Zhang S., Chen C., Zhou X., et al. (2021). Typhoon control of precipitation dual isotopes in southern China and its palaeoenvironmental implications. J. Geophys. Res.: Atmosph. 126 (14), e2020JD034336. doi: 10.1029/2020JD034336
Chen F., Lao Q., Zhang S., Bian P., Chen C. (2020b). Nitrate sources and biogeochemical processes identified using nitrogen and oxygen isotopes on the eastern coast of hainan island. Cont. Shelf. Res. 207, 104209. doi: 10.1016/j.csr.2020.104209
Chen D., Lian E., Shu Y., Yang S., Li Y., Liu P, et al. (2020a). Origin of the springtime south China Sea warm current in the southwestern Taiwan strait: Evidence from seawater oxygen isotope. Sci. China: Earth Sci. 63 (10), 1564–1576. doi: 10.1007/s11430-019-9642-8
Chen F., Zhou X., Lao Q., Wang S., Jin G., Chen C., et al. (2019). Dual isotopic evidence for nitrate sources and active biological transformation in the northern south China Sea in summer. PloS One 14 (1), e0209287. doi: 10.1371/journal.pone.0209287
Craig H. I. (1961). Isotopic variations in meteoric waters. Science 133, 1702–1703. doi: 10.1126/science.133.3465.1702
Craig H., Gordon L. I. (1965). Deuterium and oxygen 18 variation in the ocean and the marine atmosphere in Stable Isotopes in Oceanographic Studies and Paleotemperatures. Edited by. Tongiorgi E., 9–130. (Pisa, Italy: Conisglio Naz. delle Ric., Lab. di Geol. Nucl).
Deshpande R. D., Muraleedharan P. M., Singh R. L., Kumar B., Rao M. S., Dave M., et al. (2013). Spatio-temporal distributions of δ18O, δD and salinity in the Arabian Sea: Identifying processes and controls. Mar. Chem. 157 (dec.20), 144–161. doi: 10.1016/j.marchem.2013.10.001
Durack P. J. (2015). Ocean salinity and the global water cycle. Oceanography 28 (1), 20–31. doi: 10.5670/oceanog.2015.03
Fairbanks R. G. (1982). The origin of continental shelf and slope water in the new York bight and gulf of Maine: Evidence from H218O/H216O ratio measurements. J. Geophys. Res.: Ocean. 87 (C8), 5796–5808. doi: 10.1029/JC087iC08p05796
Fang Z., Wang W. (2022). Dynamics of trace metals with different size species in the pearl river estuary, southern China. Sci. Tot. Environ. 807 (P1), 150712. doi: 10.1016/J.SCITOTENV.2021.150712
Frew R. D., Dennis P. F., Heywood K. J., Meredith M. P., Boswell S. M. (2000). The oxygen isotope composition of water masses in the northern north Atlantic. Deep-Sea. Res. Part I. 47 (12), 2265–2286. doi: 10.1016/S0967-0637(00)00023-6
Harvey J. (1982). θ-s relationships and water masses in the eastern north Atlantic. Deep. Sea. Res. Part A. Oceanog. Res. Pap. 29 (8), 1021–1033. doi: 10.1016/0198-0149(82)90025-5
Hattori K. 1997(1997). Stable isotope geochemistry: Jochen hoefs. 4th ed (Berlin: Springer-Verlag), 201 pp. doi: 10.1002/qj.49705322213
Jackson A. L., Inger R., Bearhop S., Parnell A. (2009). Erroneous behaviour of MixSIR, a recently published Bayesian isotope mixing model: a discussion of Moore & semmens, (2008). Ecol. Lett. 12 (3), E1–E5. doi: 10.1111/j.1461-0248.2008.01233.x
Jin K., Rao W., Tan H., Song Y., Yong B., Zheng F., et al. (2018). H-O isotopic and chemical characteristics of a precipitation-lake water-groundwater system in a desert area. J. Hydrol. 559, 848–860. doi: 10.1016/j.jhydrol.2018.03.005
Karati K. K., Ashadevi C. R., Rasheed K., Vineetha G., Smitha B. R., Vimalkumar K. G., et al. (2019). Influence of the coastal circulation and water-mass characteristics in structuring the zooplankton community of the eastern Arabian Sea. Reg. Stud. Mar. Sci. 31, 100761. doi: 10.1016/j.rsma.2019.100761
Kumar P. K., Ramesh R. (2016). Revisiting reconstructed Indian monsoon rainfall variations during the last ∼25 ka from planktonic foraminiferal δ18O from the Eastern Arabian Sea. Quat. Int. 443, 29–38. doi: 10.1016/j.quaint.2016.07.012
Kumar P. K., Singh A., Ramesh R. (2018). Controls on δ18O, δD and δ18O–salinity relationship in the northern Indian ocean. Mar. Chem. 207, 55–62. doi: 10.1016/j.marchem.2018.10.010
Lao Q., Chen F., Liu G., Chen C., Jin G., Zhu Q., et al. (2019b). Isotopic evidence for the shift of nitrate sources and active biological transformation on the western coast of guangdong province, south China. Mar. pollut. Bull. 142, 603–612. doi: 10.1016/j.marpolbul.2019.04.026
Lao Q., Liu G., Shen Y., Su Q., Lei X. (2021). Biogeochemical processes and eutrophication status of nutrients in the northern beibu gulf, south China. J. Earth Sys. Sci. 130 (4), 1–14. doi: 10.1007/s12040-021-01706-y
Lao Q., Su Q., Liu G., Shen Y., Chen F., Lei X., et al. (2019a). Spatial distribution of and historical changes in heavy metals in the surface seawater and sediments of the beibu gulf, China. Mar. pollut. Bull. 146, 427–434. doi: 10.1016/j.marpolbul.2019.06.080
Lao Q., Wu J., Chen F., Zhou X., Li Z., Chen C., et al. (2022b). Increasing intrusion of high salinity water alters the mariculture activities in zhanjiang bay during the past two decades identified by dual water isotopes. J. Environ. Manage. 320, 115815. doi: 10.1016/j.jenvman.2022.115815
Lao Q., Zhang S., Li Z., Chen F., Zhou X., Jin G., et al. (2022a). Quantification of the seasonal intrusion of water masses and their impact on nutrients in the beibu gulf using dual water isotopes. J. Geophys. Res.: Ocean. 127, e2021JC018065. doi: 10.1029/2021JC018065
Legrande A. N., Schmidt G. A. (2006). Global gridded data set of the oxygen isotopic composition in seawater. Geophys. Res. Lett. 33 (12), 12604–1-12604-5. doi: 10.1029/2006GL026011
Lian E., Yang S., Wu H., Yang C., Li C., Liu J. T. (2016). Kuroshio subsurface water feeds the wintertime Taiwan warm current on the inner East China Sea shelf. J. Geophys. Res.: Oceans. 121 (7), 4790–4803. doi: 10.1002/2016JC011869
Liu B., Liao Y., Yan S., Yan H. (2017). Dynamic characteristics of saltwater intrusion in the pearl river estuary, China. Nat. Haz. 89 (3), 1097–1117. doi: 10.1007/s11069-017-3010-4
Liu B., Peng S., Liao Y., Wang H. (2019). The characteristics and causes of increasingly severe saltwater intrusion in pearl river estuary. Estuar. Coast. Shelf. Sci. 220, 54–63. doi: 10.1016/j.ecss.2019.02.041
Moore J. W., Semmens B. X. (2008). Incorporating uncertainty and prior information into stable isotope mixing models. Ecol. Lett. 11 (5), 470–480. doi: 10.1111/j.1461-0248.2008.01163.x
Oka E., Qiu B. (2012). Progress of north pacific mode water research in the past decade. J. Oceanogr. 68 (1), 5–20. doi: 10.1007/s10872-011-0032-5
Richardson L. E., Middleton J. F., James N. P., Kyser T. K., Opdyke B. N. (2018). Water masses and their seasonal variation on the Lincoln shelf, south Australia. Limnol. Oceanogr. 63 (5), 1944–1963. doi: 10.1002/lno.10817
Rohling E. J. (2007). Progress in paleosalinity: Overview and presentation of a new approach. Paleoceanography 22 (3), A3215–1-A3215-9. doi: 10.1029/2007PA001437
Sengupta S., Parekh A., Chakraborty S., Kumar K. R., Bose T. (2013). Vertical variation of oxygen isotope in bay of Bengal and its relationships with water masses. J. Geophys. Res.: Oceans. 118 (12), 6411–6424. doi: 10.1002/2013JC008973
Singh A., Jani R. A., Ramesh R. (2010). Spatiotemporal variations of the δ18O–salinity relation in the northern Indian ocean. Deep-Sea. Res. Part I. 57 (11), 1422–1431. doi: 10.1016/j.dsr.2010.08.002
Tran D. A., Tsujimura M., Vo L. P., Nguyen V. T., Nguyen L. D., Dang T. D. (2019). Stable isotope characteristics of water resources in the coastal area of the Vietnamese Mekong delta. Isotope. Environ. Health Stud. 55 (6), 566–587. doi: 10.1080/10256016.2019.1673746
Wang C., Guo W., Li Y., Stubbins A., Li Y., Song G., et al. (2017). Hydrological and biogeochemical controls on absorption and fluorescence of dissolved organic matter in the northern south China Sea. J. Geophys. Res.: Biogeosci. 122 (12), 3405–3418. doi: 10.1002/2017JG004100
Wang B., Zhang H., Xia L., Li X., Wang F. (2018). Cumulative effects of cascade dams on river water cycle: Evidence from hydrogen and oxygen isotopes. J. Hydrol. 568, 604–610. doi: 10.1016/j.jhydrol.2018.11.016
Wu J., Lao Q., Chen F., Huang C., Zhang S., Wang C., et al. (2021). Water mass processes between the south China Sea and the Western pacific through the Luzon strait: Insights from hydrogen and oxygen isotopes. J. Geophys. Res.: Ocean. 126 (8), e2021JC017484. doi: 10.1029/2021JC017484
Wu X., Zhang L., Hu B. X., Wang Y., Xu Z. (2020). Isotopic and hydrochemical evidence for the salinity origin in the coastal aquifers of the pearl river delta, guangzhou, China. J. Contam. Hydrol. 235 (prepublish), 103732. doi: 10.1016/j.jconhyd.2020.103732
Xia Y., Liu C., Wang D. (2018). Pearl river flushing freshwater driven upwelling in summer 2006. Haiyang. Xuebao. 40 (07), 43–54. doi: 10.3969/j.issn.0253-4193.2018.07.004
Xie L., Tian J., Zhang S., Zhang Y., Yang Q. (2011). An anticyclonic eddy in the intermediate layer of the Luzon strait in autumn 2005. J. Oceanogr. 67 (1), 37–46. doi: 10.1007/s10872-011-0004-9
Xu M. N., Zhang W., Zhu Y., Liu L., Zheng Z., Wan X. S., et al. (2018). Enhanced ammonia oxidation caused by lateral kuroshio intrusion in the boundary zone of the northern south China Sea. Geophys. Res. Lett. 45 (13), 6585–6593. doi: 10.1029/2018GL077896
Ying Y. S., Wen B. X., Sheng C. C., Fei C., Hangzhou, China, Qingdao, and China (2003). Analysis on characteristics and mechanism of current system in west coast of guangdong province in the summer. Acta Oceanol. Sin. 25 (6), 1–8. doi: 10.1007/s11769-003-0089-1
Yu X., Zhuang Y., Cai X, Qi D. (2022). Role of marginal seas in deep ocean regeneration of dissolved silica: A case study in the marginal seas of the Western pacific. Front. Mar. Sci. 9. doi: 10.3389/fmars.2022.925919
Zhang Y., Li Q., Luo Y., Yan L., Peng K., Liu Z., et al. (2022). Groundwater salinization in a subtropical region, beihai, southern China: Insights from hydrochemistry and multiple isotopes (H, O, s, Sr). Appl. Geochem. 141, 105323. doi: 10.1016/j.apgeochem.2022.105323
Keywords: δD, δ18O, water mass, Pearl River Estuary, kuroshio
Citation: Jian X, Zhang S, Lao Q, Chen F, Huang P, Chen C and Zhu Q (2022) Using dual water isotopes to quantify the mixing of water masses in the Pearl River Estuary and the adjacent northern South China Sea. Front. Mar. Sci. 9:987685. doi: 10.3389/fmars.2022.987685
Received: 06 July 2022; Accepted: 08 August 2022;
Published: 29 August 2022.
Edited by:
Meilin Wu, South China Sea Institute of Oceanology, (CAS), ChinaReviewed by:
Yanpei Zhuang, Jimei University, ChinaMiming Zhang, State Oceanic Administration, China
Zuhao Zhu, Ministry of Natural Resources, China
Copyright © 2022 Jian, Zhang, Lao, Chen, Huang, Chen and Zhu. This is an open-access article distributed under the terms of the Creative Commons Attribution License (CC BY). The use, distribution or reproduction in other forums is permitted, provided the original author(s) and the copyright owner(s) are credited and that the original publication in this journal is cited, in accordance with accepted academic practice. No use, distribution or reproduction is permitted which does not comply with these terms.
*Correspondence: Shuwen Zhang, emhhbmdzd0BzdHUuZWR1LmNu