
95% of researchers rate our articles as excellent or good
Learn more about the work of our research integrity team to safeguard the quality of each article we publish.
Find out more
ORIGINAL RESEARCH article
Front. Mar. Sci. , 04 October 2022
Sec. Ocean Observation
Volume 9 - 2022 | https://doi.org/10.3389/fmars.2022.987368
This article is part of the Research Topic Using High-Resolution Observation Methods to Reveal the Effect and Mechanism of Coastal Eutrophication, Deoxygenation, and Acidification View all 8 articles
 Qinsheng Wei1,2*†
 Yongquan Yuan2,3
 Shuqun Song2,3
 Yuhang Zhao1
 Junchuan Sun1
 Caiwen Li2,3
 Baodong Wang1,2*†
Global estuarine hypoxia is among the most acute environmental issues, yet the recognition of hypoxia variability remains patchy. The Changjiang (Yangtze River) Estuary (CE) is well known as one of the largest estuarine hypoxic systems. However, the mechanisms controlling the spatial variability and heterogeneity of summer hypoxia have been rarely examined in this region. Based on observational data in the summer of 2013, the essential linkages between physical-biogeochemical processes and spatial variability of hypoxia were revealed off the CE. The hypoxia generally occurred in a transitional region off the CE, presenting to be spatially variable and heterogeneous in its distribution and intensity. The river plume, stratification, front, upwelling and localized high phytoplankton biomass combine to shape the spatial morphology and scope of hypoxia. The spatial heterogeneity of hypoxic magnitude in horizontal direction is mainly regulated by the intensity variability of stratification and phytoplankton blooms. The position of bottom front formed by the offshore Taiwan Warm Current (TWC) and coastal water under tidal mixing controls the shoreward boundary of hypoxic zone, while the river plume front-dominated outer edge of phytoplankton blooms in upper layers plays a role in determining the seaward limit of the reach of bottom hypoxia. The stratification depth controlled by the upwelling and river plume governs the upper limit of the top reach of hypoxia, and shapes the vertical morphology of hypoxic zone. We contextualize the role of physical-biogeochemical drivers to the spatially variable hypoxia in a conceptual diagram. The findings would considerably contribute to our understanding of the spatially variable hypoxia in river plume-upwelling-front coupled estuarine systems, providing a sound basis for prediction and simulation under anticipated future conditions.
Dissolved oxygen (DO) is of great importance for elemental biogeochemical cycling (Hietanen et al., 2012; Rabalais et al., 2014; Cai et al., 2017) and marine habitats (Diaz and Rosenberg, 2008; Vaquer-Sunyer and Duarte, 2008; Stramma et al., 2010; Breitburg et al., 2018; Köhn et al., 2022). Influenced by increasing anthropogenic perturbations and natural changes, the estuarine and coastal ecosystems are experiencing eutrophication, which may eventually result in subsurface/bottom hypoxia (Zhang et al., 2010; Howarth et al., 2011; Rabalais et al., 2014; Cui et al., 2019; Diaz et al., 2019) and associated acidification (Cai et al., 2011; Sunda and Cai, 2012; Wallace et al., 2014; Zhao et al., 2020; Kessouri et al., 2021). In recent decades, the occurrence of oxygen deficit and hypoxia is increasing worldwide (Diaz and Rosenberg, 2008; Rabalais et al., 2010; Fennel and Testa, 2019; Pitcher et al., 2021), representing a significant threat to the health and sustainable output of marine ecosystem.
Hypoxia formation largely depends on the balance between O2 supply (primarily from photosynthesis and air-sea exchange) and its consumption (mainly due to degradation of organic matter). Stratification (or water column stability), which can reduce vertical water exchange and O2 supply to subsurface/bottom waters, is a prerequisite for hypoxia development (Rabouille et al., 2008; Obenour et al., 2012). Therefore, hypoxia is usually associated with a density barrier (caused by temperature, salinity or both) (Rabalais et al., 2010). Estuaries are conducive to the formation of coastal hypoxia (Howarth et al., 2011; Diaz et al., 2019), due to high phytoplankton biomass and intensive stratification. Nowadays, hypoxia in estuarine systems has been accelerated by human activities, and thereby become a symptom of eutrophication (Bianchi et al., 2010; Rabalais et al., 2014). Long water residence time is also a key factor for the development of hypoxia (Rabouille et al., 2008), which is noticeable in regions with unique topography. In addition, coastal hypoxia may also be “introduced” and exacerbated by advection of the offshore oxygen-depleted waters through upwelling (Helly and Levin, 2004; Grantham et al., 2004; Bograd et al., 2008; Chan et al., 2008). Notably, the drivers may be not uniform in space or time within various oxygen-depleted systems, leading to the variability of hypoxia (Testa and Kemp, 2014; Dussin et al., 2019; Li et al., 2021a; Stramma and Schmidtko, 2021). As demonstrated by Hetland and DiMarco (2008), the varying nature of physical-biogeochemical processes contributes to the spatial structure of hypoxia on the Texas-Louisiana continental shelf. Cheresh and Fiechter (2020) also revealed a strongly un-uniform pattern of nearshore oxygen in the central California Current System, which was associated with the alongshore heterogeneity of coastal upwelling and subsequent biogeochemical response. Consequently, hypoxia exposure may be spatially heterogeneous with persistent, geographically fixed “hot spots” (Chan et al., 2019). Understanding how and why hypoxia varies in space is of fundamental importance as its variability greatly influences the biogeochemical and ecological structure of marine systems (Pitcher et al., 2021). Actually, due to the complicated dynamics and their great influences on biogeochemical-ecological processes in river-dominated ecosystems, an in-depth understanding of the mechanisms that control the variability of estuarine hypoxia remains challenging.
The Changjiang (Yangtze River) Estuary (CE) is among the most well-known large river-dominated systems. The dynamics off the CE are far more complex as they involve river plume (i.e., the Changjiang Diluted Water, CDW) (Mao et al., 1963; Lie et al., 2003; Wu et al., 2014), frontal activities (Tian et al., 1993; Hu et al., 1995; Zhang et al., 2020b; Li et al., 2021b), upwelling (Zhu, 2003; Lü et al., 2006; Tseng et al., 2014), seasonal stratification (Hao et al., 2012), sedimentation processes (Chen et al., 1999; Wu et al., 2012; Zhang and Wu, 2018), estuary-shelf interactions (Ding et al., 2016; Zhang et al., 2019a; Liu et al., 2021; Wu et al., 2021) and close interplay among these processes. Seasonal oxygen deficit is exemplified off the CE during summertime, leading to one of the largest seasonal hypoxic zone in the world (Li et al., 2002; Chen et al., 2007; Rabouille et al., 2008). This hypoxia off the CE is a multifactor-controlled phenomenon. Previously, based on in situ observations (e.g., Li et al., 2002; Wei et al., 2007; Wei et al., 2015; Zhu et al., 2017; Chi et al., 2017; Wang et al., 2017; Li et al., 2018; Luo et al., 2018; Wang et al., 2021a; Wei et al., 2021b) and numerical modeling (e.g., Zheng et al., 2016; Zhang et al., 2019b; Große et al., 2020; Zhang et al., 2020a; Zhou et al., 2020; Zhang et al., 2021; Meng et al., 2022a), considerable research has been conducted on its formation mechanisms. Similar to other estuarine ecosystems, stratification and organic matter degradation are among the most important drivers of hypoxia off the CE (Wang et al., 2016; Zhu et al., 2016; Wei et al., 2017). Besides, this estuarine hypoxia are also influenced by freshwater discharge (Zheng et al., 2016), wind (Ni et al., 2016; Zheng et al., 2016; Wang et al., 2017; Meng et al., 2022b), intrusion of the Kuroshio subsurface water and associated Taiwan Warm Current (TWC) (Wei et al, 2015; Qian et al., 2017), upwelling (Wei et al., 2017; Wei et al., 2021b; Chen et al., 2021), topography (Li et al., 2002; Wei et al., 2015), expansion of Changjiang River plume (Zhang et al., 2018; Wei et al., 2021a) and tidal forcing (Chen et al., 2015), most of which are associated with water column stratification to an extent as well. In general, this hypoxia is mainly modulated by both physical and biogeochemical processes. However, due to the complexity and interplay of multiple factors, DO distribution within the hypoxic zone off the CE is not uniform (Wei et al., 2015; Zhang et al., 2019b; Zhou et al., 2020). Although great efforts have been devoted to the hypoxia formation, explorations characterizing the heterogeneity of hypoxia to physical and biogeochemical drivers are limited. Moreover, the processes governing the boundary, scope and magnitude of normal summer hypoxia are still unclear. Thus, the mechanisms controlling the spatial variability of hypoxia off the CE in summer have yet to be fully examined.
In the present study, we attempt to find the essential linkage between physical-biogeochemical processes and spatial variability of hypoxia off the CE. More specifically, the analyses aim to examine how river plume, stratification, physical front, upwelling and localized high phytoplankton biomass shape the spatial morphology, intensity and boundary of hypoxia in summer. As such, the results contextualize the relative importance of physical-biogeochemical drivers in regulating the spatially variable hypoxia. The findings would considerably contribute to our understanding of the spatially variable hypoxia in estuarine systems, providing a sound basis for three-dimensional simulation and prediction of hypoxia under anticipated future conditions.
The study area (Figure 1) is mainly located in the inner East China Sea (ECS) shelf. The remarkable topography in this region is characterized by a submarine canyon (water depth > 40 m), which orients from the southeast to northwest. To the west of the submarine canyon is the shallow nearshore tregion; the terrain changes dramatically seaward, deepening quickly and forming a steep topography. The northern part of the CE is mainly covered by the tongue-shaped Changjiang Bank, which is linked to the Subei Shoal and extends southeastward. The hydrographic dynamics off the CE is strongly affected by both river plume (Mao et al., 1963; Lie et al., 2003) and the Taiwan Warm Current (TWC) (Bai and Hu, 2004; Qi et al., 2017). As the fifth largest river in the world in terms of runoff discharge, the Changjiang delivers ~ 9.1 × 10¹¹ m3 yr-1 of freshwater and ~ 8 × 10⁷ tons yr-1 of sediments into the sea (Milliman and Farnsworth, 2011; Luan et al., 2016). In summer, a tremendous amount of river discharge leads to a huge plume region off the CE (Hu et al., 1995; Lie et al., 2003). The river plume significantly regulates the hydrodynamics and nutrient conditions off the CE (Mao et al., 1963; Chang and Isobe, 2003; Zhang et al., 2007; Zhu et al., 2009; Li et al., 2022). Cased by abundant nutrient export, severe eutrophication (Chai et al., 2006; Zhu et al., 2014; Wang et al., 2021b) can form off the CE, and the harmful algal blooms (Li et al., 2014; Yu et al., 2018; Wang et al., 2019b) and subsequent bottom hypoxia (Wang et al., 2016; Wei et al., 2017) are frequently observed during the rainy season. Meanwhile, the TWC, the bottom water of which primarily originates from the Kuroshio Subsurface Water (Liu et al., 2000; Yang et al., 2013), controls the seaward dynamic environment off the CE. Forced by southwesterly wind, the nutrients that are transported by the bottom TWC can be upwelled along the steep region off the CE to support surface phytoplankton blooming (Yang et al., 2013; Tseng et al., 2014). Notably, very sharp gradients of variables form off the CE (Tian et al., 1993; Ning et al., 2004; Wang et al., 2019a; Ge et al., 2020; Zhang et al., 2020b; Li et al., 2021b), leading to pronounced thermohaline (e.g. river plume and upwelling fronts), sediment, nutrient and biological productivity fronts. These fronts greatly influence the matter transport and structure the hydro-biogeochemical heterogeneity off the CE. Given the highly complicated and variable dynamic environment, the CE is an ideal venue for identifying the mechanisms controlling the spatial variability of hypoxia in estuarine systems.
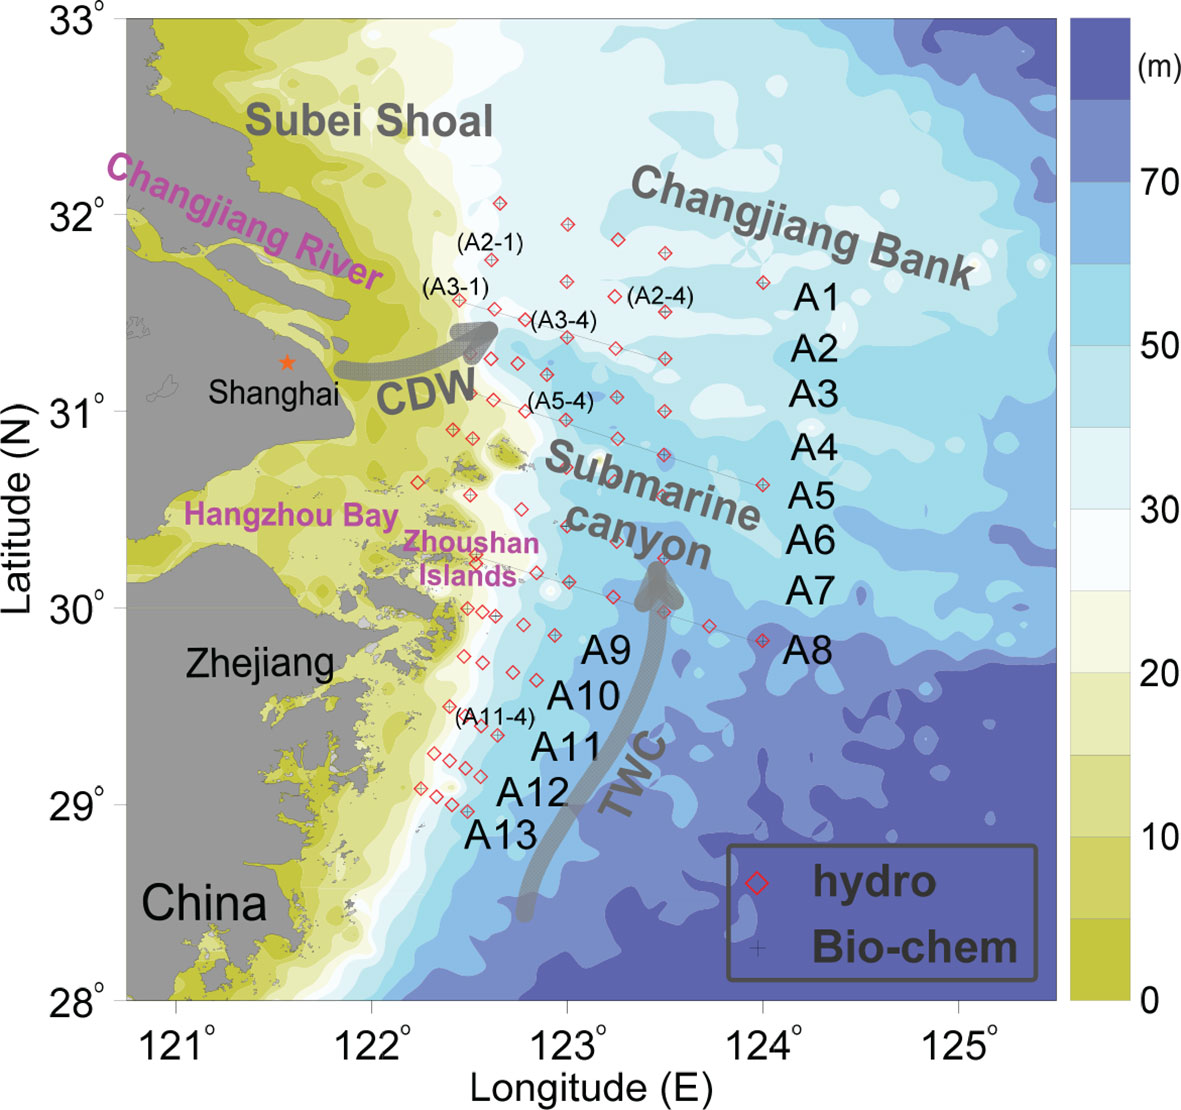
Figure 1 Geographic map of the study area and its adjacent region, which shows the station locations in August 2013 and associated currents. CDW and TWC represent the Changjiang Diluted Water and Taiwan Warm Current, respectively.
In situ observations were conducted onboard the R/V Science No. 3 during the period from August 17 to 28 in 2013. Thirteen northwest-southeast oriented regular sections (namely from A1 to A13) were parallelly designed from north to south off the CE, including 68 hydrological stations and 36 biochemical stations (Figure 1). Seawater temperature, salinity, density and turbidity were measured using a Sea-Bird 911 CTD (conductivity-temperature-depth) profiling recorder (Sea-Bird Electronics, Inc., Bellevue, WA, USA) carrying turbidity and fluorescence sensors. All sensors had been calibrated before the cruise. During the cruise, samples were collected from 5-liter free-flow water samplers mounted onto a Rosette sampling assembly, which was equipped with the CTD recorder. DO concentrations in discrete samples were measured in onboard laboratory within approximately 8 h using the Winkler method (Grasshoff et al., 1999), with a precision of 1 μmol kg−1. The nutrient samples were filtered through a 0.45-μm cellulose acetate membrane and then analyzed using an automatic nutrient analyzer (model SA 3000/5000 chemistry unit, Skalar Analytical B.V., Breda, Netherlands). Chlorophyll a (Chl-a) concentrations were determined using the fluorescence sensor and converted into Chl-a unit in µg dm-3 using the formula provided by the manufacturer. Moreover, Chl-a samples were also filtered at discrete depths during the cruise, as previously described by Li et al. (2016). The collected Chl-a samples were extracted and concentrations were measured in the laboratory using the fluorometric method (Parsons et al., 1984). Actually, there was a significantly positive relationship between fluorescence sensor observations and extracted Chl-a concentrations (r = 0.884, p < 0.001), further confirming the validity of sensor results and suggesting the feasibility to construct high-resolution regime of Chl-a using fluorescence sensor. Note that the related hydrological and laboratory-measured biochemical data have been partially used by Wei et al. (2017) and (Li et al., 2016; Li et al., 2017) but from different perspectives.
Based on oxygen solubility equation (García and Gordon, 1992), DO saturation and apparent oxygen utilization (AOU) were obtained by using the measured DO concentration and the equilibrium saturation concentration for given temperature and salinity. A quasi-step function approximation method was adopted to fit the vertical profiles of salinity, temperature and density at each station; thus, the halocline, thermocline and pycnocline depths was determined, and their intensities were obtained in units of m-1, °C m-1 and kg m-4, respectively. A detailed description of this method can be found in Ge et al. (2003). Salinity and density gradients were calculated using the oceanic front detection algorithm, as described by Belkin and O’Reilly (2009). The gradient distributions were mapped to identify the locations of physical fronts according to the gradient magnitude.
Figure 2 shows the horizontal distributions of DO and DO saturation off the CE in August 2013. DO concentration generally exhibited a decreasing trend from surface to bottom layer (Figures 2A–F). Specifically, in surface layer (Figure 2A), DO concentration was high in the northern and southern parts of study area, with high-DO centers emerging at stations of A2-1 (325 μmol dm-3), A2-4 (346 μmol dm-3), A3-4 (262 μmol dm-3) and A11-4 (220 μmol dm-3); a low-DO region was observed alongshore. In 5-m layer (Figure 2B), a distinct nearshore low-DO region existed from the estuary to the area outside of the Zhoushan Islands, and a hypoxic core with DO of ~26 μmol dm-3 appeared at station A3-1 near the Changjiang mouth; in contrast, DO concentration was relatively high in the eastern offshore area. In 10-m and 20-m layers (Figures 2C, D), the distribution patterns of DO changed significantly, compared with that in surface layer. Moreover, an approximately “S”-shaped low-DO area, especially in 20-m layer (with DO < 100 μmol dm-3), appeared from the northeastern region off the CE to the coasts off Zhejiang Province, and sharp gradients existed between this low-DO area and the southeastern high-DO region. In 30-m layer (Figure 2E), the distribution pattern of DO distribution was similar with that in 20-m layer, but DO concentration was reduced further. At bottom (Figure 2F), a notable hypoxic zone was observed mainly in the northern/northeastern part of study area. There was also a low-DO area along the isobaths of ~30-40 m in the central area, and a low-DO center was also formed at station A11-4 in the south. In contrast, DO concentration was high outside of the Hangzhou Bay and in the southeastern part of the study area at bottom.
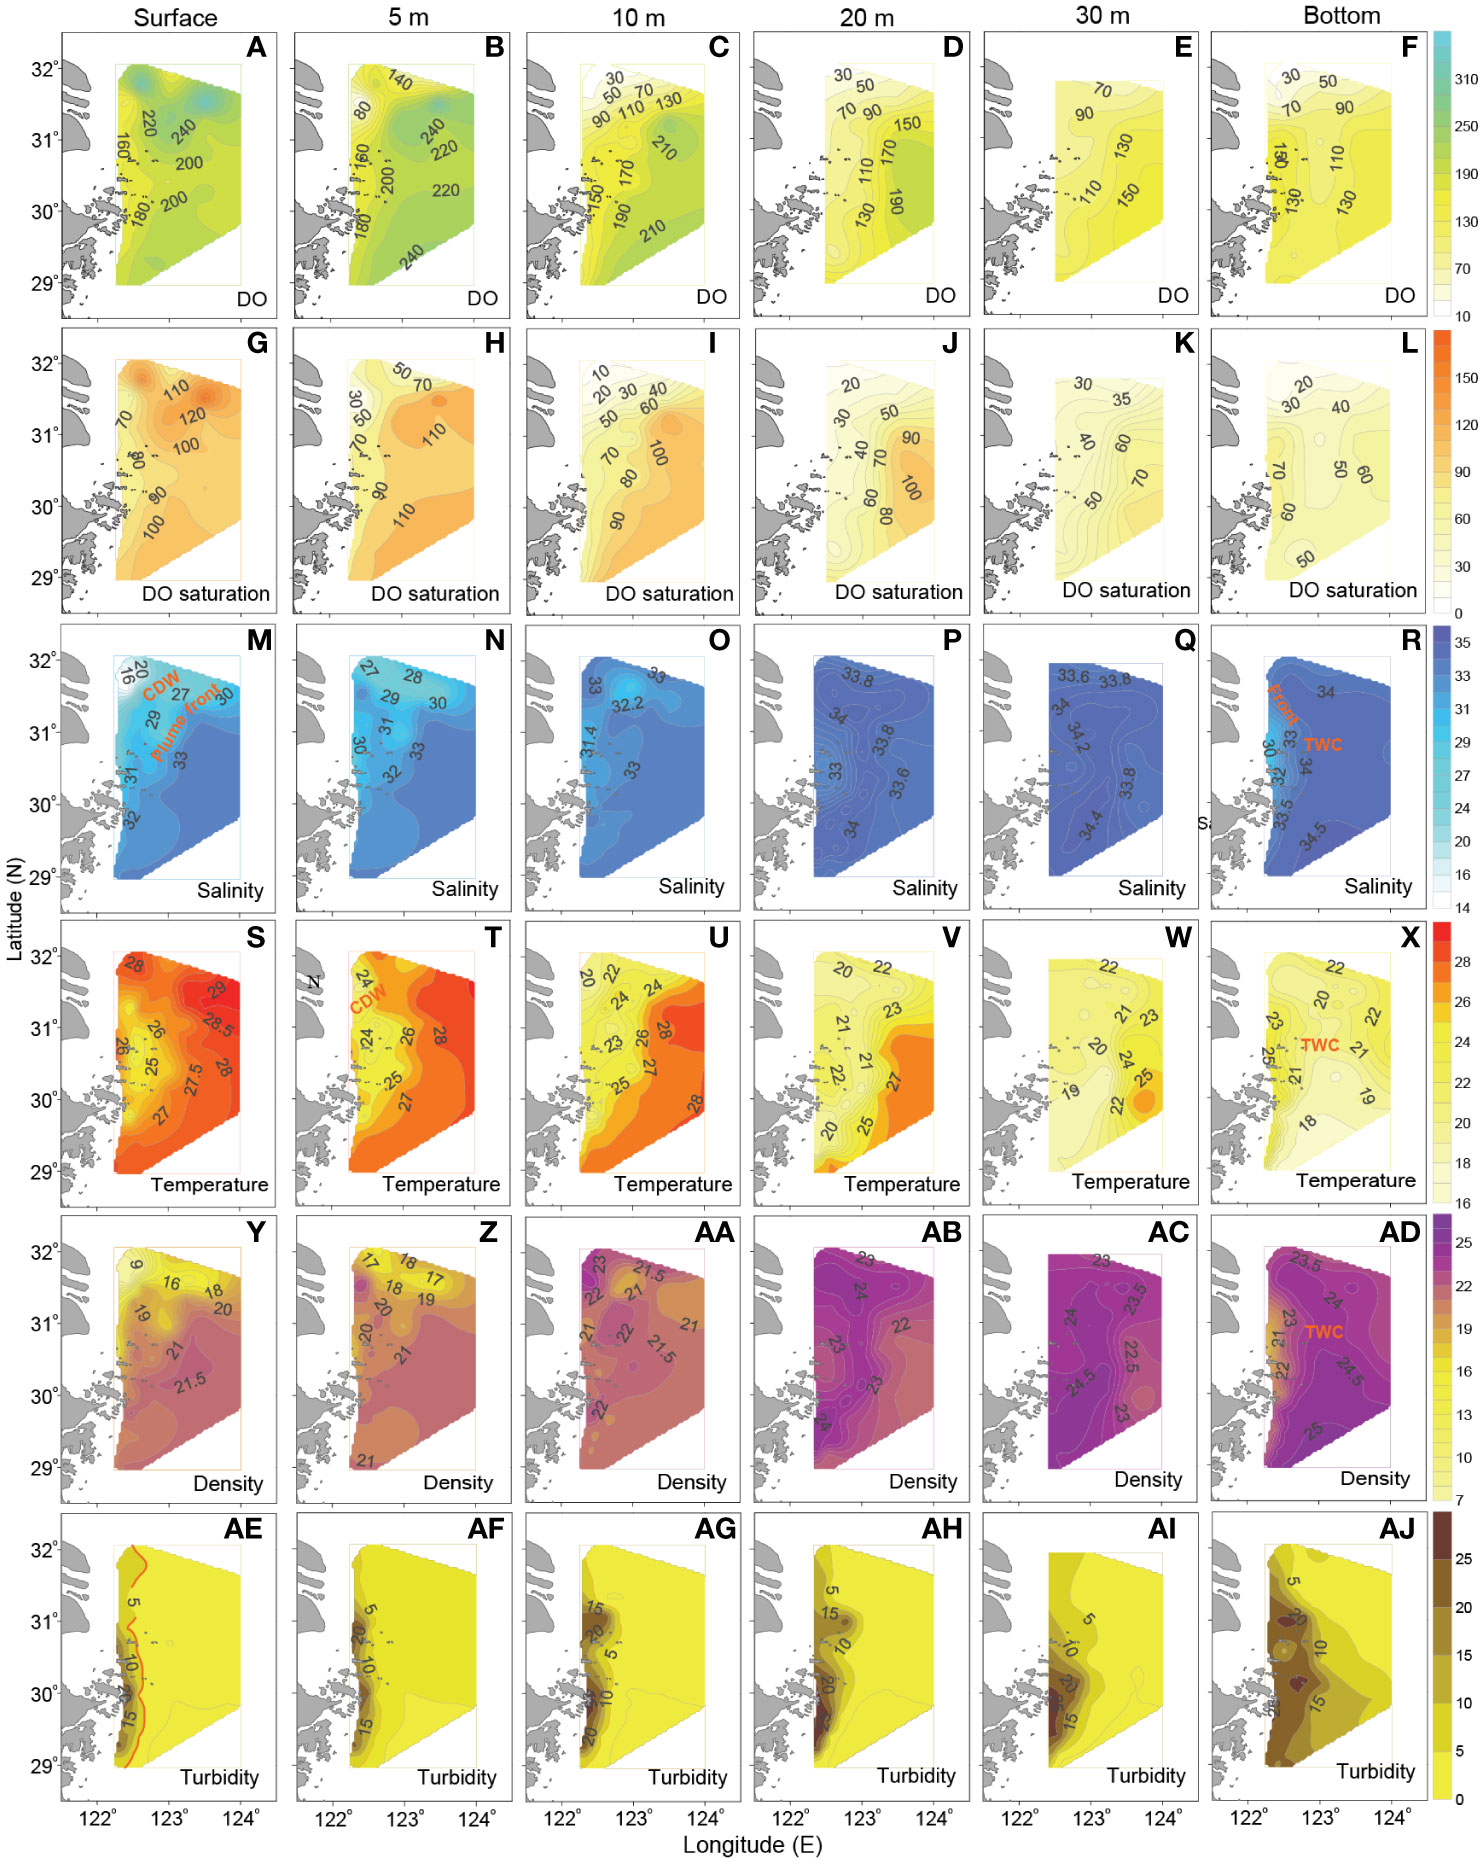
Figure 2 Horizontal distributions of (A–F) DO (μmol dm-3), (G–L) DO saturation (%), (M–R) salinity, (S–X) temperature (°C), (Y–AD) potential density (kg m-3) and (AE–AJ) turbidity (NTU) off the CE in August 2013. The red line in panels (AE–AG) generally implies the location of turbidity front, where sharp gradients occurred.
The distribution morphologies of DO saturation (Figures 2G–L) were generally consistent with that of DO in each layer. In upper layers, supersaturated DO (Figures 2G–I) was observed within the high-DO areas. From 10-m to 30-m layers, an area with undersaturated DO (Figures 2I–K) existed from the northeastern region off the CE to the coasts off Zhejiang Province, presenting distinct seaward gradients. In bottom layer, there was a significant DO-deficient area with DO < 50% (Figure 2L), whose location was in correspondence to the hypoxic zone (Figure 2F).
Regarding the vertical distributions of DO and DO saturation along typical sections off the CE, observational results show that the shape of their contours was similar with each other (Figures 3A–F). The low-DO waters with low DO saturation mainly existed on the steep area along each section, tending to be significantly uplifted westward and forming the oxycline; DO concentration was relatively high in the upper layers of eastern deep region for each section, and the waters within this high-DO region tended to be transported downward, forming sharp contrast with the upwelled low-DO waters in the western area.

Figure 3 Vertical distributions of (A–C) DO (μmol dm-3), (D–F) DO saturation (%), (G–I) salinity, (J–L) temperature (°C), (M–O) potential density (kg m-3) and (P–R) turbidity (NTU) along typical sections off the CE in August 2013.
Figures 2M–AJ show the horizontal distributions of hydrological parameters and turbidity off the CE in August 2013. With regard to salinity patterns, the existence of a relatively large-scale low-salinity area (with salinity <29) in surface indicates the northeastward expansion of the CDW plume (Figure 2M). Meanwhile, a surface saline water mass with salinity >30, which was associated with the TWC (Qi et al., 2017), was located to the southeast of the CDW plume. Moreover, distinct saline front formed in the intersection zone of the CDW and the TWC. In 5-m and 10-m layers (Figures 2N, O), the northward saline-TWC could intrude to the station A3-1, and thus parts of the diluted waters were separated from the CDW plume to form an enclosed low-salinity region in the northeastern area off the CE. In 20-m and 30-m layers (Figures 2P, Q), the CDW plume in the northeastern area off the CE almost disappeared; the saline TWC was more significant than that in the upper layers, expanding northward along the isobaths of ~40 m. At bottom (Figure 2R), the offshore area off the CE was mostly occupied by the saline TWC, and a local low-salinity area just existed outside of the Hangzhou Bay; the saline front was prominent between the offshore TWC and the nearshore low-salinity water.
Observational results show that a dominant arc-shaped cold-water area with temperature < 27°C existed both in surface and 5-m layers (Figures 2S, T). The cold area got more apparent in 10-m layer (Figure 2U), expanding from estuary to the region outside of the Zhoushan Islands. In 20-m and 30-m layers (Figures 2V, W), the distribution of temperature was similar, with an obvious low-temperature area emerging in the central region, whose location was consistent with that of the saline-TWC (Figures 2P, Q). In bottom layer (Figure 2X), influenced by the northward TWC, a cold-water area with temperature < 21°C expanded from south to north and turned toward the northwest in the northeastern area off the CE, with its path being in general agreement with the submarine canyon; a thermal front formed near the boundary of this low-temperature water mass.
The horizontal distribution of density (Figures 2Y–AD) was roughly consistent with that of salinity (Figures 2M–R) in each layer. Specifically, the low-density area in surface and 5-m layers (Figures 2Y, Z) shows the CDW pattern; the high-density water transported by the northward TWC was located to the southeast of the CDW plume. In 20-m and 30-m layers (Figures 2AB, AC), a high-density area existed in the central region, corresponding to the saline (Figures 2P, Q) and low-temperature (Figures 2V, W) area. In bottom layer (Figure 2AD), a dense water mass expanded northward along the longitude of 123°E, indicating the pathway of the TWC.
As shown in Figures 2AE-AJ, turbidity was high in nearshore area and decreased seaward. In upper layers (Figures 2AE-AI), rapid decrease in turbidity resulted in sharp gradients from nearshore to offshore, implying the formation of turbidity front near the isoline of ~5 NTU. At bottom (Figure 2AJ), turbidity was higher than that in upper layers; this might be mainly related to the resuspension of sediments. Note that the surface turbidity front with isoline of ~5 NTU (Figure 2AE) generally corresponded to the western boundary of the bottom TWC (Figures 2R, X, AD). These turbidity patterns generally reflected the spatial variability of light conditions off the CE.
Figures 3G–R exhibits the vertical distributions of salinity, temperature, density and turbidity along the sections of A3, A5 and A8. Generally, a low-salinity and low-density area existed in upper layers in the western part of sections A3 and A5 (Figures 3G, H, M, N), suggesting the CDW expansion; in contrast, the CDW influence on section A8 got much weaker (Figure 3I). The saline, cold and dense bottom waters were mainly concentrated on the steep area along each section, tending to be significantly uplifted in a shoreward direction (Figures 3G–O). The upwelled bottom waters could even reach the surface layer, leading to a saline, cold and dense area. Moreover, the water column was stratified for each section, exhibiting distinct halocline, thermocline, and pycnocline. Notably, the pattern of stratification was related to the interactions of the upper CDW plume and the bottom upwelled waters. The turbidity was high and vertically uniform in coastal area (Figures 3P–R). In contrast, it was relatively low in upper layers (<2 NTU) in the offshore deep region, which indicates that enhanced light penetration could be achieved. As a result, a noticeable turbidity front formed in the steep area (Figures 3P–R).
Figure 4 shows the horizontal distributions of nitrate and sensor-observed Chl-a in upper layers off the CE in August 2013. Overall, nitrate concentration was high in nearshore area and gradually decreased seaward, presenting significant gradients (Figures 4A–D). From surface to 10-m layers (Figures 4E–G), the distribution pattern of Chl-a was similar, and its concentration was relatively high in both of the northern and southern parts of study area, but much higher in the north than that in the south; a low-Chl-a region existed along the nearshore and in the southeastern/eastern part of the study area, respectively. In 20-m layer (Figure 4H), Chl-a concentration was much lower than that in other upper layers, but it was still higher in the north than that in the south. Notably, there were two or three high-Chl-a centers in the northern area, especially in surface and 5-m layers; surface Chl-a concentration could reach 41.02 μg dm-3 and 25.73 μg dm-3 at stations A2-1 and A5-4, respectively. A relative high-Chl-a center (> 2μg dm-3) was also observed from surface to 10-m layers in the southern area.
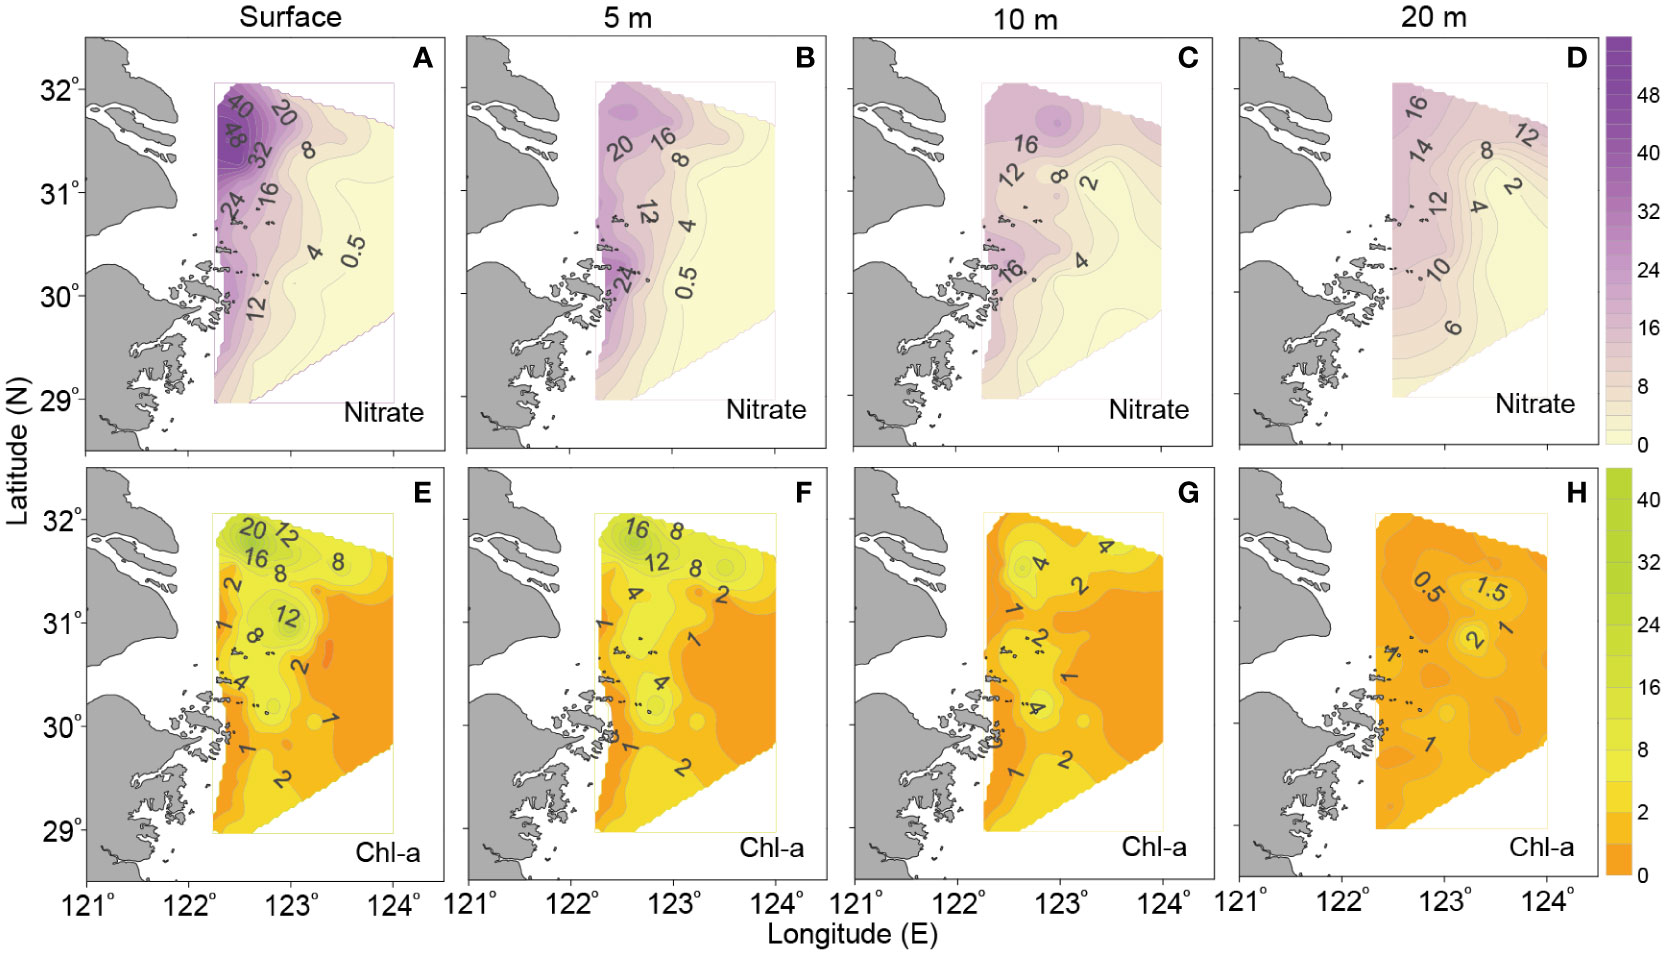
Figure 4 Horizontal distributions of (A–D) nitrate (μmol dm-3) and (E–H) Chl-a (μg dm-3) in upper layers off the CE in August 2013 (the distribution patterns of phosphate and silicate are similar to that of nitrate and hence are not shown).
As shown by the vertical distributions of nitrate off the CE (Figures 5A–C), nitrate concentration was high in upper layers in the western nearshore region of each transect, presenting a decreasing trend to offshore area; a relatively low-nitrate region was observed in the eastern deep-water area. Meanwhile, the bottom waters in steep area along each transect were also characterized by high nitrate concentration. Regarding the vertical distributions of Chl-a concentration, it generally varied from high to low in both of the downward and seaward directions, and the surface or subsurface Chl-a maximum existed along each section (Figures 5D–F). Moreover, the depth of subsurface Chl-a maximum was deeper in the offshore area than that in the nearshore shallow region.
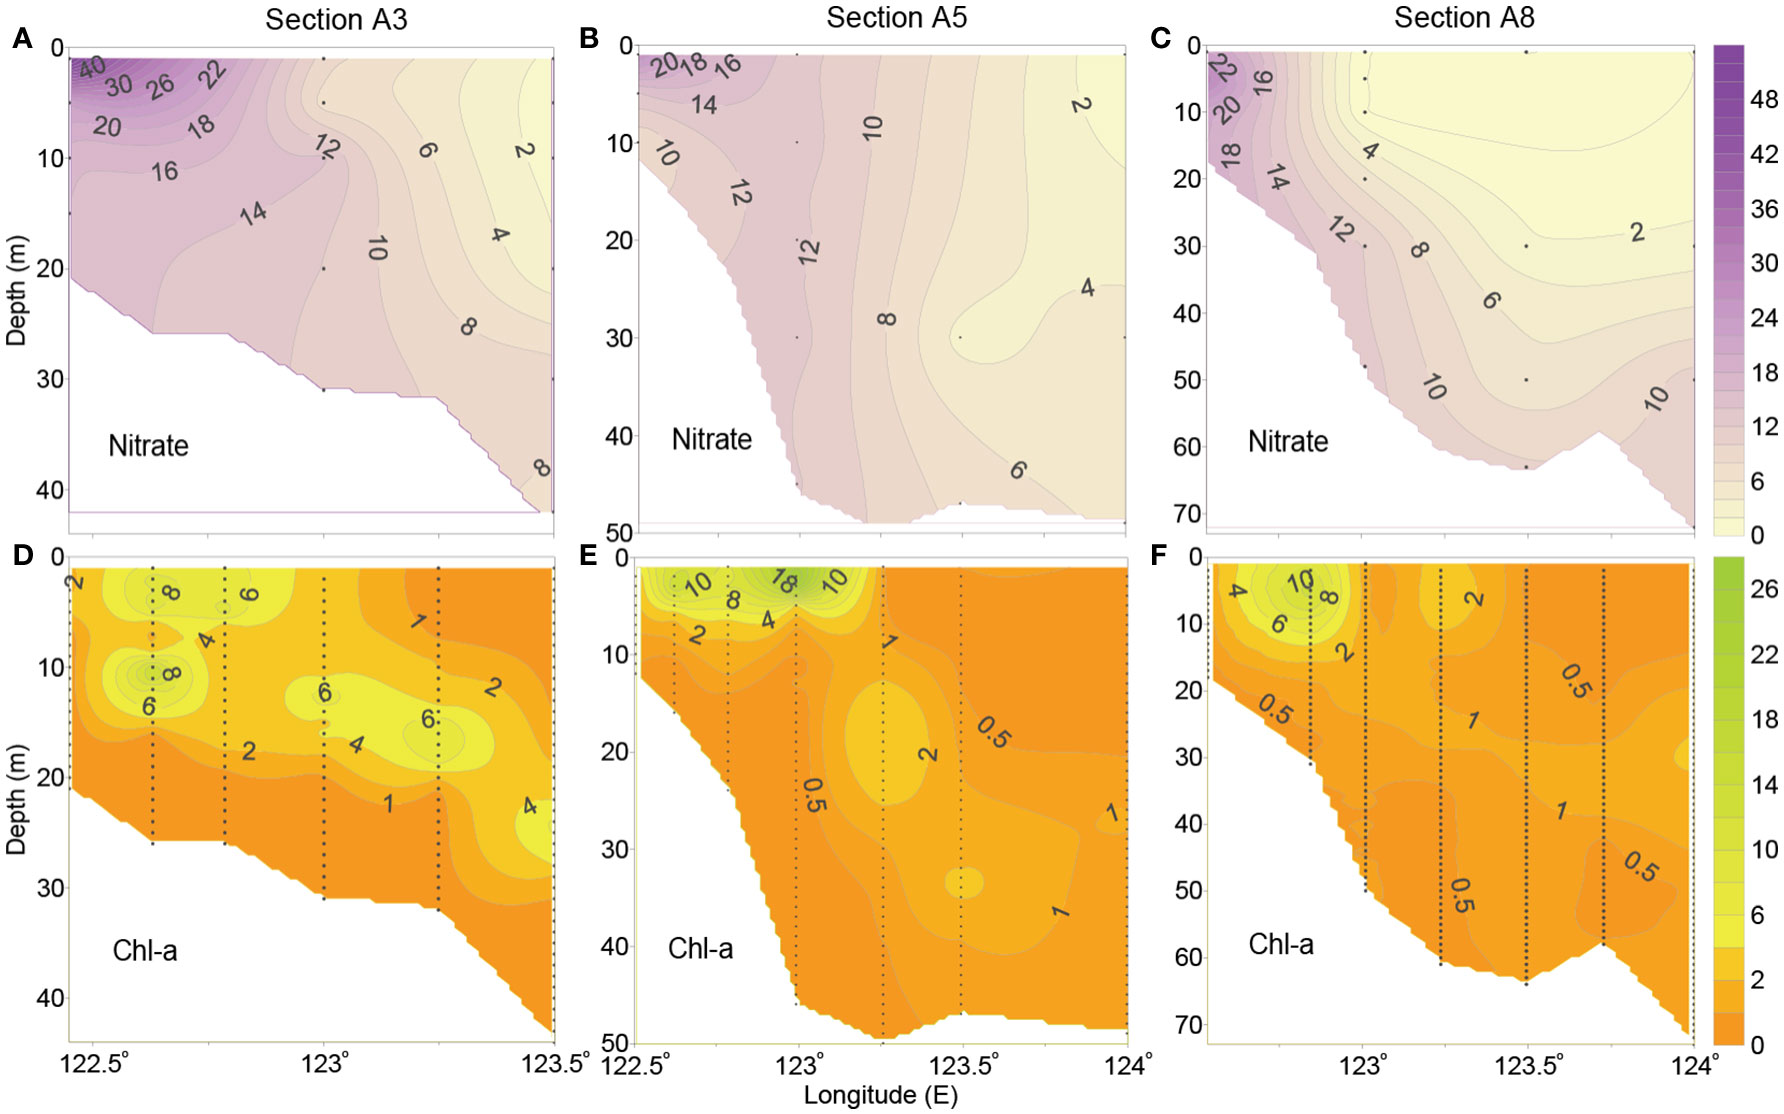
Figure 5 Vertical distributions of (A–C) nitrate (μmol dm-3) and (D–F) Chl-a (μg dm-3) along typical sections off the CE in August 2013 (the distribution patterns of phosphate and silicate are similar to that of nitrate and hence are not shown).
The low-salinity and low-density CDW is one of the most important hydrodynamics off the CE in summer, as indicated by Figures 2M, N. Generally, the surface CDW was mainly transported to the northeastern area off the CE, and then partially turned back toward the southeastern sea when it was far from the coast, as also revealed by previous studies (e.g., Mao et al., 1963; Lie et al., 2003). Meanwhile, a portion of the CDW flowed toward the southeast and formed an alongshore low-salinity area, but its scope was constricted to a narrow region outside of the Hangzhou Bay. Moreover, the TWC expanded from south to north, with varying intensity in different layers (Figures 2M-AD). Actually, the bottom TWC primarily originate from the onshore intrusion of the Kurosho Subsurface Water (Yang et al., 2013; Xu et al., 2018), which was characterized by high salinity, low temperature and high density.
Notably, there was an upwelling off the CE, which could be confirmed by the low-temperature area in upper layers (Figures 2S–U). The uplifted saline, cold and dense bottom waters along typical sections further indicate the existence of upwelling (Figures 3G–O). Generally, the upwelling was mainly located in the western steep region of submarine canyon off the CE. By comparing the temperature distributions between different layers, we find that the cold area in upper layers (Figures 2S–U) approximately corresponded to the western/northwestern boundary of the bottom TWC (Figures 2R, X, AD). Actually, the upwelling off the CE was the result of the upwelled bottom TWC along the steep topography under tidal mixing (Lü et al., 2006). Besides, southerly wind might also contribute to the summer upwelling in this area (Luo and Yu, 1998). Based on temperature-salinity diagram (Figure 6), we could further examine the hydrodynamic structures from surface to 10-m layer, identifying the CDW plume-, TWC- and upwelling-influenced areas.
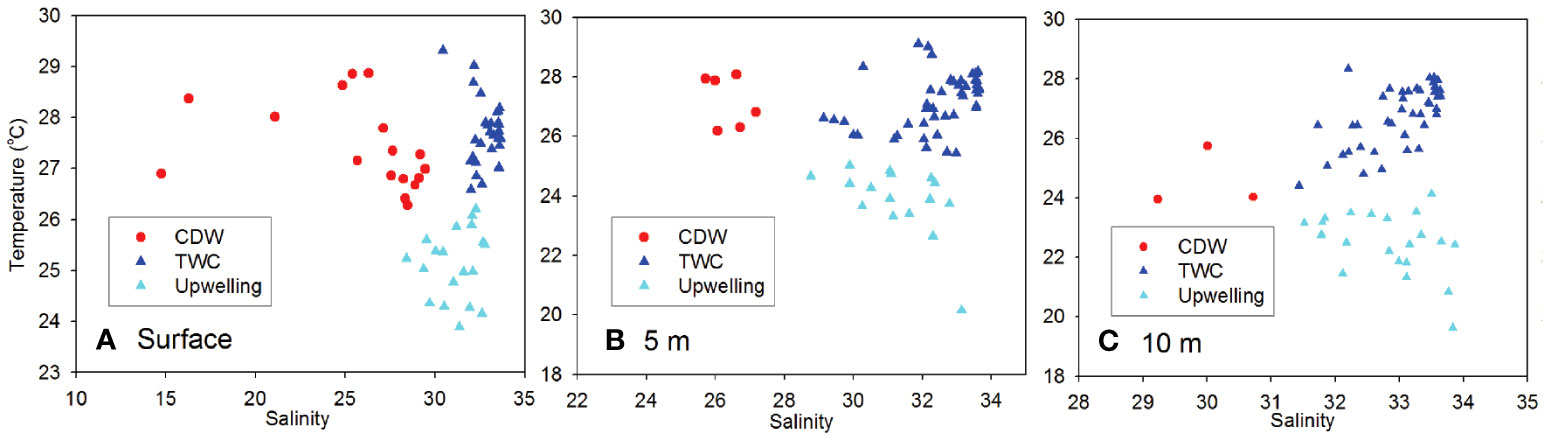
Figure 6 Temperature-salinity scatter plots at (A) surface, (B) 5-m and (C) 10-m layers off the CE in August 2013.
The observations exhibit a relatively large-scale bottom hypoxia in the northern area off the CE in summer (Figure 2F). Further analyses show that the northern hypoxia could be connected to the low-DO region in the central part of study area, which was distributed in a narrow zone along the isobaths of ~30-40 m. In general, the bottom hypoxia got more and more serious in a northward direction, with the decreased DO concentration and oxygen saturation (Figures 2F, L). Meanwhile, the bottom hypoxia-emerging depth was much shallower in the north than that in the south. This indicates the significantly spatial expansion of hypoxia in the shallow waters of Subei Shoal and Changjiang Bank, where water depth is less than 30 m. It is noteworthy that the DO-deficient waters were mainly concentrated on the western steep area of the submarine canyon and tended to be uplifted shoreward (Figures 3A–F). More importantly, a DO-deficient zone existed from the northeastern area off the CE to the coasts off Zhejiang Province in 10-m, 20-m and 30-m layers (Figures 2C–E), and even a nearshore low-DO zone could be observed from estuary to the area outside of the Zhoushan Island in surface and 5-m layers (Figures 2A, B). These findings indicate that the summer hypoxia off the CE presented to be spatially variable and heterogeneous in both of the horizontal and vertical directions. Moreover, statistical analyses show that the surface salinity corresponding to bottom hypoxic stations was mainly less than 30 (Figure 7A), whereas the bottom salinity within hypoxic zone was higher than 33 (Figure 7B). This suggests that the occurring area of bottom hypoxia and low DO off the CE approximately corresponded to a special salinity range (i.e., the region shaped by ~30 of salinity at surface and ~33 at bottom). In actuality, the surface isohaline of ~30 generally represented the CDW plume scope (Figure 2M), while the bottom isohaline of ~33 roughly corresponded the nearshore boundary of the bottom TWC (Figure 2R).
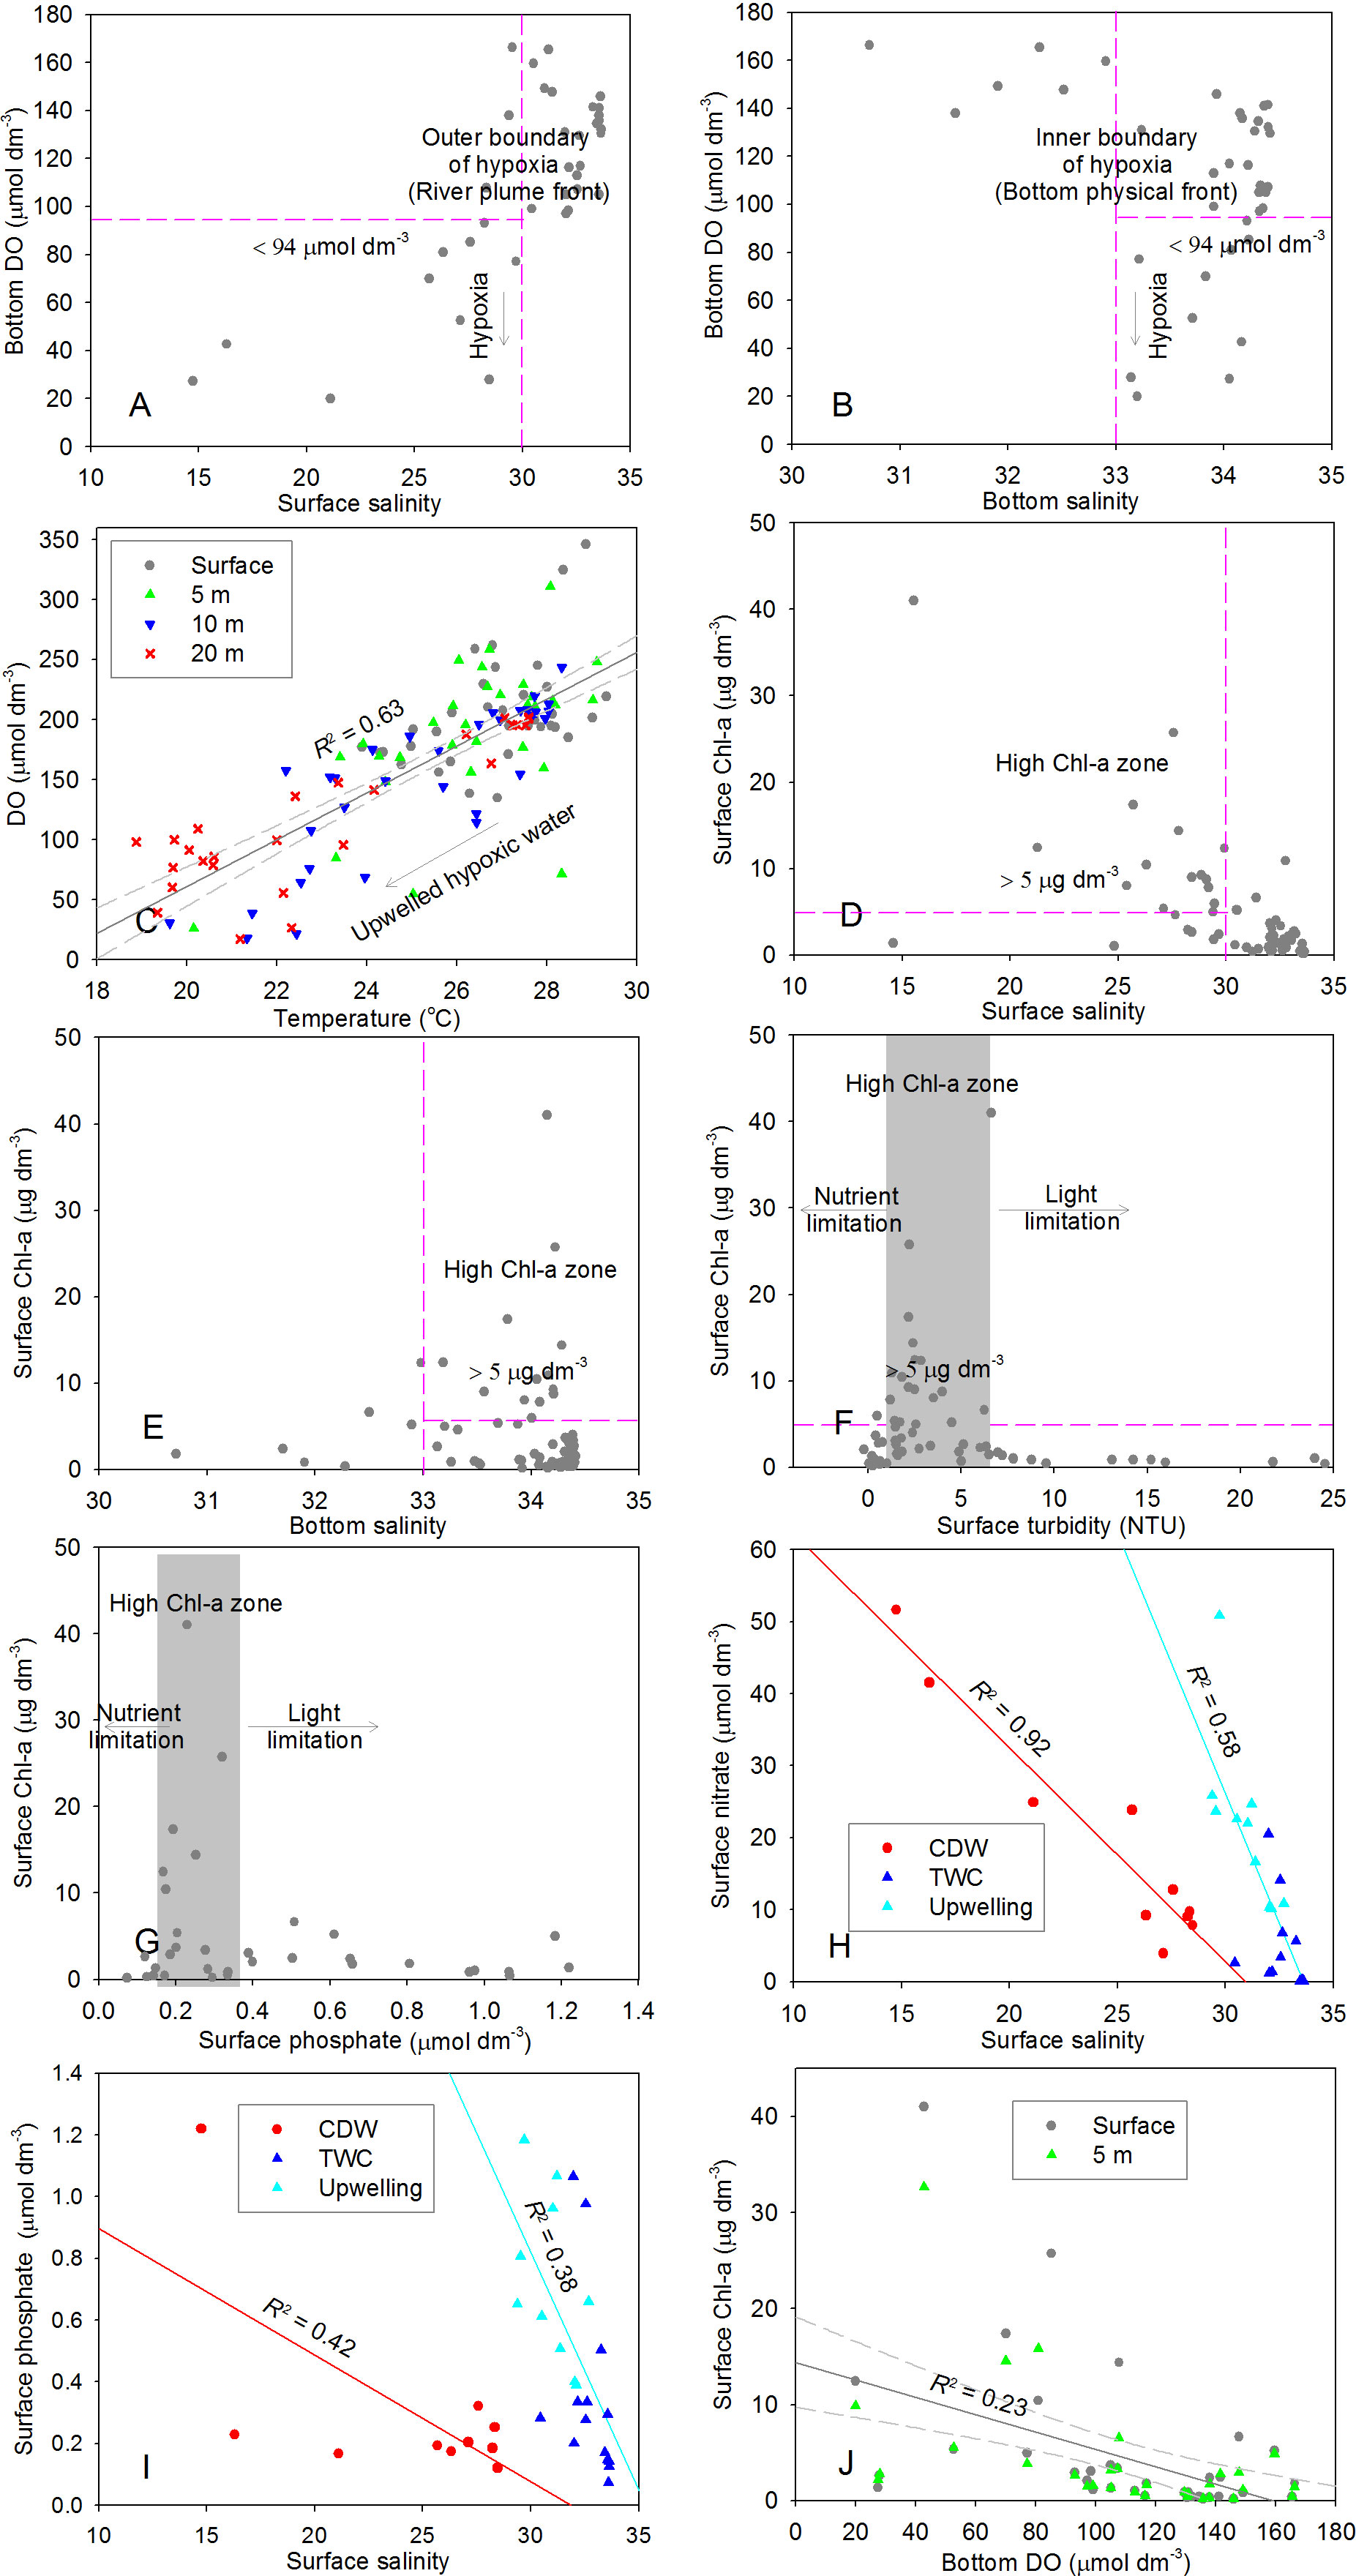
Figure 7 Relationships between the related variables off the CE in summer. (A) Bottom DO and surface salinity; (B) Bottom DO and bottom salinity; (C) DO and temperature in upper layers; (D) surface Chl-a and surface salinity; (E) surface Chl-a and bottom salinity; (F) surface Chl-a and surface turbidity; (G) surface Chl-a and surface phosphate (the relationship between surface Chl-a and nitrate shows similarity and hence is not shown); (H) surface nitrate and surface salinity in different masses; (I) surface phosphate and surface salinity in different masses; (J) surface Chl-a and bottom DO. The general threshold of hypoxia in panels a and b was operationally defined as a low DO concentration of < 94 μmol dm-3 (equivalent to ~3 mg dm-3), as also adopted by previous studies (Chen et al., 2007; Zhou et al., 2017); the grey area in (F, G) generally indicates the high Chl-a region with favorable light and nutrient conditions.
Previously, spatial variability and heterogeneity of oxygen-depleted waters were observed on the Texas-Louisiana continental shelf (Hetland and DiMarco, 2008), in the central California Current System (Cheresh and Fiechter, 2020), and off the Pearl River Estuary (Li et al., 2020). Specifically, un-uniform hypoxia on the Texas-Louisiana continental shelf was closely associated with the varying physical-biogeochemical processes (Hetland and DiMarco, 2008). Hypoxia off the Pearl River Estuary was found to heterogeneously occur in the coastal transition zone (i.e., neighboring the estuary and its adjacent shelf), where intense convergence emerged (Li et al., 2020). Here, we highlight the role of stratification, physical front, upwelling and localized high phytoplankton biomass in regulating the spatial variability and boundary of summer hypoxia off the CE.
Stratification is a critical factor that determines oxygen renewal in bottom waters. Due to the interaction of the surface CDW plume and the upwelled underlying TWC, strong stratification formed off the CE in summer, as indicated by the vertical distributions of hydrological variables in Figure 3. Based on the distribution patterns of stratification (in terms of the intensity and depth of halocline, thermocline and pycnocline) shown in Figure 8, we discuss here the influencing ways of stratification on oxygen depletion.
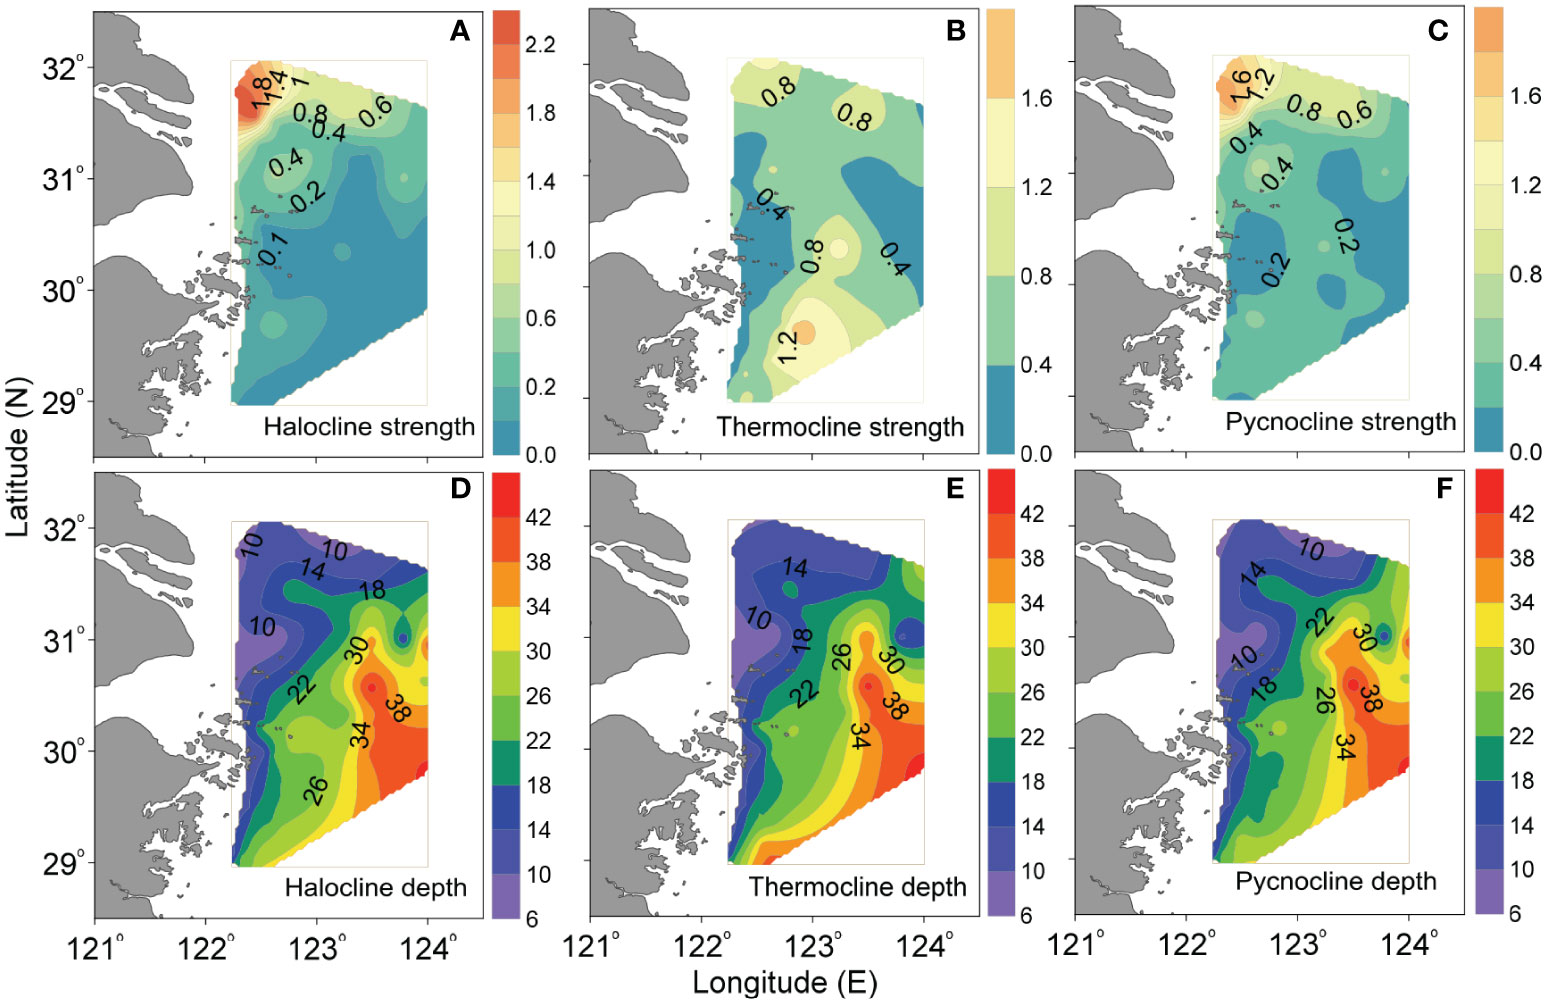
Figure 8 Horizontal distributions of the (A–C) strength of halocline (m-1), thermocline (°C m-1) and pycnocline (kg m-4), as well as (D–F) their depths (m) off the CE in August 2013.
Overall, intense halocline (>0.4 m-1) and pycnocline (> 0.4 kg m-4) were observed in the northwestern/northern part of study area (Figures 8A, C), being particularly strong in the northern shallow waters with depths of ~20-30 m. In this region, the surface and bottom layers were mainly occupied by the CDW plume and the TWC, respectively (Figures 2M, R). Meanwhile, relatively strong thermocline also existed in the northern part of study area, and there was a north-south oriented narrow zone with thermocline intensity > 0.4°C m-1 and pycnocline > 0.2 kg m-4 in the central area along the isobaths of ~30-40 m (Figures 8B, C). On the whole, the strength of stratification was more intense in the north than that in the south, especially for the halocline and pycnocline. Definitely, the region with intense stratification was in good agreement with the bottom hypoxic zone (Figures 2F, L). Statistical analyses further show that the bottom DO concentration and AOU presented a decreasing and increasing trend, respectively, as the intensity of stratification increased (Figure 9). These results exactly reflect the role of distribution and intensity of stratification in the bottom oxygen depletion.
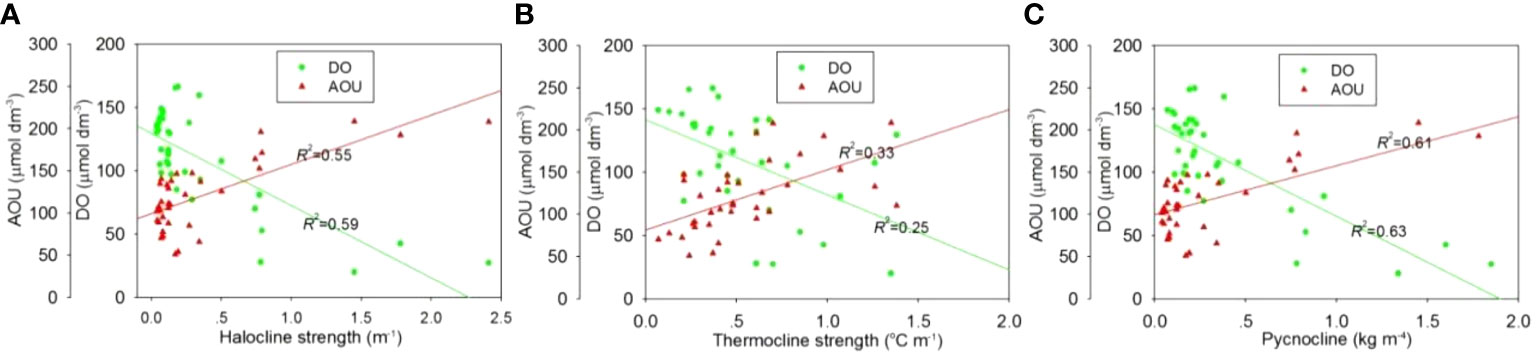
Figure 9 Bottom DO and AOU vs. strength of (A) halocline, (B) thermocline and (C) pycnocline off the CE in August 2013.
More importantly, we find that the depth of stratification was characterized by shoaling in the southeast-northwest oriented direction (i.e., the depth of stratification presented a shoaling trend from the southeast to northwest) (Figures 8D–F). This phenomenon was closely related to the upwelling, which could result in a shoreward uplift of halocline, thermocline and pycnocline along the steep area, as indicated by Figures 3G–O. Influenced by the northeastward shoaling of stratification, the upper boundary of hypoxic zone was also uplifted northwestward, leading to a low-DO area from the northeastern region off the CE to Zhejiang coasts in 5-m, 10-m, 20-m, and 30-m layers (Figures 2B–E). The positive relationship between DO and temperature in upper layers (Figure 7C) might further suggest the role of upwelling and associated shoaling stratification in regulating the vertical distribution of hypoxic zone. Actually, the shoreward upwelled DO-deficient waters could be evidently observed on the steep area along typical sections (Figures 3A–C), especially in the northern section A3, where the hypoxic waters could reach the layers above 5-m depth. Notably, the oxycline (Figures 3A–C) well correlated with stratification depth (Figures 3G–O). Consequently, the depth of stratification and its spatial variability, which were mainly shaped by river plume and upwelling interaction, play a dominated role in determining the upper boundary of the hypoxic zone. Previously, the role of stratification on hypoxia formation off the CE has been argued (e.g., Wei et al., 2015; Zhu et al., 2016). Here we emphasize the influencing ways of stratification together with upwelling on controlling the spatially variable hypoxia, including its distribution, intensity and depth.
The pronounced sharp gradients existed off the CE concerning temperature, salinity, density and turbidity (Figures 2M–AJ), which were mainly related to the CDW, TWC and upwelling, as well as their interactions. Here, based on the horizontal distributions of salinity and density gradients off the CE (Figure 10), the influence of physical fronts on the hypoxic zone was examined.
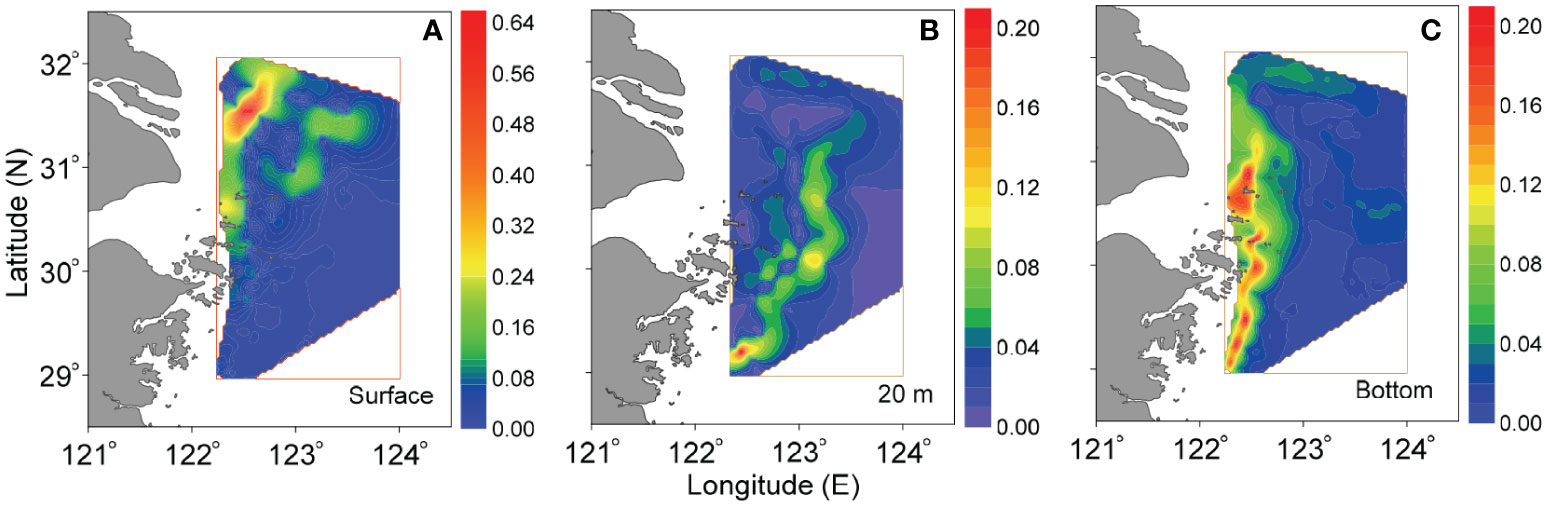
Figure 10 Horizontal distributions of density gradient (kg m-3 km-1) at (A) surface, (B) 20-m and (C) bottom layers off the CE in August 2013 (the distributions of salinity gradient show similarity and hence are not shown).
The surface sharp gradients (Figure 10A) in the northern part of study area clearly indicate the front around the CDW plume, which was approximately consistent with the isohaline of ~30 and isodense of ~20 (Figures 2M, Y). The expansion of this surface front might determine the general scope of bottom hypoxic zone off the CE (Figure 2F). This could be further confirmed by the relationship between bottom DO and surface salinity (Figure 7A). A south-north oriented narrow front with high gradient existed in the central area in middle layer of 20 m (Figure 10B); its location was approximately in accordance with the submarine canyon, where the upwelled TWC significantly occurred (Figures 3G–O). This middle-layer front might control the seaward expansion of oxygen-depleted waters, and were conducive to forming its outer boundary (Figure 2D). In fact, the connection of fronts in different middle layers could constitute the entire seaward-inclined stratification near the upper boundary of upwelling (Figures 3J–O). As a result, the oxycline with a seaward declination was shaped above the hypoxic zone (Figures 3A–C); the outer boundary of oxygen-depleted cube was spatially characterized by offshore moving in a downward direction (i.e., from upper layer to bottom), as suggested by Figures 2C–F and Figures 3A–C. At bottom, the noticeable front, which was located along the nearshore from estuary to Zhejiang coasts (Figure 10C), almost corresponded to the shoreward boundary of the TWC (i.e., the isohaline of ~33, isotherm of ~21 and isodense of ~23) (Figures 2R, X, AD). In actuality, the bottom physical front was mainly controlled by tidal mixing (Wu and Wu, 2018). It could set a boundary (near the isohaline of ~33, Figure 2R) separating the well-mixed (turbid) nearshore waters and stratified (clear) offshore waters, as revealed by (Wang et al. 2019a; Wang et al. 2019b). Hence, the bottom front might constrain the shoreward expansion of DO-deficient waters, shaping the inner boundary of bottom hypoxia (Figure 2F). This was responsible for high salinity (>33) within bottom hypoxic zone (Figure 7B). Consequently, the space between the surface CDW plume front and bottom physical front may provide a venue for the occurrence of hypoxia; the surface CDW plume front and bottom physical front approximately determined the seaward and shoreward limit of the reach of bottom hypoxic zone, respectively. Notably, the surface CDW front tended to shrink towards the shore when it expanded southward from the northern region off the CE; under this background, the space between the surface CDW plume front and bottom physical front was wide in the north and narrow in the south. This is responsible for the large-scale hypoxia in the northern area off the CE and a narrowed DO-deficient zone in the southern area (Figure 2F).
Remarkably, the bottom physical front (Figure 10C) was also generally consistent with the location of turbidity front in upper layers (Figures 2AE–AG). Statistical analyses further show that low turbidity (< 5 NTU) in upper layers almost occurred in the region with bottom salinity > 33 (Figure 11A). In actuality, the surface turbidity and bottom salinity fronts with sharp gradients both approximately occurred near the isobath of ~20 m, as indicated by the relationship between surface turbidity (bottom salinity) and water depth (Figure 11B). Undoubtedly, the existence of surface turbidity front could lead to different light conditions on both sides of the front, which was essential for primary production regime and thereby bottom hypoxia.
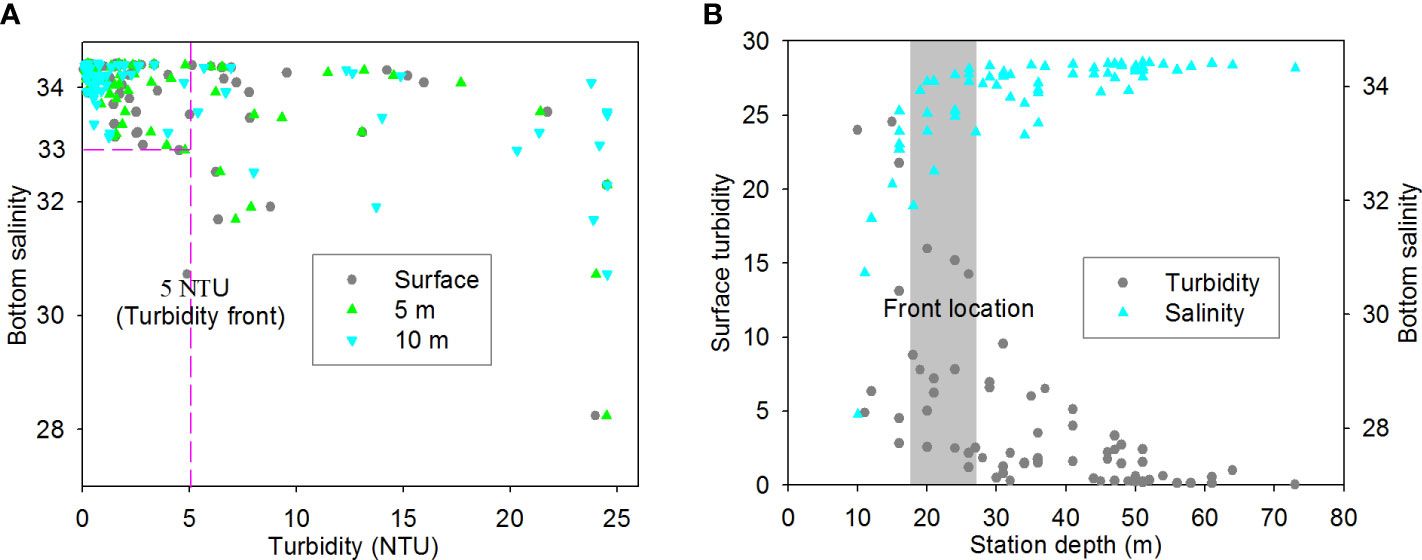
Figure 11 Relationships between (A) bottom salinity and upper-layer turbidity and between (B) surface turbidity (bottom salinity) and station depth off the CE in August 2013. The grey area in panel b generally indicates the front location, where surface turbidity and bottom salinity significant changed with water depth.
The decomposition of organic matter, which is produced by biological activities, is among the most frequently discussed processes inducing estuarine and/or coastal hypoxia (Zhu et al., 2011; Diaz et al., 2019). Based on the conspicuous spatial variability shown by the measured parameters off the CE, we further demonstrate the biogeochemical driver of oxygen depletion and its role in shaping the scope and heterogeneity of hypoxia.
As shown in Figures 4E–H, Chl-a exhibited spatial variability off the CE, and its concentration was much higher in the north than that in the south in upper layers. Generally, surface high Chl-a value (> 5 μg dm-3) mainly occurred at stations with surface salinity less than 30 (Figure 7D), while the bottom salinity corresponding to surface high Chl-a was higher than 33 (Figure 7E). This relationship was similar with that between bottom DO and salinity (Figures 7A, B). It was possible that the outer and inner boundary of surface high Chl-a area was mainly determined by surface isohaline of ~30 and bottom isohaline of ~33, respectively. Statistical analyses further show that surface high Chl-a values mainly formed at stations with appropriate turbidity (Figure 7F) and nutrient conditions (Figure 7G). Actually, in the turbid (Figure 2AE) and eutrophic (Figure 4A) inshore area affected by the CDW, light might be the primary limiting factor of phytoplankton growth and productivity. The seaward boundary of this inshore area was primary controlled by the surface turbidity front (Figure 2AE), whose location was approximately consistent with the tidal mixing-related bottom physical front (Figure 10C). In contrast, the surface-trapped CDW with abundant nutrients (Figures 4A and 5A) can reach a much farther place away from the estuary, resulting in an offshore plume front (Figures 2M, 3G). Due to favorable light and nutrient conditions, phytoplankton tends to be situated in the transitional space between the surface and bottom fronts, forming high Chl-a center within this region (Figures 4E–G, 5D–F). Exactly, this space results from the spatial separation/decoupling of surface CDW plume front and turbidity front, as indicated by vertical distributions of salinity (Figures 3G, H) and turbidity (Figures 3P, Q). Previously, Li et al. (2021b) also revealed that the sediment and river plume fronts off the CE significantly control the spatial pattern of Chl-a. Notably, because of the dominant northeastward expansion of the nutrient-rich CDW, much higher Chl-a concentration was observed in the northern transitional area off the CE (Figures 4E, F).
Moreover, the upwelling, which was mainly concentrated on the steep region off the CE (Figures 3J–L), might also contribute to upper-layer nutrient levels in this transitional region, and thus favored primary production by interacting with the surface CDW plume. This could be further indicated by the relationship between nutrient and salinity at surface (Figures 7H, I). Although nutrient concentrations were negatively correlated with salinities in either the CDW-dominated area or the TWC-influenced region in surface layer, the nutrients within the upwelling were much higher than that near the outer CDW boundary (i.e. the region of ~30 isohaline) (Figures 7H, I). This result demonstrates that the upwelling from the bottom TWC could bring additional nutrients to upper layers. Previously, some studies have also confirmed the nutrient source from upwelling off the CE by using observations or simulations (Yang et al., 2013; Xu et al., 2018). This process would play an important role in maintaining primary production when rapid nutrient consumption occurred in upper layers, especially near the CDW plume front. Due to horizontal transport along with the CDW plume and vertical delivery by upwelling, the satisfied nutrient levels might be achieved for phytoplankton growth and reproduction.
Based on above analyses, it can be inferred that the spatial separation/decoupling of surface CDW plume front and turbidity front combines upwelling to be responsible for surface phytoplankton blooming. Biological respiration under high phytoplankton biomass could result in the drawdown of bottom DO. Overall, the more serious bottom hypoxia corresponded to the higher Chl-a region in the northern part of study area, and the scope of bottom hypoxic zone in the north (Figures 2F, L) was in agreement with that of surface high-Chl-a region (Figure 4E). In fact, the bottom low-DO core in the southern area (Figures 2F, L) was also roughly in consistent with the surface high-Chl-a center at station A11-4 (Figure 4E). Consequently, the intensity and scope of high-Chl-a region generally influenced the strength and range of hypoxic zone off the CE, respectively. As revealed by statistical analyses, bottom DO concentration decreased as Chl-a increased in upper layers (Figure 7J). Nevertheless, we further note that the lowest DO did not exactly correspond to the highest Chl-a value (Figure 7J), as previously reported by Zhou et al. (2020) and Wei et al. (2021b). This is associated with the redistribution of sinking POC (particulate organic matter) under lateral transport and convergence, which may potentially influence the locations of considerable oxygen consumption and lead to the vertical decoupling of bottom hypoxic center and surface high phytoplankton biomass (Wei et al., 2021b). In fact, this process can also enhance the spatial heterogeneity of hypoxic intensity within the transitional space between the surface and bottom fronts. These results confirm the influence of in-situ biological production on the spatial variability of DO and imply a close linkage between surface productivity and bottom hypoxia off the CE. Therefore, the joint effects of turbidity and river plume fronts off the CE play an important role in dominating the spatial pattern of Chl-a and thereby bottom hypoxia.
Using multi-disciplinary observational data in the summer of 2013, this study investigated the mechanisms controlling the spatial variability and heterogeneity of hypoxia off the CE, with comprehensive considerations of multiple factors related to both physical and biogeochemical processes. We contextualize the relative contribution of drivers to the spatially variable hypoxia in a conceptual diagram (Figure 12).
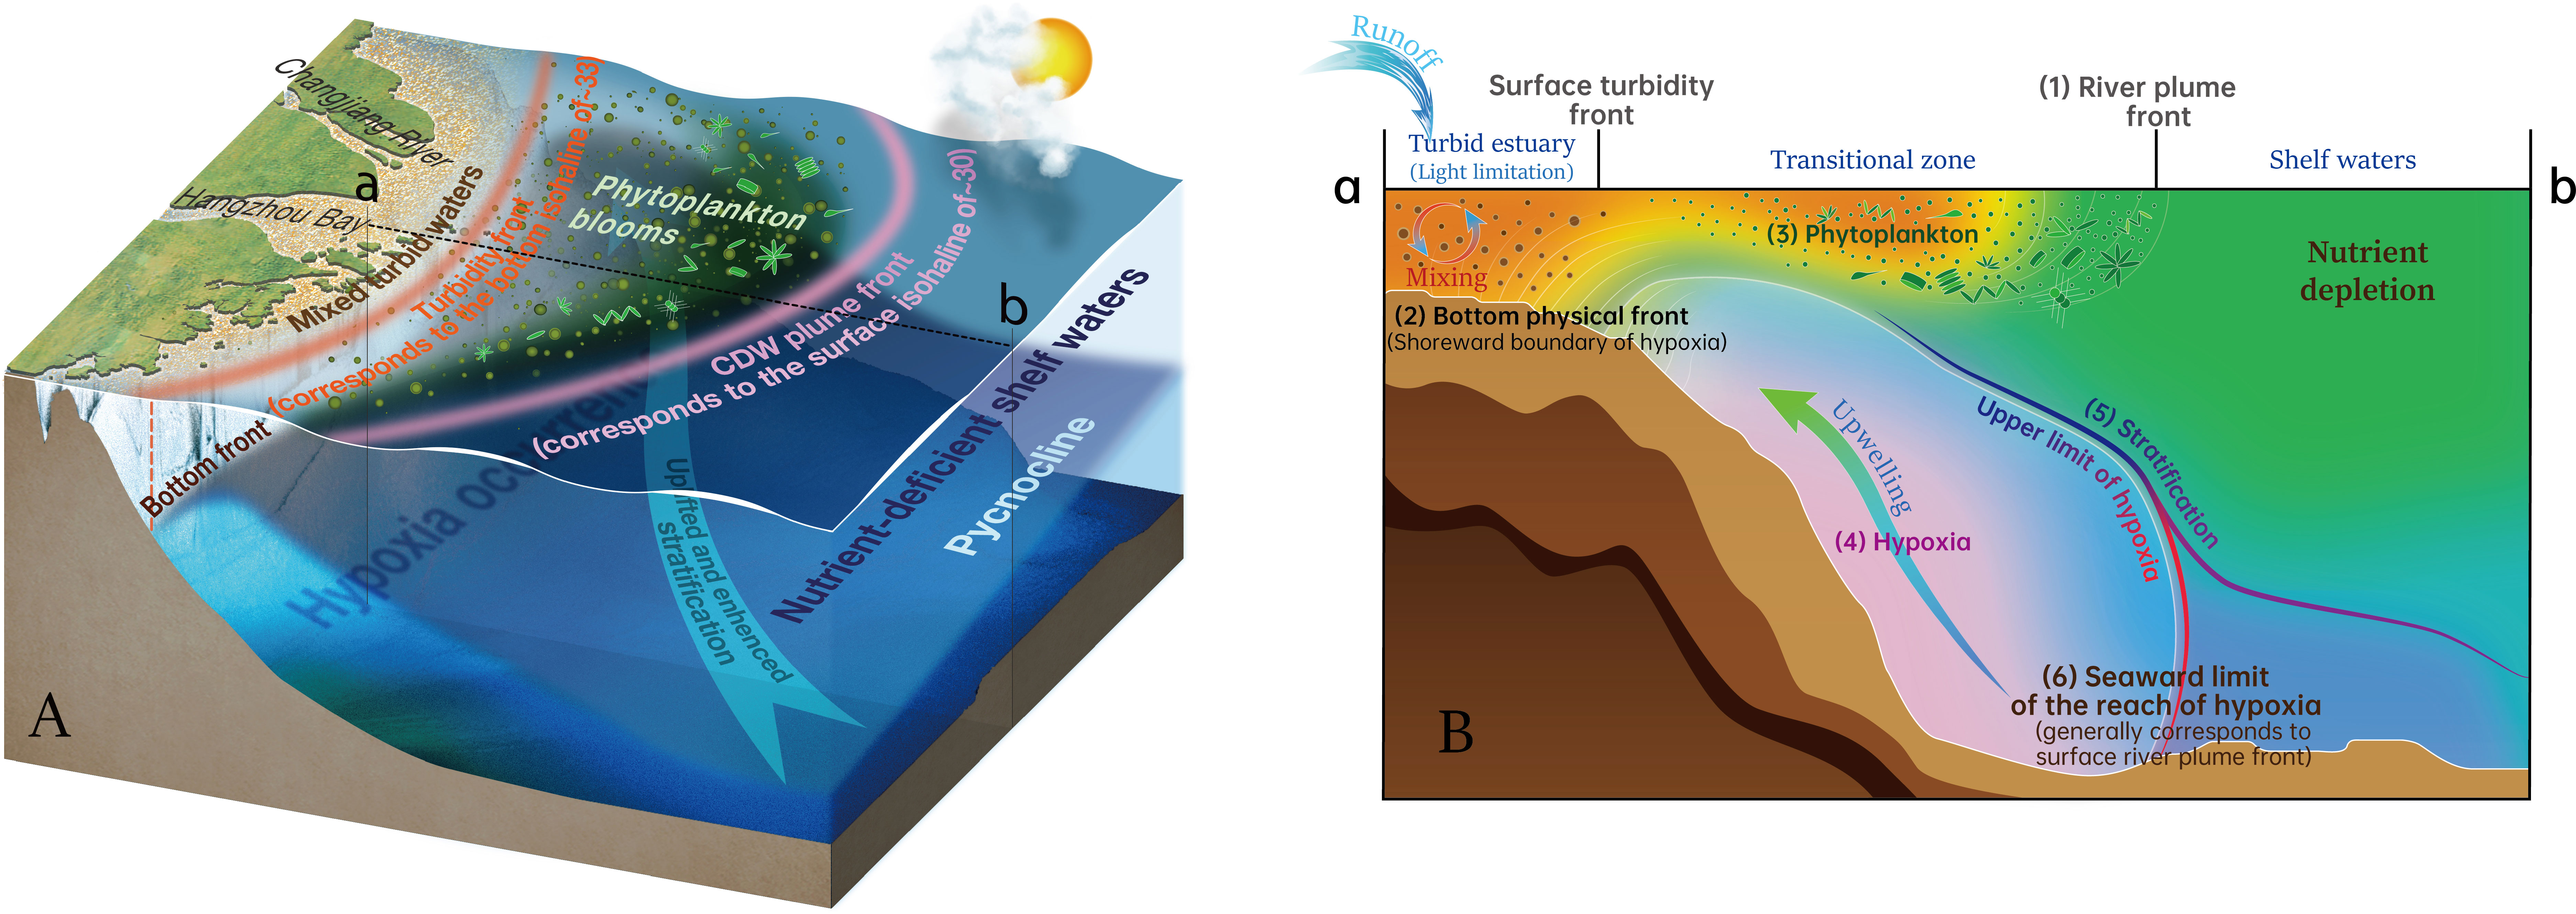
Figure 12 Conceptual diagram of spatially variable hypoxia shaped by multiple controls off the CE in summer, illustrating the (A) three-dimensional and (B) sectional (along the section ab in panel A) regimes. The indicated processes in panel B: (1) the siginificant surface front forms around the CDW plume; (2) the bottom physical front corresponding to the shoreward boundary of bottom saline water under tidal mixing generally determines the location of surface turbidity front and the inner boundary of bottom hypoxia; (3) phytoplankton blooms tend to be situated in the transitional space between the spatially separated dual fronts of surface river plume and turbidity, due to nutrient availability (contributed by the plume and coastal upwelling) and improved light conditions; (4) hypoxic waters are mainly concentrated on the steep region off the CE and tend to be uplifted shoreward; (5) the depth of stratification and its spatial variability, which are mainly shaped by river plume and upwelling interaction, play a dominated role in determining the upper boundary of the hypoxic zone; (6) the surface river plume front approximately corresponds to the seaward limit of the reach of bottom hypoxia.
1) The summer hypoxia off the CE occurred with significant geographical features, presenting to be spatially variable and heterogeneous in both of the horizontal and vertical directions. Oxygen-deficient waters were mainly concentrated on the steep area of the submarine canyon and tended to be uplifted shoreward. The bottom hypoxia got more and more serious in a northward direction, expanding toward the shallow region of the Subei Shoal and the Changjiang Bank.
2) The stratification together with upwelling influenced the hypoxia in multiple ways, including distribution, intensity and depth. The region with intense stratification was in good agreement with the bottom hypoxic zone, and the bottom DO was negatively correlated with the stratification intensity. Upwelling could redistribute low-oxygen waters closer to shore and lead to the shoaling of hypoxia. The depth of stratification and its spatial variability, which were mainly shaped by river plume and upwelling interaction, played a dominated role in determining the upper boundary of the hypoxic zone.
3) The surface CDW plume front (i.e. the isohaline of ~30) and bottom physical front (i.e. the isohaline of ~33) approximately determined the seaward and shoreward limit of the reach of bottom hypoxic zone, respectively. The front in middle layers controled the seaward extent of hypoxic waters, and was conducive to forming the outer hypoxic boundary downward from the upper layers.
4) A close linkage existed between surface biological production and bottom spatially-variable hypoxia. The spatial separation/decoupling of surface CDW plume front and turbidity front (generally corresponding to the bottom physical front) combined with the upwelling was responsible for surface phytoplankton blooming and thus bottom hypoxia. The intensity and scope of high-Chl-a region influenced the strength and range of hypoxic zone, respectively.
Overall, the stratification, upwelling, river plume, front, and localized high phytoplankton biomass combined to shape the spatial morphology, scope and strength of variable hypoxia off the CE. Note that these hydrodynamic/biogeochemical processes were typically coupled and inseparable during phytoplankton blooming and hypoxia occurrence, suggesting the further need of establishing three-dimensional model for quantitatively investigating and predicting the highly variable hypoxia off the CE in future studies.
The original contributions presented in the study are included in the article/supplementary material. Further inquiries can be directed to the corresponding authors.
QW: Data curation, Conceptualization, Formal analysis, Supervision, Writing - original draft, Writing - review and editing. YY, SS, YZ, JS, and CL: Resources, Data curation. BW: Writing - review and editing. All authors listed have made a substantial, direct, and intellectual contribution to the work, and approved it for publication.
This research was supported by the National Natural Science Foundation of China (NSFC) (Grants 41876085 and 41876075) and the Basic Scientific Fund of the National Public Research Institutes of China (Grant 2020S03).
Data and samples were collected onboard of R/V Science No. 3 implementing the open research cruise NORC2013-02 supported by NSFC Shiptime Sharing Project. We are grateful to the survey team and crew for their help and cooperation during the field investigation.
The authors declare that the research was conducted in the absence of any commercial or financial relationships that could be construed as a potential conflict of interest.
All claims expressed in this article are solely those of the authors and do not necessarily represent those of their affiliated organizations, or those of the publisher, the editors and the reviewers. Any product that may be evaluated in this article, or claim that may be made by its manufacturer, is not guaranteed or endorsed by the publisher.
Bai X. Z., Hu D. X. (2004). A numerical study on seasonal variations of the Taiwan warm current. Chin. J. Oceanol. Limnol. 22 (3), 278–285.
Belkin I. M., O’Reilly J. E. (2009). An algorithm for oceanic front detection in chlorophyll and SST satellite imagery. J. Mar. Syst. 78 (3), 319–326. doi: 10.1016/j.jmarsys.2008.11.018
Bianchi T. S., DiMarco S. F., Cowan J. H. Jr., Hetland R. D., Chapman P., Day J. W., et al. (2010). The science of hypoxia in the northern gulf of Mexico: A review. Sci. Total Environ. 408, 1471–1484. doi: 10.1016/j.scitotenv.2009.11.047
Bograd S. J., Castro C. G., Di Lorenzo E., Palacios D. M., Bailey H., Gilly W., et al. (2008). Oxygen declines and the shoaling of the hypoxic boundary in the California current. Geophys. Res. Lett. 35, L12607. doi: 10.1029/2008GL034185
Breitburg D., Levin L. A., Oschlies A., Grégoire M., Chavez F. P., Conley D. J., et al. (2018). Declining oxygen in the global ocean and coastal waters. Science 359, 1–11. doi: 10.1126/science.aam7240
Cai W. J., Huang W. J., Lutherlll G. W., Pierrot D., Li M., Testa J., et al. (2017). Redox reactions and weak buffering capacity lead to acidification in the Chesapeake bay. Nat. Commun. 8 (369), 1–12. doi: 10.1038/s41467-017-00417-7
Cai W. J., Hu X. P., Huang W. J., Murrell M. C., Lehrter J. C., Lohrenz S. E., et al. (2011). Acidification of subsurface coastal waters enhanced by eutrophication. Nat. Geosci. 4, 766–770. doi: 10.1038/ngeo1297
Chai C., Yu Z., Song X., Cao X. (2006). The status and characteristics of eutrophication in the Yangtze river (Changjiang) estuary and the adjacent East China Sea, China. Hydrobiologia 563 (1), 313–328. doi: 10.1007/s10750-006-0021-7
Chan F., Barth J. A., Kroeker K. J., Lubchenco J., Menge B. A. (2019). The dynamics and impact of ocean acidification and hypoxia: Insights from sustained investigations in the northern California current Large marine ecosystem. Oceanography 32 (3), 62–71. doi: 10.5670/oceanog.2019.312
Chan F., Barth J. A., Lubchenco J., Kirincich A., Weeks H., Peterson W. T., et al. (2008). Emergence of anoxia in the California current large marine ecosystem. Science 319, 920. doi: 10.1126/science.1149016
Chang P. H., Isobe A. (2003). A numerical study on the Changjiang diluted water in the yellow and East China Sea. J. Geophys. Res. 108 (C9), 3299. doi: 10.1029/2002JC001749
Chen C.-C., Gong G.-C., Shiah F.-K. (2007). Hypoxia in the East China Sea: One of the largest coastal low-oxygen areas in the world. Maine Environ. Res. 64, 399–408. doi: 10.1016/j.marenvres.2007.01.007
Chen J., Li D., Chen B., Hu F., Zhu H., Liu C. (1999). The processes of dynamic sedimentation in the Changjiang estuary. J. Sea Res. 41 (1), 129–140. doi: 10.1016/S1385-1101(98)00047-1
Chen X., Shen Z., Li Y., Yang Y. (2015). Tidal modulation of the hypoxia adjacent to the Yangtze estuary in summer. Mar. pollut. Bull. 100 (1), 453–463. doi: 10.1016/j.marpolbul.2015.08.005
Chen C.-C., Shiah F.-K., Gong G.-C., Chen T.-Y. (2021). Impact of upwelling on phytoplankton blooms and hypoxia along the Chinese coast in the East China Sea. Mar. pollut. Bull. 167, 112288. doi: 10.1016/j.marpolbul.2021.112288
Cheresh J., Fiechter J. (2020). Physical and biogeochemical drivers of alongshore pH and oxygen variability in the California current system. Geophys. Res. Lett. 47, e2020GL089553. doi: 10.1029/2020GL089553
Chi L. B., Song X. X., Yuan Y. Q., Wang W. T., Zhou P., Fan X., et al. (2017). Distribution and key influential factors of dissolved oxygen off the Changjiang river estuary (CRE) and its adjacent waters in China. Marine. pollut. Bull. 125 (1–2), 440–450. doi: 10.1016/j.marpolbul.2017.09.063
Cui Y. S., Wu J. X., Ren J., Xu J. (2019). Physical dynamics structures and oxygen budget of summer hypoxia in the Pearl river estuary Limnol. Oceanogr. 64, 131–148. doi: 10.1002/lno.11025
Diaz R. J., Rosenberg R. (2008). Spreading dead zones and consequences for marine ecosystems. Science 321 (5891), 926–929. doi: 10.1126/science.1156401
Diaz R. J., Rosenberg R., Sturdivant K. (2019). “Hypoxia in estuaries and semi-enclosed seas,” in Ocean deoxygenation: Everyone’s problem -causes, impacts, consequences and solutions. Eds. Laffoley D., Baxter J. M. (Gland, Switzerland: IUCN), 85–102.
Ding R., Huang D., Xuan J., Mayer B., Zhou F., Pohlmann T. (2016). Cross-shelf water exchange in the East China Sea as estimated by satellite altimetry and in situ hydrographic measurement. J. Geophys. Res. Oceans 121, 7192–211. doi: 10.1002/2016JC011972
Dussin R., Curchitser E. N., Stock C. A., Oostende N. V. (2019). Biogeochemical drivers of changing hypoxia in the California current ecosystem. Deep-Sea Res. II, 169–170. doi: 10.1016/j.dsr2.2019.05.013
Fennel K., Testa J. M. (2019). Biogeochemical controls on coastal hypoxia. Annuual Rev. Mar. Sci. 11, 105–130. doi: 10.1146/annurev-marine-010318-095138
García H. E., Gordon L. I. (1992). Oxygen solubility in seawater: Better fitting equations. Limnol. Oceanogr. 37 (6), 1307–1312. doi: 10.4319/lo.1992.37.6.1307
Ge R. F., Qiao F. L., Yu F., Jiang Z. X., Guo J. S. (2003). A method for calculating thermocline characteristic elements in shelf sea area–quasi-step function approximation method. Adv. Mar. Sci. 21 (4), 393–400.
Ge J., Torres R., Chen C., Liu J., Xu Y., Bellerby R., et al. (2020). Influence of suspended sediment front on nutrients and phytoplankton dynamics off the Changjiang estuary: A FVCOM-ERSEM coupled model experiment. J. Mar. Syst. 204, 103292. doi: 10.1016/j.jmarsys.2019.103292
Grantham B. A., Chan F., Nielsen K. J., Fox D. S., Barth J. A., Huyer A., et al. (2004). Upwelling-driven nearshore hypoxia signals ecosystem and oceanographic changes in the northeast pacific. Nature 429, 749–754. doi: 10.1038/nature02605
Große F., Fennel K., Zhang H., Laurent A. (2020). Quantifying the contributions of riverine vs. oceanic nitrogen to hypoxia in the East China Sea. Biogeosciences 17, 2701–2714. doi: 10.5194/bg-17-2701-2020
Hao J. J., Chen Y. L., Wang F., Lin P. F. (2012). Seasonal thermocline in the China seas and northwestern pacific ocean. J. Geophys. Res. 117, C02022. doi: 10.1029/2011JC007246
Helly J. J., Levin L. A. (2004). Global distribution of naturally occurring marine hypoxia on continental margins. Deep-Sea Res. I 51, 1159–1168. doi: 10.1016/j.dsr.2004.03.009
Hetland R. D., DiMarco S. F. (2008). How does the character of oxygen demand control the structure of hypoxia on the Texas-Louisiana continental shelf? J. Mar. Syst. 70, 49–62. doi: 10.1016/j.jmarsys.2007.03.002
Hietanen S., Jäntti H., Buizert C., Jürgens K., Labrenz M., Voss M., et al. (2012). Hypoxia and nitrogen processing in the Baltic Sea water column. Limnol. Oceanogr. 57 (1), 325–337. doi: 10.4319/lo.2012.57.1.0325
Howarth R., Chan F., Conley D. J., Garnier J., Doney S. C., Marino R., et al. (2011). Coupled biogeochemical cycles: Eutrophication and hypoxia in temperate estuaries and coastal marine ecosystems. Front. Ecol. Environ. 9, 18–26. doi: 10.1890/100008
Hu F. X., Hu H., Gu G. C., Su C., Gu X. J. (1995). Salinity fronts in the Changjiang river estuary (in Chinese). Oceanol. Limnol. Sin. Suppl. 26, 23–31.
Kessouri F., McWilliams J. C., Bianchi D., Sutula M., Renault L., Deutsch C., et al. (2021). Coastal eutrophication drives acidification, oxygen loss, and ecosystem change in a major oceanic upwelling system. PNAS 118 (21), e2018856118. doi: 10.1073/pnas.2018856118
Köhn E. E., Münnich M., Vogt M., Desmet F., Gruber N. (2022). Strong habitat compression by extreme shoaling events of hypoxic waters in the Eastern pacific. J. Geophys. Res.: Oceans 127, e2022JC018429. doi: 10.1029/2022JC018429
Lie H. J., Cho C. H., Lee J. H., Lee S. (2003). Structure and eastward extension of the Changjiang river plume in the East China Sea. J. Geophys. Res. 108 (C3), 3077. doi: 10.1029/2001JC001194
Li D., Gan J. P., Hui R., Liu Z. Q., Yu L. Q., Lu Z. M., et al. (2020). Vortex and biogeochemical dynamics for the hypoxia formation within the coastal transition zone off the Pearl river estuary. J. Geophys. Res.: Oceans 125, e2020JC016178. doi: 10.1029/2020JC016178
Li D., Gan J., Hui C., Yu L., Liu Z., Lu Z., et al. (2021a). Spatiotemporal development and dissipation of hypoxia induced by variable wind-driven shelf circulation off the Pearl river estuary: Observational and modeling studies. J. Geophys. Res.: Oceans 126, e2020JC016700. doi: 10.1029/2020JC016700
Li W., Ge J., Ding P., Ma J., Glibert P. M., Liu D. (2021b). Effects of dual fronts on the spatial pattern of chlorophyll-a concentrations in and off the Changjiang river estuary. Estuaries Coasts 44, 1408–1418. doi: 10.1007/s12237-020-00893-z
Li Z., Song S. Q., Li C. W. (2016). Distribution of chlorophyll a and its correlation with the formation of hypoxia in the Changjiang river estuary and its adjacent waters. Mar. Sci. 40 (2), 1–10. doi: 10.11759/hykx20150518001
Li Z., Song S. Q., Li C. W., Yu Z. M. (2017). Preliminary discussion on the phytoplankton assemblages and its response to the environmental changes in the Changjiang (Yangtze) river estuary and its adjacent waters during the dry season and the wet season. Acta Oceanol. Sin. 39 (10), 124–144. doi: 10.3969/j.issn.0253-4193.2017.10.011
Li Z., Song S. Q., Li C. W., Yu Z. M. (2018). The sinking of the phytoplankton community and its contribution to seasonal hypoxia in the Changjiang (Yangtze river) estuary and its adjacent waters. Estuar. Coast. Shelf Sci. 208, 170–179. doi: 10.1016/j.ecss.2018.05.007
Li H. M., Tang H. J., Shi X. Y., Zhang C. S., Wang X. L. (2014). Increased nutrient loads from the Changjiang (Yangtze) river have led to increased harmful algal blooms. Harmful Algae 39, 92–101. doi: 10.1016/j.hal.2014.07.002
Liu Z., Gan J., Wu H., Hu J., Cai Z., Deng Y. (2021). Advances on coastal and estuarine circulations around the Changjiang estuary in the eecent decade–2020). Front. Mar. Sci. 8. doi: 10.3389/fmars.2021.615929
Liu K. K., Tang T. Y., Gong G. C., Chen L. Y., Shiah F. K. (2000). Cross-shelf and along-shelf nutrient fluxes derived from flow fields and chemical hydrography observed in the southern East China Sea off northern Taiwan. Cont. Shelf Res. 20, 493–523. doi: 10.1016/S0278-4343(99)00083-7
Li D. J., Zhang J., Huang D. J., Wu Y., Liang J. (2002). Oxygen depletion off the Changjiang (Yangtze river) estuary. Sci. China Ser. D-Earth Sci. 45, 1137–1146. doi: 10.1360/02yd9110
Li S., Zhang Z., Zhou M., Wang C., Wu H., Zhong Y. (2022). The role of fronts in horizontal transports of the Changjiang river plume in summer and the implications for phytoplankton blooms. J. Geophys. Res.: Oceans 127, e2022JC018541. doi: 10.1029/2022JC018541
Luan H. L., Ding P. X., Wang Z. B., Ge J. Z., Yang S. L. (2016). Decadal morphological evolution of the Yangtze estuary in response to river input changes and estuarine engineering projects. Geomorphology 265, 12–23. doi: 10.1016/j.geomorph.2016.04.022
Luo X., Wei H., Fan R., Liu Z., Zhao L., Lu Y. (2018). On influencing factors of hypoxia in waters adjacent to the Changjiang estuary. Cont. Shelf Res. 152, 1–13. doi: 10.1016/j.csr.2017.10.004
Luo Y. Y., Yu G. Y. (1998). Numerical studies of wind and TWC driven upwelling in coastal areas of the East China Sea. J. Ocean Univ. Qingdao 28 (4), 537–542.
Lü X. G., Qiao F. L., Xia C. S., Zhu J. R., Yuan Y. L. (2006). Upwelling off Yangtze river estuary in summer. J. Geophys. Res. 111, C11S08. doi: 10.1029/2005JC003250
Mao H.-L., Kan T.-C., Lan S.-F. (1963). A preliminary study of the Yangtze diluted water and its mixing processes. Oceanol. Limnol. Sin. 5 (3), 183–206.
Meng Q., Zhang W., Zhou F., Liao Y., Yu P., Tang Y., et al. (2022a). Water oxygen consumption rather than sediment oxygen consumption drives the variation of hypoxia on the East China Sea shelf. J. Geophys. Res.: Biogeosci. 127, e2021JG006705. doi: 10.1029/2021JG006705
Meng Q., Zhou F., Ma X., Xuan J., Zhang H., Wang S., et al. (2022b). Response process of coastal hypoxia to a passing typhoon in the East China Sea. Front. Mar. Sci. 9. doi: 10.3389/fmars.2022.892797
Milliman J. D., Farnsworth K. L. (2011). River discharge to the coastal ocean: A global synthesis (Cambridge: Cambridge University Press).
Ni X. B., Huang D. J., Zeng D. Y., Zhang T., Li H. L., Chen J. F. (2016). The impact of wind mixing on the variation of bottom dissolved oxygen off the Changjiang estuary during summer. J. Mar. Syst. 154, 122–130. doi: 10.1016/j.jmarsys.2014.11.010
Ning X. R., Shi J. X., Cai Y. M., Liu C. G. (2004). Biological productivity front in the Changjiang estuary and the hangzhou bay and its ecological effects. Acta Oceanol. Sin. 26, 96–106.
Obenour D. R., Michalak A. M., Zhou Y., Scavia D. (2012). Quantifying the impacts of stratification and nutrient loading on hypoxia in the northern gulf of Mexico. Environ. Sci. Technol. 46, 5489–5496. doi: 10.1021/es204481a
Parsons T. R., Maita Y., Lalli C. M. (1984). A manual of chemical and biological methods for seawater analysis. Oxford: Pergamon Press.
Pitcher G. C., Aguirre-Velarde A., Breitburg D., Cardich J., Carstensen J., Conley D. J., et al. (2021). System controls of coastal and open ocean oxygen depletion. Prog. Oceanogr. 197, 102613. doi: 10.1016/j.pocean.2021.102613
Qi J. F., Yin B. S., Zhang Q. L., Yang D. Z., Xu Z. H. (2017). Seasonal variation of the Taiwan warm current water and its underlying mechanism. Chin. J. Oceanol. Limnol. 35 (5), 1045–1060. doi: 10.1007/s00343-017-6018-4
Qian W., Dai M. H., Xu M., Kao S. J., Du C. J., Liu J. W., et al (2017). Non-local drivers of the summer hypoxia in the East China Sea off the Changjiang Estuary. Estuar. Coast. Shelf Sci. 198, 393–399. doi: 10.1016/j.ecss.2016.08.032
Rabalais N. N., Cai W. J., Carstensen J., Conley D. J., Fry B., Hu X., et al. (2014). Eutrophication-driven deoxygenation in the coastal ocean. Oceanography 27 (1), 172–183. doi: 10.5670/oceanog.2014.21
Rabalais N. N., Diaz R. J., Levin L. A., Turner R. E., Gilbert D., Zhang J. (2010). Dynamics and distribution of natural and human-caused coastal hypoxia. Biogeosciences 7, 585–619. doi: 10.5194/bg-7-585-2010
Rabouille C., Conley D. J., Dai M. H., Cai W. J., Chen C. T. A., Lansard B., et al. (2008). Comparison of hypoxia among four river-dominated ocean margins: The Changjiang (Yangtze), Mississippi, pearl, and rhône rivers. Cont. Shelf Res. 28, 1527–1537. doi: 10.1016/j.csr.2008.01.020
Stramma L., Schmidtko S. (2021). Spatial and temporal variability of oceanic oxygen changes and underlyiny trends. Atmosphere-Ocean 59 (2), 122–132. doi: 10.1080/07055900.2021.1905601
Stramma L., Schmidtko S., Levin L. A., Johnson G. C. (2010). Ocean oxygen minima expansions and their biological impacts. Deep-Sea Res. Part I-Oceanogr. Res. Pap. 57, 1–9. doi: 10.1016/j.dsr.2010.01.005
Sunda W. G., Cai W.-J. (2012). Eutrophication induced CO2−acidification of subsurface coastal waters: Interactive effects of temperature, salinity, and atmospheric PCO2. Environ. Sci. Technol. 46, 10651–10659. doi: 10.1021/es300626f
Testa J. M., Kemp W. M. (2014). Spatial and temporal patterns of winter–spring oxygen depletion in Chesapeake bay bottom water. Estuaries Coasts 37, 1432–1448. doi: 10.1007/s12237-014-9775-8
Tian R., Hu F., Martin J. M. (1993). Summer nutrient fronts in the Changjiang (Yantze river) estuary. Estuarine Coast. Shelf Sci. 37 (1), 27–41. doi: 10.1006/ecss.1993.1039
Tseng Y.-F., Lin J., Dai M., Kao S.-J. (2014). Joint effect of freshwater plume and coastal upwelling on phytoplankton growth off the Changjiang river. Biogeosciences 11 (2), 409–423. doi: 10.5194/bg-11-409-2014
Vaquer-Sunyer R., Duarte C. M. (2008). Thresholds of hypoxia for marine biodiversity. Proc. Natl. Acad. Sci. United States America 105 (40), 15452–15457. doi: 10.1073/pnas.0803833105
Wallace R. B., Baumann H., Grear J. S., Aller R. C., Gobler C. J. (2014). Coastal ocean acidification: The other eutrophication problem. Estuarine Coast. Shelf Sci. 148, 1–13. doi: 10.1016/j.ecss.2014.05.027
Wang K., Cai W.-J., Chen J., Kirchman D., Wang B., Fan W., et al. (2021a). Climate and human-driven variability of summer hypoxia on a large river-dominated shelf as revealed by a hypoxia index. Front. Mar. Sci. 8. doi: 10.3389/fmars.2021.634184
Wang B., Chen J. F., Jin H. Y., Li H. L., Huang D. J., Cai W. J. (2017). Diatom bloom-derived bottom water hypoxia off the Changjiang estuary, with and without typhoon influence. Limnol. Oceanogr. 62, 1552–1569. doi: 10.1002/lno.10517
Wang H. J., Dai M. H., Liu J. W., Kao S. J., Zhang C., Cai W. J., et al. (2016). Eutrophication-driven hypoxia in the East China Sea off the Changjiang estuary. Environ. Sci. Technol. 50, 2255–2263. doi: 10.1021/acs.est.5b06211
Wang Y., Liu D., Xiao W., Zhou P., Tian C., Zhang C., et al. (2021b). Coastal eutrophication in China: Trend, sources, and ecological effects. Harmful Algae 107, 102058. doi: 10.1016/j.hal.2021.102058
Wang Y. H., Wu H., Gao L., Shen F., Liang X. S. (2019a). Spatial distribution and physical controls of the spring algal blooming off the Changjiang river estuary. Estuaries Coasts 42, 1066–1083. doi: 10.1007/s12237-019-00545-x
Wang Y. H., Wu H., Lin J., Zhu J. R., Zhang W. X., Li C. (2019b). Phytoplankton blooms off a high turbidity estuary: A the case study in Changjiang river estuary. J. Geophys. Res. Oceans 124, 8036–59. doi: 10.1029/2019JC015343
Wei H., He Y. C., Li Q. J., Liu Z. Y., Wang H. T. (2007). Summer hypoxia adjacent to the Changjiang estuary. J. Mar. Syst. 67, 292–303. doi: 10.1016/j.jmarsys.2006.04.014
Wei Q. S., Wang B. D., Chen J. F., Xia C. S., Qu D. P., Xie L. P. (2015). Recognition on the forming-vanishing process and underlying mechanisms of the hypoxia off the Yangtze river estuary. Sci. China: Earth Sci. 58, 628–648. doi: 10.1007/s11430-014-5007-0
Wei Q. S., Wang B. D., Yu Z. G., Chen J. F., Xue L. (2017). Mechanisms leading to the frequent occurrences of hypoxia and a preliminary analysis of the associated acidification off the Changjiang estuary in summer. Sci. China: Earth Sci. 60, 360–381. doi: 10.1007/s11430-015-5542-8
Wei Q. S., Wang B. D., Zhang X. L., Ran X. B., Fu M. Z., Sun X., et al. (2021a). Contribution of the offshore detached Changjiang (Yangtze river) diluted water to the formation of hypoxia in summer. Sci. Total Environ. 764, 142838. doi: 10.1016/j.scitotenv.2020.142838
Wei Q. S., Yao P., Xu B. C., Zhao B., Ran X. B., Zhao Y. H., et al. (2021b). Coastal upwelling combined with the river plume regulates hypoxia in the Changjiang estuary and adjacent inner East China Sea shelf. J. Geophys. Res.: Oceans 126, e2021JC017740. doi: 10.1029/2021JC017740
Wu J., Liu J. T., Wang X. (2012). Sediment trapping of turbidity maxima in the Changjiang estuary. Mar. Geol. 303, 14–25. doi: 10.1016/j.margeo.2012.02.011
Wu H., Shen J., Zhu J., Zhang J., Li L. (2014). Characteristics of the Changjiang plume and its extension along the jiangsu coast. Cont. Shelf Res. 76, 108–123. doi: 10.1016/j.csr.2014.01.007
Wu T., Wu H. (2018). Tidal mixing sustains a bottom-trapped river plume and buoyant coastal current on an energetic continental shelf. J. Geophys. Res.: Oceans 123, 8026–8051. doi: 10.1029/2018JC014105
Wu R., Wu H., Wang Y. (2021). Modulation of shelf circulations under multiple river discharges in the East China Sea. J. Geophys. Res.: Oceans 126 (4), e2020JC016990. doi: 10.1029/2020JC016990
Xu L., Yang D., Benthuysen J., Yin B. (2018). Key dynamical factors driving the kuroshio subsurface water to reach the Zhejiang coastal area. J. Geophys. Res.: Oceans 123, 9061–9081. doi: 10.1029/2018jc014219
Yang D. Z., Yin B. S., Sun J. C., Zhang Y. (2013). Numerical study on the origins and the forcing mechanism of the phosphate in upwelling areas off the coast of Zhejiang province, China in summer. J. Mar. Syst. 123–124, 1–18. doi: 10.1016/j.jmarsys.2013.04.002
Yu R. C., Lu S. H., Liang Y. B. (2018). “Harmful algal blooms in the coastal waters of China,” in Global ecology and oceanography of harmful algal blooms. ecological studies (Analysis and synthesis), vol. 232 . Eds. Glibert P., Berdalet E., Burford M., Pitcher G., Zhou M. Switzerland: Springer International Publishing AG, part of Springer Nature, 309–316. doi: 10.1007/978-3-319-70069-4_15
Zhang H., Fennel K., Laurent A., Bian C. (2020a). A numerical model study of the main factors contributing to hypoxia and its interannual and short-term variability in the East China Sea. Biogeosciences 17, 5745–5761. doi: 10.5194/bg-17-5745-2020
Zhang J., Gilbert D., Gooday A. J., Levin L., Naqvi S. W. A., Middelburg J. J., et al. (2010). Natural and human-induced hypoxia and consequences for coastal areas: Synthesis and future development. Biogeosciences 7, 1443–1467. doi: 10.5194/bg-7-1443-2010
Zhang J., Guo X., Zhao L. (2019a). Tracing external sources of nutrients in the East China Sea and evaluating their contributions to primary production. Prog. Oceanogr. 176, 102122. doi: 10.1016/j.pocean.2019.102122
Zhang J., Liu S. M., Ren J. L., Wu Y., Zhang G. L. (2007). Nutrient gradients from the eutrophic Changjiang (Yangtze river) estuary to the oligotrophic kuroshio waters and re–evaluation of budgets for the East China Sea shelf. Prog. Oceanogr. 74 (4), 449–478. doi: 10.1016/j.pocean.2007.04.019
Zhang Q., Wu J. (2018). Sediment suspension by straining-induced convection at the head of salinity intrusion. J. Geophys. Res.: Oceans 123, 656–671. doi: 10.1002/2017JC013192
Zhang W., Wu H., Feng Y. (2021). Response of bottom hypoxia off the Changjiang river estuary to multiple factors: A numerical study. Ocean Model. 159, 101751. doi: 10.1016/j.ocemod.2021.101751
Zhang W., Wu H., Hetland R. D., Zhu Z. (2019b). On mechanisms controlling the seasonal hypoxia hot spots off the Changjiang river estuary. J. Geophys. Res.: Oceans 124, 8683–8700. doi: 10.1029/2019JC015322
Zhang W., Wu H., Zhu Z. (2018). Transient hypoxia extent off Changjiang river estuary due to mobile Changjiang river plume. J. Geophys. Res.: Oceans 123, 9196–9211. doi: 10.1029/2018JC014596
Zhang Z., Zhou M., Zhong Y., Zhang G., Jiang S., Gao Y., et al. (2020b). Spatial variations of phytoplankton biomass controlled by river plume dynamics over the lower Changjiang estuary and adjacent shelf based on high-resolution observations. Front. Mar. Sci. 7. doi: 10.3389/fmars.2020.587539
Zhao Y., Liu J., Uthaipan K., Song X., Xu Y., He B., et al. (2020). Dynamics of inorganic carbon and pH in a large subtropical continental shelf system: Interaction between eutrophication, hypoxia, and ocean acidification. Limnol. Oceanogr. 65, 1359–1379. doi: 10.1002/lno.11393
Zheng J., Gao S., Liu G., Wang H., Zhu X. (2016). Modeling the impact of river discharge and wind on the hypoxia off Yangtze estuary. Natural Hazards Earth Syst. Sci. 16, 2559–2576. doi: 10.5194/nhess-16-2559-2016
Zhou F., Chai F., Huang D., Wells M., Ma X., Meng Q., et al. (2020). Coupling and decoupling of high biomass phytoplankton production and hypoxia in a highly dynamic coastal system: The Changjiang (Yangtze river) estuary. Front. Mar. Sci. 7. doi: 10.3389/fmars.2020.00259
Zhou F., Chai F., Huang D. J., Xue H. J., Chen J. F., Xiu P., et al. (2017). Investigation of hypoxia off the Changjiang estuary using a coupled model of ROMS-CoSiNE. Prog. Oceanogr. 159, 237–254. doi: 10.1016/j.pocean.2017.10.008
Zhu J. (2003). Dynamic mechanism of the upwelling on the west side of the submerged river valley off the Changjiang mouth in summertime. Chin. Sci. Bull. 48, 2754–2758. doi: 10.1007/BF02901770
Zhu Z. Y., Ng W. M., Liu S. M., Zhang J., Chen J. C., Wu Y. (2009). Estuarine phytoplankton dynamics and shift of limiting factors: A study in the Changjiang (Yangtze river) estuary and adjacent area. Estuarine Coast. Shelf Sci. 84, 393–401. doi: 10.1016/j.ecss.2009.07.005
Zhu Z. Y., Wu H., Liu S. M., Wu Y., Huang D. J., Zhang J., et al. (2017). Hypoxia off the Changjiang (Yangtze river) estuary and in the adjacent East China Sea: Quantitative approaches to estimating the tidal impact and nutrient regeneration. Mar. pollut. Bull. 125, 103–114. doi: 10.1016/j.marpolbul.2017.07.029
Zhu Z. Y., Wu Y., Zhang J., Du J. Z., Zhang G. S. (2014). Reconstruction of anthropogenic eutrophication in the region off the Changjiang estuary and central Yellow Sea: From decades to centuries. Cont. Shelf Res. 72 (1), 152–162. doi: 10.1016/j.csr.2013.10.018
Zhu Z. Y., Zhang J., Wu Y., Zhang Y. Y., Lin J., Liu S. M. (2011). Hypoxia off the Changjiang (Yangtze river) estuary: Oxygen depletion and organic matter decomposition. Mar. Chem. 125, 108–116. doi: 10.1016/j.marchem.2011.03.005
Keywords: hypoxia, river plume, stratification, upwelling, front, physical-biogeochemical processes, Changjiang (Yangtze River) Estuary
Citation: Wei Q, Yuan Y, Song S, Zhao Y, Sun J, Li C and Wang B (2022) Spatial variability of hypoxia and coupled physical-biogeochemical controls off the Changjiang (Yangtze River) Estuary in summer. Front. Mar. Sci. 9:987368. doi: 10.3389/fmars.2022.987368
Received: 06 July 2022; Accepted: 05 September 2022;
Published: 04 October 2022.
Edited by:
Kui Wang, Zhejiang University, ChinaReviewed by:
Bin Yang, Beibu Gulf University, ChinaCopyright © 2022 Wei, Yuan, Song, Zhao, Sun, Li and Wang. This is an open-access article distributed under the terms of the Creative Commons Attribution License (CC BY). The use, distribution or reproduction in other forums is permitted, provided the original author(s) and the copyright owner(s) are credited and that the original publication in this journal is cited, in accordance with accepted academic practice. No use, distribution or reproduction is permitted which does not comply with these terms.
*Correspondence: Qinsheng Wei, d2VpcWluc2hlbmdAZmlvLm9yZy5jbg==; Baodong Wang, d2FuZ2JkQGZpby5vcmcuY24=
†Present address: Qinsheng Wei, First Institute of Oceanography, Ministry of Natural Resources, Qingdao, China Baodong Wang, First Institute of Oceanography, Ministry of Natural Resources, Qingdao, China
Disclaimer: All claims expressed in this article are solely those of the authors and do not necessarily represent those of their affiliated organizations, or those of the publisher, the editors and the reviewers. Any product that may be evaluated in this article or claim that may be made by its manufacturer is not guaranteed or endorsed by the publisher.
Research integrity at Frontiers
Learn more about the work of our research integrity team to safeguard the quality of each article we publish.