 Ricardo A. Scrosati
 Matthew J. Freeman
 Julius A. Ellrich
 Willy Petzold
- Department of Biology, St. Francis Xavier University, Antigonish, NS, Canada
Biogeographic studies aim to understand species distributions and are becoming increasingly relevant to establish baselines to monitor ecological change. The NW Atlantic coast hosts a cold-temperate biota, although knowledge about its biogeography is patchy. This study documents for the first time biogeographic variation at mid-to-high intertidal elevations in wave-exposed rocky intertidal habitats along the open Atlantic coast of Nova Scotia (Canada), a hydrographically distinct subregion of this cold-temperate region. For this goal, we measured the summer abundance of algae and invertebrates at the same nine locations over four consecutive years (2014 to 2017) spanning 415 km of coastline, which allowed us to examine latitudinal and interannual patterns. In addition, we looked for mensurative evidence on possible drivers underlying these patterns, focusing on sea surface temperature, daily maximum and minimum temperature (which often happen at low tides at thus differ from sea surface temperature), pelagic food supply for intertidal filter-feeders (phytoplankton abundance and particulate organic carbon), drift sea ice during the cold season (which can cause intertidal disturbance), and species associations. Our field surveys revealed that northern locations can be severely disturbed by ice scour when drift ice is abundant and, while biological recolonization occurs over the years, it differs in pace among locations. Southern locations, instead, did not experience ice scour during our study and, thus, generally exhibited a higher species richness and abundance than northern locations. Multivariate analyses indicated that the aforementioned expressions of temperature and pelagic food supply explained together 32–55% of the variation in alongshore biogeographic pattern, depending on the year. Species association analyses suggest that algal foundation species (generally more abundant at southern locations) contribute to increase location-wise species richness. Mensurative evidence for bottom-up forcing in seaweed–herbivore and filter-feeder–predator systems differed greatly among years. Overall, in addition to its inherent value to advance NW Atlantic intertidal biogeography, our species distribution database should be valuable to assess ecological change decades into the future as climate change and other anthropogenic influences unfold.
Introduction
At regional spatial scales, distinct species pools determine biogeographic regions. Within regions, species vary in abundance across space and time as influenced directly or indirectly by environmental variation (Vellend, 2016). Describing and understanding those patterns are the central goals of biogeography. Biogeographic studies have been done for many terrestrial, freshwater, and marine systems (Abell et al., 2008; Sanford, 2014; Cox et al., 2016). Intertidal systems are unique because, by virtue of occurring between the highest and lowest tide marks on marine shores, they regularly experience submergence during high tides and aerial conditions during low tides (Raffaelli and Hawkins, 1999). Thus, their biogeography is influenced by a combination of factors related to air and sea properties. As species assemblages differ almost completely between rocky and sedimentary intertidal habitats, biogeography is commonly studied separately for such habitat types. This study focuses on the biogeography of rocky intertidal environments.
Rocky intertidal environments have a relatively unidimensional shape when viewed at a regional scale, as they are much narrower (meters to tens of meters wide, depending on tidal amplitude and intertidal slope) than their alongshore extent, which typically spans many kilometers. This property facilitates macroecological field work compared with predominantly two-dimensional (e.g., prairies) or three-dimensional (e.g., open ocean) environments. Thus, intertidal biogeography has often helped to advance general biogeography (Leonard, 2000; Helmuth et al., 2002; Sagarin and Gaines, 2002; Crickenberger and Wethey, 2018; Fenberg and Rivadeneira, 2019). Of course, several studies on rocky intertidal biogeography have focused on factors that pertain more exclusively to such systems (e.g., upwelling, Menge and Menge, 2013; surf zone properties, Shanks et al., 2017). Overall, a growing number of studies are documenting rocky intertidal biogeographic patterns and the underlying drivers across the globe. Examples include those done on the NE (Blanchette et al., 2008; Fenberg et al., 2015), SE (Broitman et al., 2001; Ibanez-Erquiaga et al., 2018), SW (Poloczanska et al., 2011; Schiel et al., 2019), and NW (Ishida et al., 2021; Hu and Dong, 2022) Pacific coasts, the Indian Ocean coast (Tsang et al., 2012), the Arctic (Thyrring et al., 2021) and Antarctic (Griffiths and Waller, 2016) coasts, and the NE (Hawkins et al., 2019; Pereira et al., 2022), SE (Bustamante et al., 1997; Hill and McQuaid, 2008), SW (Palomo et al., 2019; Vélez-Rubio et al., 2021), and NW (Adey and Hayek, 2005) Atlantic coasts. This list of studies is naturally not exhaustive, as related studies are cited in those articles. The present study focuses on the NW Atlantic coast.
The NW Atlantic coast exhibits a pronounced latitudinal thermal gradient. Between Newfoundland (Canada) and Cape Hatteras, North Carolina (Unites States), there is a region defined by cold-temperate waters (Searles, 1984; Spalding et al., 2007). In this region, intertidal rocky substrate is abundant only between Newfoundland and New England, United States (Mathieson et al., 1991). On this coastal range, rocky intertidal habitats span a wide gradient of wave exposure, from sheltered conditions in inlets and harbours to exposed conditions in habitats facing the open ocean (Bertness, 2007; Tam and Scrosati, 2014). Many species are restricted to either sheltered or exposed habitats, while others occur in both environments, although greatly differing in abundance between them. Overall, species composition (a community property that depends on species identity and their relative abundance) differs considerably between sheltered and exposed rocky intertidal habitats in this region (Menge and Sutherland, 1987; Heaven and Scrosati, 2008). Such a difference results from direct effects of wave action on species and indirect effects mediated by interspecific interactions (Menge and Sutherland, 1987; Bryson et al., 2014). This article focuses on the biogeography of wave-exposed rocky intertidal habitats. This approach facilitates making inferences on alongshore oceanographic influences on communities. This is the case because wave-exposed habitats directly face open oceanic waters, while wave-sheltered habitats typically occur in semi-enclosed environments that are often more affected by local anthropogenic factors, which are less predictable (Musetta-Lambert et al., 2015; Kelly et al., 2021). In fact, for these reasons, wave-exposed habitats are often preferred for studies of benthic–pelagic coupling that investigate how nearshore pelagic conditions influence benthic intertidal biogeography (Connolly and Roughgarden, 1998; Navarrete et al., 2005; Lathlean et al., 2019; Valqui et al., 2021; Román et al., 2022).
The coastal range that exhibits abundant rocky substrate in the NW Atlantic cold-temperate region spans various subregions that differ hydrographically. One of them is the open Atlantic coast of Nova Scotia, which neighbours the subregions of Newfoundland, the Gulf of St. Lawrence, the Bay of Fundy, and the Gulf of Maine (Mathieson et al., 1991; Figure 1). Biogeographic studies of wave-exposed rocky intertidal habitats exist for some of these subregions (Adey and Hayek, 2005; Bryson et al., 2014; Trott, 2022), but not for the open Atlantic coast of Nova Scotia. For this coast, some studies have described communities (including algae and invertebrates) in wave-exposed rocky intertidal habitats, but only for single locations (Stephenson and Stephenson, 1954; Scrosati and Heaven, 2007). Other studies did survey such habitats at various locations along this coast, but they documented patterns for only a few invertebrate species (Tam and Scrosati, 2011; Scrosati and Ellrich, 2018). Overall, these scattered observations done in separate years do not allow for an understanding of biogeographic variation. Therefore, the main goal of the present study is to provide a biogeographic account of wave-exposed rocky intertidal habitats along the open Atlantic coast of Nova Scotia.
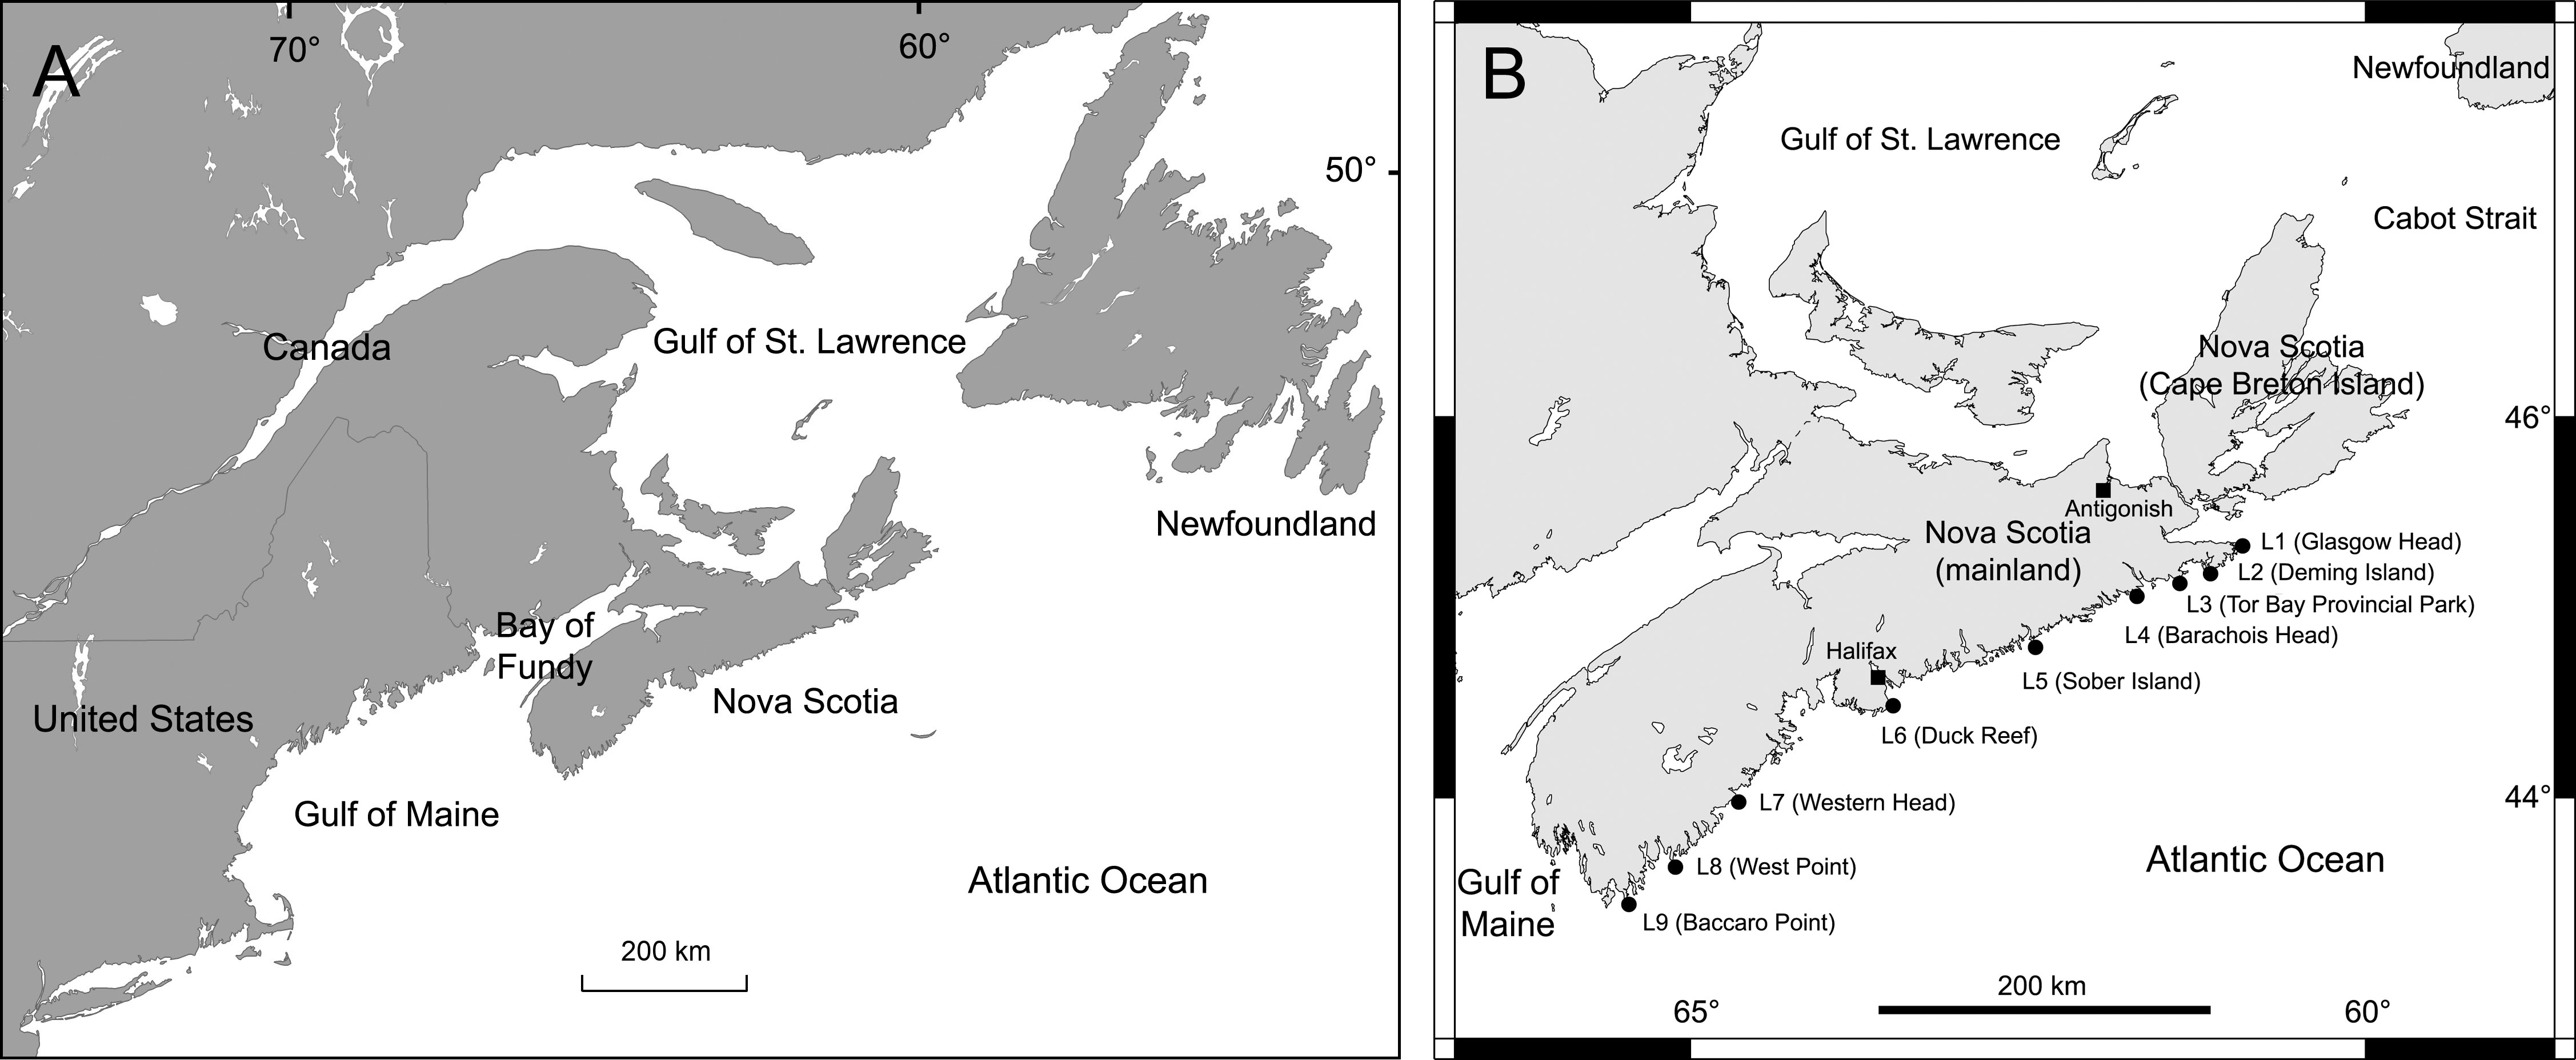
Figure 1 (A) Map showing the hydrographically distinct subregions of the cold-temperate NW Atlantic biogeographic region where rocky substrate is naturally abundant (Newfoundland, Gulf of St. Lawrence, open Atlantic coast of Nova Scotia, Bay of Fundy, and Gulf of Maine) and (B) map showing the position of the nine wave-exposed rocky intertidal locations surveyed for this study.
Using data on algal and invertebrate abundance from various locations, our first objective was to characterize the alongshore biogeographic structure of wave-exposed rocky intertidal habitats. This step entailed a determination of latitudinal changes in species composition as well as the identification of the species that mainly explained compositional differences along the coast. Due to the scarcity of alongshore biological and environmental information, precise predictions could not be made beyond the notion that biogeographic structure would exist given the extent of this coast. Our second objective was to investigate how temporally stable alongshore community patterns are, for which we replicated all surveys over four consecutive years (2014 to 2017). Finally, we looked for mensurative evidence on possible drivers underlying these spatiotemporal patterns, focusing on a set of variables that are often considered as environmental and biological filters. Our third objective was thus to evaluate how temperature (Lathlean et al., 2014; Little et al., 2021), pelagic food supply (Menge et al., 1997), ice load (Petzold et al., 2014), and species associations (Lany et al., 2017) were related to the observed biogeographic patterns.
Materials and methods
Study locations
We conducted our surveys at nine wave-exposed rocky intertidal locations spanning the entire Atlantic coast of mainland Nova Scotia, an extent of 415 km (Figure 1). The names and geographic coordinates of these locations are provided in Table 1. For convenience, they will hereafter be referred to as L1 to L9, from north to south. Typical views of these locations are shown in Figure 2. Additional photographs (Scrosati and Ellrich, 2022) and videos (Ellrich and Scrosati, 2018) of each location are available online. These locations are wave-exposed because they face the open Atlantic Ocean without obstructions. Values of daily maximum water velocity (an indication of wave exposure) measured with dynamometers (see design in Bell and Denny, 1994) in wave-exposed intertidal habitats along this coast range between 6-12 m s-1 (Hunt and Scheibling, 2001; Scrosati and Heaven, 2007; Ellrich and Scrosati, 2017). For this study, we took all biotic and abiotic measurements (described below) on bedrock intertidal areas excluding large cracks and tide pools.
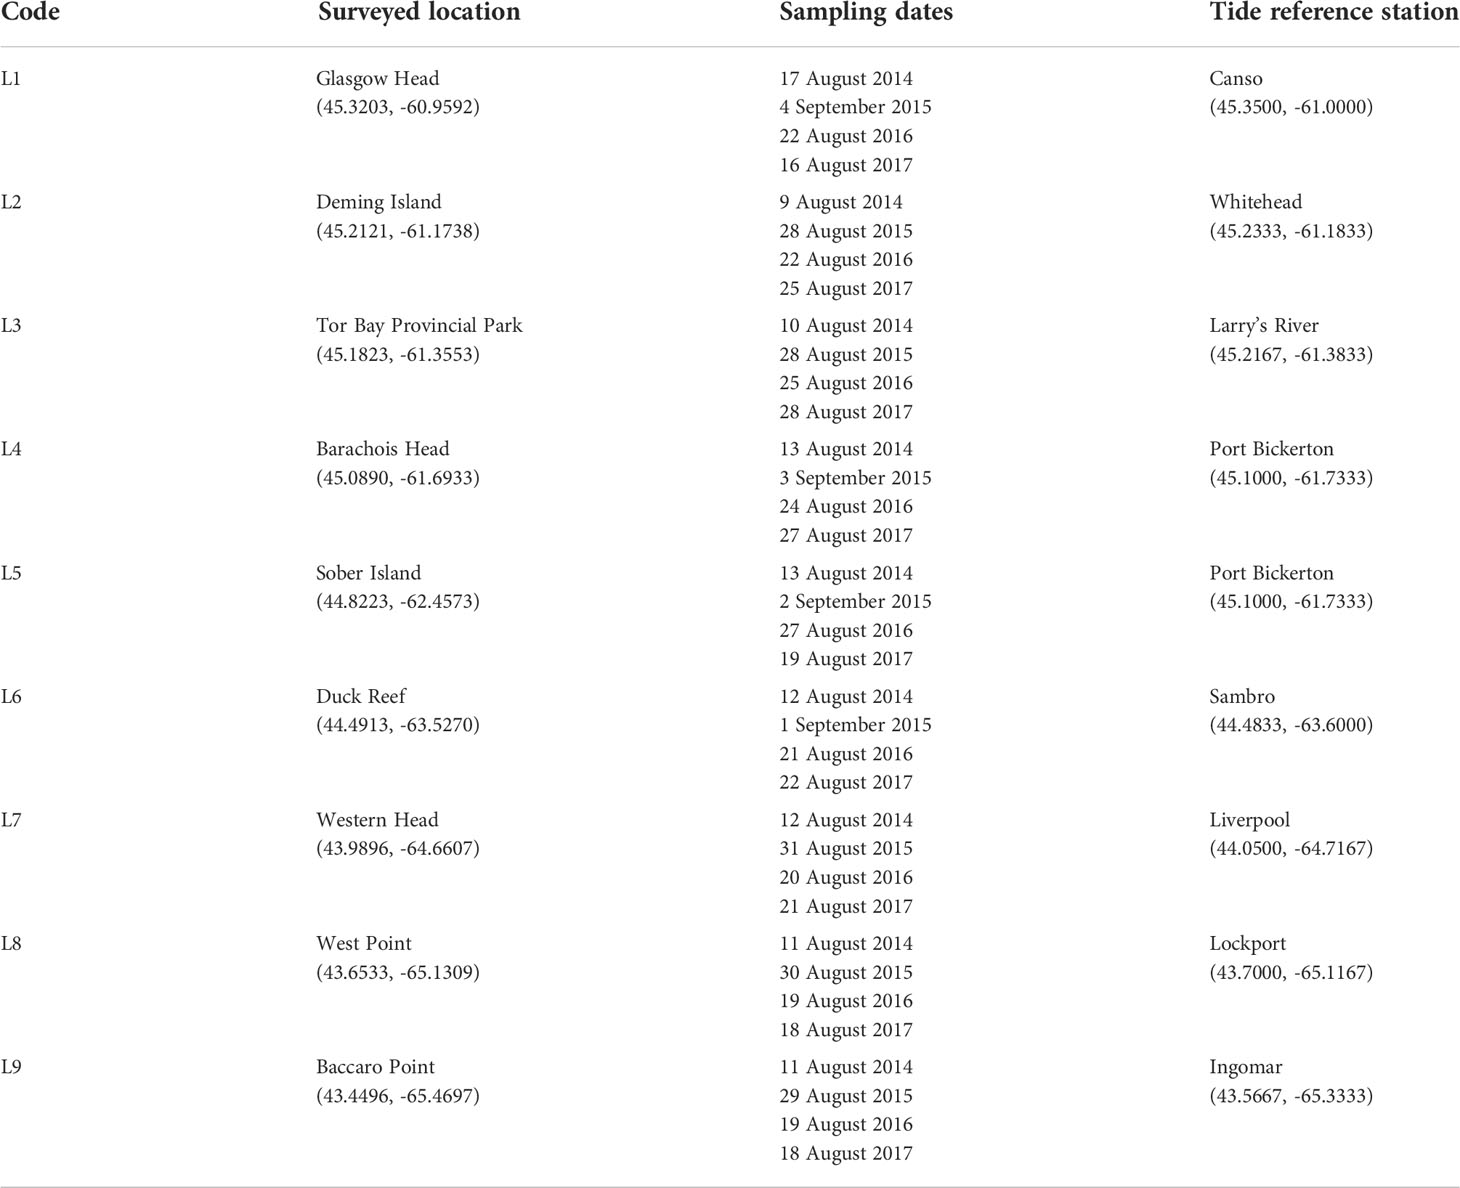
Table 1 Names of the surveyed locations (with geographic coordinates in parenthesis), sampling dates when species abundance was measured, and names of the tide reference stations (with geographic coordinates in parenthesis) that are closest to the surveyed locations.
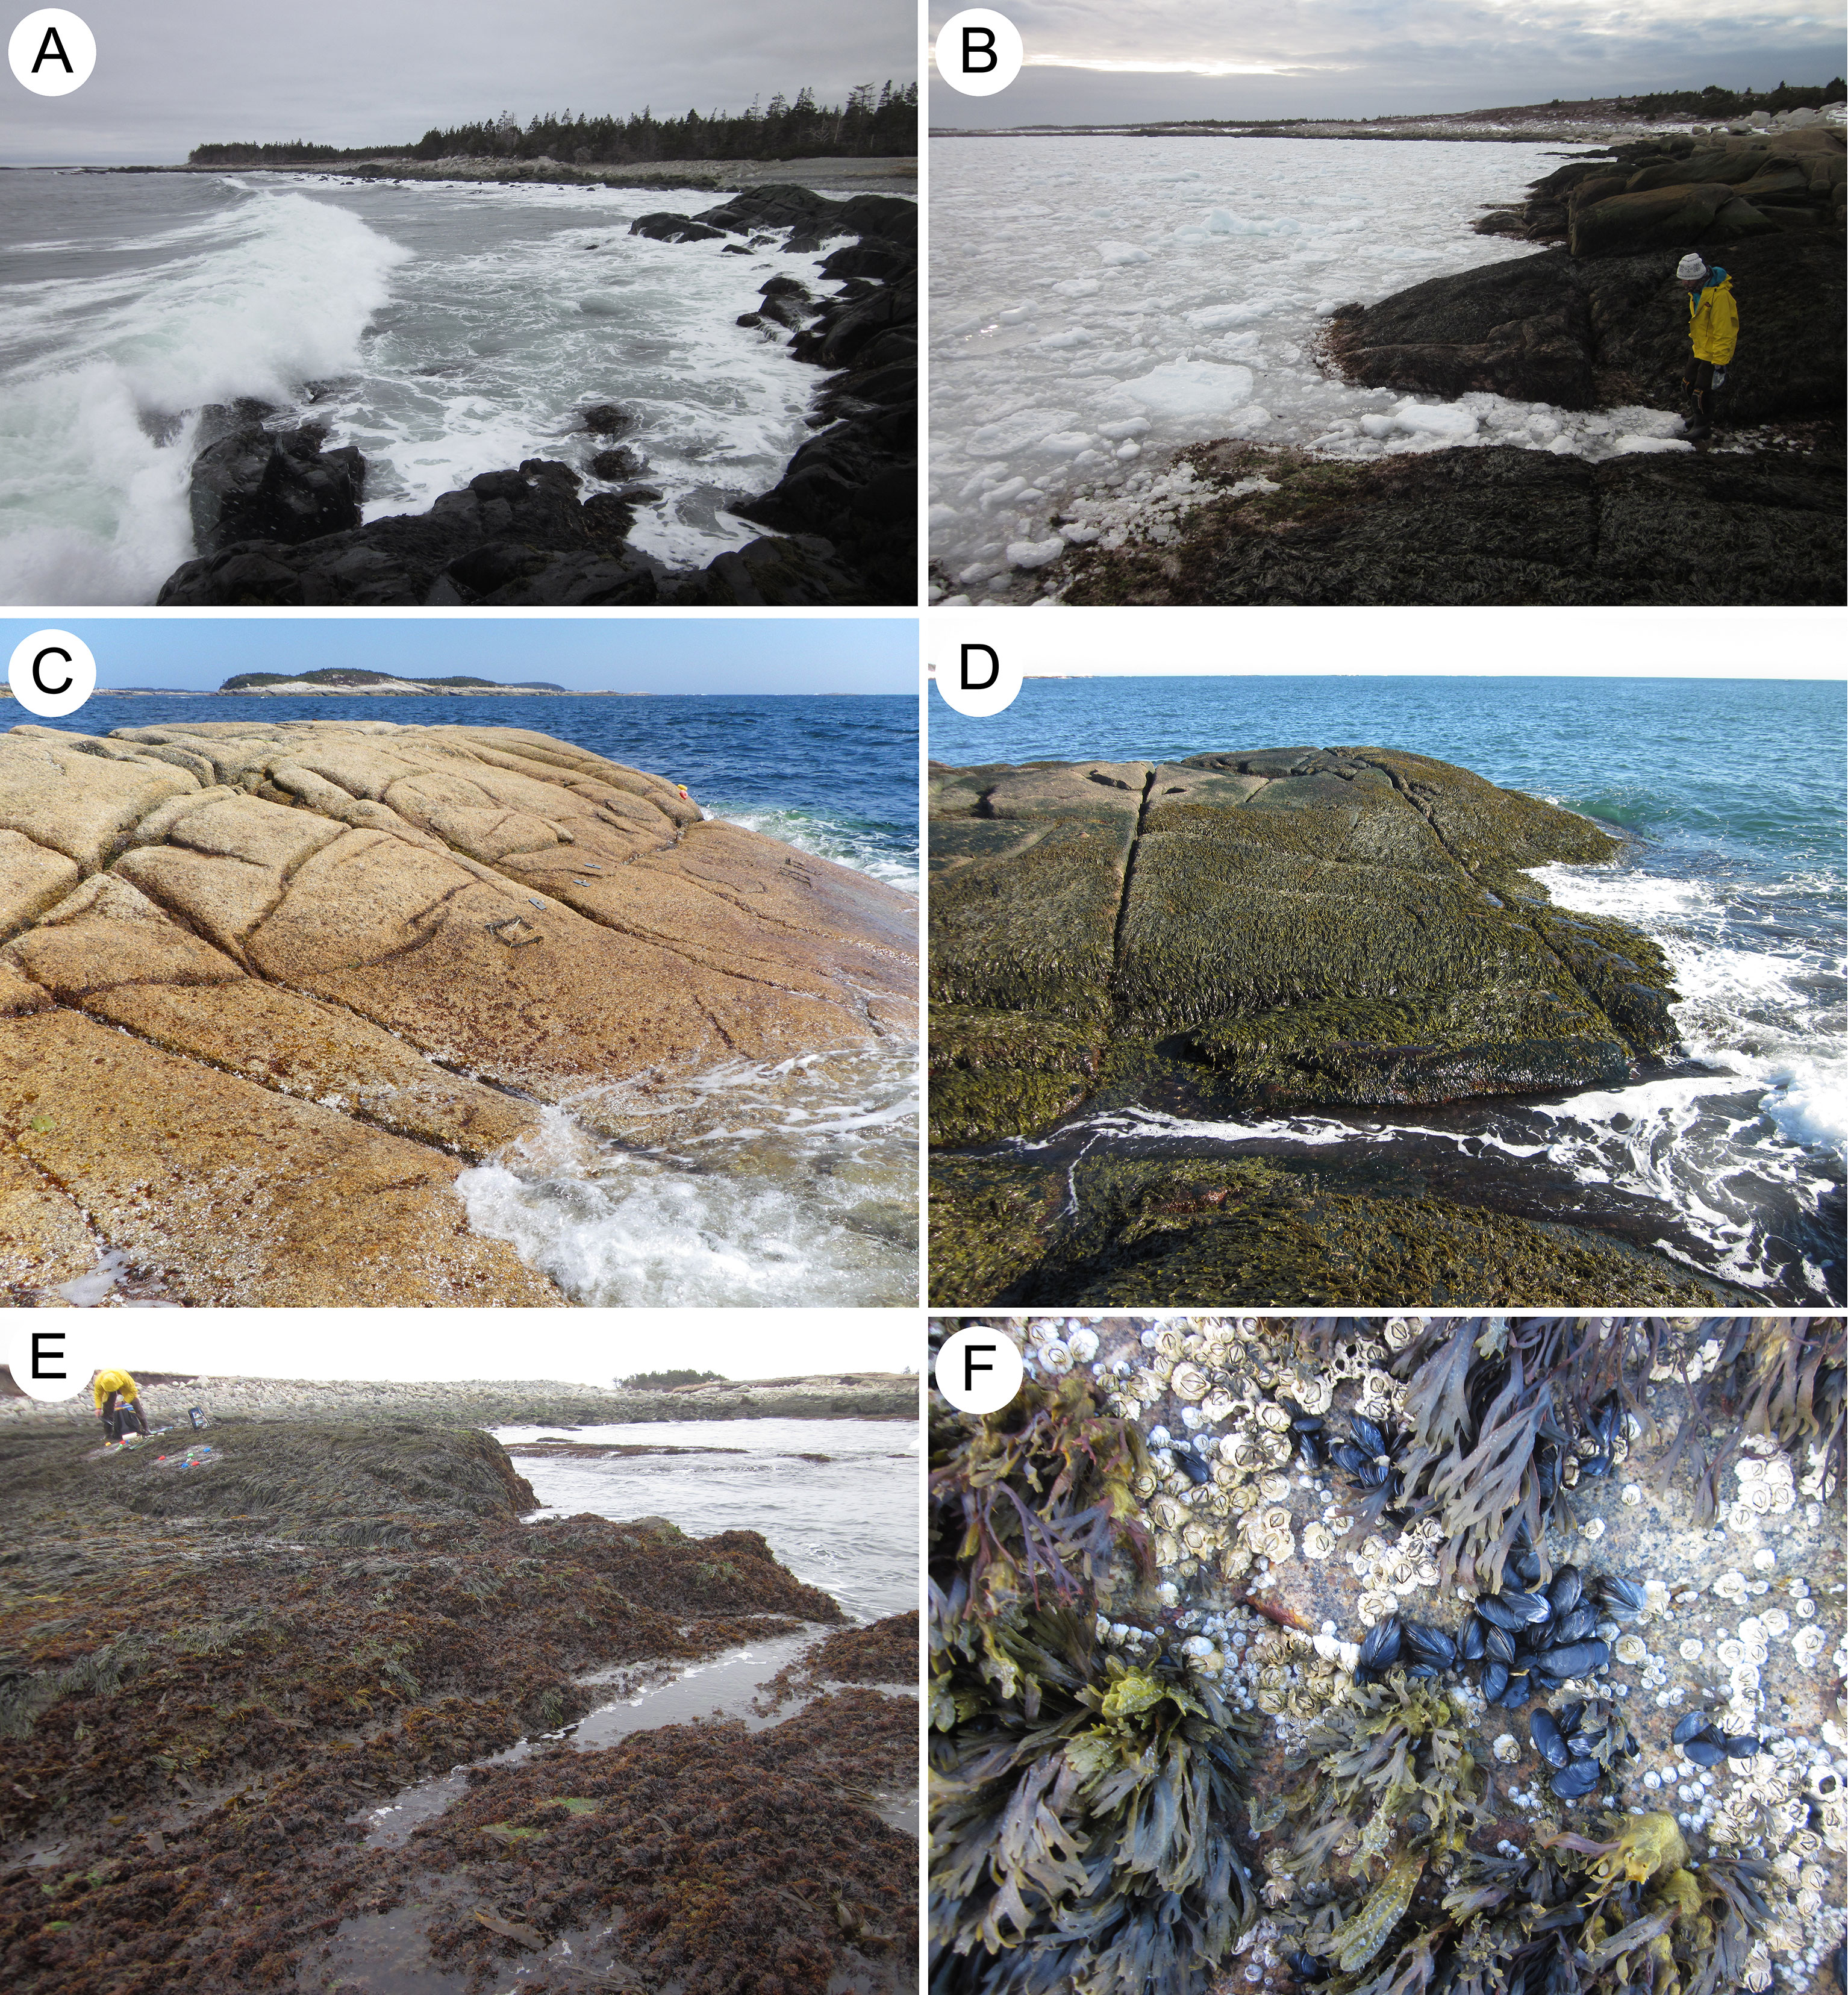
Figure 2 (A) Typical view of wave-exposed rocky intertidal habitats surveyed for this study (photo taken at L3 on 17 April 2016). (B) Photo of L2 taken minutes after drift sea ice reached the coast on 3 April 2014. (C) Photo of L2 taken on 30 April 2014 after the drift ice that arrived to the coast earlier that month had fully melted, showing the resulting widespread disturbance caused by ice scour, which removed virtually all sessile organisms from the substrate. (D) Photo of L2 taken on 24 March 2015, showing the vigorous recolonization by sessile organisms (mainly Fucus and barnacles) that was taking place after the intense ice scour that occurred in April 2014. (E) Photo of L5 taken on 1 May 2014 showing a typically high cover of Fucus, as this location was not reached by the drift sea ice that reached northern locations in the previous month. (F) Common organisms found at mid-to-high elevations in the studied wave-exposed rocky intertidal habitats: the alga Fucus, the barnacle Semibalanus balanoides, and the blue mussel Mytilus (photo taken at L6 on 12 August 2014). These photographs were taken by RAS at low tide.
Algal and invertebrate abundance
In the four studied years (2014 to 2017), we measured algal and invertebrate abundance in the summer, when space occupancy is typically highest. For safety, we took these measurements at low tide on days with calm seas. Due to tide dynamics, the periods of aerial exposure during low tides shorten from high to low elevations. In addition, strong wave action on some days renders the intertidal zone inaccessible even at low tide, especially at middle and low elevations. Thus, given the extent of coastline to survey and the lack of roads linking our locations directly, we always surveyed the mid-to-high intertidal zone to have enough time to survey all locations in a relatively short period (Table 1), which was necessary to minimize time effects on the data each summer. As tidal amplitude increases from 1.8 m at L1 to 2.4 m at L9 (Tide Forecast, 2022) and as wave splash might differ somewhat among locations, we had to carefully determine the elevation of measurements at each location to take them at the same relative elevation in terms of exposure to aerial conditions during low tides. Therefore, for each location, we considered the intertidal range to be the vertical distance between chart datum (0 m in elevation, or lowest normal tide in Canada) and the highest elevation exhibiting sessile perennial organisms (the barnacle Semibalanus balanoides), as such a high boundary is determined by tidal amplitude and wave splash (Scrosati and Heaven, 2007). To determine the high intertidal boundary, we only considered barnacles that occurred on stable bedrock outside of cracks and crevices. Then, we divided the resulting intertidal range for each location by three and measured algal and invertebrate abundance just above the bottom boundary of the upper third of the intertidal range, which we hereafter call the mid-to-high intertidal zone. Based on this method, we measured species abundance at an elevation (in m above chart datum, with the high barnacle boundary stated in parenthesis) of 1.17 m at L1 (1.75 m), 1.13 m at L2 (1.69 m), 1.30 m at L3 (1.95 m), 1.57 m at L4 (2.36 m), 1.08 m at L5 (1.62 m), 1.49 m at L6 (2.24 m), 1.49 m at L7 (2.24 m), 1.41 m at L8 (2.11 m), and 1.63 m at L9 (2.44 m). We determined these elevations at the beginning of this study on days with calm seas using a stadia rod, a sighting scope, and tide height data available at a resolution of one minute for the tide reference stations that are closest to our study locations (Table 1; Tide and Current Predictor, 2022).
The sampling unit was a quadrat (20 cm x 20 cm) consisting of a metallic frame and 100 square subdivisions created with monofilament line. Each year, we measured algal and invertebrate abundance in 30 quadrats at each location (except at L9, where we surveyed 10 quadrats in 2014 and 2015, 11 in 2016, and 12 in 2017 due to accessibility issues). At each location, we randomly placed the replicate quadrats at the targeted elevation following the coastline. For each quadrat, we measured species abundance as percent cover for sessile species (seaweeds and filter-feeding invertebrates) and as number of individuals for mobile species (herbivore and carnivore invertebrates), as typically done in intertidal ecology (Broitman et al., 2001; Boaventura et al., 2002; Sink et al., 2005; Menge et al., 2017; Freilich et al., 2018; Ibanez-Erquiaga et al., 2018; Schiel, 2019). These two species groups can be viewed as different functional groups. We used field guides (Gibson, 2003; Martínez, 2003) and taxonomic keys (Pollock, 1998; Sears, 1998; Villalard-Bohnsack, 2003) for identifications. For a sessile species, its percent cover was measured as the number of square subdivisions in a quadrat covered by 50% or more by that species. If a sessile species was present in a quadrat but covered less than 1% of it, we recorded its percent cover for the quadrat as 0.5%. The encountered organisms were mostly identified at the species level, although a few were identified at higher taxonomic levels due to morphological unclarities, as is often the case in non-destructive studies that identify all producers and consumers in communities (Broitman et al., 2001; Boaventura et al., 2002; Kimbro and Grosholz, 2006; Russell et al., 2006). Nonetheless, each taxon identified above the species level typically included only one or a few unidentified species, as these mid-to-high intertidal habitats have a limited biodiversity compared with lower elevations or with other temperate coasts. All species names conform to the World Register of Marine Species (WoRMS, 2022). The data on algal and invertebrate abundance for each quadrat, location, and year are freely available from the figshare online repository (Scrosati et al., 2022).
Environmental data
We collected data on temperature, pelagic food supply, and ice load for each location. This paragraph summarizes how we measured temperature, as a detailed explanation was provided by Scrosati et al. (2020). Essentially, we measured in-situ temperature every half hour at each location using submersible loggers (HOBO Pendant logger, Onset Computer, Bourne, MA, USA) that were permanently attached to the rocky substrate at the elevations where we measured species abundance (stated above). Temperature measurements started in April-May 2014 at L2-L9 and in April 2015 at L1 and ended in 2018 or 2019, depending on the location (Scrosati et al., 2020). For the present study, we used temperature values that represented the growth seasons of 2014 to 2017. For 2014, the earliest date for which we had temperature data for all locations (except L1, which lacked data for 2014) was 1 May (Scrosati et al., 2020) and the first date in which we measured species abundance was 9 August (Table 1), so we used temperature data between 1 May and 8 August to represent the 2014 growth season. For 2015, 2016, and 2017, we used temperature data for all nine locations between 1 May and 8 August. We considered the same time period each year for consistency. Specifically, we used values of daily sea surface temperature (SST), daily maximum temperature (MaxT), and daily minimum temperature (MinT). These expressions of temperature are not necessarily coupled, as SST refers to seawater temperature (which intertidal organisms experience at high tide) while MaxT and MinT may take place during aerial exposure at low tide, as the air can be warmer or colder than SST (Høgslund et al., 2014). Thus, these three temperature expressions are valuable to understand community patterns (Helmuth et al., 2002; Fenberg et al., 2015; Mota et al., 2015; Rodrigues et al., 2019; Wang et al., 2020; Little et al., 2021). These daily values are freely available through the data paper by Scrosati et al. (2020).
As measures of pelagic food supply, we considered the abundance of coastal phytoplankton and particulate organic carbon (POC), which are food sources for intertidal filter-feeders. In coastal ecology, chlorophyll-a concentration (Chla, hereafter) is often used as a proxy for phytoplankton abundance. Conveniently, Chla and POC in surface waters are regularly measured by satellites across the globe (Navarrete et al., 2005; McClain, 2009; Burrows et al., 2010; Menge and Menge, 2013; Arribas et al., 2014; Mazzuco et al., 2015; Lara et al., 2016). The spatial resolution of the cells for which satellite data are measured (4 km x 4 km or 9 km x 9 km) is considerably smaller than the distance among our locations, making satellite data suitable for our goals, as recognized for regional-scale studies (Legaard and Thomas, 2006). We obtained Chla and POC data from the OceanColor Data website of the National Aeronautics and Space Administration of the United States using their SeaDAS software (NASA, 2022). To enable analyses in relation to temperature, we retrieved Chla and POC data for the period between 1 May and 8 August (see above for rationale) for our four years. Firstly, we retrieved all of the daily Chla and POC values available for the 4-km-x-4-km cells that included our nine locations. For dates when data for those cells were unavailable, we used data for the corresponding 9-km-x-9-km cells. For L4, the number of dates with data for those two cell sizes was limited, so we also used data averages for the eight 4-km-x-4-km cells surrounding the 4-km-x-4-km cell that includes L4. Previous analyses showed that data from 4-km-x-4-km cells are highly correlated with data for these alternative options (Scrosati and Ellrich, 2016; Freeman, 2022), making them appropriate to achieve as great as possible sample sizes for each location. When available, for each date we used an average of values recorded by MODIS-Aqua, MODIS-Terra, and VIIRS-SNPP instruments on board NASA satellites.
Due to the harsh winters of eastern Canada, sea ice develops extensively across the Gulf of St. Lawrence (Figure 1) every winter (see a photograph of ice cover in Scrosati and Heaven, 2007). Sea ice does not form on the open Atlantic coast of Nova Scotia (except in sheltered inlets and harbours; Mathieson et al., 1991). However, in late winter and early spring, abundant sea ice drifts off the Gulf of St. Lawrence through the Cabot Strait towards the open Atlantic (Figure 1) and moves south following the coast driven by the Nova Scotia Current. In most years, such drift ice reaches only the Atlantic coast of Cape Breton Island (Figure 1) before melting. However, in more extreme years, the drift ice also reaches the Atlantic coast of mainland Nova Scotia (Minchinton and Scheibling, 1993; McCook and Chapman, 1997) and scours wave-exposed intertidal habitats at our northern locations, largely melting before reaching southern locations (Stephenson and Stephenson, 1954; Petzold et al., 2014). The Canadian Ice Service (2022) provides daily charts during the cold season indicating the concentration of drift sea ice along this coast, which predicts the intensity of intertidal ice scour (Petzold et al., 2014). Thus, for each location, we used those charts to calculate seasonal ice load for the cold seasons preceding the four summers when we measured species abundance.
Data analyses
We tested if species composition depended on location and year separately for sessile and mobile species. We did so because the abundance measurement unit differed between both functional groups (percent cover for sessile species and density for mobile species) and any standardization technique to combine both datasets would have distorted the data in one way or another. For each mobile species, we calculated density by dividing the number of organisms found in a quadrat by the quadrat’s area (4 dm2). For each functional group, we evaluated the effects of location, year, and their interaction through a two-way permutational multivariate analysis of variance (PERMANOVA) using 999 random permutations (Anderson et al., 2008). To evaluate the contribution of each species to the changes in species composition along the coast, we ran a similarity percentages analysis (SIMPER) for each pair of locations based on Bray-Curtis similarities and, then, averaged the contribution of each species to the compositional difference between locations across all such SIMPER tests (Clarke and Warwick, 2001).
As species composition varied significantly along the coast each year (see Results), we determined the alongshore biogeographic pattern for each year through nonmetric multidimensional scaling (NMDS) with overlayed clusters based on Euclidean distances (Clarke, 1993; Clarke and Warwick, 2001). Given the logistical constraints that influenced our field work, we did these characterizations using only the data for sessile species. This is so because, each summer, we had to survey all locations within the fewest possible days to minimize time effects on the data. Thus, because of the extent of surveyed coastline (415 km), the lack of roads linking locations directly, and the inability to access locations on days with strong waves, each summer we surveyed each location only once (Table 1). As sessile species are permanently attached to the substrate, their abundance does not change much from day to day. However, mobile organisms may move up or down the shore from day to day depending on the conditions at low tide (e.g., hot and dry vs. cool and wet). Thus, snapshot abundance data for sessile species from a given elevation (mid-to-high, in our case) are more representative of a wider temporal range than equivalent data for mobile species.
We then tested whether SST, MaxT, MinT, Chla, and POC were related to the alongshore biogeographic patterns for sessile species. For each year and location, we first calculated the average of each of those environmental variables for the period between 1 May and 8 August (see above for rationale). For each year, we then ran a DISTLM (distance-based linear model) test to compare the ability of models depicting all possible combinations of those environmental variables to statistically explain the multivariate ordination pattern based on the abundance of sessile species (Anderson et al., 2008). The DISTLM test for each year ranked all possible models based on their corrected Akaike’s Information Criterion (AICc) value (Powell et al., 2014). The best model was the one exhibiting the lowest AICc value (Anderson, 2008; Anderson et al., 2008). For each of the resulting four models (2014 to 2017), we assessed the relative importance of each environmental variable using their squared semipartial correlation coefficients (Howell, 2010; Navarrete et al., 2014). This coefficient measures the reduction in a model’s R2 after removing a given independent variable (Tabachnick and Fidell, 2013). As temperature data were unavailable for L1 in 2014 (Scrosati et al., 2020), the DISTLM test for 2014 excluded L1 (see Results). Ice load data, however, were available for all nine locations in 2014 (actually peaking for L1). Therefore, to evaluate if ice load was related to biogeographic pattern in 2014, we deemed most useful to run a separate analysis with data for the nine locations. Since the DISTLM tests used the aggregate ordination scores for each replicate as the dependent variable, we used those values to evaluate the relationship between biogeographic pattern and ice load. For 2015, we made that test also using the data for all nine locations, but no tests were done for 2016 and 2017 because the ice charts indicated a lack of drift ice then.
We examined species associations that were potentially useful to infer community facilitation and influences on herbivore and predator abundance. For facilitation, we investigated the relationship between the abundance of canopy-forming algae and the number of all other species, which are smaller and thus may benefit from reduced abiotic stress under algal canopies (Scrosati, 2017; Umanzor et al., 2019; Roberts and Bracken, 2021). We considered Fucus (Watt and Scrosati, 2013) and red turf algae (Dudgeon et al., 1999; Scrosati, 2016) as the canopy-forming algae. In our habitats, we found two Fucus species (Mathieson and Dawes, 2017): F. vesiculosus, predominant at L2, and F. distichus edentatus, predominant at southern locations (see photos in Scrosati and Ellrich, 2022). Although F. vesiculosus is easily recognized when it bears air bladders, it may not display any in certain exposed environments (Villalard-Bohnsack, 2003) and juveniles of both species may be hard to identify. Therefore, we combined them as Fucus sp., especially as both species form extensive canopies and thus likely play a similar ecological role. Red turf algae included Chondrus crispus and, only in southern locations, Mastocarpus stellatus (Table 2). They are similar in form and size and co-occurred in the same patches when found at the same location, suggesting a similar ecological role. Thus, although their abundance was measured separately in 2016 and 2017 (combined as red turf algae in 2014 and 2015), this analysis used their combined abundance for all four years. To examine possible biotic influences on herbivore abundance, we focused on the two most abundant herbivores, Littorina littorea and L. obtusata (periwinkles; Table 2), and investigated the relationship between their abundance and that of Fucus. We did separate analyses for both periwinkles because L. obtusata feeds primarily on macroscopic Fucus thalli (Molis et al., 2015) while L. littorea feeds mainly on microscopic benthic algae (Hawkins and Hartnoll, 1983), which may be favoured by a low Fucus abundance. To examine possible biotic influences on predator abundance, we focused on the only prominent predator found in our habitats, the dogwhelk Nucella lapillus (Table 2; see a photo in Scrosati and Ellrich, 2022). As this snail feeds on the main filter-feeders found on this coast (barnacles, Semibalanus balanoides, and blue mussels, Mytilus spp.; Leonard, 2000; Sherker et al., 2017; see Figure 2F and additional photos in Scrosati and Ellrich, 2022), we investigated the relationship between the combined abundance of barnacles and blue mussels (Menge, 1978) and dogwhelk abundance. There are two intertidal species of blue mussel on our coast, Mytilus edulis and M. trossulus. Due to morphological similarities (Innes and Bates, 1999) and hybridization (Riginos and Cunningham, 2005), their visual identification is difficult, so we identified them as Mytilus spp., as commonly done in field studies with these species (Cusson and Bourget, 2005; Le Corre et al., 2013). Genetic surveys done in wave-exposed intertidal habitats on our coast revealed a predominance of M. trossulus (80-85%) over M. edulis (Hunt and Scheibling, 1996; Tam and Scrosati, 2011).
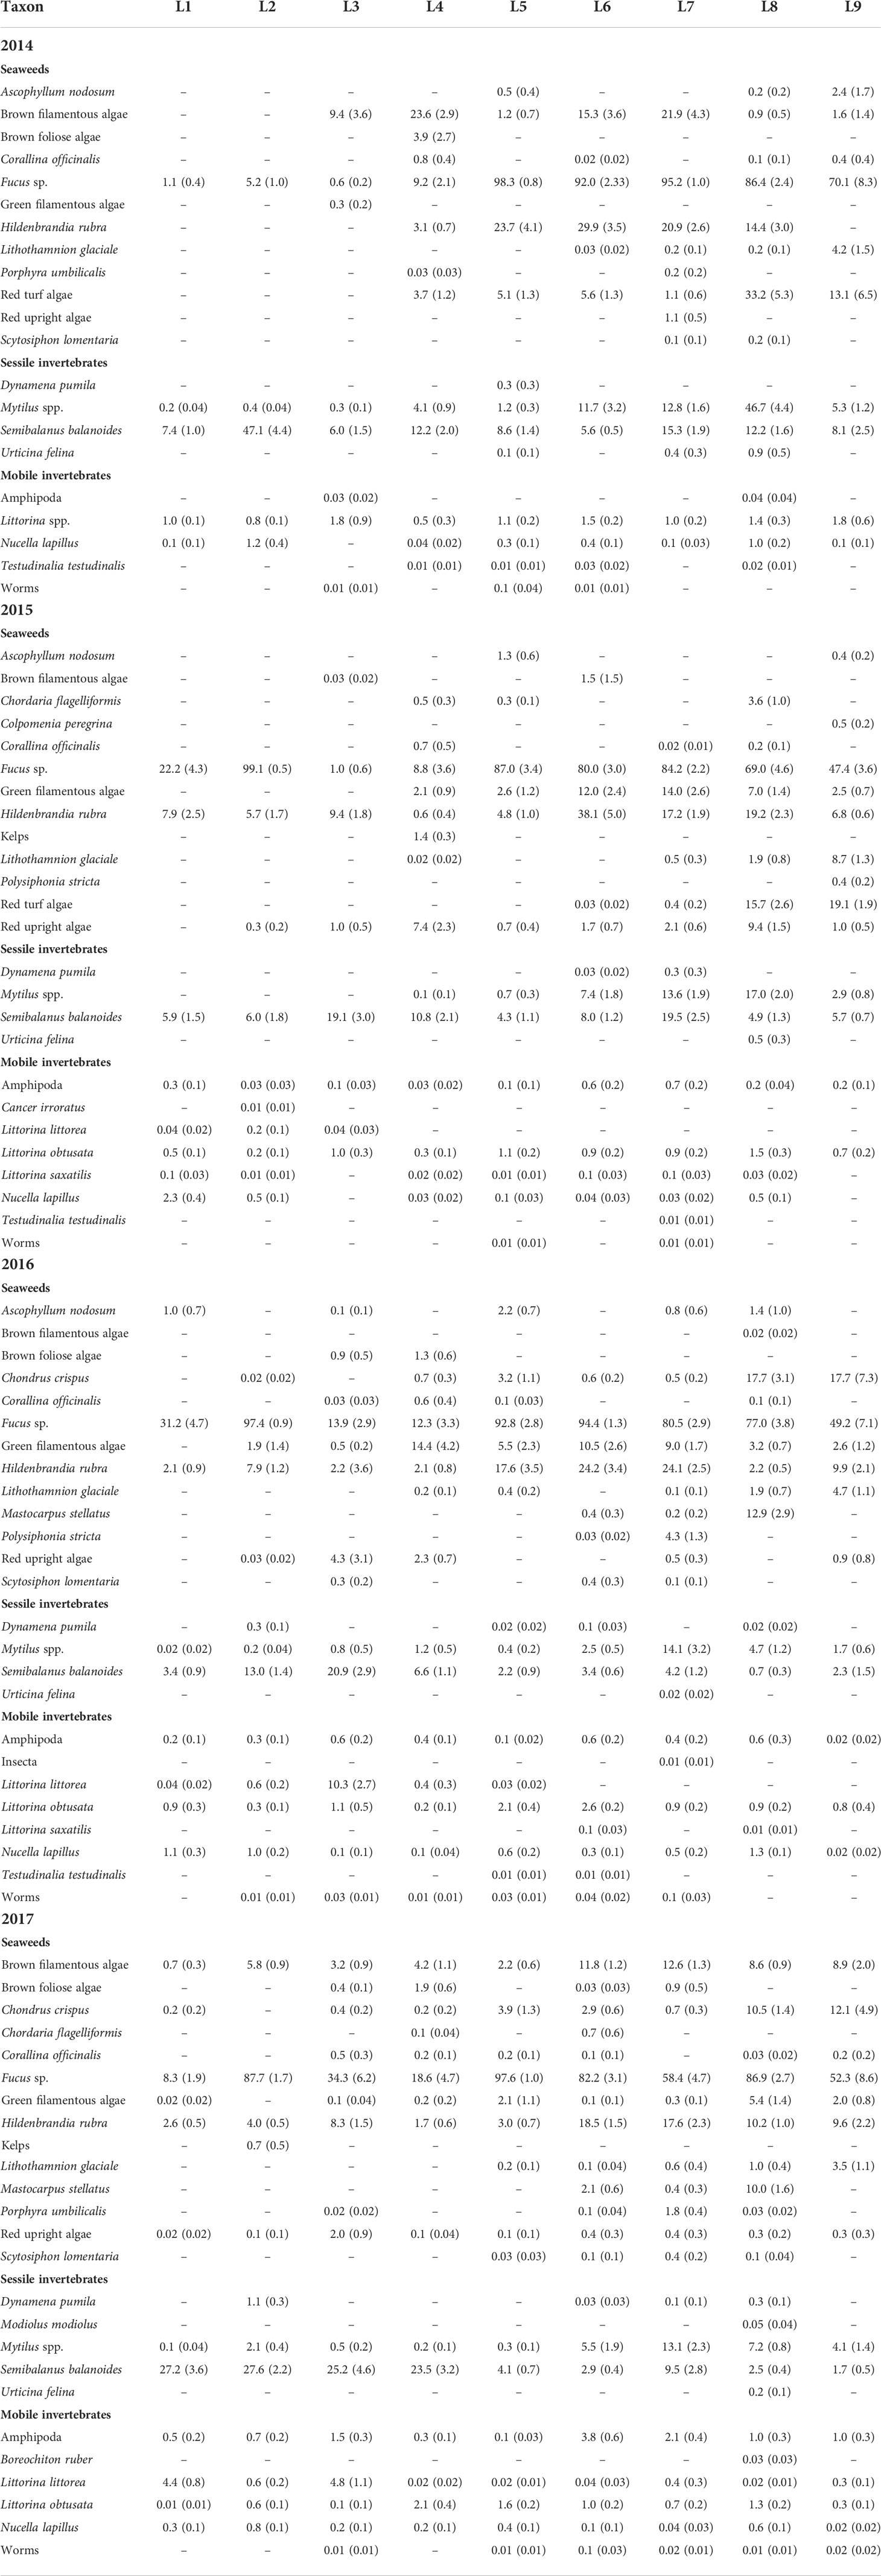
Table 2 Abundance of each taxon (mean with SE in parenthesis) identified at each location (L1 to L9) each studied year (2014 to 2017). The abundance of seaweeds and sessile invertebrates is expressed as percent cover, while the abundance of mobile invertebrates is expressed as density (individuals dm-2). See Materials and Methods for details. Values are reported to their first decimal point except values lower than 0.05, which are reported to their second decimal point.
Results
Latitudinal and interannual biogeographic patterns
We identified a total of 33 taxa, including 18 seaweeds and 15 invertebrates (Table 2). The total number of taxa identified per location during the entire study (species richness) was generally higher at southern locations than at northern locations, with peaks at L7-L8 (Figure 3).
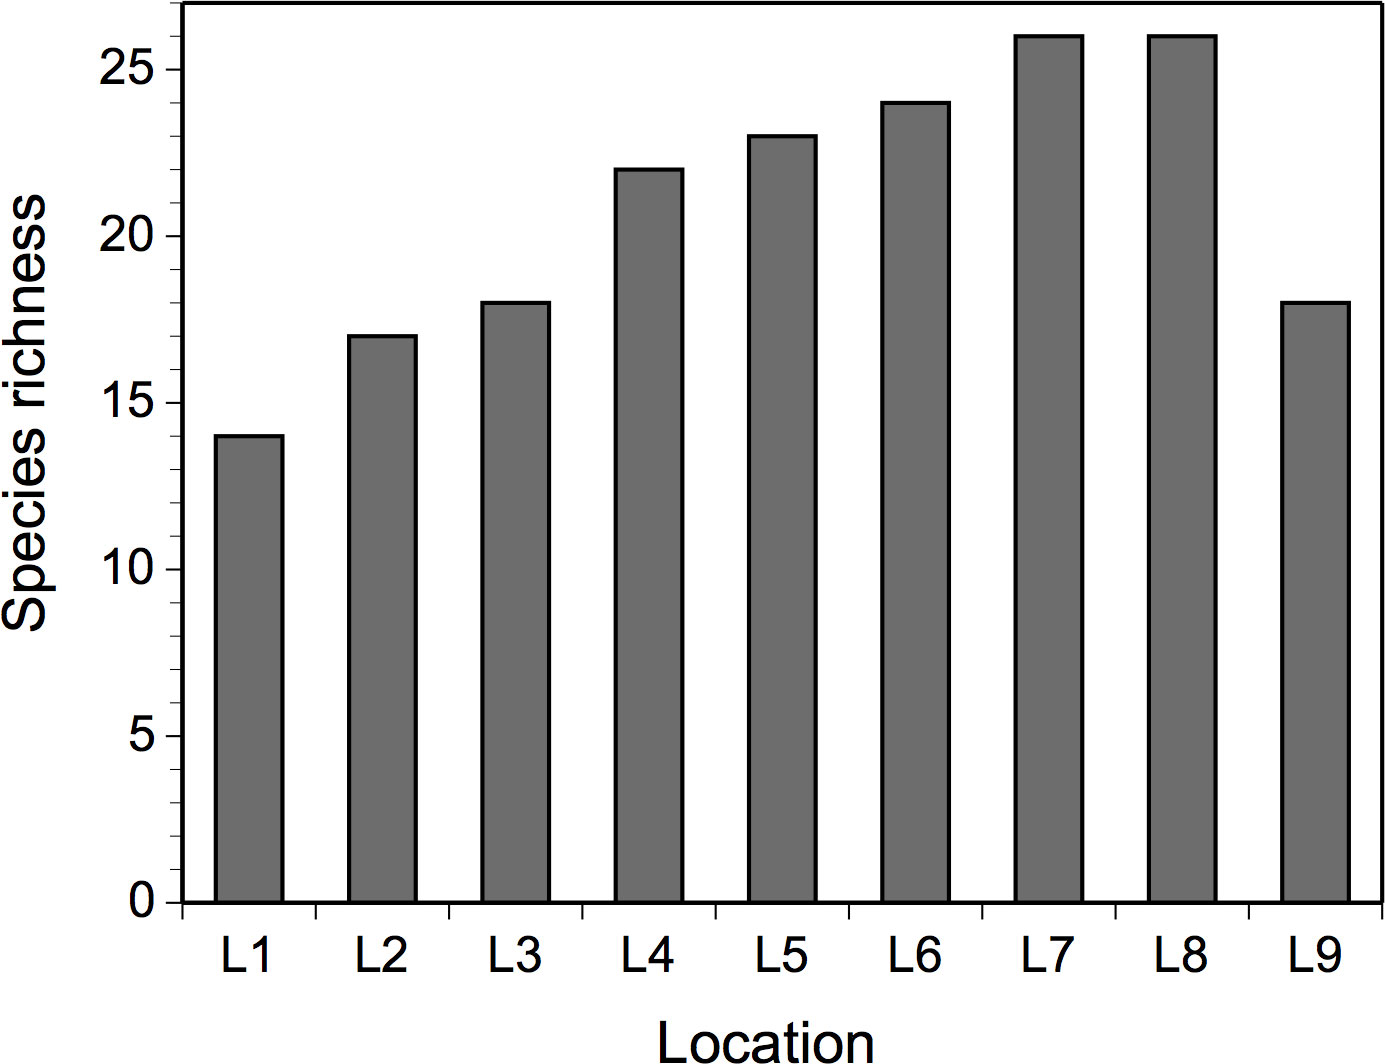
Figure 3 Total number of taxa (species richness) identified at mid-to-high elevations in wave-exposed rocky intertidal habitats at each location during the four studied years.
The species composition of sessile species was significantly affected by location (pseudo-F = 7.30, P < 0.001), year (pseudo-F = 29.98, P < 0.001), and the year x location interaction (pseudo-F = 13.42, P < 0.001), as indicated by the two-way PERMANOVA. Because of the significant interaction term, we ran one-way PERMANOVAs and found that species composition differed among locations for each surveyed year, as the pseudo-F value was 49.22 in 2014, 31.83 in 2015, 25.13 in 2016, and 29.56 in 2017 (P < 0.001). The NMDS ordinations then revealed how the latitudinal (alongshore) biogeographic structure was each year for sessile species. Their species composition in 2014 differed in broad terms between northern (L1 to L4) and southern (L5 to L9) locations (Figure 4). In 2015, 2016, and 2017, the broad distinction between northern and southern locations persisted, although L2 was then grouped with southern locations (Figure 4). The species that mainly explained the latitudinal differences in species composition were basically the same for all four years (Table 3). The most important taxon in terms of contribution to biogeographic pattern was the canopy-forming alga Fucus, followed by the barnacle Semibalanus balanoides and the crustose alga Hildenbrandia rubra, filamentous algae, and then mussels (Mytilus spp.) and red turf algae, which were separated as Chondrus crispus and Mastocarpus stellatus in 2016 and 2017 (Table 3). Separate analyses of variance detected significant effects of location and year on the abundance of these organisms (P < 0.01). Overall, their latitudinal patterns of abundance were relatively stable across years, with few exceptions (Table 2). For instance, Fucus was consistently most abundant at southern locations (and at L2 after 2014). Barnacles were most abundant at L2 in 2014, at L3 and L7 in 2015, at L2 and L3 in 2016, and at all four northern locations (L1 to L4) and L7 in 2017. The alga H. rubra was generally most abundant at southern locations, although not as consistently as Fucus. Filamentous algae were often most abundant at some southern locations and at L4. Mussels were consistently most abundant at the same southern locations (L6, L7, and L8), while red turf algae (including C. crispus and M. stellatus) were consistently most abundant at the two southernmost locations (L8 and L9).
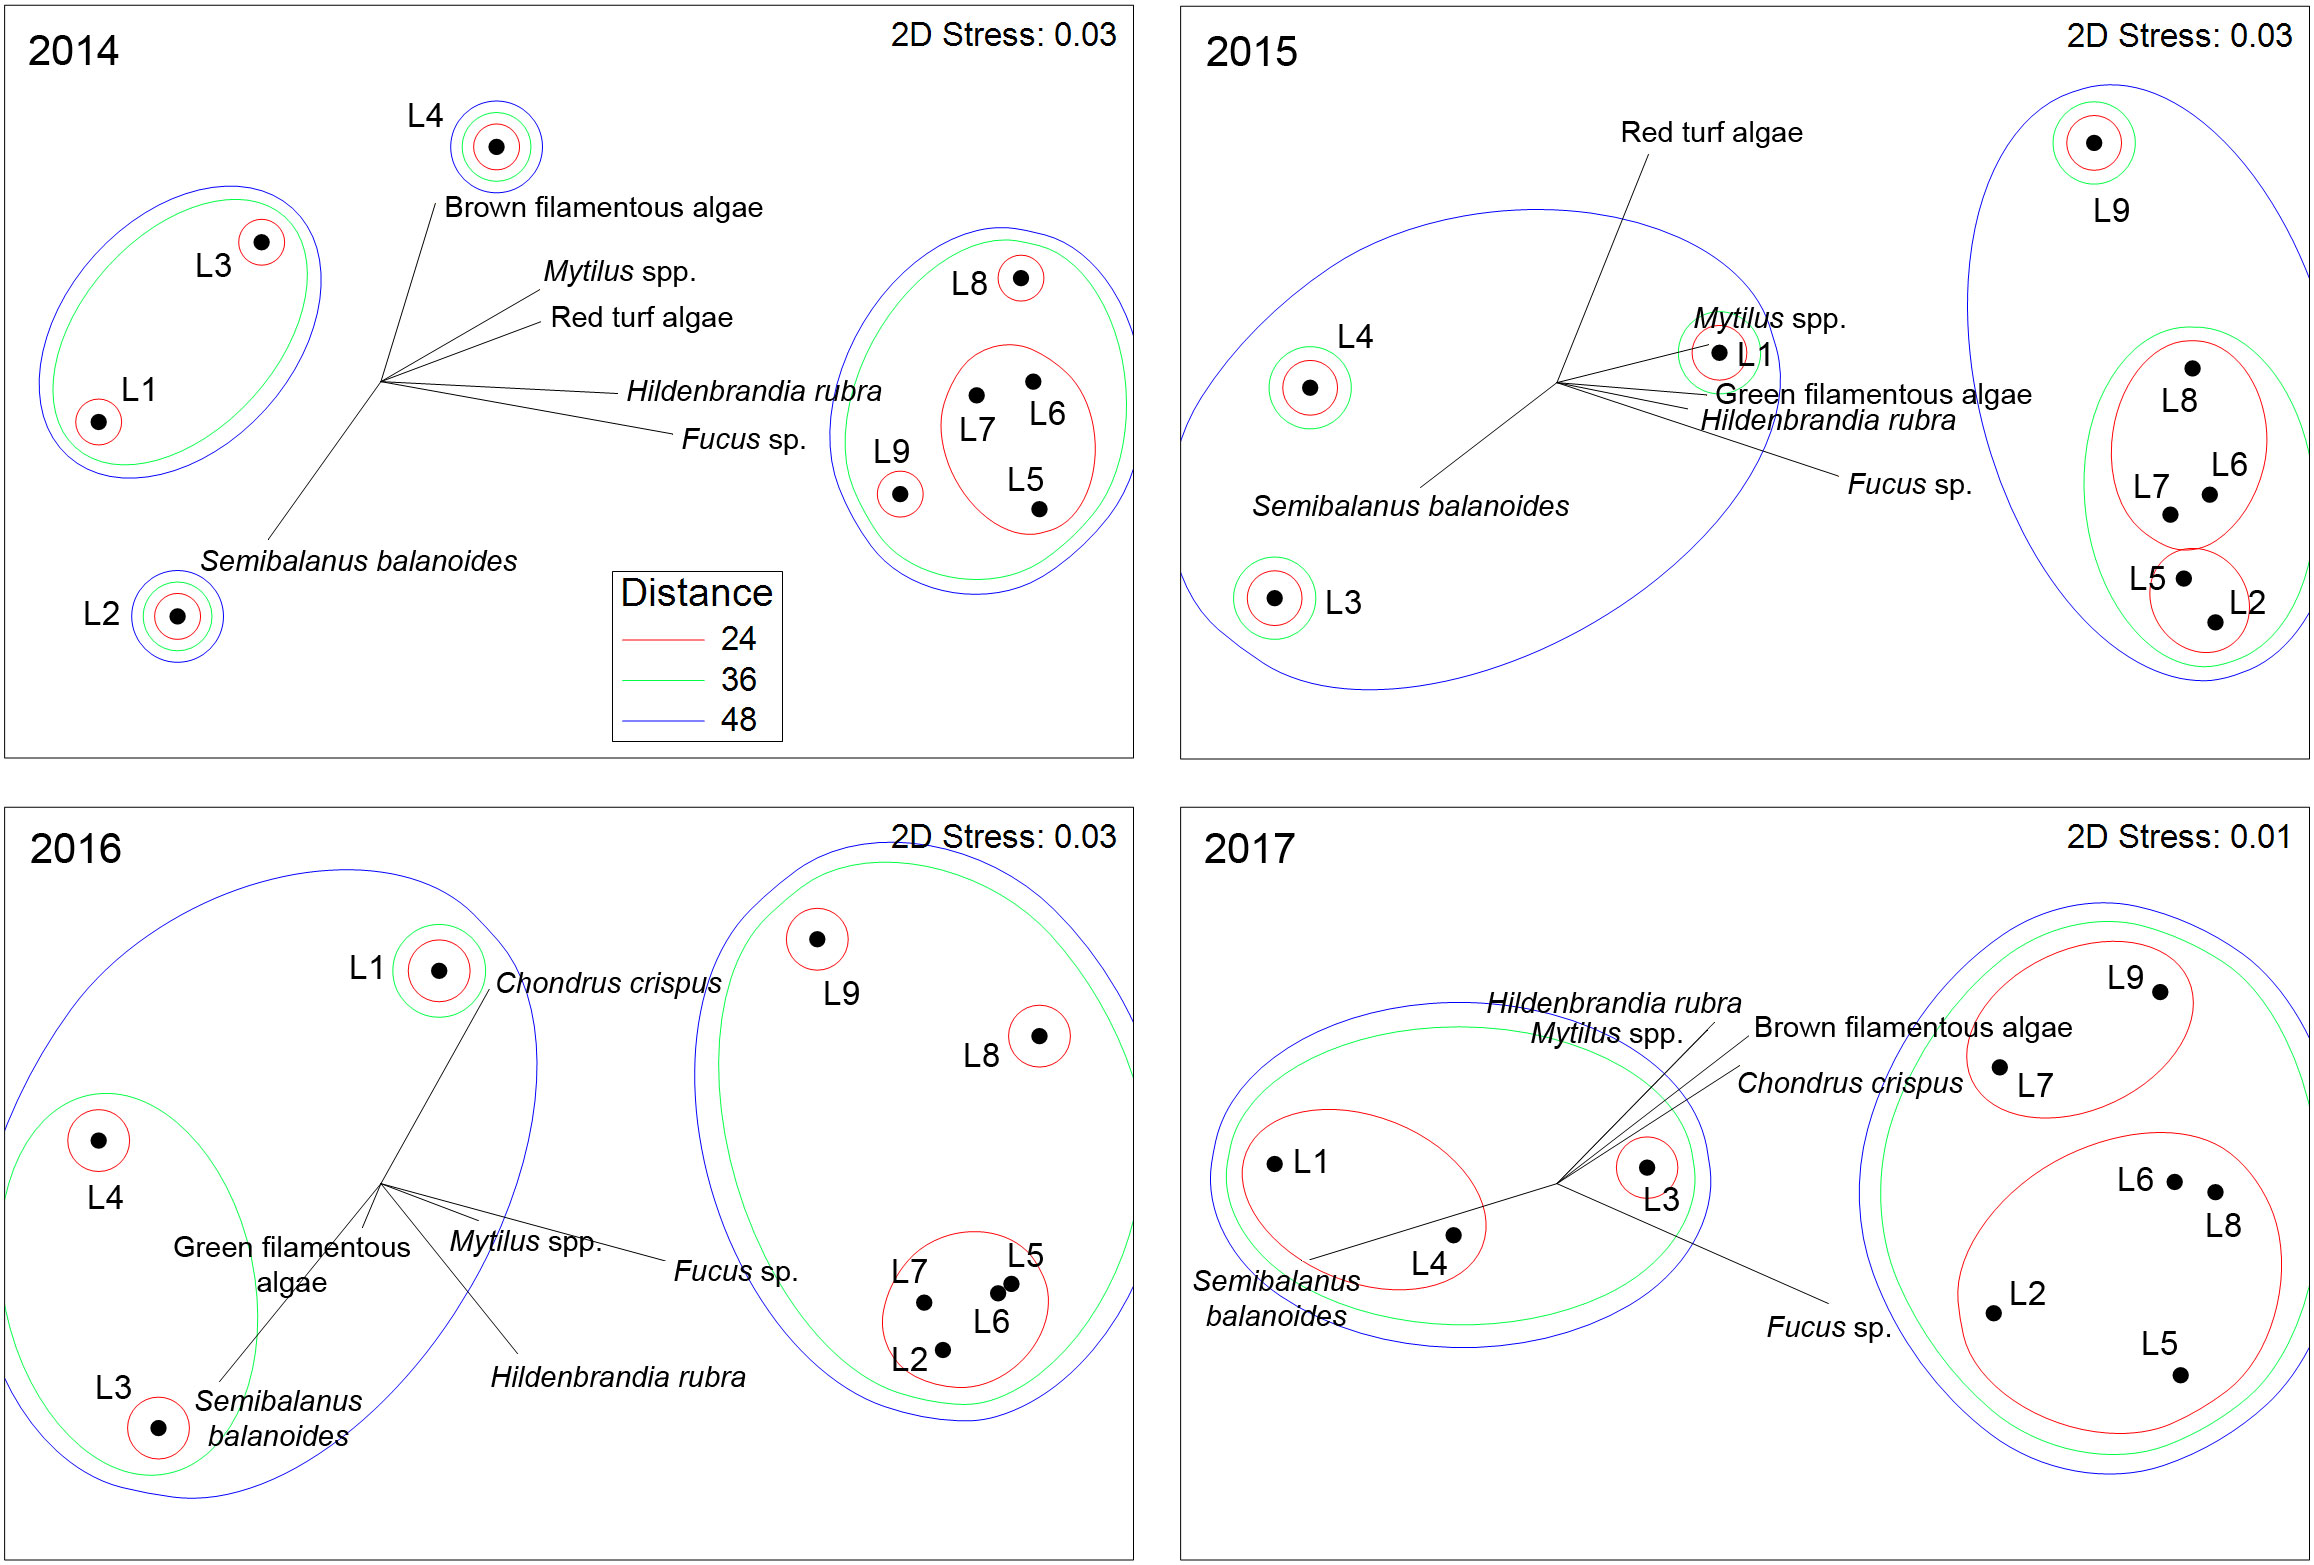
Figure 4 NMDS ordination plots for sessile species, showing the location centroids and vectors for the sessile species with the largest contribution to the multivariate patterns as revealed by SIMPER analyses. The shapes surrounding the centroids represent threshold Euclidean distances between the centroids.
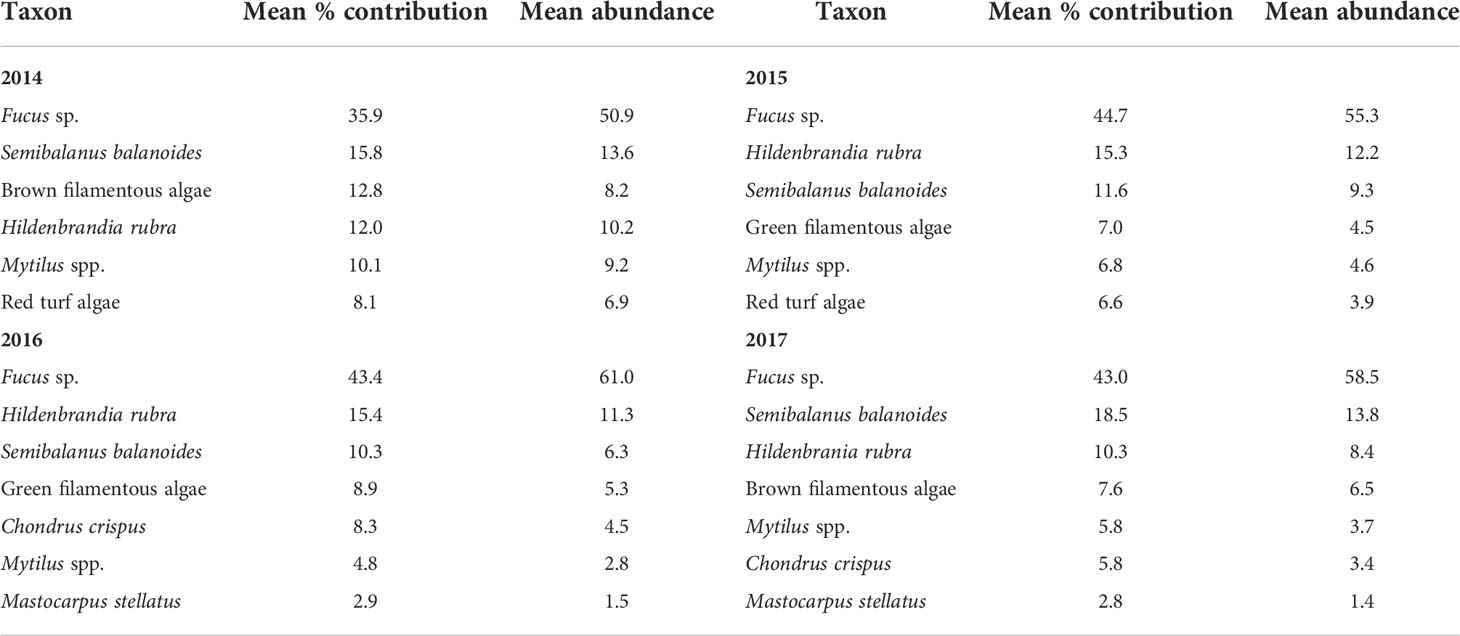
Table 3 Summary results of SIMPER analyses for sessile species, indicating the mean percent contribution to similarity in species composition among locations (see Materials and Methods for details) and the mean abundance (percent cover) across all locations for each surveyed year. For brevity, only the species with the highest contribution are shown (those amounting to a cumulative contribution of 90%).
The species composition of mobile species was also significantly affected by location (pseudo-F = 3.92, P < 0.001), year (pseudo-F = 23.44, P < 0.001), and the year x location interaction (pseudo-F = 5.18, P < 0.001), as indicated by the two-way PERMANOVA. Due to the significant interaction term, we ran one-way PERMANOVAs and found that species composition differed among locations for each surveyed year, as the pseudo-F value was 5.83 in 2014, 13.69 in 2015, 11.84 in 2016, and 14.53 in 2017 (P < 0.001). The species that mainly explained the compositional changes across locations were, as for sessile species, always basically the same (Table 4). The most important species in terms of contribution to biogeographic pattern were periwinkles (identified as Littorina spp. in 2014 and as L. obtusata and L. littorea afterwards), followed by dogwhelks (Nucella lapillus) and amphipods (Table 4). Separate analyses of variance detected significant effects of location and year on the abundance of these species (P < 0.01). Overall, their latitudinal patterns of abundance showed some consistency throughout the years (Figure 5 and Table 2). Although when both periwinkles were combined as Littorina spp. (in 2014) no clear pattern was evident, when they were measured separately (2015 to 2017) L. obtusata was generally most abundant at southern locations and L. littorea at some northern locations. Dogwhelks were always abundant at L2 and L8 in relation to most or all other locations, while dominance at some locations (e.g., L1) was more variable over the years. Amphipods exhibited more irregular patterns of abundance.
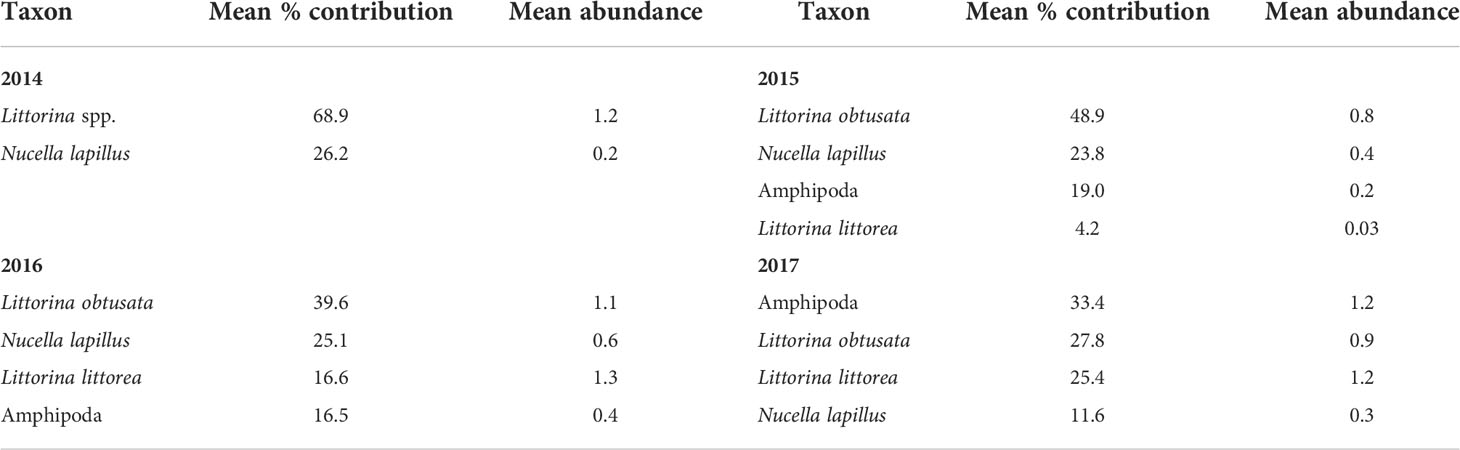
Table 4 Summary results of SIMPER analyses for mobile species, indicating the mean percent contribution to similarity in species composition among locations (see Materials and Methods for details) and the mean abundance (individuals dm-2) across all locations for each surveyed year. For brevity, only the species with the highest contribution are shown (those amounting to a cumulative contribution of 90%).
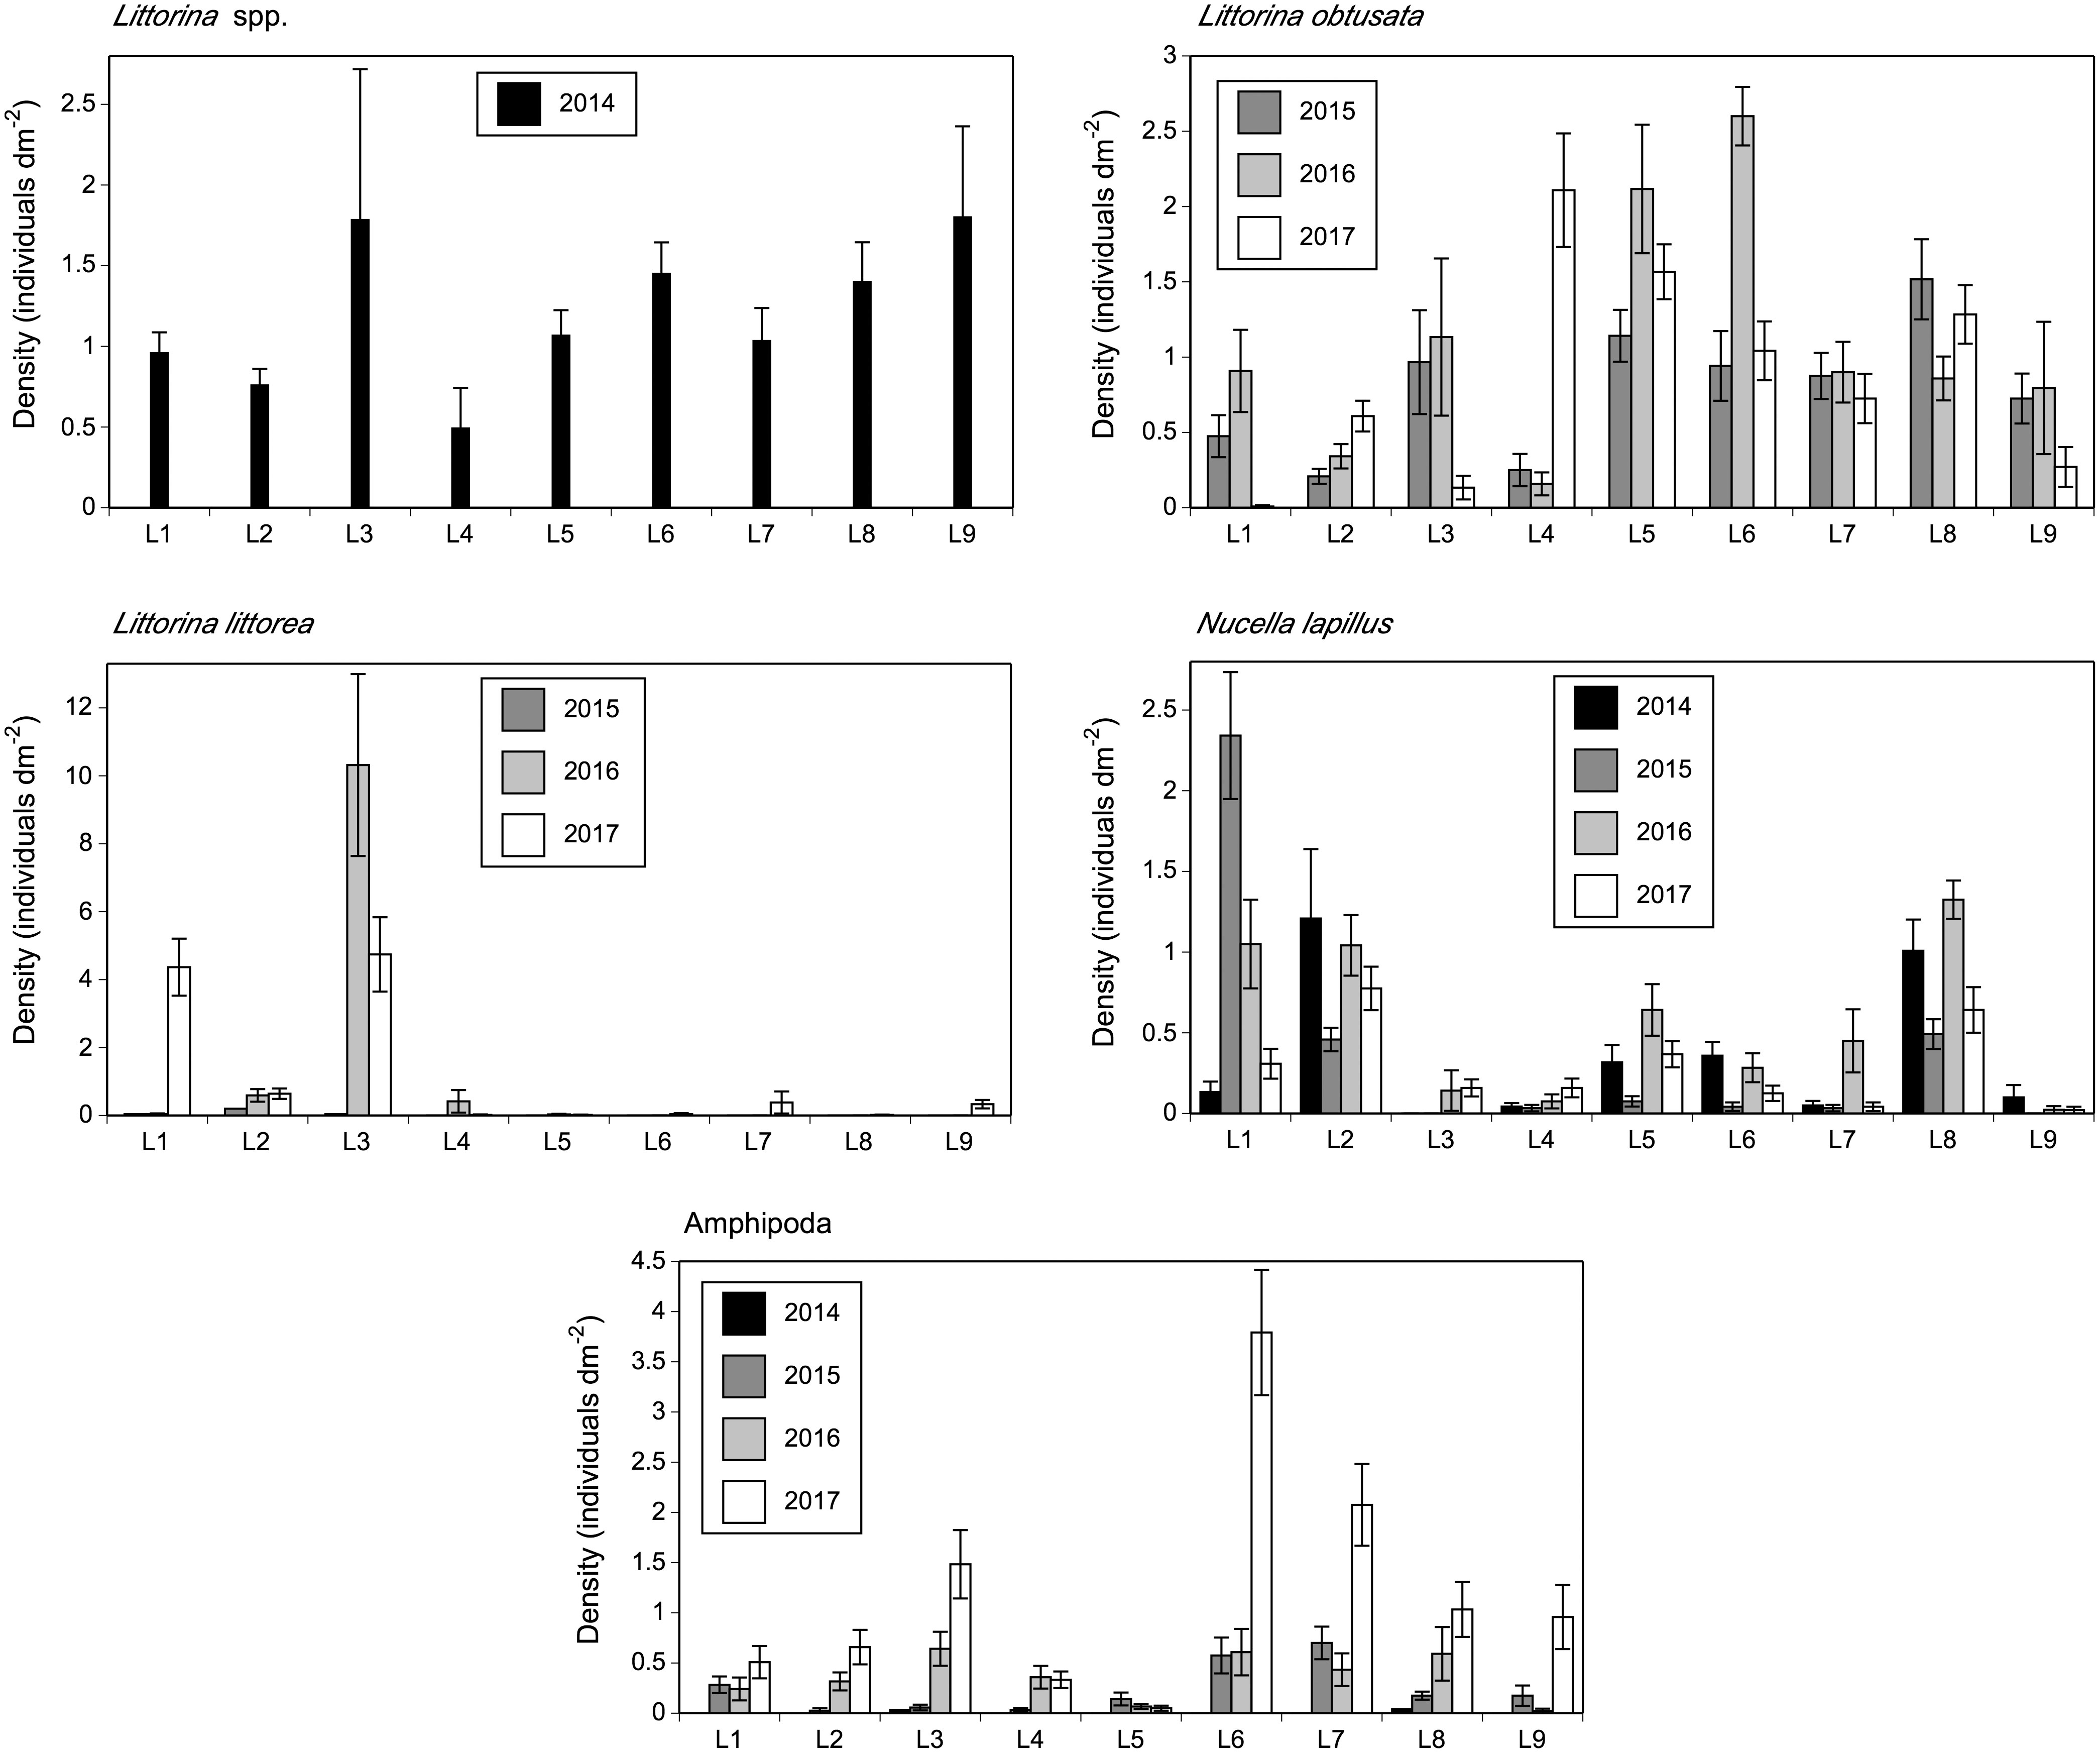
Figure 5 Density (mean ± SE) of the mobile species that had the largest contribution to the multivariate patterns for mobile species as revealed by SIMPER analyses.
Relationships between biogeographic patterns and environmental variables
SST, MaxT, MinT, Chla, and POC were all included in the best DISTLM model (the one with the lowest AICc value) of each year. These models explained 32–55% of the biogeographic variation for sessile species, depending on the year (Table 5). Each year, MaxT had a higher value of squared semipartial correlation than the other four variables in the DISLM and it often exhibited higher values at southern locations than at northern locations (Figure 6). Conversely, SST and MinT showed a tendency to being lower at some or all of the southern locations (Figure 6). Chla was often relatively high at L4, L7, and mainly L8, although alongshore patchiness existed as well (Figure 6). POC was highest at L8 in three of the four studied years (Figure 6). We note that separate analyses of variance done for these variables revealed significant location and year effects in all cases (P < 0.01) except year for POC (P = 0.53), although that result is not relevant for our goal of evaluating the statistical influence of these variables on biogeographic pattern every year.
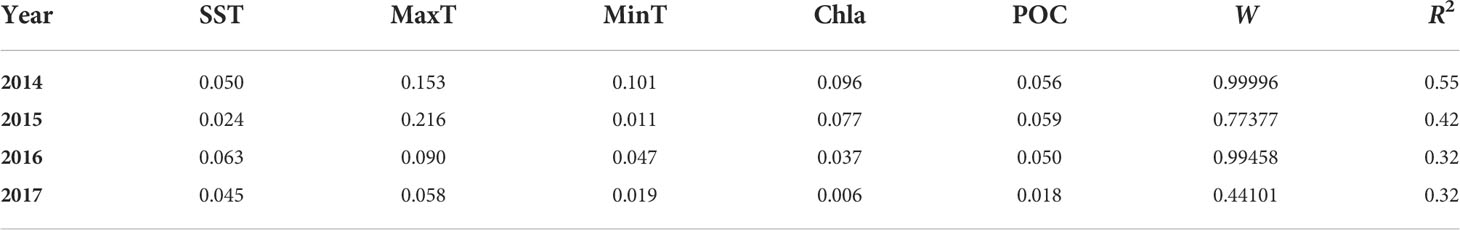
Table 5 Summary of the DISTLM analyses that investigated the relationship between multivariate pattern for sessile species and environmental variables (see Materials and Methods for details). For brevity, we report the relevant statistics for the best model for each year (the one with the lowest AICc value), which always included the five measured environmental variables. The cells for each variable in the table indicate the squared semipartial correlation coefficient for each year. The weight of evidence for each model is indicated as W. The amount of variation in the response variable explained by each model is indicated with R2 (P < 0.001 in all cases).
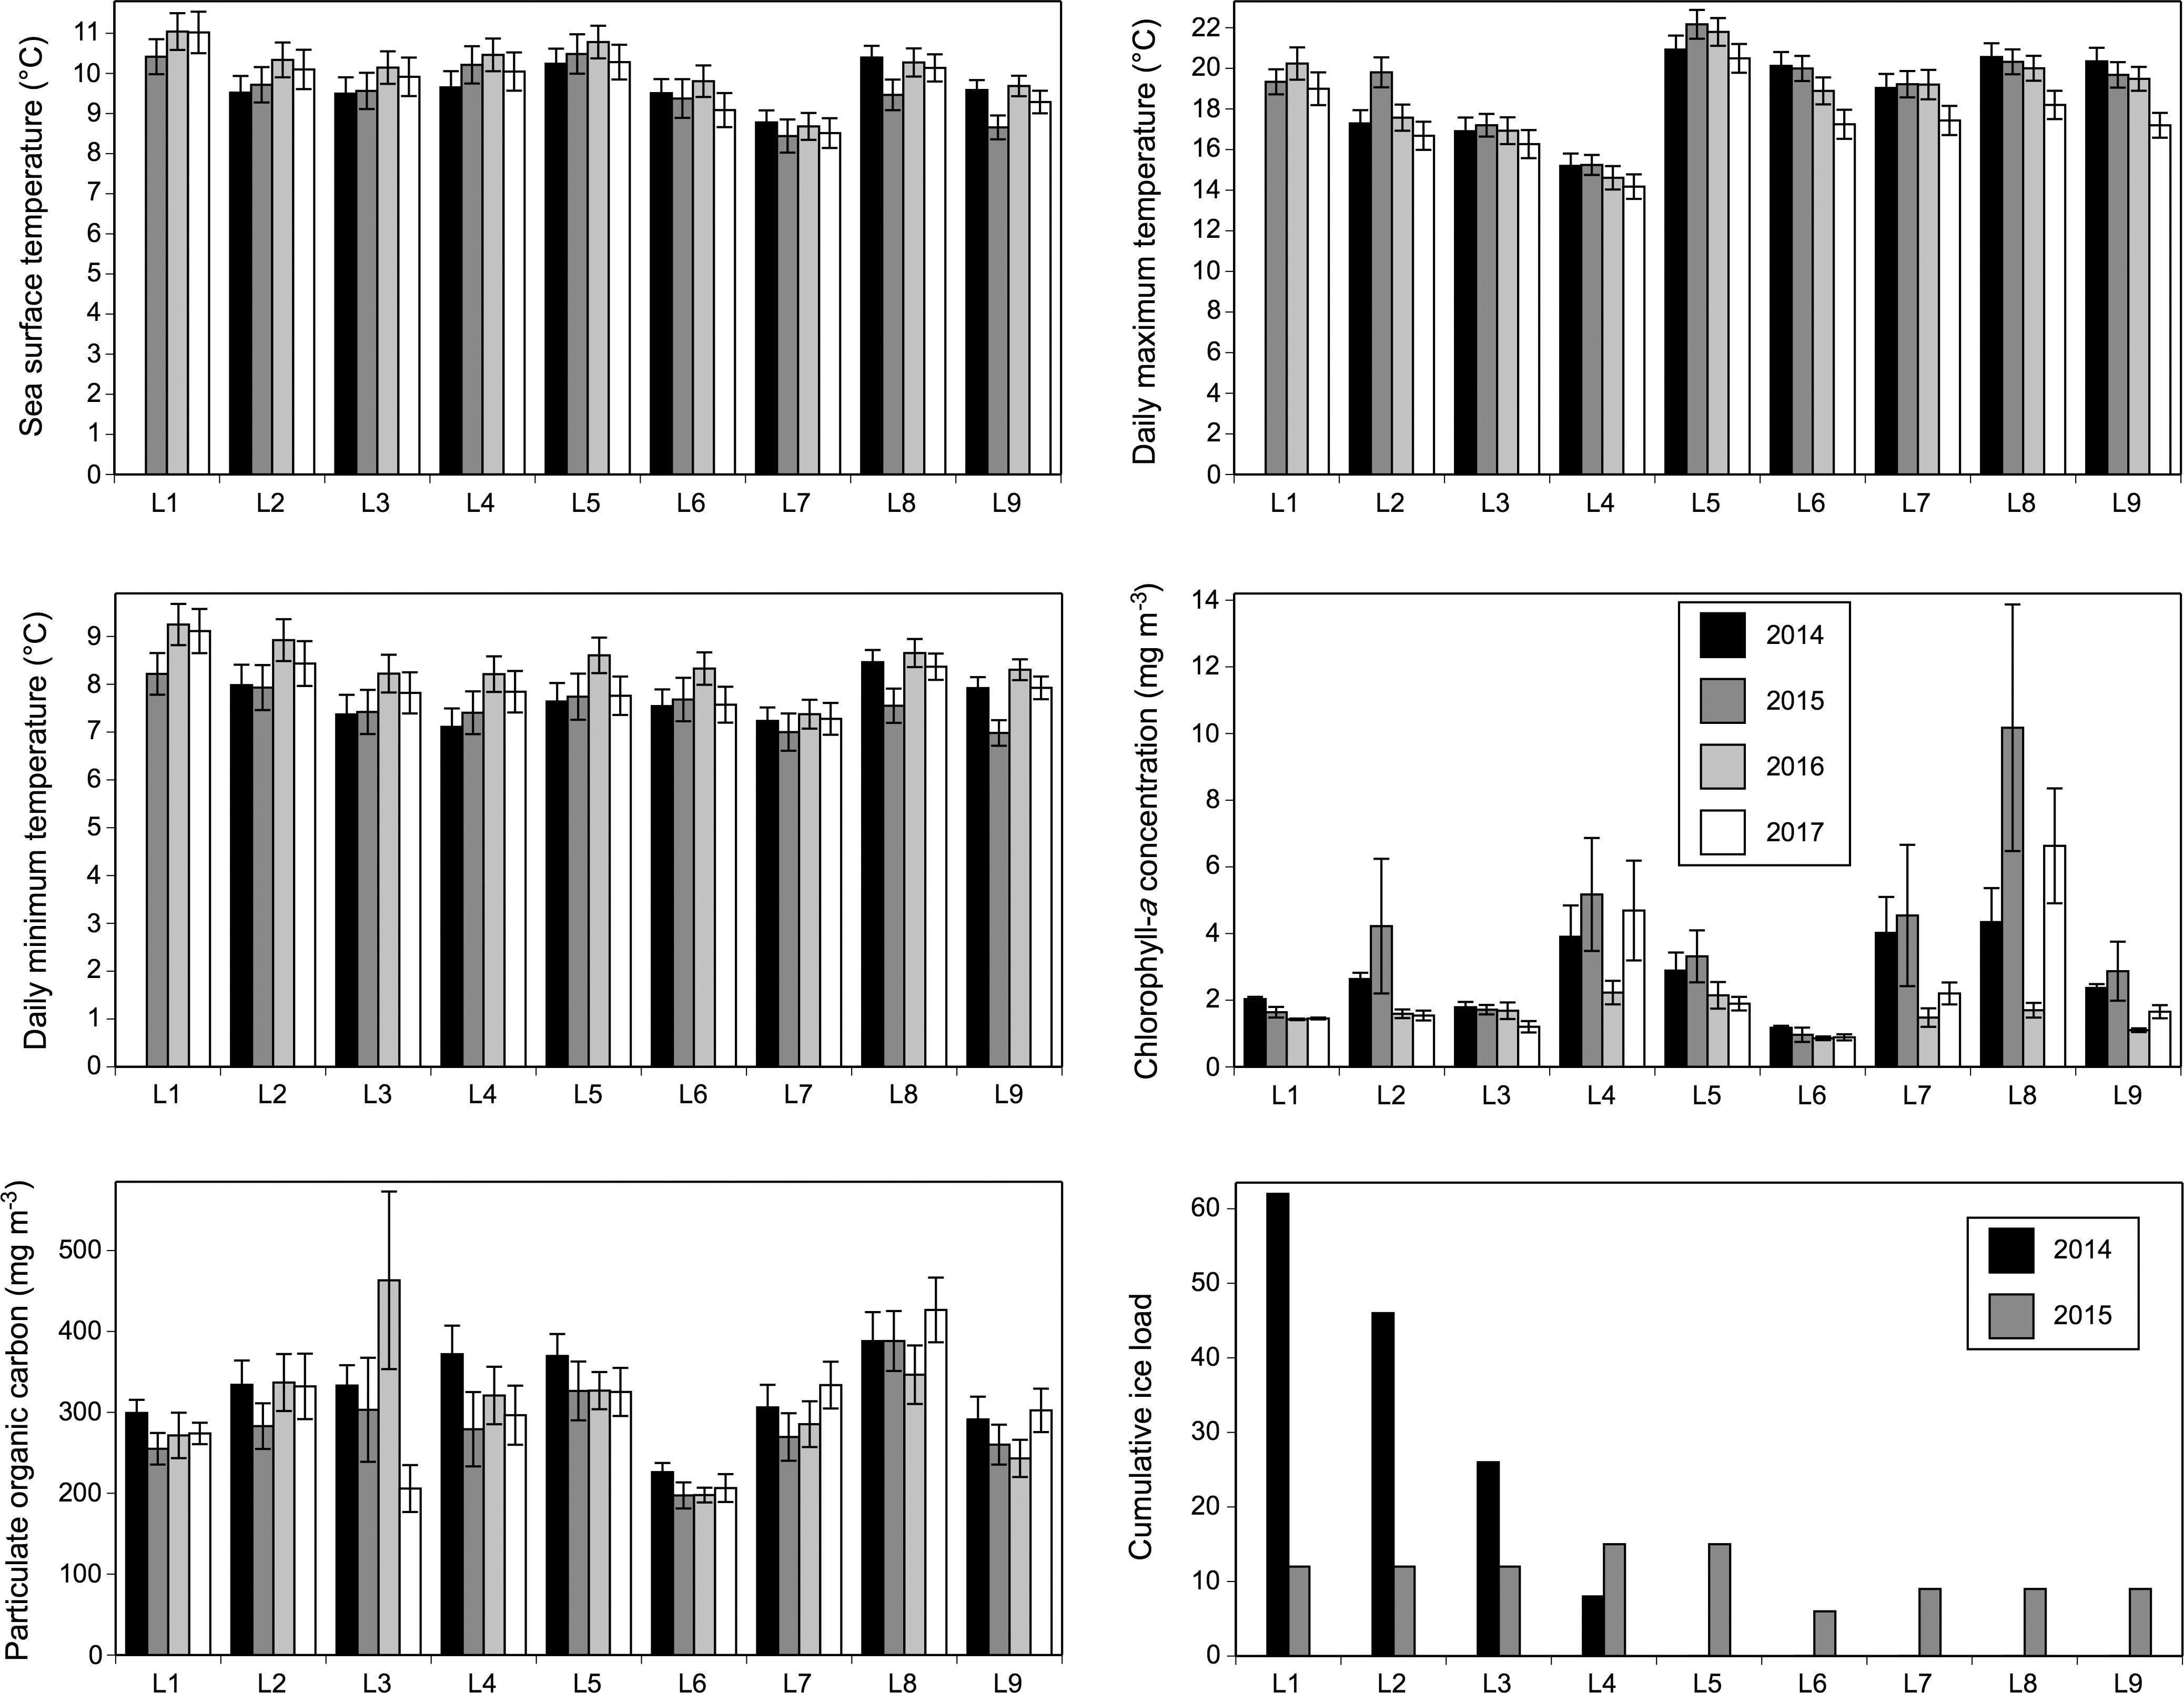
Figure 6 Sea surface temperature, daily maximum temperature, daily minimum temperature, chlorophyll-a concentration, and particulate organic carbon (mean ± SE) measured during the growth season and cumulative ice load measured during the cold season for each location and year. See Materials and Methods for the underlying rationale for these measurements.
In 2014, ice load during the cold season explained 23% of the summer biogeographic variation of sessile species (P < 0.001). In 2014, the drift ice coming from the north reached mainland Nova Scotia in early April. It was most prevalent at L1 (occurring over 10 days, with a concentration of 80% in 7 of those days) and L2 (occurring over 8 days, with a concentration of 80% in 5 of those days; Figure 2) and decreased towards L4 (occurring over 4 days with a maximum daily concentration of only 20%), not reaching locations south of L4 (Figures 2, 6). In 2015, winter ice load statistically explained 21% of the summer biogeographic variation for sessile species (P < 0.001). In 2015, drift ice reached mainland Nova Scotia around mid-February, spanned a longer extent of coastline, and was generally more abundant in northern locations, but daily concentrations never surpassed 30% and were similar across locations (Figure 6). In fact, field surveys done at our nine locations in April 2015 did not detect intertidal disturbances as found so clearly after the occurrence of drift ice at our northern locations in 2014 (Figure 2). No significant drift ice occurred on the studied coast in 2016 or 2017.
Species associations
In 2014, the abundance of Fucus was correlated to species richness, both variables being generally higher at southern locations and Fucus abundance statistically explaining 62% of the variation in richness. The basic latitudinal pattern for richness persisted in 2015, 2016, and 2017. In those years, Fucus abundance was also correlated to richness, but statistically explained only 4–16% of its variation, seemingly because the marked increase that Fucus abundance had at L2 after 2014 (Figure 7) was not mirrored by a similar increase in richness at that location. The abundance of red turf algae (which always peaked at L8 and L9) was correlated to species richness in 2014, 2015, and 2017, although then explaining only 7–22% of its variation, and statistically uncorrelated to richness in 2016 (Table 6 and Figure 7).
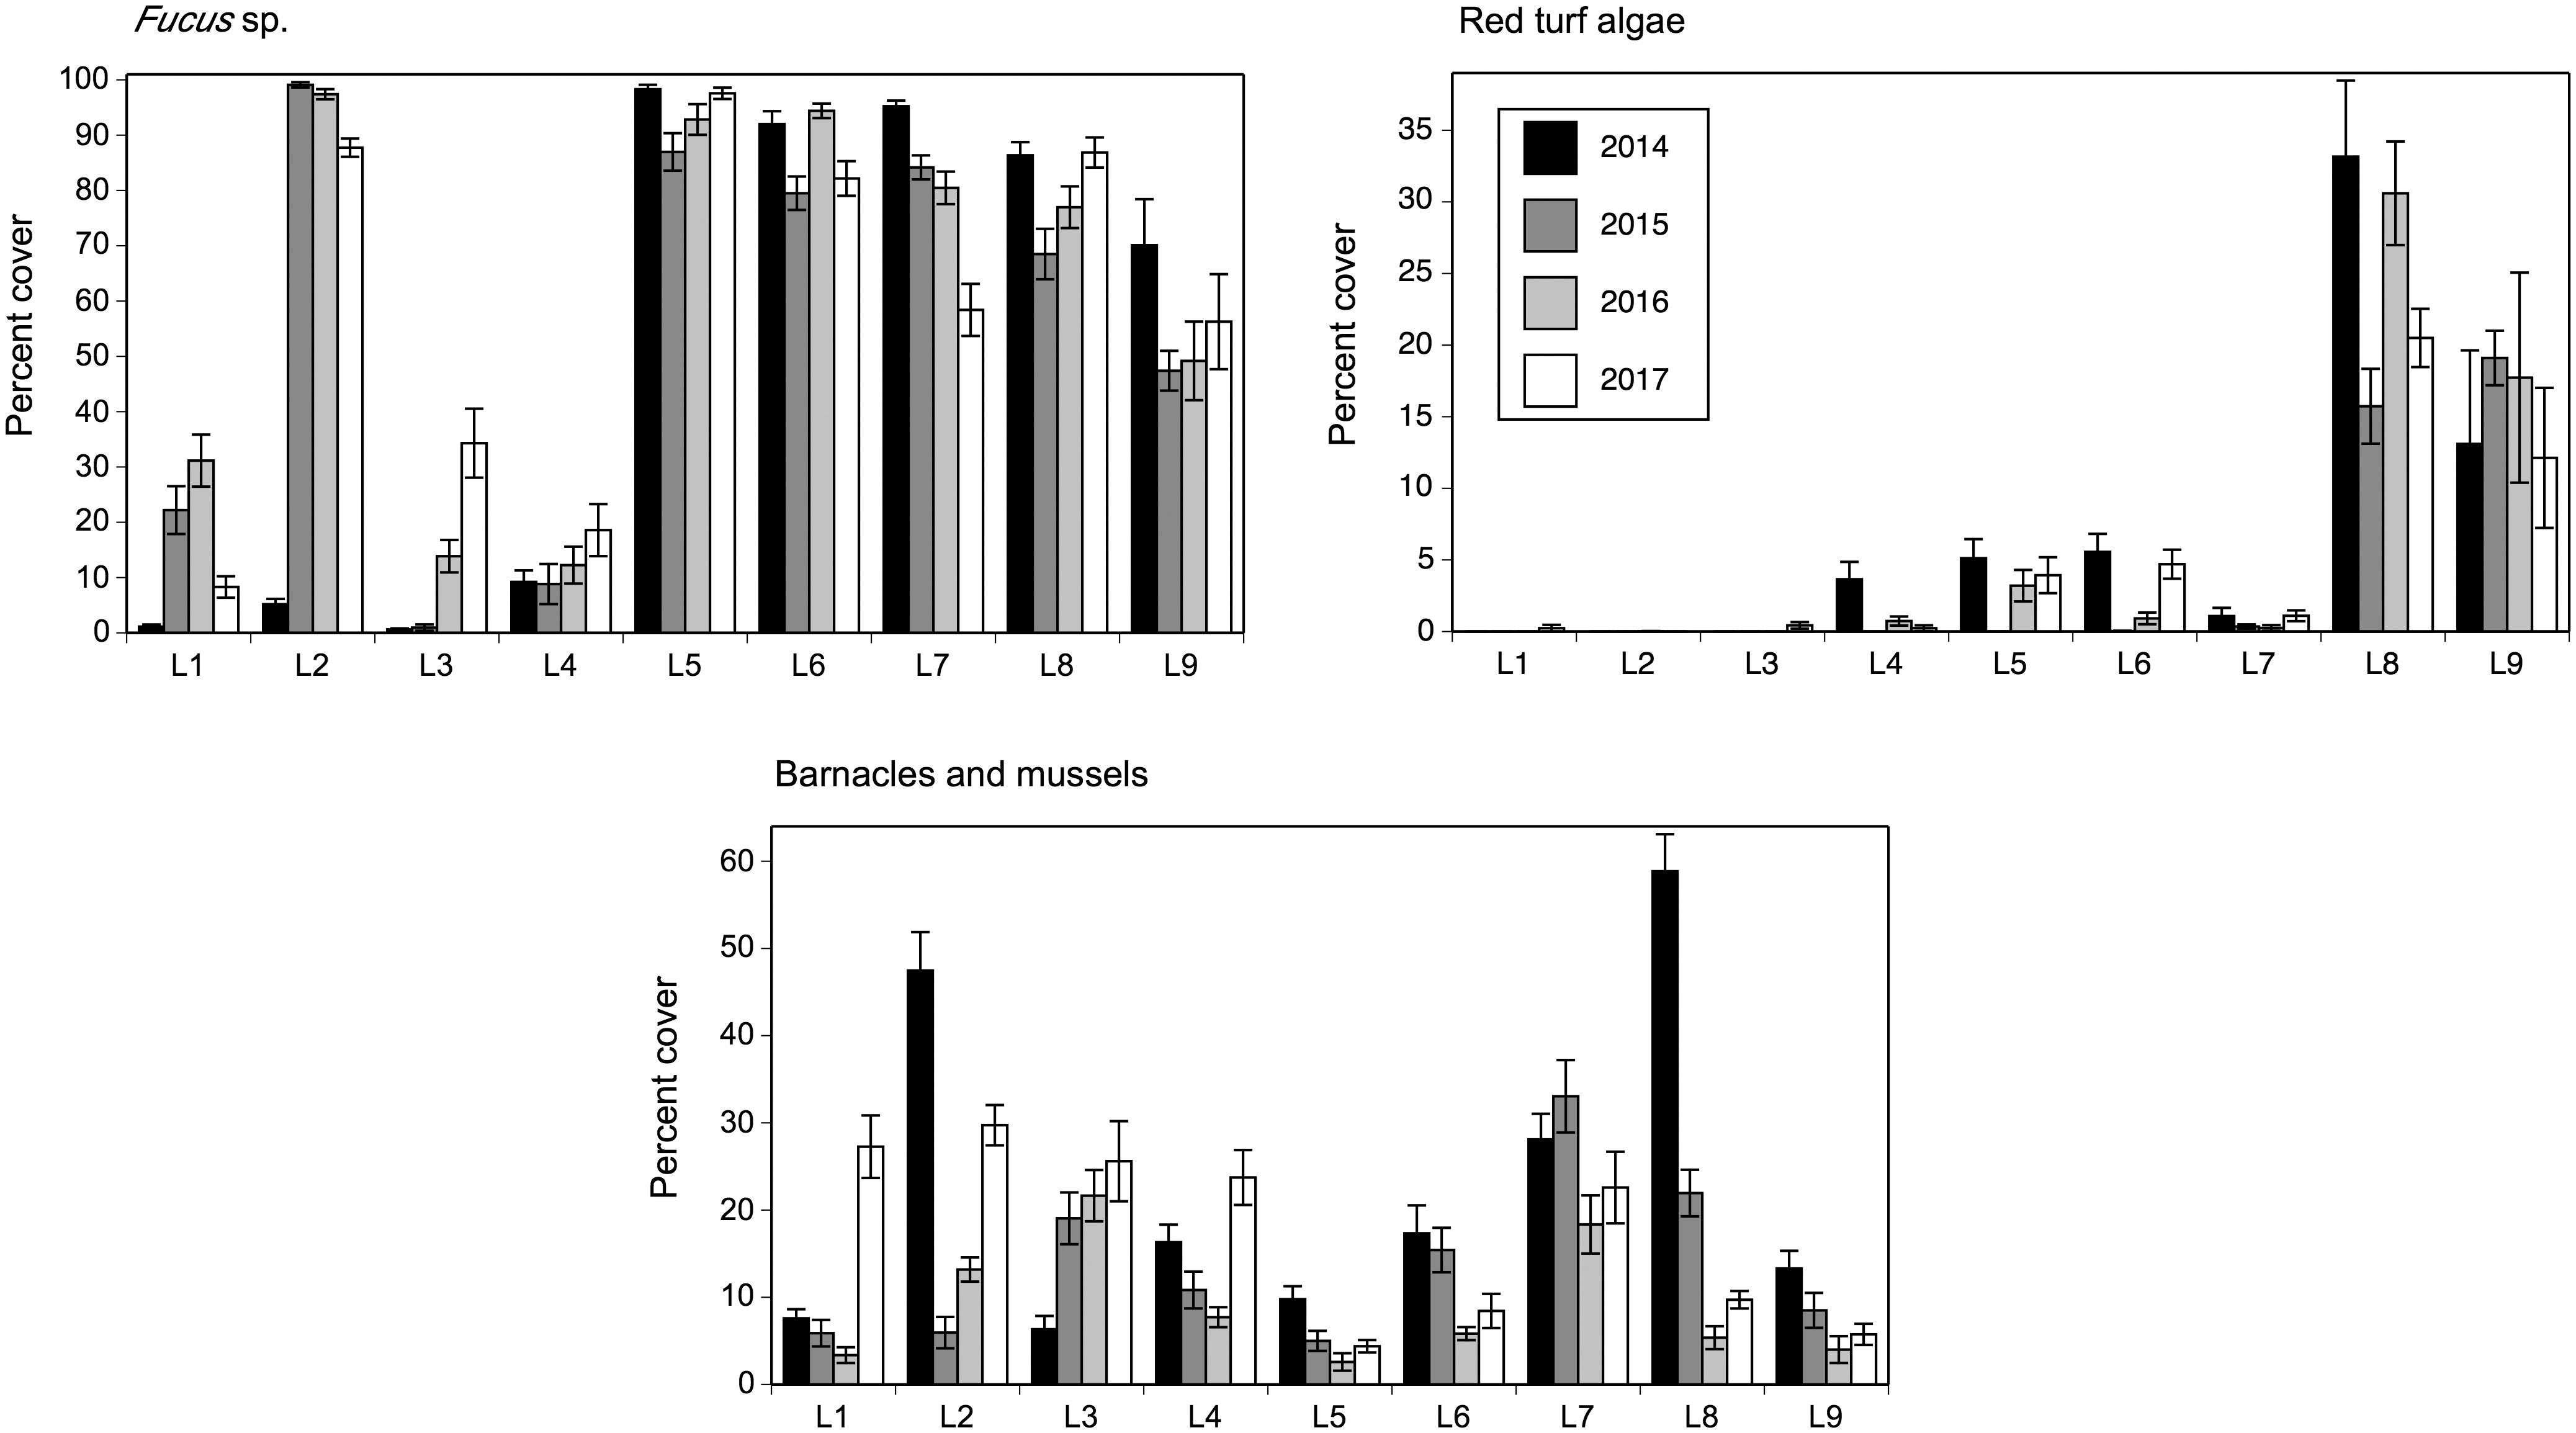
Figure 7 Percent cover (mean ± SE) of the sessile species that had the largest contribution to the multivariate patterns for sessile species as revealed by SIMPER analyses.
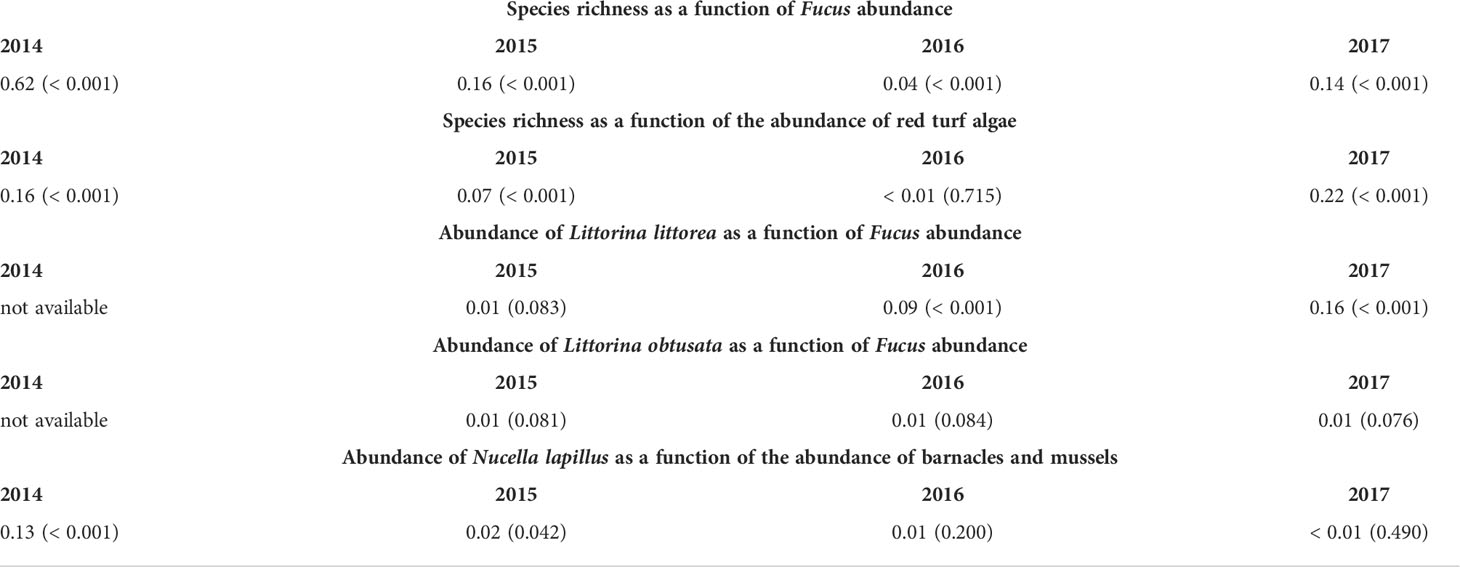
Table 6 Summary results for correlation analyses (R2, with P in parenthesis) examining species associations. Refer to Materials and Methods for details.
We determined the association between Fucus and each Littorina species only between 2015 and 2017, because in 2014 we combined both periwinkles as Littorina spp. In 2015, Fucus abundance was unrelated to the abundance of L. littorea, but both variables were negatively related in 2016 and 2017, although Fucus abundance then explained only 9–16% of the variation in L. littorea abundance. Under a significance level of 0.05, Fucus abundance was statistically unrelated to the abundance of L. obtusata in 2015, 2016, and 2017, but those relationships were significant under a significance level of 0.09, although Fucus abundance nonetheless then explained only 1% of the variation in L. obtusata abundance (Table 6 and Figures 5, 7).
Dogwhelks were most abundant at L2 and L8 in all four years (although an unusual peak at L1 occurred in 2015). Barnacle and mussel abundance statistically explained 13% of the variation in dogwhelk abundance in 2014, but correlations were very low or statistically insignificant for the other three years (Table 6 and Figures 5, 7).
Discussion
The open Atlantic coast of Nova Scotia is a hydrographically distinct subregion of the NW Atlantic cold-temperate biogeographic region (Mathieson et al., 1991). Using species abundance data measured over four years at the mid-to-high intertidal zone at nine locations along the Atlantic coast of Nova Scotia, this study provides the first account of latitudinal and interannual biogeographic patterns in wave-exposed rocky intertidal habitats in this subregion. The biogeographic characterization of this metaecosystem can be best done using the data for sessile species (algae and filter-feeding invertebrates) given the logistical constraints that influenced our field work (detailed in Materials and Methods). Thus, based on the univariate and multivariate results for sessile species viewed in combination for all studied years, the Atlantic coast of mainland Nova Scotia exhibits a composite of northern and southern locations, exemplified by our locations L1 to L4 and L5 to L9, respectively. Southern locations generally have more species, show higher levels of space occupancy, are biologically more similar to one another, and have a higher interannual consistency in species composition than northern locations. The following paragraphs discuss possible drivers underlying these patterns.
When abundant, drift ice coming from the Gulf of St. Lawrence at the end of the cold season influences these biogeographic patterns. The abundant drift ice that scoured the coast between L1 and L4 in April 2014 caused extensive disturbance there, removing almost all organisms particularly at L1 and L2 (Figure 2). Recolonization started soon after the ice disappeared, initially mainly by barnacles (because their recruitment spans May and June; Scrosati and Holt, 2021) and later by Fucus and other species. In the summer of 2014, however, species composition still differed broadly between these four northern locations and locations L5-L9, which had not been reached by drift ice. The scarcity of drift ice in 2015 and its absence in 2016 and 2017 enabled further recolonization to occur at the northern locations. Nonetheless, species composition still differed broadly between three of the northern locations (L1, L3, and L4) and L5-L9 between 2015 and 2017. In the ordinations for 2015-2017, L2 grouped with the southern locations (mainly due to a strong recolonization by Fucus) but it still had fewer species than the southern locations. It is possible, then, that the lower species richness often found at northern locations may result in part from a slow ecological succession and the recurrence of ice scour at irregular interannual scales. Latitudinal patchiness in species composition along the coast has been observed for other intertidal systems (Sink et al., 2005; Blanchette et al., 2008; Broitman et al., 2011). Overall, our observations constitute another example of how physical disturbance can structure intertidal seascapes (Paine and Levin, 1991).
Modelling showed that also temperature and pelagic food supply during the growth season were related to alongshore biogeographic pattern. Interestingly, just the five environmental variables used to describe these properties (SST, MaxT, MinT, Chla, and POC) explained 32-55% of the observed biogeographic variation, depending on the year. This is remarkable, as statistically explaining spatial community patterns is difficult given the many factors at play in nature (Low-Décarie et al., 2014; Menge et al., 2015; Robuchon et al., 2017). MaxT was statistically the most important variable in all four years (its squared semipartial correlation reaching up to 22%) and usually showed higher values at southern locations than at northern locations. During the period considered as the main growth season (1 May to 8 August; see Materials and Methods for rationale), MaxT is often reached at low tide and thus mainly represents air temperature, as the daily maxima in air temperature then often surpass seawater temperature (Scrosati et al., 2020). Thus, the southward increase in MaxT may simply reflect broad latitudinal gradients in air temperature. As we never observed widespread mortality at southern locations in the summer, these higher MaxT values seem not to have been extreme for intertidal life. Instead, it is more likely that the southward increase in MaxT may favour species growth and survival (Wahl et al., 2021), in that way contributing to the higher space occupancy observed at our southern locations. This notion could be further examined by estimating in-situ body temperatures for a variety of species depending on ambient MaxT, although the size of existing loggers continues to prevent their usage in many cases. For example, body temperature has been estimated for shelled intertidal invertebrates using loggers embedded in soft materials inside shells mimicking live organisms (Judge et al., 2018). However, on our wave-exposed habitats, the organisms typically used for such purposes (e.g., mussels, barnacles, and limpets) are often considerably smaller than in nearby wave-sheltered environments (Tam and Scrosati, 2014) or in wave-exposed environments from other coasts (Judge et al., 2018).
Although SST and MinT showed more irregular alongshore patterns than MaxT, both variables were generally lower at some or all of the southern locations. Between 1 May and 8 August (the growth season; see Materials and Methods for rationale), MinT is often similar to SST on this coast because of warm weather conditions (Scrosati et al., 2020). However, both variables were included in the best model in each studied year by our model selection technique, indicating that both variables were statistically relevant, albeit in a limited way. SST is often related to intertidal biogeographic patterns (Sink et al., 2005; Blanchette et al., 2008; Fenberg et al., 2015; Lloyd et al., 2020), but it is hard to make precise inferences on its ecological role through mensurative approaches. The observed daily drops in SST during the growth season, particularly in summer, suggest that coastal upwelling occurs along our coast but is more pronounced at southern locations (Scrosati and Ellrich, 2020). Then, southern locations might experience a higher input of upwelled inorganic nutrients (as found for other coasts; Pfister et al., 2007; Broitman et al., 2011; Blanchette et al., 2016), which might further help to explain the higher algal cover found at southern locations. An interesting case is represented by L2. Although this northern location was intensely scoured by drift ice in April 2014 (Figure 2), it experienced a vigorous recolonization by Fucus that superficially made it look like southern locations between 2015 and 2017 (Figure 2). Up a narrow inlet from L2, there was an onshore aquaculture operation that might have released inorganic nutrients as waste towards the open ocean (McIver et al., 2018), which may have fueled the high Fucus growth seen at L2. Periodic data on nutrient concentration and algal growth rates, currently unavailable, are needed to evaluate these possibilities further.
The contribution of Chla and POC was always limited in the models, each variable never explaining more than 10% of the biogeographic variation of sessile species. This could be so because both variables measure pelagic food supply for filter-feeders, with no obvious direct relevance to algae. In any case, Chla and POC varied irregularly along the coast. Interestingly, both variables were often higher at L8 than at most or all other locations, and mussels were often abundant or most abundant at that location, depending on the year. A separate study found that barnacle growth in the same four years was always relatively high at L8 (Scrosati and Ellrich, 2019). In combination, these observations support the notion that pelagic food supply may explain some biological patterns along this coast, but that its relevance to overall patterns for sessile species is limited.
The canopy-forming alga Fucus can be very abundant in the studied habitats. Thus, the correlation found every year between Fucus cover and species richness suggests that facilitation by this foundation organism may contribute to the higher richness at southern locations, where Fucus is most abundant. The correlation was strong in 2014 but weakened in subsequent years, although mainly as a result of changes at L2, where the vigorous recolonization of Fucus after the 2014 ice scour event (Figure 2) was not accompanied by a similar increase in richness. In fact, removing L2 from the analyses for 2015-2017 resulted in Fucus cover statistically explaining more variation in species richness (21% in 2014, 9% in 2015, and 33% in 2017; P < 0.001) than considering all nine locations. As the cover of red turf algae (Chondrus crispus and Mastocarpus stellatus) was also correlated to species richness, although not strongly and only in three of the four studied years, these algae may also be contributing to richness patterns to some extent (Scrosati, 2016). Facilitation by canopy-forming algae through the limitation of thermal and desiccation stress at low tide has been noted for several species, particularly at the upper intertidal zone where aerial exposure periods are long (Bertness et al., 1999; Watt and Scrosati, 2013; Umanzor et al., 2019).
Based on the snapshot abundance data collected each year for mobile species, some consistent patterns emerged for these organisms. The density of the main herbivores (the periwinkles Littorina littorea and L. obtusata) and the main carnivore (the dogwhelk Nucella lapillus) varied clearly across locations. The negative relationship between the density of L. littorea and Fucus cover in two of the three examined years (both periwinkles were combined as Littorina spp. in 2014) might indicate a higher supply of food (benthic microalgae on the rocky substrate; Hawkins and Hartnoll, 1983) for these snails as Fucus cover decreases. On the other hand, evidence for possible bottom-up forcing (association between consumer density and the abundance of its food source) was limited. For instance, the abundance of L. obtusata (which feeds on Fucus; Molis et al., 2015) was correlated to Fucus cover only under a significance level of 0.09 and with R2 values of merely 1%, while the abundance of dogwhelks (which feed on barnacles and mussels; Leonard, 2000; Sherker et al., 2017) was correlated to the combined cover of these filter-feeders only in 2014 (with an R2 of 13%). Field observations consistent with bottom-up forcing (using the mussel–dogwhelk system) have previously been made along the NW Atlantic coast (Tam and Scrosati, 2011). It is then possible that this phenomenon may be more common than what our snapshot data on consumer abundance were able to reveal. Using consumer abundance data averaged over several days (to account for their daily elevational movements) might better assess this possibility, although a larger field team will be needed to repeatedly survey distant wave-exposed locations during the same time period.
In summary, this study documents biogeographic variation at mid-to-high intertidal elevations in wave-exposed rocky intertidal habitats along the Atlantic coast of Nova Scotia. Characteristic patterns were identified thanks to the replication of surveys over consecutive years, which is a desirable approach for coastal biogeographic research (Raimondi et al., 2019). In addition to its inherent value to advance NW Atlantic intertidal biogeography, the resulting database on species distribution should also be valuable to quantify ecological change decades into the future as climate change and other anthropogenic influences unfold (Sagarin et al., 1999; Wethey and Woodin, 2008; Wilson et al., 2019; Menge et al., 2022; Monteiro et al., 2022; Navarrete et al., 2022; Raymond et al., 2022; Storch et al., 2022). In this sense, this study identifies environmental variables that could be monitored regularly to help predict possible biological changes (Herfindal et al., 2022). Besides having direct influences, environmental variables may also affect species distribution indirectly by influencing interspecific interactions (Menge and Sutherland, 1987; Silliman and He, 2018). Thus, our results on species associations could be complemented with experimental studies on interspecific interactions in relation to environmental variation, as done for other systems (Abrego et al., 2021; Sirén et al., 2022). Overall, given our results, increasing temperature and reduced ice scour as expected for future climatic scenarios might induce a northward shift in the observed biogeographic patterns. Ultimately, the information presented in this study enriches our knowledge on Canadian marine biodiversity (Archambault et al., 2010; Wei et al., 2020) and could assist efforts to plan and establish marine protected areas along our coast (e.g., DFO, 2022).
Data availability statement
The species abundance dataset used for this study can be freely downloaded from the figshare online repository at this address: https://doi.org/10.6084/m9.figshare.20205023.v1.
Author contributions
RS designed the study, led the field work and data analyses, and wrote the manuscript. JE and WP measured species abundance and handled the temperature loggers. MF retrieved the online environmental data and performed data analyses. All authors discussed the results and contributed to the final manuscript version.
Funding
This study was funded by grants from the Canada Research Chairs program (CRC grant #210283), the Natural Sciences and Engineering Research Council (NSERC Discovery Grant #311624), and the Canada Foundation for Innovation (CFI Leaders Opportunity Grant #202034) awarded to RS, by a postdoctoral scholarship from the German Academic Exchange Service (DAAD scholarship #91617093) awarded to JE, and by a Nova Scotia Graduate Scholarship from the province of Nova Scotia (Canada) awarded to MF.
Acknowledgments
We thank Maike Willers and Carmen Denfeld for field assistance and the reviewers for providing constructive comments on earlier versions of this paper.
Conflict of interest
The authors declare that the research was conducted in the absence of any commercial or financial relationships that could be construed as a potential conflict of interest.
Publisher’s note
All claims expressed in this article are solely those of the authors and do not necessarily represent those of their affiliated organizations, or those of the publisher, the editors and the reviewers. Any product that may be evaluated in this article, or claim that may be made by its manufacturer, is not guaranteed or endorsed by the publisher.
References
Abell R., Thieme M. L., Revenga C., Bryer M., Kottelat M., Bogutskaya N., et al. (2008). Freshwater ecoregions of the world: A new map of biogeographic units for freshwater biodiversity conservation. BioScience 58, 403–414. doi: 10.1641/B580507
Abrego N., Roslin T., Huotari T., Ji Y., Schmidt N. M., Wang J., et al. (2021). Accounting for species interactions is necessary for predicting how Arctic arthropod communities respond to climate change. Ecography 44, 885–896. doi: 10.1111/ecog.05547
Adey W. H., Hayek L. C. (2005). The biogeographic structure of the western north Atlantic rocky intertidal. Cryptogamie Algol. 26, 35–66.
Anderson D. R. (2008). Model-based inference in the life sciences: A primer on evidence (New York: Springer).
Anderson M. J., Gorley R. N., Clarke K. R. (2008). PERMANOVA+ for PRIMER: Guide to software and statistical methods (Plymouth: PRIMER-E).
Archambault P., Snelgrove P. V. R., Fisher J. A. D., Gagnon J. M., Garbary D. J., Harvey M., et al. (2010). From sea to sea: Canada’s three oceans of biodiversity. PLoS ONE 5, e12182. doi: 10.1371/journal.pone.0012182
Arribas L. P., Bagur M., Gutiérrez J. L., Palomo M. G. (2014). Matching spatial scales of variation in mussel recruitment and adult densities across southwestern Atlantic rocky shores. J. Sea Res. 95, 16–21. doi: 10.1016/j.seares.2014.10.015
Bell E. C., Denny M. W. (1994). Quantifying "wave exposure": A simple device for recording maximum velocity and results of its use at several field sites. J. Exp. Mar. Biol. Ecol. 181, 9–29. doi: 10.1016/0022-0981(94)90101-5
Bertness M. D. (2007). Atlantic shorelines. Natural history and ecology (Princeton: Princeton University Press).
Bertness M. D., Leonard G. H., Levine J. M., Schmidt P. R., Ingraham A. O. (1999). Testing the relative contribution of positive and negative interactions in rocky intertidal communities. Ecology 80, 2711–2726. doi: 10.1890/0012-9658(1999)080[2711:TTRCOP]2.0.CO;2
Blanchette C. A., Denny M. W., Engle J. M., Helmuth B., Miller L. P., Nielsen K. J., et al. (2016). “Intertidal,” in Ecosystems of California. Eds. Mooney H., Zavaleta E. (Oakland: University of California Press), 337–357.
Blanchette C. A., Miner C. M., Raimondi P. T., Lohse D., Heady K. E. K., Broitman B. R. (2008). Biogeographical patterns of rocky intertidal communities along the Pacific coast of North America. J. Biogeogr. 35, 1593–1607. doi: 10.1111/j.1365-2699.2008.01913.x
Boaventura D., Ré P., da Fonseca L. C., Hawkins S. J. (2002). Intertidal rocky shore communities on the continental Portuguese coast: Analysis of distribution patterns. Mar. Ecol. 23, 69–90. doi: 10.1046/j.1439-0485.2002.02758.x
Broitman B. R., Navarrete S. A., Smith F., Gaines S. D. (2001). Geographic variation of southeastern Pacific intertidal communities. Mar. Ecol. Prog. Ser. 224, 21–34. doi: 10.3354/meps224021
Broitman B. R., Véliz F., Manzur T., Wieters E. A., Finke G. R., Fornes P. A., et al. (2011). Geographic variation in diversity of wave-exposed rocky intertidal communities along central Chile. Rev. Chil. Hist. Nat. 84, 143–154. doi: 10.4067/S0716-078X2011000100011
Bryson E. S., Trussell G. C., Ewanchuk P. J. (2014). Broad-scale geographic variation in the organization of rocky intertidal communities in the Gulf of Maine. Ecol. Monogr. 84, 579–597. doi: 10.1890/13-1106.1
Burrows M. T., Jenkins S. R., Robb L., Harvey R. (2010). Spatial variation in size and density of adult and post-settlement Semibalanus balanoides: Effects of oceanographic and local conditions. Mar. Ecol. Prog. Ser. 398, 207–219. doi: 10.3354/meps08340
Bustamante R. H., Branch G. M., Eekhout S. (1997). The influences of physical factors on the distribution and zonation patterns of South African rocky-shore communities. S. Afr. J. Mar. Sci. 18, 119–136. doi: 10.2989/025776197784160901
Canadian Ice Service (2022) (Canadian Ice Service). Available at: http://ice-glaces.ec.gc.ca (Accessed July 4, 2022).
Clarke K. R. (1993). Non-parametric multivariate analyses of changes in community structure. Aust. J. Ecol. 18, 117–143. doi: 10.1111/j.1442-9993.1993.tb00438.x
Clarke K. R., Warwick R. M. (2001). Change in marine communities: An approach to statistical analysis and interpretation (Plymouth: PRIMER-E).
Connolly S. R., Roughgarden J. (1998). A latitudinal gradient in northeast Pacific intertidal community structure: Evidence for an oceanographically based synthesis of marine community theory. Am. Nat. 151, 311–326. doi: 10.1086/286121
Cox C. B., Moore P. D., Ladle R. J. (2016). Biogeography. An ecological and evolutionary approach (Chichester: John Wiley & Sons).
Crickenberger S., Wethey D. S. (2018). Annual temperature variation as a time machine to understand the effects of long-term climate change on a poleward range shift. Glob. Change Biol. 24, 3804–3819. doi: 10.1111/gcb.14300
Cusson M., Bourget E. (2005). Small-scale variations in mussel (Mytilus spp.) dynamics and local production. J. Sea Res. 53, 255–268. doi: 10.1016/j.seares.2004.07.005
DFO (2022) Eastern Shore islands: Area of interest (Fisheries and Oceans Canada). Available at: https://www.dfo-mpo.gc.ca/oceans/aoi-si/easternshore-ilescoteest-eng.html (Accessed July 4, 2022).
Dudgeon S. R., Steneck R. S., Davison I. R., Vadas R. L. (1999). Coexistence of similar species in a space-limited intertidal zone. Ecol. Monogr. 69, 331–352. doi: 10.1890/0012-9615(1999)069[0331:COSSIA]2.0.CO;2
Ellrich J. A., Scrosati R. A. (2017). Maximum water velocities in wave-exposed rocky intertidal habitats from Deming Island, Atlantic coast of Nova Scotia, Canada. Pangaea dataset. doi: 10.1594/pangaea.880722
Ellrich J. A., Scrosati R. A. (2018). Videos of rocky intertidal locations along the Atlantic coast of Nova Scotia, Canada. figshare online repository. doi: 10.6084/m9.figshare.6936308.v1
Fenberg P. B., Menge B. A., Raimondi P. T., Rivadeneira M. M. (2015). Biogeographic structure of the northeastern Pacific rocky intertidal: The role of upwelling and dispersal to drive patterns. Ecography 38, 83–95. doi: 10.1111/ecog.00880
Fenberg P. B., Rivadeneira M. M. (2019). On the importance of habitat continuity for delimiting biogeographic regions and shaping richness gradients. Ecol. Lett. 22, 664–673. doi: 10.1111/ele.13228
Freeman M. J. (2022). The biogeographic patterns of rocky intertidal communities along the wave-exposed coast of Nova Scotia, Canada M.Sc. thesis (Antigonish, NS, Canada: St. Francis Xavier University).
Freilich M. A., Wieters E., Broitman B. R., Marquet P. A., Navarrete S. A. (2018). Species co-occurrence networks: Can they reveal trophic and non-trophic interactions in ecological communities? Ecology 99, 690–699. doi: 10.1002/ecy.2142
Griffiths H. J., Waller C. L. (2016). The first comprehensive description of the biodiversity and biogeography of Antarctic and Sub-Antarctic intertidal communities. J. Biogeogr. 43, 1143–1155. doi: 10.1111/jbi.12708
Hawkins S. J., Hartnoll R. G. (1983). Grazing of intertidal algae by marine invertebrates. Oceanogr. Mar. Biol. Annu. Rev. 21, 195–282.
Hawkins S. J., Pack K. E., Firth L. B., Mieszkowska N., Evans A. J., Martins G. M., et al. (2019). “The intertidal zone of the north-east Atlantic region: Pattern and process,” in Interactions in the marine benthos: Global patterns and processes. Eds. Hawkins S. J., Bohn K., Firth L. B., Williams G. A. (Cambridge: Cambridge University Press), 7–46.
Heaven C. S., Scrosati R. A. (2008). Benthic community composition across gradients of intertidal elevation, wave exposure, and ice scour in Atlantic Canada. Mar. Ecol. Prog. Ser. 369, 13–23. doi: 10.3354/meps07655
Helmuth B., Harley C. D. G., Halpin P. M., O'Donnell M., Hofmann G. E., Blanchette C. A. (2002). Climate change and latitudinal patterns of intertidal thermal stress. Science 298, 1015–1017. doi: 10.1126/science.1076814
Herfindal I., Aanes S., Benestad R., Finstad A. G., Salthaug A., Stenseth N. C., et al. (2022). Spatiotemporal variation in climatic conditions across ecosystems. Clim. Res. 86, 9–19. doi: 10.3354/cr01641
Hill J. M., McQuaid C. D. (2008). δ13C and δ15N biogeographic trends in rocky intertidal communities along the coast of South Africa: Evidence of strong environmental signatures. Estuar. Coast. Shelf Sci. 80, 261–268. doi: 10.1016/j.ecss.2008.08.005
Høgslund S., Sejr M. K., Wiktor J., Blicher M. E., Wegeberg S. (2014). Intertidal community composition along rocky shores in southwest Greenland: A quantitative approach. Polar Biol. 37, 1549–1561. doi: 10.1007/s00300-014-1541-7
Hu L., Dong Y. (2022). Northward shift of a biogeographical barrier on China’s coast. Divers. Distrib. 28, 318–330. doi: 10.1111/ddi.13463
Hunt H. L., Scheibling R. E. (1996). Physical and biological factors influencing mussel (Mytilus trossulus, M. edulis) settlement on a wave-exposed rocky shore. Mar. Ecol. Prog. Ser. 142, 135–145. doi: 10.3354/meps142135
Hunt H. L., Scheibling R. E. (2001). Patch dynamics of mussels on rocky shores: Integrating process to understand pattern. Ecology 82, 3213–3231. doi: 10.1890/0012-9658(2001)082[3213:PDOMOR]2.0.CO;2
Ibanez-Erquiaga B., Pacheco A. S., Rivadeneira M. M., Tejada C. L. (2018). Biogeographical zonation of rocky intertidal communities along the coast of Peru (3.5–13.5° S southeast Pacific). PLoS ONE 13, e0208244. doi: 10.1371/journal.pone.0208244
Innes D. J., Bates J. A. (1999). Morphological variation of Mytilus edulis and Mytilus trossulus in eastern Newfoundland. Mar. Biol. 133, 691–699. doi: 10.1007/s002270050510
Ishida K., Tachibana M., Hori M., Okuda T., Yamamoto T., Nakaoka M., et al. (2021). Quantifying the dynamics of rocky intertidal sessile communities along the Pacific coast of Japan: Implications for ecological resilience. Sci. Rep. 11, 16073. doi: 10.1038/s41598-021-95348-1
Judge R., Choi F., Helmuth B. (2018). Recent advances in data logging for intertidal ecology. Front. Ecol. Evol. 6, 213. doi: 10.3389/fevo.2018.00213
Kelly N. E., Guijarro-Sabaniel J., Zimmerman R. (2021). Anthropogenic nitrogen loading and risk of eutrophication in the coastal zone of Atlantic Canada. Estuar. Coast. Shelf Sci. 263, 107630. doi: 10.1016/j.ecss.2021.107630
Kimbro D. L., Grosholz E. D. (2006). Disturbance influences oyster community richness and evenness, but not diversity. Ecology 87, 2378–2388. doi: 10.1890/0012-9658(2006)87[2378:DIOCRA]2.0.CO;2
Lany N. K., Zarnetske P. L., Gouhier T. C., Menge B. A. (2017). Incorporating context dependency of species interactions in species distribution models. Integr. Comp. Biol. 57, 159–167. doi: 10.1093/icb/icx057
Lara C., Saldías G. S., Tapia F. J., Iriarte J. L., Broitman B. R. (2016). Interannual variability in temporal patterns of chlorophyll-a and their potential influence on the supply of mussel larvae to inner waters in northern Patagonia (41-44° s). J. Mar. Syst. 155, 11–18. doi: 10.1016/j.jmarsys.2015.10.010
Lathlean J., Ayre D., Minchinton T. (2014). Estimating latitudinal variability in extreme heat stress on rocky intertidal shores. J. Biogeogr. 41, 1478–1491. doi: 10.1111/jbi.12311
Lathlean J. A., Trassierra J. A., Everett J. D., McQuaid C. D. (2019). Testing the intermittent upwelling hypothesis: Intercontinental comparisons of barnacle recruitment between South Africa and Australia. Estuar. Coast. Shelf Sci. 224, 197–208. doi: 10.1016/j.ecss.2019.04.040
Le Corre N., Martel A. L., Guichard F., Johnson L. E. (2013). Variation in recruitment: Differentiating the roles of primary and secondary settlement of blue mussels Mytilus spp. Mar. Ecol. Prog. Ser. 481, 133–146. doi: 10.3354/meps10216
Legaard K. R., Thomas A. C. (2006). Spatial patterns in seasonal and interannual variability of chlorophyll and sea surface temperature in the California current. J. Geophys. Res. 111, C06032. doi: 10.1029/2005JC003282
Leonard G. H. (2000). Latitudinal variation in species interactions: A test in the New England rocky intertidal zone. Ecology 81, 1015–1030. doi: 10.1890/0012-9658(2000)081[1015:LVISIA]2.0.CO;2
Little C., Trowbridge C. D., Williams G. A., Hui T. Y., Pilling G. M., Morritt D., et al. (2021). Response of intertidal barnacles to air temperature: Long-term monitoring and in-situ measurements. Estuar. Coast. Shelf Sci. 256, 107367. doi: 10.1016/j.ecss.2021.107367
Lloyd H. B., Cruz-Motta J. J., Glasby T. M., Hutchings P. A., Gribben P. E. (2020). Unusual but consistent latitudinal patterns in macroalgal habitats and their invertebrate communities across two countries. Divers. Distrib. 26, 912–927. doi: 10.1111/ddi.13070
Low-Décarie E., Chivers C., Granados M. (2014). Rising complexity and falling explanatory power in ecology. Front. Ecol. Environ. 12, 412–418. doi: 10.1890/130230
Martínez A. J. (2003). Marine life of the north Atlantic: Canada to New England (New York: Aqua Quest Publications).
Mathieson A. C., Dawes C. J. (2017). Seaweeds of the Northwest Atlantic (Amherst: University of Massachusetts Press).
Mathieson A. C., Penniman C. A., Harris L. G. (1991). “Northwest Atlantic rocky shore ecology,” in Ecosystems of the world. 24. Intertidal and littoral ecosystems. Eds. Mathieson A. C., Nienhuis P. H. (Amsterdam: Elsevier), 109–191.
Mazzuco A. C. A., Christofoletti R. A., Pineda J., Starczak V. R., Ciotti A. M. (2015). Temporal variation in intertidal community recruitment and its relationships to physical forcings, chlorophyll-a concentration, and sea surface temperature. Mar. Biol. 162, 1705–1725. doi: 10.1007/s00227-015-2689-6
McClain C. R. (2009). A decade of satellite ocean color observations. Annu. Rev. Mar. Sci. 1, 19–42. doi: 10.1146/annurev.marine.010908.163650
McCook L. J., Chapman A. R. O. (1997). Patterns and variations in natural succession following massive ice scour of a rocky intertidal seashore. J. Exp. Mar. Biol. Ecol. 214, 121–147. doi: 10.1016/S0022-0981(96)02751-7
McIver R., Milewski I., Loucks R., Smith R. (2018). Estimating nitrogen loading and far-field dispersal potential from background sources and coastal finfish aquaculture: A simple framework and case study in Atlantic Canada. Estuar. Coast. Shelf Sci. 205, 46–57. doi: 10.1016/j.ecss.2018.01.005
Menge B. A. (1978). Predation intensity in a rocky intertidal community. Relation between predator foraging activity and environmental harshness. Oecologia 34, 1–16. doi: 10.1007/BF00346237
Menge B. A., Bracken M. E. S., Lubchenco J., Leslie H. M. (2017). Alternative state? Experimentally induced Fucus canopy persists 38 years in an Ascophyllum-dominated community. Ecosphere 8, e01725. doi: 10.1002/ecs2.1725
Menge B. A., Daley B. A., Wheeler P. A., Strub P. T. (1997). Rocky intertidal oceanography: An association between community structure and nearshore phytoplankton concentration. Limnol. Oceanogr. 42, 57–66. doi: 10.4319/lo.1997.42.1.0057
Menge B. A., Gouhier T. C., Hacker S. D., Chan F., Nielsen K. J. (2015). Are meta-ecosystems organized hierarchically? A model and test in rocky intertidal habitats. Ecol. Monogr. 85, 213–233. doi: 10.1890/14-0113.1
Menge B. A., Gravem S. A., Johnson A., Robinson J. W., Poirson B. N. (2022). Increasing instability of a rocky intertidal meta-ecosystem. Proc. Natl. Acad. Sci. U. S. A. 119, e2114257119. doi: 10.1073/pnas.2114257119
Menge B. A., Menge D. N. L. (2013). Dynamics of coastal meta-ecosystems: The intermittent upwelling hypothesis and a test in rocky intertidal regions. Ecol. Monogr. 83, 283–310. doi: 10.1890/12-1706.1
Menge B. A., Sutherland J. P. (1987). Community regulation: Variation in disturbance, competition, and predation in relation to environmental stress and recruitment. Am. Nat. 130, 730–757. doi: 10.1086/284741
Minchinton T. E., Scheibling R. E. (1993). Free space availability and larval substratum selection as determinants of barnacle population structure in a developing rocky intertidal community. Mar. Ecol. Prog. Ser. 95, 233–244. doi: 10.3354/meps095233
Molis M., Scrosati R. A., El-Belely E. F., Lesniowski T., Wahl M. (2015). Wave-induced changes in seaweed toughness entail plastic modifications in snail traits maintaining consumption efficacy. J. Ecol. 103, 851–859. doi: 10.1111/1365-2745.12386
Monteiro C., Pereira J., Seabra R., Lima F. P. (2022). Fine-scale survey of intertidal macroalgae reveals recent changes in a cold-water biogeographic stronghold. Front. Mar. Sci. 9, 880074. doi: 10.3389/fmars.2022.880074
Mota C. F., Engelen A. H., Serrão E. A., Pearson G. A. (2015). Some don't like it hot: Microhabitat-dependent thermal and water stresses in a trailing edge population. Funct. Ecol. 29, 640–649. doi: 10.1111/1365-2435.12373
Musetta-Lambert J. L., Scrosati R. A., Keppel E. A., Barbeau M. A., Skinner M. A., Courtenay S. C. (2015). Intertidal communities differ between breakwaters and natural rocky areas on ice-scoured Northwest Atlantic coasts. Mar. Ecol. Prog. Ser. 539, 19–31. doi: 10.3354/meps11484
NASA (2022) OceanColor data. Available at: http://oceandata.sci.gsfc.nasa.gov (Accessed July 4, 2022).
Navarrete S. A., Barahona M., Weidberg N., Broitman B. R. (2022). Climate change in the coastal ocean: Shifts in pelagic productivity and regionally diverging dynamics of coastal ecosystems. Proc. R. Soc B 289, 20212772. doi: 10.1098/rspb.2021.2772
Navarrete A. H., Lagos N. A., Ojeda F. P. (2014). Latitudinal diversity patterns of Chilean coastal fishes: Searching for causal processes. Rev. Chil. Hist. Nat. 87, 2. doi: 10.1186/0717-6317-87-2
Navarrete S. A., Wieters E. A., Broitman B. R., Castilla J. C. (2005). Scales of benthic-pelagic coupling and the intensity of species interactions: From recruitment limitation to top-down control. Proc. Natl. Acad. Sci. U.S.A. 102, 18046–18051. doi: 10.1073/pnas.0509119102
Paine R. T., Levin S. A. (1991). Intertidal landscapes: Disturbance and the dynamics of pattern. Ecol. Monogr. 51, 145–178. doi: 10.2307/2937261
Palomo M. G., Bagur M., Calla S., Dalton M. C., Soria S. A., Hawkins S. J. (2019). “Biodiversity and interactions on the intertidal rocky shores of Argentina (south-west Atlantic),” in Interactions in the marine benthos: Global patterns and processes. Eds. Hawkins S. J., Bohn K., Firth L. B., Williams G. A. (Cambridge: Cambridge University Press), 164–189.
Pereira J., Monteiro C., Seabra R., Lima F. P. (2022). Fine-scale abundance of rocky shore macroalgae species with distribution limits in NW Iberia in 2020/2021. Biodivers. Data J. 10, e80798. doi: 10.3897/BDJ.10.e80798
Petzold W., Willers M. T., Scrosati R. A. (2014). Visual record of intertidal disturbance caused by sea ice in the spring on the Atlantic coast of Nova Scotia. F1000Research 3, 112. doi: 10.12688/f1000research.4146.1
Pfister C. A., Wootton J. T., Neufeld C. J. (2007). The relative roles of coastal and oceanic processes in determining physical and chemical characteristics of an intensively sampled nearshore system. Limnol. Oceanogr. 52, 1767–1775. doi: 10.4319/lo.2007.52.5.1767
Pollock L. W. (1998). A practical guide to the marine animals of northeastern North America (New Brunswick: Rutgers University Press).
Poloczanska E. S., Smith S., Fauconnet L., Healy J., Tibbetts I. R., Burrows M. T., et al. (2011). Little change in the distribution of rocky shore faunal communities on the Australian east coast after 50 years of rapid warming. J. Exp. Mar. Biol. Ecol. 400, 145–154. doi: 10.1016/j.jembe.2011.02.018
Powell A., Smith D. J., Hepburn L. J., Jones T., Berman J., Jompa J., et al. (2014). Reduced diversity and high sponge abundance on a sedimented Indo-Pacific reef system: Implications for future changes in environmental quality. PLoS ONE 9, e85253. doi: 10.1371/journal.pone.0085253
Raimondi P. T., Miner C. M., Menge B. A., Blanchette C. A., Lohse D. P. (2019). Quantitative biogeography: Large-scale, long-term change in the rocky intertidal region of the California Current Large Marine Ecosystem. Oceanography 32, 26–37. doi: 10.5670/oceanog.2019.308
Raymond W. W., Barber J. S., Dethier M. N., Hayford H. A., Harley C. D. G., King T. L., et al. (2022). Assessment of the impacts of an unprecedented heatwave on intertidal shellfish of the Salish Sea. Ecology 2022, e3798. doi: 10.1002/ecy.3798
Riginos C., Cunningham C. W. (2005). Local adaptation and species segregation in two mussel (Mytilus edulis x Mytilus trossulus) hybrid zones. Mol. Ecol. 14, 381–400. doi: 10.1111/j.1365-294X.2004.02379.x
Roberts E. A., Bracken M. E. S. (2021). Intertidal canopy-forming seaweeds modulate understory seaweed photoprotective compounds. J. Phycol. 57, 645–654. doi: 10.1111/jpy.13118
Robuchon M., Valero M., Thiébaut E., Le Gall L. (2017). Multi-scale drivers of community diversity and composition across tidal heights: An example on temperate seaweed communities. J. Ecol. 105, 1791–1805. doi: 10.1111/1365-2745.12781
Rodrigues J. F. M., Sobral F. L., Iverson J. B., Diniz-Filho J. A. F. (2019). Phylogenetic and spatial analyses suggest minimum temperature as an environmental filter for turtle communities. J. Biogeogr. 46, 671–679. doi: 10.1111/jbi.13527
Román S., Weidberg N., Muñiz C., Aguion A., Vázquez E., Santiago J., et al. (2022). Mesoscale patterns in barnacle reproduction are mediated by upwelling-driven thermal variability. Mar. Ecol. Prog. Ser. 685, 153–170. doi: 10.3354/meps13992
Russell R., Wood S. A., Allison G., Menge B. A. (2006). Scale, environment, and trophic status: The context dependency of community saturation in rocky intertidal communities. Am. Nat. 167, E158–E170. doi: 10.1086/504603
Sagarin R. D., Barry J. P., Gilman S. E., Baxter C. H. (1999). Climate-related change in an intertidal community over short and long time scales. Ecol. Monogr. 69, 465–490. doi: 10.1890/0012-9615(1999)069[0465:CRCIAI]2.0.CO;2
Sagarin R. D., Gaines S. D. (2002). Geographical abundance distributions of coastal invertebrates using one-dimensional ranges to test biogeographic hypotheses. J. Biogeogr. 29, 985–997. doi: 10.1046/j.1365-2699.2002.00705.x
Sanford E. (2014). “The biogeography of marine communities,” in Marine community ecology and conservation. Eds. Bertness M. D., Bruno J. F., Silliman B. R., Stachowicz J. J. (Sunderland: Sinauer Associates), 131–163.
Schiel D. R. (2019). Experimental analyses of diversity partitioning in southern hemisphere algal communities. Oecologia 190, 179–193. doi: 10.1007/s00442-019-04375-3
Schiel D. R., Underwood A. J., Chapman M. G. (2019). “Biogeographic comparisons of pattern and process on intertidal rocky reefs of New Zealand and south-eastern Australia,” in Interactions in the marine benthos: Global patterns and processes. Eds. Hawkins S. J., Bohn K., Firth L. B., Williams G. A. (Cambridge: Cambridge University Press), 391–413.
Scrosati R. A. (2016). The clonal seaweed Chondrus crispus as a foundation species. Algae 31, 41–48. doi: 10.4490/algae.2016.31.2.10
Scrosati R. A. (2017). Community-level facilitation by macroalgal foundation species peaks at an intermediate level of environmental stress. Algae 32, 41–46. doi: 10.4490/algae.2017.32.2.20
Scrosati R. A., Ellrich J. A. (2016). A 12-year record of intertidal barnacle recruitment in Atlantic Canada (2005-2016): Relationships with sea surface temperature and phytoplankton abundance. PeerJ 4, e2623. doi: 10.7717/peerj.2623
Scrosati R. A., Ellrich J. A. (2018). Benthic-pelagic coupling and bottom-up forcing in rocky intertidal communities along the Atlantic Canadian coast. Ecosphere 9, e02229. doi: 10.1002/ecs2.2229
Scrosati R. A., Ellrich J. A. (2019). A 5-year study (2014-2018) of the relationship between coastal phytoplankton abundance and intertidal barnacle size along the Atlantic Canadian coast. PeerJ 7, e6892. doi: 10.7717/peerj.6892
Scrosati R. A., Ellrich J. A. (2020). Latitudinal and seasonal changes in intertidal sea surface temperature along the Atlantic coast of Nova Scotia, Canada. Front. Mar. Sci. 7, 592. doi: 10.3389/fmars.2020.00592
Scrosati R. A., Ellrich J. A. (2022). Photos of wave-exposed rocky intertidal locations along the Atlantic coast of Nova Scotia, Canada. figshare online resource. doi: 10.6084/m9.figshare.20740879.v1
Scrosati R. A., Ellrich J. A., Freeman M. J. (2020). Half-hourly changes in intertidal temperature at nine wave-exposed locations along the Atlantic Canadian coast: A 5.5-year study. Earth Syst. Sci. Data 12, 2695–2703. doi: 10.5194/essd-12-2695-2020
Scrosati R. A., Ellrich J. A., Petzold W. (2022). Abundance of seaweeds and invertebrates in wave-exposed rocky intertidal habitats along the Canadian Atlantic coast (2014-2017). figshare dataset. doi: 10.6084/m9.figshare.20205023.v1
Scrosati R., Heaven C. (2007). Spatial trends in community richness, diversity, and evenness across rocky intertidal environmental stress gradients in eastern Canada. Mar. Ecol. Prog. Ser. 342, 1–14. doi: 10.3354/meps342001
Scrosati R. A., Holt J. K. (2021). Recruitment and post-recruitment dynamics of the barnacle Semibalanus balanoides on a wave-exposed headland in Atlantic Canada. Front. Mar. Sci. 8, 799514. doi: 10.3389/fmars.2021.799514
Searles R. B. (1984). Seaweed biogeography of the mid-Atlantic coast of the United States. Helgoländer Meeresunters. 38, 259–271. doi: 10.1007/BF01997484
Sears J. R. (1998). NEAS keys to the benthic marine algae of the northeastern coast of North America from Long Island Sound to the Strait of Belle Isle (Dartmouth: Northeast Algal Society).
Shanks A. L., Morgan S. G., MacMahan J., Reniers A. J. H. M. (2017). Alongshore variation in barnacle populations is determined by surf zone hydrodynamics. Ecol. Monogr. 87, 508–532. doi: 10.1002/ecm.1265
Sherker Z. T., Ellrich J. A., Scrosati R. A. (2017). Predator-induced shell plasticity in mussels hinders predation by drilling snails. Mar. Ecol. Prog. Ser. 573, 167–175. doi: 10.3354/meps12194
Silliman B. R., He Q. (2018). Physical stress, consumer control, and new theory in ecology. Trends Ecol. Evol. 33, 492–503. doi: 10.1016/j.tree.2018.04.015
Sink K. J., Branch G. M., Harris J. M. (2005). Biogeographic patterns in rocky intertidal communities in KwaZulu-Natal, South Africa. Afr. J. Mar. Sci. 27, 81–96. doi: 10.2989/18142320509504070
Sirén A. P. K., Sutherland C. S., Karmalkar A. V., Duveneck M. J., Morelli T. L. (2022). Forecasting species distributions: Correlation does not equal causation. Divers. Distrib. 28, 756–769. doi: 10.1111/ddi.13480
Spalding M. D., Fox H. E., Allen G. R., Davidson N., Ferdaña Z. A., Finlayson M., et al. (2007). Marine ecoregions of the world: A bioregionalization of coastal and shelf areas. BioScience 57, 573–583. doi: 10.1641/B570707
Stephenson T. A., Stephenson A. (1954). Life between tide marks in North America. IIIA. Nova Scotia and Prince Edward Island: Descripton of the region. J. Ecol. 42, 14–45. doi: 10.2307/2256977
Storch D., Šímová I., Smyčka J., Bohdalková E., Toszogyova A., Okie J. G. (2022). Biodiversity dynamics in the Anthropocene: How human activities change equilibria of species richness. Ecography 2022, e05778. doi: 10.1111/ecog.05778
Tam J. C., Scrosati R. A. (2011). Mussel and dogwhelk distribution along the NW Atlantic coast: Testing predictions derived from the abundant-centre model. J. Biogeogr. 38, 1536–1545. doi: 10.1111/j.1365-2699.2011.02498.x
Tam J. C., Scrosati R. A. (2014). Distribution of cryptic mussel species (Mytilus edulis and M. trossulus) along wave exposure gradients on northwest Atlantic rocky shores. Mar. Biol. Res. 10, 51–60. doi: 10.1080/17451000.2013.793809
Thyrring J., Wegeberg S., Blicher M. E., Krause-Jensen D., Høgslund S., Olesen B., et al. (2021). Latitudinal patterns in intertidal ecosystem structure in West Greenland suggest resilience to climate change. Ecography 44, 1156–1168. doi: 10.1111/ecog.05381
Tide and Current Predictor (2022) Tidal height and current site selection. Available at: http://tide.arthroinfo.org (Accessed July 4, 2022).
Tide Forecast (2022) Tide times and tide charts worldwide. Available at: http://www.tide-forecast.com (Accessed July 4, 2022).
Trott T. J. (2022). Mesoscale spatial patterns of Gulf of Maine rocky intertidal communities. Diversity 14, 557. doi: 10.3390/d14070557
Tsang L. M., Achituv Y., Chu K. H., Chan B. K. K. (2012). Zoogeography of intertidal communities in the west Indian Ocean as determined by ocean circulation systems: Patterns from the Tetraclita barnacles. PLoS ONE 7, e45120. doi: 10.1371/journal.pone.0045120
Umanzor S., Ladah L., Calderón-Aguilera L. E., Zertuche-González J. A. (2019). Testing the relative importance of intertidal seaweeds as ecosystem engineers across tidal heights. J. Exp. Mar. Biol. Ecol. 511, 100–107. doi: 10.1016/j.jembe.2018.11.008
Valqui J., Ibañez-Erquiaga B., Pacheco A. S., Wilbur L., Ochoa D., Cardich J., et al. (2021). Changes in rocky intertidal communities after the 2015 and 2017 El Niño events along the Peruvian coast. Estuar. Coast. Shelf Sci. 250, 107142. doi: 10.1016/j.ecss.2020.107142
Vélez-Rubio G. M., González−Etchebehere L., Scarabino F., Trinchin R., Manta G., Laporta M., et al. (2021). Macroalgae morpho−functional groups in Southern marine ecosystems: Rocky intertidal in the southwestern Atlantic (33°–35° S). Mar. Biol. 168, 153. doi: 10.1007/s00227-021-03960-6
Villalard-Bohnsack M. (2003). Illustrated key to the seaweeds of New England (Kingston: The Rhode Island Natural History Survey).
Wahl M., Barboza F. R., Buchholz B., Dobretsov S., Guy-Haim T., Rilov G., et al. (2021). Pulsed pressure: Fluctuating impacts of multifactorial environmental change on a temperate macroalgal community. Limnol. Oceanogr. 66, 4210–4226. doi: 10.1002/lno.11954
Wang H. Y., Tsang L. M., Lima F. P., Seabra R., Ganmanee M., Williams G. A., et al. (2020). Spatial variation in thermal stress experienced by barnacles on rocky shores: The interplay between geographic variation, tidal cycles, and microhabitat temperatures. Front. Mar. Sci. 7, 553. doi: 10.3389/fmars.2020.00553
Watt C. A., Scrosati R. A. (2013). Bioengineer effects on understory species richness, diversity, and composition change along an environmental stress gradient: experimental and mensurative evidence. Estuar. Coast. Shelf Sci. 123, 10–18. doi: 10.1016/j.ecss.2013.02.006
Wei C. L., Cusson M., Archambault P., Belley R., Bourque M., Brown T., et al. (2020). Seafloor biodiversity of Canada's three oceans: Patterns, hotspots, and potential drivers. Divers. Distrib. 26, 226–241. doi: 10.1111/ddi.13013
Wethey D. S., Woodin S. A. (2008). Ecological hindcasting of biogeographic responses to climate change in the European intertidal zone. Hydrobiologia 606, 139–151. doi: 10.1007/s10750-008-9338-8
Wilson K. L., Skinner M. A., Lotze H. K. (2019). Projected 21st-century distribution of canopy-forming seaweeds in the northwest Atlantic with climate change. Divers. Distrib. 25, 582–602. doi: 10.1111/ddi.12897
WoRMS (2022) (World Register of Marine Species). Available at: http://marinespecies.org (Accessed July 4, 2022).
Keywords: benthic, biogeography, intertidal, invertebrate, macroalga, seaweed, wave exposure
Citation: Scrosati RA, Freeman MJ, Ellrich JA and Petzold W (2022) Biogeography of algae and invertebrates from wave-exposed rocky intertidal habitats along the Atlantic coast of Nova Scotia (Canada): Latitudinal and interannual patterns and possible underlying drivers. Front. Mar. Sci. 9:987162. doi: 10.3389/fmars.2022.987162
Received: 05 July 2022; Accepted: 03 October 2022;
Published: 01 November 2022.
Edited by:
Fernando P. Lima, Centro de Investigacao em Biodiversidade e Recursos Geneticos (CIBIO-InBIO), PortugalReviewed by:
Chih-Lin Wei, National Taiwan University, TaiwanMarcelo Michel Rivadeneira, Universidad Católica del Norte, Chile
Lorena Arribas, CONICET Instituto de Biología de Organismos Marinos (IBIOMAR), Argentina
Copyright © 2022 Scrosati, Freeman, Ellrich and Petzold. This is an open-access article distributed under the terms of the Creative Commons Attribution License (CC BY). The use, distribution or reproduction in other forums is permitted, provided the original author(s) and the copyright owner(s) are credited and that the original publication in this journal is cited, in accordance with accepted academic practice. No use, distribution or reproduction is permitted which does not comply with these terms.
*Correspondence: Ricardo A. Scrosati, cnNjcm9zYXRAc3RmeC5jYQ==