
94% of researchers rate our articles as excellent or good
Learn more about the work of our research integrity team to safeguard the quality of each article we publish.
Find out more
ORIGINAL RESEARCH article
Front. Mar. Sci. , 24 August 2022
Sec. Physical Oceanography
Volume 9 - 2022 | https://doi.org/10.3389/fmars.2022.986780
 Meiyi Hou1,2
 Youmin Tang2,3*
The new emerging type of El Niño brings challenges to the state-of-the-art coupled models to simulated features of El Niño - Southern Oscillation (ENSO) diversity. The Coupled Model Intercomparison Project (CMIP), containing the advanced worldwide coupled models, has recently released the model outputs in phase 6. In this paper, the characteristics of two types of ENSO in 19 models from CMIP phase 5 and their counterparts in phase 6 are assessed regarding the spatial and temporal features and the seasonal cycle features. The weaker amplitude of Eastern Pacific (EP) and Central Pacific (CP) ENSO in CMIP5 is increased and the spatial structure of CP ENSO is better depicted in CMIP6. However, no significant improvement in the ENSO periodicity and the ENSO phase-locking behavior compared to CMIP5. A synthetic ENSO score, containing eight metrics, is defined and employed to evaluate the performance of each CMIP model. The average ENSO score for CMIP6 is 2.375, indicating modest improvement compared to the average score of 2.441 for CMIP5. Furthermore, the slight improvement in the ENSO score is partly related to the reduced climatology bias of sea surface temperature in the Niño4 region. The overall evaluation provides necessary information for future investigation about the mechanism exploration of the ENSO diversity based on the models with better performance.
The anomalous ocean temperature in the tropical Pacific during the mature phase of El Niño – Southern Oscillation (ENSO) predominantly influences global interannual climate variability, thus affecting the livelihoods of millions of people around the world. The fluctuation of the atmosphere-ocean coupled system between the anomalous warm phase (El Niño) and cold phase (La Niña) switches roughly every 2-7 years (McPhaden et al., 2020). During the anomalous phase, the induced extreme weathers, including floods, droughts, and heatwaves, have significant impacts on agricultural production, public health, and economies in many nations (Tang and Yu, 2008; Zhang et al., 2016; Jiang et al., 2019; Lin et al., 2020; Chu et al., 2021; Tang et al., 2022).
ENSO became the focus of marine and atmospheric science research in the 1980s. Since then, steady progress has been made in the mechanism research and the simulation of ENSO (Battisti and Hirst, 1989; Wang and Fang, 1996; Jin, 1997a; Jin, 1997b; Neelin et al., 1998; McPhaden, 1999; Wang et al., 1999; Latif et al., 2001; Song et al., 2018). However, the atypical El Niño in 2002-2003 seems to mark the start of a new flavor of ENSO evolution in the following decade, whose maximum sea surface temperature anomalies (SSTAs) were in the central equatorial Pacific instead of in the eastern tropical Pacific (Timmermann et al., 2018; Capotondi et al., 2020). Differentiated by the location of the largest SSTAs, canonical El Niño is referred to as eastern Pacific (EP) El Niño. At the same time, the nonconventional type of El Niño is called central Pacific (CP) El Niño (Kao and Yu, 2009). Although ENSO simulation in the state-of-the-art climate models has significantly improved, many models still have problems simulating the basic features of two types of ENSO. Coupled Model Intercomparison Project (CMIP) provides a standard experimental protocol and infrastructure, allowing the broader climate community and users to analyze model simulations to promote model developments (Meehl et al., 2000; Meehl et al., 2005; Taylor et al., 2012). However, Coupled Global Circulation Models (CGCMs) from the CMIP phase3 (CMIP3) and phase 5 (CMIP5) were still struggling with their ENSO simulation. The assessment of the CMIP3 and CMIP5 models indicated that a large number of CMIP models fail to produce the realistic amplitude of the EP ENSOs (Achutarao and Sperber, 2002; Yu and Kim, 2010; Kim and Yu, 2012). Although models were able to simulate the intensity of the observed CP ENSOs, presenting the exact spatial pattern of observed CP ENSOs was still a challenge (Ham and Kug, 2012; Capotondi et al., 2020).
CMIP phase 6 (CMIP6) model outputs have recently been released, including the outputs of updated models originating from the CMIP5 (Eyring et al., 2016). Some research has covered the assessment of the seasonal cycle, and the phase-locking of the typical ENSO simulated in the CMIP6 models (Liu et al., 2021; Mandy B. Freund et al., 2020; Song et al., 2020). In addition, Planton et al. (2021) have evaluated several characteristics of the simulated ENSO in CMIP5 and CMIP6 in a comprehensive view by producing ENSO metrics. However, the ENSO diversity is not assessed in detail in their work. To our knowledge, the research on the assessment of the two types of ENSO simulated in CMIP6 is lacking, especially by making a contrast between the CMIP5 models and their updated models in CMIP6. Compared to the CMIP5 models, whether the CMIP6 counterparts improve the simulation ability of the ENSO diversity is interesting to both model development and ENSO studies. As such, an analysis of the simulation ability of two types of ENSO in models from CMIP5 and CMIP6 is presented in this study.
Our evaluations are based on 19 models from CMIP5 (Taylor et al., 2012) and 19 models from CMIP6 (Eyring et al., 2016). Specific model configurations and affiliations are listed in Table 1. Since we were concerned about the internal variability of the model, we chose to assess the outputs of the pre-industrial control (piControl) run experiment in CMIP5 and CMIP6. The piControl experiment has fixed 1850 atmospheric composition, fixed solar variability, and constant background volcanic aerosol value. We analyzed the first 200 years of the piControl simulations. The HadISST 1.1 dataset (Rayner et al., 2003) from the Met Office Hadley Center is utilized as the observational SST, ranging from January 1980 to December 2021, to evaluate the simulation ability of CMIP models. The model data is interpolated to the observational grid, which is 1.0°×1.0° on the horizon, by using the bilinear interpolation method. All anomalies are calculated as a departure from the long-term climatology with a linear trend removed in advance.
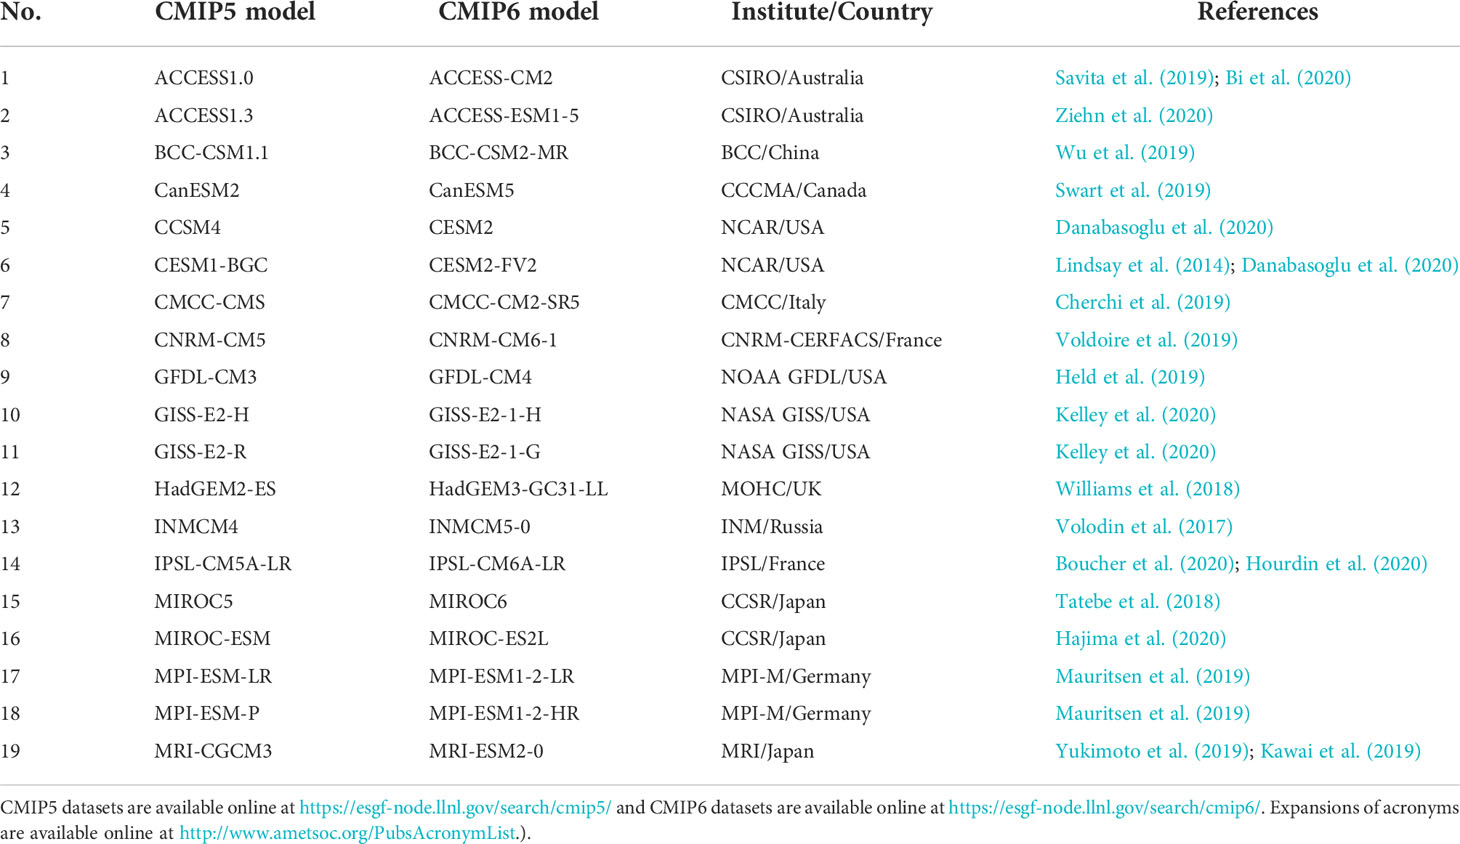
Table 1 List of models from the CMIP5 and CMIP6 analyzed in this study.
Following Kao and Yu (2009), we employ the combined regression-Empirical Orthogonal Function (EOF) analysis to the monthly SSTA to identify the EP and CP types of ENSO events. Firstly, the tropical Pacific SSTAs regressed with the Niño4 (5°S-5°N, 160°E-150°W) SSTA were removed. The EOF method is then applied to the residual SSTAs to obtain the time series of EP ENSO. To make an impartial comparison between different models, the time series is normalized and regressed with the residual SSTAs to get the standardized spatial pattern of EP ENSO. Likewise, the spatial pattern of CP ENSO is obtained by first removing the SSTAs regressed with the Niño1+2 SSTA and then applying EOF analysis.
We first provide an overview of the ENSO spatial pattern of the multi-model ensemble (MME) in CMIP5 and CMIP6. As shown in Figure 1, the observational EP ENSO pattern offers its maximum SSTA of 1.09°C in the eastern Pacific off the equator. Moreover, the maximum SSTA in the observational CP ENSO pattern is 0.81°C, located in the central equatorial Pacific. Compared with the observation, the intensity of both ENSO types is weaker in CMIP5 and CMIP6. The good news is that the CMIP6 MME can provide a stronger and more realistic ENSO pattern than CMIP5. The maximum SSTA increases from 0.79°C in CMIP5 to 0.94°C in CMIP6 for EP ENSO spatial pattern and from 0.59°C to 0.71°C for CP ENSO spatial pattern. In addition, the location of the maximum SSTA is also evaluated. Compared with CMIP5, improvement of CMIP6 is found in the simulation of CP spatial pattern because the maximum center of SSTA moves 15° to the west, being much closer to that of the observation. In contrast, the maximum center of SSTA in the EP ENSO pattern almost remains the same in CMIP5 and CMIP6, located in the equatorial eastern Pacific, which is 25° west and 5° north of the observation. Furthermore, the warm western boundary extends more westward than the observation in the CP ENSO pattern derived from both the CMIP5 and CMIP6 models.
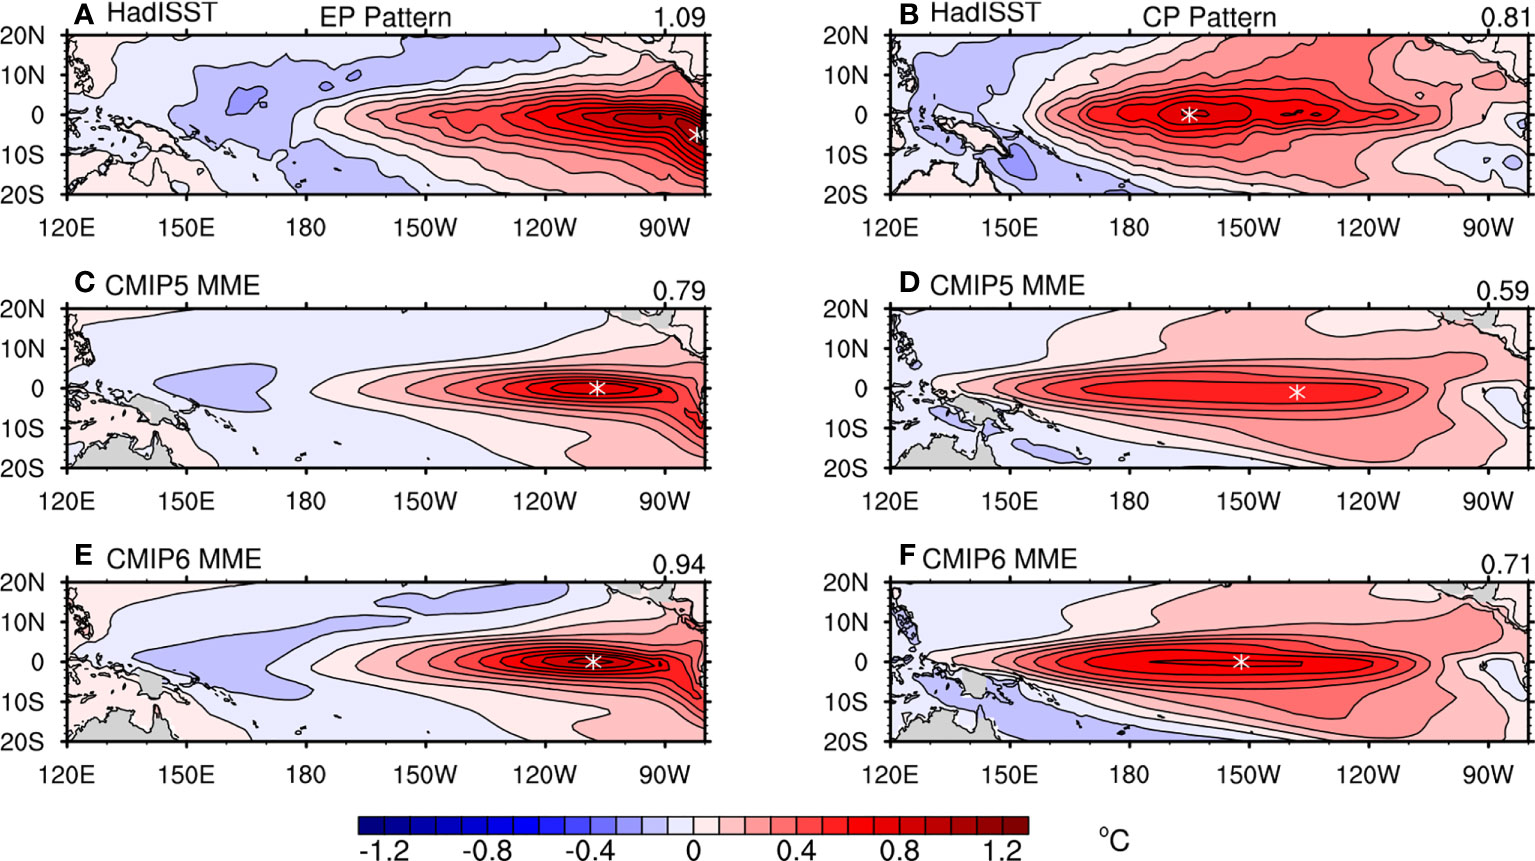
Figure 1 Spatial pattern of the standard deviations of the first EOF mode for the EP ENSO and CP ENSO obtained from observations (A, B). And the composite EP ENSO and CP ENSO spatial pattern of the multi-model mean of CMIP5 (C, D) and CMIP6 (E, F). Asterisk markers denote the location of the maximum SSTA in each plot. The number on the top right of each plot represents the maximum SSTA value.
We then evaluate the individual capability of the 19 models from CMIP5 and the 19 models from CMIP6 to portray the spatial features of two types of ENSO by employing the Taylor diagram. Four diagrams were provided in Figure 2 to give abundant details about the simulation ability of each model in terms of different CMIP phases and different ENSO types. As shown in Figure 2A, the normalized standardized deviations vary from 46.4% (GISS-E2-H) to 93.8% (GFDL-CM3), indicating that all CMIP5 models fail to depict the strong observational intensity of EP ENSO. The spatial correlations range from 0.736 (ACCESS1-3) to 0.956 (ACCESS1-0), with only one model displaying a spatial correlation lower than 0.75. Therefore, most CMIP5 models can simulate rational spatial patterns of EP ENSO but with lower amplitude. In contrast, it seems easier for the CMIP5 models to simulate reasonable amplitude of CP ENSO, as indicated by 12 out of 19 models displaying normalized standard deviation in the range of 1 ± 30% compared with the reference data (Figure 2B). However, the spatial correlations vary from 0.606 (MIROC-ESM) to 0.904 (CESM1-BGC), with 7 models lower than 0.75.
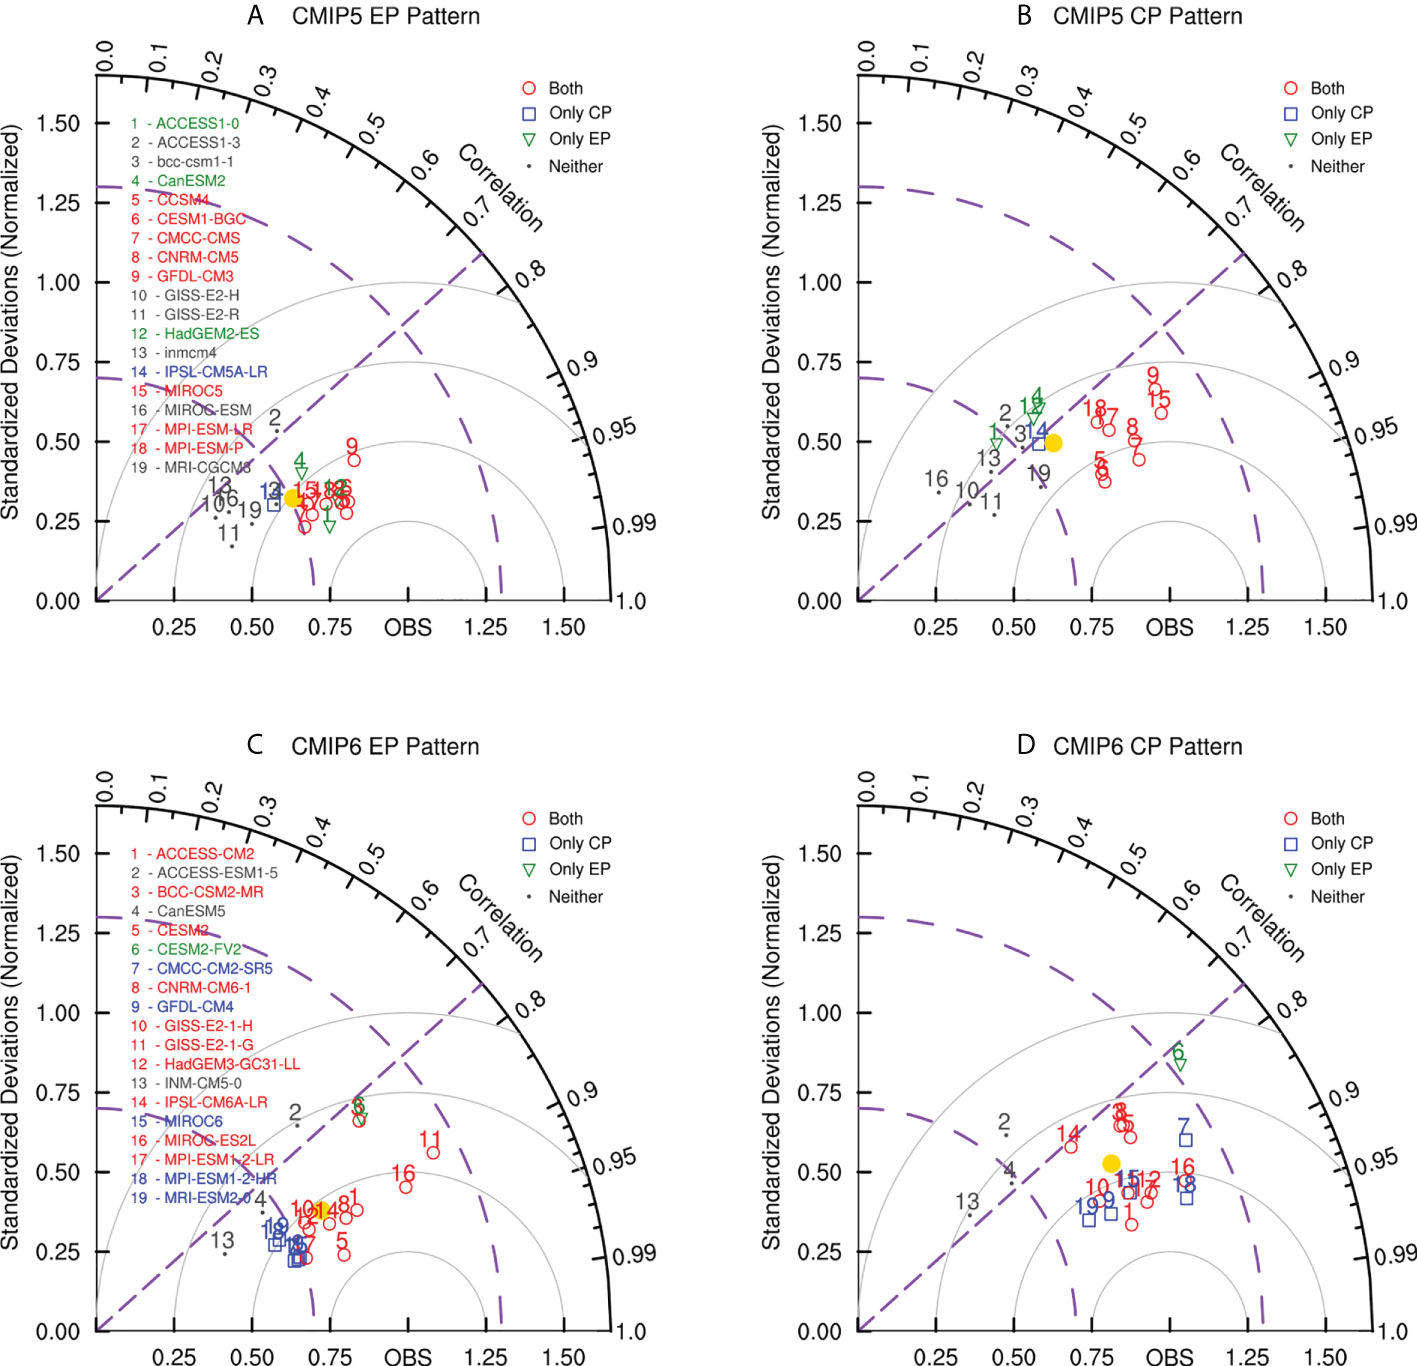
Figure 2 Taylor diagram displaying normalized spatial pattern statistics of EP ENSO and CP ENSO between 19 CMIP5 models (A, B) and 19 CMIP6 models (C, D), and observations for 1980-2021. Point “OBS” signifies the observational pattern based on the HadISST dataset. The radial coordinate gives the standard deviation normalized by the observed value, and the angular coordinate shows the spatial correlation with observation. Grey circles centered at point “OBS” represent the location of the normalized RMSE. Purple dashed lines denote the correlation coefficient of 0.75 and the standard deviation of 0.7 and 1.3. Color markers are different CMIP models, except for the yellow dot representing the average value of the CMIP models.
For the convenience of visualization, models with good performances in both ENSO simulations are selected and denoted as the red circles in Figures 2A, B. Herein, the model providing a standard deviation within 1 ± 30% and a spatial correlation higher than 0.75 is marked as a model with good performance in this ENSO pattern. In addition, the models that can only simulate the CP (EP) ENSO spatial pattern similar to the observation are denoted as blue rectangles (green triangles). The models failing to depict either type of ENSO are represented as grey dots. Based on these criteria, 8 CMIP5 models are selected, which have good simulation ability of both types of ENSO spatial patterns, namely CCSM4, CESM1-BGC, CMCC-CMS, CNRM-CM5, GFDL-CM3, MIROC5, MPI-ESM-LR, and MPI-ESM-P. IPSL-CM5A-LR can only simulate CP ENSO well. ACCESS1-0, CanESM2, and HadGEM2-ES can only simulate EP ENSO well. At the same time, the rest majority of the models tend to provide smaller amplitude for either type of ENSO.
Likewise, the capability of CMIP6 models is presented in Figures 2C, D. As shown in Figure 2C, half (10 out of 19) models experience an increase in the amplitude of EP ENSO as the model updates from CMIP5 to CMIP6. In addition, the average standardized deviation for the EP spatial patterns in different CMIP6 models is slightly higher. However, the average spatial correlation for the EP spatial patterns almost remains the same. The above results indicate only a slight improvement in the simulation skill of the EP ENSO intensity for the coupled models. In contrast, significant improvement can be seen in the simulation of the CP ENSO pattern from CMIP6 models (Figures 2B, D). Ten models show increases in both the standardized deviation and the spatial correlation. Furthermore, the average correlation over the 19 CMIP models rises from 0.785 in CMIP5 to 0.840 in CMIP6.
10 CMIP6 models are classified as offering good performance in simulating both types of ENSO spatial patterns, namely ACCESS-CM2, BCC-CSM2-MR, CESM2, CNRM-CM6-1, GISS-E2-1-H, GISS-E2-1-G, HadGEM3-GC31-LL, IPSL-CM6A-LR, MIROC-ES2L, MPI-ESM1-2-LR. Five models can simulate only the CP ENSO well while one model can only simulate EP ENSO well. The rest two models fail to depict either type of ENSO spatial pattern similar to the observation.
The leading periodicities of these two ENSO types are investigated in this section. The leading periodicity is determined by performing a power spectrum analysis of the normalized principal component of the first SST EOF modes of the two ENSO types using the fast Fourier transform (FFT). The dominating period for EP ENSO and CP ENSO both in models and observation are presented as scatter dots in Figures 3A, B. It is worth mentioning that only the period shorter than seven years was calculated because the ENSO phenomenon is known to have a period of 2-7 years. As shown in Figures 3C, D, the power spectrum is dominated by the highest peak near year 5 and year 3 for EP ENSO and CP ENSO, respectively. The highest peak of the power spectrum denotes the leading periodicity of the ENSO events. Therefore, the EP ENSO event derived from the observational data has a longer leading period than the CP ENSO event, which agrees with several previous studies (Yu and Kim, 2010; Kim and Yu, 2012; Ren et al., 2013). To better compare the leading periodicity of two types of ENSO in CMIP models with that of the observation, scatter plots are given in Figures 3A, B. Compared with the observation (red dots in Figures 3A, B), most CMIP models fail to depict the longer leading periods of EP ENSO events. Furthermore, some models present leading periods of EP ENSO shorter than 2 years. Comparing CMIP models in different phases, no sign of improvement in the simulation of the ENSO periodicity from CMIP5 to CMIP6 for the coupled models is observed. The average periodicity for both types of ENSO simulated by CMIP6 models is slightly longer than in CMIP5 models.
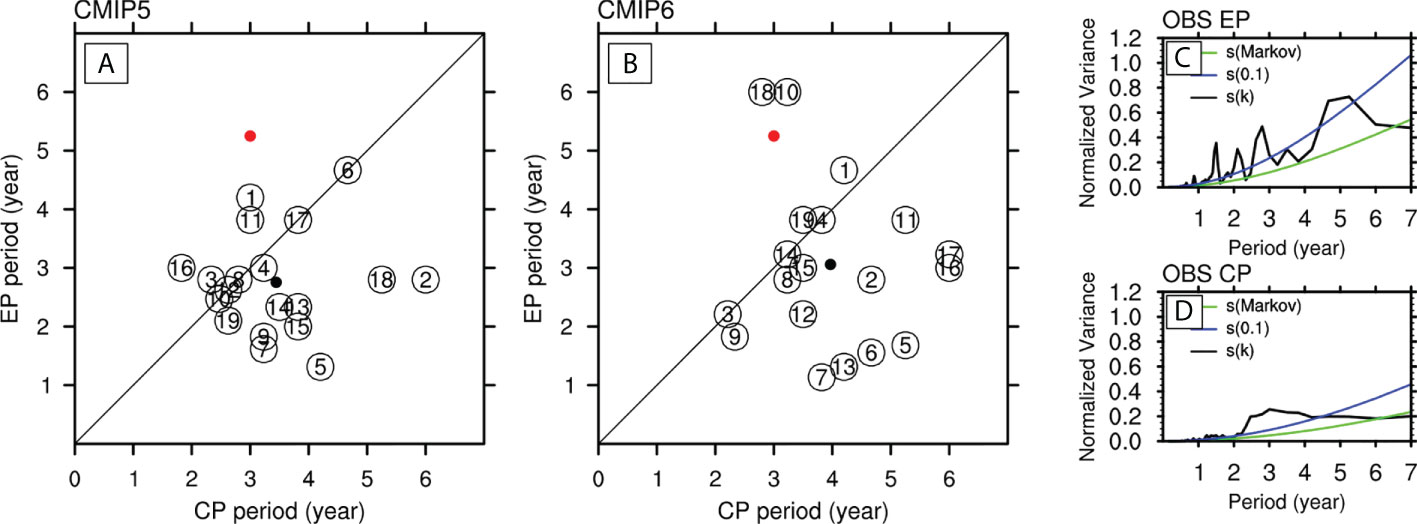
Figure 3 Scatter plots the leading periodicity for EP versus CP ENSO from (A) CMIP5 models and observations, and (B) CMIP6 and observations. The red dot represents the observational data, and the black denotes the model average. The normalized power spectrum for the observed (C) EP and (D) CP ENSOs from the HadISST (black lines). The green and blue lines denote the theoretical Markov “red noise” spectrum and the upper 90% confidence bound.
Seasonal standard variation of ENSO-related SSTA portrays the phase-locking behavior of ENSO. The observation data in Figures 4A–D shows that two types of ENSO events display significant phase-locking phenomena. The two normalized ENSO-related SSTAs display peak warming during boreal winter (November, December, and January). Though the seasonal variation of Niño3 SSTA and Niño4 SSTA both reach their maximum value from November to January, they reach their minimum value in different months. Particularly, Niño3 SSTA has its minimum seasonal variation during March, April, and May, while Niño4 SSTA has its minimum seasonal variation during May, June, and July.
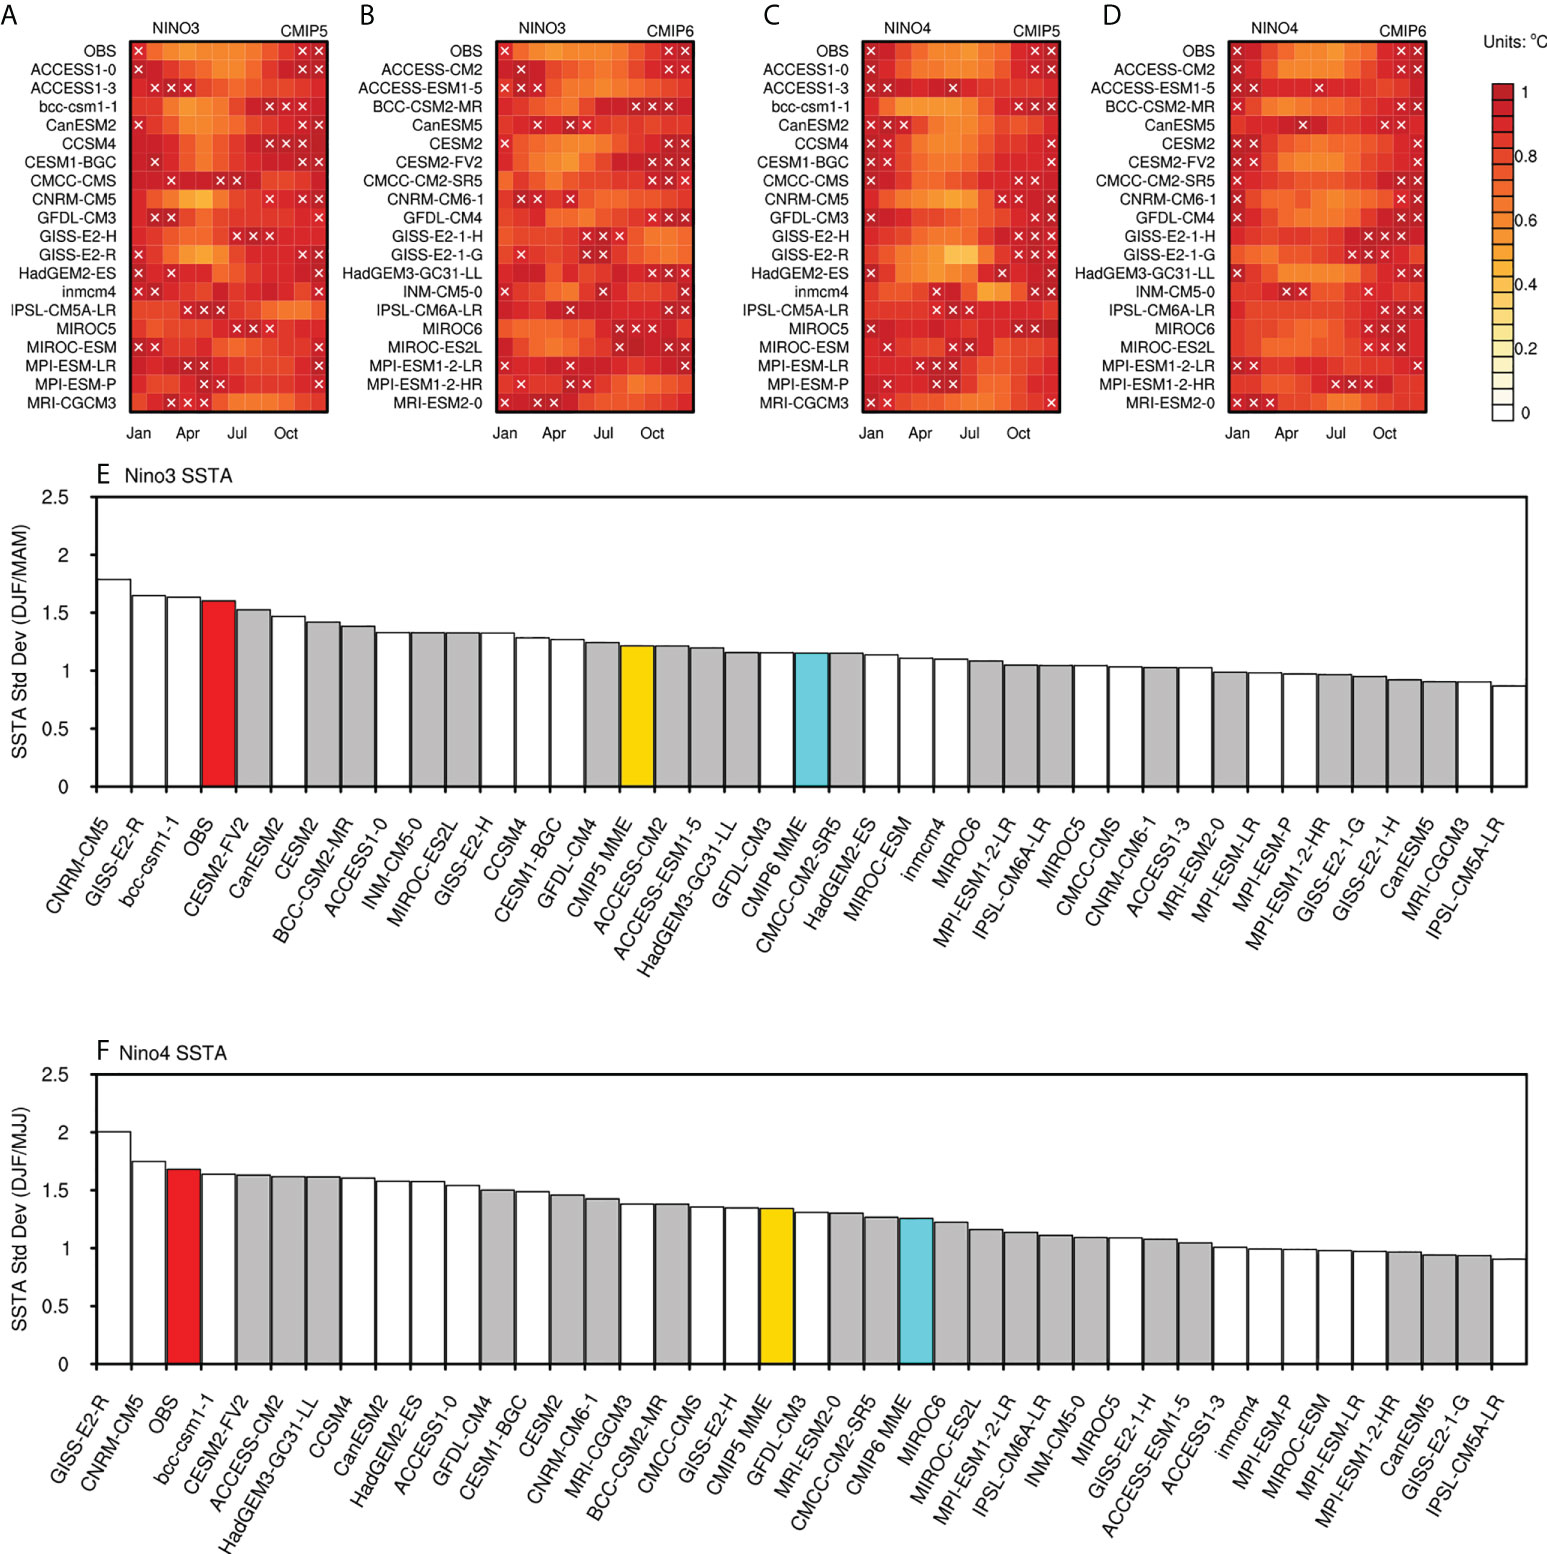
Figure 4 Seasonal phase-locking behavior in CMIP models. Standard deviation of Monthly Niño3 SSTA and Niño4 SSTA for observational data and CMIP5 and CMIP6 models, normalized by their maximum value (A–D). The white crosses indicate the largest 3 monthly standard deviation values in each model. Phase locking index for Niño3 SSTA (E) and Niño4 SSTA (F) in observation and CMIP models. The red bar represents the observation. The white and grey bars denote different models in CMIP5 and CMIP6, respectively. The yellow and blue bars indicate the multi-model mean result in CMIP5 and CMIP6.
To better imply the warming peak in the annual cycle, white crosses in Figures 4A–D are added, marking the largest three monthly variation values in each annual cycle. In terms of the observation, the three white crosses cover three successive months, namely November, December, and January. It indicates that the single warming peak is one main characteristic of ENSO phase locking. However, some models display more than one warming peak in their annual cycles. Therefore, the following criteria are made to assess model simulations. The model is regarded as failing to simulate a single-peak annual cycle if one of the three crosses is three or three more months separated from the other two crosses. Regarding CMIP5 models, two models (MPI-ESM-LR and MPI-ESM-P) have double peaks in the seasonal cycle of Niño3 SSTA, and three models (ACCESS1-3, inmcm4, MIROC-ESM) have double peaks in the seasonal cycle of Niño4 SSTA. As for CMIP6 models, four models (GISS-E2-1-G, INM-CM5-0, IPSL-CM6A-LR, MPI-ESM1-2-LR) and three models (ACCESS-ESM1-5, CanESM5, INM-CM5-0) have the same problem with the annual cycles of two ENSO-related SSTAs. Moreover, some CMIP models also struggle to represent realistic ENSO behavior regarding seasonality in the Niño3 and Niño4 regions. For example, GISS-E2-H and MIROC present a locking month with the warm phase around August, instead of December, in the eastern Pacific region (Niño3). Generally, most models capture the seasonality of Niño4 SSTA better than that of Niño3 SST. In addition, fewer models present the warming peak of Niño4 SSTA variation during boreal summer and autumn in CMIP6. However, only four models, namely ACCESS-ESM1-5, CESM2, CMCC-CM2-SR5, and CFDL-CM4, gain moderate improvement from their previous version in the Niño3 SSTA seasonality simulation.
To better analyze different CMIP models, we calculate the seasonal phase locking index (PLI) following Bellenger et al. (2014). We calculate the PLI by using different months regarding the different seasonality features of two ENSO-related SSTA. Specifically, the PLI for the Niño3(Niño4) index is the ratio of the SSTA standard deviation in Niño3 in NDJ(NDJ) over MAM(MJJ). Figures 4E, F indicate that most models provide weaker phase-locking than the observation. In terms of the multi-model average, CMIP6 fails to improve in the simulation of the seasonality of the ENSO-related SSTAs. Among all the models, CNRM-CM5 and GISS-E2-R simulate slightly stronger phase-locking for both Niño3 and Niño4 SSTA. BCC-CSM1-1 from CMIP5 and CESM2-FV2 from CMIP6 give the best performance.
To better evaluate the overall performance of each CMIP model, a synthetic score, similar to Bellenger et al. (2014), is defined as the average of the following eight metrics: the maximum standard deviation for EP and CP ENSO spatial SSTA pattern to depict the simulated ENSO amplitude; the spatial root mean square error (RMSE) of the EP and CP ENSO spatial SSTA to qualify ENSO spatial structure; the leading periodicity (Figures 3A, B) to describe the ENSO period; and the phase-locking index (Figures 4E, F) to represent ENSO seasonal phase locking. For each metric (except for RMSE) and each model, we compute the absolute value of the error compared to observations. Then the absolute error and the RMSE are normalized by the CMIP5 + CMIP6 inter-model standard deviation. An overall ENSO score is defined as the average of these normalized errors. The lower the ENSO score, the better the model captures the basic characteristics of the two types of ENSO on average.
The eight metrics and the ENSO scores for different CMIP models are given in Figure 5. Generally, the average ENSO score for CMIP6 is 2.375, indicating modest improvement compared to the average score for CMIP5 of 2.441. Specifically, the simulation skill of the amplitude and spatial structure of CP ENSO improve significantly in CMIP6. The amplitude and the periodicity of EP ENSO are slightly better depicted in CMIP6 models than in CMIP5 models on the average level. However, the other characteristics are still poorly represented in CMIP6. Among all 38 models, the top five models are ACCESS-CM2, CNRM-CM5, CanESM2, CESM1-BGC, and HadGEM3-GC31-LL. In addition, it is interesting to find that although 10 out of 19 models present better performance of ENSO simulation in CMIP6, some models which have excellent performance in CMIP5 fail to improve in CMIP6. Further work is still needed to elucidate this finding.
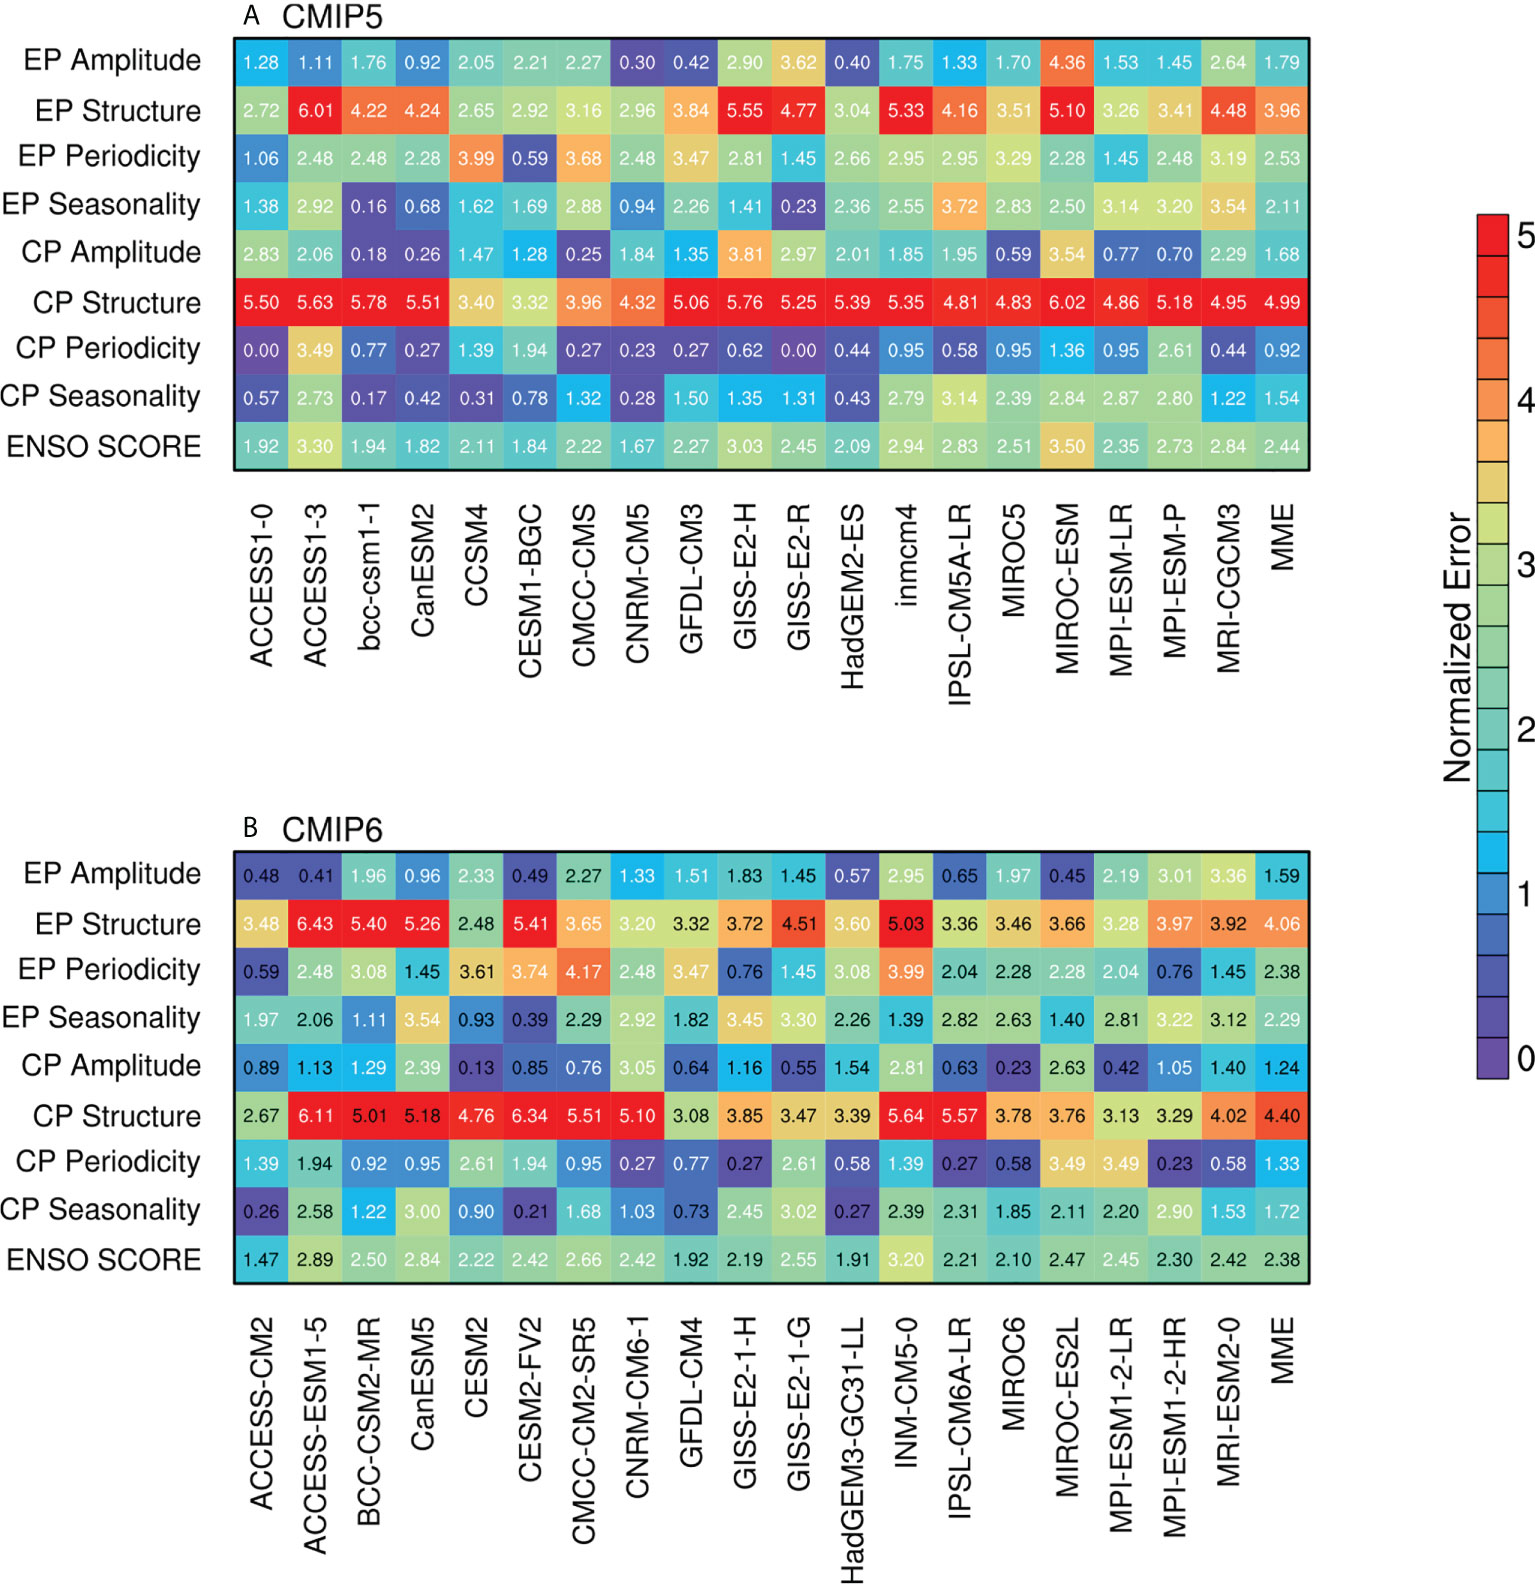
Figure 5 Simulation performance metrics (units: 1) for each model of (A) CMIP5 and (B) CMIP6. Eight primary metrics in terms of two types of ENSO simulation skills are used as the criteria: EP and CP ENSO amplitude (the error of the maximum standard deviation for EP and CP ENSO SSTA); EP and CP ENSO spatial structure (the spatial root mean square error of the EP and CP ENSO SSTA); EP and CP ENSO periodicity (the error of the leading periodicity of EP and CP ENSO time series); EP and CP ENSO seasonality (the error of phase-locking index for Niño3 SSTA and Niño4 SSTA). The ENSO score is defined as the average of the above eight metrics. Text in each color box represents the exact score value, and the black text indicates a decreased error from CMIP5 to CMIP6.
A universal problem in current models is the excessive cold tongue bias of the SST climatology in the tropical pacific. Recent research has shown that the cold tongue bias is slightly reduced in CMIP6, especially in the Niño4 region (Jiang et al., 2021). Therefore, the relationship between SST bias in the tropical Pacific and the ENSO score is investigated. In addition, as we indicated in the last section that the simulation skill of CP ENSO has improved, we naturally consider if there is a link between the improvement of the simulation skill of CP ENSO and the decrease of the climatology bias in the CP ENSO-related region. The SST bias is computed by taking an area average over the absolute error of the model SST climatology in the Niño4 region. It has been found that there is a correlation of 0.38 (p < 0.02) between the ENSO score and the average climatology bias in the Niño4 region among all CMIP models (Figure 6). Previous research indicated that excessive cold tongue bias induces overly weak negative shortwave-SST feedback in the central Pacific (Bayr et al., 2018; Ying et al., 2019), and produces a zonal advection feedback bias through changing zonal SST gradient (Jiang et al., 2021), thus leading to the excessive westward extension of ENSO SST variability. Therefore, the modest improvement in the simulated mean background in CMIP6 may partly explain the slight improvement in overall ENSO simulation performance.
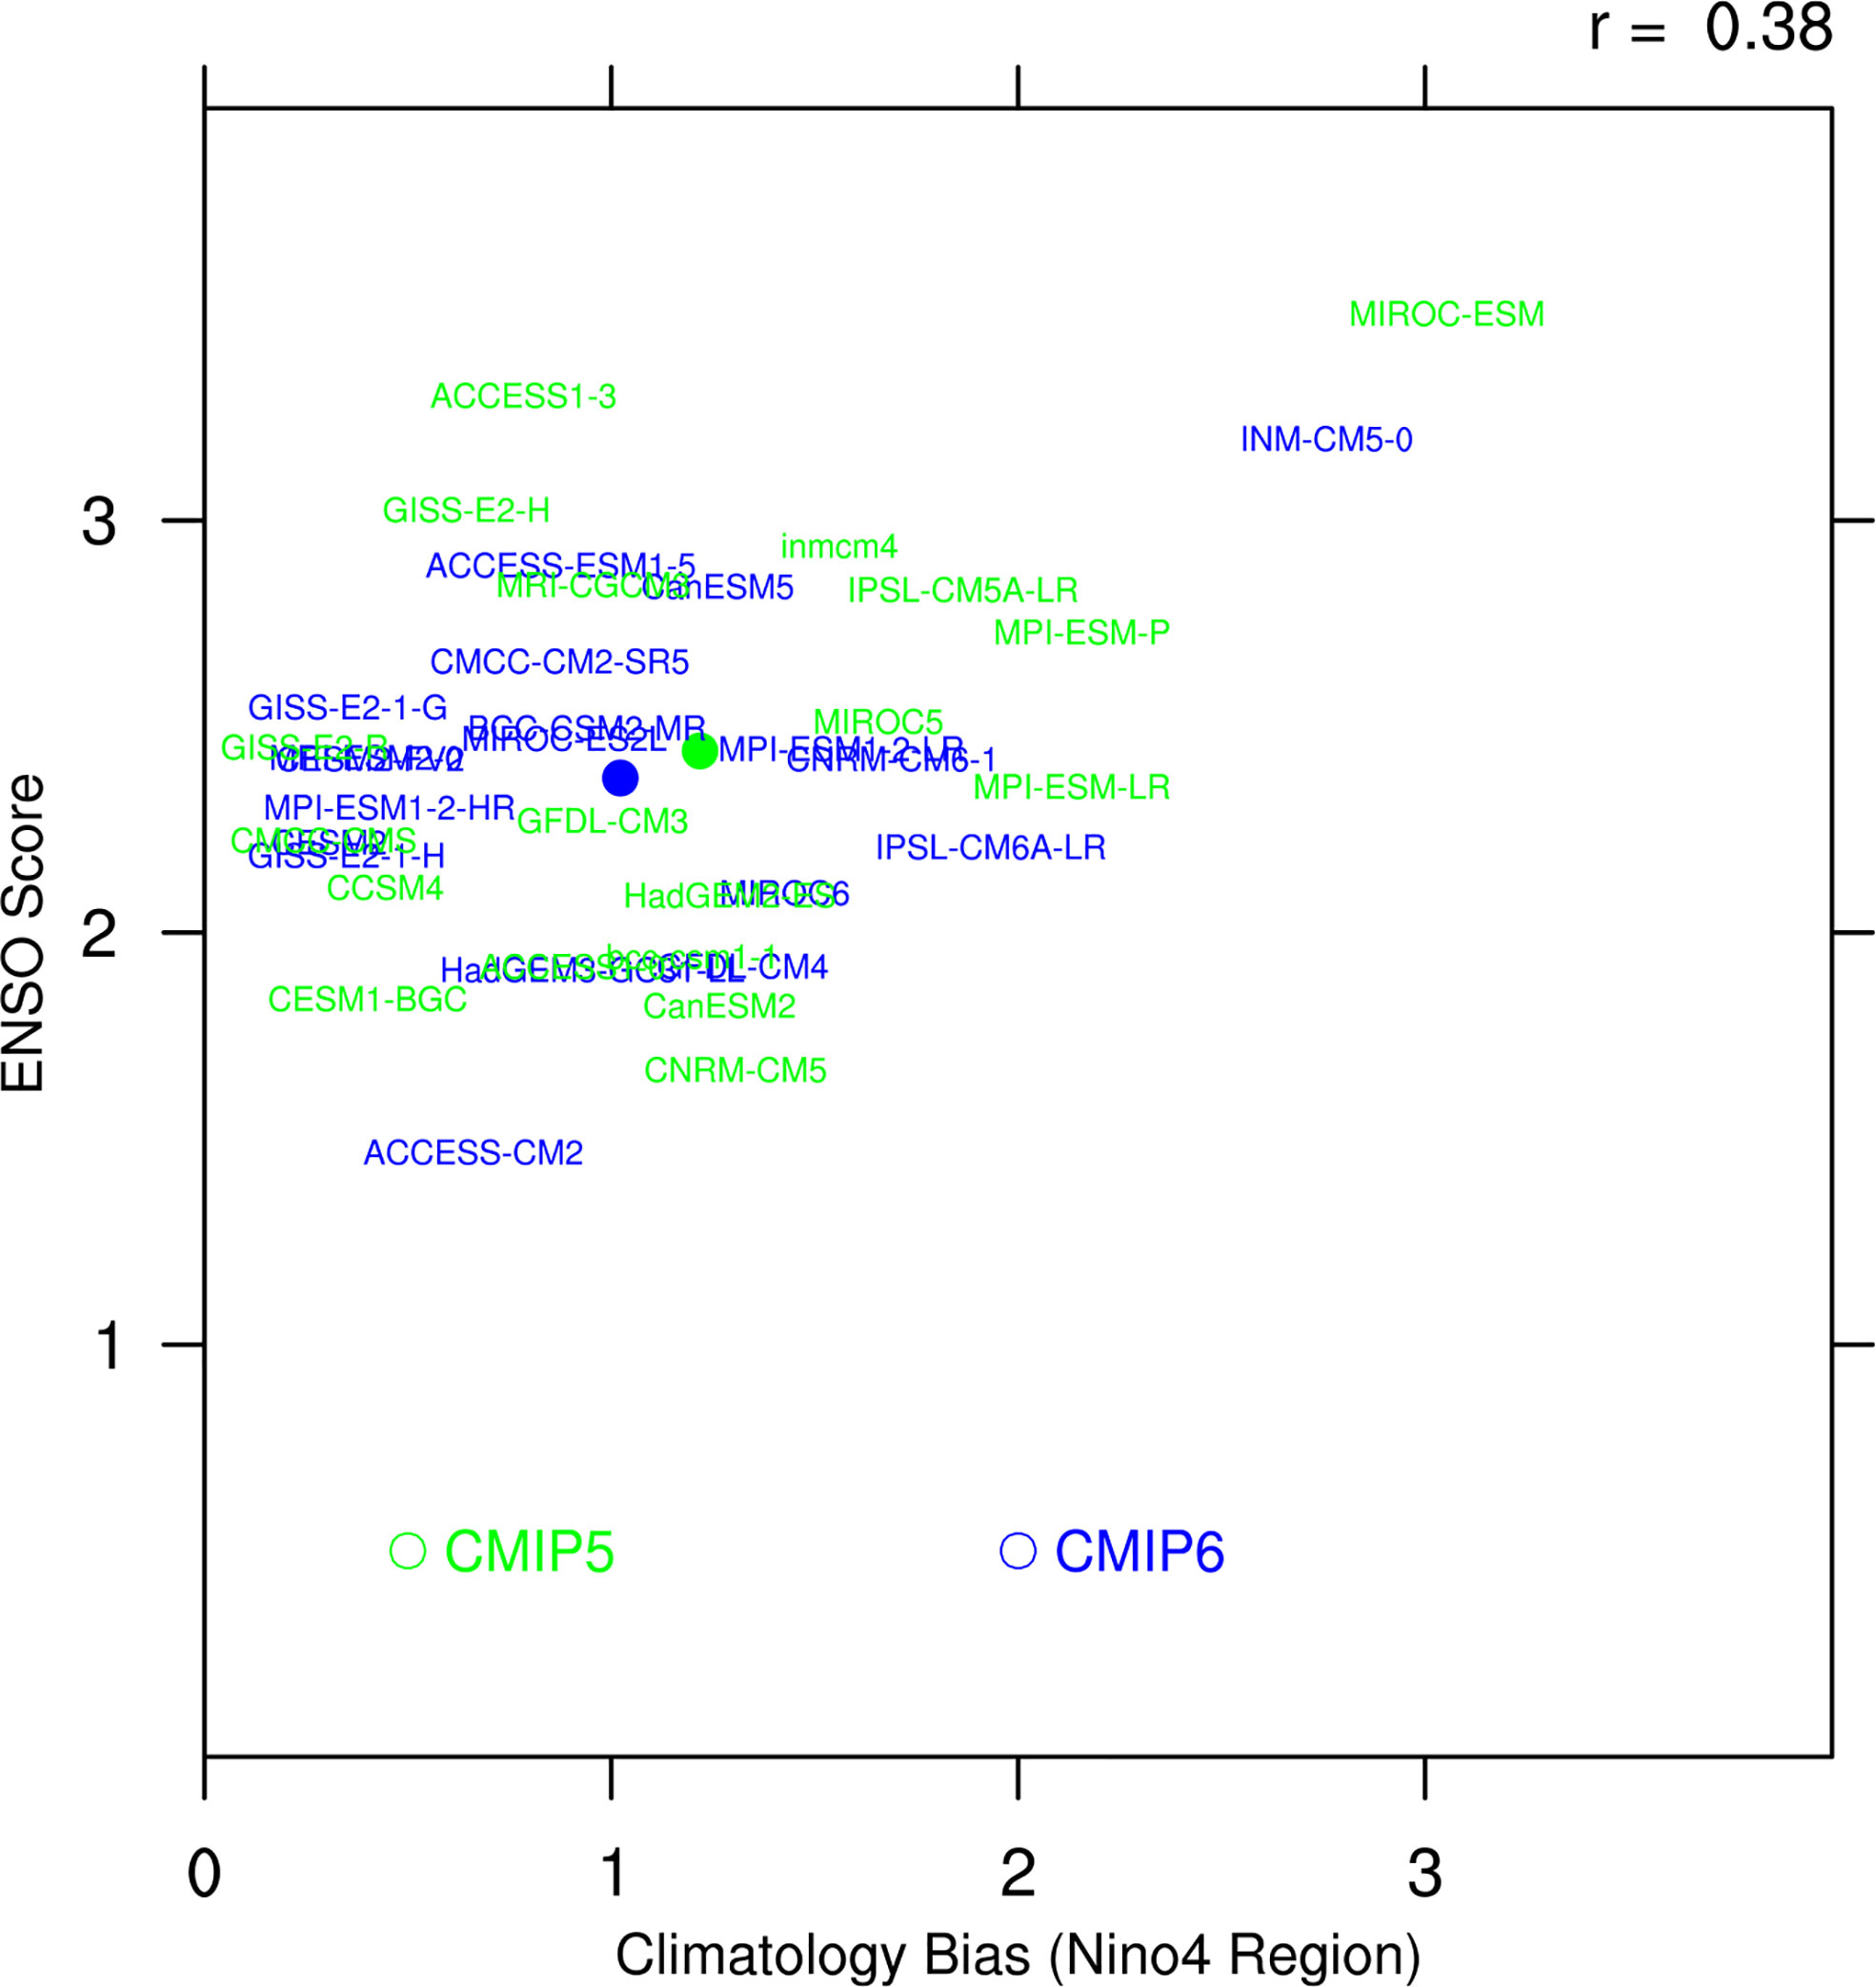
Figure 6 Scatterplots of the climatology bias of SST in the Niño4 region of CMIP models (horizontal axis, units: °C) and the ENSO score of CMIP models (vertical axis, units: 1). Green (blue) texts represent different CMIP5 (CMIP6) models listed in Table 1, and green (blue) dots denote the MME of CMIP5 (CMIP6) models.
Since the 1980s, the frequent occurrence of CP El Niño events has become a focus for climate research. However, the state-of-the-art models still have difficulties representing the realistic feature of the CP ENSO. This study assessed the relative performance of 19 CMIP5 models and their updated version in CMIP6 in terms of two types of ENSO simulation. The simulation skills of all models have not been improved consistently. From the perspective of MME, the amplitude and structure of CP ENSO, and the amplitude and periodicity of EP ENSO are better depicted. The CMIP6 models can better present the winter peak of the Niño4 SSTA variation. Regardless, the excessive westward extension of CP ENSO variability is still presented in CMIP6 models. There is no significant improvement in the simulation of EP ENSO structure, CP ENSO periodicity, and the seasonal cycle of both types of ENSO. Furthermore, the overall ENSO simulation performance is assessed by computing eight metrics, indicating moderate improvement for CMIP6. There is a correlation of 0.38 between the ENSO score and the average climatology bias in the Niño4 region. Therefore, the modest improvement in the simulated mean state in CMIP6 may explain the slight improvement of ENSO features. However, most models have ENSO score pluses and minuses in CMIP6, suggesting future investigations in this certain field.
The ENSO simulation ability of state-of-the-art numerical models is a focus for model development and ENSO research. Planton et al. (2021) evaluated the ENSO performance in 88 CMIP models by creating CLIVAR 2020 ENSO metrics package. ENSO performance, ENSO teleconnections, and ENSO processes are evaluated by experts in several different climate communities. However, different ENSO types were not separately evaluated in their work. The assessment in this paper focused on the basic simulation skills of the ENSO features with respect to different ENSO flavors. By assessing CMIP5 models, Feng et al. (2019) implied that different mechanisms account for the simulation of two types of ENSO in models. The strong contributions of the thermocline feedback and Ekman feedback during SST warming in the eastern equatorial Pacific should be simulated well to provide a better simulation of EP ENSO. While the climatological SST gradient over the Niño4 region is more related to the better performance of the CP ENSO simulation. Our result agrees with them in that the correlation between the EP ENSO score and the SST bias in the tropical region is not significant. While the CP seasonality score and CP structure score both have a significant relationship with the SST bias in the Niño4 region. The correlation between the CP amplitude score and the SST bias in the tropical Pacific is also of 95% significance. However, the reason for the change in ENSO simulation skills is complicated and intriguing, and also closely related to the model development and ENSO mechanism, which is not the main focus of this paper. Anyhow, the overall evaluation of ENSO, including the ENSO score metrics, in this study can provide suggestions to select models to explore other underlying mechanisms of the ENSO diversity simulation in the future.
Research shows that many updates are applied to the development of CMIP6 models, including cloud parameterization, aerosol presentation, and vertical level resolution in both atmospheric and oceanic modules. However, it seems that there is no qualitative improvement in the simulations of two types of ENSO from CMIP5 to CMIP6, indicating much room for model development in the future. Furthermore, the climatology bias of SST in CMIP6 models is still large, which induces a more westward western boundary of the warm SSTA variability for CP ENSO in models. It is suggested that the western boundary of the ENSO spatial variability is closely related to the frequency of the ENSO events (Yu and Kim, 2010). Therefore, the research on the future projection of the ENSO frequency based on CMIP outputs should be taken with great caution.
The original contributions presented in the study are included in the article/supplementary material. Further inquiries can be directed to the corresponding author.
The idea originated from a discussion between the two authors. Both authors designed the assessment methodology. MH collected the data, designed the software program, and carried out the data analysis under the guidance of YT. The initial manuscript draft was written by MH and edited by YT. Both authors contributed to the article and approved the submitted version.
This study is supported by the National Natural Science Foundation of China (Grant Nos. 42106004 and 42130409).
All figures in this study were generated by the NCAR Command Language (version 6.4.0, http://dx.doi.org/10.5065/D6WD3XH5).
The authors declare that the research was conducted in the absence of any commercial or financial relationships that could be construed as a potential conflict of interest.
All claims expressed in this article are solely those of the authors and do not necessarily represent those of their affiliated organizations, or those of the publisher, the editors and the reviewers. Any product that may be evaluated in this article, or claim that may be made by its manufacturer, is not guaranteed or endorsed by the publisher.
Achutarao K., Sperber K. (2002). Simulation of the El niño southern oscillation: Results from the coupled model intercomparison project. Clim. Dynam. 19, 191–209. doi: 10.1007/s00382-001-0221-9
Battisti D. S., Hirst A. C. (1989). Interannual variability in a tropical atmosphere-ocean model: Influence of the basic state, ocean geometry and nonlinearity. J. Atmos. Sci. 46, 1687–1712. doi: 10.1175/1520-0469(1989)046<1687:IVIATA>2.0.CO;2
Bayr T., Latif M., Dommenget D., Wengel C., Harlaß J., Park W. (2018). Mean-state dependence of ENSO atmospheric feedbacks in climate models. Clim. Dynam. 50, 3171–3194. doi: 10.1007/s00382-017-3799-2
Bellenger H., Guilyardi E., Leloup J., Lengaigne M., Vialard J. (2014). ENSO representation in climate models: from CMIP3 to CMIP5. Clim. Dynam. 42, 1999–2018. doi: 10.1007/s00382-013-1783-z
Bi D., Dix M., Marsland S., O'farrell S., Sullivan A., Bodman R., et al. (2020). Configuration and spin-up of ACCESS-CM2, the new generation Australian community climate and earth system simulator coupled model. J. So Hemisph. Earth 70, 225–251. doi: 10.1071/ES19040
Boucher O., Jerome S., Albright A. L., Aumont O., Balkanski Y., Bastrikov V., et al. (2020). Presentation and evaluation of the IPSL-CM6A-LR climate model. J. Adv. Model. Earth Sy 12, e2019MS002010. doi: 10.1029/2019MS002010
Capotondi A., Wittenberg A., Kug J. S., Takahashi K., McPhaden M. (2020). “ENSO diversity,” in El Niño southern oscillation in a changing climate (Hoboken: Wiley), pp 65–pp 86. doi: 10.1002/9781119548164.ch4
Cherchi A., Fogli P. G., Lovato T., Peano D., Iovino D., Gualdi S., et al. (2019). Global mean climate and main patterns of variability in the CMCC-CM2 coupled model. J. Adv. Model. Earth Sy 11, 185–209. doi: 10.1029/2018MS001369
Chu Q., Lian T., Chen D., Wang X., Feng J., Feng G., et al. (2021). The role of El niño in the extreme mei-yu rainfall in 2020. Atmos. Res. 266, 105965. doi: 10.1016/j.atmosres.2021.105965
Danabasoglu G., Lamarque J.-F., Bacmeister J., Bailey D. A., Duvivier A. K., Edwards J., et al. (2020). The community earth system model version 2 (CESM2). J. Adv. Model. Earth Sy 12, e2019MS001916. doi: 10.1029/2019MS001916
Eyring V., Bony S., Meehl G., Senior C., Stevens B., Ronald S., et al. (2016). Overview of the coupled model intercomparison project phase 6 (CMIP6) experimental design and organization. Geosci. Model. Dev. 9, 1937–1958. doi: 10.5194/gmd-9-1937-2016
Feng J., Lian T., Ying J., Junde L., Li G. (2019). Do CMIP5 models show El niño diversity? J. Clim. 33, 1619–1641. doi: 10.1175/JCLI-D-18-0854.1
Freund M. B., Brown J. R., Henley B. J., Karoly D. J., Brown J. N. (2020). Warming patterns affect El niño diversity in CMIP5 and CMIP6 models. J. Clim. 33, 8237–8260. doi: 10.1175/JCLI-D-19-0890.1
Hajima T., Watanabe M., Yamamoto A., Tatebe H., Noguchi M., Abe M., et al. (2020). Development of the MIROC-ES2L earth system model and the evaluation of biogeochemical processes and feedbacks. Geosci. Model. Dev. 13, 2197–2244. doi: 10.5194/gmd-13-2197-2020
Ham Y. G., Kug J. S. (2012). How well do current climate models simulate two types of El niño? Clim. Dynam. 39, 383–398. doi: 10.1007/s00382-011-1157-3
Held I. M., Guo H., Adcroft A., Dunne J. P., Horowitz L. W., Krasting J., et al. (2019). Structure and performance of GFDL's CM4.0 climate model. J. Adv. Model. Earth Sy 11, 3691–3727. doi: 10.1029/2019MS001829
Hourdin F., Rio C., Jam A., Traore A.-K., Musat I. (2020). Convective boundary layer control of the Sea surface temperature in the tropics. J. Adv. Model. Earth Sy 12, e2019MS001988. doi: 10.1029/2019MS001988
Jiang W., Huang P., Huang G., Ying J. (2021). Origins of the excessive westward extension of ENSO SST simulated in CMIP5/6 models. J. Clim. 34, 2839–2851. doi: 10.1175/JCLI-D-20-0551.1
Jiang F., Zhang W., Geng X., Stuecker M. F., Liu C. (2019). Impacts of central pacific El niño on southern China spring precipitation controlled by its longitudinal position. J. Clim. 32, 7823–7836. doi: 10.1175/jcli-d-19-0266.1
Jin F.-F. (1997a). An equatorial ocean recharge paradigm for ENSO. part II: A stripped-down coupled model. J. Atmos. Sci. 54, 830–847. doi: 10.1175/1520-0469(1997)054<0830:Aeorpf>2.0.Co;2
Jin F. F. (1997b). An equatorial ocean recharge paradigm for ENSO. part I: Conceptual model. J. Atmos. Sci. 54, 811–829. doi: 10.1175/1520-0469(1997)054<0811:Aeorpf>2.0.Co;2
Kao H. Y., Yu J. Y. (2009). Contrasting Eastern-pacific and central-pacific types of ENSO. J. Clim. 22, 615–632. doi: 10.1175/2008JCLI2309.1
Kawai H., Yukimoto S., Koshiro T., Oshima N., Tanaka T., Yoshimura H., et al. (2019). Significant improvement of cloud representation in the global climate model MRI-ESM2. Geosci. Model. Dev. 12, 2875–2897. doi: 10.5194/gmd-12-2875-2019
Kelley M., Schmidt G., Nazarenko L., Bauer S., Ruedy R., Russell G., et al. (2020). GISS-E2.1: Configurations and climatology. J. Adv. Model. Earth Sy 12, e2019MS002025. doi: 10.1029/2019MS002025
Kim S. T., Yu J. Y. (2012). The two types of ENSO in CMIP5 models. Geophys. Res. Lett. 39, 221–228. doi: 10.1029/2012GL052006
Latif M., Sperber K., Arblaster J., Braconnot P., Chen D. K., Colman A., et al. (2001). ENSIP: The El niño simulation intercomparison project. Clim. Dynam. 18, 255–276. doi: 10.1007/s003820100174
Lindsay K., Bonan G., Doney S., Hoffman F., Lawrence D., Long M., et al. (2014). Preindustrial-control and twentieth-century carbon cycle experiments with the earth system model CESM1(BGC). J. Clim. 27, 8981–9005. doi: 10.1175/JCLI-D-12-00565.1
Lin I. I., Camargo S., Patricola C., Boucharel J., Chand S., Klotzbach P., et al. (2020). “ENSO and tropical cyclones,” in El Niño southern oscillation in a changing climate (Hoboken:Wiley). doi: 10.1002/9781119548164.ch17
Liu M., Ren H.-L., Zhang R., Ineson S., Wang R. (2021). ENSO phase-locking behavior in climate models: from CMIP5 to CMIP6. Environ. Res. Commun. 3, 031004. doi: 10.1088/2515-7620/abf295
Mauritsen T., Bader J., Becker T., Behrens J., Bittner M., Brokopf R., et al. (2019). Developments in the MPI-m earth system model version 1.2 (MPI-ESM 1.2) and its response to increasing CO2. J. Adv. Model. Earth Sy 11, 998–1038. doi: 10.1029/2018MS001400
McPhaden M. J. (1999). Genesis and evolution of the 1997-98 El niño. Sci. (New York NY) 283, 950–954. doi: 10.1126/science.283.5404.950
McPhaden M. J., Santoso A., Cai W. (2020). “Introduction to El niño southern oscillation in a changing climate,” in El Niño southern oscillation in a changing climate (Hoboken: Wiley), pp 1–pp19. doi: 10.1002/9781119548164.ch1
Meehl G., Boer G., Covey C., Latif M., Ronald S. (2000). CMIP coupled model intercomparison project. Bull. Am. Meteorol. Soc. 81, 313–318. doi: 10.1175/1520-0477(2000)081<0313:TCMIPC>2.3.CO;2
Meehl G., Covey C., McAvaney B., Latif M., Ronald S. (2005). Overview of the coupled model intercomparison project. Bull. Am. Meteorol. Soc. 86, 95–96. doi: 10.1175/BAMS-86-1-89
Neelin J. D., Battisti D. S., Hirst A. C., Jin F. F., Wakata Y., Yamagata T., et al. (1998). ENSO theory. J. Geophys. Res.: Oceans 103, 14261–14290. doi: 10.1029/97JC03424
Planton Y., Guilyardi E., Wittenberg A., Lee J., Gleckler P., Bayr T., et al. (2021). Evaluating climate models with the CLIVAR 2020 ENSO metrics package. Bull. Am. Meteorol. Soc. 102, E193–E217. doi: 10.1175/BAMS-D-19-0337.1
Rayner N. A., Parker D. E., Horton E. B., Folland C. K., Alexander L. V., Rowell D. P., et al. (2003). Global analyses of sea surface temperature, sea ice, and night marine air temperature since the late nineteenth century. J. Geophys. Res.: Atmos. 108, 4407. doi: 10.1029/2002JD002670
Ren H., Jin F.-F., Stuecker M., Ruihuang X. (2013). ENSO regime change since the late 1970s as manifested by two types of ENSO. J. Meteorol. Soc. Jpn. 91, 835–842. doi: 10.2151/jmsj.2013-608
Savita A., Marsland S., Dix M., Bi D., Dobrohotoff P., Fiedler R., et al. (2019). Data from: Earth system grid federation online platform. CSIRO-ARCCSS ACCESS-CM2 model output prepared for CMIP6 FAFMIP. doi: 10.22033/ESGF/CMIP6.2282
Song X., Chen D., Tang Y., Liu T. (2018). An intermediate coupled model for the tropical ocean-atmosphere system. Sci. China: Earth Sci. 61, 1859–1874. doi: 10.1007/s11430-018-9274-6
Song Z., Liu H., Chen X. (2020). Eastern Equatorial pacific SST seasonal cycle in global climate models: from CMIP5 to CMIP6. Acta Oceanol. Sin. 39, 50–60. doi: 10.1007/s13131-020-1623-z
Swart N., Cole J., Kharin V., Lazare M., Scinocca J., Gillett N., et al. (2019). The Canadian earth system model version 5 (CanESM5.0.3). Geosci. Model. Dev. 12, 4823–4873. doi: 10.5194/gmd-12-4823-2019
Tang Q., Gong K., Xiong L., Dong Y., Xu W. (2022). Can El niño–southern oscillation increase respiratory infectious diseases in China? an empirical study of 31 provinces. Int. J. Env. Res. Pub. He 19, 2971. doi: 10.3390/ijerph19052971
Tang Y., Yu B. (2008). MJO and its relationship to ENSO. J. Geophys. Res.: Atmos. 113, D14106. doi: 10.1029/2007JD009230
Tatebe H., Ogura T., Nitta T., Komuro Y., Ogochi K., Takemura T., et al. (2018). Description and basic evaluation of simulated mean state, internal variability, and climate sensitivity in MIROC6. Geosci. Model. Dev. 12, 2727–2765. doi: 10.5194/gmd-12-2727-2019
Taylor K. E., Stouffer R. J., Meehl G. A. (2012). An overview of CMIP5 and the experiment design. Bull. Am. Meteorol. Soc. 93, 485–498. doi: 10.1175/BAMS-D-11-00094.1
Timmermann A., An S.-I., Kug J.-S., Jin F.-F., Cai W., Capotondi A., et al. (2018). El Niño–southern oscillation complexity. Nature 559, 535–545. doi: 10.1038/s41586-018-0252-6
Voldoire A., Saint‐Martin D., Senesi S., Decharme B., Alias A., Chevallier M., et al. (2019). Evaluation of CMIP6 DECK experiments with CNRM-CM6-1. J. Adv. Model. Earth Sy 11, 2177–2213. doi: 10.1029/2019MS001683
Volodin E., Mortikov E., Kostrykin S., Galin V., Lykossov V., Gritsun A., et al. (2017). Simulation of the present-day climate with the climate model INMCM5. Clim. Dynam. 49, 3715–3734. doi: 10.1007/s00382-017-3539-7
Wang B., Barcilon A., Fang Z. (1999). Stochastic dynamics of El niño–southern oscillation. J. Atmos. Sci. 56, 5–23. doi: 10.1175/1520-0469(1999)056<0005:Sdoeno>2.0.Co;2
Wang B., Fang Z. (1996). Chaotic oscillations of tropical climate: A dynamic system theory for ENSO. J. Atmos. Sci. 53, 2786–2802. doi: 10.1175/1520-0469(1996)053<2786:Cootca>2.0.Co;2
Williams K. D., Copsey D., Blockley E. W., Bodas-Salcedo A., Calvert D., Comer R., et al. (2018). The met office global coupled model 3.0 and 3.1 (GC3.0 and GC3.1) configurations. J. Adv. Model. Earth Sy 10, 357–380. doi: 10.1002/2017MS001115
Wu T., Lu Y., Fang Y., Xin X., Li L., Li W., et al. (2019). The Beijing climate center climate system model (BCC-CSM): the main progress from CMIP5 to CMIP6. Geosci. Model. Dev. 12, 1573–1600. doi: 10.5194/gmd-12-1573-2019
Ying J., Huang P., Lian T., Tan H. (2019). Understanding the effect of an excessive cold tongue bias on projecting the tropical pacific SST warming pattern in CMIP5 models. Clim. Dynam. 52, 1805–1818. doi: 10.1007/s00382-018-4219-y
Yu J.-Y., Kim S. T. (2010). Identification of central-pacific and Eastern-pacific types of ENSO in CMIP3 models. Geophys. Res. Lett. 37, 242–247. doi: 10.1029/2010GL044082
Yukimoto S., Kawai H., Koshiro T., Oshima N., Yoshida K., Urakawa S., et al. (2019). The meteorological research institute earth system model version 2.0, MRI-ESM2.0: Description and basic evaluation of the physical component. J. Meteorol. Soc. Jpn. 97, 931–965. doi: 10.2151/jmsj.2019-051
Zhang W. J., Jin F. F., Stuecker M. F., Wittenberg A. T., Timmermann A., Ren H. L., et al. (2016). Unraveling El niño's impact on the East Asian monsoon and Yangtze river summer flooding. Geophys. Res. Lett. 43, 11375–11382. doi: 10.1002/2016GL071190
Keywords: ENSO diversity, phase-locking, CMIP models, ENSO score, model simulation
Citation: Hou M and Tang Y (2022) Recent progress in simulating two types of ENSO – from CMIP5 to CMIP6. Front. Mar. Sci. 9:986780. doi: 10.3389/fmars.2022.986780
Received: 05 July 2022; Accepted: 05 August 2022;
Published: 24 August 2022.
Edited by:
Xiaohui Xie, Ministry of Natural Resources, ChinaReviewed by:
Jing Ma, Nanjing University of Information Science and Technology, ChinaCopyright © 2022 Hou and Tang. This is an open-access article distributed under the terms of the Creative Commons Attribution License (CC BY). The use, distribution or reproduction in other forums is permitted, provided the original author(s) and the copyright owner(s) are credited and that the original publication in this journal is cited, in accordance with accepted academic practice. No use, distribution or reproduction is permitted which does not comply with these terms.
*Correspondence: Youmin Tang, eXRhbmdAdW5iYy5jYQ==
Disclaimer: All claims expressed in this article are solely those of the authors and do not necessarily represent those of their affiliated organizations, or those of the publisher, the editors and the reviewers. Any product that may be evaluated in this article or claim that may be made by its manufacturer is not guaranteed or endorsed by the publisher.
Research integrity at Frontiers
Learn more about the work of our research integrity team to safeguard the quality of each article we publish.