 Junhyeong Seo1,2
 Doshik Hahm3*
 Guebuem Kim1
 Inhee Lee3
 Jihyun Park1
 Taehee Na1
 Jae-Hyoung Park4
 Sok Kuh Kang4
 Jeomshik Hwang1
- 1School of Earth and Environmental Sciences/Research Institute of Oceanography, Seoul National University, Seoul, South Korea
- 2Marine Environmental Research Center, Korea Institute of Ocean Science and Technology, (KIOST), Busan, South Korea
- 3Department of Oceanography, Pusan National University, Busan, South Korea
- 4Ocean Circulation and Climate Research Center, Korea Institute of Ocean Science and Technology (KIOST), Busan, South Korea
We investigated the effects of eddies and typhoons on the biogeochemistry of the tropical northwest Pacific by examining the distribution of nutrients, dissolved oxygen (DO), chlorophyll-a (Chl-a), gross primary production (GPP), dissolved organic carbon (DOC), and fluorescent dissolved organic matter (FDOM). Water samples were collected from anticyclonic and cyclonic eddies in September 2019 and 2020, and before and after the passage of a Category 2 typhoon in 2019. The study region was characterized by a deep nitracline (~150 m), which was deeper than both the pycnocline (~50 m) and the FDOM-depleted layer (~75 m). A subsurface chlorophyll maximum layer was observed at 100–150 m depth. No clear differences in Chl-a, DO, GPP, DOC, and FDOM were observed for the anticyclonic and cyclonic eddies, indicating that the eddies did not have a significant influence on biological production. Similarly, there were no discernable changes in Chl-a concentrations or other biogeochemical parameters after the passage of the typhoon, which induced water mixing to a depth of ~60 m. We conjecture that the nutrient-depleted layer was too deep for any eddy- or typhoon-induced vertical mixing to cause upwelling of nutrients to the euphotic zone. Our results imply that the disturbances caused by mesoscale processes in the upper layer of the highly oligotrophic northwest Pacific may have a smaller effect than in oceans in other parts of the world.
Introduction
Mesoscale eddies, which are ubiquitous phenomena in the surface ocean (McWilliams, 2008), play a crucial role in global ocean circulation, regional water mixing and redistribution (Chelton, 2013; Lao et al., 2022). Mesoscale eddies have also been reported to affect primary production (PP) by transporting nutrients (Williams and Follows, 2003). Cyclonic (cold) eddies generally have high PP because localized divergence and subsequent upwelling increase nutrient supply to the euphotic zone (Falkowski et al., 1991; Oschlies and Garcon, 1998; Benitez-Nelson et al., 2007). McGillicuddy et al. (1998) reported that the upward flux of nitrate via upwelling in a cyclonic eddy accounted for ~40% of the annual nutrient budget in the Sargasso Sea. The upwelling of nutrients can induce plankton blooms and shifts in the compositions of planktonic communities (McGillicuddy et al., 2007). For example, the expansion of eukaryotic phytoplankton biomass with an intensification of subsurface chlorophyll maximum (SCM) was observed in the cyclonic eddy of the North Pacific Subtropical Gyre (Barone et al., 2022). In contrast, anticyclonic (warm) eddies generally have low PP because of convergence and deepening of the thermocline (Siegel et al., 1999; Ning et al., 2008; Gaube et al., 2013), although exceptions have been reported. Mizobata et al. (2002) reported chlorophyll-a (Chl-a) concentrations that were three times higher at the edge than in the core of an anticyclonic eddy. Similarly, the phytoplankton communities at the edges of anticyclonic eddies were markedly different from those at the cores of the eddies in the northern South China Sea (Wang et al., 2018). Furthermore, Martin and Richards (2001) observed enhanced PP in the core of an anticyclonic eddy induced by the vertical transport of nutrients associated with ageostrophic circulation. These results suggest that the influence of eddies on biogeochemistry is highly variable.
Approximately 80–100 tropical cyclones (typhoons and hurricanes) occur annually worldwide (Frank and Young, 2007), and 31% of which develop in the northwest Pacific (NWP), appointing it the most active basin for the formation (Ramsay, 2017). The tropical cyclones formed in the NWP (hereafter typhoons) can trigger heavy rainfall on land and dynamical responses in the ocean; Shen et al. (2021), for example, reported that an eddy in the open ocean was triggered by inertial-Ekman pumping under the forcing of a typhoon. Following the transit of a tropical cyclone, seawater temperature restoration takes about 30–60 days for the surface layer and > 6 months for the subsurface layer (Dare and McBride, 2011; Mei and Pasquero, 2013). The supply of nutrients from the deep ocean to the euphotic zone by tropical cyclone-induced vertical mixing has been widely observed, and this process is considered the main cause of enhanced PP associated with typhoons (Babin et al., 2004; Zheng and Tang, 2007; Wang and Xiu, 2022). Lin et al. (2003) showed a 20%–30% increase in PP in the South China Sea after the transit of a Category 2 typhoon. Chen et al. (2013) reported a 40% increase in particulate organic carbon flux after a Category 2 typhoon passed through the northwest Pacific (NWP) region. Additionally, the tropical cyclone can affect the biogeochemistry in the water column, such as particle decomposition with oxygen consumption (Zhou et al., 2021; Lu et al., 2022), development of hypoxia (Meng et al., 2022), and changing of phytoplankton size structure (Ma et al., 2021).
The NWP region is characterized by a high occurrence of eddies. Yang et al. (2013) observed ~50,000 eddies in the NWP region (12–28°N, 122–170°E) from October 1992 to February 2012 based on satellite altimeter data. The modal radius and mean lifespan of eddies in this region are ~130 km and ~10 weeks, respectively, with the westward flow at a speed of 6 km d−1. The tropical NWP also generates the highest number of typhoons. Webster et al. (2005) reported that ~45% of typhoons greater than Category 4 between 1975 and 2004 occurred in the NWP region, with an increasing trend after 1980. However, the effects of eddies and typhoons on ocean biogeochemistry in this region are poorly understood.
In this study, we measured the distribution of Chl-a, nutrients, dissolved organic carbon (DOC), fluorescent dissolved organic matter (FDOM), dissolved oxygen (DO), and gross primary production (GPP) in the NWP to examine the influence of eddies on ocean biogeochemistry and biological production. We also examined how the biogeochemistry of the upper layer of the ocean responded to a typhoon that passed through the vicinity of the study area during one of our field surveys.
Materials and Methods
Water sampling in the areas affected by eddies and typhoons
Two expeditions were carried out in the NWP (16–22°N, 126–132°E) aboard the R/V Isabu from 30 August to 11 September 2019 and from 8 to 25 September 2020 (Figure 1). Sea surface height anomaly (SSHA) and geostrophic surface current data which were obtained from the Copernicus Marine Environment Monitoring Service (http://marine.copernicus.eu) were used to identify locations of eddies in the study area (Figure 1). The boundaries and depths of the eddies were confirmed by examining the sections of temperature, salinity, and density (Figures 2, 3). Water samples were collected in two anticyclonic eddies (Eddy 1 at 19°N, 130°E in 2019 and Eddy 2 at 20°N, 128°E in 2020) and a cyclonic eddy in 2020 (Eddy 3 at 17°N, 127°E). Hydrographic data, including temperature, salinity, and fluorescence, were measured using a CTD profiler (SBE911-plus, Sea-Bird Electronics Inc., WA, USA). Seawater samples were collected using 10-L Niskin bottles mounted on a CTD-Rosette sampler.
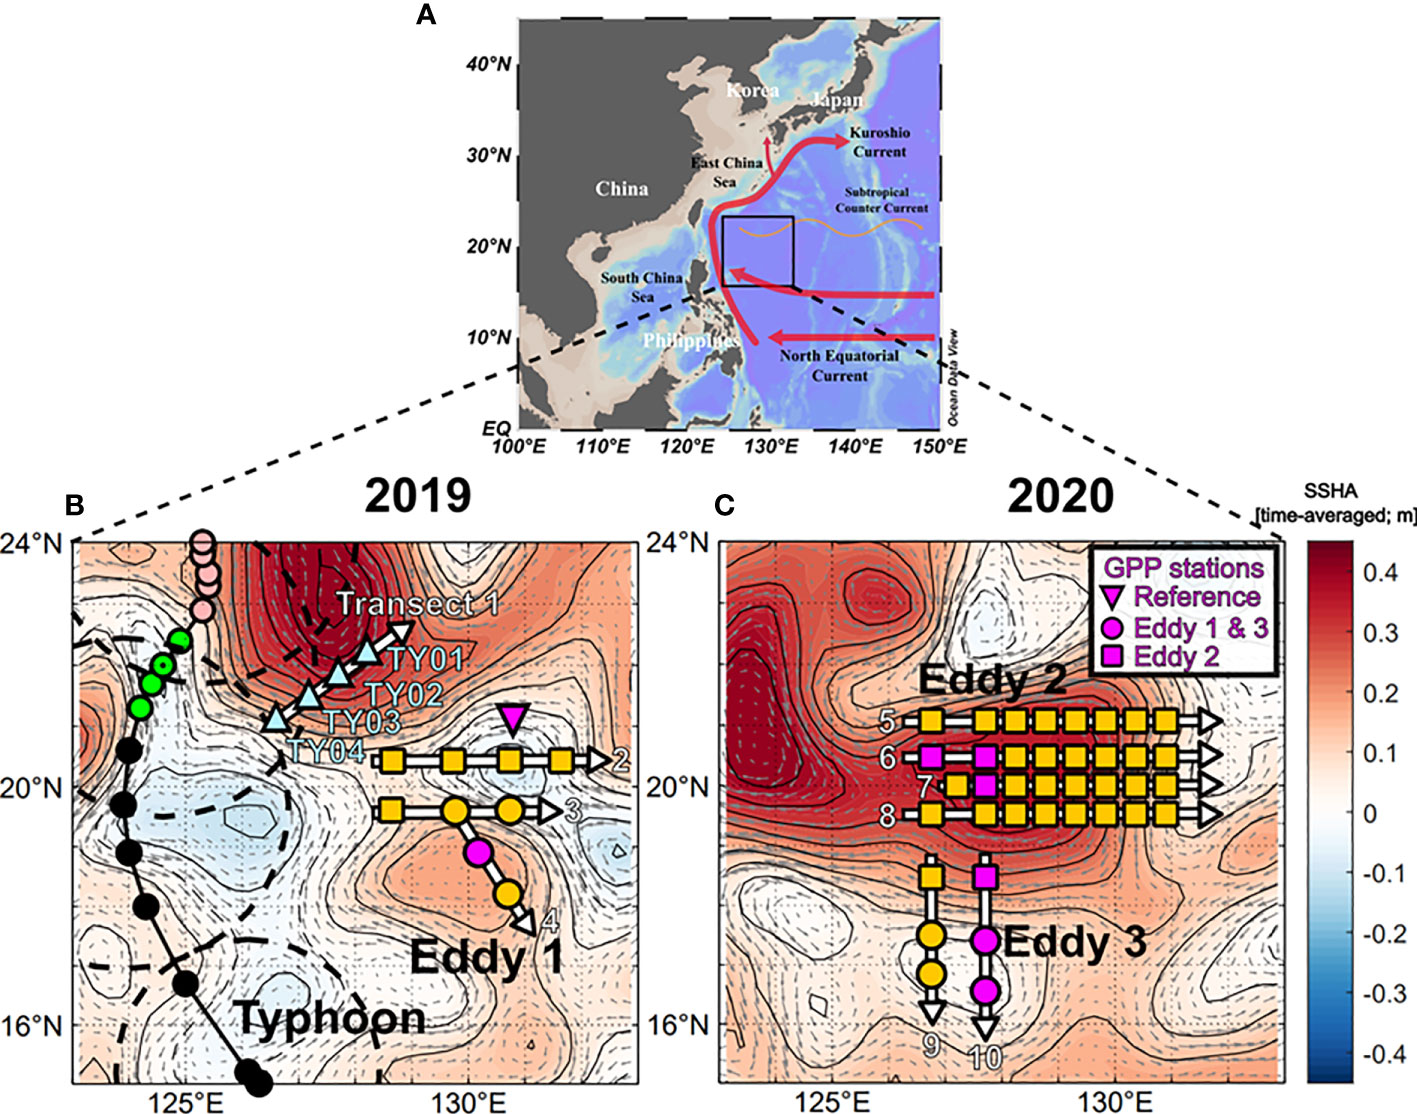
Figure 1 Maps showing the surface current systems and sampling regions in the tropical NWP. (A) Map showing the study region, major landmasses, and dominant current systems. (B) Map for 2019 showing the eddy sites (yellow circles), and study sites in the reference areas for measuring biogeochemical parameters (yellow squares). Stations recording information before and after the transit of the typhoon are denoted as triangles (TY01 to TY04). The typhoon track and category are indicated by different colors (black: tropical storm; green: Category 1; pink: Category 2). Dashed circles indicate the typhoon boundary where the wind speed was 30 knots. (C) Map for 2020, where the study sites for eddies 2 and 3 are denoted as squares and circles, respectively. The background color shows the sea surface height anomaly (SSHA) averaged over the sampling period. Gray arrows indicate the geostrophic current.
During the 2019 cruise, typhoon Lingling developed at 15.2°N, 126.1°E at 00:00 on 2 September (all times are in UTC) and intensified into a Category 1 storm (wind speed > 33 m s−1) at 21.3°N, 124.2°E (12:00 on 3 September) and a Category 2 storm (wind speed > 44 m s−1) at 22.9°N, 125.3°E (12:00 on 4 September) nearby our study area (Figure 1B). The migration speeds of Lingling in the vicinity of the study area were < 5 m s–1, lower than those of typical typhoons in the NWP (5–7 m s–1; Kossin, 2018). Four stations (TY01, TY02, TY03, and TY04) were revisited two days (11:00 on 7 September) after the typhoon’s transit. Stations TY03 and TY04 were within the radius of the strong winds (> 15 m s−1) of the typhoon. Hydrographic data in the upper 100 m layer were measured using the CTD profiler. Seawater sampling was also conducted in the upper 100 m layer at six depths. The typhoon track data were obtained from Japan’s Regional Specialized Meteorological Center (RSMC; http://www.jma.go.jp). The typhoon’s intensity, according to the Saffir-Simpson Hurricane Wind Scale, was evaluated using 1-min averaged maximum wind speeds from the RSMC (Harper et al., 2010).
Analyses of biogeochemical parameters
Seawater samples for Chl-a, nutrient, DOC, and FDOM analyses were filtered using pre-combusted (4 h, 450°C) glass fiber filters (GF/F, Whatman, 0.7 μm pore size). The filter pads for Chl-a analysis were stored in a deep freezer at −70°C and the filtered samples for nutrient analysis (~10 mL) were stored in pre-cleaned polyethylene bottles at −20°C. The filtered samples (~20 mL) for DOC measurements were immediately acidified with 6 N HCl to a pH of ~2 in pre-combusted (4 h, 450°C) glass ampoules. The FDOM samples (~40 mL) were stored in pre-combusted (4 h, 450°C) amber vials without any treatment and kept in a refrigerator at 4°C.
The Chl-a concentration was determined using a fluorescence sensor (WET Labs ECO-AFL/FL) calibrated with high-performance liquid chromatography (HPLC) analyses of Chl-a extracted from the filter samples (Zapata et al., 2000). The linear correlation was used to convert the fluorescence to Chl-a concentration (n = 88, r2 = 0.41). Concentrations of dissolved inorganic nitrogen (NO3-+NO2-+NH4+), dissolved inorganic phosphorous (), and dissolved silicate (DSi: Si(OH)4) were measured using an auto nutrient analyzer (New QuAAtro39, SEAL Analytical). The procedural blank was < 2% of the average concentration of the samples. The measurement uncertainties for the reference material (Batch CA from KANSO Technos, Japan) were < 3% for and DIP. DOC concentrations were determined via a high-temperature combustion method using a total organic carbon analyzer (TOC-L, Shimadzu, Japan) with < 3% accuracy (Benner and Strom, 1993). Accuracy was determined by cross-checking with the reference material (deep seawater reference, 40–44 μM provided by University of Miami). The detection limits of , , , and DOC were 0.05, 0.04, 0.2, and 5 μmol L−1, respectively.
FDOM intensity was determined using a fluorescence spectrometer (Aqualog, Horiba, USA), with emission and excitation wavelengths in the ranges of 240–700 nm at 3 nm intervals and 250–500 nm at 5 nm intervals, respectively. Parallel factor analysis (PARAFAC) was performed using the Solo software, following Stedmon and Bro (2008). Raman Unit (R.U.) values were calculated based on the intensity of FDOM normalized by the Raman peak area at 350 nm of ultrapure water (Lawaetz and Stedmon, 2009). The PARAFAC model identified terrestrial humic-like (C peak), marine humic-like (M peak), and protein-like (T peak) components (Coble, 1996; Coble et al., 1998).
GPP was measured according to the 18O in vitro method adopted from Ferrón et al. (2016). Briefly, water samples used for the incubation were collected in Niskin bottles at six light depths (100%, 50%, 30%, 12%, 5%, and 1% of photosynthetically active radiation; PAR) and introduced into acid-cleaned borosilicate glass bottles with ground-glass stoppers. The glass bottles were spiked with before stopping. Each incubation bottle was inserted into a container covered with a screen to mimic the light level of the sampling depth. The incubation was carried out in an on-deck bath, which was supplied with continuously flowing surface water. After 24 hours, incubated samples were sub-sampled into 40 mL serum bottles under a N2 atmosphere. Mercuric chloride solution was added to serum bottles to inhibit biological activity before crimp-sealing. The 18O/16O of DO in seawater was measured using a membrane inlet mass spectrometer (Kana et al., 1994), which consisted of a 2.5-cm-long silicone membrane (Bay Instruments) and a PrismaPlus QMG220 quadrupole mass spectrometer (Pfeiffer). The standard deviations of triplicate measurements of 18O/16O were typicality < 0.5‰. See Ferrón et al. (2016) for further details of the experiment and calculation of GPP.
The temperature and salinity of the surface waters along the cruise tracks were measured with a thermosalinograph (SBE 45, Sea-Bird Scientific). The surface waters were supplied to the laboratory through the clean water intake system positioned at a nominal depth of 7 m. The raw data from the thermosalinograph were calibrated against surface values (< 10 m) collected from CTD downcasts (n = 57, r2 > 0.98). In addition, DO concentrations were measured with an optode (Oxygen Optode 4531, Aanderaa). The raw data were corrected for salinity according to the manufacturer’s manual and for the gain of the optode (Johnson et al., 2015; Lee et al., 2021). The corrected values were within the 1% range of the values determined by amperometric titration (Langdon, 2010) and further corrected using the linear correlation with the titration-determined values (n = 62, r2 > 0.99). This final correction should make any effect of respiration on O2 concentrations in the water intake system negligible (Juranek et al., 2010).
Results
Hydrological characteristics and physicochemical parameters in the upper layer
The depth of the surface mixed layer (SML), which is defined as the depth at which the temperature is 0.5°C less than the sea surface temperature (Price et al., 1986; Kelly and Qiu, 1995), was ~50 m in 2019 (Figure 2). From the bottom of the SML, the water temperature decreased gradually downward up to a depth of 200 m. Salinity increased below the SML up to ~200 m water depth, with a maximum value at 150–200 m. In 2020, the temperature and salinity in the upper 200 m layer were slightly higher than that in 2019 (Figure 3). In the deeper layers (200–500 m), the temperature and salinity decreased gradually with depth without any significant differences between the 2019 and 2020 profiles.
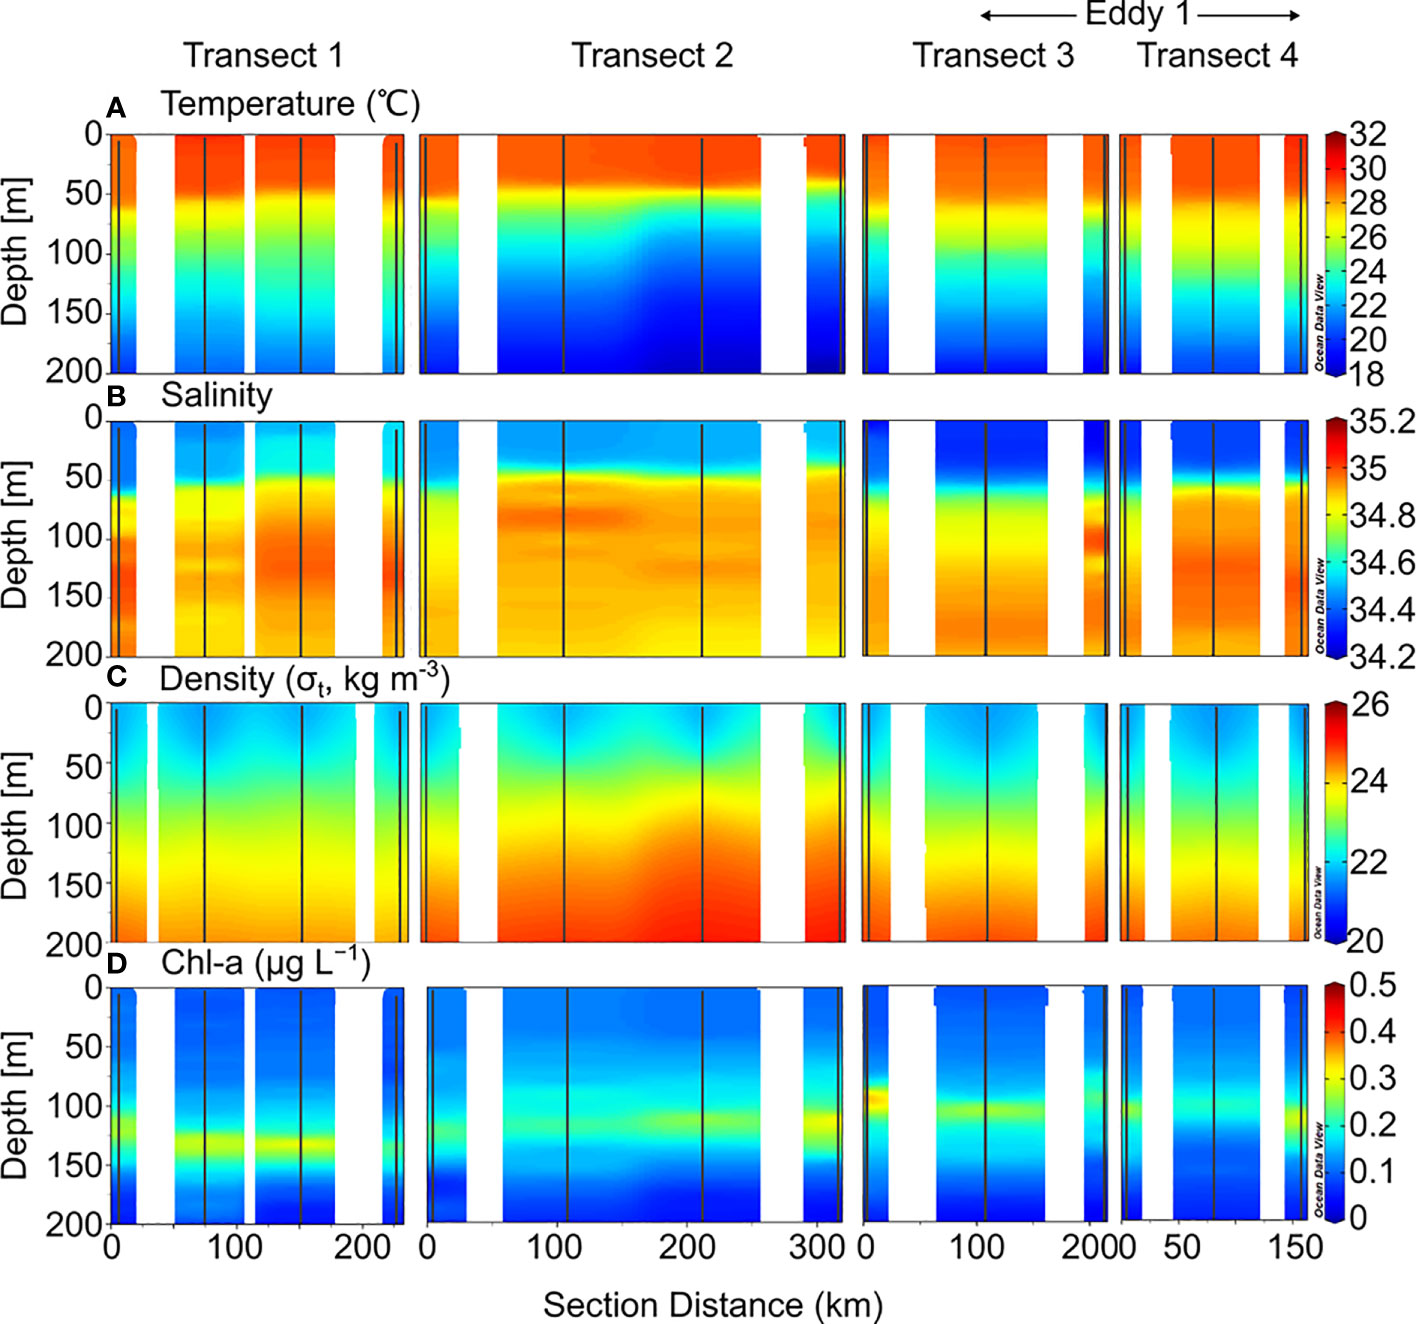
Figure 2 Sectional distributions of (A) temperature, (B) salinity, (C) density, and (D) Chl-a in the upper 200 m layer of the northwest Pacific from August to September 2019.
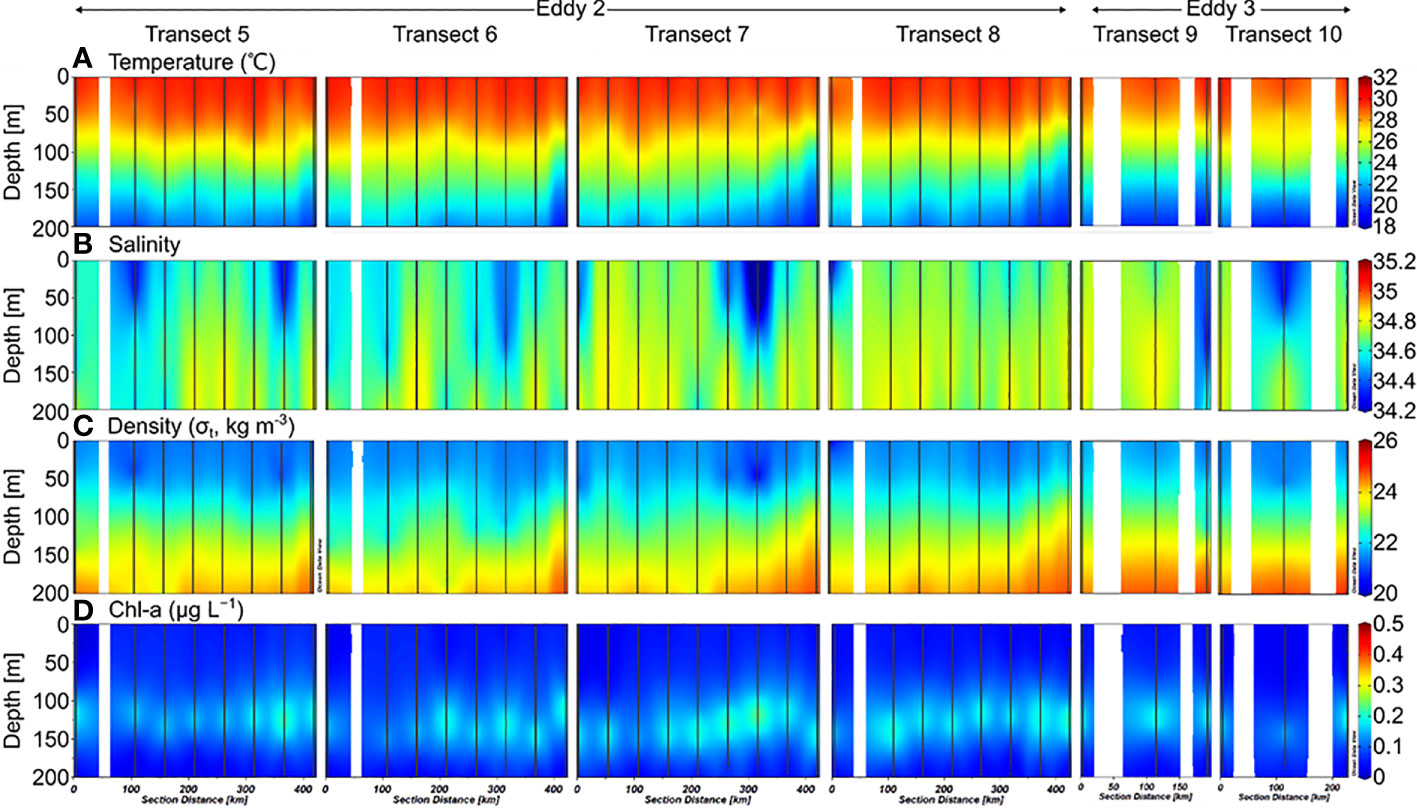
Figure 3 Sectional distributions of (A) temperature, (B) salinity, (C) density, and (D) Chl-a in the upper 200 m layer of the northwest Pacific in September 2020.
The Chl-a concentrations measured in 2019 ranged from 0.01–0.38 μg L−1, with a SCM layer between 100–150 m depth (Figure 2). There were no significant differences between the stations. However, the SCM layer was observed at slightly shallower depths along Transects 3 and 4. The euphotic zone (Ez), defined as the depth at which photosynthetically available radiation (PAR) decreases to 1% of the surface value, ranges from 40–130 m, with an average of 80 ± 30 m. In 2020, Chl-a concentrations ranged from 0.01–0.36 μg L−1, with an SCM layer at 100–150 m depth (Figure 3). The distribution of Chl-a and Ez in 2020 was similar to that in 2019.
Dissolved inorganic nitrogen (DIN, the sum of , , and concentrations) was equivalent to nitrate () concentration because the nitrite () and ammonium () concentrations were below the detection limit for all the samples. In 2019, the nutrient-depleted layer (DIN < 2 μmol L–1, following Reynolds, 2006) was 150 m thick (Figure 4A). Below ~150 m, the DIN increased gradually with depth. The vertical distribution of DSi (Si(OH)4; Figure 5C) and (data not shown) was similar to that of DIN. In 2020, the nutrient distribution in the upper 150 m layer and the thickness of the nutrient-depleted layer were comparable to those observed in 2019 (Figure 4E). Nutrient concentrations increased gradually with depth in the deeper layers (200–500 m), with no significant differences between 2019 and 2020 (Figure 4).
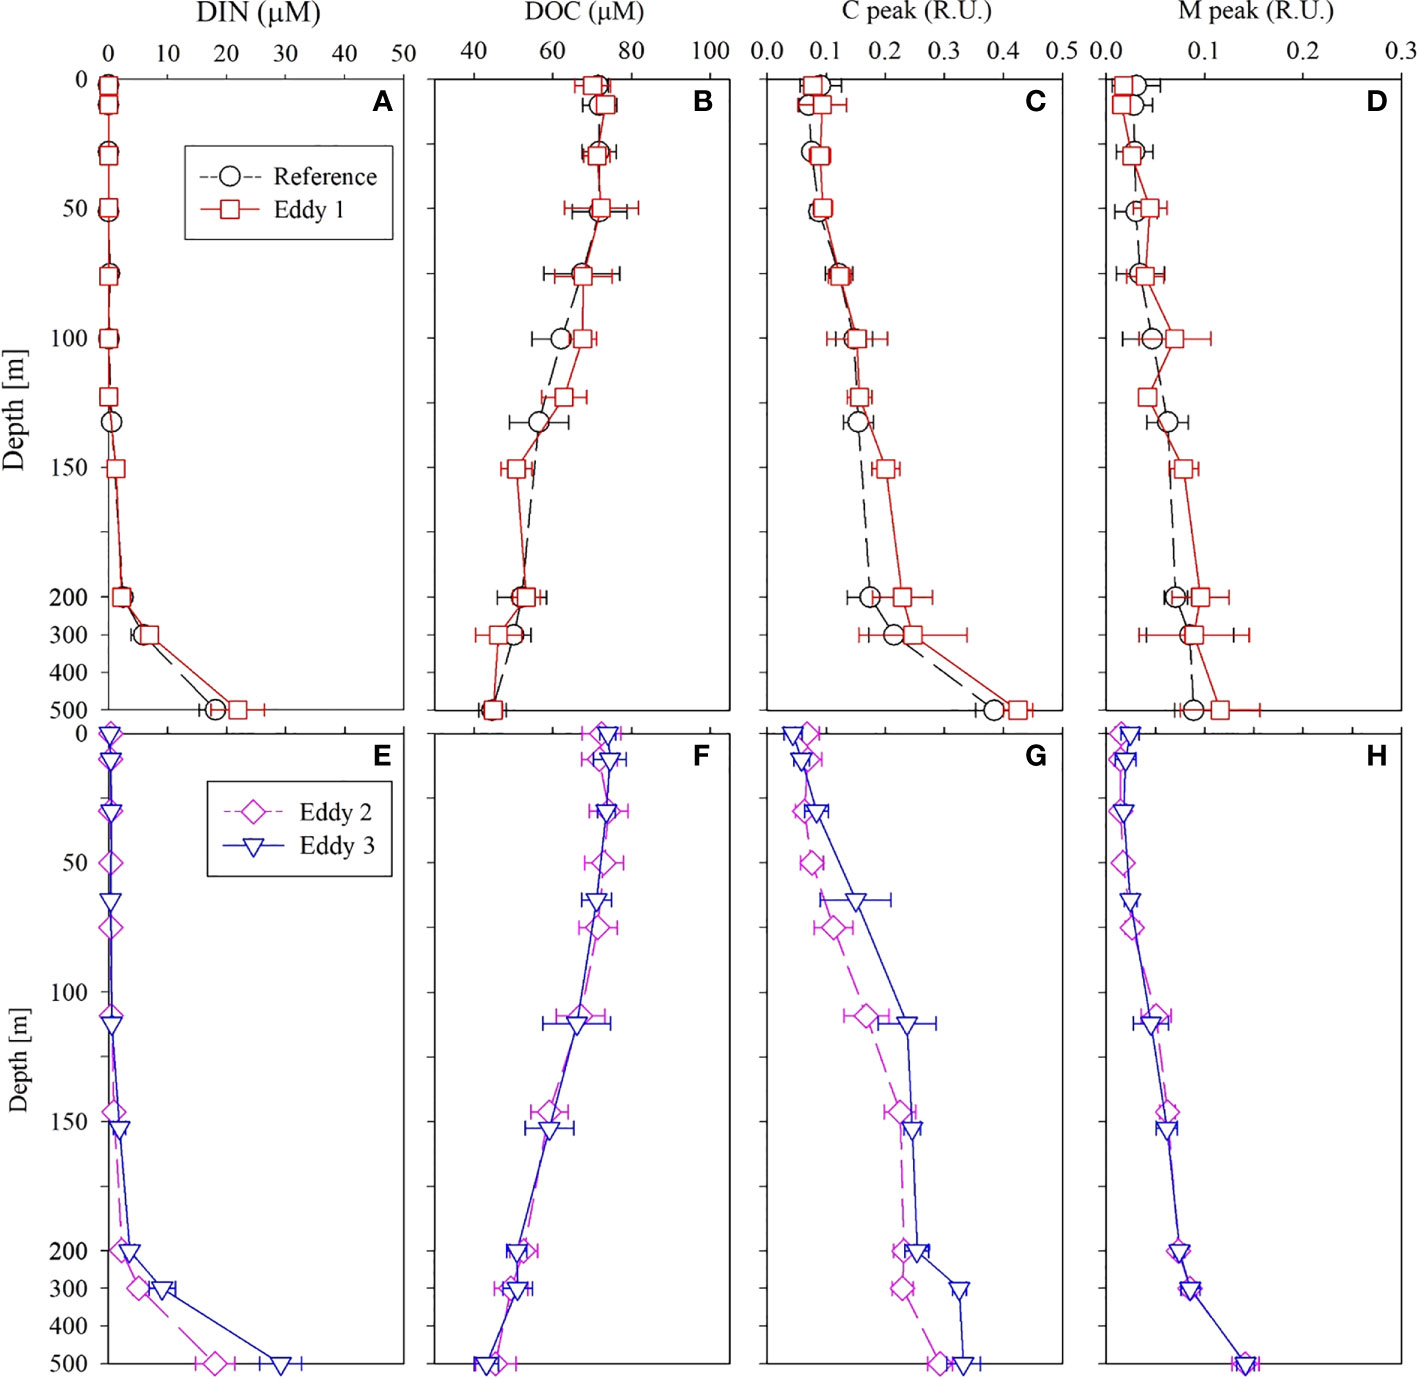
Figure 4 Vertical distributions of (A) DIN, (B) DOC, (C) C peak, and (D) M peak in 2019 and (E) DIN, (F) DOC, (G) C peak, and (H) M peak in 2020 in the upper 500 m layer of the northwest Pacific. The data present as the mean and standard deviations.
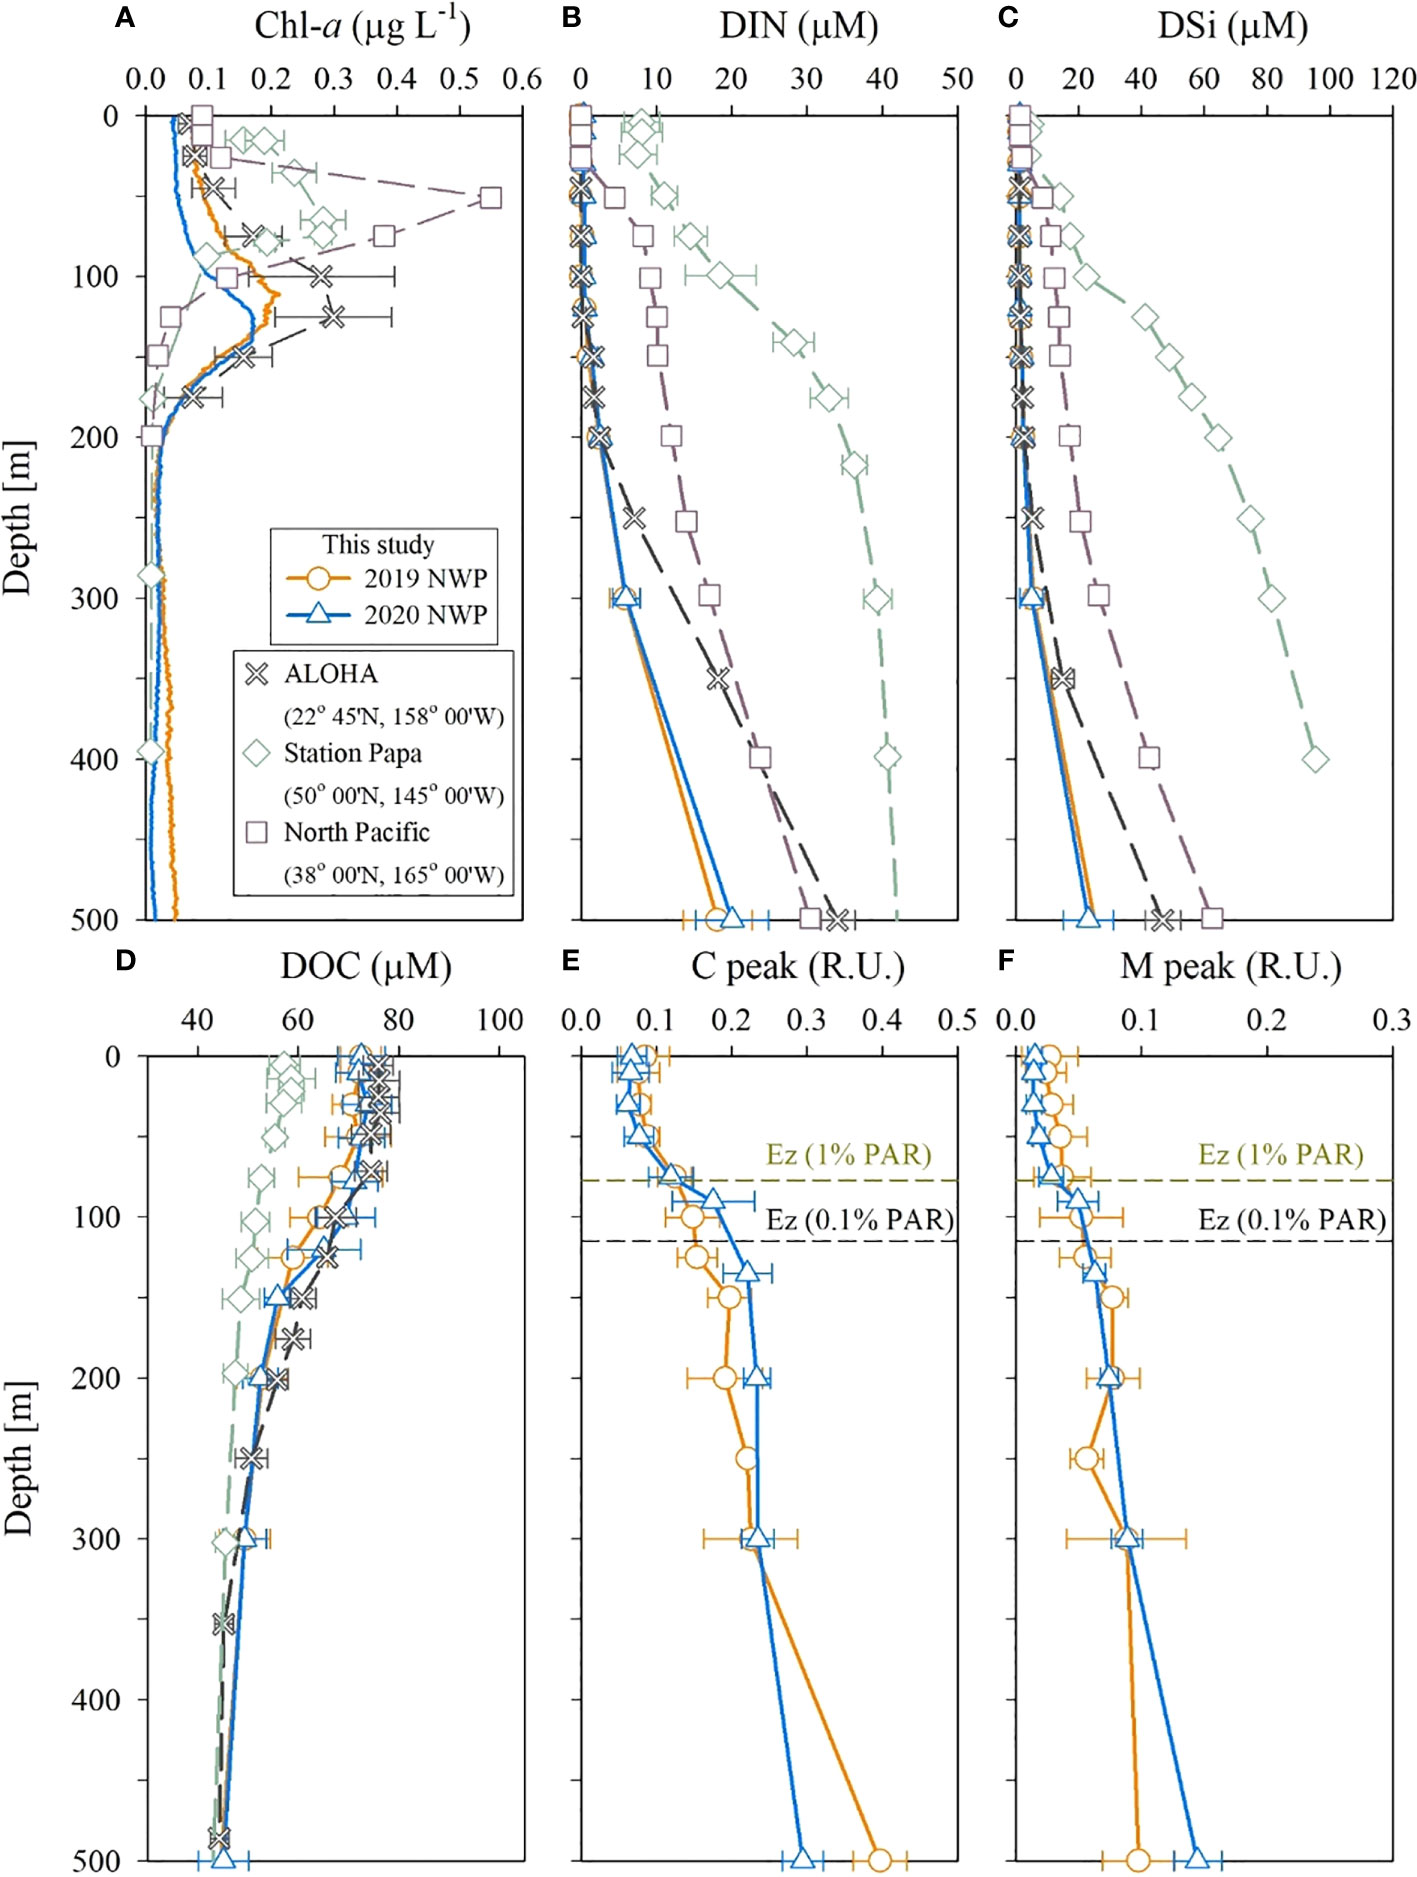
Figure 5 Vertical profiles of (A) Chl-a, (B) DIN, (C) DSi, (D) DOC, (E) C peak, and (F) M peak in the upper 500 m layer in the NWP in September 2019 and 2020. Data are from Buesseler et al. (2020), the Hawaii Times Series, and the Japan Meteorological Agency.
The DOC concentrations in the upper 200 m layer ranged from 42–85 μmol L–1 (Figure 4B) in 2019. The DOC concentration in the SML showed less variation (72 ± 5 μmol L–1, mean ± SD) and decreased gradually with increasing depth below the SML. In 2020, DOC concentrations in the upper 200 m layer ranged from 46–87 μmol L–1 (Figure 4F). Within the deeper layers (200–500 m), DOC concentration decreased gradually with depth to 45 ± 4 μmol L–1. Overall, the DOC distribution in 2019 and 2020 was similar.
The concentrations of the C and M peaks (FDOM humic like; hereafter FDOMH) in the upper 200 m layer were 0.04–0.29 and 0.003–0.13 R.U., respectively, in 2019 (Figure 4). The FDOMH concentration increased gradually with depth through layers deeper than 200 m; their vertical distribution was a mirror image of DOC distribution. In 2020, the concentrations of the C and M peaks in the upper 200 m layer were 0.02–0.35 and 0.002–0.09 R.U., respectively (Figure 4), with a distribution comparable to that observed in 2019. In both years, the FDOMH concentrations in the deeper layer (200–500 m) increased uniformly with depth to a mean value of 0.32 ± 0.05 R.U. for the C peak and 0.13 ± 0.03 R.U. for the M peak at a depth of 500 m (Figure 4). The measured T peak concentrations in both the years were lower than the detection limit in the entire water column.
Distribution of temperature, salinity, and dissolved oxygen in the surface waters along the cruise track
In 2019, surface temperature and salinity ranged from 28.7–29.9°C (29.2 ± 0.2°C, mean ± SD), and 34.0–34.6 psu (mean 34.4 ± 0.1 psu), respectively (Figure 6; Table 1). In 2020, the surface temperature and salinity ranged from 28.8–31.0°C (mean 30.0 ± 0.3°C), and 34.2–34.8 psu (mean 34.5 ± 0.1 psu), respectively (Figure 6; Table 1). The mean temperature in 2020 was ~0.8°C higher than that in 2019. DO concentrations in 2019 ranged from 194–199 μmol kg−1, with a mean of 197 ± 1 μmol kg−1. These values were slightly higher than the saturation concentration of 194 μmol kg−1, calculated using average temperature and salinity values of 29.2°C and 34.4 psu (Garcia and Gordon, 1992), and corresponded to a saturation anomaly of 1.4 ± 0.3%. The saturation anomaly is calculated as ΔO2(%) = ([O2]obs/[O2]sat− 1)×100 ΔO2, where [O2]obs and [O2]sat are the measured and air-saturated concentrations of DO, respectively. In 2020, DO concentrations ranged from 188–219 μmol kg−1, with a mean of 191 ± 1 μmol kg−1. The mean saturation anomaly for DO was 0.1% ± 0.6% and the variability along the cruise track was greater than that in 2019.
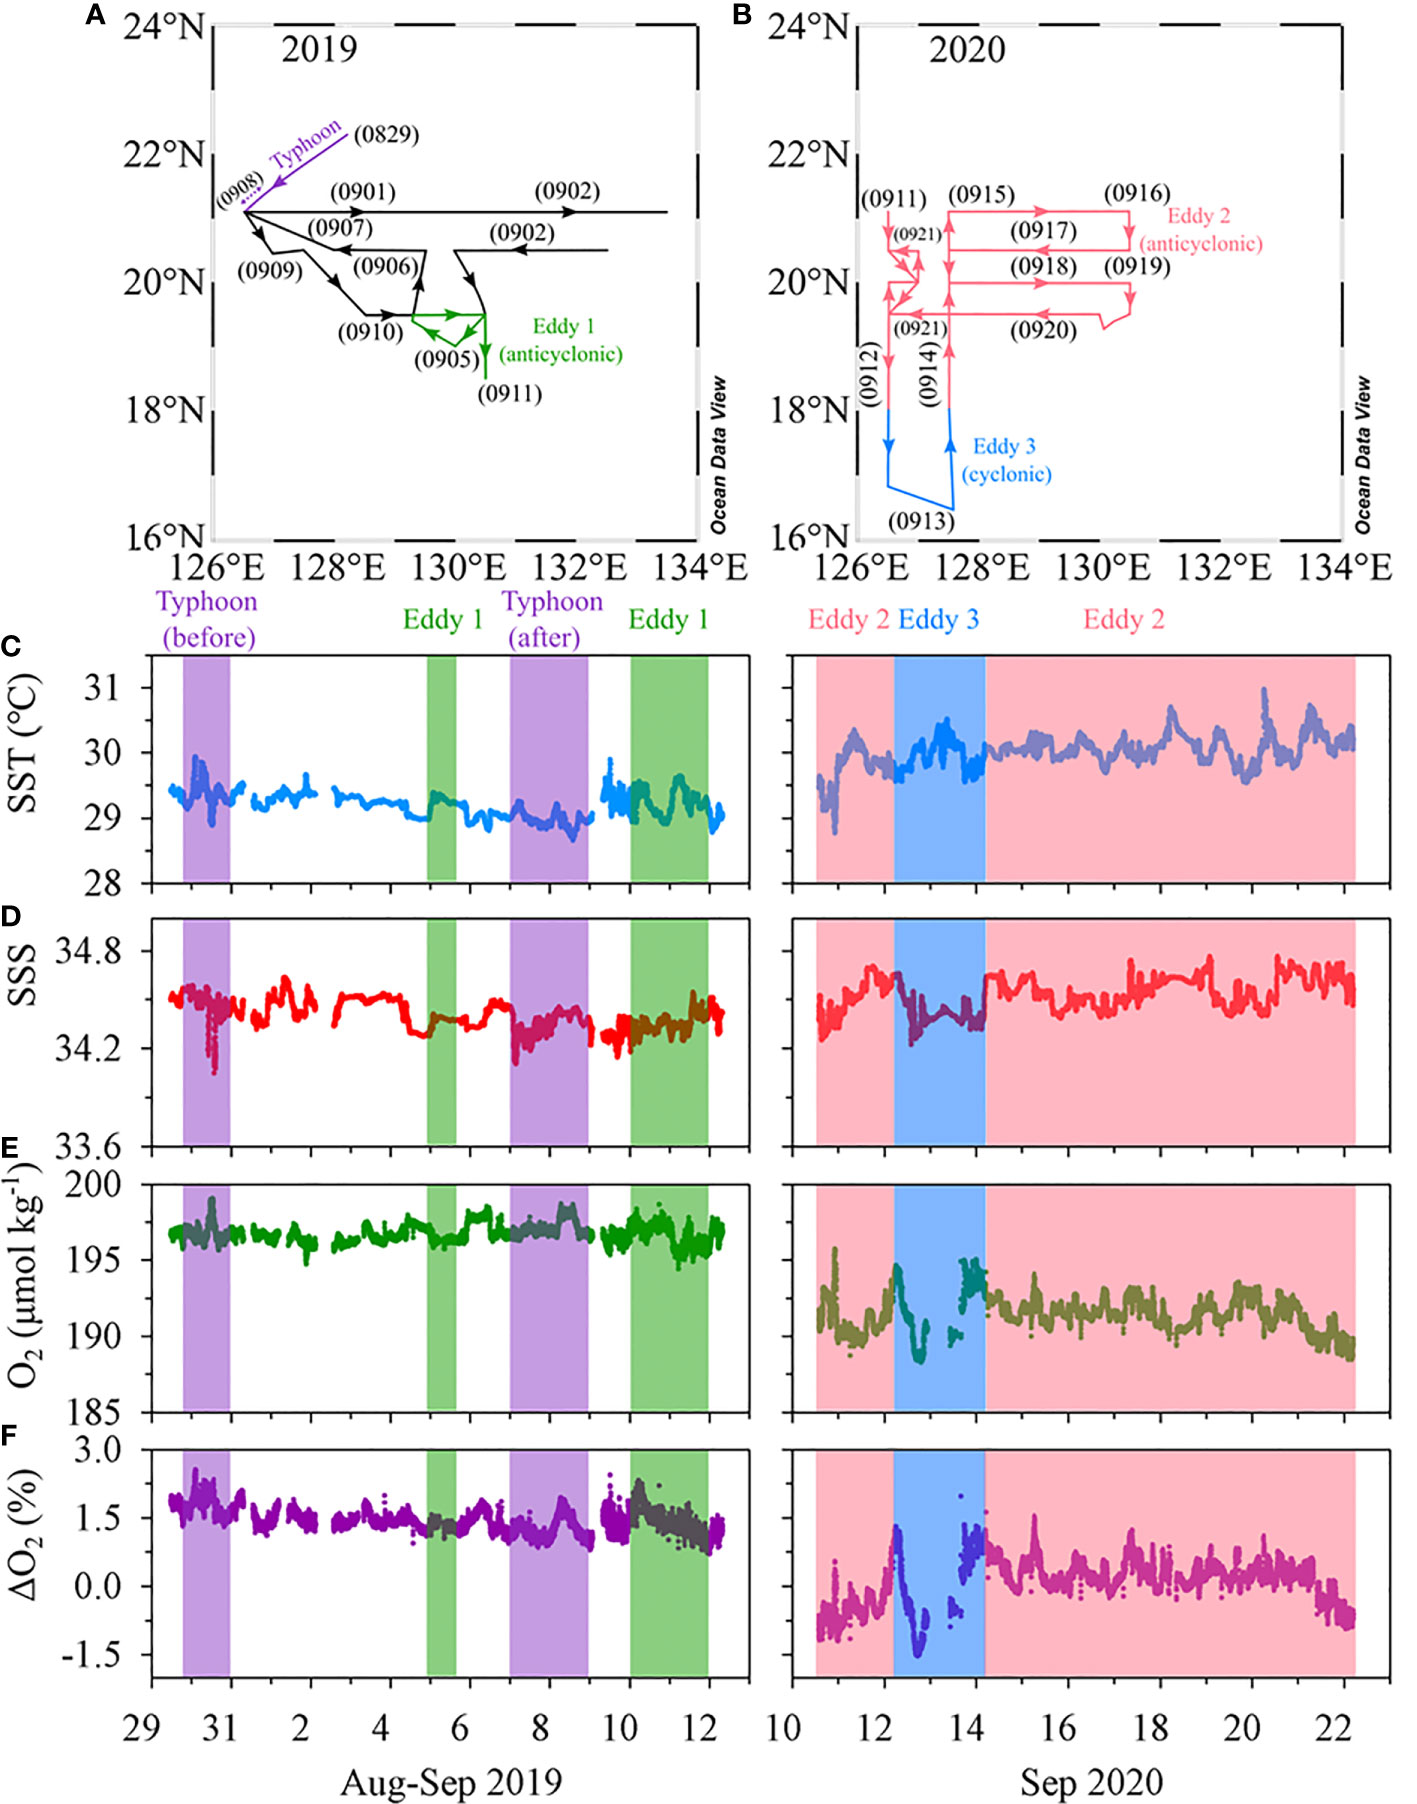
Figure 6 Map showing the cruise tracks in (A) 2019 and (B) 2020. Time series of in situ measurements of (C) temperature, (D) salinity, (E) DO concentrations, and (F) DO saturation anomaly in 2019 (left) and 2020 (right).
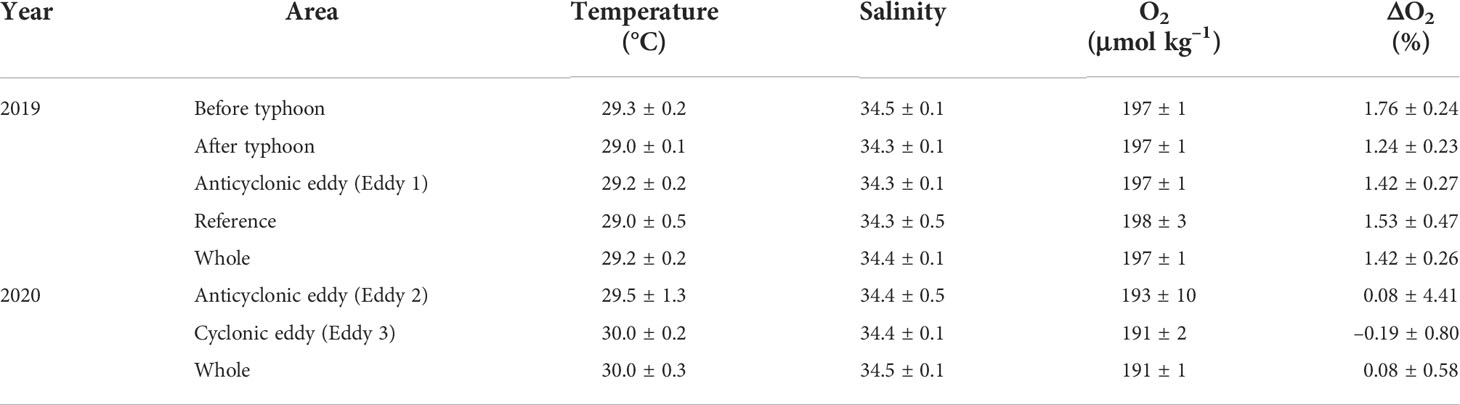
Table 1 Properties of surface waters in the eddies and reference site. The data present as the mean and standard deviations.
Discussion
Extreme oligotrophy of the northwest Pacific
The DIN concentration in the 50–150 m layer of the study region was much lower than that observed in the northeastern subarctic Pacific in August (Station Papa; Signorini et al., 2001) and the central subtropical North Pacific in September (32.6–38.0°N, 165.0°E, Japan Meteorological Agency; JMA; http://www.data.jma.go.jp; Figure 5). Nutrient depletion (< 2 μmol L–1) in our study regions was similar to that observed in the oligotrophic regions, such as Station ALOHA (A Long-term Oligotrophic Habitat Assessment) of the Hawaii Ocean Time-series (https://hahana.soest.hawaii.edu/hot/) in September (Figure 5). However, the DIN concentrations below 200 m depth were lower than those at station ALOHA.
The thick DIN-deficient layer appears to be responsible for the deeper location of the SCM layer at 100–150 m. The SCM layer, similar to DIN concentration distribution, was deeper than that observed at station Papa (75 m; Buesseler et al., 2020) and the central North Pacific (80 m; JMA) (Figure 5). The depth of the SCM layer in the study region was similar to that observed at station ALOHA (100–120 m). A deep SCM layer might be a characteristic of oligotrophic regions. The deeper SCM layer at station ALOHA is attributed to photoacclimation to low light (Fennel and Boss, 2003).
The GPP observed in 2019 and 2020 was in the range of 0.1–0.6 μmol O2 L−1 d−1 in the euphotic layer, except for one higher GPP value at the periphery of the anticyclonic eddy (Eddy 1; 1.0 μmol O2 L−1 d−1; Figure 7). The GPP values (< 0.6 μmol O2 L−1 d−1) were half of those at station ALOHA measured using the same 18O in vitro method (Ferrón et al., 2016), indicating extreme oligotrophy in the study area. The depth-integrated GPP values in the upper 100 m layer were 24 and 15 mmol O2 m−2 d−1 in 2019 and 2020, respectively. These are equivalent to 210 and 130 mg C m−2 d−1, assuming a photosynthetic quotient of 1.4 (Laws, 1991). Given that the typical 18O-GPP/14C-NPP value range is 2.0–2.7 (Marra, 2002; Quay et al., 2010), these values are consistent with the NPP value of 76–80 mg C m−2 d−1 measured using the 13C incubation method in the study region in 2018 (Yun et al., 2020).
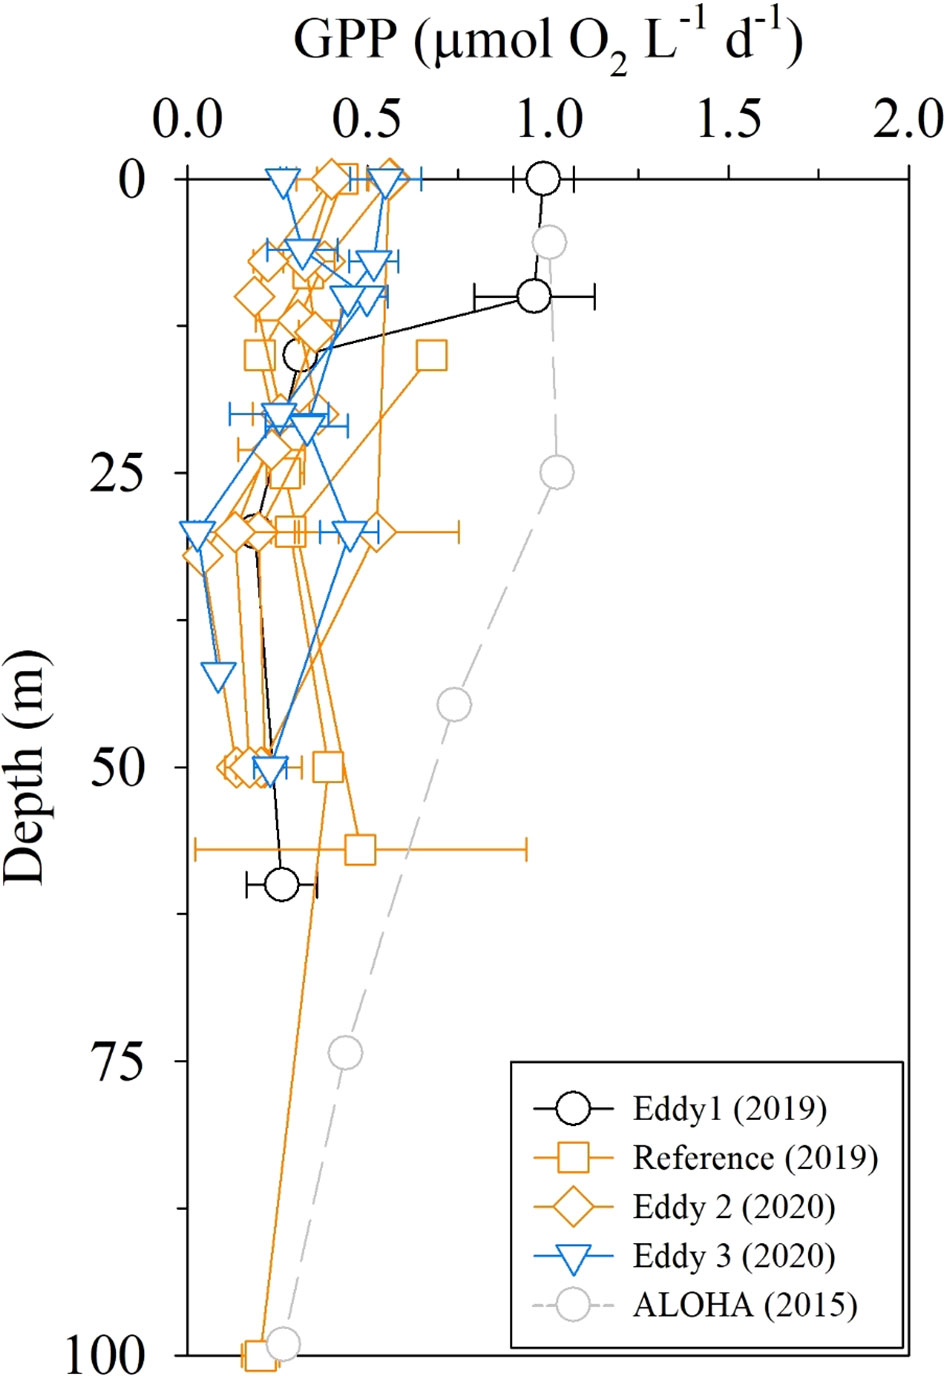
Figure 7 Depth profiles of GPP rates measured using the 18O in vitro method. ALOHA data are from Ferrón et al. (2016).
DOC concentrations in the upper 200 m layer (53–74 μmol L–1) were higher than those at station Papa (48–59 μmol L–1; Siegel et al., 2021) and similar to those at station ALOHA (56–76 μmol L–1; HOT). However, DOC concentrations below the 200 m layer in our study area were comparable to those at these sites (Figure 5). Hansell et al. (2009) suggested that high DOC concentrations in subtropical gyres (the NWP and ALOHA sites) could be due to the accumulation of organic matter facilitated by vertical stratification in the upper layer. Indeed, the vertical stratification of the surface layer at the NWP and ALOHA stations was stronger than that at Station Papa. The T peak of the FDOM indicates the biological production in the euphotic zone and degrades rapidly with depth (Jørgensen et al., 2011). The concentrations of the T peak in 2019 and 2020 were below the detection limits in the study region, indicating insignificant biological production. In summary, the study region was found to be extremely oligotrophic, with a thick nutrient-depleted surface layer, low FDOM concentrations, and a deeper SCM layer.
Effects of eddies on biogeochemistry
The magnitude of SSHA indicates the occurrence of eddies in the study region. The highest magnitude of SSHAs during 2019 and 2020 was 0.20 m for Eddy 1, 0.40 m for Eddy 2, and −0.10 m for Eddy 3 (Figure 1). The SML of the cyclonic eddy (Eddy 3; ~20 m) was much shallower than that of the anticyclonic eddies (Eddies 1 and 2; ~55 m; Figs 2 and 3).
Continuous underway measurements of temperature, salinity, and DO concentration in the anticyclonic or cyclonic eddies were largely indistinguishable from those in the adjacent areas (Table 1). One exception was a slight decrease in DO concentration (~5 μmol kg–1) in the cyclonic eddy around 12 – 13 September 2020 (Figures 6E, F). This decrease is in contrast with previous studies reporting that DO concentrations in the cyclonic eddies were higher than in the outer areas of the cyclonic eddies (Sukigara et al., 2014; Jayalakshmi et al., 2015). The studies ascribed the increase in DO concentration to upward nutrient supply resulting in enhanced biological production. The decrease in DO concentration in our observations may be explained by the decomposition of organic matter. The difference in apparent oxygen utilization (AOU) between –1.9 to 2.7 μmol kg–1 for the surface layers of the outside and inside of the cyclonic eddy should result in 0.48 μmol L–1 higher DIN inside of the cyclonic eddy, assuming O2/N ratio of 9.5 (Anderson, 1995; Barone et al., 2022). Given virtually no difference in the DIN concentrations between inside and outside of the eddy (< 0.1 umol L–1), while the decomposition of organic matter is an important process responsible for the significant change of DO concentration in the coastal area with large amounts of organic matter (Lu et al., 2022), the process within the eddy was very limited and not likely the main cause of the decrease in DO concentration. Considering similarly low values observed on September 10 and 22, 2020 in the anticyclonic eddy, it is difficult to ascribe the small difference in DO concentration to the eddy.
There were no discernible differences between the distributions of Chl-a, DIN, DOC, and FDOMH concentrations in the upper layers of anticyclonic eddies and the reference sites (Figure 4). Similarly, there were no significant differences in biogeochemical parameters between the cyclonic eddy and the reference sites (Figure 4). The GPP results also indicated indistinguishable changes in PP between the eddy regions and the reference sites (Figure 7). These observations imply that the upward/downward displacement of the thermocline did not have any significant impact on the biogeochemistry of the surface layer, presumably because of the thickness of the nutrient-depleted layer (~150 m).
Our observations differ from previous studies demonstrating pronounced increases in biological production. For example, Gao et al. (2017) observed in situ phytoplankton blooms in a cyclonic eddy in the NWP (18–20°N, 135–140°E). Despite a similar degree of nutrient depletion in our study region, the cyclonic eddy lifted cold water and the SCM layers to shallower layers, resulting in an increase in PP. The pronounced effects may be attributed to larger vertical displacement resulting from larger SSHA of the eddy; the SSHA magnitude of the eddy (−0.50 m) is much larger than that of Eddy 3 (−0.10 m). Chow et al. (2017) observed 2,000 km long phytoplankton blooms lasting over one month in the subtropical gyre of the North Pacific (130–180°E centered at 22°N). These blooms were attributed to a northward shift of the North Equatorial Current and horizontal spreading of nutrients by eddy activity. These observations suggest that in many subtropical areas topped with a thick nutrient-depleted layer, eddies have little influence on biogeochemistry unless they are exceptionally strong to lift the subsurface to the nutrient-depleted surface layers or fed with nutrients from external sources such as the North Equatorial Current.
Effects of typhoons on biogeochemistry
The vertical distributions of temperature, salinity, and DO concentration did not differ significantly among the four stations (TY01, TY02, TY03, and TY04; Figure 8) before the typhoon transit in 2019. After the passage of the typhoon, salinity in the surface layer decreased by ~0.1 psu at stations TY01, TY02, and TY03. Temperature and DO concentration in the SML decreased by ~0.5°C and ~13 μmol kg−1 at these stations, respectively. The SML deepened from 40 to ~60 m based on the vertical distributions of temperature, salinity, and DO concentration (Figure 8). The continuous underway observations at higher spatial resolution also revealed a similar temperature decrease of 0.4°C along Transect 1 after the typhoon had passed (Figure 6). This was accompanied by a subtle drop in ΔO2 of ~0.5%. The observed cooling and freshening that accompanied the increase in the SML depth could be due to typhoon-induced vertical mixing and precipitation. Similar surface cooling by Typhoon Lingling were also observed by wave-glider, satellite, and reanalysis data (Qiu et al., 2021; Son et al., 2022). Specifically, Qiu et al. (2021) observed that the maximum temperature decrease was ~0.6°C by wave-glider (18.2°N, 124.8°E), which was positioned close to the transit of the typhoon. Son et al. (2022) reported that these surface cooling persisted approximately two weeks based on the results from Medium-Range Weather Forecasts Ocean Reanalysis System 5.
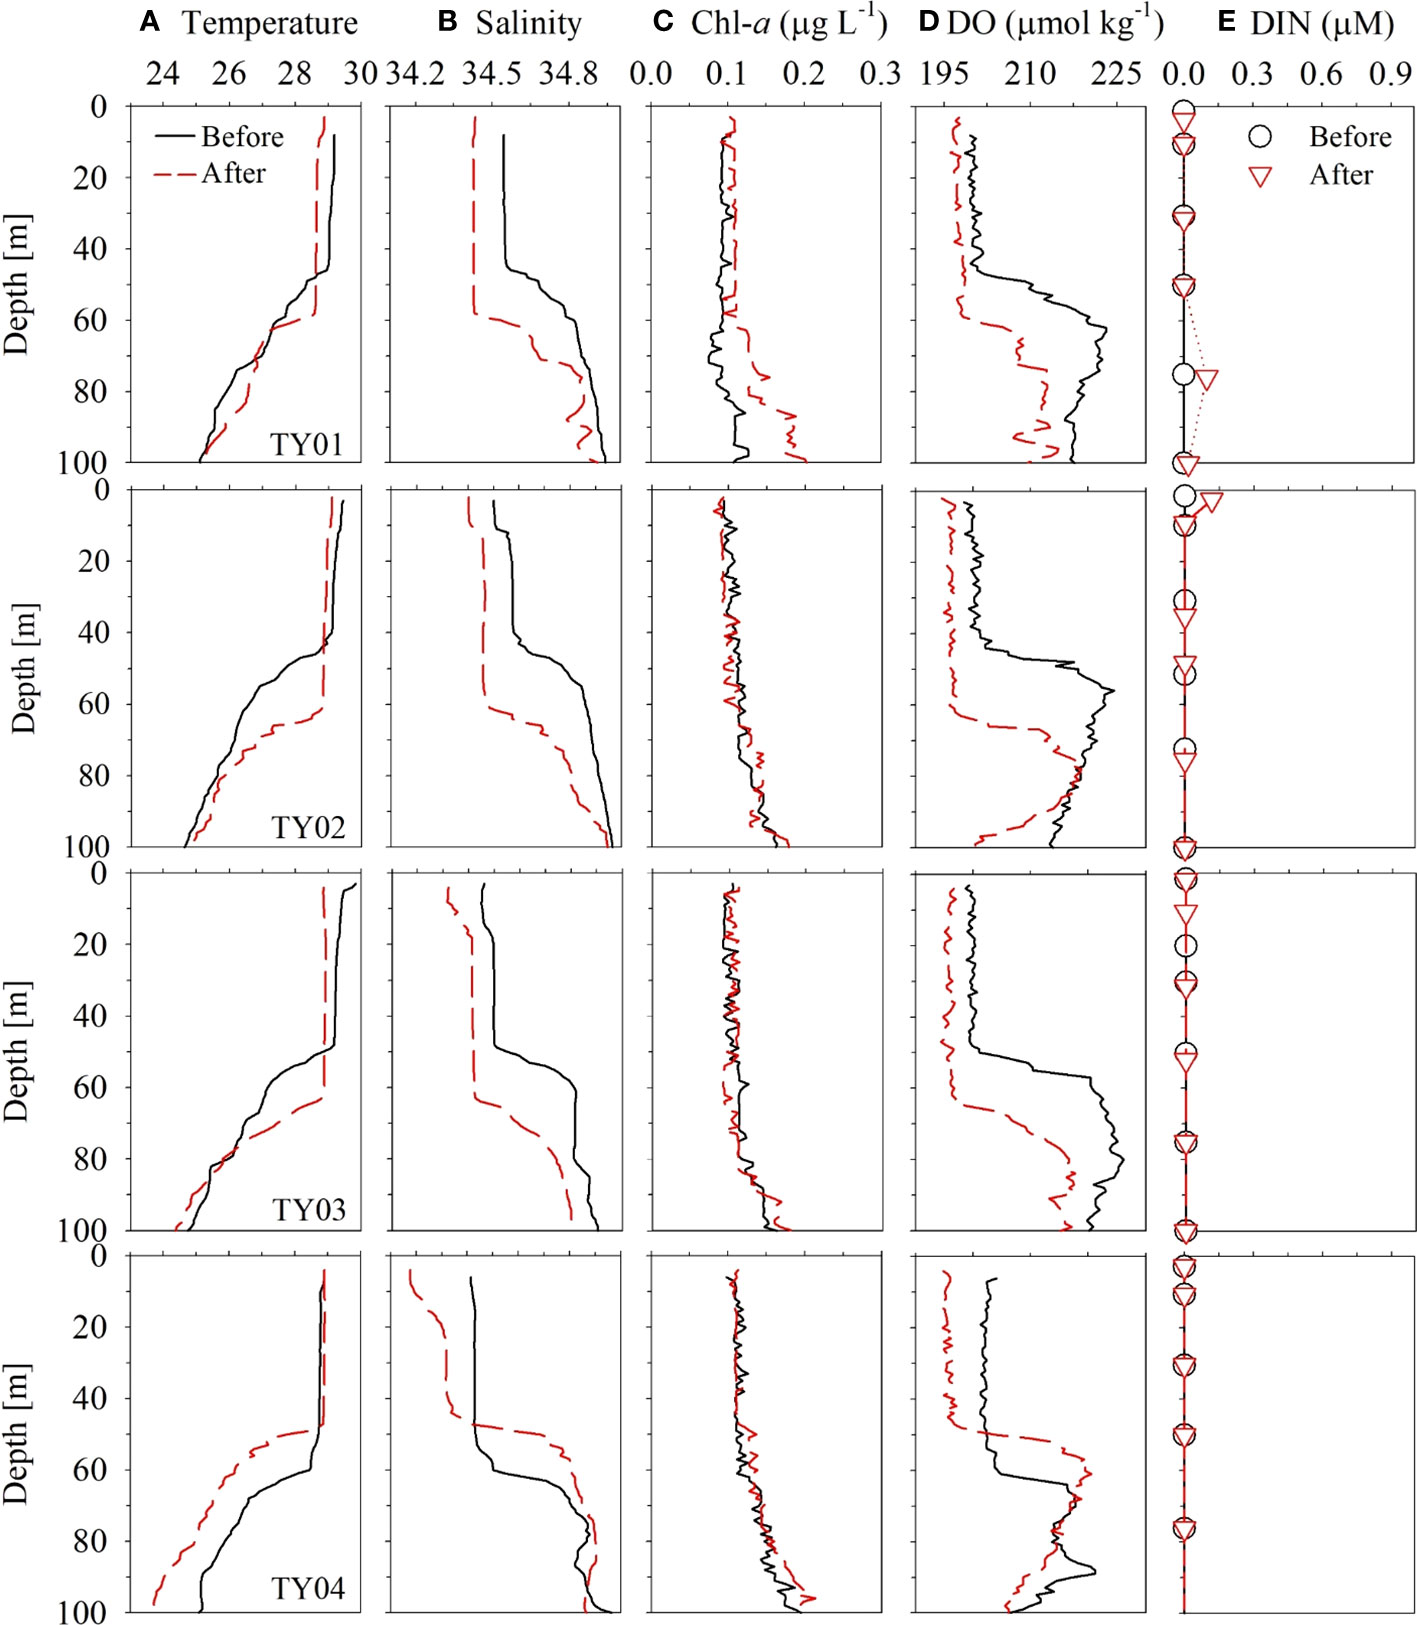
Figure 8 Vertical profiles of (A) temperature, (B) salinity, (C) Chl-a, (D) DO, and (E) DIN in the typhoon region for stations TY01, TY02, TY03, and TY04 in September 2019. Black solid and red dashed lines denote conditions before and after the passing of the typhoon, respectively.
The DO concentrations and saturation anomalies in the upper layer decreased slightly (~8 μmol kg–1 and several percent, respectively, for the surface) after the typhoon passage (Figure 8D). The depths of the subsurface maxima of saturation anomalies deepened from 60 m to 80 m and the magnitudes decreased from 10% to ~3% after the passing (Figure S2). This change of the saturation anomalies can be explained by entrainment of subsurface water with excess O2 and enhanced air-sea gas exchange during the passage of the typhoon. Under the condition of 14 m s–1 wind speed (Figure S3), the saturation anomalies in a 60 m-thick mixed layer should become less <0.5% after 2 days from an unlike high initial saturation anomaly of 10% (Pilson, 2013). For the calculation of gas transfer velocity, we used the parameterization of Wanninkhof (1992) and assumed temperature and salinity of 29°C and 34.5 psu, respectively. The newly developed subsurface maxima may be ascribed to the adaptation of phytoplankton community to the deepened mixed layer depth and nutricline (Cullen, 2015). Contrary to some of the previous studies reporting marked decrease in DO concentrations due to organic matter decomposition after typhoons (Xu et al., 2019; Lu et al., 2022), the AOU decrease (~5 μmol kg–1 at surface; Figure S2) and no increase in DIN in the study area indicate minimal effect of organic matter either brought up from subsurface or produced in the surface layer.
In contrast to the other stations, salinity dropped by ~0.2 psu at TY04 without an accompanying temperature drop in the surface layer (Figure 8). Shoaling of the SML and absence of cooling contradict the assumption that typhoon-induced vertical mixing is the probable cause of freshening. Ocean reanalysis data revealed that freshening might result from the inflow of external water masses into the edge of the anticyclonic eddy (Figure S1, the data are from Copernicus; http://marine.copernicus.eu). Based on these results, we did not consider TY04 to be a typhoon-influenced area despite it being the closest to the typhoon’s path.
The changes in temperature and salinity before and after the transit of the typhoon indicated that typhoon-induced vertical mixing was confined to a depth of 60–70 m (Figures 8A, B). The vertical distributions of Chl-a and nutrients did not exhibit clear differences before and after the typhoon (Figures 8C, E). Moreover, the time-series of Chl-a concentrations based on the satellite data (Remote Sensing Systems, level 4, version 5.0) did not reveal any significant change (only ~0.05 μg L–1 increase) after the passing of the typhoon (Figure S4). These results imply that water column mixing up to 60 m does not cause a significant upward supply of nutrients in this oligotrophic ocean.
These observations are consistent with those of Lin (2012) using satellite data and numerical experiments. Lin (2012) demonstrated that PP only increases in the NWP region (15–25°N, 127–180°E) when intense typhoons (Categories 4 and 5) induce a temperature drop of > 2.5°C and physical mixing reaches depths of ~180 m with slow migration speed (1.7–3.6 m s−1). Lin (2012) argued that an anticyclonic eddy can act as an insulator to restrain the entrainment of cold water to the surface layer even under a Category 5 typhoon. Although the migration speed was sufficiently slow to induce the vertical mixing by typhoon, the weakness of Typhoon Lingling (Category 2) and the presence of an anticyclonic eddy (Transect 1) may explain the shallow vertical mixing of ~60 m and insignificant influence of the typhoon on PP along its passage. Given that a large portion of the NWP region is covered with a nutrient-depleted layer (Figure S5; data from JMA), our results imply that the impact of typhoon-induced mixing in this oligotrophic ocean may not be as significant as previously thought.
Summary and conclusions
We investigated the biogeochemical parameters of the eddies in the oligotrophic NWP. We observed isopycnal displacement in the mesoscale eddies compared to the adjacent sites. However, the distribution of Chl-a, nutrients, DOC, FDOM, and GPP did not exhibit discernible differences across anticyclonic and cyclonic eddies or between the reference sites. Our results indicate that in this oligotrophic ocean, where the nutrient-depleted layer is very deep (~150 m), the upward advection associated with the cyclonic eddy has an insufficient impact on PP. The typhoon-induced disturbance (up to 70 m depth) after the passage of a Category 2 typhoon also appeared to cause no clear changes in Chl-a concentration or other biogeochemical parameters in the upper layer. Typhoon-induced mixing was confined to the upper 60 m of the water column, which was shallower than both the nitracline and SCM layers. A large portion of the oligotrophic NWP is topped with a thick nutrient-depleted layer and, therefore, may not experience significant changes in biogeochemistry due to eddies and typhoons.
Data availability statement
The raw data supporting the conclusions of this article will be made available by the authors, without undue reservation.
Author contributions
JS, GK, JH, and DH contributed to the conceptualization of the study. JS, IL, JP, and TN performed field sampling and analyses. J-HP and SK were involved in the data interpretation for physical structure of eddies and typhoons. JH, GK, JS, and DH were involved in the data interpretation and writing of the manuscript. All authors contributed to the article and approved the submitted version.
Funding
This research was funded by the Korea Institute of Ocean Science and Technology through a project to promote the cooperative use of the research vessel (PE99884).
Acknowledgments
We thank the captain and the crew of the R/V Isabu for their help at sea and all cruise participants for their help with sampling.
Conflict of interest
The authors declare that the research was conducted in the absence of any commercial or financial relationships that could be construed as a potential conflict of interest.
Publisher’s note
All claims expressed in this article are solely those of the authors and do not necessarily represent those of their affiliated organizations, or those of the publisher, the editors and the reviewers. Any product that may be evaluated in this article, or claim that may be made by its manufacturer, is not guaranteed or endorsed by the publisher.
Supplementary material
The Supplementary Material for this article can be found online at: https://www.frontiersin.org/articles/10.3389/fmars.2022.983748/full#supplementary-material
References
Anderson L. A. (1995). On the hydrogen and oxygen content of marine phytoplankton, deep Sea re-search part I. Oceanog Res. Papers 42 (9), 1675–1680. doi: 10.1016/0967-0637(95)00072-E
Babin S., Carton J., Dickey T., Wiggert J. (2004). Satellite evidence of hurricane-induced phytoplankton blooms in an oceanic desert. J. Geophys Res. Oceans 109:Issue C3. doi: 10.1029/2003JC001938
Barone B., Church M. J., Dugenne M. E., Hawco N. J., Jahn O., White A. E., et al. (2022). Biogeochemical dynamics in adjacent mesoscale eddies of opposite polarity. Global Biogeochem. Cycles 36 (2), e2021GB007115. doi: 10.1029/2021GB007115
Benitez-Nelson C. R., Bidigare R. R., Dickey T. D., Landry M. R., Leonard C. L., Brown S. L., et al. (2007). Mesoscale eddies drive increased silica export in the subtropical pacific ocean. Science 316, 1017–1021. doi: 10.1126/science.1136221
Benner R., Strom M. (1993). A critical evaluation of the analytical blank associated with DOC measurements by high-temperature catalytic oxidation. Mar. Chem. 41, 153–160. doi: 10.1016/0304-4203(93)90113-3
Buesseler K. O., Benitez-Nelson C. R., Roca-Martí M., Wyatt A. M., Resplandy L., Clevenger S. J., et al. (2020). High-resolution spatial and temporal measurements of particulate organic carbon flux using thorium-234 in the northeast pacific ocean during the EXport processes in the ocean from RemoTe sensing field campaign. Elementa: Sci. Anthropocene 8 (1), 030. doi: 10.1525/elementa.2020.030
Chen K. S., Hung C. C., Gong G. C., Chou W. C., Chung C. C., Shih Y. Y., et al. (2013). Enhanced POC export in the oligotrophic northwest pacific ocean after extreme weather events. Geophys Res. Lett. 40, 5728–5734. doi: 10.1002/2013GL058300
Chow C. H., Cheah W., Tai J.-H. (2017). A rare and extensive summer bloom enhanced by ocean eddies in the oligotrophic western north pacific subtropical gyre. Sci. Rep. 7, 1–10. doi: 10.1038/s41598-017-06584-3
Coble P. G. (1996). Characterization of marine and terrestrial DOM in seawater using excitation-emission matrix spectroscopy. Mar. Chem. 51, 325–346. doi: 10.1016/0304-4203(95)00062-3
Coble P. G., Del Castillo C. E., Avril B. (1998). Distribution and optical properties of CDOM in the Arabian Sea during the 1995 southwest monsoon. Deep Sea Res. Part II: Topical Stud. Oceanog. 45, 2195–2223. doi: 10.1016/S0967-0645(98)00068-X
Cullen J. J. (2015). Subsurface chlorophyll maximum layers: Enduring enigma or mystery solved? Annu. Rev. Mar. Sci. 7 (1), 207–239. doi: 10.1146/annurev-marine-010213-135111
Dare R. A., McBride J. L. (2011). Sea Surface temperature response to tropical cyclones. Monthly Weather Rev. 139, 3798–3808. doi: 10.1175/MWR-D-10-05019.1
Falkowski P. G., Ziemann D., Kolber Z., Bienfang P. K. (1991). Role of eddy pumping in enhancing primary production in the ocean. Nature 352, 55–58. doi: 10.1038/352055a0
Fennel K., Boss E. (2003). Subsurface maxima of phytoplankton and chlorophyll: Steady-state solutions from a simple model. Limnol. Oceanog. 48, 1521–1534. doi: 10.4319/lo.2003.48.4.1521
Ferrón S., del Valle D. A., Björkman K. M., Quay P. D., Church M. J., Karl D. M. (2016). Application of membrane inlet mass spectrometry to measure aquatic gross primary production by the 18O in vitro method. Limnol. Oceanog.: Methods 14, 610–622. doi: 10.1002/lom3.10116
Frank W. M., Young G. S. (2007). The interannual variability of tropical cyclones. Monthly Weather Rev. 135, 3587–3598. doi: 10.1175/MWR3435.1
Gao W., Wang Z., Zhang K. (2017). Controlling effects of mesoscale eddies on thermohaline structure and in situ chlorophyll distribution in the western north pacific. J. Mar. Syst. 175, 24–35. doi: 10.1016/j.jmarsys.2017.07.002
Garcia H. E., Gordon L. I. (1992). Oxygen solubility in seawater: Better fitting equations. Limnol. Oceanog. 37, 1307–1312. doi: 10.4319/lo.1992.37.6.1307
Gaube P., Chelton D. B., Strutton P. G., Behrenfeld M. J. (2013). Satellite observations of chlorophyll, phytoplankton biomass, and ekman pumping in nonlinear mesoscale eddies. J. Geophys Research: Oceans 118, 6349–6370. doi: 10.1002/2013JC009027
Hansell D. A., Carlson C. A., Repeta D. J., Schlitzer R. (2009). Dissolved organic matter in the ocean: A controversy stimulates new insights. Oceanography 22, 202–211. doi: 10.5670/oceanog.2009.109
Harper B., Kepert J., Ginger J. (2010). Guidelines for converting between various wind averaging periods in tropical cyclone conditions. Citeseer 5–6.
Jørgensen L., Stedmon C. A., Kragh T., Markager S., Middelboe M., Søndergaard M. (2011). Global trends in the fluorescence characteristics and distribution of marine dissolved organic matter. Mar. Chem. 126, 139–148. doi: 10.1016/j.marchem.2011.05.002
Jayalakshmi K. J., Sabu P., Devi C. R., Sanjeevan V. N. (2015). Response of micro-and mesozooplankton in the southwestern bay of Bengal to a cyclonic eddy during the winter monsoon 2005. Environ. Monit. Assess. 187, 1–18. doi: 10.1007/s10661-015-4609-0
Johnson K. S., Plant J. N., Riser S. C., Gilbert D. (2015). Air oxygen calibration of oxygen optodes on a profiling float array. J. Atmospheric Ocea Technol. 32, 2160–2172. doi: 10.1175/JTECH-D-15-0101.1
Juranek L. W., Hamme R. C., Kaiser J., Wanninkhof R., Quay P. D. (2010). Evidence of O2 consumption in underway seawater lines: Implications for air-sea O2 and CO2 fluxes. Geophys Res. Lett. 37:Issue 1. doi: 10.1029/2009GL040423
Kana T. M., Darkangelo C., Hunt M. D., Oldham J. B., Bennett G. E., Cornwell J. C. (1994). Membrane inlet mass spectrometer for rapid high-precision determination of N2, O2, and ar in environmental water samples. Anal Chem. 66, 4166–4170. doi: 10.1021/ac00095a009
Kelly K. A., Qiu B. (1995). Heat flux estimates for the western north atlantic. part I: Assimilation of satellite data into a mixed layer model. J. Phys. oceanog 25, 2344–2360. doi: 10.1175/1520-0485(1995)025<2344:HFEFTW>2.0.CO;2
Kossin J. P. (2018). A global slowdown of tropical-cyclone translation speed. Nature 558, 104–107. doi: 10.1038/s41586-018-0158-3
Langdon C. (2010). Determination of dissolved oxygen in seaweater by winkler titration using amperometric technique. In The go-ship repeat hydrography manual: a collection of expert reports and guidelines.( Hood E.M., Sabine C.L., Sloyan B.M.) Version 1, 137, 18. doi: 10.25607/OBP-1350
Lao Q., Zhang S., Li Z., Chen F., Zhou X., Jin G., et al. (2022). Quantification of the seasonal intrusion of water masses and their impact on nutrients in the beibu gulf using dual water isotopes. J. Geophys. Res. Ocean. 127, e2021JC018065. doi: 10.1029/2021JC018065
Lawaetz A. J., Stedmon C. A. (2009). Fluorescence intensity calibration using the raman scatter peak of water. Appl. Spectrosc. 63, 936–940. doi: 10.1366/000370209788964548
Laws E. A. (1991). Photosynthetic quotients, new production and net community production in the open ocean. Deep Sea Res. Part I Oceanogr. Res. Pap. 38 (1), 143–167. doi: 10.1016/0198-0149(91)90059-O
Lee I., Hahm D., Shin D., Hong C.-S., Nam S., Kim G., et al. (2021). Determination and uncertainty of spring net community production estimated from O2/Ar measurements in the northern East China Sea and southern yellow Sea. Continental Shelf Res. 230, 104570. doi: 10.1016/j.csr.2021.104570
Lin I.-I. (2012). Typhoon-induced phytoplankton blooms and primary productivity increase in the western north pacific subtropical ocean. J. Geophys Research: Oceans 117:Issue C3. doi: 10.1029/2011JC007626
Lin I., Liu W. T., Wu C. C., Wong G. T., Hu C., Chen Z., et al. (2003). New evidence for enhanced ocean primary production triggered by tropical cyclone. Geophys Res. Lett. 30 (13). doi: 10.1029/2003GL017141
Lu X., Zhou X., Jin G., Chen F., Zhang S., Li Z., et al. (2022). Biological impact of typhoon wipha in the coastal area of western guangdong: A comparative field observation perspective. J. Geophys. Res. Biogeosci 127, e2021JG006589. doi: 10.1029/2021JG006589
Marra J. (2002). “Approaches to the measurement of plankton production,” in Phytoplankton productivity: Carbon assimilation in marine and freshwater ecosystems. (UK: Blackwell Publishing Company), 78–108.
Martin A. P., Richards K. J. (2001). Mechanisms for vertical nutrient transport within a north Atlantic mesoscale eddy. Deep Sea Res. Part II: Topical Stud. Oceanog 48, 757–773. doi: 10.1016/S0967-0645(00)00096-5
Ma C., Zhao J., Ai B., Sun S., Zhang G., Huang W., et al. (2021). Assessing responses of phytoplankton to consecutive typhoons by combining argo, remote sensing and numerical simulation data. Sci. Total Environ. 790, 148086. doi: 10.1016/j.scitotenv.2021.148086
McGillicuddy D. J., Anderson L. A., Bates N. R., Bibby T., Buesseler K. O., Carlson C. A., et al. (2007). Eddy/wind interactions stimulate extraordinary mid-ocean plankton blooms. Science 316, 1021–1026. doi: 10.1126/science.1136256
McGillicuddy D., Robinson A., Siegel D., Jannasch H., Johnson R., Dickey T., et al. (1998). Influence of mesoscale eddies on new production in the Sargasso Sea. Nature 394, 263–266. doi: 10.1038/28367
McWilliams J. C. (2008). The nature and consequences of oceanic eddies. Ocean modeling an eddying regime 177, 5–15. doi: 10.1029/177GM03
Mei W., Pasquero C. (2013). Spatial and temporal characterization of Sea surface temperature response to tropical cyclones. J. Climate 26, 3745–3765. doi: 10.1175/JCLI-D-12-00125.1
Meng Q., Zhou F., Ma X., Xuan J., Zhang H., Wang S., et al. (2022). Response process of coastal hypoxia to a passing typhoon in the East China Sea. Front. Mar. Sci. 9, 692. doi: 10.3389/fmars.2022.892797
Mizobata K., Saitoh S., Shiomoto A., Miyamura T., Shiga N., Imai K., et al. (2002). Bering Sea Cyclonic and anticyclonic eddies observed during summer 2000 and 2001. Prog. Oceanog 55, 65–75. doi: 10.1016/S0079-6611(02)00070-8
Ning X., Peng X., Le F., Hao Q., Sun J., Liu C., et al. (2008). Nutrient limitation of phytoplankton in anticyclonic eddies of the northern south China Sea. Biogeosci Discussions 5, 4591–4619. doi: 10.5194/bgd-5-4591-2008
Oschlies A., Garcon V. (1998). Eddy-induced enhancement of primary production in a model of the north Atlantic ocean. Nature 394, 266–269. doi: 10.1038/28373
Pilson M. E. (2013). An introduction to the chemistry of the Sea (U.S.A.: Cambridge University Press)
Price J. F., Weller R. A., Pinkel R. (1986). Diurnal cycling: Observations and models of the upper ocean response to diurnal heating, cooling, and wind mixing. J. Geophys Research: Oceans 91, 8411–8427. doi: 10.1029/JC091iC07p08411
Qiu C., Liang H., Sun X., Mao H., Wang D., Yi Z., et al. (2021). Extreme Sea-surface cooling induced by eddy heat advection during tropical cyclone in the north Western pacific ocean. Front. Mar. Sci. 8. doi: 10.3389/fmars.2021.726306
Quay P., Peacock C., Björkman K., Karl D. (2010). Measuring primary production rates in the ocean: Enigmatic results between incubation and non-incubation methods at station ALOHA. Global Biogeochem Cycles 24:Issue 3. doi: 10.1029/2009GB003665
Ramsay H. (2017). The global climatology of tropical cyclones (Oxford Research Encyclopedia of Natural Hazard Science). Retrieved 10 Oct. 2022, Available from: https://oxfordre.com/naturalhazardscience/view/10.1093/acrefore/9780199389407.001.0001/acrefore-9780199389407-e-79
Shen D., Li X., Wang J., Bao S., Pietrafesa L. J. (2021). Dynamical ocean responses to typhoon malakas, (2016) in the vicinity of Taiwan. J. Geophys. Res. Ocean. 126, e2020JC016663. doi: 10.1029/2020JC016663
Siegel D. A., Cetinić I., Graff J. R., Lee C. M., Nelson N., Perry M. J., et al. (2021). An operational overview of the EXport Processes in the Ocean from RemoTe Sensing (EXPORTS) Northeast Pacific field deployment. Elem. Sci. Anth. 9, 107. doi: 10.1525/elementa.2020.00107
Siegel D. A., McGillicuddy D. J. Jr., Fields E. A. (1999). Mesoscale eddies, satellite altimetry, and new production in the Sargasso Sea. J. Geophys Research: Oceans 104, 13359–13379. doi: 10.1029/1999JC900051
Signorini S. R., McClain C. R., Christian J. R., Wong C. (2001). Seasonal and interannual variability of phytoplankton, nutrients, TCO2, pCO2, and O2 in the eastern subarctic pacific (ocean weather station papa). J. Geophys Research: Oceans 106, 31197–31215. doi: 10.1029/2000JC000343
Son J.-H., Heo K.-Y., Choi J.-W., Kwon J. (2022). Long-lasting upper ocean temperature responses induced by intense typhoons in mid-latitude. Sci. Rep. 12, 5752. doi: 10.1038/s41598-022-09833-2
Stedmon C. A., Bro R. (2008). Characterizing dissolved organic matter fluorescence with parallel factor analysis: a tutorial. Limnol. Oceanog.: Methods 6, 572–579. doi: 10.4319/lom.2008.6.572
Sukigara C., Suga T., Toyama K., Oka E. (2014). Biogeochemical responses associated with the passage of a cyclonic eddy based on shipboard observations in the western north pacific. J. Oceanogr. 70, 435–445. doi: 10.1007/s10872-014-0244-6
Wang L., Huang B., Laws E. A., Zhou K., Liu X., Xie Y., et al. (2018). Anticyclonic eddy edge effects on phytoplankton communities and particle export in the northern south China Sea. J. Geophys. Res. Ocean. 123, 7632–7650. doi: 10.1029/2017JC013623
Wang Y., Xiu P. (2022). Typhoon footprints on ocean surface temperature and chlorophyll-a in the south China Sea. Sci. Total Environ. 840, 156686. doi: 10.1016/j.scitotenv.2022.156686
Wanninkhof R. (1992). Relationship between wind speed and gas exchange. J. Of Geophys Re- search 97 (C5), 7373–7382. doi: 10.1029/92JC00188
Webster P. J., Holland G. J., Curry J. A., Chang H.-R. (2005). Changes in tropical cyclone number, duration, and intensity in a warming environment. Science 309, 1844–1846. doi: 10.1126/science.1116448
Williams R. G., Follows M. J. (2003). “Physical transport of nutrients and the maintenance of biological production BT-ocean biogeochemistry: The role of the ocean carbon cycle in global change.” in Eds. Fasham M. J. R.. (Berlin, Heidelberg: Springer Berlin Heidelberg), 19–51.
Xu H., Tang D., Sheng J., Liu Y., Sui Y. (2019). Study of dissolved oxygen responses to tropical cyclones in the bay of Bengal based on argo and satellite observations. Sci. Total Environ. 659, 912–922. doi: 10.1016/j.scitotenv.2018.12.384
Yang G., Wang F., Li Y., Lin P. (2013). Mesoscale eddies in the northwestern subtropical pacific ocean: Statistical characteristics and three-dimensional structures. J. Geophys Res: Oceans 118, 1906–1925. doi: 10.1002/jgrc.20164
Yun M. S., Kim Y., Jeong Y., Joo H. T., Jo Y. H., Lee C. H., et al. (2020). Weak response of biological productivity and community structure of phytoplankton to mesoscale eddies in the oligotrophic Philippine Sea. J. Geophys Research: Oceans 125, e2020JC016436. doi: 10.1029/2020JC016436
Zapata M., Rodríguez F., Garrido J. L. (2000). Separation of chlorophylls and carotenoids from marine phytoplankton: a new HPLC method using a reversed phase C8 column and pyridine-containing mobile phases. Mar. Ecol. Prog. Ser. 195, 29–45. doi: 10.3354/meps195029
Zheng G. M., Tang D. (2007). Offshore and nearshore chlorophyll increases induced by typhoon winds and subsequent terrestrial rainwater runoff. Mar. Ecol. Prog. Ser. 333, 61–74. doi: 10.3354/meps333061
Keywords: mesoscale eddy, typhoon, biogeochemistry, northwest Pacific Ocean, oligotrophic ocean
Citation: Seo J, Hahm D, Kim G, Lee I, Park J, Na T, Park J-H, Kang SK and Hwang J (2022) Insignificant effects of eddies and typhoons on the biogeochemistry of the tropical northwest Pacific Ocean. Front. Mar. Sci. 9:983748. doi: 10.3389/fmars.2022.983748
Received: 01 July 2022; Accepted: 28 September 2022;
Published: 17 October 2022.
Edited by:
Jing Zhang, University of Toyama, JapanCopyright © 2022 Seo, Hahm, Kim, Lee, Park, Na, Park, Kang and Hwang. This is an open-access article distributed under the terms of the Creative Commons Attribution License (CC BY). The use, distribution or reproduction in other forums is permitted, provided the original author(s) and the copyright owner(s) are credited and that the original publication in this journal is cited, in accordance with accepted academic practice. No use, distribution or reproduction is permitted which does not comply with these terms.
*Correspondence: Doshik Hahm, aGFobUBwdXNhbi5hYy5rcg==