 Zezheng Liu1,2,3Sergio Fagherazzi4Xinhui Liu1,2Dongdong Shao1,3,5Chiyuan Miao6Yanzi Cai1,3Congyu Hou1,2Yeling Liu1Xia Li2*Baoshan Cui1,2,3*
- 1State Key Laboratory of Water Environmental Simulation, School of Environment, Beijing Normal University, Beijing, China
- 2Advanced Interdisciplinary Institute of Environment and Ecology, Beijing Normal University, Zhuhai, China
- 3Yellow River Estuary Wetland Ecosystem Observation and Research Station, Ministry of Education, Dongying, Shandong, China
- 4Department of Earth and Environment, Boston University, Boston, MA, United States
- 5Tang Scholar, Beijing Normal University, Beijing, China
- 6State Key Laboratory of Earth Surface Processes and Resource Ecology, Faculty of Geographical Science, Beijing Normal University, Beijing, China
The water discharge and sediment load have been increasingly altered by climate change and human activities in recent decades. For the Pearl River, however, long-term variations in the sediment regime, especially in the last decade, remain poorly known. Here we updated knowledge of the temporal trends in the sediment regime of the Pearl River at annual, seasonal and monthly time scales from the 1950s to 2020. Results show that the annual sediment load and suspended sediment concentration (SSC) exhibited drastically decreased, regardless of water discharge. Compared with previous studies, we also found that sediment load and SSC reached a conspicuous peak in the 1980s, and showed a significant decline starting in the 2000s and 1990s, respectively. In the last decade, however, water discharge and sediment load showed slightly increasing trends. At the seasonal scale, the wet-season water discharge displays a decreasing trend, while the dry-season water discharge is increasing. At the monthly scale, the flood seasons in the North and East Rivers typically occur one month earlier than that in the West River due to the different precipitation regimes. Precipitation was responsible for the long-term change of discharge, while human activities (e.g. dam construction and land use change) exerted different effects on the variations in sediment load among different periods. Changes in the sediment regime have exerted substantial influences on downstream channel morphology and saltwater intrusion in the Greater Bay Area. Our study proposes a watershed-based solution, and provides scientific guidelines for the sustainable development of the Greater Bay Area.
Introduction
Hydrological connectivity has become one of the most widely used concept in the Earth and Environmental Sciences (Pringle, 2003; Bracken et al., 2013). Hydrological connectivity is defined as the water-mediated transfer of matter, energy, or organisms within or between elements of the hydrologic cycle (Pringle et al., 2001). In the land-river-sea system, rivers provide the primary link between the land and the ocean, and deliver terrigenous materials, such as freshwater, sediment as well as nutrients, to the ocean (Li et al., 2020; Zhang et al., 2020; Singh and Khan, 2020; Matiatos et al., 2021; Yakushev et al., 2021; Regnier et al., 2022). The water discharge and sediment load delivered to the sea are dominant factors affecting the geomorphologic and ecosystem evolution of the estuaries and coast (Syvitski et al., 2009; Meiggs and Taillefert, 2011; Liu et al., 2020; Liu et al., 2021b). For over half a century, the water discharge and sediment load in large river systems have been increasingly altered by climate change and human activities, such as reservoir or dam construction, land use changes, soil conservation measures, and water extraction (Dai et al., 2016; Best, 2018; Khan, 2018; Li et al., 2020; Dethier et al., 2022). Changes of water discharge and sediment load can cause various effects on coastal ecosystems and the geomorphological evolution of river channels (Dai et al., 2016; Liu et al., 2021b). However, the causes and trends of changes in upstream flow regime and sediment supply differ from river to river and vary through time (Khan et al., 2016; Li et al., 2020; Wu et al., 2020; Dethier et al., 2022). Therefore, it is of scientific and practical importance to explore changes in water discharge and sediment load and their response to human activities and climate change in the context of global change.
In China, numerous studies have investigated trends of water discharge and sediment load for the country’s large rivers and the impacts on estuarine and coastal environments (Dai et al., 2016; Wu et al., 2020; Liu et al., 2021b). For example, the Yellow River has experienced a drastic reduction in sediment load due to anthropogenic changes, which has caused massive erosion in the Yellow River Delta (Wang et al., 2010; Wang et al., 2016). Similarly, the sediment load of the Yangtze River has shown a drastic decreasing trend since the construction of the Three Gorges Dam Reservoir in 2003 (Xu and Milliman, 2009; Yang et al., 2015). The Pearl River (Figure 1), the subject of this paper, ranks as the second and third largest river in terms of water discharge and sediment load in China, respectively (Nilsson et al., 2005; Liu et al., 2018b). The Pearl River plays a key role in freshwater supply to large cities (e.g. Zhuhai, Guangdong, Macau and Hong Kong) and shoreline protection in the Greater Bay Area. Several studies have explored the interannual variations in water discharge and sediment load in the Pearl River based on annual time series data (e.g., Dai et al., 2008; Zhang et al., 2008; Zhang et al., 2012; Liu et al., 2014; Tan et al., 2017). However, monthly and seasonal variations in water discharge and sediment load in the Pearl River remain poorly known; these changes can shed light on the influence of human activity and climate change at the monthly and seasonal time scales (Chen et al., 2001). Liu et al. (2018b) have explored the monthly and seasonal variations in water discharge and sediment load in the Pearl River, but the latest year for the hydrological data is 2009. Therefore, there is a need to add and update knowledge of the sediment regime in the Pearl River to aid environmental management of the Greater Bay Area.
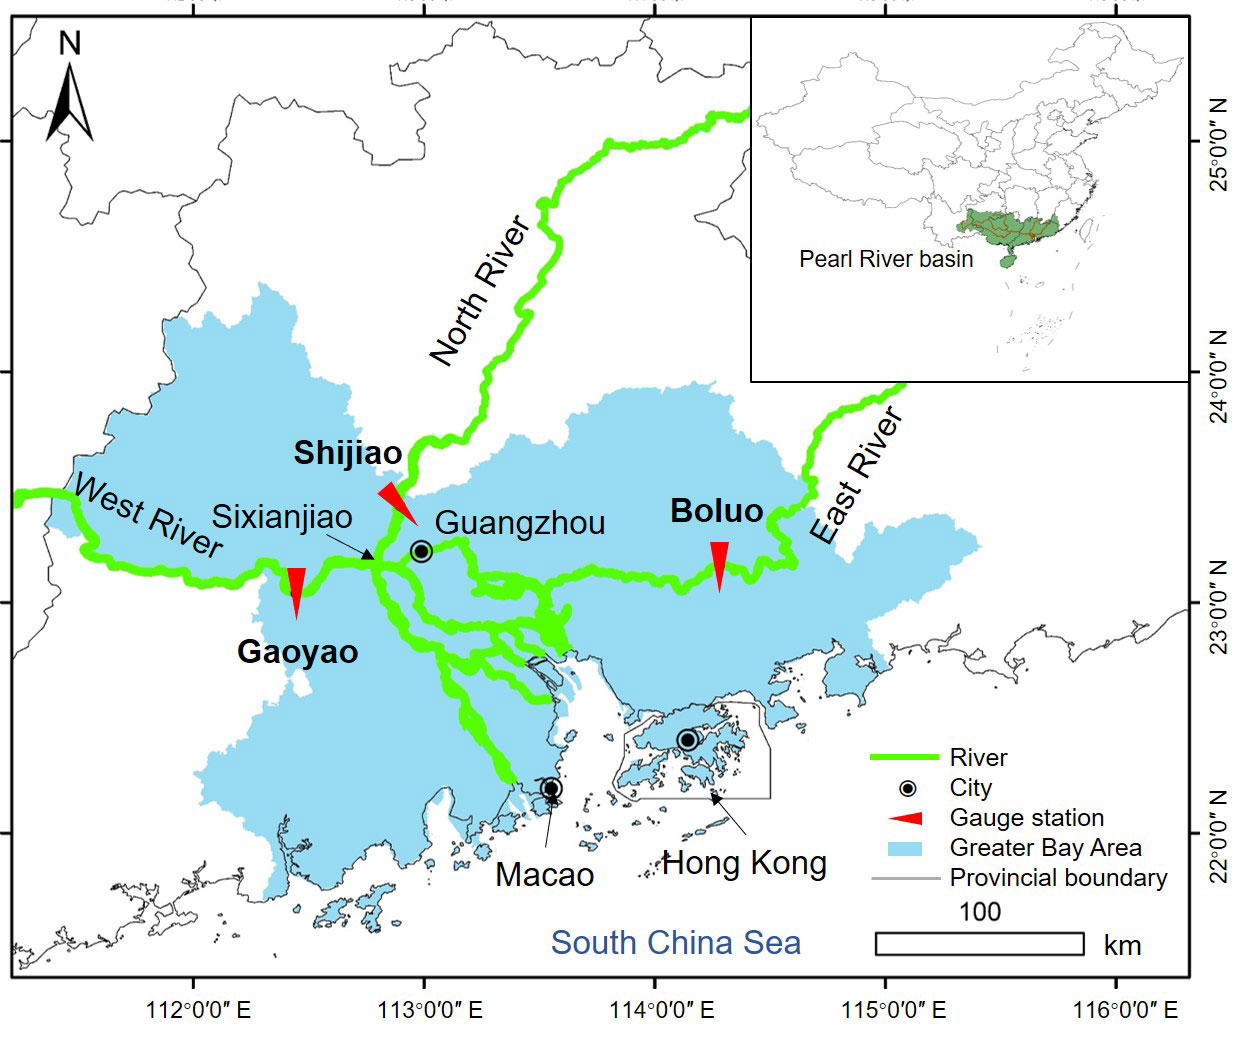
Figure 1 Pearl River and the Greater Bay Area, and locations of the three hydrological stations used in this study.
Here we detect annual, seasonal and monthly changes in the sediment regime of the Pearl River and its three tributaries from the 1950s to 2020. The main objectives of this study are as follows: (a) to reveal temporal trends in water discharge and sediment load in the Pearl River and its three tributaries at annual, seasonal and monthly time scales; (b) to examine the impacts of climate change (in particular, precipitation) and human activities (e.g. dam construction and land use changes) on the sediment regime; (c) to explore the environmental responses (e.g. downstream channel morphology and saltwater intrusion) to alteration of sediment regime, and provide scientific guidelines for the sustainable development of the Greater Bay Area.
Materials and methods
Study area
The Pearl River is the second largest river (after the Yangtze River) in China, and flows 2400 km eastward to the South China Sea (Figure 1). The Pearl River basin originates from the Yunnan Plateau and consists of a 450,000 km2 catchment area (Liu et al., 2014). Topographically, the elevation of the Pearl River basin ranges from 0 m to 2795 m above the mean sea level, and gradually decreases from the northwestern mountainous part to the southeastern coastal part (Zheng et al., 2017). The Pearl River basin comprises a region of subtropical to tropical monsoon climate straddling the Tropic of Cancer, with an annual mean temperature ranging from 14 to 22°C (Zheng et al., 2017). The annual mean precipitation in the Pearl River basin ranges from 1,200 to 2,200 mm, and gradually decreases from the east to the west of the river basin (Liu et al., 2018b). The wet season extends from April to September, followed by a dry season from October to March (Wu et al., 2012). The Guangdong-Hong Kong-Macao Greater Bay Area, strategically defined by the China State Council in 2015, is one of the most important economic centers situated in the Pearl River Delta (Figure 1). The Pearl River is an important freshwater and sediment source for large cities and coastal ecosystems in the Greater Bay Area.
The Pearl River is a compound river system, and comprises three major tributaries: the West River, the North River and the East River (Figure 1). Among the three main tributaries, the West River is the largest tributary with a catchment area of 35.15 × 10⁴ km2, accounting for 77% and 89% of the Pearl River’s total water discharge and sediment load, respectively (Table 1). The North River is the second largest tributary with a drainage area of 2.86 × 10⁴ km2, accounting for 15% and 8% of the Pearl River’s total water discharge and sediment load, respectively (Table 1). The East River has the lowest water discharge and sediment load (Table 1). The West River, the North River and the East River flow into the Greater Bay Area through Gaoyao, Shijiao and Boluo stations, respectively (Figure 1). Moreover, the water discharge and sediment load from the West River and North River basins are redistributed by the Sixianjiao channel, forming a complicated river network in the deltaic region (Figure 1). The Pearl River flows through the Pearl River Delta and finally enters the South China Sea (Figure 1). The tide type in the Pearl River Estuary, located in the front of the Pearl River Delta, is the irregular mixed semi-diurnal tide, with a mean tidal range of 0.86-1.60 m (Zhang et al., 2010).
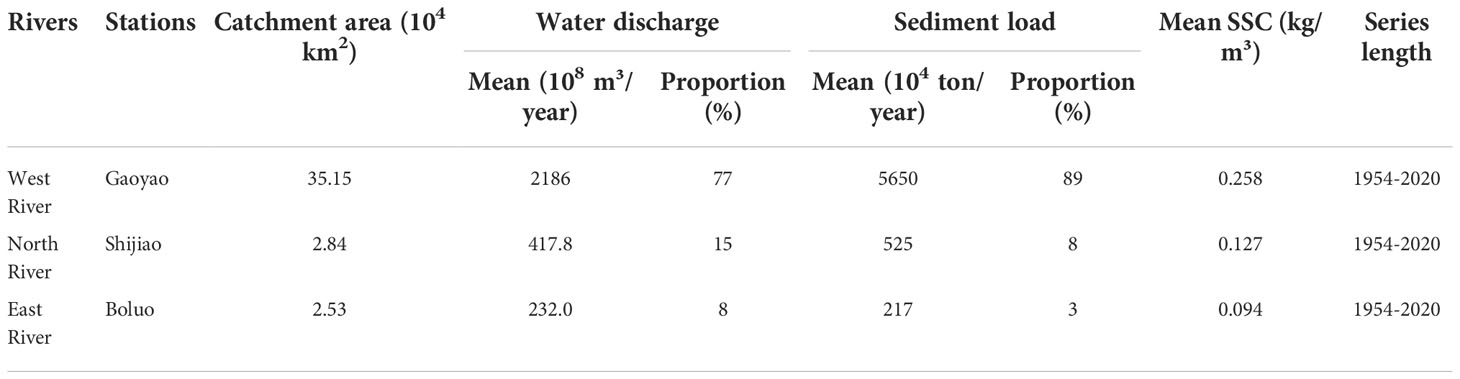
Table 1 General information of gauge stations on the main tributaries of the Pearl River in the Greater Bay Area.
Human activities
In the Pearl River basin, human activities, such as dam construction, land use changes, water diversion, deforestation and reforestation, have strongly affected water discharge and sediment load (Ezcurra et al., 2019; Li et al., 2020; Wu et al., 2020). For flood control, agricultural irrigation, and power generation, more than 9,000 reservoirs or dams have been constructed in the Pearl River basin from the 1950s to the 2000s, with a total storage capacity of 894 × 108 m3 (Liu et al., 2018b). From the 1950s to the 2000s, 14, 5 and 3 major reservoirs were built in the West, North and East River basins, respectively (Table 2). The reservoirs in the Pearl River basin are heavily silted by sediments, and the total sediment deposition rate of the Pearl River is 512 × 106 m3/year (Dai et al., 2008). For example, approximately 71% of the total sediment load from upstream was trapped by the reservoirs in the West River basin from 1991 to 2002 (Wang et al., 2021). Another important human activity in the Pearl River basin is deforestation or reforestation. With rapid population growth in the Pearl River basin since the 1950s, large parts of the Pearl River basin were deforested, in response to an increase in the need for food and timber (Dai et al., 2008). Since the mid-1980s, projects for water and soil conservation, such as reforestation, have been implemented in China to stop the expansion of the area of land under erosion. The area of land under erosion in the Pearl River basin was almost unchanged from 1995 (62,700 km2) to 2004 (62,730 km2) (Liu et al., 2018b).

Table 2 Summary information of large reservoirs constructed in the Pearl River Basin.
Data sources
The hydrological data in this study were derived from the hydrological yearbooks of the People’s Republic of China, the Bulletin of River Sediment of China compiled by the Ministry of Water Resources of the People’s Republic of China (http://www.mwr.gov.cn/) and previous studies (Wu et al., 2014; Liu et al., 2018b). Annual water discharge, sediment load and annual average suspended sediment concentration (SSC) in the three tributaries of the Pearl River are available from 1954 to 2020. Seasonal and monthly water discharge and sediment load in Gaoyao Station are available from January 1957 to December 2020, and the data from Shijiao and Boluo Stations cover a period from January 1954 to December 2020. In this study, water discharge and sediment load data in the Pearl River are defined as the sum of these three tributaries, and the SSC in the Pearl River is defined as the mean level of these three tributaries. The measurements of water discharge, sediment load and suspended sediment concentration at three stations followed national standards issued by the Ministry of Water Conservancy and Electric Power (1962) and Ministry of Water Conservancy and Electric Power (1975). The suspended sediment load per unit time through cross-section was calculated by using the general cross-section sampling method with the flow tests. The quality of the hydrological data has been checked and was under the strict control of the Pearl Water Resources Commission, China before its release.
To explore the impacts of climate change and human activities, we also collected precipitation data and general information on reservoir construction in the Pearl River basin. A census of large reservoirs and dams constructed in the Pearl River basin was obtained from the Pearl River Water Resources Commission of the Ministry of Water Resources (http://www.pearlwater.gov.cn/) and previous studies (Dai et al., 2008; Liu et al., 2018b). Annual precipitation in Guangzhou from January 1961 to December 2020 was obtained from the Climate Change Research Center, Chinese Academy of Sciences (Wu et al., 2017). Furthermore, we also collected general information of the morphological changes of the river channels and saltwater intrusion to reveal the ecological outcomes of hydrological alternations. The elevation of three cross-sectional profiles (e.g. Gaoyao, Shijiao and Boluo) were derived from the Pearl River Sediment Bulletin, provided by the Pearl River Water Resources Commission of the Ministry of Water Resources (http://www.pearlwater.gov.cn/). These fixed cross-sections in these three channel transects were established by the Water Bureau of Guangdong Province in 1960s. The selected three channel transects are 100 km away from the estuarine mouth, and the effects of the tidal level change are neglected (Wang et al., 2021). The channel transects are measured twice a year by the Guangdong Bureau of hydrology, and the channel transects data are reliable and comparable. Times and duration of saltwater intrusion in the Pearl River Estuary from 2009 to 2020 were derived from the Bulletin of Sea Level in China compiled by the Ministry of Natural Resources of the People’s Republic of China (http://www.mnr.gov.cn/) and previous studies (Li et al., 2019; Wang et al., 2020). Furthermore, we also derived information on freshwater supply during 2005-2020 from the Bulletin of Flood and Drought Disaster in China compiled by the Ministry of Water Resources of the People’s Republic of China (http://www.mwr.gov.cn/), and the Pearl River Water Resources Commission of the Ministry of Water Resources (http://www.pearlwater.gov.cn/).
Data analysis
The non-parametric Mann-Kendall test (M-K) was used to identify trends in annual discharge, sediment load and SSC. The Mann-Kendall test was originally proposed by Mann (1945) and later reformulated by Kendall (1975). The non-parametric Mann-Kendall test has no requirements of homoscedasticity or prior assumptions on the distribution of the data (Önöz and Bayazit, 2003), and has similar explanatory power to other parametric methods (Serrano et al., 1999). The M-K test has been widely used to quantify the significance of trends in hydrometeorological time series (Liu et al., 2018b; Wang et al., 2021). Detailed information of the M-K test is described below.
The standardized Sk statistic is given as follows:
where xi and xj are the values of sequence i and j, respectively; n represent the length of the time series; ri symbolizes the function that takes the values of 1, 0 and -1. Positive and negative values of r indicate increasing and decreasing trends in the time series, respectively. Under a null hypothesis of random independence of the time series; the statistic Sk is approximately normally distributed when n ≥ 8, with the average and variance values of statistics Sk as shown
The standardized test statistic ZMK is computed as follows:
The ZMK follows the standard normal distribution with variance “1” and mean “0”. Given that a significance level of α = 0.05 was applied here, the null hypothesis of no trend is rejected if |ZMK| is larger than the theoretical value of 1.96 (95% significant level). Positive and negative values of ZMK indicate upward and downward trends, respectively.
Furthermore, we also used the least-squares linear regression method to examine the temporal trends in annual and seasonal water discharge, sediment load and suspended sediment concentration. One-way ANOVAs followed by non-parametric Kruskal-Wallis tests were used to test differences in annual water discharge, sediment load and suspended sediment concentration between different periods. To examine the relationship between water discharge, sediment load and precipitation, we used the least-squares linear regression method, with statistical significance at the 0.05 level. All statistical analyzes were carried out using MATLAB Software (version 2016a). The processing of this study is outlined in Figure 2.
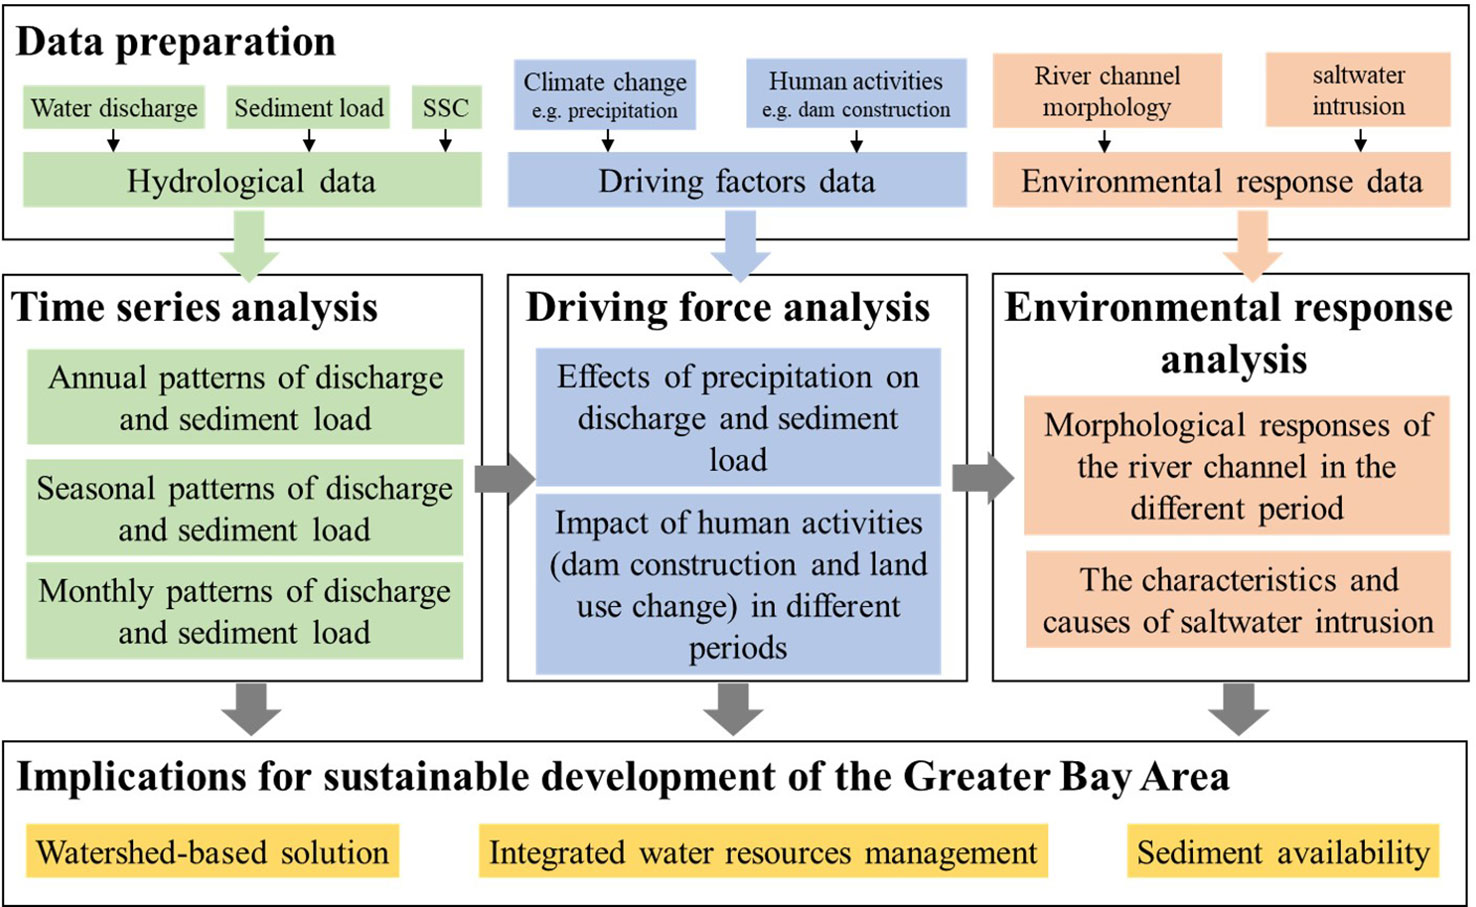
Figure 2 Flow chart of this study. SSC denotes suspended sediment concentration.
Results
Annual patterns of discharge and sediment load
From 1954 to 2020, there are no significant trends detected for water discharge of the Pearl River (Figure 3D) as well as its major tributaries, the West River (Figure 3A), North River (Figure 3B) and East River (Figure 3C) (P > 0.05). Water discharge at these stations in the Guangdong-Hong Kong-Macao Greater Bay Area shows slightly increasing trends. However, sediment load of the Pearl River (Figure 3D) as well as its major tributaries, the West River (Figure 3A) and East River (Figure 3C), show significant decreasing trends from 1954 to 2020 (P< 0.05). Sediment load in the North River also shows a slightly decreasing trend (Figure 3B). For suspended sediment concentration, significant decreasing trends were detected at stations Gaoyao in the West River, Shijiao in the North River, Boluo in the East River and the mean level of the Pearl River (P< 0.05) (Figure 3E). The results of the Mann–Kendall test show similar trends in the annual water discharge and sediment load in the Pearl River as well as its major tributaries since the 1950s (Table 3). The results of the M-K test indicate a nonsignificant change trend in the discharge and different change trends in the sediment load and suspended sediment concentration (Table 3).
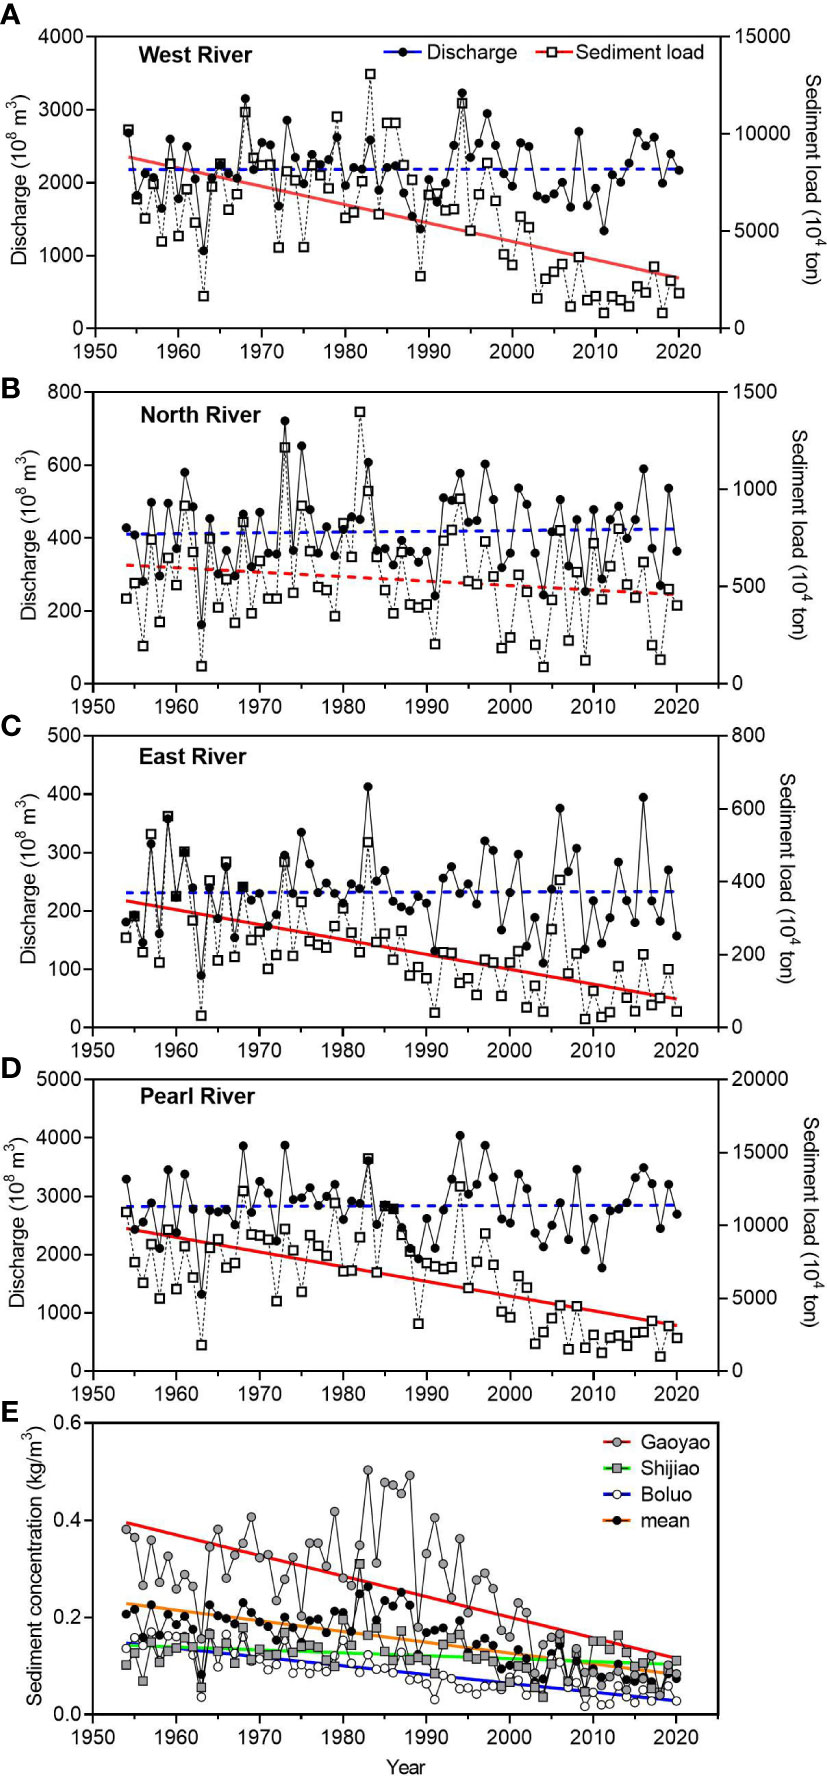
Figure 3 Temporal changes in annual discharge (a-d), sediment load (A-D) and suspended sediment concentration (E) in the Pearl River (D) as well as in its major tributaries, the West River (A), North River (B) and East River (C) since 1954. Solid lines denote significant correlations (P< 0.05), whereas dotted lines denote non-significant correlations.
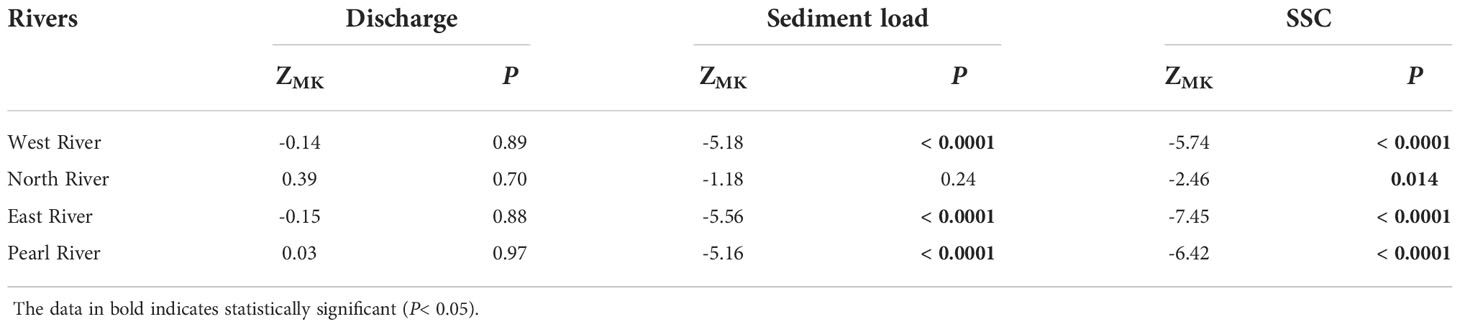
Table 3 Results of M-K test for annual discharge, sediment load and SSC.
In different periods, averages and trends in annual water discharge, sediment load and suspended sediment concentration of the Pearl River as well as its major tributaries show different patterns (Figure 4; Table 4). Consistent with the above results, mean annual water discharge showed no significant differences among different periods (Figures 4A-D), however, annual water discharge in the West River showed significant decreasing trends in the 1980s (P< 0.05) (Table 4). In the last ten years (2010-2019), annual water discharge in the Pearl River as well as its major tributaries showed slightly increasing trends (Table 4). Sediment load and SSC significantly differed among different periods (Figure 4). Sediment load and SSC reached a conspicuous peak in the 1980s in the Pearl River, the west River and North River. In the 1980s, sediment load in the North River showed significant decreasing trends (P< 0.05) (Table 4). Sediment loads in the Pearl River and the west River were lower in the 2000s and 2010s than in the other periods (Figures 4E, F), while sediment load in the North River showed no significant differences among different periods (Figure 4G). In the East river, however, sediment load and SSC reached a conspicuous peak in the 1950s, and showed significant differences starting in the 1990s and 1970s, respectively (Figures 4H, I). SSC in the Pearl River showed decreasing trends from the 1950s to the 2010s, except in the 1960s and 1970s (Table 4).
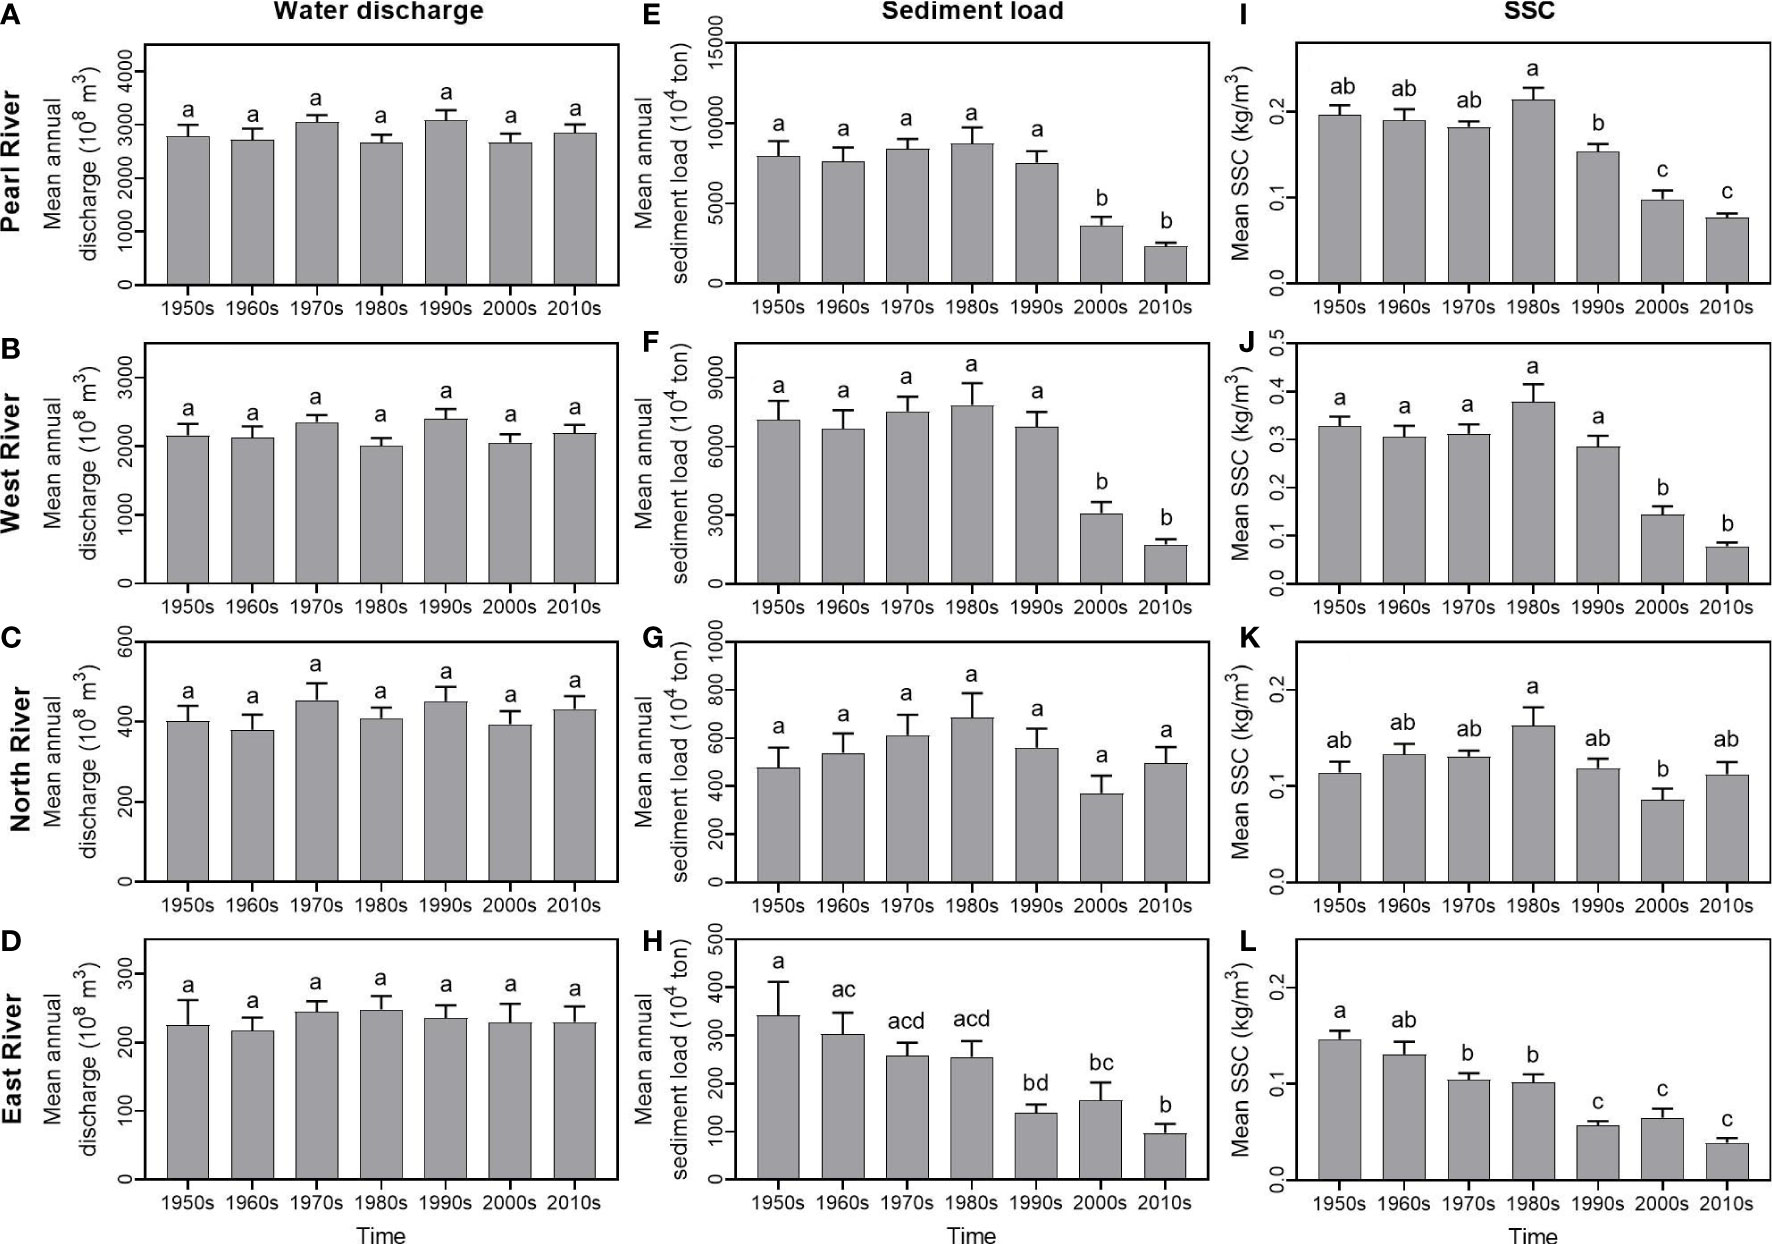
Figure 4 Mean (± SE) of annual water discharge (A-D), sediment load (E-H) and suspended sediment concentration (I-L) in the Pearl River as well as its major tributaries in different periods. For differences among periods, bars sharing a letter are not significantly different from one another (P< 0.05).
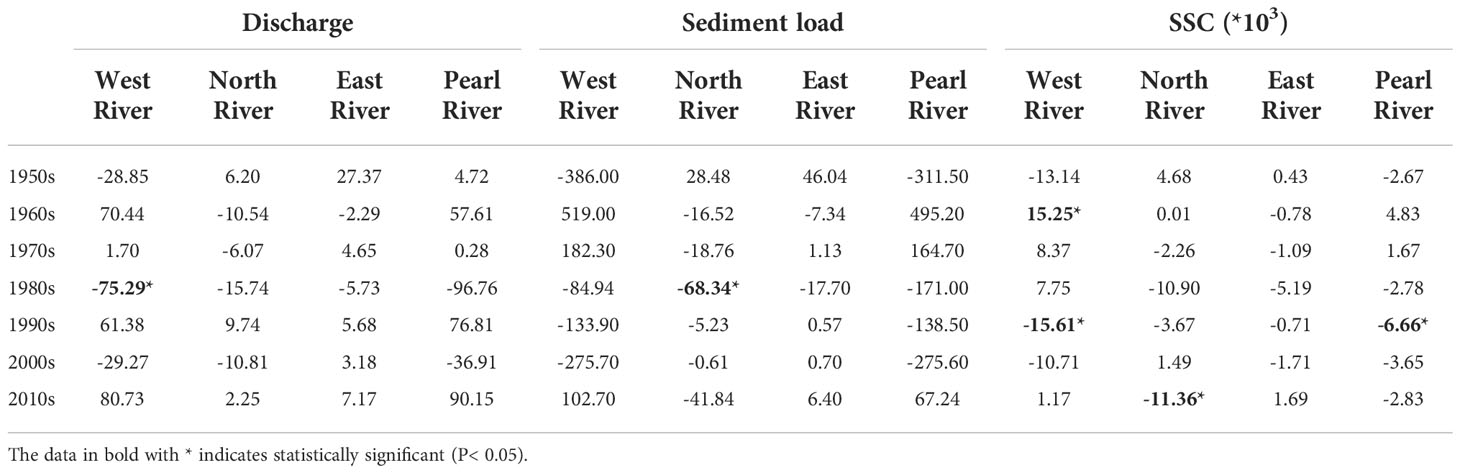
Table 4 The slope of liner regression between annual discharge, sediment load and suspended sediment concentration and time in the Pearl River as well as its major tributaries in different periods.
Seasonal patterns of discharge and sediment load
In general, discharge and sediment load in the Pearl River as well as its major tributaries show obvious seasonal patterns, due to the dominant impact of the summer monsoon. More than 70% of discharge in the Pearl River basin is concentrated in the wet season (April-September) (Table 5). For the Pearl River, the wet-season discharge shows a non-significant decreasing trend, but the dry-season shows a significant increasing trend, and the ratio of wet-season to dry-season shows a significant decreasing trend (Figure 5D). Additionally, the contribution of the wet season to the annual discharge decreased from 80.6% to 71.3% from the 1950s to the 2010s (Table 5). For the West River, the trends of discharge in the wet and dry seasons and the ratio of wet-season to dry-season show a similar pattern to that of the main Pearl River. In addition, the percentages decreased from 81.6% to 71.6% for the wet-season water discharge from the 1950s to the 2010s (Table 5). For the North River, the wet-season discharge and the ratio of wet-season to dry-season show a non-significant decreasing trend, but the dry-season series show a nonsignificant increasing trend (Figure 5B). Additionally, the contribution of the wet season to the annual water discharge decreased from 80.7% to 72.1% from the 1950s to the 2010s (Table 5). For the East River, the wet-season discharge shows a non-significant decreasing trend, the dry-season discharge shows a slightly increasing trend, but the ratio of wet-season to dry-season shows a significant decreasing trend (Figure 5C). Additionally, the contribution of the wet season to the annual water discharge decreased from 81.0% to 66.9% from the 1950s to the 2010s (Table 5).
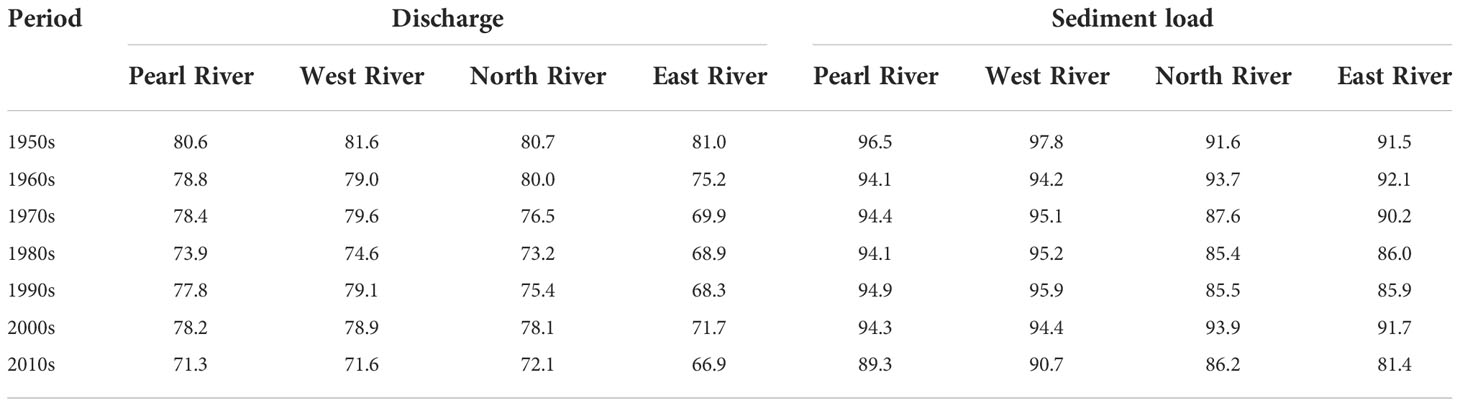
Table 5 Percentages (%) of the wet-season discharge and sediment load accounting for the annual amount during different periods.
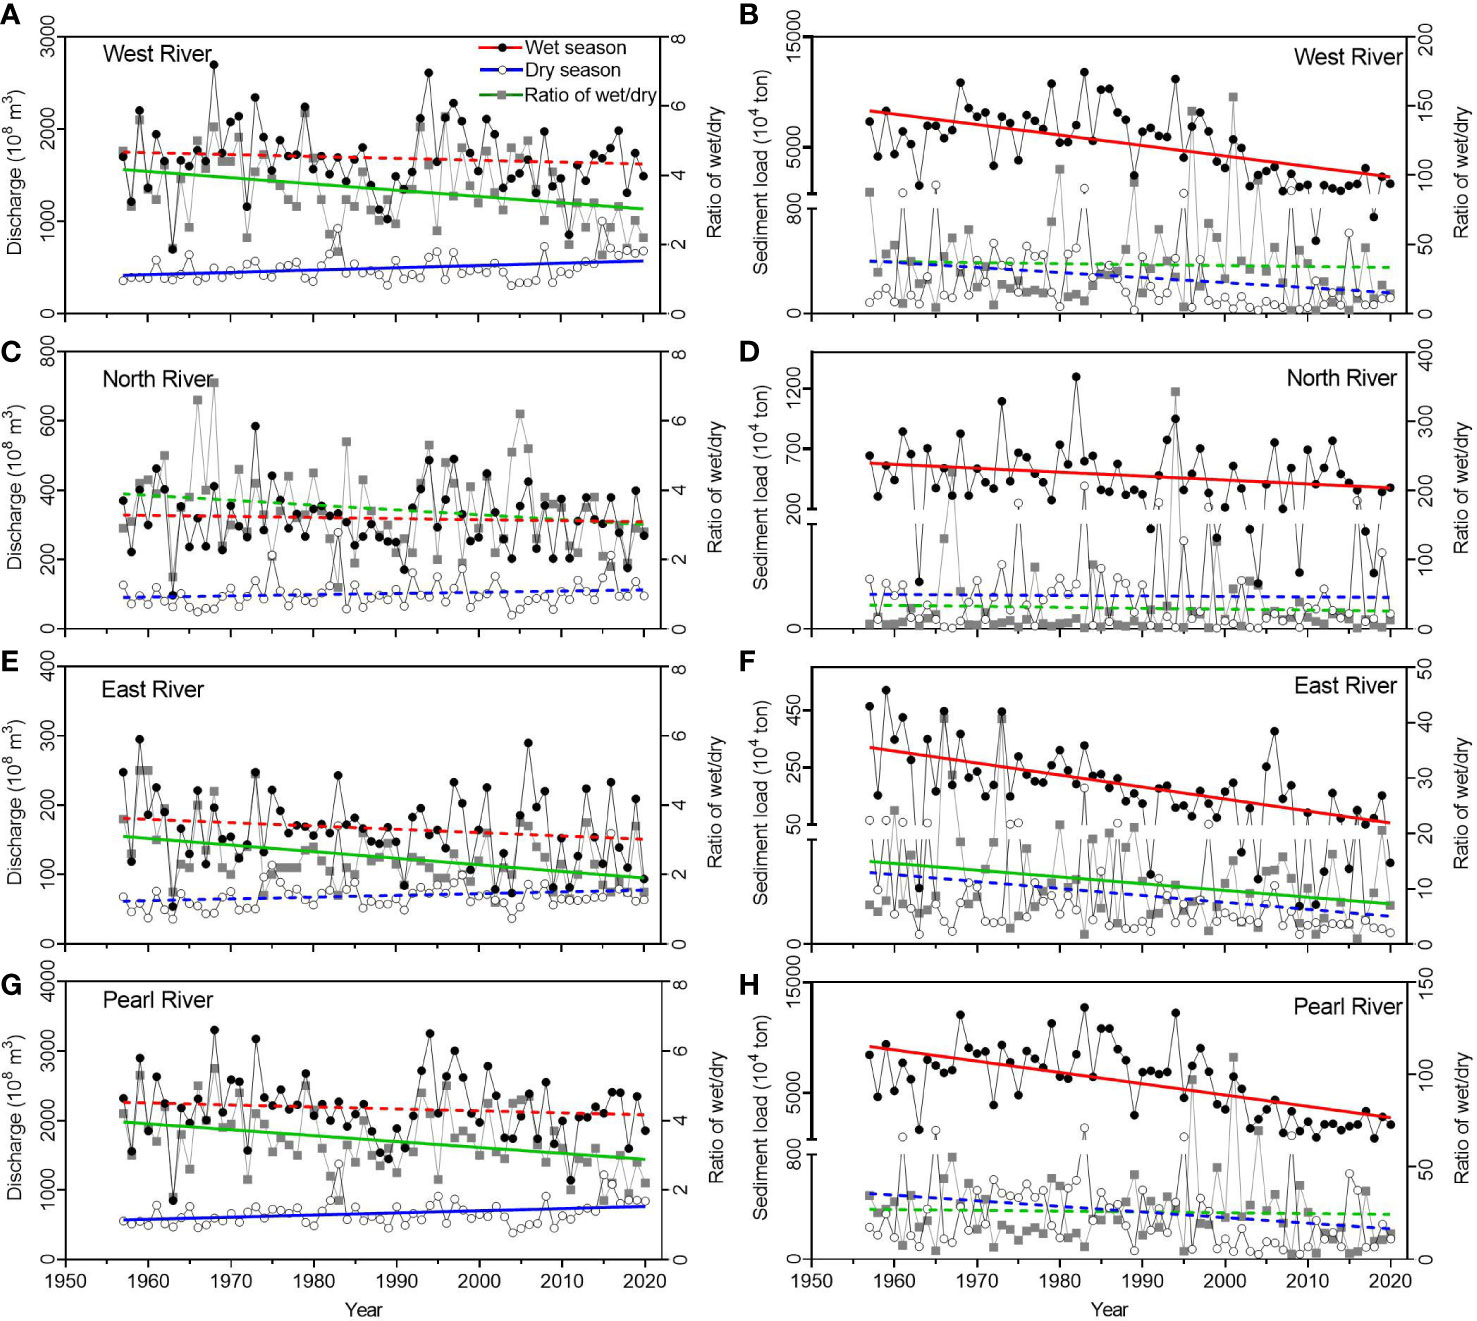
Figure 5 Temporal changes of discharge and sediment load in wet and dry-season, and the ratio of wet to dry seasons in the West (A, E), North (B, F), East (C, G) Rivers, and the Pearl River (D, H) since the 1960s. Solid lines denote significant correlations (P ≤ 0.05), whereas dotted lines denote non-significant correlations.
For sediment load, more than 90% of the annual sediment load in the Pearl River basin occurs in the wet season (Table 5). For the Pearl River, the wet-season sediment load shows a significant decreasing trend, but the dry-season sediment load and the ratio of wet-season to dry-season show nonsignificant decreasing trends (Figure 5H). Additionally, the contribution of the wet season to the annual sediment load decreased from 96.5% to 89.3% from the 1950s to the 2010s (Table 5). For the West River, the trends of sediment load in the wet and dry seasons and the ratio of wet-season to dry-season show a similar pattern to that of the main Pearl River (Figure 5E). In addition, the percentages decreased from 97.8% to 90.7% for the wet-season sediment load from the 1950s to the 2010s (Table 5). For the North River, the wet-season sediment load shows a significant decreasing trend, but the dry-season sediment load and the ratio of wet-season to dry-season show a non-significant decreasing trend (Figure 5F). Additionally, the contribution of the wet season to the annual sediment load decreased from 91.6% to 86.2% from the 1950s to the 2010s (Table 5). For the East River, the wet-season sediment load and the ratio of wet-season to dry-season show a significant decreasing trend, but the dry-season sediment load shows a non-significant decreasing trend (Figure 5G). In addition, the percentages decreased from 91.5% to 81.4% for the wet-season sediment load from the 1950s to the 2010s (Table 5).
Monthly patterns of discharge and sediment load
Overall, the multi-year averages of monthly discharge and sediment load of the Pearl River as well as its major tributaries were highest in summer (June-August) and lowest in winter (December- February) from the 1950s to the 2010s (Figure 6). However, there were some differences in the monthly distribution of discharge and sediment load among the Pearl River and three tributaries. For the Pearl River, the highest multi-year averages of monthly discharge and sediment load from the 1950s to the 2010s occurred in June and July, respectively (Figure 6). For the West River, both the highest multi-year averages of monthly discharge and sediment load from the 1950s to the 2010s occurred in July (Figure 6). For the North and East Rivers, however, both the highest multi-year averages of monthly discharge and sediment load from the 1950s to the 2010s occurred in June (Figure 6). Thus, the month with the highest multi-year averages of monthly discharge and sediment load in the North and East Rivers typically occurs one month earlier than that in the West River (Figure 6). This can be attributed to the different precipitation regimes in each watershed. The annual precipitation gradually decreases from the eastern to the western side of the Pearl River basin, and the monsoons comes later in the west than in the east (Zhang et al., 2012).
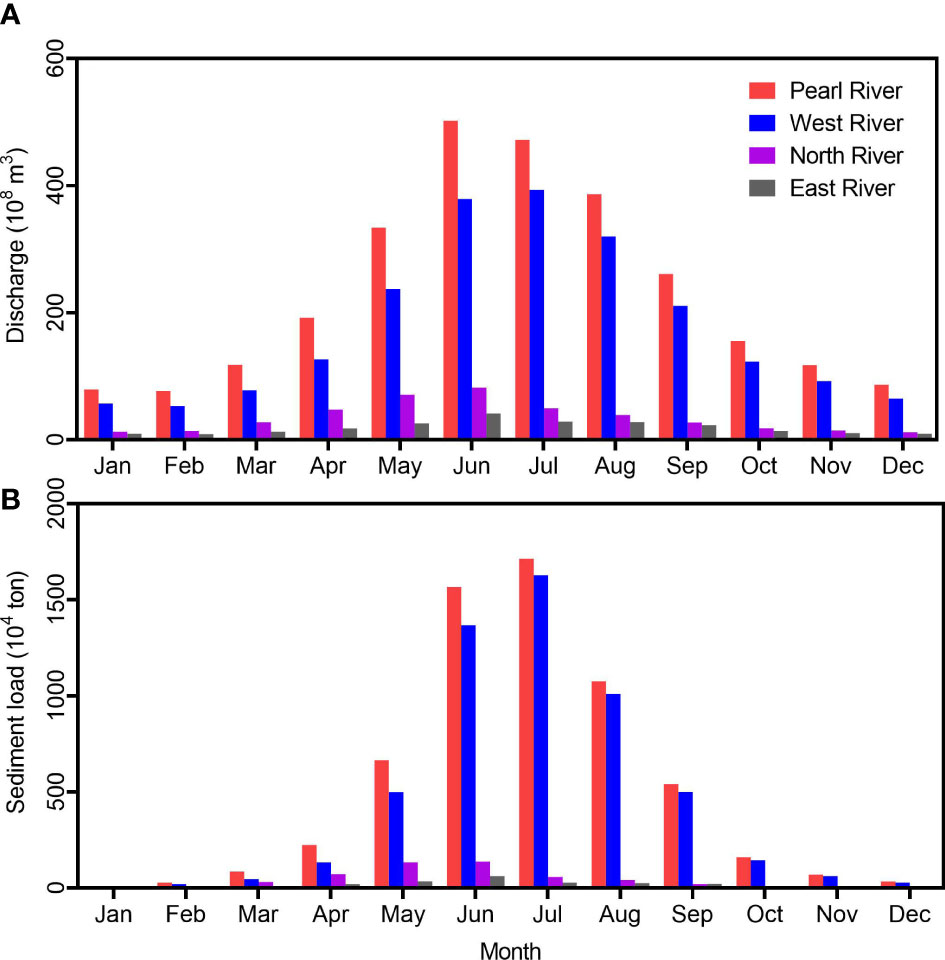
Figure 6 Multi-year averages of monthly distribution of discharge (A) and sediment load (B) in the Pearl River as well as its major tributaries from the 1950s to the 2010s.
The long-term changes in the monthly discharge and sediment load exhibit different patterns in the Pearl River and its three tributaries (Figure 7). For the Pearl River, the average peak discharge decreased by 32.3% from the 1950s to the 1980s but increased by 53.5% from the 1980s to the 1990s, and decreased by 25.4% from the 1990s to the 2010s (Figure 7A). However, the average peak sediment load in the Pearl River increased by 25.0% from the 1950s to the 1990s, and decreased by 75.7% from the 1990s to the 2010s (Figure 7E). The West River has a similar pattern to that in the Pearl River (Figures 7B, F). The average peak discharge first decreased, then increased and finally decreased again, while the peak sediment load exhibits first increases, and then decreases from the 1950s to the 2010s (Figures 7B, F). For the North River and East River, the average peak of water discharge decreased by 23.6% and 45.8% from the 1950s to the 2010s, respectively (Figures 7C, D). The average sediment peak in the North River increased by 54.3% from the 1950s to the 1980s and decreased by 29.6% from the 1980s to the 2010s (Figure 7G). The average sediment peak in the East River decreased by 82.4% from the 1950s to the 2010s (Figure 7H).
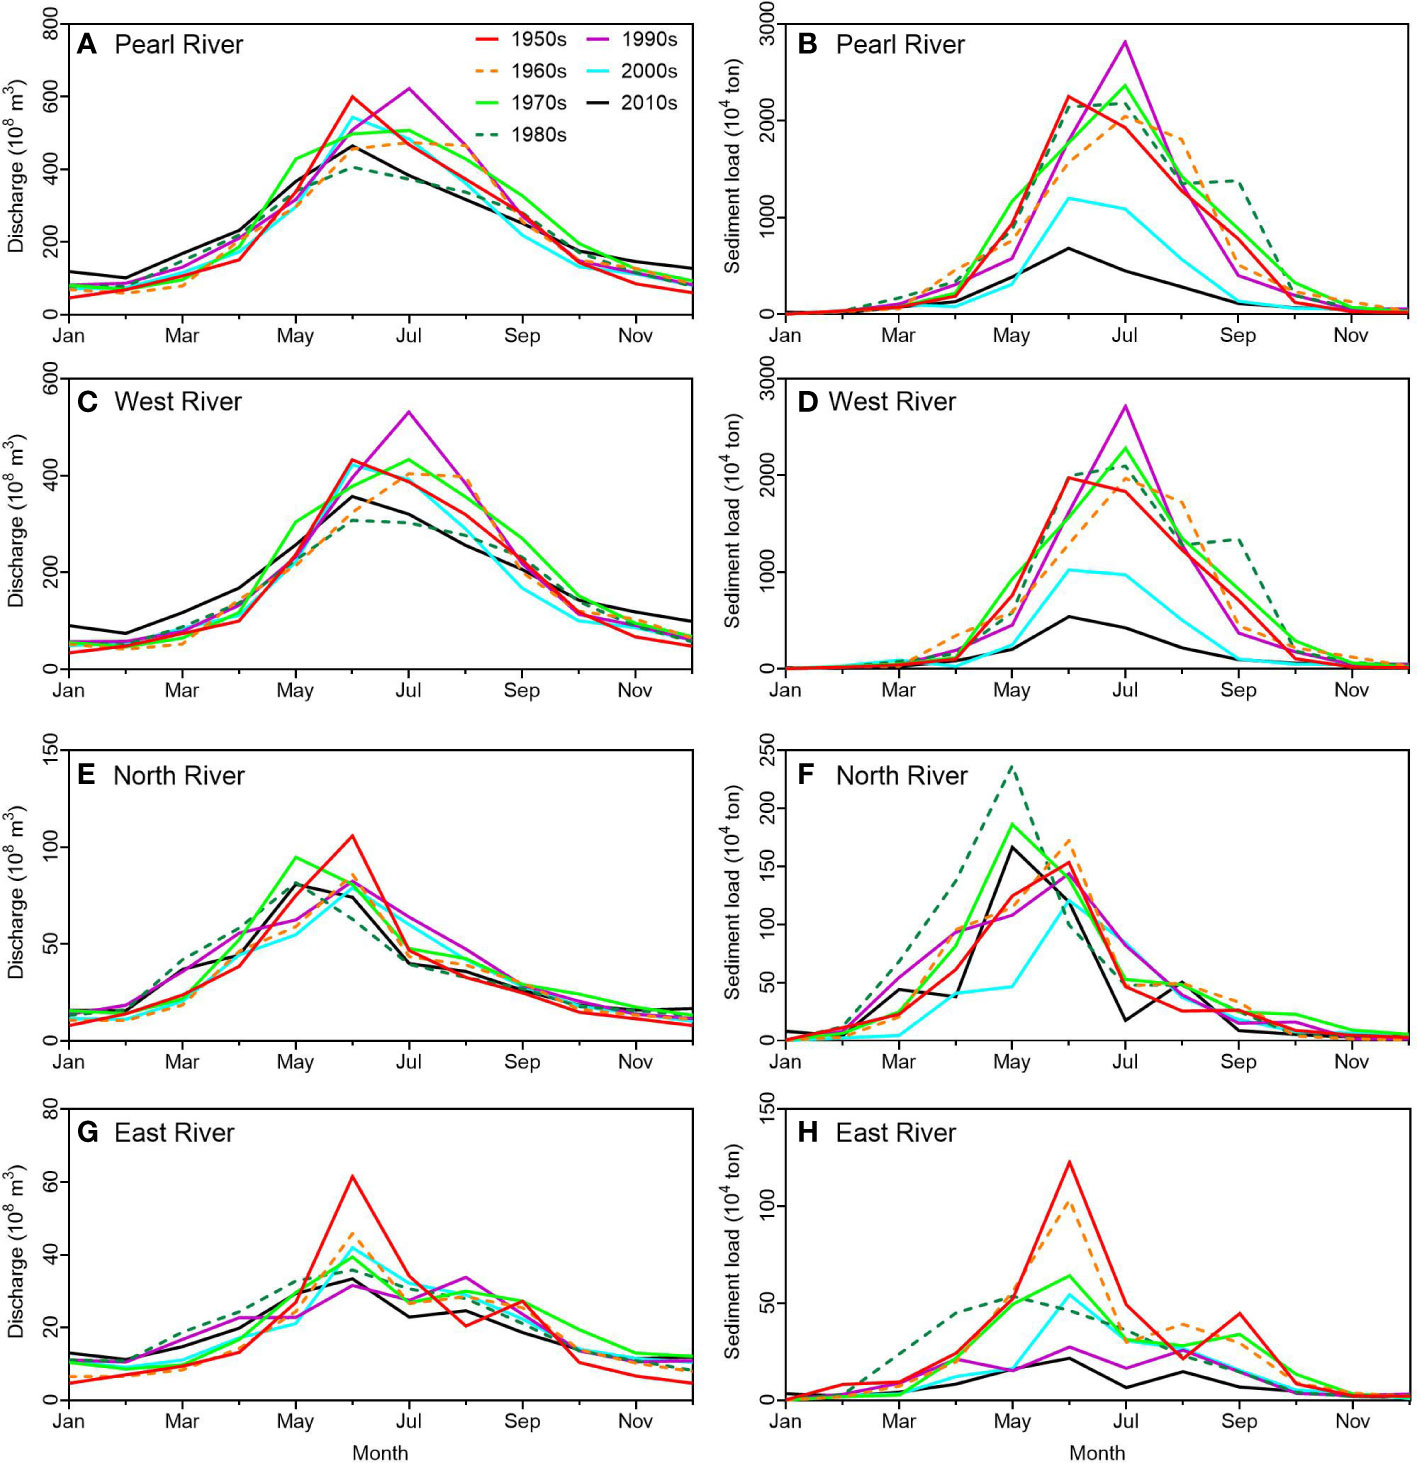
Figure 7 Temporal changes in the monthly distribution of discharge and sediment load in the Pearl River (A, E), West (B, F), North (C, G), and East (D, H) Rivers from the 1950s to the 2010s.
Discussion
Effects of precipitation and human activities on sediment regime
Numerous studies suggested that climate change (particularly, precipitation) plays an important role in temporal variations of water discharge and sediment load (van Vliet et al., 2013; Bajracharya et al., 2018; Liu et al., 2018b; Zheng et al., 2022). In the Pearl River Basin, water discharge levels fluctuate seasonally and are significantly influenced by the subtropical monsoon climate. Thus, the highest multi-year averages of monthly water discharge and sediment load occurred in the months of June-August, which is primarily attributed to precipitation fluctuations (Zhang et al., 2008; Wei et al., 2020). As shown in Figure 8A, the annual and seasonal water discharge is strongly correlated with precipitation in the Greater Bay Area from the 1960s to the 2010s (P< 0.05). However, there was no significant statistical correlation between annual and wet-season sediment load and precipitation in the Greater Bay Area from the 1960s to the 2010s (P > 0.05) (Figure 8B). On the contrary, the dry-season sediment load correlates well with precipitation in the Greater Bay Area during the 1960s-2010s (Figure 8B). These statistical analyses indicate that the inter-annual variations in the annual and seasonal water discharge in the Pearl River are mainly controlled by precipitation variability, while precipitation variability has little influence on sediment load. Changes in sediment load are greatly affected by other potential anthropogenic impacts, such as reservoirs/dam constructions, and land use change.
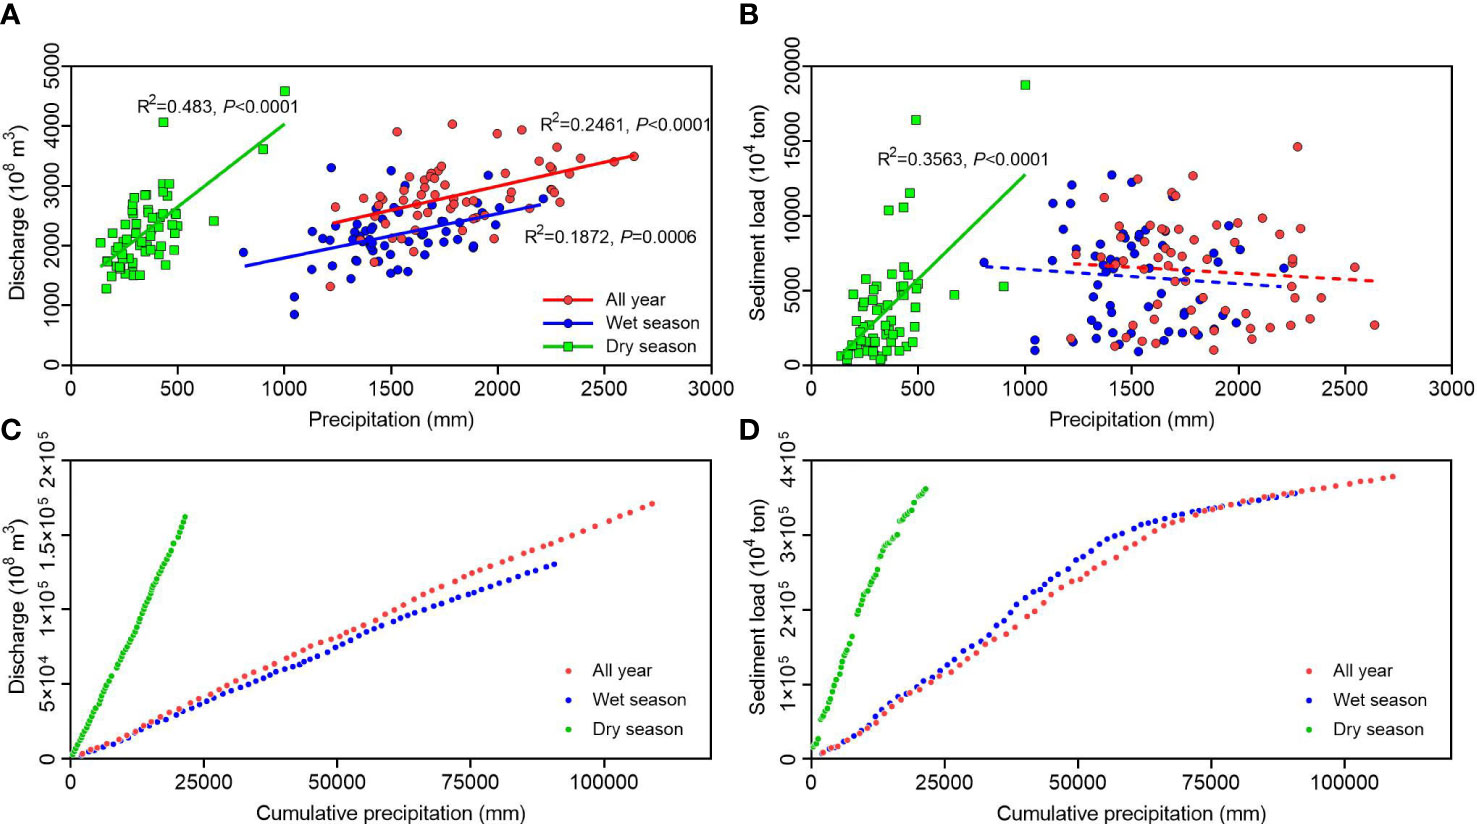
Figure 8 Correlation between annual and seasonal precipitation and discharge (A), sediment load (B) in the Pearl River from the 1960s to the 2010s. Solid lines denote significant correlations (P< 0.05), whereas dotted lines denote non-significant correlations. Plots of cumulative annual and seasonal precipitation versus cumulative discharge (C), and cumulative sediment load (D) in the Pearl River from the 1960s to the 2010s.
The double mass plots of the cumulative water discharge (or sediment load) against cumulative precipitation can assess the relative contributions of human activities and climate change. The double mass curve should be a straight line when there are no impacts from human activities, while there are some breaks in the double mass curves when the variations are not only affected by precipitation but also by human activities (Zhang and Lu, 2009; Liu et al., 2018b). The double mass plots of the cumulative annual and seasonal water discharge and the cumulative precipitation indicate that there was no significant anthropogenic impact on water discharge (Figure 8C). A slight increase in the dry-season discharge can be observed in the double mass plot, while slight decreases in the annual and wet-season discharge can be observed in the double mass plot (Figure 8C). However, significant decreases in the double mass plots of cumulative sediment load versus cumulative precipitation can be observed (Figure 8D), indicating that human activities (e.g. constructions of reservoirs/dams, afforestation) have become a dominant factor in sediment regime variability in recent decades. For the Pearl River, therefore, both this study and previous studies suggest that precipitation fluctuations were the major reason for temporal changes in the water discharge, however, human activities are greatly changing the sediment load (Dai et al., 2008; Wu et al., 2012).
In recent years, increasing studies suggest that upstream human activities, such as reservoirs or dam construction, deforestation and reforestation, have strongly affected water discharge and sediment input into the estuary (Ezcurra et al., 2019; Li et al., 2020; Wu et al., 2020). It is widely recognized that deforestation has accelerated denudation and soil erosion, resulting in an increase in sediment load (Veldkamp et al., 2020; Hu et al., 2021). Before the 1990s, the area of land under erosion expanded quickly in the Pearl River basin, with the area increasing from 41,100 km2 in the 1950s to 57,073 km2 in the 1990s (Xia, 1999; Pan, 2004). On the other hand, most of the large dams and reservoirs have been constructed during this period (Table 2). Thus, the sediment load and suspended sediment concentration remained relatively high in the Pearl River from the 1950s to the 1990s (Figure 4), which is attributed mainly to the offsetting impacts of dams and reservoirs construction on soil erosion (Liu et al., 2014). However, a series of water and soil conservation projects have been conducted to control the soil erosion in the Pearl river basin since the early 1990s. The water and soil conservation measures have slowed the increasing trend of eroded land area, which increased by only 30 km2 from 1995 to 2004 in the Pearl River basin (Liu et al., 2014). However, the sediment trapped by the reservoirs is substantial, and the total deposition rate has probably reached 600 Mt/a (Dai et al., 2008). Thus, the influence of reservoirs or dam construction exceeded the influence of deforestation and soil erosion after the 1990s. The decline of sediment load and suspended sediment concentration after the 1990s (Figure 4) are mainly attributable to sediment deposition in the reservoirs and the water and soil conservation projects in the Pearl River basin (Liu et al., 2018b). Due to the construction of more dams and reservoirs in the coming decades, the total storage capacities of the reservoirs are expected to increase in the Pearl River basin, which will result in a further decrease in sediment load into the Greater Bay Area (Wang et al., 2021).
Environmental response to alterations in sediment regime
For the Pearl River Estuary, a decrease in upstream sediment supply and sand dredging activities caused temporal changes in the river channel morphology (Wang et al., 2021). The cross-sectional profile in the Gaoyao station has deepened from 1990 to 2014, with an approximate 12 m increase in average water depth, indicating that scouring dominated in the profile during this period (Figure 9A). However, water depth in the channel geometry of the Gaoyao station shows an obvious decreasing trend from 2014 to 2020, indicating that siltation dominated in profile during this period (Figure 9A). For the Shijiao station in the North River, the cross-sectional profile has also become deeper from 2000 to 2013, but has a non-significant change trend from 2013 to 2020 (Figure 9B). Furthermore, the cross-sectional profile in the Boluo station (the East River) showed a non-significant change trend from 2010 to 2020, with a balance between erosion and deposition (Figure 9C), while previous studies found that it has become narrower and deeper from the 1960s to the 1980s (Liu et al., 2018b; Wang et al., 2021). Thus, both this study and previous studies indicate that scouring was dominant in channel of the Pearl River Estuary from the early 1990s, then reach a relatively stable or slight deposition state after 2010 or 2013 (Wang et al., 2021). In the Pearl River Estuary, large-scale excavations of sand began in the mid-1980s and boomed in the 1990s (Liu et al., 2018b; Wang et al., 2021). Meanwhile, reservoir and dam construction resulted in a reduction of the sediment load during this period (Table 2). Both activities have combined to cause a rapid increase in the channel water depth in this period. Since 2000, authorities began to control sand excavation activities in the Pearl River Estuary (Wang et al., 2021). However, due to the construction of new dams, the sediment load further decreased in the 2000s (Figure 4), resulting in a continuous increase in water depth of three cross-sectional profiles. In the last ten years, a relatively stable sediment load (Table 4) and prohibited sand excavation activities have resulted in a relatively stable river channel morphology (Figure 9).
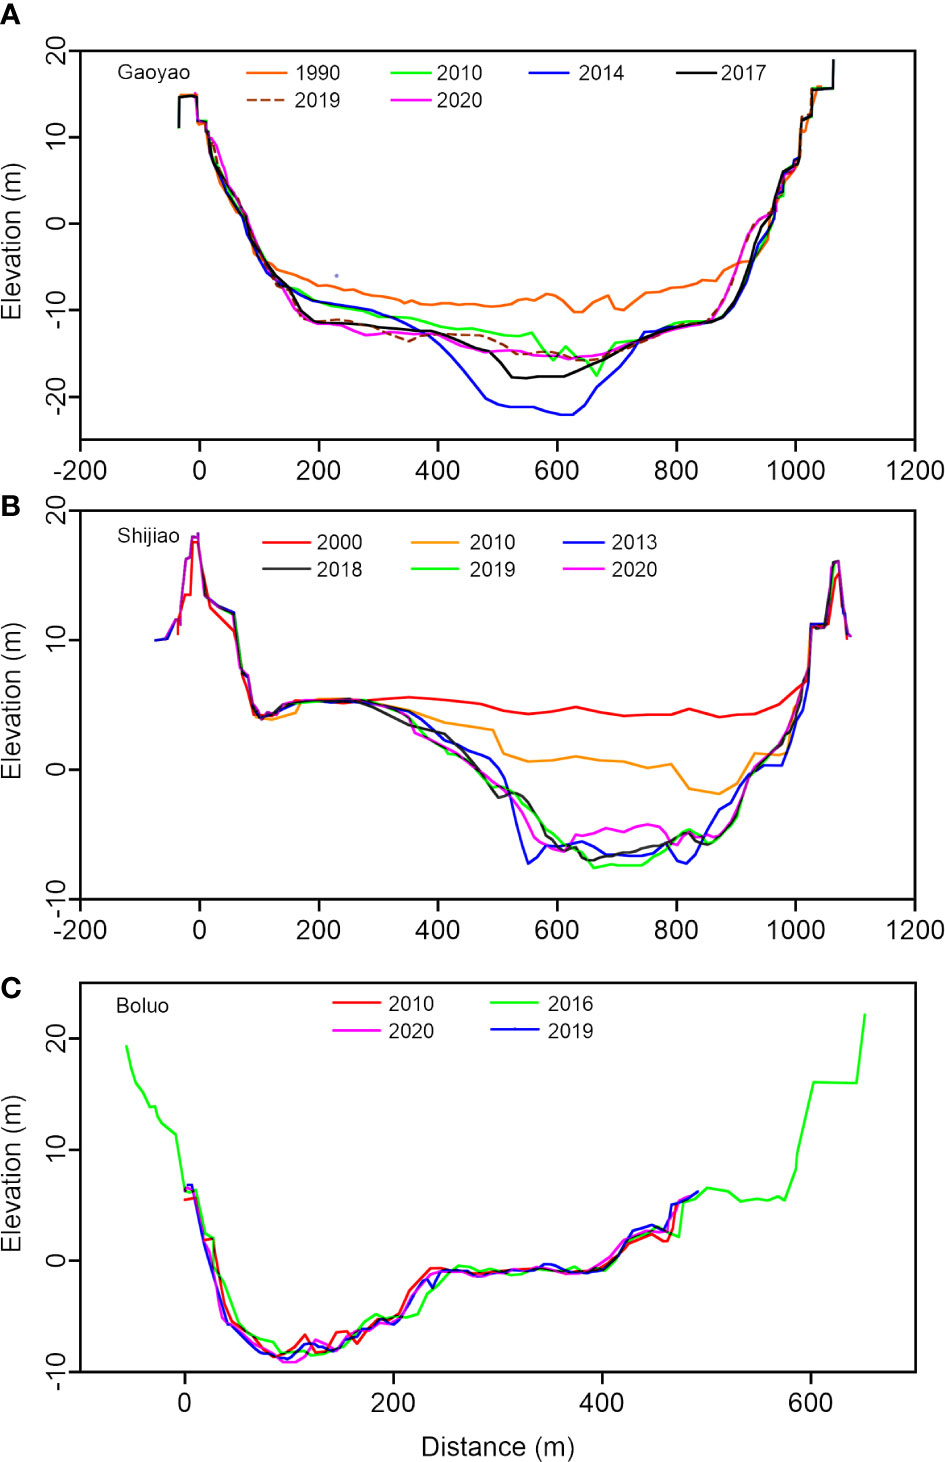
Figure 9 Temporal changes in bottom elevation of cross-sectional profiles in the Gaoyao (A), Shijiao (B), and Boluo (C) stations.
In recent decades, saltwater intrusion has been the main issue under the influences of both anthropogenic activities and natural forces, e.g. reduced upstream discharge and rising sea levels (Yuan et al., 2015; Liu et al., 2019; Eslami et al., 2021). The duration with salinity exceeding the recommended salinity threshold is an important index to evaluate saltwater intrusion. According to the National Hygienic Standard for Drinking Water (GB 5749-2006) in China, the 250-mg/L isohaline is defined as the recommended salinity threshold value of river water for drinking purposes. Severe saltwater intrusion in the Pearl River Estuary has tremendously affected surface water and groundwater quality, and changed the biodiversity of terrestrial and aquatic communities (Long et al., 2013; Wang and Hong, 2021). From 2009 to 2020, a total of 68 saltwater intrusion events occurred in the Pearl River Estuary, with an average of 5.67 per year (Figure 10A). The annual frequency of saltwater intrusion in the Pearl River Estuary was highest in 2010, with a total of 14 events (Figure 10A). The annual duration of saltwater intrusion varied over years, with an average of 59 days per year during 2009-2020 (Figure 10A). Generally, saltwater intrusion started between September and October each year and ended between March and April of the following year. From 2009 to 2020, saltwater intrusion in the Pearl River Estuary mainly occurred between October and March (Figure 10B). Both this study and previous studies indicate that the frequency and duration of saltwater intrusion did not display a decreasing trend (Liu et al., 2019; Wang et al., 2020), even though river discharges in the dry-season increased during this period (Figure 6). Except for the reduction in freshwater flow upstream, the increasingly severe saltwater intrusion can also be attributed to uneven sand dredging, more frequent northeasterly wind, rising tides and channel evolution (Li et al., 2019).
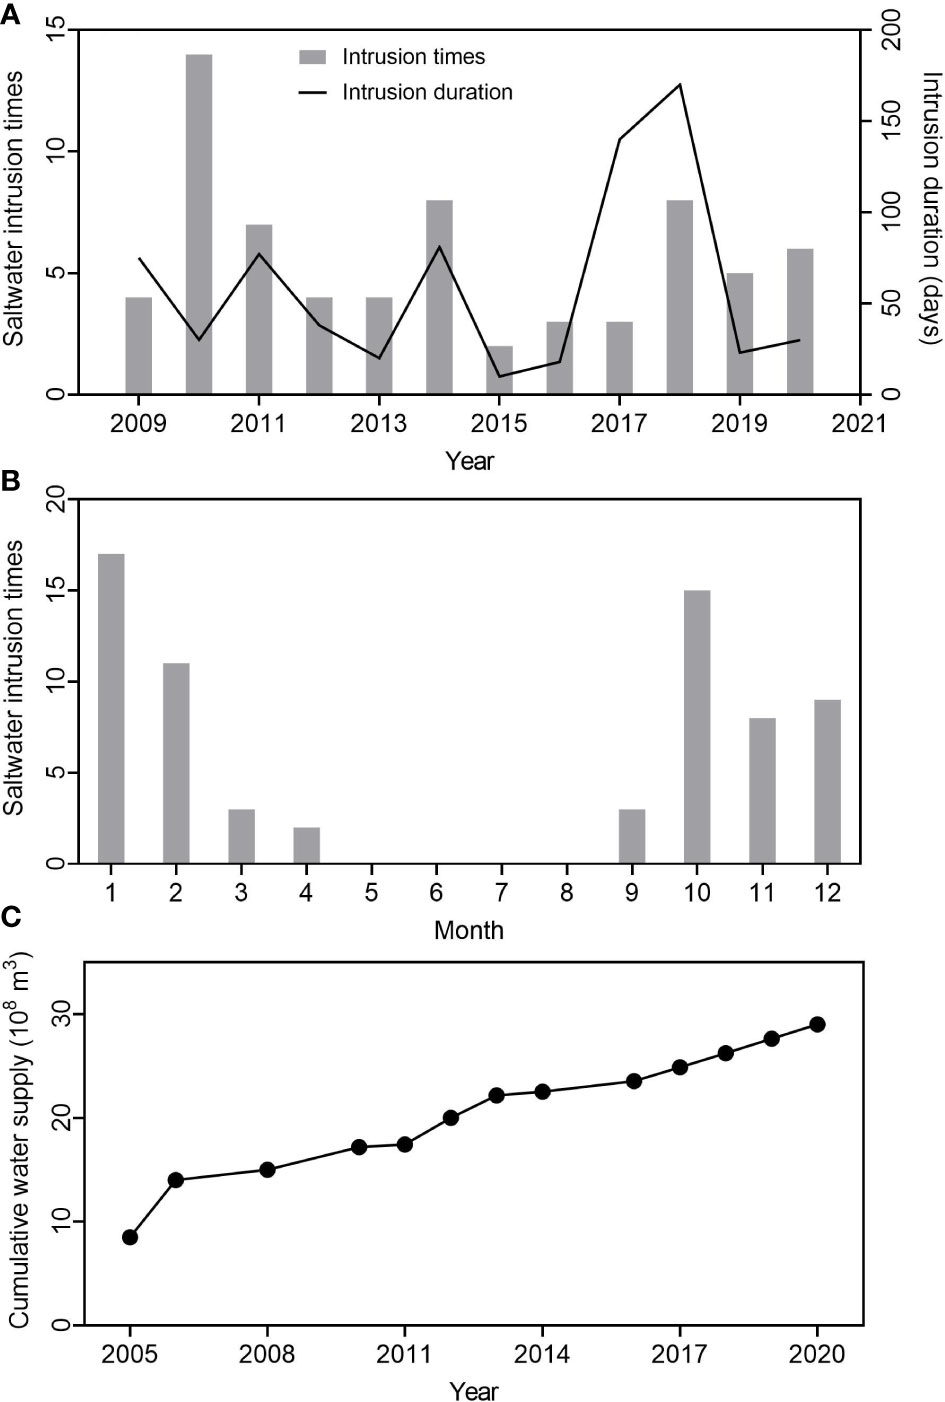
Figure 10 Saltwater intrusion events and duration (A), and multi-year cumulative monthly distribution of saltwater intrusion (B) in the Pearl River Estuary from 2009 to 2020. Temporal changes in the cumulative water supply to the Pearl River Estuary in the dry season from 2005 to 2020 (C).
Implications for sustainable development
Based on the above discussion, we found that precipitation variability was responsible for the long-term changes in the annual, seasonal, and monthly water discharge; however, human activities (e.g. dam construction and land use changes) exerted a significant influence on the variability in sediment load. The sediment load and suspended sediment concentration in the Greater Bay Area have drastically decreased since the mid-1980s. Changes in water discharge and sediment load have exerted substantial influences on downstream river channels and delta environments in the Greater Bay Area. For example, severe saltwater intrusion has occurred in the Greater Bay Area in recent years. The management of the discharge and sediment regime is not only related to flood control and disaster mitigation, but also related to the protection of coastal ecosystems and safe water supply for the Great Bay Area, such as for the cities of Zhuhai and Macao. For the sustainable development of the Greater Bay Area, thus, we recommend that restoration and management of the Greater Bay Area should be planned at the watershed scale. The watershed-based solution, incorporating river basin regulation in estuarine management and restoration, was able to address the mismatch between ecological drivers at the watershed scale and local restoration efforts at the estuary scale (Sayles and Baggio, 2017; Liu et al., 2021b). The watershed-based solution has been implemented in many estuaries (Cui et al., 2009; Dunn and Minderhoud, 2022), such as artificial channel diversions in the Mississippi River Delta, USA (Day et al., 2007; Paola et al., 2011), and the water-sediment regulation scheme in the Yellow River Estuary, China (Cui et al., 2009).
In the Pearl River Basin, integrated water resources management has been carried out to mitigate the effects of saltwater intrusion in the Great Bay Area since 2005 (The Central People’s Government of the People’s Republic of China, 2006). According to the Pearl River Basin water resources comprehensive plans, the joint optimal operation of upstream key reservoirs (e.g. the Tianshengqiao, Longtan, Dajingshan, Fenghuangshan and Baise reservoirs) in the West, North and East Rivers can increase the discharge and enhance the runoff in the dry season, thus preventing saltwater intrusion and guaranteeing drinking water safety of Macao and Zhuhai in the Great Bay Area (The Pearl River Water Resources Commission of the Ministry of Water Resources, 2015). The cumulative extra freshwater supplied to the Great Bay Area in the dry season reached approximately 30 × 108 m3 during 2005-2020 (Figure 10C), which contributed to the increase in water discharge during the dry season (Figure 5). The method of increasing the freshwater flow in the dry season not only ensures freshwater supply, but is also of great significance for coastal environments. For example, freshwater from rivers plays a critical role in the regulation of phytoplankton biomass, primary production, microbial community structure and water quality in the Great Bay Area (Fan et al., 2012; Zhou et al., 2016; Li et al., 2017; Sarkar et al., 2021). However, the effect of reservoir management for saltwater mitigation and freshwater supplement to coastal ecosystems remains relatively poorly understood. In the Great Bay Area, the water discharge and sediment load were also influenced by the redistribution of the water and the sediment at Sixianjiao channel (Figure 1). The changes in the divided flow ratio and the divided sediment ratio between Gaoyao and Shijiao stations have affected the hydrological process in the Great Bay Area (Liu et al., 2014). Therefore, Changes in the redistribution of water discharge and sediment load at Sixianjiao channel, optimal allocation of freshwater resources, and real-time optimal dispatching of water deserve further research (Liu et al., 2014; Liu et al., 2018a; Chang et al., 2020; Wohner et al., 2022).
The watershed-based solution not only focused on the quantity of water supply, but also on the quality of water. Excessive anthropogenic nutrient loading in the Pearl River has contributed to the expansion of coastal eutrophication and hypoxic zones in the Great Bay Area (Cui et al., 2019; Geeraert et al., 2021; Yu et al., 2021). Nutrient management strategy at the watershed scale is a promising way to protect and restore coastal ecosystems. For example, submerged aquatic vegetation communities in the Chesapeake Bay have been successfully restored after reducing the inputs of in situ nutrients (Ruhl and Rybicki, 2010; Lefcheck et al., 2018). Furthermore, sediment availability is an important factor controlling the morphological evolution and shoreline protection (Langston et al., 2020; Yang et al., 2020; Liu et al., 2021a), and it is thus essential to the sustainable development of the Greater Bay Area. Due to the dramatic reduction in sediment load, sediment supply and its transport pathways and budgets should be integrated into the watershed-based solution. In addition, hydrological connectivity of the river network is an important aspect of drinking water supply, flood prevention and ecological security (Cui et al., 2012; Cui et al., 2015; Shao et al., 2020). The major flow paths and critical confluences of the river networks in the Greater Bay Area are important for aquatic and terrestrial communities, saltwater intrusion and water quality management (Cui et al., 2015; Niu et al., 2021). Therefore, the water system and the river network should be protected for the sustainable development of the Greater Bay Area in the future.
Conclusions
This study reveals temporal changes in the sediment regime of the Pearl River at different time scales from the 1950s to 2020, and examines climatic and anthropogenic influences on water discharge and sediment load. The annual water discharge in the Pearl River as well as its major tributaries displays a slightly increasing trend, while the annual sediment load and SSC in the West and East Rivers exhibit a drastically decreasing trend. Sediment load and SSC reached a conspicuous peak in the 1980s in the Pearl River, and showed a significant decline starting in the 2000s and 1990s, respectively. At the seasonal scale, the wet-season water discharge is relatively constant, but the dry-season discharge shows a significant increasing trend, and the ratio of wet-season to dry-season also decreases. The wet-season sediment load decreases, while the dry-season sediment load and the ratio of wet-season to dry-season do not display any trend. At the monthly scale, differences were observed in sediment regime changes among the three tributaries, and the flood seasons in the North and East Rivers typically occur one month earlier than that in the West River due to the different precipitation regimes in each watershed. The long-term changes in the annual, seasonal, and monthly water discharge were mainly caused by precipitation variability; however, human activities (e.g. dam construction and land use changes) exerted a significant influence on the variations of sediment load. Alterations of the sediment regime have exerted substantial influences on downstream channel morphology and saltwater intrusion in the Greater Bay Area. Reduced sediment load and sand excavations have combined to cause a rapid increase in the channel water depth. Salt intrusion can be partly attributed to reduced water discharge. Finally, we suggest that the watershed-based solution, incorporating river basin regulation in estuarine management and restoration, should be carried out for the sustainable development of the Greater Bay Area.
Data availability statement
The data analyzed in this study is subject to the following licenses/restrictions: The data that support the findings of this study are available from the corresponding author upon reasonable request. Requests to access these datasets should be directed to BC,cuibs@bnu.edu.cn.
Author contributions
ZL, Conceptualization, Data collection, Formal analysis, Software, Writing - original draft, Writing - review and editing. SF, Supervision, Conceptualization, Writing - review and editing. CH, Data collection of precipitation. BC, Supervision, Conceptualization, Writing - original draft, Writing - review and editing. All authors contributed to the article and approved the submitted version.
Funding
This project was financially supported by the Key Project of the National Natural Science Foundation of China (U1901212, 51639001), and the Fund for Innovative Research Group of the National Natural Science Foundation of China (51721093). SF was supported by the USA National Science Foundation award 1637630 (PIE LTER) and 1832221 (VCR LTER). X. L. was supported by the National Natural Science Foundation of China (42206170) and the Guangdong Basic and Applied Basic Research Foundation (2021A1515110830).
Conflict of interest
The authors declare that the research was conducted in the absence of any commercial or financial relationships that could be construed as a potential conflict of interest.
Publisher’s note
All claims expressed in this article are solely those of the authors and do not necessarily represent those of their affiliated organizations, or those of the publisher, the editors and the reviewers. Any product that may be evaluated in this article, or claim that may be made by its manufacturer, is not guaranteed or endorsed by the publisher.
References
Bajracharya A. R., Bajracharya S. R., Shrestha A. B., BikashMaharjan S. (2018). Climate change impact assessment on the hydrological regime of the kaligandaki basin, Nepal. Sci. Total Environ. 625, 837–848. doi: 10.1016/j.scitotenv.2017.12.332
Best J. (2018). Anthropogenic stresses on the world’s big rivers. Nat. Geosci. 12 (1), 7–21. doi: 10.1038/s41561-018-0262-x
Bracken L. J., Wainwright J., Ali G. A., Tetzlaff D., Smith M. W., Reaney S. M., et al. (2013). Concepts of hydrological connectivity: Research approaches, pathways and future agendas. Earth. Sci. Rev. 119, 17–34. doi: 10.1016/j.earscirev.2013.02.001
Chang I. S., Zhao M., Chen Y., Guo X., Zhu Y., Wu J., et al. (2020). Evaluation on the integrated water resources management in china’s major cities-based on city blueprint® approach. J. Clean. Prod. 262, 121410. doi: 10.1016/j.jclepro.2020.121410
Chen X., Zong Y., Zhang E., Xu J. G., Li S. J. (2001). Human impacts on the changjiang (Yangtze) river basin, China, with special reference to the impacts on the dry season water discharges into the sea. Geomorphology 41, 111–123. doi: 10.1016/S0169-555X(01)00109-X
Cui B., Shao X., Zhang Z. (2015). Assessment of flow paths and confluences for saltwater intrusion in a deltaic river network. Hydrol. Process. 29 (20), 4549–4558. doi: 10.1002/hyp.10521
Cui Y., Wu J., Ren J., Xu J. (2019). Physical dynamics structures and oxygen budget of summer hypoxia in the pearl river estuary. Limnol. Oceanogr. 64 (1), 131–148. doi: 10.1002/lno.11025
Cui B., Yang Q., Yang Z., Zhang K. (2009). Evaluating the ecological performance of wetland restoration in the yellow river delta, China. Ecol. Eng. 35 (7), 1090–1103. doi: 10.1016/j.ecoleng.2009.03.022
Cui B., Zhang Z., Lei X. (2012). Implementation of diversified ecological networks to strengthen wetland conservation. Clean - Soil Air Water 40 (10), 1015–1026. doi: 10.1002/clen.201200026
Dai Z. J., Fagherazzi S., Mei X. F., Gao J. J. (2016). Decline in suspended sediment concentration delivered the changjiang (Yangtze) river into the East China Sea between 1956 and 2013. Geomorphology 268, 123–132. doi: 10.1016/j.geomorph.2016.06.009
Dai S. B., Yang S. L., Cai A. M. (2008). Impacts of dams on the sediment flux of the pearl river, southern China. Catena 76, 36–43. doi: 10.1016/j.catena.2008.08.004
Day J. W. Jr., Boesch D. F., Clairain E. J., Kemp G. P., Laska S. B., Mitsch W. J., et al. (2007). Restoration of the Mississippi delta: lessons from hurricanes Katrina and Rita. Science 315 (5819), 1679–1684. doi: 10.1126/science.1137030
Dethier E. N., Renshaw C. E., Magilligan F. J. (2022). Rapid changes to global river suspended sediment flux by humans. Science 376 (6600), 1447–1452. doi: 10.1126/science.abn7980
Dunn F. E., Minderhoud P. S. J. (2022). Sedimentation strategies provide effective but limited mitigation of relative sea-level rise in the Mekong delta. Commun. Earth Environ. 3, 2. doi: 10.1038/s43247-021-00331-3
Eslami S., Hoekstra P., Minderhoud P. S. J., Trung N. N., Hoch J. M., Sutanudjaja E. H., et al. (2021). Projections of salt intrusion in a mega-delta under climatic and anthropogenic stressors. Commun. Earth Environ. 2, 142. doi: 10.1038/s43247-021-00208-5
Ezcurra E., Barrios E., Ezcurra P., Ezcurra A., Vanderplank S., Vidal O., et al. (2019). A natural experiment reveals the impact of hydroelectric dams on the estuaries of tropical rivers. Sci. Adv. 5 (3), eaau9875. doi: 10.1126/sciadv.aau9875
Fan X., Cui B., Zhang K., Zhang Z., Shao H. (2012). Water quality management based on division of dry and wet seasons in pearl river delta, China. Clean - Soil Air Water 40 (4), 381–393. doi: 10.1002/clen.201100123
Geeraert N., Archana A., Xu M. N., Kao S. J., Baker D. M., Thibodeau B. (2021). Investigating the link between pearl river-induced eutrophication and hypoxia in Hong Kong shallow coastal waters. Sci. Total Environ. 772, 145007. doi: 10.1016/j.scitotenv.2021.145007
Hu X., Næss J. S., Iordan C. M., Huang B., Zhao W., Cherubini F. (2021). Recent global land cover dynamics and implications for soil erosion and carbon losses from deforestation. Anthropocene 34, 100291. doi: 10.1016/j.ancene.2021.100291
Khan M. Y. A. (2018). “Spatial variation in the grain size characteristics of sediments in ramganga river, ganga basin, India,” in Handbook of environmental materials management. Ed. Hussain C. (Cham: Springer). doi: 10.1007/978-3-319-58538-3_50-1
Khan M. Y. A., Daityari S., Chakrapani G. J. (2016). Factors responsible for temporal and spatial variations in water and sediment discharge in ramganga river, ganga basin, India. Environ. Earth Sci. 75, 283. doi: 10.1007/s12665-015-5148-2
Langston A. K., Durán Vinent O., Herbert E. R., Kirwan M. L. (2020). Modeling long-term salt marsh response to sea level rise in the sediment-deficient plum island estuary, MA. Limnol. Oceanogr. 65 (9), 2142–2157. doi: 10.1002/lno.11444
Lefcheck J. S., Orth R. J., Dennison W. C., Wilcox D. J., Murphy R. R., Keisman J., et al. (2018). Long-term nutrient reductions lead to the unprecedented recovery of a temperate coastal region. Proc. Natl. Acad. Sci. U.S.A. 115 (14), 3658–3662. doi: 10.1073/pnas.1715798115
Li J., Jiang X., Jing Z., Li G., Chen Z., Zhou L., et al. (2017). Spatial and seasonal distributions of bacterioplankton in the pearl river estuary: The combined effects of riverine inputs, temperature, and phytoplankton. Mar. pollut. Bull. 125 (1-2), 199–207. doi: 10.1016/j.marpolbul.2017.08.026
Li L., Ni J., Chang F., Yue Y., Frolova N., Magritsky D., et al. (2020). Global trends in water and sediment fluxes of the world’s large rivers. Sci. Bull. 65 (1), 62–69. doi: 10.1016/j.scib.2019.09.012
Liu Z., Fagherazzi S., Cui B. (2021a). Success of coastal wetlands restoration is driven by sediment availability. Commun. Earth Environ. 2 (1), 1–9. doi: 10.1038/s43247-021-00117-7
Liu Z., Fagherazzi S., Li J., Cui B. (2021b). Mismatch between watershed effects and local efforts constrains the success of coastal salt marsh vegetation restoration. J. Clean. Prod. 292, 126103. doi: 10.1016/j.jclepro.2021.126103
Liu Z., Fagherazzi S., Ma X., Xie C., Li J., Cui B. (2020). Consumer control and abiotic stresses constrain coastal saltmarsh restoration. J. Environ. Manage. 274, 111110. doi: 10.1016/j.jenvman.2020.111110
Liu F., Hu S., Guo X., Luo X., Cai H., Yang Q. (2018b). Recent changes in the sediment regime of the pearl river (South china): Causes and implications for the pearl river delta. Hydrol. Process. 32 (12), 1771–1785. doi: 10.1002/hyp.11513
Liu B., Peng S., Liao Y., Long W. (2018a). The causes and impacts of water resources crises in the pearl river delta. J. Clean. Prod. 177, 413–425. doi: 10.1016/j.jclepro.2017.12.203
Liu B., Peng S., Liao Y., Wang H. (2019). The characteristics and causes of increasingly severe saltwater intrusion in pearl river estuary. Estuar. Coast. Shelf Sci. 220, 54–63. doi: 10.1016/j.ecss.2019.02.041
Liu F., Yuan L. R., Yang Q. S., Ou S. Y., Xie L. L., Cui X. (2014). Hydrological responses to the combined influence of diverse human activities in the pearl river delta, China. Catena 113, 41–55. doi: 10.1016/j.catena.2013.09.003
Li W. S., Zuo C. S., Wang H., Dong J. X., Gao T., Pan S., et al. (2019). Salt tide intrusion characteristics in main estuaries of China. Mar. Sci. Bull. 38, 650–655. doi: 10.11840/j.issn.1001-6392.2019.06.006
Long A., Sun L., Shi R., Zhou W., Dang A. (2013). Saltwater intrusion induced by a complete neap tide and its effect on nutrients variation in the estuary of pearl river, China. J. Coast. Res. 29 (5), 1158–1168. doi: 10.2112/JCOASTRES-D-12-00182.1
Mann H. B. (1945). Nonparametric tests against trend. Econometric. J. Econometric Soc 13, 245–259. doi: 10.2307/1907187
Matiatos I., Wassenaar L. I., Monteiro L. R., Venkiteswaran J. J., Gooddy D. C., Boeckx P., et al. (2021). Global patterns of nitrate isotope composition in rivers and adjacent aquifers reveal reactive nitrogen cascading. Commun. Earth Environ. 2, 52. doi: 10.1038/s43247-021-00121-x
Meiggs D., Taillefert M. (2011). The effect of riverine discharge on biogeochemical processes in estuarine sediments. Limnol. Oceanogr. 56 (5), 1797–1810. doi: 10.4319/lo.2011.56.5.1797
Ministry of Water Conservancy and Electric Power (1962). PRC National standards for hydrological survey Vol. vol. 1-7 (Beijing: China Industry Press).
Ministry of Water Conservancy and Electric Power (1975). PRC Handbook for hydrological survey Vol. vol. 1-3 (Beijing: Water Conservancy and Electric Power Press).
Nilsson C., Reidy C. A., Dynesius M., Revenga C. (2005). Fragmentation and flow regulation of the world's large river systems. Science 308 (5720), 405–408. doi: 10.1126/science.1107887
Niu L., Cai H., Jia L., Luo X., Tao W., Dong Y., et al. (2021). Metal pollution in the pearl river estuary and implications for estuary management: The influence of hydrological connectivity associated with estuarine mixing. Ecotox. Environ. Safe. 225, 112747. doi: 10.1016/j.ecoenv.2021.112747
Önöz B., Bayazit M. (2003). The power of statistical tests for trend detection. Turkish. J. Eng. Environ. Sci. 27, 247–251. doi: 10.3906/sag-1205-120
Pan J. H. (2004). Review and expectation of water and soil conservation in guangxi. Guangxi Water Resour. Hydropower Eng. 5, 47–49. doi: 10.3969/j.issn.1003-1510.2004.z2.014
Paola C., Twilley R. R., Edmonds D. A., Kim W., Mohrig D., Parker G. (2011). Natural processes in delta restoration: Application to the Mississippi delta. Annu. Rev. Mar. Sci. 3, 67–91. doi: 10.1146/annurev-marine-120709-142856
Pringle C. M., Costa-Broseta Á., Castillo M. C., Spoel S. (2001). Hydrologic connectivity and the management of biological reserves: a global perspective. Ecol. Appl. 11, 981–998. doi: 10.1890/1051-0761(2001)011[0981:HCATMO]2.0.CO;2
Pringle C. (2003). What is hydrologic connectivity and why is it ecologically important? Hydrol. Process. 17 (13), 2685–2689. doi: 10.1002/hyp.5145
Regnier P., Resplandy L., Najjar R. G., Ciais P. (2022). The land-to-ocean loops of the global carbon cycle. Nature 603 (7901), 401–410. doi: 10.1038/s41586-021-04339-9
Ruhl H. A., Rybicki N. B. (2010). Long-term reductions in anthropogenic nutrients link to improvements in Chesapeake bay habitat. Proc. Natl. Acad. Sci. U.S.A. 107 (38), 16566–16570. doi: 10.1073/pnas.1003590107
Sarkar B., Islam A., Das B. C. (2021). Role of declining discharge and water pollution on habitat suitability of fish community in the mathabhanga-churni river, India. J. Clean. Prod. 326, 129426. doi: 10.1016/j.jclepro.2021.129426
Sayles J. S., Baggio J. A. (2017). Social–ecological network analysis of scale mismatches in estuary watershed restoration. Proc. Natl. Acad. Sci. U.S.A. 114 (10), E1776–E1785. doi: 10.1073/pnas.1604405114
Serrano V. L., Mateos V. L., Garcia J. A. (1999). Trend analysis of monthly precipitation over the Iberian peninsula for the period 1921-1995. Phys. Chem. Earth. Pt. B 24 (2), 85–90. doi: 10.1016/S1464-1909(98)00016-1
Shao X., Fang Y., Cui B. (2020). A model to evaluate spatiotemporal variations of hydrological connectivity on a basin-scale complex river network with intensive human activity. Sci. Total Environ. 723, 138051. doi: 10.1016/j.scitotenv.2020.138051
Singh N., Khan M. Y. A. (2020). ANN modeling of the complex discharge-sediment concentration relationship in bhagirathi river basin of the himalaya. sustain. Water Resour. Manage. 6, 36. doi: 10.1007/s40899-020-00396-6
Syvitski J. P. M., Kettner A. J., Overeem I., Hutton E. W. H., Hannon M. T., Brankenridge G. R., et al. (2009). Sinking deltas due to human activities. Nat. Geosci. 2, 681–686. doi: 10.1038/ngeo629
Tan C., Huang B. S., Liu K. S., Chen H., Liu F., Qiu J., et al. (2017). Using the wavelet transform to detect temporal variations in hydrological processes in the pearl river, China. Quat. Int. 440, 52–63. doi: 10.1016/j.quaint.2016.02.043
The Central People’s Government of the People’s Republic of China (2006). Available at: http://www.gov.cn/govweb/yjgl/2006-01/10/content_152547.htm.
The Pearl River Water Resources Commission of the Ministry of Water Resources (2015) Comprehensive planning for the pearl river basin, (2012-2030). Available at: http://www.pearlwater.gov.cn/zwgkcs/slghn/201903/t20190305_91390.html.
van Vliet M. T., Franssen W. H., Yearsley J. R., Ludwig F., Haddeland I., Lettenmaier D. P., et al. (2013). Global river discharge and water temperature under climate change. Global Environ. Change 23 (2), 450–464. doi: 10.1016/j.gloenvcha.2012.11.002
Veldkamp E., Schmidt M., Powers J. S., Corre M. D. (2020). Deforestation and reforestation impacts on soils in the tropics. Nat. Rev. Earth Env. 1 (11), 590–605. doi: 10.1038/s43017-020-0091-5
Wang H., Bi N., Saito Y., Wang Y., Sun X., Zhang J., et al. (2010). Recent changes in sediment delivery by the huanghe (Yellow river) to the sea: Causes and environmental implications in its estuary. J. Hydrol. 391 (3-4), 302–313. doi: 10.1016/j.jhydrol.2010.07.030
Wang Y. H., Cai S. L., Yang Y. D., Zhong Z. Y., Liu F. (2021). Morphological consequences of upstream water and sediment changes and estuarine engineering activities in pearl river estuary channels over the last 50 years. Sci. Total Environ. 765, 144172. doi: 10.1016/j.scitotenv.2020.144172
Wang S., Fu B., Piao S., Lü Y., Ciais P., Feng X., et al. (2016). Reduced sediment transport in the yellow river due to anthropogenic changes. Nat. Geosci. 9 (1), 38–41. doi: 10.1038/NGEO2602
Wang J., Hong B. (2021). Threat posed by future Sea-level rise to freshwater resources in the upper pearl river estuary. J. Mar. Sci. Eng. 9 (3), 291. doi: 10.3390/jmse9030291
Wang H., Li W., Zuo C., Dong J., Li C., Xu H., et al. (2020). Saltwater intrusion in the pearl river estuary (China): Variation characteristics and cause analysis. J. Coast. Res. 36 (6), 1145–1153. doi: 10.2112/JCOASTRES-D-19-00130.1
Wei X., Cai S., Ni P., Zhan W. (2020). Impacts of climate change and human activities on the water discharge and sediment load of the pearl river, southern China. Sci. Rep. 10 (1), 1–11. doi: 10.1038/s41598-020-73939-8
Wohner P. J., Duarte A., Wikert J., Cavallo B., Zeug S. C., Peterson ,. J. T. (2022). Integrating monitoring and optimization modeling to inform flow decisions for Chinook salmon smolts. Ecol. Model. 471, 110058. doi: 10.1016/j.ecolmodel.2022.110058
Wu J., Gao X. J., Giorgi F., Chen D. L. (2017). Changes of effective temperature and cold/hot days in late decades over China based on a high resolution gridded observation dataset. Int. J. Climatol. 37 (S1), 788–800. doi: 10.1002/joc.5038
Wu C., Yang S., Huang S., Wang S. (2014). Multi-scale variability of water discharge and sediment load in the pearl river during 1954-2011. Acta Geograph. Sin. 69 (3), 422–432. doi: 10.11821/dlxb201403013
Wu C. S., Yang S. L., Lei ,. Y. P. (2012). Quantifying the anthropogenic and climatic impacts on water discharge and sediment load in the pearl river (Zhujiang), China, (1954-2009). J. Hydrol. 452, 190–204. doi: 10.1016/j.jhydrol.2012.05.064
Wu Z., Zhao D., Syvitski J. P., Saito Y., Zhou J., Wang M. (2020). Anthropogenic impacts on the decreasing sediment loads of nine major rivers in China 1954-2015. Sci. Total Environ. 739, 139653. doi: 10.1016/j.scitotenv.2020.139653
Xia H. P. (1999). Flood disasters, soil erosion, and eco-restoration of vegetation in the Yangtze and the pearl river valleys. Trop. Geogr. 19 (2), 124–130. doi: 10.3969/j.issn.1001-5221.1999.02.005
Xu K., Milliman J. D. (2009). Seasonal variations of sediment discharge from the Yangtze river before and after impoundment of the three gorges dam. Geomorphology 104 (3-4), 276–283. doi: 10.1016/j.geomorph.2008.09.004
Yakushev E., Gebruk A., Osadchiev A., Pakhomova S., Lusher A., Berezina A., et al. (2021). Microplastics distribution in the Eurasian Arctic is affected by Atlantic waters and Siberian rivers. Commun. Earth Environ. 2, 23. doi: 10.1038/s43247-021-00091-0
Yang S. L., Luo X., Temmerman S., Kirwan M., Bouma T., Xu K., et al. (2020). Role of delta-front erosion in sustaining salt marshes under sea-level rise and fluvial sediment decline. Limnol. Oceanogr. 65 (9), 1990–2009. doi: 10.1002/lno.11432
Yang S. L., Xu K. H., Milliman J. D., Yang H. F., Wu C. S. (2015). Decline of Yangtze river water and sediment discharge: Impact from natural and anthropogenic changes. Sci. Rep. 5 (1), 1–14. doi: 10.1038/srep12581
Yuan R., Zhu J., Wang B. (2015). Impact of sea-level rise on saltwater intrusion in the pearl river estuary. J. Coast. Res. 31 (2), 477–487. doi: 10.2112/JCOASTRES-D-13-00063.1
Yu L., Gan J., Dai M., Hui C. R., Lu Z., Li D. (2021). Modeling the role of riverine organic matter in hypoxia formation within the coastal transition zone off the pearl river estuary. Limnol. Oceanogr. 66 (2), 452–468. doi: 10.1002/lno.11616
Zhang X., Fichot C. G., Baracco C., Guo R., Neugebauer S., Bengtsson Z., et al. (2020). Determining the drivers of suspended sediment dynamics in tidal marsh-influenced estuaries using high-resolution ocean color remote sensing. Remote Sens. Environ. 240, 111682. doi: 10.1016/j.rse.2020.111682
Zhang S. R., Lu X. X. (2009). Hydrological responses to precipitation variation and diverse human activities in a mountainous tributary of the lower xijiang, China. Catena 77, 130–142. doi: 10.1016/j.catena.2008.09.001
Zhang S., Lu X. X., Higgitt D. L., Chen C. T. A., Han J., Sun H. (2008). Recent changes of water discharge and sediment load in the zhujiang (Pearl river) basin, China. Glob. Planet. Change 60 (3-4), 365–380. doi: 10.1016/j.gloplacha.2007.04.003
Zhang W., Ruan X., Zheng J., Zhu Y., Wu H. (2010). Long-term change in tidal dynamics and its cause in the pearl river delta, China. Geomorphology 120 (3-4), 209–223. doi: 10.1016/j.geomorph.2010.03.031
Zhang W., Wei X. Y., Zheng J. H., Zhu Y. L., Zhang Y. J. (2012). Estimating suspended sediment loads in the pearl river delta region using sediment rating curve. Cont. Shelf Res. 38, 35–46. doi: 10.1016/j.csr.2012.02.017
Zheng Y., He Y., Chen X. (2017). Spatiotemporal pattern of precipitation concentration and its possible causes in the pearl river basin, China. J. Clean. Prod. 161, 1020–1031. doi: 10.1016/j.jclepro.2017.06.156
Zheng J., Wang H., Liu B. (2022). Impact of the long-term precipitation and land use changes on runoff variations in a humid subtropical river basin of China. J. Hydrol.- Reg. Stud. 42, 101136. doi: 10.1016/j.ejrh.2022.101136
Zhou W., Gao J., Liao J., Shi R., Li T., Guo Y., et al. (2016). Characteristics of phytoplankton biomass, primary production and community structure in the modaomen channel, pearl river estuary, with special reference to the influence of saltwater intrusion during neap and spring tides. PloS One 11 (12), e0167630. doi: 10.1371/journal.pone.0167630
Keywords: water discharge, sediment loads, hydrological connectivity, coastal wetlands, estuary, sustainable development
Citation: Liu Z, Fagherazzi S, Liu X, Shao D, Miao C, Cai Y, Hou C, Liu Y, Li X and Cui B (2022) Long-term variations in water discharge and sediment load of the Pearl River Estuary: Implications for sustainable development of the Greater Bay Area. Front. Mar. Sci. 9:983517. doi: 10.3389/fmars.2022.983517
Received: 01 July 2022; Accepted: 14 November 2022;
Published: 25 November 2022.
Edited by:
Jose A. Jimenez, Universitat Politecnica de Catalunya, SpainReviewed by:
Jorge Guillen, Institute of Marine Sciences (CSIC), SpainMohd Yawar Ali Khan, King Abdulaziz University, Saudi Arabia
Copyright © 2022 Liu, Fagherazzi, Liu, Shao, Miao, Cai, Hou, Liu, Li and Cui. This is an open-access article distributed under the terms of the Creative Commons Attribution License (CC BY). The use, distribution or reproduction in other forums is permitted, provided the original author(s) and the copyright owner(s) are credited and that the original publication in this journal is cited, in accordance with accepted academic practice. No use, distribution or reproduction is permitted which does not comply with these terms.
*Correspondence: Baoshan Cui, cuibs@bnu.edu.cn; Xia Li, lixiabnu@bnu.edu.cn