 Yu Han1Yaowen Zhang2Han Zhang2Cuicui Feng2Tianran Hua2Yiqun Yang2Peng Yun1
 Jian Zeng1Li Peng3Jiangning Zeng4
 Guanqiong Ye2*
- 1Zhejiang Institute of Marine Planning and Design, Zhejiang Institute of Hydraulics & Estuary, Zhejiang, China
- 2Ocean College, Zhejiang University, Zhejiang, China
- 3School of Internet of Things Engineering, Jiangnan University, Jiangsu, China
- 4Second Institute of Oceanography, Ministry of Natural Resources (MNR), Zhejiang, China
The bay area is a crucial land–sea junction zone containing essential urban clusters while receiving extremely complex internal and external disturbances that challenge more on its resilience management. However, a sound management tool based on the bay area’s resilience is widely lacking due to the difficulty of unifying resilience indicators and quantifying resilience relationships between regions. This paper tries to establish a comprehensive resilience index for coastal bays from four major resilience-related dimensions, namely, physical structure, social development, ecological environment, and hazards, and applies it into the three major developed bay areas in China. A coupling coordination degree model was used to further reveal the resilience development and its internal coordination by temporal and spatial differences. The results show that the index could clearly reveal the resilience changes from the year 2000 to 2020 of the three bays with the common key drivers of socioeconomic development. It also explains the resilience changes among three bay areas through analyzing synergistic and conflict relationships between the four sub-resilience systems.
1 Introduction
Resilience is the ability of a system to adapt, overcome external disturbances, maintain its own stability, and restore its own function through a series of processes such as “resistance, absorption, repair, enhancement, and learning” (Adger et al., 2005). Resource depletion and potential environmental damage have triggered considerable concern about introducing resilience theory into regional management framework to achieve sustainable development (Brand, 2009; Yang et al., 2018). The resilience concept is permeating policymaking, for example, the National Science & Technology Council (NSTC) of the US published the “Opportunities and Actions for Ocean Science and Technology 2022–2028,” which encouraged the development of key elements for building resilient coastal communities, such as knowledge, technology, and capital (NSTC, 2022). Moreover, China has included the concept of urban resilience in the 14th Five-Year Plan and outline of long-term goals for 2035. However, even if increasing academic research and debates have discussed resilience management from multiple perspectives, there still a lack of comprehensive general discussions on evaluation strategies in this new and growing field (Li et al., 2020; Liu et al., 2022). A critical but largely inadequate need for resilience management is scientific information (Brown and Williams, 2015). Thus, government occupies the primary position in promoting resilience development systemically through public policies. For practical policy guidance, understanding the overall character of the systemic resilience based on quantifying interactions of impact factors within the system would facilitate better results (Nathwani et al., 2019). Since resilient development of the coastal zone requires consideration of the nexus between the land and sea, it is difficult to process in coastal areas.
The degree of resilience in land–sea intersection areas remains poorly understood, as the difficulty on unraveling interaction relationships between coastal community development and marine ecosystem changes. Nevertheless, coastal cities, especially in bay areas, are, in many cases, global economic centers (e.g., manufacturing, technology, trade, and finance) where the massive population aggregation and speeding up of industrialization make them vulnerable in facing complex disturbances from both the land and sea areas (Gao et al., 2022). For example, Bohai Bay, Yangtze river Delta, and Pearl River Delta of Chinese important bay areas and other international bay areas, e.g., the Tokyo Bay, San Francisco Bay, and New York Bay, are in a dilemma between economic growth and ecological degradation. In particular, the coastal urban ecosystem is vulnerable to disturbance (Nathwani et al., 2019). Thus, improving the resilience of the bay area has become a critical way to pursue sustainable development and tackle multi-risks (Sellberg et al., 2018; Jozaei et al., 2020; Wang et al., 2021). Among the existing literatures about urban resilience, conceptual studies have received more attention than analytical studies. Resilience is an important attribute to describe the dynamics of urban social–ecological system (SES), which has been studied in many fields from different perspectives (Adger et al., 2005; Folke et al., 2010). The Land–Ocean Interactions in the Coastal Zone (LOICZ) project constructed the framework of resilience and transformation on urban coasts (Ramesh et al., 2015), while contemporary studies have not devoted enough concern to the resilience assessment of the bay area ecosystem (Adger et al., 2005; Nathwani et al., 2019; Büyüközkan et al., 2022). An integrated vision of resilience evaluation suggests quantifying the dynamics and interactive relationships among various factors within the system to identify holistic properties of resilient systems. Otherwise, as is the case with most studies, qualitative or quantitative evaluation of the integrated resilience generally does not capture the breadth and depth of resilient evolution (Gari et al., 2015; Angeler and Allen, 2016; Liang and Li, 2020). Moreover, one issue that stands out in these studies is that they mostly focus on one risk, one disaster, or one region, which makes results lack comparability and universality (Diaz-Sarachaga and Jato-Espino, 2020; Kasmalkar et al., 2020; Li et al., 2021). In consequence, it is necessary to develop a comprehensive and informative resilience assessment framework tailored to the characteristics of the bay area and help formulate strategies in these areas to respond positively to crisis that might occur in the future.
The understanding of how changing patterns of resilience in the bay area is related to the broader dimensions of socioeconomic and environmental development is thus far largely unresolved. Here, we addressed these knowledge gaps by estimating the temporal and spatial variation in resilience of typical bay areas of China and then relating these resilience changes to human stressors and socioeconomic status. By subdividing the structure, impact, and process of resilience in the bay area system, the study innovatively constructed a resilience framework including the internal resilience structure and the external resilience of the bay area, and a total of 15 indicators were selected. Subsequently, we took the Bohai Bay, Hangzhou Bay, and Pearl River Delta as research objects, applied the framework to measure the resilience dynamic in the region, and analyzed differences in the development of resilience levels between regions by means of spatial and temporal variability analysis. Furthermore, coupling coordination degree model (CCDM) is often used to analyze the relationship between economic and ecological open systems with coupled characteristics (Jia et al., 2008, Zhang and Mo, 2014, Luo et al., 2021). Thus, the coupling coordination degree model (CCDM), correlation analysis, and significance test were used to illustrate the variation of resilience in the bay area through analyzing synergistic and conflict relationships between internal-resilience-related attributes. In a continuous changing world, this work can be used to explore enabling conditions for resilience building and guide effective policy and actions for promoting sustainable development of the bay area.
2 Methods
2.1 Study areas
We chose the three major bays as study areas, namely, Bohai Bay, Hangzhou Bay, and the Pearl River Delta from the north coast to the south coast of China, which ensured regional representativeness. They have been experiencing rapid economic development in the recent 30 years, accounting for 15.6% of the 2020 gross national product (GNP), and thus represented a high level and intensity of economic activities and dense urban development. As the epitome of many coastal cities in China, they have been already struggling with coastal ecosystem degradation, inadequate urban infrastructure and services, and so on, which may in turn restrict the resilient development of bays (Gao et al., 2013). Therefore, bays are especially sensitive to threats due to high population density and resource consumption but are capable of coping with resilient threats as an important engine for ocean economic development. The dual characteristics of high economic development level and high marine ecological stress in Chinese coastal areas are the motivation to study the resilience of Chinese bays. The locations and socioeconomic information are shown in Figure 1. Among them, Bohai Bay covers Qinhuangdao, Tangshan, Tianjin, Cangzhou, and Binzhou; Hangzhou Bay covers Shanghai, Jiaxing, Hangzhou, and Ningbo; and the Pearl River Delta covers Shenzhen, Dongguan, Guangzhou, Zhongshan, and Zhuhai.
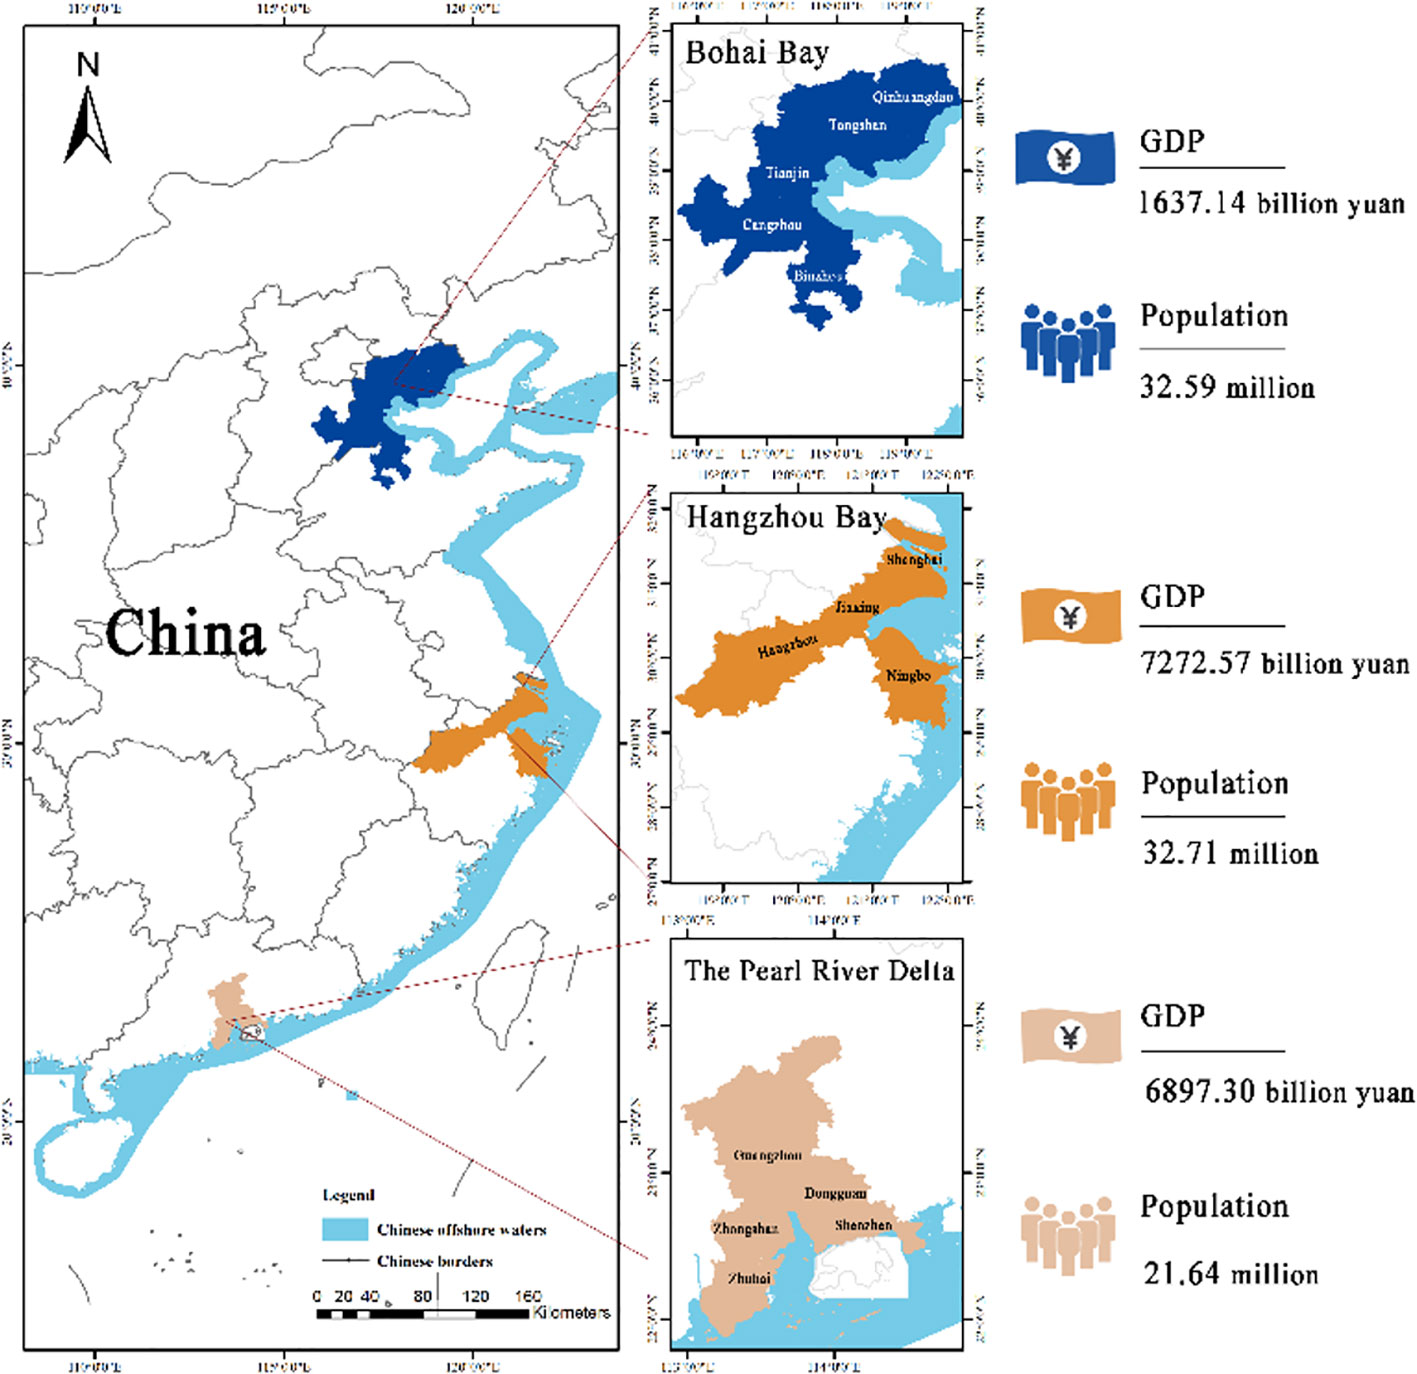
Figure 1 Location of Bohai Bay, Hangzhou Bay, and the Pearl River Delta in China. GDP and population are counted in 2020.
2.2 Index construction
Frameworks play an important role in analyzing social–ecological systems (Joerin et al., 2014), which provide shared concepts and variables that enable comparison across multiple cases. Some studies have proposed the conceptual framework of urban resilience (Galderisi, 2014; Ribeiro and Gonalves, 2019; Zhang et al., 2020), most of which reflect the ability of urban systems to resist, recover, adapt, or transform in the face of a series of disturbances. The adaptive cycle, a central mechanism of resilience theory, characterizes the dynamics of social–ecological systems (Yan and Tang, 2020). As a complex adaptive system in the bay area, current studies have focused strongly on a single subsystem and the single threats affecting that subsystem (Kuenzer et al., 2020). Therefore, to better make a reasonable and valid assessment of the resilience of the bay, we instantiated the complex framework of multiple subsystems (Figure 2) to reveal the changes in resilience resulting from the spatial and temporal variability of the three major bay area in China. The interactions between the internal attributes of coastal zone resilience were further explored. In light of the conceptual framework, specific indicators were selected based on previous studies (Zheng et al., 2018; da Silva et al., 2019; Oke et al., 2020), field survey, and adaptive resilience theory (Lak et al., 2020; Wardekker et al., 2020) (Table 1). Fifteen indicators in the index were extracted from the bay areas’ status of urban economy and social and coastal ecological environment. Thus, the evaluation index system of bay areas’ resilience was composed of four sub-resilience systems: physical space resilience, social development resilience, ecology resilience, and disasters resilience.
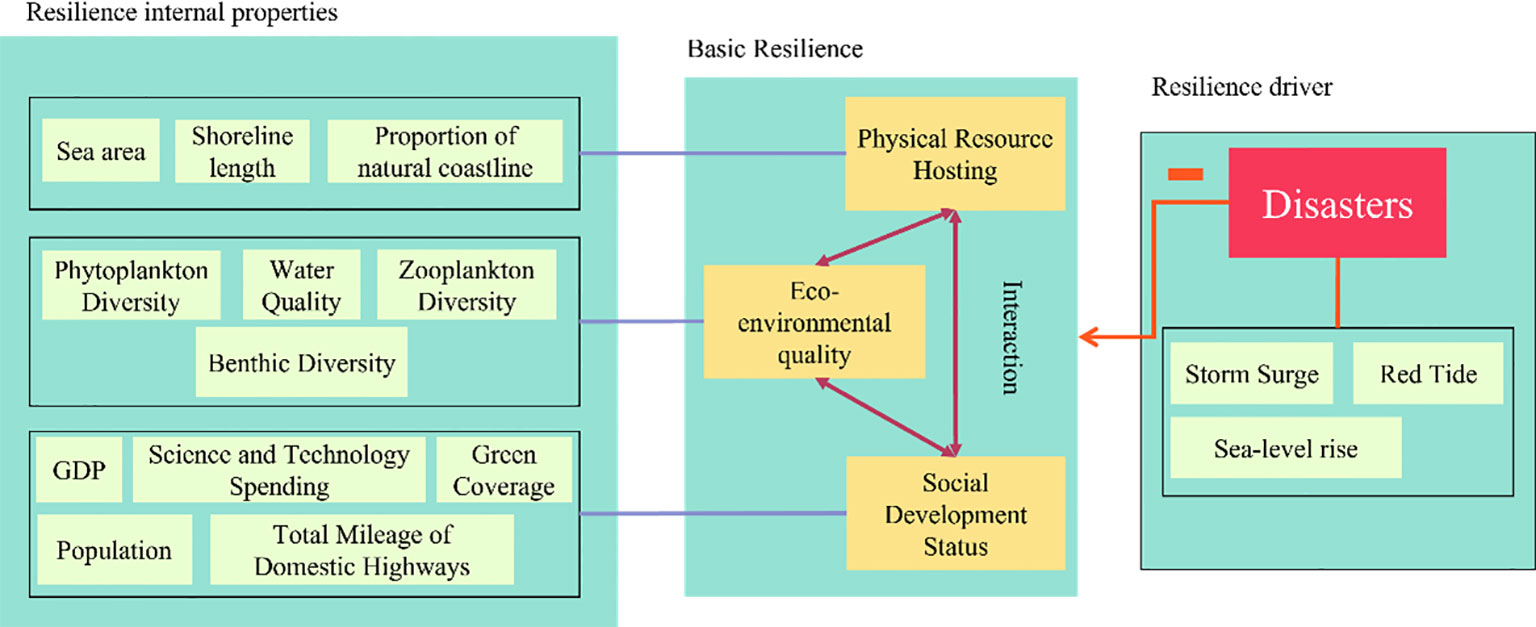
Figure 2 The conceptual framework of resilience assessment. The resilience system consists of four sub-resilience systems, namely, physical space, social development, ecology, and disasters, and the sub-resilience system of disasters may act negative impacts on the overall coastal resilience while the other three sub-resilience systems form the basic resilience with multiple internal properties of the coastal bay areas.
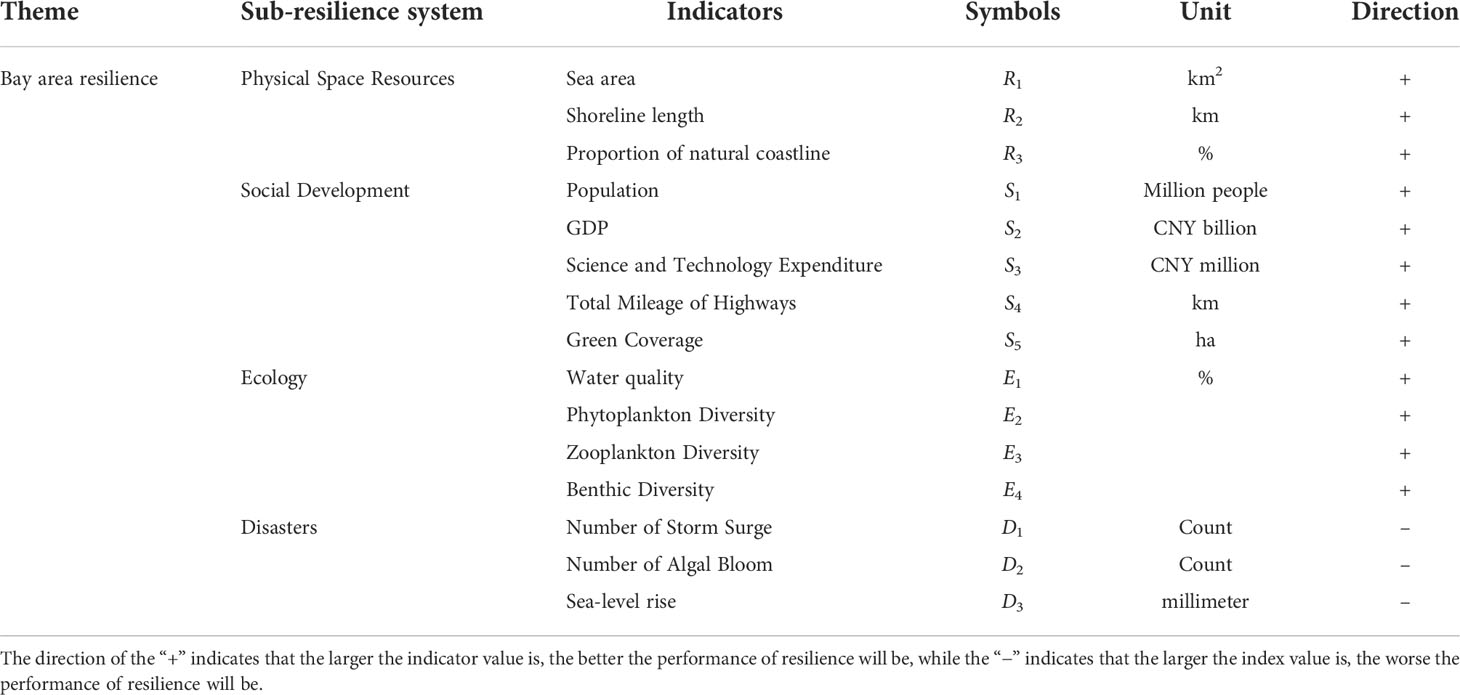
Table 1 Indicators for assessing the resilience of the bay area.
2.3 Mathematical processing
2.3.1 Assessment of bay area resilience
Due to the inconsistency of the units of the indicators in the resilience assessment framework, it is necessary to first standardize the original indicator data across multiple regions using the range method according to the effect direction of indicators on bay areas’ resilience.
where Nij refers to the specific value of the j indicator in the ith year.
The entropy method is an objective weighting method widely used in evaluating environmental time series data (Delgado and Romero, 2016) that is calculated according to the degree of variation in the data series. The advantage of the entropy method in multidimensional comprehensive evaluation is that it is more objective, avoiding the influence of human factors in subjective evaluation (Zhang et al., 2011). Compared with the analytic hierarchy process (AHP), principal component analysis (PCA), and other subjective weighting methods, this method is more objective and convenient (Lin et al., 2022). Therefore, it was applied to give weight to the bay area resilience index system. In this study, the weights of indicators determined by entropy method were calculated by Equations (2–4):
where Nij indicates the normalized data of Equation (1), and ej and wj are the entropy value and the calculated weight of each indicator, respectively. In Equation (3), , which is used to make sure that the logarithm has meaning.
Ultimately, the quantifying results of resilience through standardized values and weights of indicators are:
2.3.2 Correlation analysis
In order to better explore the interactions between the internal attributes of coastal zone resilience, this paper adopts the method of calculating Pearson’s coefficient to determine the degree of correlation between two factors. This paper also used the one-way ANOVA method for significance testing of indicators in different bays.
Overall correlation coefficients ρ for the two factors X, Y are as follows:
Pearson correlation coefficient r:
where r can also be estimated by (Xi,Yi)
2.3.3 The coupling coordination degree model
The coupling coordination degree model (CCDM) were employed to analyze the coupling coordination relationship among the four sub-resilience systems in the three bay areas of China. According to the ecological coupling evaluation model (Li et al., 2019), the formulas were given as follows.
where D represents the coupling coordination degree, D∈[0,1]; C denotes the coupling degree, C∈[0,1]; and T represents the integrated evaluation index of the four sub-resilience (physics, social economy, ecology, and disaster). The closer the D value is to 1, the better is the coordination relationship, anssd the closer the D value is to 0, the worse is the coordination relationship. In the study, the criteria for classifying the coupling coordination level are determined according to the distribution function (Liao, 1996).
where R, S, E, and D denote the calculation result of the physics, social economy, ecology, and disaster sub-resilience, respectively.
where α, β, γ, and δ represent their contribution. In the study, it is assumed that ∝=β=γ=δ=1/4 , considering that the core of bay area’s resilience is coordination.
2.4 Data sources
The index data of social development status was obtained from the National Bureau of Statistics, the China City Statistical Yearbook, and the statistical yearbooks/bulletins of various provinces and cities. Environmental data came from the Bulletin on the State of China’s Marine Ecological Environment and the Environmental Protection Bulletin of various provinces and cities. Disaster data came from China Marine Disaster Bulletin, China Sea Level Bulletin, and Marine Disaster Bulletin of various provinces and cities. Physical space resource data came from the literature (Zhang et al., 2016; Sun et al., 2017; Li, 2020; Peng et al., 2020). Although very little data were missing, a nearest neighbor interpolation method was used to fit the data when needed to ensure the data continuity. More information about the data sources could be found in Table 2.
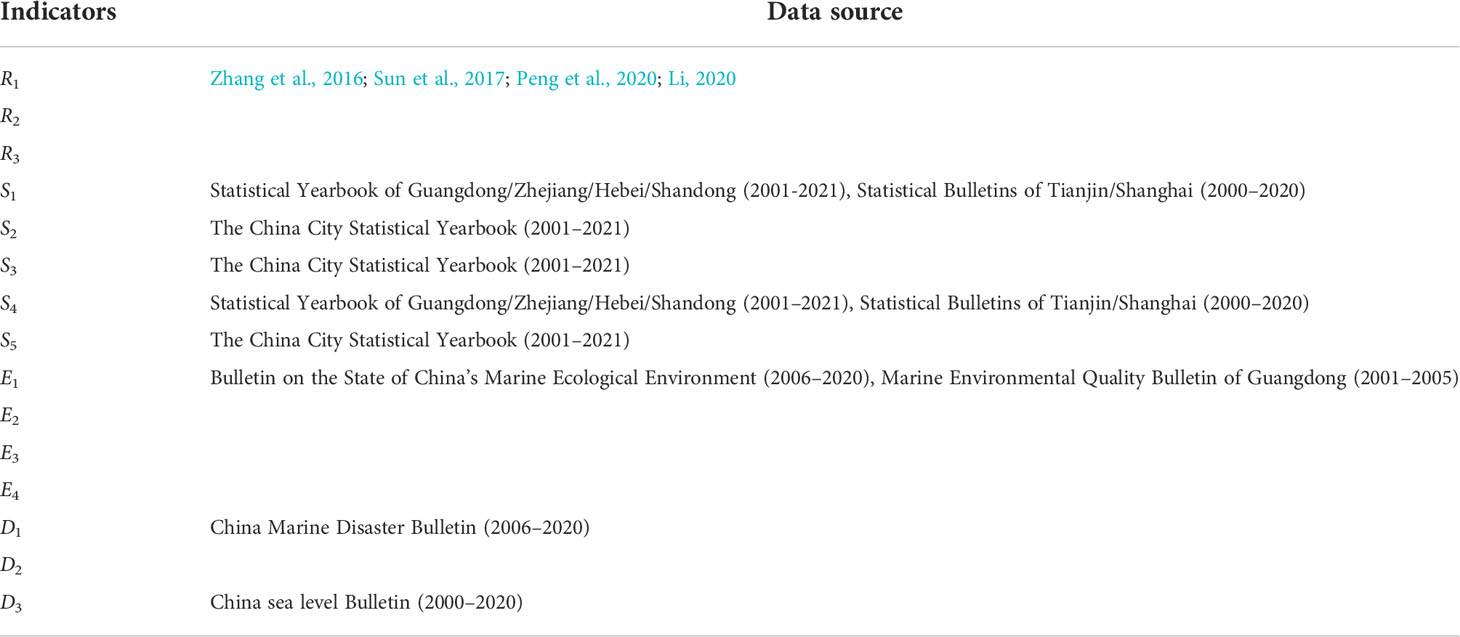
Table 2 Data sources of the indicators for assessing the resilience of the bay area.
3 Results
3.1 The spatiotemporal evolution of bays’ resilience and sub-resilience over 21 years
As shown in Figure 3, the resilience in Bohai Bay (BHB), Hangzhou Bay (HZB), and the Pearl River Delta (PRD) presented positive improvement overall with slight fluctuation over 21 years, mainly due to the positive growth of the social development sub-resilience. The highest growth rate of resilience was in HZB where resilience level raised from 0.32 in 2000 to 0.72 in 2020, an increase of approximately 127.61%, followed by the PRD with value of +110.35% and BHB with value of +46.16%. This indicated that the development level of resilience in BHB lagged behind that in other two bays. Among them, troughs occurred in 2005, 2005, and 2010 for the PRD, HZB, and PRD, respectively. The time nodes coincided with the frequent emergence of marine disaster in China, which largely affected resilience growth (Figure 4). It was worth noting that ecological resilience in all the study areas fluctuated greatly and remained at a low level during the observation years.
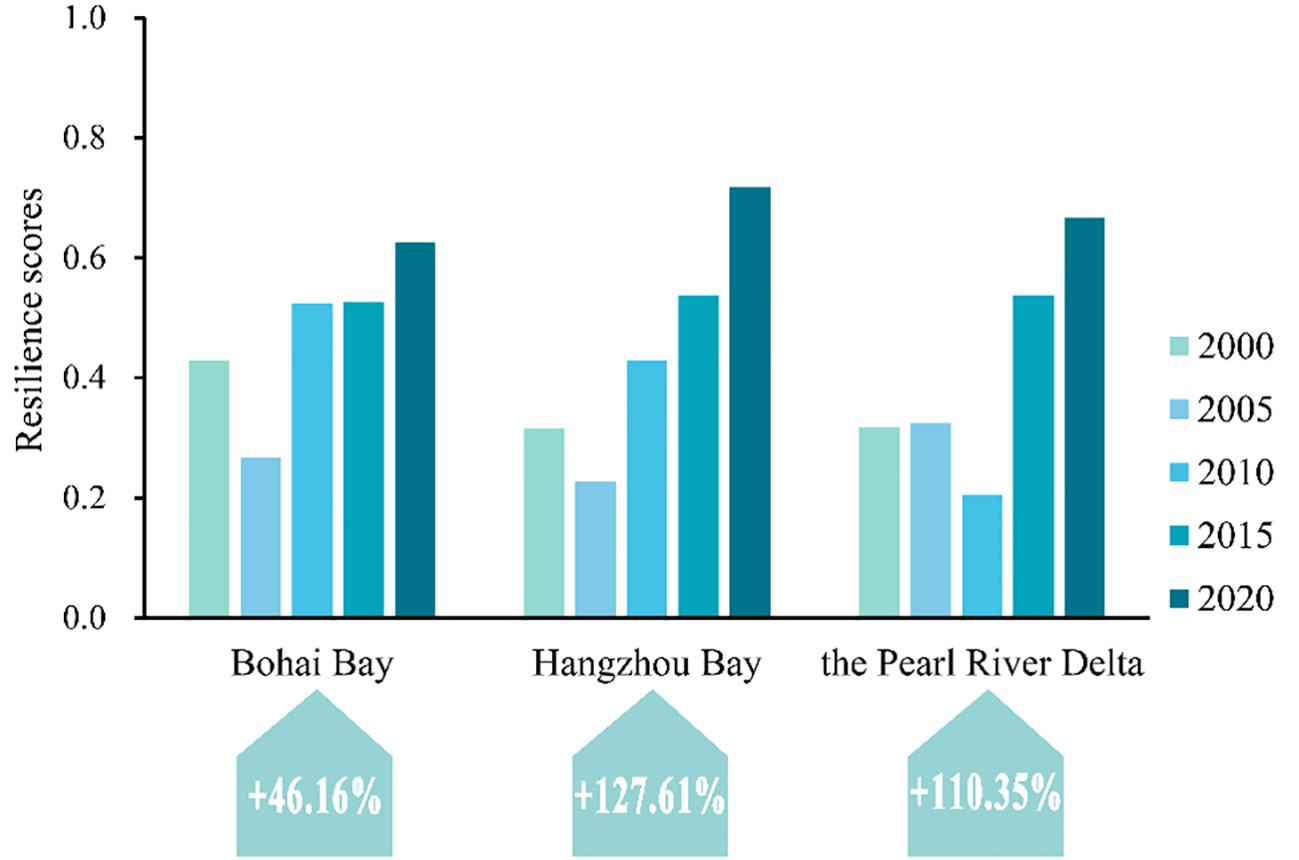
Figure 3 Changes in the three bays’ resilience scores by regions from 2000 to 2020. The percentage below it shows that the change rate in the resilience scores from 2000 to 2020 HZB and PRD have higher increasing rates of the resilience score than BHB.
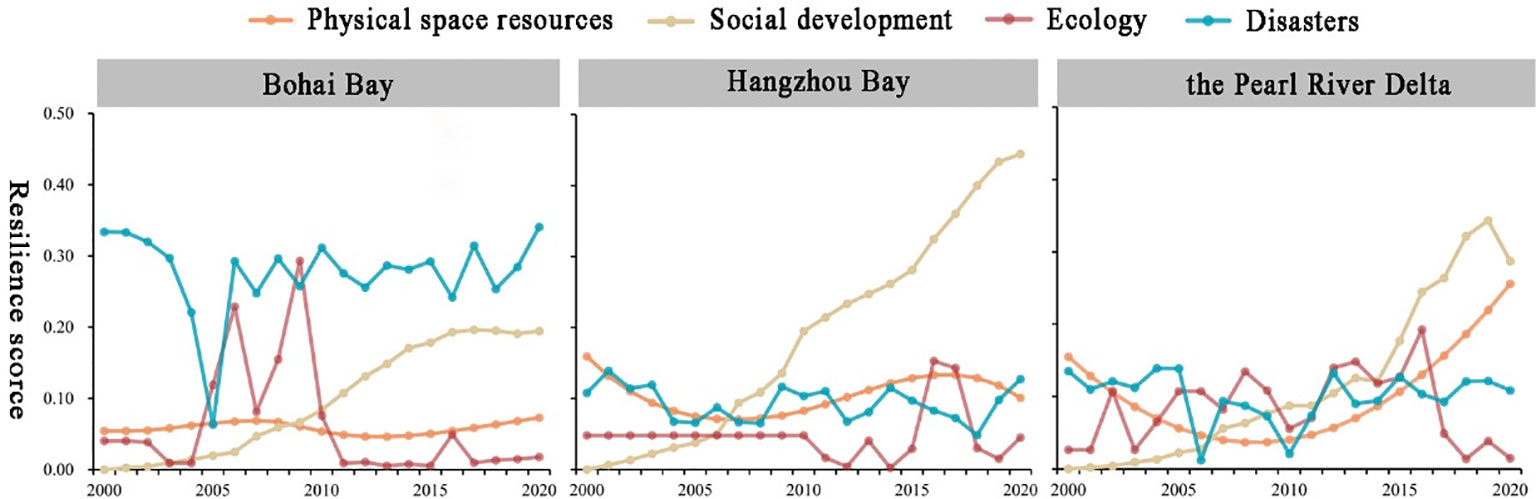
Figure 4 Line chart of resilience value for bays from 2000 to 2020. Different color indicates the four sub-resilience systems within the resilient system of bays. The ecological sub-resilience system has maintained a low level in the three bay areas, while the social development sub-resilience system has maintained an upward trend.
Regarding physical space resources resilience, the resilient level in BHB was relatively stable and increased slightly, and the resilience level dropped first then grew and ultimately dropped in HZB, and the resilient level dropped first then grew and ultimately grew in PRD. The resilient level of physical space resources developed in a differentiated manner among different regions, which resulted from local disparities in socioeconomic status, policies, technology, and so on. The resilient level of social development showed a rapid upward trend in the three bay areas.
3.2 Interaction relationship of properties within resilience
Figure 5 demonstrates how all factors affecting the resilience level interacted. The result shows that the resilient change in BHB was significantly positively correlated with those of in HZB (R=0.56, p<0.01), followed by those of in PRD (R=0.36, p<0.01). For BHB, we found that the disasters sub-resilience trend was significantly positively correlated with the social development sub-resilience trend (R=0.12, p<0.0001) and was significantly negative correlated with the ecology sub-resilience trend (R=−0.19, p<0.0001), followed by those of the physical resources sub-resilience (R=−0.16, p<0.0001). For HZB, the social development sub-resilience trend was significantly positively correlated with sub-resilience of physical resource (R=0.33, p<0.01) and ecology trends (R=0.087, p<0.0001) and was significantly negative correlated with the disaster sub-resilience trend (R=−0.14, p<0.01). For PRD, the sub-resilience trend of physical resource was significantly positive correlated with that of social development (R=0.7, p<0.001) and was significantly negative correlated with that of the ecology trend (R=−0.52, p<0.05). Physical space resources have a very obvious positive correlation with social development, which were the two sub-resilience systems with the strongest correlation found in this study.
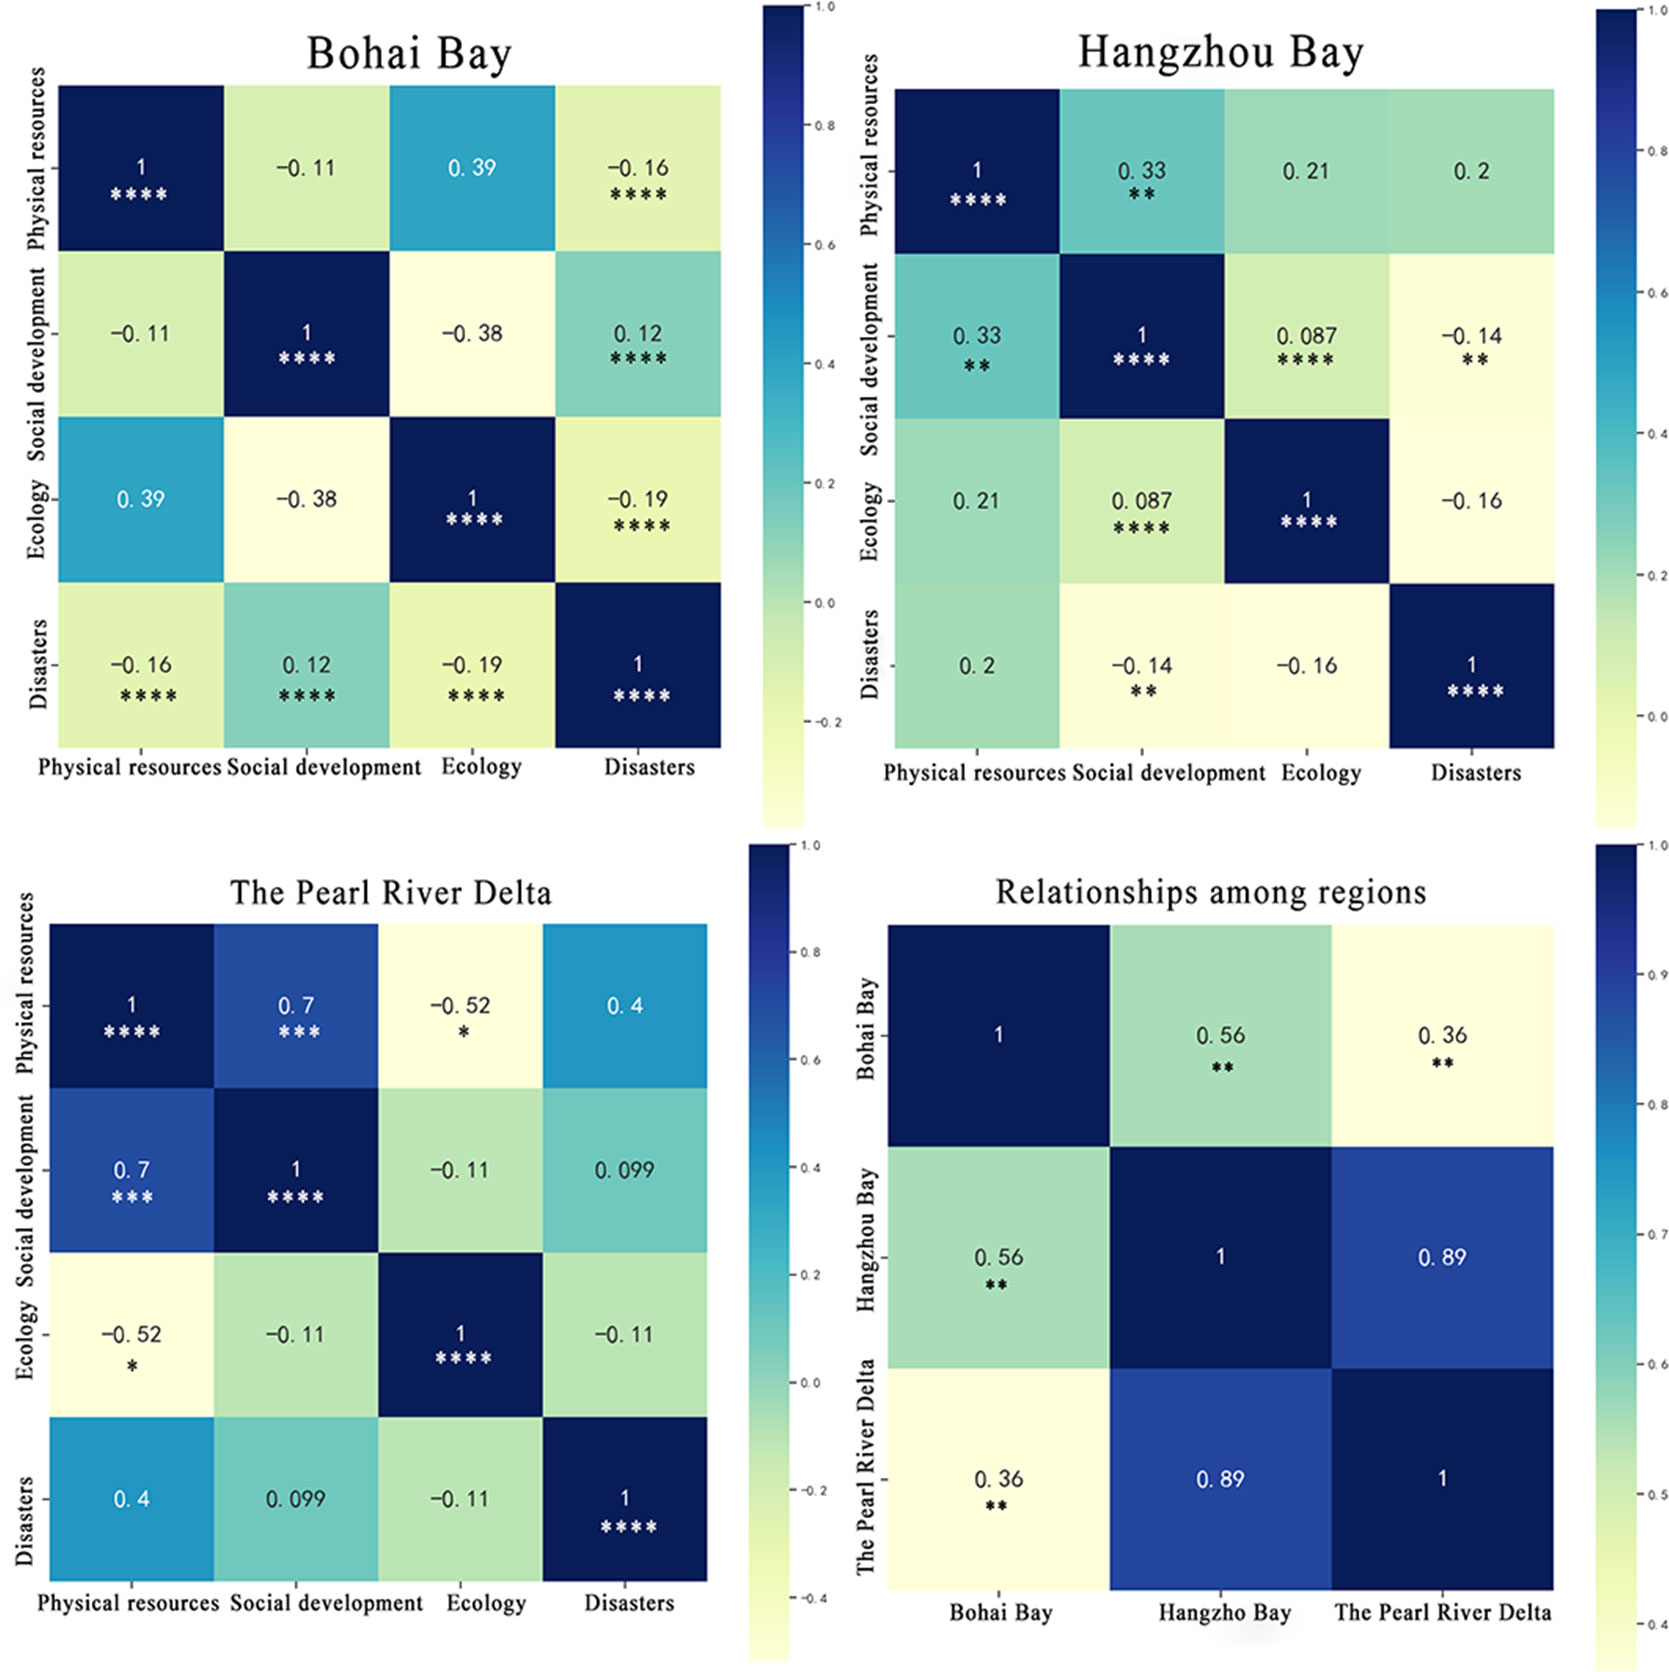
Figure 5 The interactive relationships between sub-resilience systems in and among three bay areas. t significance test below the value (*p<0.05, **p<0.01, ***p<0.001, and ****p<0.0001). The correlations among the four sub-resilience systems show significant spatial heterogeneity in Chinese bay areas.
3.3 Coupling and coordinated development between sub-resilience
The spatiotemporal evolution of the coupling coordination level is shown in Figure 6. The coupling coordinated level of the three bay areas increased slightly in the long term, and the overall growth gradient was between grades 1 and 2. Up to 2019, the coupling coordination level of the three bay areas was still imbalanced, which regional social, ecological, and environmental coordination developments in Chinese bay areas affecting integrated resilience growth. In the past 20 years, the spatiotemporal evolution characteristics of the coupling coordinated level in the three bay areas are different. The coupling coordinated level of BHB fluctuated greatly, and the degree of coordinated development reached the highest around 2009, showing a trend of fluctuation improvement. The coupling coordinated levels of HZB and PRD have shown a stable upward trend since 2001. The worst level of coupling coordination was observed in BHB compared with other regions. In summary, the coupling coordination level within resilience for the bay areas was not optimistic, and the coordinated development of the four sub-resilience among regions was biased.
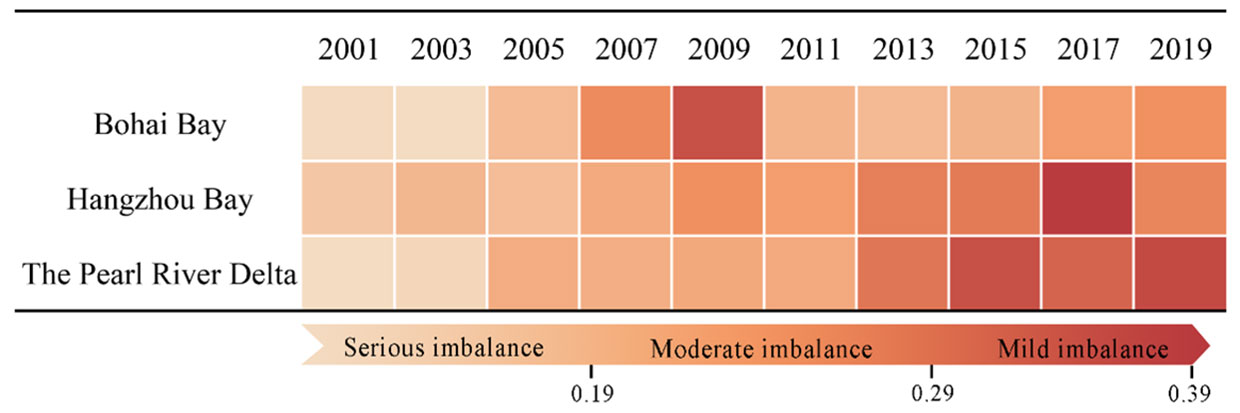
Figure 6 Coupling coordinated level of the three bay areas during 2001–2019. The coupling coordination level in the three bay areas is overall imbalance, but they show a trend of fluctuation improvement. The coordinated development of PRD and HZB in south China is better than that of BHB in north China.
4 Discussions
4.1 Resilience assessment for coastal bays
It is an essential effort in the field of sustainable development to explore quantifying the resilience of the bay area and analyzing the synergistic and conflict relationships among sub-resilience systems. In this study, an assessment framework of resilience in the bay area was constructed, including four sub-resilience systems: physical space resilience, social development resilience, ecology resilience, and disasters resilience, and a total of 15 indicators were selected. Our results show that the indicator system in the study can be used to clarify the evolution of resilience in the bay area. As we all know, constructing the indicator system and quantifying the comprehensive score have been a mature method used in scientific research (Davies and Tonts, 2010; Meerow et al., 2016; Zhang, 2016). The resilience assessment in coastal areas mainly achieves the purpose of quantification by constructing the evaluation indicators system, selecting the corresponding mathematical method, and establishing the operation model. At present, the construction of resilience assessment indicator system mainly considers the comprehensive performance of resilience in coastal social–ecological systems under multiple disturbances of human and nature (Joerin et al., 2014; Lam et al., 2015). The indicator system generally covers multiple dimensions such as ecology, society, economy, infrastructure, and policy, which has been applied in the resilience assessment of coastal areas such as Shenzhen (Liang and Li, 2020) in China and Saudi Arabia (Alshehri et al., 2015).
In our study, we first standardized the original data of each indicator, then used entropy method to determine the weight of each indicator, and finally carried out Pearson correlation test and calculate coupling coordination level. The concept of entropy first appeared in thermodynamics, developed by Rudolph Clausius in 1865, as a way of describing the disorder of a system. In the information theory, entropy is a measure of the uncertainty associated with a random variable (Zhang et al., 2011). Therefore, in the entropy method, the greater the change range, the higher the index weight, which makes the system score more different. In other similar studies, PCA and AHP are also important methods for assigning index weights. At the same time, some scholars use DPSIR, ENA, and other methods to analyze the direct and indirect environmental interactions among economic components, which provides a framework for the investigation of the function, resilience, and dynamics of an ecosystem (Xu et al., 2018; Nathwani et al., 2019). Compared with subjective weight determination methods such as AHP, the entropy method is more objective and accurate and can better explain the obtained results (Prachee et al., 2005; Lee and Philip, 2013). This method can modify the obtained weight and has high adaptability. Nevertheless, the method determines the weight of the indicator according to the variation degree of the indicator, ignoring its importance degree (Tomson and Danny, 2021). Therefore, when the indicator value changes suddenly or not much, the weights given by it may be far from the reality. To sum up, the entropy weight method can provide basis for multidimensional comprehensive evaluation and avoid the influence of human factors in subjective evaluation; we finally adopt this method (Zhou et al., 2021; Huang and Ling, 2018).
The selection of indicators directly affects the final results. In this paper, a total of 15 indicators are selected and clustered into four sub-resilience systems to represent the physical space resources, social development, ecology, and disasters in the bay area. In view of the special geographical conditions of the bay area, we comprehensively consider the coupling of land and sea, focus on the changes in the coastal zone, and take into account the conditions of land and sea. Although there are few studies on the resilience in bay areas at present, based on similar studies, we believe that the percent of attainment days meeting excellent air quality standard, renewable resource recycling rate (Liang et al., 2020), urbanization rate, total economic losses due to marine disasters (Nathwani et al., 2019), dumping amounts of dredged materials in unit sea area (Gao et al., 2022), and other indicators can be further defined. Due to the limit of data, we failed to collect these data. If relevant data can be obtained and analyzed, the research results will be more convincing.
4.2 Spatial heterogeneity and internal interconnections of coastal resilience
The ecological sub-resilience at a low level revealed great vulnerability for marine ecosystem to answer the threats of environmental risks and disasters, which may be attributed to serious environmental problems under sustained high economic growth and prosperity. Nevertheless, social development sub-resilience currently became the key driver in bay areas to promote overall resilience even though the overall ecological resilience was low. There was not enough evidence to show that social development sub-resilience would have a significant negative impact on ecological sub-resilience system. Our results showed that there were significant differences in the sub-resilience systems of the three bay areas. There are two main reasons for spatial heterogeneity: physical geographical conditions and different patterns of development in the three bay areas. Different from HZB and PRD, BHB is not conducive to the diffusion of pollutants objectively because there is no river with large runoff into the sea and the ocean current activity is not active, resulting in the water exchange time being longer. It may lead to the easier correlation between marine disasters (especially algal bloom) and human activities. From the time scale, the regional development patterns can be summarized as four stages of prepare, absorb, recover, and adapt (Linkov et al., 2014; Liang and Li, 2020). Different development patterns in the three bay areas also make their resilience have different characteristics. Comparing the results of resilience trends in the study with previous studies, BHB and HZB are more likely to be in the recover stage, while PRD may have evolved into the adapt stage. Therefore, PRD has stronger resilience than BHB and HZB. Greater resilience is also the next evolution trend of BHB and HZB.
At present, there have been several studies on the resilience of HZB and PRD (Xiao et al., 2019a; Bi et al., 2020; Liang and Li, 2020), but the research on the relationship among sub-resilience in the bay areas is widely lacking. During our study period, the social economy in the PRD developed rapidly, but due to the negative effects caused by the pressure of socioeconomic system, pressure on marine ecological of the area has not been reversed in recent 20 years. Most cities are in the stage that socioeconomic development and marine ecological damage coexist (Gao et al., 2022). Although abundant financial resources supported marine ecological restoration projects, the improvement of ecological environment often lagged behind the restoration effect of physical space. Ignoring the role of the ocean and the impact of global climate change will lead to significant deviation in the sustainability assessment of coastal cities or regions (Li et al., 2021). For HZB, the regional ecosystem health status continued to degrade at city scale in 2001–2013, and this decline spread to the surrounding areas from Shanghai and Jiaxing (Xiao et al., 2019a; Xiao et al., 2019b). Only from 2001 to 2013, the resilience in HZB did not show an improvement trend, but after 2013, HZB began to improve significantly. To a large extent, the increasing governance capacity given by the social development to environmental issues promoted improvements in regional marine physical resources and ecology sub-resilience, and serious marine disasters produced the negative impact on social development sub-resilience. Studies on BHB found that islands are most sensitive to stressors from inland activities and coastline development (Shen et al., 2016), but there is lack of overall analysis for this bay area. Although disasters sub-resilience had a certain destructive effect on the sub-resilience of physical space resources and ecology, it had a certain promoting effect on the sub-resilience of social development through facilitating the construction of urban infrastructure. Urban resilience levels in the Beijing–Tianjin–Hebei region (BTH) have shown an upward trend with slight fluctuation between 1998 and 2019, and the differences between cities have gradually decreased (Liu et al., 2022), which also confirmed with the results of our research.
Meanwhile, few studies involve quantitative analysis of the interaction relationship within resilience. From the comprehensive performance of coupling coordinated level, the coordinated development of PRD and HZB (in southern China) was better than that of BHB (in northern China), which was also consistent with the existing research conclusion (Fan et al., 2019). Although the disaster sub-resilience level was high, serious environmental pollution and low level of economic development led to the low level of coordinated development. In HZB and PRD, where ocean economy was developing rapidly, the sub-resilience of ecology and physical space resources was slightly improved, benefiting from the implementation of marine ecological protection strategy. This made their internal resilience more coordinated than that of BHB. However, it is not optimistic that economic development and urbanization process are exerting strong pressures on the ecological security system, which makes it in a passive and restrained position in Chinese coastal cities (Nathwani et al., 2019; Gao et al., 2022). In addition, coastal cities have efficiency disaster response, which could decrease the negative impact in case marine disasters occur. The conclusions of these studies are mutually confirmed with the results of this paper, which further enhances the credibility of our study. In summary, owing to the complex influence of multiple sub-resilience factors, the study could provide some implications and help urban managers to develop an integrated vision to better understand resilience.
5 Conclusions
This paper proposed a sound resilience index system for the bay areas by considering both the internal resilience structure and the external disturbances and has been validated through the practical assessment in three major bay areas in China from 2000 to 2020. The resilience indicator system effectively evaluated the temporal and spatial variation of resilience level in the bay areas. It also revealed the resilience level changes among three bay areas and the interaction relationships between the four sub-resilience systems. Base on the results, the resilience level in BHB, HZB, and PRD presented positive improvement overall with slight fluctuation during the study period, and the social development was the key driver factor. In the three bay areas, the interaction relationship between sub-resilience systems obviously showed regional heterogeneity, which could be explained by regional development patterns. Moreover, what was not so optimistic was that the coupling coordination level in the three bay areas remained imbalanced for long term even though it has increased slightly. Furthermore, we innovatively connected the resilience changes to human stressors and socioeconomic status, which was of great significance to explore enabling conditions for resilience building and guide effective policy and actions for promoting sustainable development in the bay area.
It should be noted that coastal resilience as a core ability for maintaining coastal health and sustainability is of great importance but is very challenging understand and manage. Our study is an early trial to quantify the resilience, the connections with coastal ecosystem health are still unclear, and the proposed index system is still lacking of some key indicators due to the unavailability, e.g., marine food web information and coastal hydrological attributes. More research efforts including theoretical and practical investigations should be invested both for research institutes and coastal government to explore, uncover, and regulate the coastal resilience for promoting coastal sustainability.
Data availability statement
The raw data supporting the conclusions of this article will be made available by the authors, without undue reservation.
Author contributions
Conceptualization: GY, YH, and YZ. Methodology: GY, YZ, HZ, TH, CF, and YY. Validation: GY, YH, LP, and JZ (Jian Zeng). Data curation and analyses: HZ, YZ, YH, and JZ (Jiangning Zeng). Writing: all authors. All authors contributed to the article and approved the submitted version.
Funding
This work was supported by National Natural Science Foundation of China (No. 42176216), the Science Technology Department of Zhejiang of China (No. 2022C15008), the Key Laboratory of Marine Ecosystem Dynamics, Ministry of Nature Resources (No. MD202001), and Fujian Provincial Key Laboratory of Marine Ecological Conservation and Restoration (No. 2021003).
Conflict of interest
The authors declare that the research was conducted in the absence of any commercial or financial relationships that could be construed as a potential conflict of interest.
Publisher’s note
All claims expressed in this article are solely those of the authors and do not necessarily represent those of their affiliated organizations, or those of the publisher, the editors and the reviewers. Any product that may be evaluated in this article, or claim that may be made by its manufacturer, is not guaranteed or endorsed by the publisher.
Supplementary material
The Supplementary Material for this article can be found online at: https://www.frontiersin.org/articles/10.3389/fmars.2022.982263/full#supplementary-material
References
Adger W. N., Hughes T. P., Folke C., Carpenter S. R., Rockstrom J. (2005). Social-ecological resilience to coastal disasters. Science 309 (5737), 1036–1039. doi: 10.1126/science.1112122
Alshehri S. A., Rezgui Y., Li H. (2015). Disaster community resilience assessment method: A consensus- based Delphi and AHP approach. Natural Hazards. 78 (1), 395–416. doi: 10.1007/s11069-015-1719-5
Angeler D. G., Allen C. R. (2016). Quantifying resilience. J. Appl. Ecol. 53, 617–624. doi: 10.1111/1365-2664.12649
Bi M. L., Xie G. D., Yao C. Y. (2020). Ecological security assessment based on the renewable ecological footprint in the guangdong -Hong Kong -Macao greater bay area, China. Ecol. Indic. 116, 106432. doi: 10.1016/j.ecolind.2020.106432
Brand F. (2009). Critical natural capital revisited: Ecological resilience and sustainable development. Ecol. Econ. 68 (3), 605–612. doi: 10.1016/j.ecolecon.2008.09.013
Brown E. D., Williams B. K. (2015). Resilience and resource management. Environ. Manag. 56, 1416–1427. doi: 10.1007/s00267-015-0582-1
Büyüközkan G., Ilcak O., Feyziolu O. A. (2022). Review of urban resilience literature. Sustain. Cities. Soc. 77, 103579. doi: 10.1016/j.scs.2021.103579
da Silva C. A., dos Santos E. A., Maier S. M., da Rosa F. S. (2019). Urban resilience and sustainable development policies: An analysis of smart cities in the state of S˜aoPaulo. REGE 27, 61–78. doi: 10.1108/REGE-12-2018-0117
Davies A., Tonts M. (2010). Economic diversity and regional socioeconomic performance: An empirical analysis of the Western Australian grain belt. Geograp. Res. 48 (3), 223–234. doi: 10.1111/j.1745-5871.2009.00627.x
Delgado A., Romero I. (2016). Environmental conflict analysis using an integrated grey clustering and entropy-weight method: A case study of a mining project in Peru. Environ. Model. Software. 77, 108–121. doi: 10.1016/j.envsoft.2015.12.011
Diaz-Sarachaga J. M., Jato-Espino D. (2020). Analysis of vulnerability assessment frameworks and methodologies in urban areas. Nat. Hazards. 100, 437–457. doi: 10.1007/s11069-019-03805-y
Fan Y. P., Fang C. L., Zhang Q. (2019). Coupling coordinated development between social economy and ecological environment in Chinese provincial capital cities-assessment and policy implications. J. Cleaner. Prod. 229, 289–298. doi: 10.1016/j.jclepro.2019.05.027
Folke C., Carpenter S. R., Walker B., Scheffer M., Chapin T., Rockström J. (2010). Resilience thinking: integrating resilience, adaptability and transformability. Ecol. Soc. 15 (4), 20. doi: 10.5751/ES-03610-150420
Galderisi A. (2014). Urban resilience: A framework for empowering cities in face of heterogeneous risk factors. ITU. A|Z. 11 (1), 36–58.
Gao X., Li P., Chen C.-T. A. (2013). Assessment of sediment quality in two important areas of mariculture in the bohai Sea and the northern yellow Sea based on acid-volatile sulfide and simultaneously extracted metal results. Mar. pollut. Bull. 72 (1), 281–288. doi: 10.1016/j.marpolbul.2013.02.007
Gao L. H., Ning J., Bao W. L. T. Y., Yan A., Yin Q. R. (2022). A study on the marine ecological security assessment of guangdong-Hong Kong-Macao great bay area. Mar. pollut. Bull. 113416, 176. doi: 10.1016/j.marpolbul.2022.113416
Gari S. R., Newton A., Icely J. D. (2015). A review of the application and evolution of the DPSIR framework with an emphasis on coastal social-ecological systems. Ocean. Coast. Manage. 103, 63–77. doi: 10.1016/j.ocecoaman.2014.11.013
Huang W. J., Ling M. Z. System resilience assessment method of urban lifeline system for GIS. Comput. Environ. Urban. Syst. 71, 67–80. doi: 10.1016/j.compenvurbsys.2018.04.003
Jia S.J., Liu Y.C., Xing M.J. (2008) On coordination development of agricultural ecological-environment and economy in different regions based on coupling degree model. Research of Agricultural Modernization. 5, 573–5. doi: 10.1016/S1002-0721(08)60105-2 (In Chinese).
Joerin J., Shaw R., Takeuchi Y., Krishnamurthy R.. (2014). The adoption of a climate disaster resilience index in chennai, India. Disasters 38 (3), 540–561. doi: 10.1111/disa.12058
Jozaei J., Mitchell M., Clement S. (2020). Using a resilience thinking approach to improve coastal governance responses to complexity and uncertainty: a Tasmanian case study. Australia. J. Environ. Manag. 253, 109662. doi: 10.1016/j.jenvman.2019.109662
Kasmalkar I. G., Serafin K. A., Miao Y., Bick I. A., Ortolano L., Ouyang D., et al. (2020). When floods hit the road: Resilience to flood-related traffic disruption in the San Francisco bay area and beyond. Sci. Adv. 6, eaba2423. doi: 10.1126/sciadv.aba2423
Kuenzer C., Heimhuber V., Day J., Varis O., Bucx T., Renaud F., et al. (2020). Profiling resilience and adaptation in mega deltas a comparative assessment of the Mekong, yellow, Yangtze, and Rhine deltas. Ocean. Coast. Manag. 198, 105362. doi: 10.1016/j.ocecoaman.2020.105362
Lak A., Hasankhan F., Garakani S. A. (2020). Principles in practice: Toward a conceptual framework for resilient urban design. J. Environ. Plann. Manage. 0, 1–33. doi: 10.1080/09640568.2020.1714561
Lam N. S. N., Qiang Y., Arenas H., Brito P., Liu K.B. (2015). Mapping and assessing coastal resilience in the Caribbean region. Cartogr. Geogr. Inf. Sci. 42 (4), 315–322. doi: 10.1080/15230406.2015.1040999
Lee P. H., Philip L. H. (2013). An r package for analyzing and modeling ranking data. BMC Med. Res. Methodol. 13 (1), 65. doi: 10.1186/1471-2288-13-65
Li N. (2020). Long-term remote sensing dynamic monitoring and ecological assessment of coastal wetland in hangzhou bay. China. Nanjing. Nanjing. Forest. University. Master. Degree. doi: 10.27242/d.cnki.gnjlu.2020.000002
Liang J., Li Y. F. (2020). Resilience and sustainable development goals based social- ecological indicators and assessment of coastal urban areas: A case study of dapeng new district, shenzhen, China. Watershed. Ecol. Environ. 2), 6–15. doi: 10.1016/j.wsee.2020.06.001
Liao C. B. (1996). Quantitative evaluation and classification system of the coordinated development of environment and economy: taking the urban agglomeration in the pearl river delta as an example. Guangzhou. Environ. Sci. 1), 12–16.
Li G., Kou C., Wang Y., Yang H. (2020). System dynamics modelling for improving urban resilience in Beijing, China. Resour. Conserv. Recycling. 161, 104954. doi: 10.1016/j.resconrec.2020.104954
Li X., Long X., Qi X. (2019). Dynamic evolution and analysis of coupling development of economy society and environment in Yangtze river economic belt. Resour. Environ. Yangtze. Basin. 28 (3), 505–516.
Linkov I., Bridges T., Creutzig F., Decker J., Fox-Lent C., Kroger W., et al. (2014). Changing the resilience paradigm. Nat. Climate Change 4 (6), 407–409. doi: 10.1038/nclimate2227
Lin Y., Zhang H. W., Ye G. Q., Jiang J. G., Jiang Q. T. (2022). Marine eco-civilization performance evaluation in oujiang estuary, Zhejiang province, China. Environ. Dev. Sustainabil., 1–22. doi: 10.1007/s10668-021-02047-y
Liu L., Lei Y., Zhuang M., Ding S. (2022). The impact of climate change on urban resilience in the Beijing-Tianjin-Hebei region. Sci. Total. Environ. 827, 154157. doi: 10.1016/j.scitotenv.2022.154157
Li Q., Wu J., Su Y., Zhang C., Wu X., Wen X., et al. (2021). Estimating ecological sustainability in the guangdong-Hong Kong-Macao greater bay area, China retrospective analysis and prospective trajectories. J. Environ. Manage. 303, 114167. doi: 10.1016/j.jenvman.2021.114167
Lou Y., Yin G., Xin Y., Xie S., Li G., Liu S., Wang X, et al. Recessive transition mechanism of arable land use based on the perspective of coupling coordination of input–output: a case study of 31 provinces in China. Land (2021),10, 1–27. doi: 10.3390/land10010041
Meerow S., Newell J. P., Stults M. (2016). Defining urban resilience: A review. Landscape Urban. Plann. 147, 38–49. doi: 10.1016/j.landurbplan.2015.11.011
Nathwani J., Lu X., Wu C., Fu G., Qin X. (2019). Quantifying security and resilience of Chinese coastal urban ecosystems. Sci. Total. Environ. 672, 51–60. doi: 10.1016/j.scitotenv.2019.03.322
NSTC (2022) Opportunities and actions for ocean science and technology 2022-2028 (US, Washington). Available at: https://trumpwhitehouse.archives.gov/wpcontent/uploads/2018/11/Science-and-Technology-for-Americas-Oceans-A-Decadal-Vision.pdf (Accessed June 7, 2022).
Oke A. E., Aghimien D. O., Akinradewo O. I., Aigbavboa C. O. (2020). Improving resilience of cities through smart city drivers. Australasian Journal of Construction Economics and Building 20, 45–64. doi: 10.5130/AJCEB.v20i2.6647
Peng X. J., Lin X. R., Fang J., Wang T., Jiang X. S. (2020). Analysis on coastline and coastal wetland changes in the hangzhou bay in recently 30 years. J. Ocean. Technol. 39, 9–16.
Prakash P., Yellaboina S., Ranjan A., Hasnain S.E.. (2005). Computational prediction and experimental verification of novel IdeR binding sites in the upstream sequences of mycobacterium tuberculosis open reading frames. Bioinformatics 21 (10), 2161–2166. doi: 10.1093/bioinformatics/bti375
Ramesh R., Chen Z., Cummins V., Day J., D'Elia C., Dennison B., et al. (2015). Land–ocean interactions in the coastal zone: Past, present & future. Anthropocene 12, 85–98. doi: 10.1016/j.ancene.2016.01.005
Ribeiro P., Gonalves L. (2019). Urban resilience: a conceptual framework. Sustain. Cities. Soc. 50, 101625. doi: 10.1016/j.scs.2019.101625
Sellberg M. M., Ryan P., Borgström S. T., Norström A. V., Peterson G. D. (2018). From resilience thinking to resilience planning: lessons from practice. J. Environ. Manage. 217, 906–918. doi: 10.1016/j.jenvman.2018.04.012
Shen C. C., Shi H. H., Zheng W., Ding D. W. (2016). Spatial heterogeneity of ecosystem health and its sensitivity to pressure in the waters of nearshore archipelago. Ecol. Indic. 61, 822–832. doi: 10.1016/j.ecolind.2015.10.035
Sun B. S., Zuo S. H., Xie H. L., Li H. Y., Yang Z. W. (2017). Analysis of impact effects and changes of the coastline in the bohai bay during the past 40 years. J. East. China Normal. Univ. (Natural. Science). 04, 012.
Tomson O., Danny C. I. (2021). Olympic Rankings based on objective weighting scheme. J. Appl. Stat 48 (3), 573–582. doi: 10.1080/02664763.2020.1736525
Wang J., Shen T., Gou A. (2021). Coastal resilience assessment of the San Francisco bay in USA and its enlightenment. Trans. Oceanol. Limnol. 43 (5), 149–158. 020.
Wardekker A., Wilk B., Brown V., Uittenbroek C., Mees H., Driessen P., et al. (2020). A diagnostic tool for supporting policymaking on urban resilience Vol. 101 (Cities London, England).
Xiao R., Liu Y., Fei X. F., Yu W. X., Zhang Z. H., Meng Q. X. (2019a). Ecosystem health assessment: A comprehensive and detailed analysis of the case study in coastal metropolitan region, eastern China. Ecol. Indic. 98, 363–376. doi: 10.1016/j.ecolind.2018.11.010
Xiao R., Yu X. Y., Shi R. X., Zhang Z. H., Yu W. X., Li Y. S., et al. (2019b). Ecosystem health monitoring in the shanghai-hangzhou bay metropolitan area: A hidden Markov modeling approach. Environ. Int. 133, 105170. doi: 10.1016/j.envint.2019.105170
Xu W., Cai Y. P., Rong Q. Q., Yang Z. F., Li C. H., Wang X. (2018). Agricultural non-point source pollution management in a reservoir watershed based on ecological network analysis of soil nitrogen cycling. Environ. Sci. pollut. Res. 25 (9), 9071–9084. doi: 10.1007/s11356-017-1092-x
Yang D., Gao X., Xu L., Guo Q. (2018). Constraint-adaptation challenges and resilience transitions of the industry–environmental system in a resource-dependent city. Resour. Conserv. Recycling. 134, 196–205. doi: 10.1016/j.resconrec.2018.03.016
Yan S., Tang J. (2020). Progress on the theory and practice of resilient city. J. Hum. Settlements. West. China. 35 (2), 111–118.
Zhang K. . Regime shifts and resilience in china's coastal ecosystems. Ambio 45 (1), 89–98. doi: 10.1007/s13280-015-0692-2
Zhang M.D., Mo D.Y. (2014) Coupling coordination degree of urban land use benefit and urbanization. Resour. Sci. 1, 8–16 (In Chinese).
Zhang H., Gu C. L., Gu L. W., Zhang Y. (2011). The evaluation of tourism destination competitiveness by TOPSIS & information entropy - a case in the Yangtze river delta of China. Tourism. Manage. 32 (2), 443–451. doi: 10.1016/j.tourman.2010.02.007
Zhang X. H., Huang H. M., Wang P., Chen M. R., Wang J. H., Sun Q. Y. (2016). Change analysis of coastline and Sea reclamation in pearl river estuary from 1973 to 2015. Trans. Oceanol. Limnol. 05, 002. doi: 10.13984/j.cnki.cn37-1141.2016.05.002
Zhang M., Yang Y., Li H., Dijk M. V. (2020). Measuring urban resilience to climate change in three Chinese cities. Sustainability 12 (22), 9735. doi: 10.3390/su12229735
Zheng Y., Xie X.-L., Lin C.-Z., Wang M., He X.-J. (2018). Development as adaptation: Framing and measuring urban resilience in Beijing. Adv. Climate Change Res. 9, 234–242. doi: 10.1016/j.accre.2018.12.002
Keywords: bay area, resilience, sustainable development, spatial and temporal assessment, ecological economic equilibrium
Citation: Han Y, Zhang Y, Zhang H, Feng C, Hua T, Yang Y, Yun P, Zeng J, Peng L, Zeng J and Ye G (2022) Spatiotemporal resilience assessment and comparison in China’s bay area. Front. Mar. Sci. 9:982263. doi: 10.3389/fmars.2022.982263
Received: 30 June 2022; Accepted: 26 September 2022;
Published: 25 October 2022.
Edited by:
Jose A. Jimenez, Universitat Politecnica de Catalunya, SpainReviewed by:
Ariel Blanco, University of the Philippines Diliman, PhilippinesDaniele Brigolin, Università Iuav di Venezia, Italy
Copyright © 2022 Han, Zhang, Zhang, Feng, Hua, Yang, Yun, Zeng, Peng, Zeng and Ye. This is an open-access article distributed under the terms of the Creative Commons Attribution License (CC BY). The use, distribution or reproduction in other forums is permitted, provided the original author(s) and the copyright owner(s) are credited and that the original publication in this journal is cited, in accordance with accepted academic practice. No use, distribution or reproduction is permitted which does not comply with these terms.
*Correspondence: Guanqiong Ye, Z3F5QHpqdS5lZHUuY24=