
94% of researchers rate our articles as excellent or good
Learn more about the work of our research integrity team to safeguard the quality of each article we publish.
Find out more
ORIGINAL RESEARCH article
Front. Mar. Sci. , 02 September 2022
Sec. Marine Biogeochemistry
Volume 9 - 2022 | https://doi.org/10.3389/fmars.2022.982051
This article is part of the Research Topic Advances in Estuarine and Coastal Nitrogen Cycle View all 17 articles
 Hanyue Xu1,2†
 Da-Wei Li1,2†
 Hong-Chun Li1,3*
 Meixun Zhao1,2
 William M. Berelson4
 Gui’e Jin1
 Li Li1Satabdi Misra3
Sedimentary nitrogen isotope (δ15Nsed) in Santa Barbara Basin (SBB) has been mostly interpreted as the record of the eastern tropical North Pacific (ETNP) intermediate water denitrification process. Nevertheless, debate remains regarding sources and control mechanisms of δ15Nsed signal in SBB. Multi-proxy analyses including δ15Nsed, total organic carbon (TOC), total nitrogen (TN), C/N ratio, and marine biomarkers were performed on a 46-cm sediment core (SBB-190629) collected from SBB in 2019. The core was dated with varve counting and 210Pb dating method, showing a depositional history of 1938–2019 CE with a sedimentation rate of 0.564 cm/year. The findings show that the δ15Nsed record (at ~0.25-year resolution) ranges from 6.24‰ to 7.43‰, which was affected by both local and remote forcing. The long-term variations of the SBB δ15Nsed signature show a general decreasing trend from 1940 to the late 1980s, low values during 1980~2000, and an increase afterward, which is thought to reflect changes in ETNP denitrification induced by the strength of tropical trade winds. Our results also reveal a series of abrupt annual to multiannual changes, superimposed on the long-term variation mentioned above. The SBB local δ15N signal (Δδ15NSBB) is accessed by using the deviation from the mean δ15N (Δδ15N) of SBB-190629 to subtract the Δδ15N of the ETNP. The Δδ15NSBB record compares well with redox-sensitive proxies (Re/Mo ratio and C29 stanol/stenol ratio) from the SBB bottom water and with the OCmarine content calculated based on the C/N ratio mixing model, indicating that the Δδ15NSBB is mainly controlled by bottom water denitrification, which was induced by the change of upwelling intensity and marine productivity. Since various climatic factors (e.g., El Niño–Southern Oscillation (ENSO), Pacific Decadal Oscillation (PDO), and North Pacific Gyre Oscillation (NPGO)) have different impacts on the upwelling intensity (hence the marine productivity and denitrification) in SBB on different timescales, the influence of combined climatic factors on SBB denitrification is time dependent.
In a marine system under oxygen-deficient conditions, e.g., eastern tropical North Pacific (ETNP), microbial activity converts bioavailable nitrate to nitrogen (N2) via the denitrification process. The intensity of the oxygen-deficient zone (ODZ) controls water column denitrification, as nitrate becomes the favorable electron acceptor after dissolved O2 is exhausted during microbially regulated organic carbon (OC) remineralization (Altabet et al., 1999; Ward, 2011; Horak et al., 2016; Margolskee et al., 2019). During the denitrification process, 14N is preferentially removed from the water column, and 15N is progressively enriched in the remaining nitrate pool (Altabet, 2006; Davis et al., 2019; Wang et al., 2019). Therefore, with a stronger ODZ, the water column denitrification is stronger, which creates a more positive δ15N of the water column. The δ15Nnitrate-enriched water from the ODZ is upwelled into the photic zone and incorporated into phytoplankton. After the death of the phytoplankton, the organic matter with a high δ15N signal via sinking particles is preserved in the marine sediment (Rayner et al., 2003; Wang et al., 2019). Under the circumstance of complete nitrate utilization (biological fractionation effects are negligible) and the absence of sedimentary diagenesis, such changes can be recorded in marine sedimentary δ15N (δ15Nsed) (Altabet et al., 1999; Emmer and Thunell, 2000; Thunell and Kepple, 2004; Ward, 2011; Horak et al., 2016; Davis et al., 2019; Margolskee et al., 2019; Wang et al., 2019; Sánchez et al., 2022). Hence, in regions where these conditions are met, δ15Nsed is accepted as a proxy for the integrated rates of denitrification and the volume of the ODZ: when the ODZ is expanded and the water column denitrification is intensified, the δ15Nsed increases (Emmer and Thunell, 2000; Tems et al., 2015; Horak et al., 2016; Davis et al., 2019; Wang et al., 2019; Sánchez et al., 2022).
Santa Barbara Basin (SBB; Figure 1A) is located between the California Coast to the north and the Channel Islands to the south, particularly in the Southern California Bight (Emmer and Thunell, 2000; Hendy et al., 2015; Osborne et al., 2016; Davis et al., 2019; Wang et al., 2019). It is a shallow nearshore basin with a maximum depth of ~600 m. The basin is bordered with narrow sills to the west (~475-m depth) and east (~230-m depth), which further reduces ventilation combined with the re-mineralization of organic matter, creating an anoxic water environment (dissolved oxygen<0.1 ml/L) below the sills (Emmer and Thunell, 2000; Bograd et al., 2002; Goericke et al., 2015). The high sedimentation rate and anoxic depositional environment minimize bioturbation, creating high-resolution and low sedimentary diagenesis records in SBB (Hendy et al., 2015; Sarno et al., 2020). A minimal (<1‰) offset between the sediment trap δ15N time series and down core δ15Nsed records in SBB provides further support that diagenetic isotopic alteration on δ15Nsed is negligible (Altabet et al., 1999; Emmer and Thunell, 2000; Davis et al., 2019; Wang et al., 2019). Furthermore, previous studies show that nitrogen utilization is complete in SBB surface waters throughout the year except in spring. During the spring, a large amount of nutrients is brought by upwelling, which may affect nitrogen utilization in the surface water. However, all of the upwelled nitrate is completely utilized on interannual scales (Emmer and Thunell, 2000; Davis et al., 2019). Therefore, δ15Nsed from the SBB records the variation of δ15N in the water column and is a good potential indicator of changes in ODZs and water column denitrification on longer than annual scales in the past.
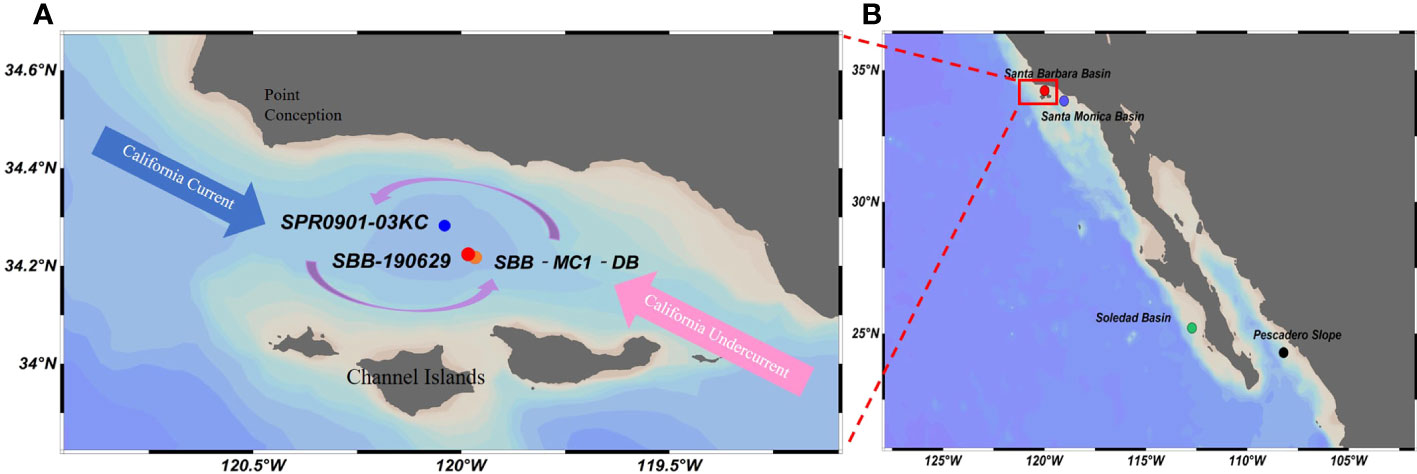
Figure 1 (A) Map of Santa Barbara Basin and the surrounding region, showing sampled and referred core locations in Santa Barbara Basin (SBB). Red circle (●), core SBB-190629 (this study); blue circle (●), core SPR0901‐03KC from Wang et al. (2019); orange circle (●), core SBB-MC1-DB from Davis et al. (2019). Major currents are mentioned in the text. (B) Locations of core sites along the North American margin are referred to in this study. Red circle (●), Santa Barbara Basin core location in this study. Purple circle (●), Santa Monica Basin core location from Davis et al. (2019). Green circle (●), Soledad Basin core location from Deutsch et al. (2014). Black circle, Pescadero Slope core location from Deutsch et al. (2014). Red box indicates SBB region and is enlarged in panel A.
The δ15N (and δ15Nsed) value of the water column (sediment) in SBB is affected by several factors. In near-surface circulation (upper 100 m) of SBB, the interaction between the cold southward flowing California Current (CC) and relatively warm northward flowing countercurrents (Davidson current) creates a semi-permanent cyclonic gyre. Annual variations in the strength of the two surface currents under climatic forcing such as El Niño/La Niña and Pacific Decadal Oscillation (PDO) strongly affect the degree of upwelling, thermocline depth, and biological productivity within the basin and in turn influence water column denitrification and δ15N value (Liu and Kaplan, 1989; Tems et al., 2015; Davis et al., 2019; Wang et al., 2019). Between depths of 100 and 400 m, the highly saline, anoxic, and δ15N-enriched waters originating from the ETNP zone are deflected to SBB through the California Undercurrent (CUC) (Figure 1A). The ETNP has the largest volume of low-O2 waters of all ODZs along the equator to mid-latitude in the northeastern Pacific (Horak et al., 2016); fluctuations of the intensity of denitrification in the ETNP are reflected on water δ15N and advected to SBB. Compared with the denitrified water from ETNP, CC input with lower δ15N is considered a relatively stable end-member on decadal scales in the nitrogen isotopic mass balance of the SBB input water. Therefore, in this study, the ETNP δ15N variation represents the distal signal (or remote forcing) in SBB δ15N budget. Finally, the SBB bottom waters (>475 m) are derived from North Pacific Intermediate Water (NPIW), which periodically flows over the deepest sill and further complicates the water column oxygen content and denitrification in SBB.
Previous studies have focused on the SBB δ15Nsed records as the distal signal of ETNP denitrification. However, some studies show that variation of δ15Nsed in SBB is associated not only with the change of ETNP ODZ but also with oxygen loss along the California Margin (Liu and Kaplan, 1989; Emmer and Thunell, 2000; Deutsch et al., 2014; Tems et al., 2015; Davis et al., 2019). In the study of Davis et al. (2019), the δ15Nsed record of core SBB‐MC1‐DB (Figure 1A) covering a sedimentary history of 1892–2017 CE was used to examine the decadal-scale variability (via Walker Circulation) and long-term anthropogenic forcing to δ15N signals; the difference of δ15Nsed between ETNP and SBB was the result of anthropogenic forced changes; however, factors of regional oceanography may be a candidate but ignored. Wang et al. (2019) combined δ15Nsed records (SPR0901-03KC in Figure 1A) of the SBB with additional productivity proxies to assess local and remote forcing of denitrification in the Northeast Pacific for the last 2,000 years. They suggest that wind curl upwelling (local signal) contributes to Southern California’s primary productivity and denitrification process, especially during weak coastal upwelling intervals. However, the resolution and chronological coverage of the core SPR0901-03KC δ15Nsed record was not able to compare with instrumental climatic records. Furthermore, recent studies have identified an increase in water column denitrification in the bottom waters of SBB (Goericke et al., 2015; White et al., 2019), and the δ15N signal could be transported into the upper water column via eddy diffusion and upwelling. Hence, understanding of δ15N variation on annual-to-decadal timescales and its influencing factors in SBB requires further investigation.
The present study aims to detect the local δ15N signal from the δ15Nsed record and understand the role of climatic fluctuations and oceanic upwelling on interannual δ15N variations in SBB. To do this, a 46-cm-long sediment core spanning 80 years of depositional history was sampled at a high resolution (every ~0.25 years) and analyzed for nitrogen isotopic signature. The local δ15N signals are separated from the bulk δ15Nsed throughout the comparison with the distal δ15N signals of the ETNP denitrification records published in the previous literature. Then, the variation of the SBB local Δδ15N (Δδ15NSBB) signals is compared with several geochemical parameters {(Re/Mo)EF, C29 stanol/stenol ratio, marine OC, marine biomarkers} to understand changes in redox condition, O2 content, and productivity in SBB. The role of climatic indices such as PDO, North Pacific Gyre Oscillation (NPGO), and El Niño–Southern Oscillation (ENSO) as influencing factors in shaping δ15Nsed signatures of the SBB is comprehensively discussed.
Core SBB-190629 (34°13.4′N, 119°58.99′W; 583-m depth) was collected on board the RV Oceanus by a multi-core device from SBB on 29 June 2019. The core was 46 cm long and contained clear laminations (Figure 2A). It was split in half and kept in a cold room at 4°C in the Department of Earth Sciences at the University of Southern California (USC). Half of the core was transported to the Department of Geosciences at the National Taiwan University (NTU) in February 2020. During the transportation, the sediments were contracted from 46 to 35 cm. Therefore, sampling depths were calibrated back to the original depths (Figure 2B). In Figure 2A, the depth scale of the core was the original depth. In Figure 2B, the depth scale of the core was the depth of the core at sampling time. The original depth of the core changed from 46 to 35 cm after the contraction. However, the main features of the color changes in the core sediments remained. Therefore, the depth correlations were able to be established (see the dashed lines in Figures 2A, B). With the correlated controlling depths, the relationship between sampling depth (D1) and original depth (D0) was D1 = 0.1408 + 0.6193 × D0 + 0.0037 × (R2 = 1.00).
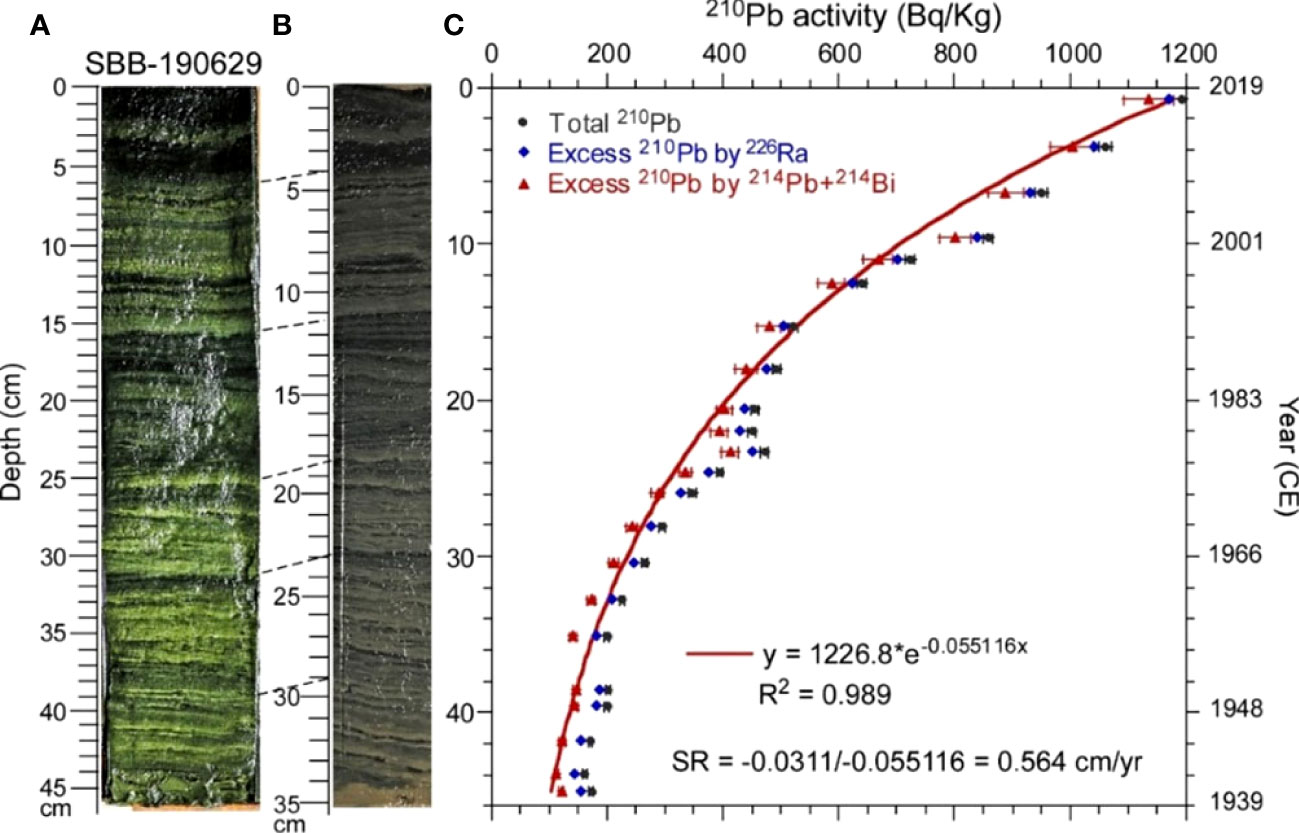
Figure 2 Photos and 210Pb profile of core SBB-190629. (A) Photo of the core before transportation to National Taiwan University (NTU). (B) Photo of the core after transportation to NTU. (C) 210Pb profile. The constructed ages are shown on the right-hand side of the plot. Red line represents the fitting curve.
The half core was subsampled at a 1-cm interval for 210Pb dating and biomarker analysis and then subsampled at a 2–3-mm interval (roughly four samples within 1 cm) for fine-resolution total organic carbon (TOC), total nitrogen (TN), and δ15N analyses. A total of 160 subsamples had been obtained. All sediment samples were freeze-dried by a freeze vacuum dryer (model EYELA FDU-1200), then ground, and mixed well. All dried samples were stored in a refrigerator at 8°C until analysis.
A total of 22 horizons of the core were analyzed for 210Pb dating through a high-resolution ORTEC GEM-FX8530P4 gamma spectrometer with a 10-cm-thick low-background lead shield in the NTUAMS Lab at NTU. The energy of 210Pb, 226Ra, 214Pb, and 214Bi peaks in the gamma spectrometer was at 46, 186, 351, and 610 keV, respectively. Each dry sample (weighing ranging from 5 to 10 g) in a plastic sample container was placed on top of the detector. Counting efficiency, geometry, and density effects of the detector were calibrated by various standards. Supported 210Pb activity was determined by either the 226Ra activity or activity of (214Pb + 214Bi)/2 in the sample measurements (Li et al., 2019). The excess 210Pb equals total 210Pb activity minus either 226Ra activity or activity of (214Pb + 214Bi)/2. The results are shown in Figure 2C and listed in Supplementary Table S1.
Sediment samples were taken at 2–3-mm intervals for TOC, TN, and δ15N analyses. The samples were treated with 0.5 mol/L of HCl for removal of carbonates and subsequently rinsed with Milli-Q water repeatedly until a pH of 7 was reached. After that, the samples were centrifuged to remove water and then oven-dried at 50°C for 48 h. Then, a small amount (approximately 5–10 mg) of samples were taken and placed in a tinfoil boat and analyzed for TOC and TN contents with an Elemental Analyzer FLASH 2000 at Ocean University of China (OUC) with a standard deviation of ±0.02 wt.% (n = 6), determined by replicate analysis of atropine (Thermo Fisher Scientific, Breda, Netherlands) and a low organic content soil (Elemental Microanalysis Ltd., Okehampton, UK). Other 0.5~1 mg samples were placed in a tinfoil boat and analyzed for δ15N on EA-IRMS (FLASH EA 1112 series coupled with Thermo Fisher Delta V continuous flow isotopic ratio mass spectrometer) at OUC. Measured δ15N values were calibrated against nitrogen isotope standards N‐1 (δ15N = 0.40‰) and USGS‐40 (δ15N = −4.52‰).
The precision of the δ15N measurements is reflected by the standard deviation of the duplicated N-1 and USGS‐40 measurements, which is less than ±0.10‰ (n = 6). The results of TOC, TN, and δ15N are shown in Figure 3 and listed in Supplementary Table S2.
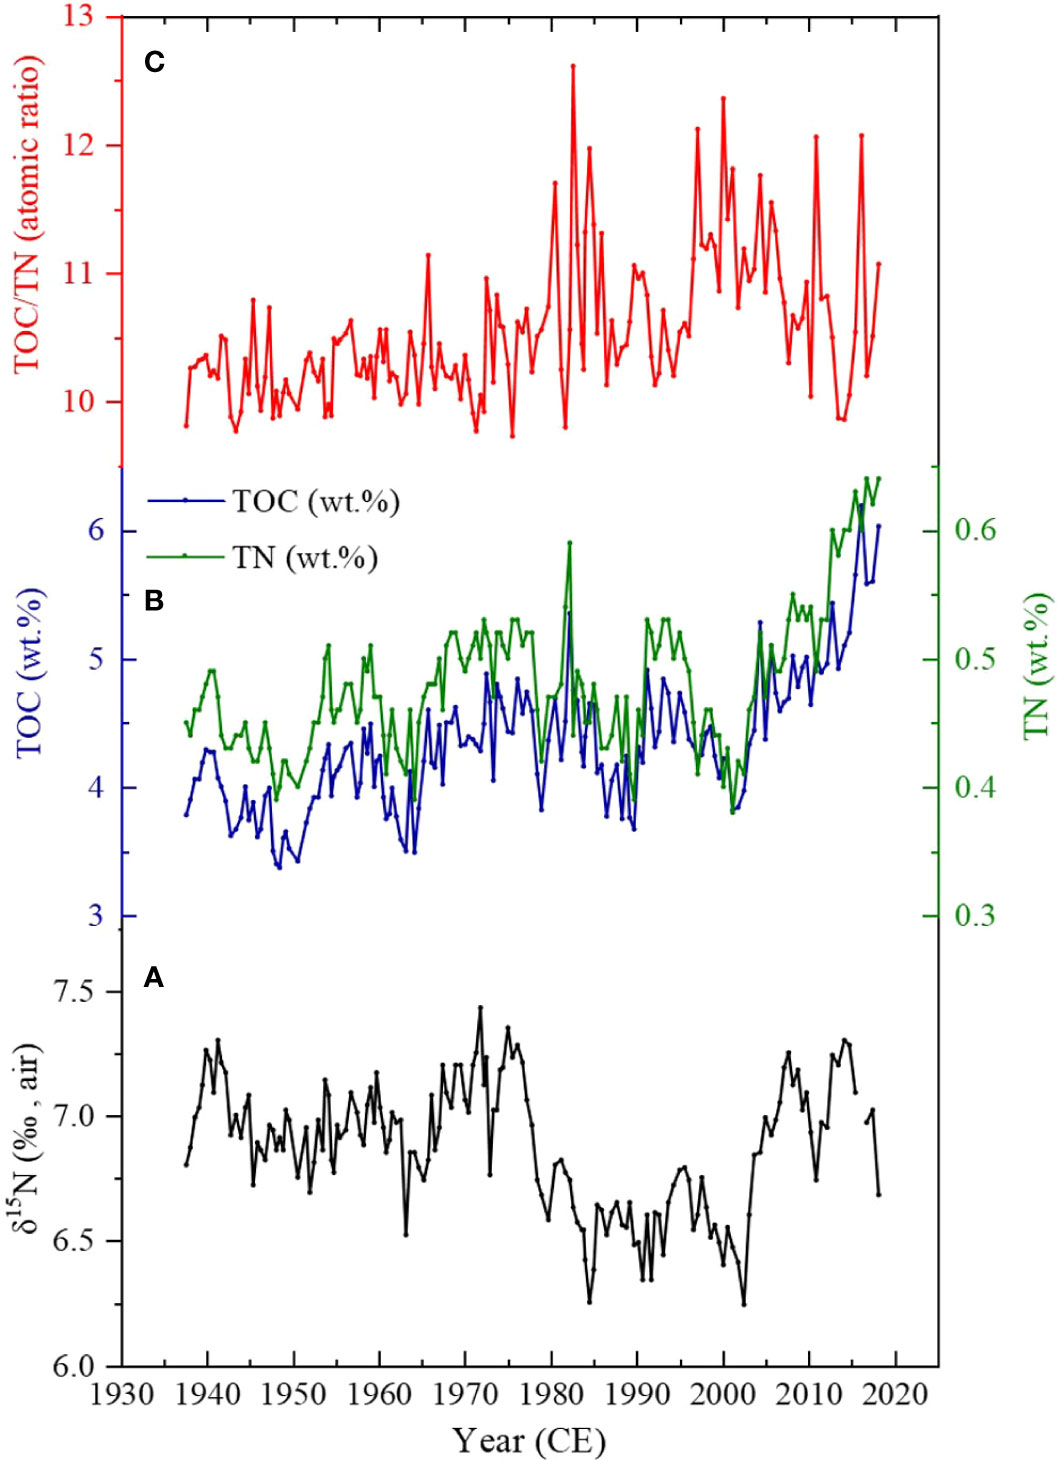
Figure 3 TOC, TN, and δ15N variation of the core SBB-20190629. (A) δ15N variation in core SBB-190629. (B) Total organic carbon (TOC, wt.%) and total nitrogen (TN, wt.%) records from SBB-20190629. (C) C/N atomic ratio (atom ratio of TOC/TN).
Total lipids were extracted from freeze-dried sediment samples (0.15–0.25 g) by using a dichloromethane and methanol (3:1 v/v) mixture utilizing ultrasonication (15 min). After that, an internal standard mixture containing C19 n-alkanol and n-C24D50 was added to the samples. The total lipid extracts were extracted by centrifuge. The extracts were then hydrolyzed with 6% KOH in MeOH. The non-polar lipid fractions were eluted with 8 ml of hexane using silica gel chromatography and then subsequently dried under a gentle N2 stream. The alcohol lipid fractions (containing marine phytoplankton biomarkers) were further eluted with 12 ml of dichloromethane and methanol (95:5, v/v), dried under a gentle N2 stream, and derivatized using N,O-bis(trimethylsilyl)-trifluoroacetamide (BSTFA) at 70°C for 1 h before instrumental measurements. Biomarker quantification was performed on an Agilent 6890N GC with a flame ionization detector (FID) (Li et al., 2014). The biomarker contents were plotted in Figure 4A and listed in Supplementary Table S3.

Figure 4 (A) Variation of marine organic carbon (OC) calculated by C/N atom ratio in core SBB-190629. Content of marine biomarkers was expressed in μg per g dry sediment (μg/g). (B) Total marine biomarkers calculated by A + B + D. (C) Variation of individual marine biomarkers: Brassicasterol (B), Dinosterol (D), and Alkenones (A).
Ancillary hydrologic data over the period 1953–2018 CE were collected from the California Cooperative Oceanic Fisheries Investigations program (CalCOFI) as described at http://calcofi.org. Determinations as to the phase and state of PDO were available at http://jisao.washington.edu/pdo/PDO. The climate indices of ENSO represented by the Niño 3.4 region (5°N–5°S, 170°W–120°W) are available at https://www.esrl.noaa.gov/psd/gcos_wgsp/Timeseries/. The NPGO index by Di Lorenzo et al. (2008) is available at http://www.o3d.org/npgo/.
The temporal changes of TOC, TN, and δ15N over time were assessed using the sequential t-test analysis of regime shifts (STARs) (Rodionov, 2004; Rodionov and Overland, 2005; Howard et al., 2007; www.BeringClimate.noaa.gov). The STARs use a t-test analysis to determine whether sequential records in a time series represent statistically significant departures from mean values observed during the preceding period of a predetermined duration. The cutoff length (l) is set to 30 years, and the probability level to α = 0.1.
The Adjacent-Averaging filter smooth was used to remove noise from signals by OriginPro8.0 software; for example, the measured δ15N and marine OC have smoothed 5 points of window. Geochemical data were interpolated to obtain evenly spaced time series using OriginPro8.0 software prior to statistical analyses. The rule of interpolation is according to the resolution of data; as the result of the different resolutions of this study to others, all records are interpolated to annual resolution. When all of the data were adjusted to the same resolution, IBM SPSS Statistics software was further used for correlation analysis.
The chronology of core SBB-190629 was determined by 210Pb dating through a gamma spectrometer. In the 238U–206Pb decay series, 226Ra (T1/2 = 1,600 years), 214Pb (T1/2 = 26.8 min), and 214Bi (T1/2 = 19.9 min) are the parents of 210Pb (T1/2 = 22.3 years). If sample material is formed more than 200 years ago, its 226Ra and 210Pb activities reach secular equilibrium (i.e., the activities are equal). Similarly, after the sample formation is more than 1 day, its 214Pb, 214Bi, and 210Pb reach secular equilibrium. Therefore, we can use 226Ra, 214Pb, and 214Bi to obtain the supported 210Pb. Excess 210Pb comes from 222Rn (T1/2 = 3.8 days) decay in the atmosphere and precipitates on Earth through wet and dry fallouts. As excess 210Pb deposits on the Earth"s surface, its decay timer starts to count. Therefore, excess 210Pb in a sediment sequence exponentially decreases with time (or depth) (Li et al., 2019):
where D and SR represent depth and sedimentation rate, respectively. The slope of the Ln 210Pb-D plot should yield a linear sedimentation rate (SR) (Appleby and Oldfield, 1992). Figure 2C shows the excess 210Pb decay trend with the core depth. Because the excess 210Pb activity is much higher than the supported 210Pb activity, the decay trends of excess 210Pb and total 210Pb are very similar. With the use of 226Ra or (214Pb + 214Bi)/2 as supported 210Pb for calculation of excess 210Pb, the fitting results are similar. Considering 214Pb and 214Bi can quickly reach secular equilibrium with 210Pb, we choose to use the excess 210Pb calculated from the total 210Pb minus (214Pb + 214Bi)/2. An equation of y = 1226.8 × e−0.055116x is obtained by using exponential fitting of the excess 210Pb with depth. The estimated SR in SBB-190629 is 0.564 cm/year (Figure 2C). Based on this SR, the 46-cm-long core would cover about 80 years of depositional history. With the use of the SR of 0.564 cm/year, the age of each depth can be calculated assuming the age of the top sediment was 2019 CE.
The δ15Nsed in core SBB-190629 varies from 6.24‰ to 7.43‰ (Figure 3A). The variation of δ15Nsed fluctuated between 6.70‰ and 7.20‰ from the late 1930s to the 1960s and then became higher during the 1970s with an average of 7.14‰. After that, a decline in δ15Nsed of ~1‰ was evident from the mid-1980s to the mid-2000s. After that, the δ15Nsed value increased sharply in the mid-2000s and reached 7.30‰ in 2015–2016.
The TOC of the samples varies from 3.37 to 6.19 wt.% (Figure 3B, blue). A decrease to approximately 2 wt.% occurred between the late-1930s and mid-1980s. The TOC further decreased with an average of 4.28 wt.% between the mid-1980s and mid-2000s. A sharp increase in TOC with a maximum at 6.19 wt.% was evident since the mid-2000s.
Sedimentary TN consists of organic nitrogen (ON) and inorganic nitrogen (IN). The TN of sediments in core SBB-190629 fluctuates between 0.38 and 0.64 wt.% (Figure 3B, green). The variation trend of TN is similar to that of TOC.
According to the results of STARs analysis, the regime shifts of TOC, TN, and δ15N approximately appear at the same time: 1965~1970, 1978~1985, and 2005~2010 (Figure S1). In general, the variation of TOC, TN, and δ15N roughly displayed similar temporal trends.
The C/N ratios (atom ratio of TOC/TN) in core SBB-190629 vary from 9.73 to 12.61, with an average of 10.53 (Figure 3C). Although both marine and terrigenous origins of organic matters could contribute to the sediments in the coring site, the good correlation between TOC and TN (Figure 3) suggests that the majority of the organic matters in the sediments came from the similar source. For the linear equation of TN = 0.092 * TOC + 0.081 (R2 = 0.81, p< 0.01) (Figure S2), the intercept represents the average 0.081 wt.% of IN in the TN, which may be from terrestrial clay-bound N (Müller, 1977; Schubert and Calvert, 2001; Hu et al., 2013; Hendy et al., 2015; Wang et al., 2019). Compared to the average TN of 0.48 wt.% in SBB sediments, the IN accounts for about 16.9% of TN, so its interference is minor.
The C/N ratio has been utilized for assessing the source of organic matter. Generally, the C/N ratio of algae ranges from 4 to 10 (Thornton and McManus, 1994; Lamb et al., 2006), while the C/N ratio of approximately 20 indicates terrestrial vascular plant input (Meyers, 1997; Schubert and Calvert, 2001). A two-end-member mixing model was employed to estimate the relative contributions of OC from marine and river in the SBB sediments.
(C/N)sample=fterrestial× (C/N)terrestial+fmarine× (C/N)marine (3)
The terrestrial end-member is based on the mean values of the particular matter samples collected near Santa Clara River (C/Nterrestrial = 13.07), which is the main terrestrial source of the SBB sediments (Masiello and Druffel, 2001; Komada et al., 2004). The average C/N ratio of phytoplankton is 7 for the marine end-member (Lamb et al., 2006). The OCmarine is calculated by multiplying the sediment proportion of marine by TOC; the trends are shown in Figure 4A. According to this calculation, the average values of OCmarine content and fmarine are 1.83 wt.% (ranging from 0.39 to 2.76 wt.%) and 41% (ranging from 12% to 55%), respectively. Compared with the average TOC content of 4.31 wt.%, the OCmarine proportion in the TOC is generally less than the OCterrestrial, agreeing with the previous studies (Thunell, 1998; Hendy et al., 2015).
Brassicasterol (B) and Dinosterol (D) are major marine sediment biomarkers in SBB derived predominantly from cell membrane components of diatom and dinoflagellate among phytoplankton, which further reflect the corresponding phytoplankton biomass in the euphotic layer (Volkman, 1986; Volkman et al., 1998; Xing et al., 2016). Alkenones (A) are another major lipid component that originated from haptophytes. Hence, the sum of Brassicasterol, Dinosterol, and Alkenones (B + D + A) can be successfully utilized for evaluating primary productivity (Schubert et al., 1998; Xing et al., 2016). The biomarker contents of the three lipid biomarkers are depicted in Figure 4B. Brassicasterol and Dinosterol contents gradually increased before the 1970s, slightly decreased after the 1980s, and increased again from the 2000s, consistent with TOC and OCmarine variations. Alkenone content decreased gradually over the last 80 years, despite a slightly high value in the late 1950s and early 1970s. The sum of the three biomarkers shows decadal variations and a strongly increasing trend from 2010 onward (Figure 4C).
As mentioned above, surface water inputs to SBB have different δ15N with heavier δ15N of CUC originating from ETNP and lighter δ15N of CC. In order to provide evidence of high δ15N waters from ETNP that could be advected to Southern California via CUC to influence the water δ15N along the Southern California Coast, we collected integrated δ15N of nitrate (Sigman et al., 2003; Sigman et al., 2005) and salinity data sets of water samples within 100–400 m from the California Coast to the southern tip of Baja California (Van Geen, 2001). Figure S3 shows a strong positive correlation (R2 = 0.97) between δ15N and salinity, and the highest δ15N and salinity in the southern tip of Baja California decreased to the lowest δ15N and salinity near SBB. The conservative behavior of δ15N with respect to salinity demonstrates the ETNP influence on the water along the California Coast. Although the CUC is the strongest in fall, Liu and Kaplan (1989) found a similar correlation between δ15N and salinity along the California Coast water in the summer. In addition, as already noted, δ15Nsed from the SBB records the variation of δ15N in the water column; therefore, a positive correlation between δ15N from an SBB box core (SPR0901-04BC, Figure 1A) and measured salinity at the core of CUC (σθ = 26.4–26.5) from the CalCOFI during the last 50 years was verified by Wang et al. (2019) to support the influence of ETNP high δ15N on SBB. Thus, ETNP water is an important source of enriched δ15Nnitrate transported to SBB with the CUC.
Another test to demonstrate the ETNP δ15N influence on the δ15N signal in SBB is to use δ15Nsed in ETNP to compare with the SBB δ15Nsed. The δ15Nsed record of core SBB-190629 is compared with the δ15Nsed records at three sites along the North American margin (Figure 5). The Pescadero Slope and Soledad Basin sites (Figure 1B) are within the anoxic zone in the ETNP (Deutsch et al., 2014). Adjacent to SBB, the third site in Santa Monica Basin (SMB, Figure 1B) is >1,000 km north of the anoxic zone but physically connected via the coastal undercurrent (Deutsch et al., 2014). Basically, the δ15Nsed records at the Pescadero Slope and Soledad Basin sites reflect the strongest influence of the ETNP δ15N (or the distal δ15N signal), whereas the SBB and SMB sites are farther away from the ETNP influence. Despite the four cores having their own chronologies, the comparisons shown in Figure 5 reveal that 1) δ15Nsed records (except the SBB δ15Nsed) showed a general decreasing trend from the late 1930s to ~1980. All four records showed relatively low values during 1980~2000 and then increasing trends after 2000. 2) The δ15Nsed values became lower from the south site to the north site, indicating that the mixture from the ETNP δ15N becomes weaker with increasing distance from ETNP. The latitudinal and chronological comparisons of the δ15Nsed records at the four sites along the Eastern Pacific margin exhibit that the δ15Nsed have recorded primarily large-scale oceanographic changes originating in the water column, and the water with the ETNP δ15N signal can reach as far as the SBB, implying that the distal δ15N signal should be distinguished from the local δ15N signal in the SBB δ15Nsed. The visible dissimilarities on short timescales between the SBB δ15Nsed record and other δ15Nsed records further validate the local δ15N signal interference. Below, we discuss the determination of the local δ15N signal in the SBB δ15Nsed.
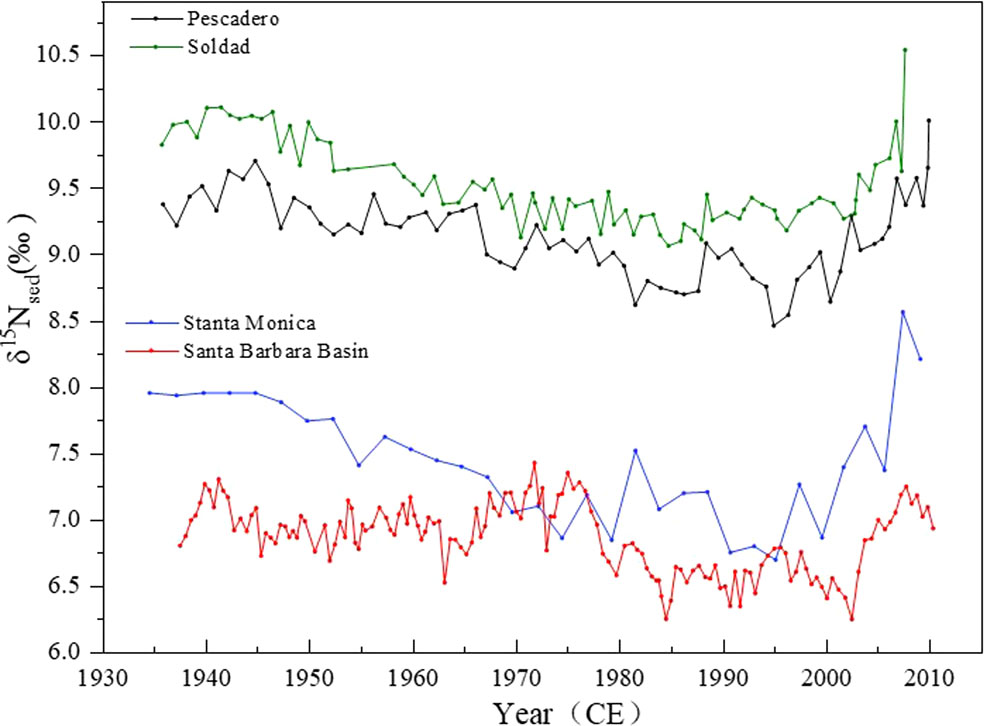
Figure 5 Bulk organic δ15N from four sediment core sites along the North American margin: Soledad (Deutsch et al., 2014), Pescadero (Deutsch et al., 2014), Santa Monica Basin (Davis et al., 2019), and Santa Barbara Basin (this study). Locations of core sites are showing in Figure 1B.
To distinguish the local δ15N signal in SBB, the δ15Nsed of Pescadero Slope and Soledad Basin belonging to the anoxic zone of ETNP were treated to represent the ETNP δ15N variability (Deutsch et al., 2014). These two records from 1935 to 2010 were selected to keep the same timescale for this study. The δ15N anomalies (Δδ15N) of ETNP were calculated by the individual δ15Nsed value by subtracting the mean δ15N value over 1935~2007 of each site and then averaging them. Figure 6A shows the ETNP Δδ15N record (blue curve with shaded error area) during 1935~2007. In order to confirm the representative of the ETNP δ15N signal, we compared the simulated changes in δ15N (Figure 6A, green curve) using an ocean general circulation model (GCM) by Deutsch (2014) with our result. The modeled δ15N record was based on numerical simulations of the cycle of N and its isotope cycle in the ETNP anoxic zone (125°W to coast, 5°N to 25°N) during 1959~2005. The result shows that decadal variations in the model predicted δ15N of particulate organic N sinking into the anoxic zone, which closely matches the sediment proxy data in both amplitude and timing. The reliability of the calculated ETNP δ15N signal is verified.
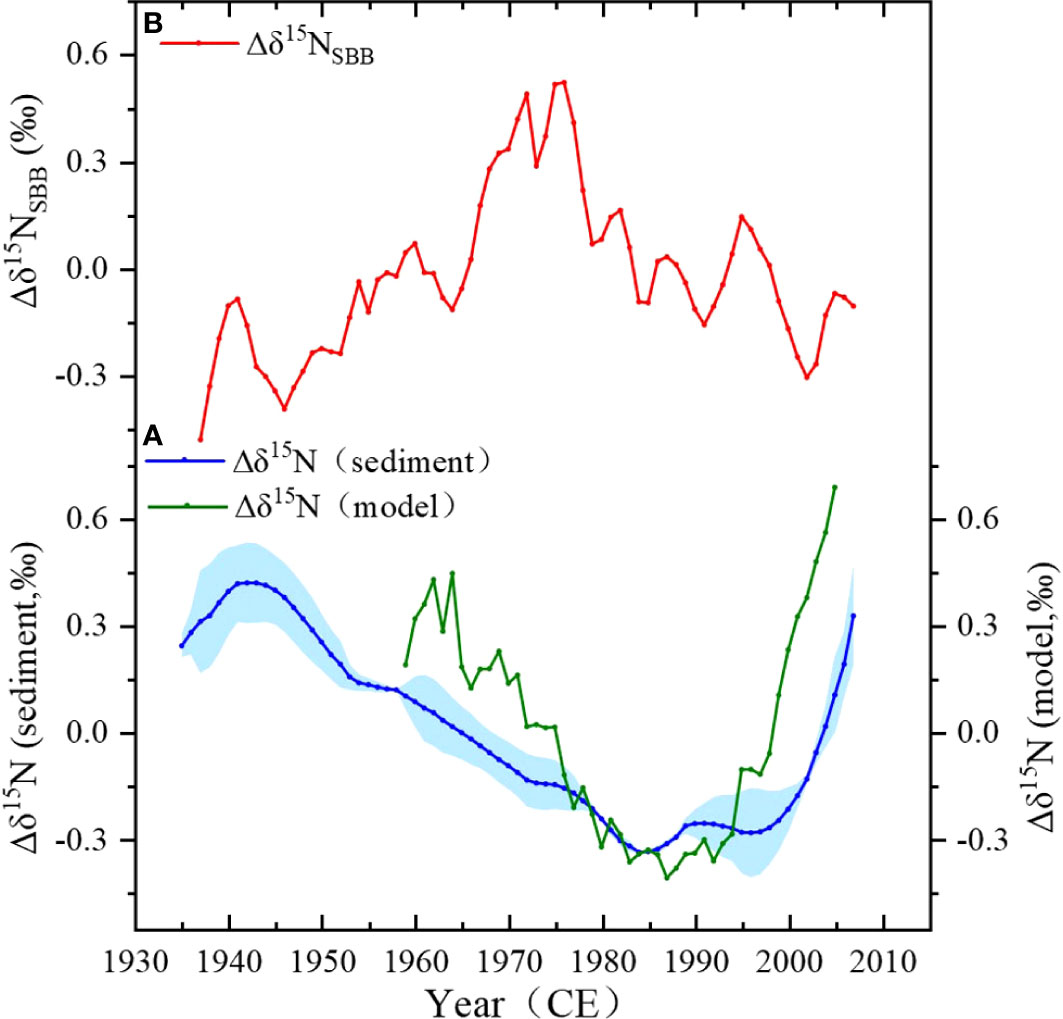
Figure 6 Calculation of ETNP Δδ15N and Δδ15NSBB. (A) Construction of the eastern tropical North Pacific (ETNP) Δδ15N signal, the blue curve shows the result of the average Δδ15N from Soledad and Pescadero sites, and the green curve shows the result of the model. (B) The calculated Δδ15NSBB (red curve).
Similarly, the Δδ15N (δ15N anomaly, deviation from the mean δ15N of 1935~2007) record for the SBB δ15Nsed record was obtained. By subtracting the ETNP Δδ15N from the SBB Δδ15N, the local Δδ15N in SBB (Δδ15NSBB) was produced, shown in Figure 6B (red curve). Note that the local anomaly signals are only accessible from 1938 to 2007 owing to the lack of availability of the ETNP Δδ15N since 2007. In Figure 6B, the Δδ15NSBB record ranges from −0.5 to 0.6, and the difference between the maximum and minimum value is 1.1, roughly equal to the change of bulk Δδ15N (1.2); therefore, the local effect of δ15Nsed is not insignificant. In addition, there are differences in the trend of Δδ15NSBB and bulk Δδ15N; the Δδ15NSBB appeared in decadal variations with a general increasing trend from 1945 to the late 1970s and a decreasing trend afterward. The outstanding peak of the Δδ15NSBB is during 1965~1978. In the following sections, we will discuss the causes of the variations in the Δδ15NSBB.
The main influencing factors for the Δδ15NSBB fluctuations are i) incomplete nitrate utilization, ii) terrestrial input, and iii) bottom water denitrification. First of all, in Section 3.3, we have demonstrated that the IN accounted for 16.9% of the TN on average in the sediments. This IN mainly from terrestrial clay-bound N (Hendy et al., 2015; Wang et al., 2019) has little influence on the SBB δ15Nsed. How the influence of terrestrial input of organic N is compared with TN from the water column in SBB remains unclear. Secondly, the additionally isotopic variability arising from incomplete surface nutrient utilization is insignificant in magnitude and also confined to seasonal timescales (Emmer and Thunell, 2000; Davis et al., 2019). Therefore, Factors i) and ii) may have minor impacts on the Δδ15NSBB fluctuations on interannual timescales. In this present work, bottom water denitrification is thought to majorly impact local δ15N variability. Denitrification in the anoxic waters and sediments in a semi-closed environment of SBB has been well documented in historic and modern records (Emmer and Thunell, 2000; Bograd et al., 2002; Goericke et al., 2015; Davis et al., 2019). SBB is influenced by Southern California eddy, which through strong vertical advection enhances water mixing (Chenillat et al., 2018). Chung (1973) reported a 222Rn-based estimate of 3.9 cm2/s for vertical eddy diffusivity in SBB, which yields a rough mixing time of 0.6–0.8 years for the basin water, implying significant and rapid water exchange across the bottom water and the overlying water (Sigman et al., 2003). In addition, tight correlations were observed between our Δδ15NSBB record and local redox proxies (Re/Mo ratio and C29 stanol/stenol ratio), which document SBB bottom water O2 condition (see the detailed discussion as follows), providing evidence that SBB local denitrification process affects sediment δ15N signal.
Molybdenum (Mo) and rhenium (Re) are redox-sensitive elements and can be accumulated in marine sediments beneath O2-depleted waters. However, authigenic Mo precipitation only proceeds in the presence of free HS− water, which is considered a more reducing environment compared with authigenic Re precipitation (Crusius et al., 1996). Thus, a decrease in sedimentary Re/Mo indicates the pore water shift from slightly to strongly reducing sulfidic environments (Crusius et al., 1996; Wang et al., 2017). In anoxic marine environments such as SBB, Re/Mo ratio in marine sediments is used to indicate changing redox conditions at the time of sediment deposition, with a higher Re/Mo ratio reflecting lower redox potential, or enhanced ODZ and denitrification degree and vice versa (Wang et al., 2017). Wang et al. (2017) measured total Mo and Re concentrations in the sediments and calculated enrichment factors for Re/Mo {(Re/Mo)EF; 3-year resolution)} in SBB from 1759 to 2008. In order to compare with this record, a linear extrapolation was used to obtain annual resolution by using Origin software. The Δδ15NSBB record of core SBB-190629 was compared with the (Re/Mo)EF record (Figure 7B) of core SPR0901-04BC, showing a strong negative correlation (r = −0.49, p< 0.05) which demonstrates that the Δδ15NSBB was controlled by redox conditions.
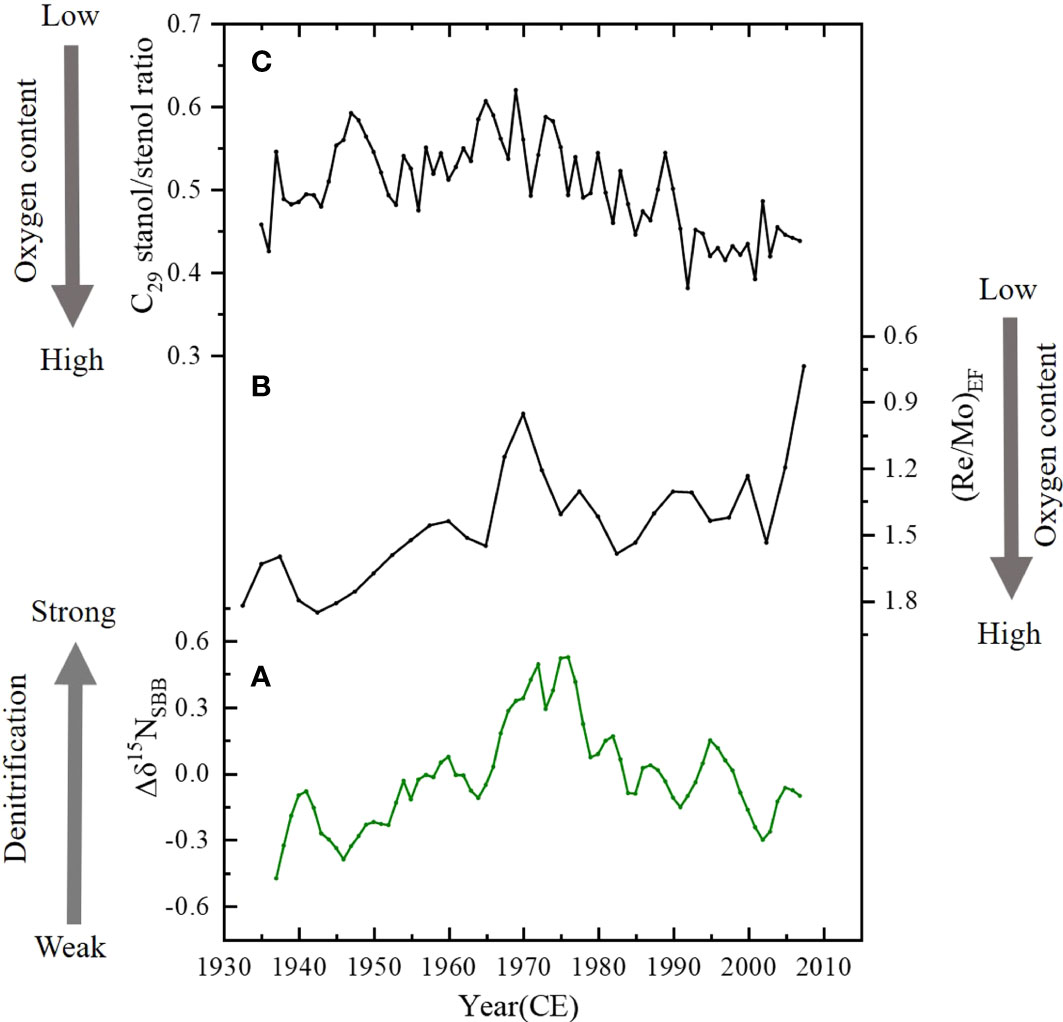
Figure 7 Comparisons of the (A) Δδ15NSBB with redox proxies: (B) (Re/Mo)EF record (Wang et al., 2017) and (C) C29 stanol/stenol ratio record (Alfken et al., 2021). Note that the scale of (Re/Mo)EF record is reversed.
Another redox-sensitive proxy in SBB is the C29 stanol/stenol ratio, as the 5α(H)-stanol/Δ5-stenol ratios increase through microbial conversion under anoxic conditions by the reduction of sterol Δ5 double bonds to 5α(H)-stanols (Rosenfeld and Hellmann, 1971; Eyssen et al., 1973). Thus, the C29 stanol/stenol ratio is used as an indicator of redox conditions related to oxygen availability in the sediments and bottom waters of the SBB, with a higher C29 stanol/stenol ratio reflecting lower redox potential, stronger anoxia, and denitrification and vice versa (Alfken et al., 2020). Alfken et al. (2021) used a matrix-assisted laser desorption/ionization coupled to Fourier transform-ion cyclotron resonance–mass spectrometry (MALDI-FT-ICR-MS) to measure C29 stanol/stenol from 1900 to 2009 (Figure 7C). We take the part of 1935–2009 for the comparison. In Figure 7, a general positive correlation between the C29 stanol/stenol ratio and Δδ15NSBB records further suggests that the change of Δδ15NSBB represents SBB bottom water denitrification. Note that the C29 stanol/stenol record was a few years ahead of the Δδ15NSBB record, which might be caused by chronological uncertainties or other unknown reasons. After the C29 stanol/stenol record was moved 5 years later, the positive correlation between the two records reaches the highest (r = 0.61, p< 0.01).
In summary, Figure 7 illustrates that the variations of the Δδ15NSBB record reflect changes in bottom water denitrification in SBB, with an increased Δδ15NSBB indicating reduced oxygen content and enhanced denitrification. According to the Δδ15NSBB record, the bottom water denitrification increased generally from 1945 to the late 1970s and then decreased at around 2000. The mechanisms controlling denitrification in SBB are discussed in detail as follows.
As mentioned earlier, denitrification in SBB bottom water can be affected by 1) oxygen consumption of OC, which is related to marine productivity, and 2) O2 input by flushing water from north of Point Conception, which are tightly connected with the local upwelling process. Variability of the upwelling north of Point Conception has been monitored since 1946 and can be described by the Pacific Fisheries Upwelling Index (PFEL) at 36°N (Davis et al., 2019). Upwelling provides nutrients to support phytoplankton growth in SBB (Checkley and Barth, 2009); stronger upwelling will cause higher productivity and result in higher marine OC (Wang et al., 2019). The general trend of marine OC (Figure 4) shows significant variability on a decadal timescale. The averages and standard deviations during 1937~1966, 1966~1982, 1982~2007, and 2007~2010 were 1.87 ± 0.16 (n = 61), 2.03 ± 0.27 (n = 23), 1.53 ± 0.42 (n = 47), and 2.10 ± 0.50 (n = 19) wt.%, respectively. The average and standard deviation during 1937~1966 indicate that the OCmarine had a small variation and was close to the average (1.83 wt.%) of the entire record. High contents prevailed during 1966~1982, and low OCmarine contents occurred during 1982~2007. However, the OCmarine record may involve a diagenetic effect. Marine biomarkers are considered an effective proxy for their resistance to sedimentary diagenesis and stable preservation in geological time, thus providing an independent measure of export productivity in the SBB water column. Figure 8 compares the Δδ15NSBB record (Figure 8A), the OCmarine record (Figure 8B), total marine biomarker (B + D + A) record (Figure 8C), and annual average upwelling index (Figure 8D). The comparisons showed good correlations among the four curves, indicating that higher OCmarine and total marine biomarker contents that resulted from higher productivity under stronger upwelling caused stronger denitrification in the SBB bottom water. According to the positive relationship between the Δδ15NSBB record and primary productivity records (Δδ15NSBB and OCmarine: r = 0.40, p< 0.01; Δδ15NSBB and marine biomarkers: r = 0.61, p< 0.01), enhanced productivity caused by upwelling (upwelling index and marine biomarkers r = 0.63, p< 0.01) should be more important than the O2 brought by flushing events from north of Point Conception to the denitrification in the bottom water of the SBB. This probably means that 1) the O2 amount brought by flushing events may be small, 2) the duration of the flushing events is short, and 3) the low O2 but high nutrient upwelled water is dominant so that the annual hypoxia condition of SBB would not be affected significantly by the flushing O2 amount. Therefore, upwelling and productivity seem to be the major factors to influence the δ15N in SBB.
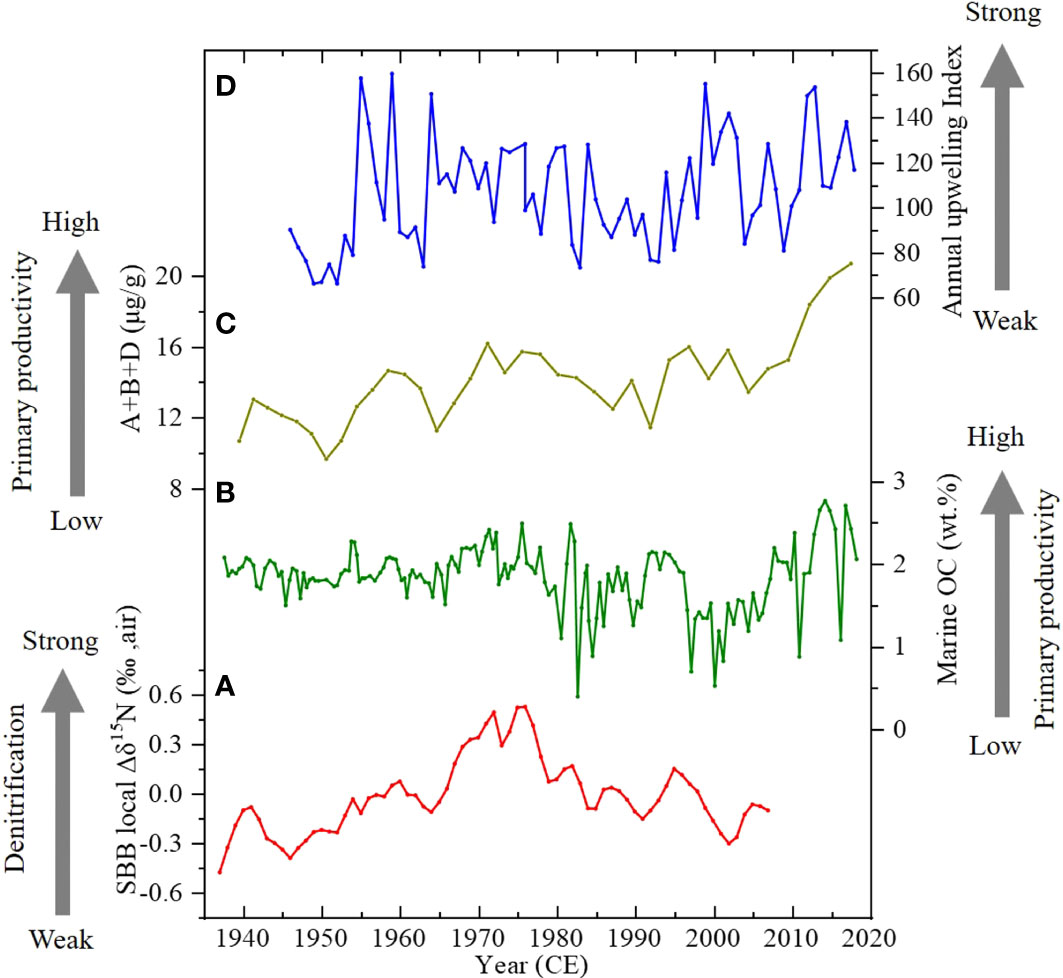
Figure 8 Comparisons of (A) the Δδ15NSBB, (B) OCmarine (wt.%), and (C) total biomarker content in core SBB-190629 with (D) annual average upwelling index in 36°N at the north of Point Conception (Davis et al., 2019).
Several studies have also found that local upwelling-induced productivity may cause the sediment δ15N changes in SBB, supporting our finding above (Wang et al., 2019; Sánchez et al., 2022). Wang et al. (2019) also proposed that nutrient-rich, higher δ15N subarctic water, which was caused by incomplete nitrate utilization in the subarctic region when the Aleutian low is strong, might have been transported into the SBB and was recorded by sediment δ15N during the Little Ice Age period. Indeed, a high-value state was found between 1965 and 1980 in our SBB δ15Nsed when PDO was in the negative phase. Considering the phase relationship of negative PDO vs weak Aleutian Low (Chavez et al., 2003; Hendy et al., 2015), the southward transport mechanism could not explain the high SBB δ15Nsed signal during 1965~1980, whereas the marine biomarkers, marine OC, and local redox proxies all support higher productivity and strengthened local denitrification in SBB during this time interval. Therefore, we suggest that the high value between 1965 and 1980 is more likely to be the result of local denitrification.
There have been many studies focusing on the climate effect on the bulk SBB δ15Nsed (Emmer and Thunell, 2000; Tems et al., 2015; Horak et al., 2016; Davis et al., 2019; Wang et al., 2019); however, studies specifically about the separate signals are limited. Since the variability of upwelling strength in the California Coast system on annual-to-decadal timescales is linked with ENSO (e.g., Bograd and Lynn, 2001), PDO (e.g., Chhak and Di Lorenzo, 2007), and NPGO (e.g., Di Lorenzo et al., 2008; García-Reyes and Largier, 2010), here we discuss the influences of the climatic forcing on the upwelling, production, and denitrification in SBB. In Figure 9, the records of ENSO, PDO, and NPGO were compared with the records of upwelling, marine biomarkers, OCmarine (reflecting marine productivity), and the Δδ15NSBB.
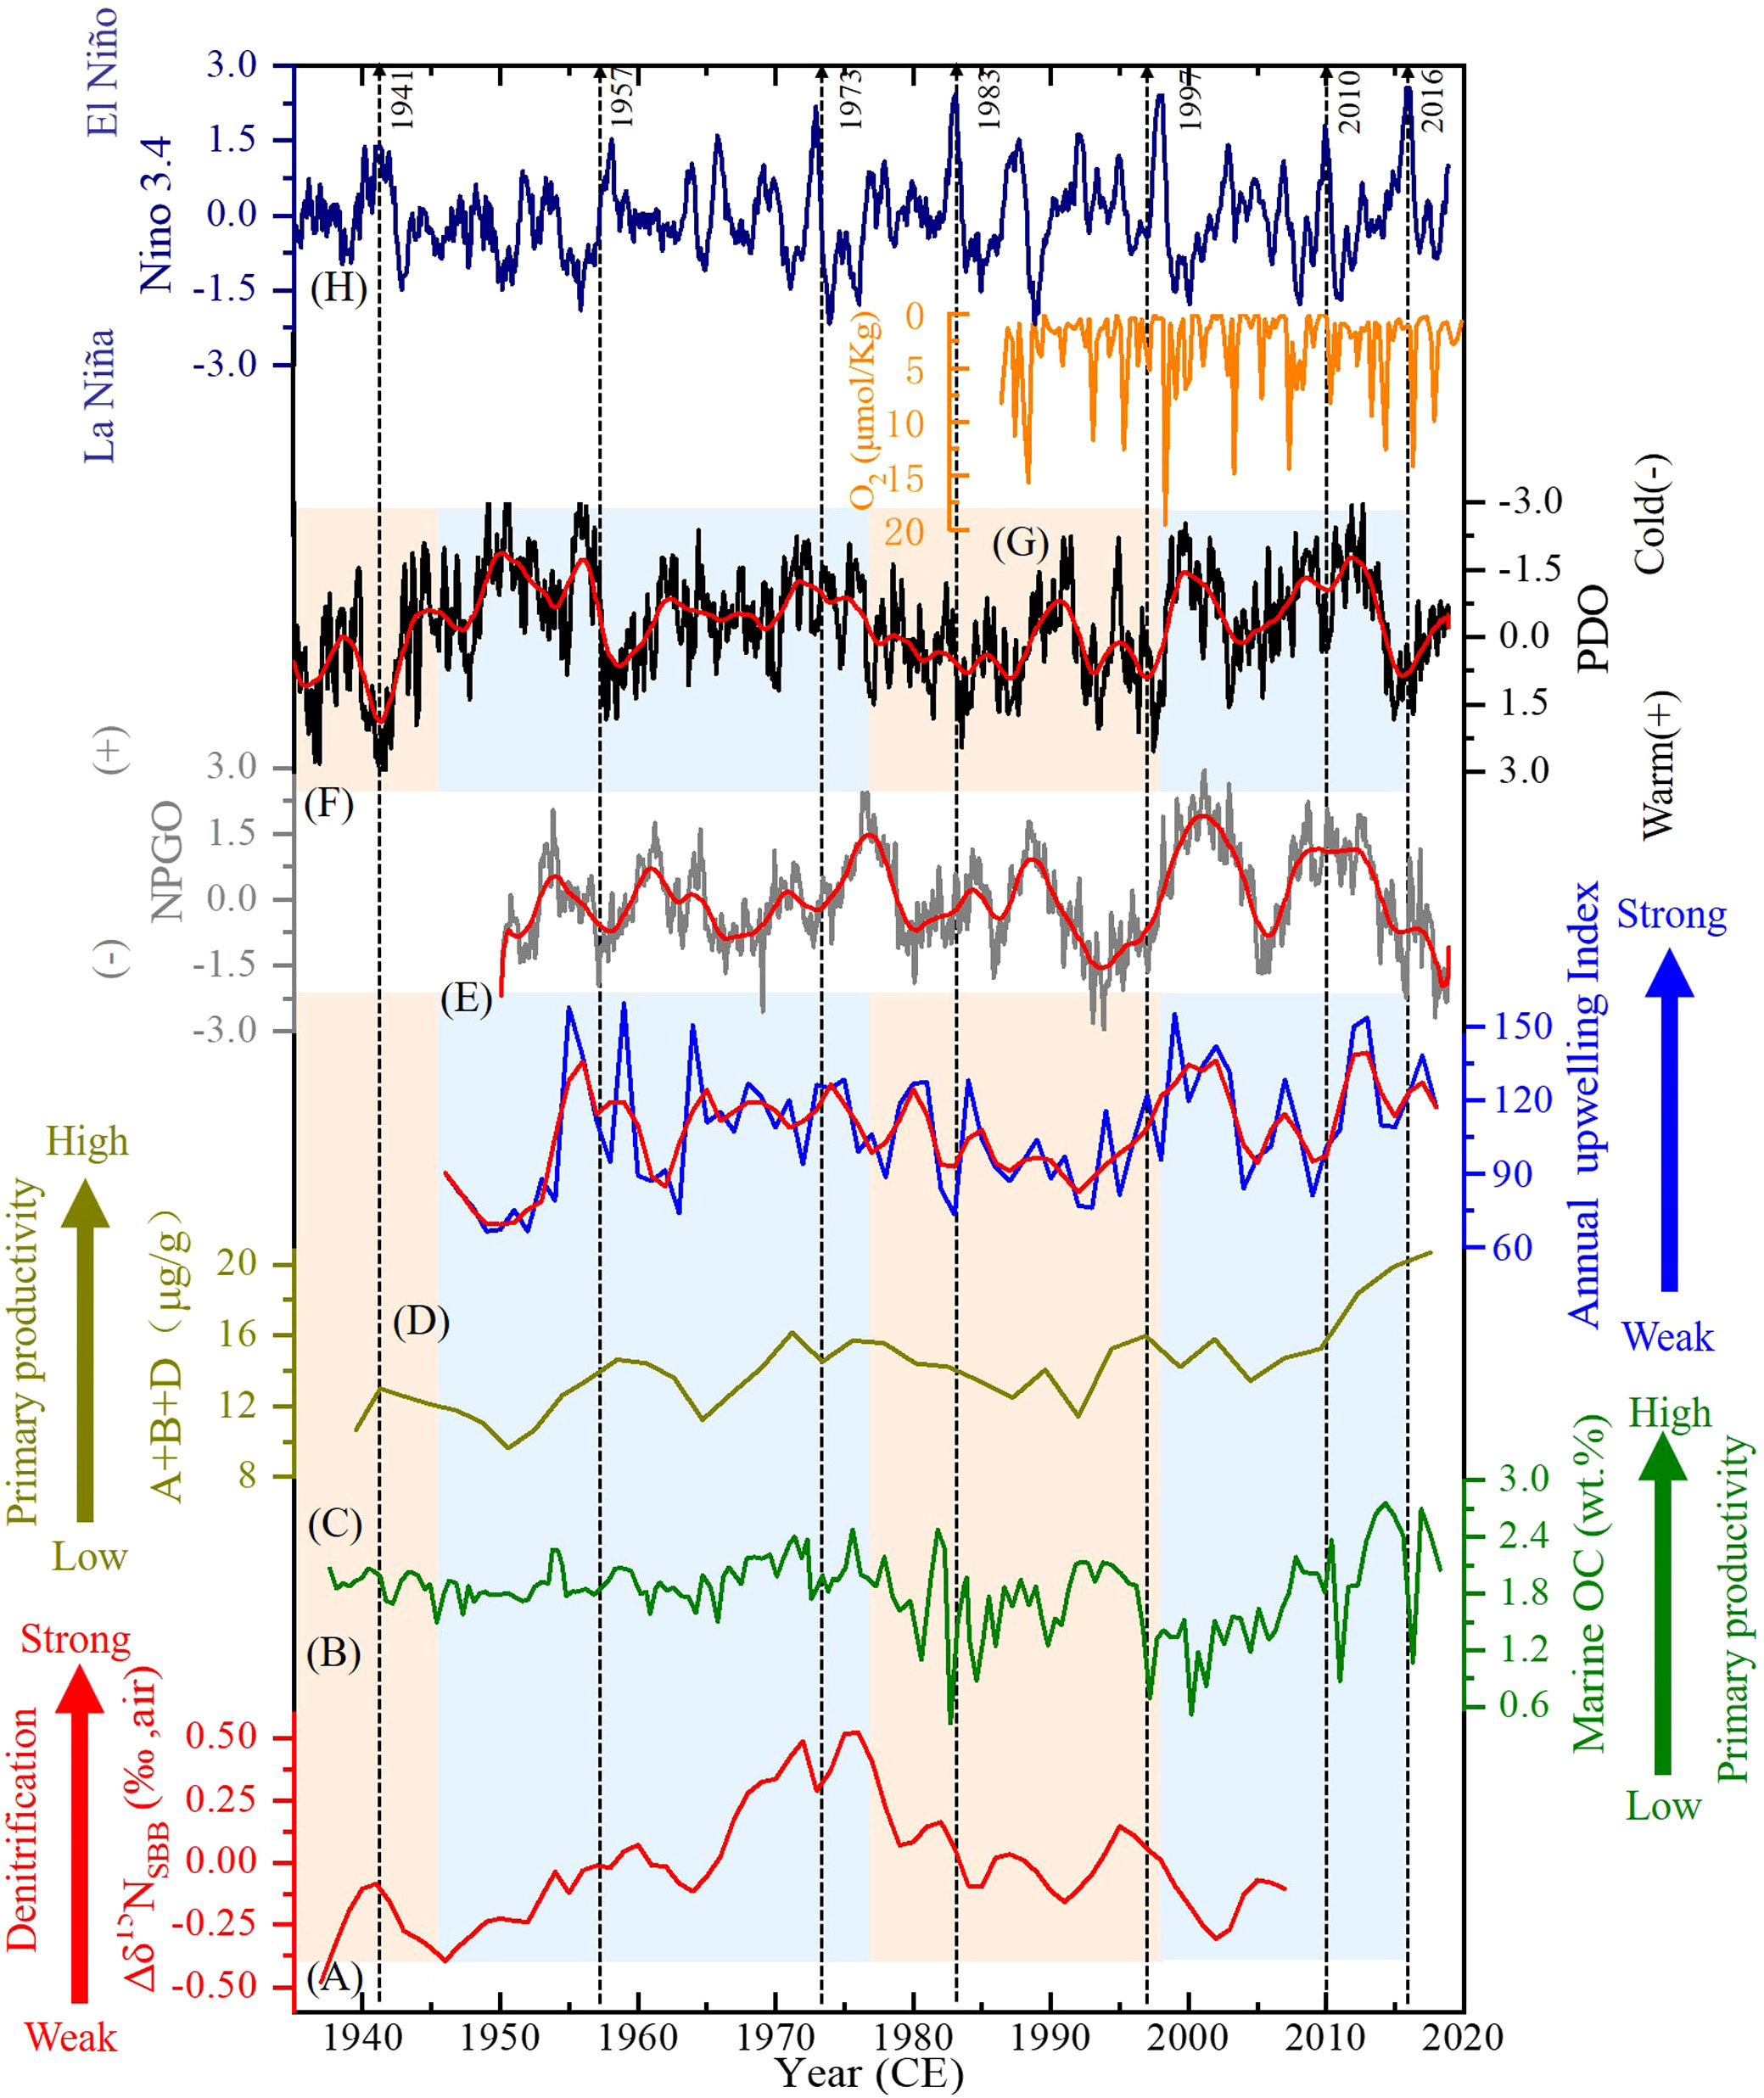
Figure 9 Comparisons of the Santa Barbara Basin (SBB) (A) local Δδ15N (‰), (B) OCmarine (wt.%), (C) marine biomarkers (μg/g), (D) annual upwelling index, and (G) O2 content (μmol/kg) records with (E) North Pacific Gyre Oscillation (NPGO) (http://www.o3d.org/npgo/). (F) Pacific Decadal Oscillation (PDO) (http://jisao.washington.edu/pdo/PDO), and (H) El Niño–Southern Oscillation (ENSO) (https://www.esrl.noaa.gov/psd/gcos_wgsp/Timeseries/) records. Strong El Niño events such as in 1941, 1957–1958, 1973, 1982–1983, 1997–1998, 2010, and 2016 are marked. Red lines in panels (D–F) represent the results of 3 years smoothed. Orange areas denote warm phase of PDO, whereas blue areas represent cold phase of PDO. Note that the scale of O2 content and PDO is reversed.
The ETNP denitrification is controlled by the variations in wind intensity over the tropical Pacific by eventually regulating the ocean water upwelling, the zonal structure of the underlying thermocline, area of oxygen minimum zone (OMZ), and biological productivity (Canfield, 2006; Deutsch et al., 2014; Tems et al., 2015; Horak et al., 2016). Stronger tropical trade winds will generate stronger upwelling along the equator divergent zones and enhance primary productivity (Sydeman et al., 2014). Consequently, the area of OMZ and denitrification in ETNP will be intensified, thus elevating Δδ15N of ETNP (Deutsch et al., 2014). The variations of δ15N signals by ETNP denitrification are further transported northward by CUC and finally recorded in SBB water and sediments. Therefore, tropical trade winds act as a remote influencing factor and control the general trend of SBB sedimentary δ15N (δ15Nsed) signature. The general decreasing trends of the δ15Nsed records shown in Figure 5 from 1940 to the late 1980s (except the SBB record) reflect reduced upwelling, productivity, and denitrification in the ETNP probably caused by the weakening of tropical trade wind (Deutsch et al., 2014; Tems et al., 2015). The strength of tropical trade wind remained low during 1980~2000 and then started to increase. Except for high values between 1965 and 1980, the SBB δ15Nsed variation follows that of the ETNP, suggesting that tropical trade wind induced ETNP water column δ15N change, which controlled the general trend of SBB δ15Nsed. After the removal of the distal δ15N signature (the ETNP δ15N) from the SBB δ15Nsed record, the local mechanism of the Δδ15NSBB trend needs an explanation.
The PDO is a long-term ocean fluctuation at the mid-latitudes of the Pacific Ocean and is controlled by the ocean–atmosphere climatic variability (Deser et al., 2004; Di Lorenzo et al., 2008). It is determined by the first dominant mode of variations in sea surface temperature (SST) and has triggered major environmental alterations in terms of physical and biological regime shifts along the western coast of North America (Di Lorenzo et al., 2008). The PDO shifts reflect changes in the strength and position of Aleutian low and concomitant changes in upwelling and SST, which have major environmental impacts in the area of SBB (Hendy et al., 2015). As shown in Figure 9, the positive (warm) PDO phase is associated with depressed thermocline and weakened upwelling with shallow water depth and therefore induces a significant decline in marine productivity in SBB (Chavez et al., 2003; Venrick, 2012; Hendy et al., 2015; Wang et al., 2017). The decreased marine productivity of positive PDO reduces bottom water denitrification, further inducing a decline of Δδ15NSBB. In contrast, the negative (cold) PDO phase is associated with higher productivity in SBB, which is attributed to intensified ocean water upwelling induced by the Aleutian low (Chavez et al., 2003; Di Lorenzo et al., 2008; Hendy et al., 2015), therefore increasing the Δδ15NSBB by enhancing bottom water denitrification in SBB. Hence, the PDO regime shift has a determining influence on the general trend of Δδ15NSBB on the decadal to centennial timescale.
The NPGO is a climate pattern that emerges as the second dominant mode of sea surface temperature variability in the Northeast Pacific and is driven by the atmosphere through the North Pacific Oscillation (Ceballos et al., 2009). The wind-driven upwelling and horizontal advection are the main driving factors of NPGO fluctuations, and their variations are correlated with salinity, nutrients, and chlorophyll of the central and eastern branches of the subtropical gyre (Di Lorenzo et al., 2008). However, the NPGO impact cannot be addressed before 1950 owing to the availability of NPGO indices only after 1950. According to the observation, positive correlations between the salinity, content, and Chl-a of CC and NPGO strength (Di Lorenzo et al., 2008) imply that stronger NPGO causes stronger upwelling in the south of 38°N areas. However, only a weak positive correlation between NPGO and upwelling (r = 0.27, p< 0.05) in SBB may be due to the alternating effects of the phase relationship between fluctuations of the PDO and NPGO modes. As the different dominant mode of SST in the Northeast Pacific, the NPGO index is plotted inversely for comparison with the PDO in general. In Figure 9, negative relationships between NPGO and PDO can be observed clearly after 1986; however, the relationships between the two were obscure before 1986. Therefore, the phase relationship between NPGO and PDO is complicated. For instance, during 1986~2015, the two parameters were strongly negatively correlated (in phase). In this period, the impacts of PDO and NPGO on the upwelling and productivity are in the same direction in SBB. Indeed, significant correlations are found between NPGO, PDO, and upwelling (NPGO and upwelling: r = 0.48, p< 0.001, PDO and upwelling: r = −0.44, p< 0.001). In contrast, during 1950~1985, the two parameters were out of phase. Under such circumstances, the effects of PDO and NPGO on upwelling and productivity would be opposite; thus, in this period, there is no direct correlativity between climate indexes, and upwelling can be found. In principle, the interaction of NPGO and PDO common controls the intensity of upwelling and primary productivity, further influencing denitrification in SBB on interannual timescales.
Previous studies have found increased SST and decreased upwelling in SBB, low O2 content in the bottom water of SBB during El Niño events, and opposite situations during La Niña events (Goericke et al., 2015; Wang et al., 2017). The O2 content in the bottom water of SBB from California Cooperative Oceanic Fisheries Investigations (CalCOFI) during 1987~2010 is compared with our records. Furthermore, the annual upwelling record and the Niño 3.4 record are also compared with our records (Figure 9). In Figure 9, several strong El Niño events such as in 1941, 1957–1958, 1973, 1982–1983, 1997–1998, 2010, and 2016 are marked. On the annual timescale, the relationships between ENSO phases and other parameters are inconsistent; however, the comparison does appear to indicate low upwelling (hence low productivity) and high O2 content (due to low organic consumption) corresponding to strong El Niño events, and low OCmarine in the sediment record, e.g., 1983, 1997, and 2010, and vice versa during strong La Niña events, e.g., around 1989, 2000, and 2012. In contrast, not every equatorial El Niño affects SBB (Alfken et al., 2021). For instance, the broad OCmarine and Δδ15NSBB peaks centered at approximately 1941 and 1994 were matched with mainly El Niño conditions, and low upwelling, OCmarine content, and Δδ15NSBB at around 1950, 1964, and 1990 were matched with mainly La Niña conditions. In general, some strong ENSO events influence seasonal physical and biological fluctuations in SBB on the foundation of PDO and NPGO, but due to the chronology of core SBB-190629, it was used a linear sedimentation rate, and its uncertainty could be > ± 2 years in some sections. The comparison can only be valid on interannual-to-decadal timescales.
The high-resolution (~0.25-year) multi-proxy analyses including TOC, TN, biomarkers, and δ15N of a 46-cm sediment core (SBB-190629) collected from the SBB reveal the role of local and remote influencing factors in controlling interannual δ15N variations from 1938 to 2019 CE. The δ15Nsed records from the ETNP anoxic zone (Pescadero Slope and Soledad Basin) are further evaluated to distinctly identify the transported ETNP δ15N signature and local δ15N signal variability. With the use of the deviation from the mean δ15N (Δδ15N) of SBB-190629 to subtract the Δδ15N of ETNP, Δδ15NSBB fluctuations have been generated. The Δδ15NSBB reflects the bottom water denitrification, which is mainly influenced by changes in oxygen content and productivity associated with oceanic water upwelling. The comparisons between the Δδ15NSBB record and redox-sensitive multi-proxies including the Re/Mo ratio, C29 stanol/stenol ratio, OCmarine content, and total marine biomarker concentration authenticate the Δδ15NSBB as an indicator of bottom water denitrification, which is proportional to marine productivity and upwelling intensity in the SBB. In general, strong upwelling brings more nutrients and elevates marine productivity to lower O2 content in the water column during La Niña and cold PDO conditions, resulting in high OCmarine and more denitrification (higher δ15N) and vice versa under El Niño and warm PDO. Such phenomena can be seen on annual timescales. However, the relationships of the SBB OCmarine and δ15N records with ENSO and PDO records on longer-than-annual timescales are complicated because upwelling and O2 content in the SBB can be influenced by PDO, NPGO, and ENSO. The combination of these climatic forcing factors has different impacts on the marine productivity in SBB at different timescales. Tropical trade winds act as a remote influencing factor and control the general trend of SBB sedimentary δ15N (δ15Nsed) signature by transporting ETNP δ15N signal to SBB. The general decreasing trend of the ETNP δ15N from 1940 to the late 1980s probably reflected reduced upwelling, productivity, and denitrification caused by the weakening of tropical trade winds. The strength of tropical trade winds remained low during 1980~2000 and then started to increase afterward.
The datasets presented in this study can be found in online repositories. The names of the repository/repositories and accession number(s) can be found in the article/Supplementary Material.
H-CL, D-WL, and HX designed the study and wrote the paper. H-CL provided accurate dating of core SBB-190629, and HX carried out measurements on total organic carbon, total nitrogen, biomarkers, and nitrogen isotopes. All co-authors provided intellectual input for data interpretation and writing of this manuscript. All authors contributed to the article and approved the submitted version.
This study was supported by the National Natural Science Foundation of China (Grant No. 41876076) to D-WL, the National Natural Science Foundation of China (Grant No. 41630966) to MZ, and grants from the Ministry of Science and Technology of Taiwan (MOST 107-2116-M-002-005, MOST 108-2116-M-002-012, MOST 109-2116-M-002-018 and MOST 110-2116-M-002-015) to H-CL.
We thank Dr. D. Burdige at Old Dominion University and Dr. T. Komada at San Francisco State University for their coring.
The authors declare that the research was conducted in the absence of any commercial or financial relationships that could be construed as a potential conflict of interest.
All claims expressed in this article are solely those of the authors and do not necessarily represent those of their affiliated organizations, or those of the publisher, the editors and the reviewers. Any product that may be evaluated in this article, or claim that may be made by its manufacturer, is not guaranteed or endorsed by the publisher.
The Supplementary Material for this article can be found online at: https://www.frontiersin.org/articles/10.3389/fmars.2022.982051/full#supplementary-material
Alfken S., Wörmer L., Lipp J. S., Napier T., Elvert M., Wendt J., et al. (2021). Disrupted coherence between upwelling strength and redox conditions reflects source water change in Santa Barbara basin during the 20th century. Paleoceanogr. Paleoclimatology 36 (12), e2021PA004354. doi: 10.1029/2021PA004354
Alfken S., Wörmer L., Lipp J. S., Wendt J., Schimmelmann A., Hinrichs K.-U. (2020). Mechanistic insights into molecular proxies through comparison of subannually resolved sedimentary records with instrumental water column data in the Santa Barbara basin, southern California. Paleoceanogr. Paleoclimatol. 35 (10), e2020PA004076. doi: 10.1029/2020PA004076
Altabet M. A. (2006). “Isotopic tracers of the marine nitrogen cycle: present and past.”, in Marine organic matter: biomarkers, isotopes and DNA. ed. Volkman J. K. (Berlin, Heidelberg: Springer), 251–293.
Altabet M. A., Pilskaln C., Thunell R., Pride C., Sigman D., Chavez F., et al. (1999). The nitrogen isotope biogeochemistry of sinking particles from the margin of the Eastern north pacific. Deep-Sea Res. Part I-Oceanogr. Res. Pap. 46, 655–679. doi: 10.1016/S0967-0637(98)00084-3
Bograd S. J., Lynn R. J. (2001). Physical-biological coupling in the California current during the 1997–99 El niño-la niña cycle. Geophys. Res. Lett. 28 (2), 275–278. doi: 10.1029/2000GL012047
Bograd S. J., Schwing F. B., Castro C. G., Timothy D. A. (2002). Bottom water renewal in the Santa Barbara basin. Geophys. Res.-Oceans 107, 9–1-9-9. doi: 10.1029/2001JC001291
Canfield D. (2006). Models of oxic respiration, denitrification and sulfate reduction in zones of coastal upwelling. Geochim. Cosmochim. Acta 70, 5753–5765. doi: 10.1016/j.gca.2006.07.023
Ceballos L. I., Di Lorenzo E., Hoyos C. D., Schneider N., Taguchi B. (2009). North pacific gyre oscillation synchronizes climate fluctuations in the Eastern and Western boundary systems. J. Clim. 22 (19), 5163–5174. doi: 10.1175/2009JCLI2848.1
Chavez F. P., Ryan J., Lluch-Cota S. E., Nãiquen C. M. (2003). From anchovies to sardines and back: Multidecadal change in the pacific ocean. Science 299 (5604), 217–221. doi: 10.1126/science.1075880
Checkley J. D.M., Barth J. A. (2009). Patterns and processes in the California current system. Prog. Oceanogr. 83 (1-4), 49–64. doi: 10.1016/j.pocean.2009.07.028
Chenillat F., Franks P. J., Capet X., Rivière P., Grima N., Blanke B., et al. (2018). Eddy properties in the southern California current system. Ocean Dyn. 68 (7), 761–777. doi: 10.1007/s10236-018-1158-4
Chhak K., Di Lorenzo E. (2007). Decadal variations in the California current upwelling cells. Geophys. Res. Lett. 34 (14), L14604. doi: 10.1029/2007GL030203
Chung Y. C. (1973). Excess radon in the Santa Barbara basin. Earth Planet. Sci. Lett. 17 (2), 319–323. doi: 10.1016/0012-821X(73)90196-9
Crusius J., Calvert S., Pedersen T., Sage D. (1996). Rhenium and molybdenum enrichments in sediments as indicators of oxic, suboxic and sulfidic conditions of deposition. Earth Planet. Sci. Lett. 145 (1-4), 65–78. doi: 10.1016/S0012-821X(96)00204-X
Davis C. V., Ontiveros-Cuadras J. F., Benitez-Nelson C., Schmittner A., Tappa E. J., Osborne E., et al. (2019). Ongoing increase in Eastern tropical north pacific denitrification as interpreted through the Santa Barbara basin sedimentary δ15N record. Paleoceanogr. Paleoclimatol. 34, 1554–1567. doi: 10.1029/2019PA003578
Deser C., Phillips A. S., Hurrell J. W. (2004). Pacific interdecadal climate variability: Linkages between the tropics and the north pacific during boreal winter since 1900. J. Clim. 17 (16), 3109–3124. doi: 10.1175/1520-0442(2004)017<3109:PICVLB>2.0.CO;2
Deutsch C., Berelson W., Thunell R., Weber T., Tems C., McManus J., et al. (2014). Centennial changes in north pacific anoxia linked to tropical trade winds. Science 345, 665–668. doi: 10.1126/science.1252332
Di Lorenzo E., Schneider N., Cobb K. M., Franks P. J. S., Chhak K., Miller A. J., et al. (2008). North pacific gyre oscillation links ocean climate and ecosystem change. Geophys. Res. Lett. 35 (8), L08607. doi: 10.1029/2007GL032838
Emmer E., Thunell R. C. (2000). Nitrogen isotope variations in Santa Barbara basin sediments: Implications for denitrification in the eastern tropical north pacific during the last 50,000 years. Paleoceanogr. Paleoclimatol. 15, 377–387. doi: 10.1029/1999PA000417
Eyssen H. J., Parmentier G. G., Compernolle F. C., de Pauw G., Piessens-Denef M. (1973). Biohydrogenation of sterols by eubacterium ATCC 21,408–Nova species. Eur. J. Biochem. 36 (2), 411–421. doi: 10.1111/j.1432-1033.1973.tb02926.x
García-Reyes M., Largier J. (2010). Observations of increased wind-driven coastal upwelling off central California. J. Geophys. Res.-Oceans 115 (C4), C04011. doi: 10.1029/2009JC005576
Goericke R., Bograd S. J., Grundle D. S. (2015). Denitrification and flushing of the Santa Barbara basin bottom waters. Deep-Sea Res. Part II-Top. Stud. Oceanogr. 112, 53–60. doi: 10.1016/j.dsr2.2014.07.012
Hendy I. L., Napier T. J., Schimmelmann A. (2015). From extreme rainfall to drought: 250 years of annually resolved sediment deposition in Santa Barbara basin, California. Quat. Int. 387, 3–12. doi: 10.1016/j.quaint.2015.01.026
Horak R. E., Ruef W., Ward B. B., Devol A. H. (2016). Expansion of denitrification and anoxia in the eastern tropical north pacific from 1972 to 2012. Geophys. Res. Lett. 43, 5252–5260. doi: 10.1002/2016GL068871
Howard J. A. E., Jarre A., Clark A. E., Moloney C. L. (2007). Application of the sequential t-test algorithm for analysing regime shifts to the southern benguela ecosystem. Afr. J. Mar. Sci. 29, 437–451. doi: 10.2989/AJMS.2007.29.3.11.341
Hu L., Shi X., Guo Z., Wang H., Yang Z. (2013). Sources, dispersal and preservation of sedimentary organic matter in the yellow Sea: the importance of depositional hydrodynamic forcing. Mar. Geol. 335, 52–63. doi: 10.1016/j.margeo.2012.10.008
Komada T., Druffel E. R. M., Trumbore S. E. J. (2004). Oceanic export of relict carbon by small mountainous rivers. Geophys. Res. Lett. 2004, 31(7):L07504. doi: 10.1029/2004GL019512
Lamb A. L., Wilson G. P., Leng M. J. (2006). A review of coastal palaeoclimate and relative sea-level reconstructions using δ13C and C/N ratios in organic material. Earth-Sci. Rev. 75 (1-4), 29–57. doi: 10.1016/j.earscirev.2005.10.003
Liu K. K., Kaplan I. R. (1989). The eastern tropical pacific as a source of 15N-enriched nitrate in seawater off southern California. Limnology and Oceanography 34 (5), 820–830. doi: 10.4319/lo.1989.34.5.0820
Li H.-C., Wang J., Sun J.-J., Chou C.-Y., Li H.-K., Xia Y.-Y., et al. (2019). Study of jinchuan mire in NE China I: AMS 14C, 210Pb and 137Cs dating on peat cores. Quat. Int. 528, 9–17. doi: 10.1016/j.quaint.2019.07.020
Li D., Zhao M., Chen M. T. (2014). East Asian Winter monsoon controlling phytoplankton productivity and community structure changes in the southeastern south China Sea over the last 185 kyr. Paleogeogr. Paleoclimatol. Paleoecol. 414 (0), 233–242. doi: 10.1016/j.palaeo.2014.09.003
Margolskee A., Frenzel H., Emerson S., Deutsch C. (2019). Ventilation pathways for the north pacific oxygen deficient zone. Glob. Biogeochem. Cycle 33, 875–890. doi: 10.1029/2018GB006149
Masiello C. A., Druffel E. R. (2001). Carbon isotope geochemistry of the Santa Clara river. Glob. Biogeochem. Cycle 15, 407–416. doi: 10.1029/2000GB001290
Meyers P. A. (1997). Organic geochemical proxies of paleoceanographic, paleolimnologic, and paleoclimatic processes. Org. Geochem. 27, 213–250. doi: 10.1016/S0146-6380(97)00049-1
Müller P. J. (1977). CN ratios in pacific deep-sea sediments: Effect of inorganic ammonium and organic nitrogen compounds sorbed by clays. Geochim. Cosmochim. Acta 41 (6), 765–776. doi: 10.1016/0016-7037(77)90047-3
Osborne E. B., Thunell R. C., Marshall B. J., Holm J. A., Tappa E. J., Benitez-Nelson C., et al. (2016). Calcification of the planktonic foraminifera globigerina bulloides and carbonate ion concentration: Results from the Santa Barbara basin. Paleoceanogr. Paleoclimatology 31, 1083–1102. doi: 10.1002/2016PA002933
Rayner N., Parker D. E., Horton E., Folland C. K., Alexander L. V., Rowell D., et al. (2003). Global analyses of sea surface temperature, sea ice, and night marine air temperature since the late nineteenth century. J. Geophys. Res.-Atmos. 108 (D14), 4407. doi: 10.1029/2002JD002670
Rodionov S. N. (2004). A sequential algorithm for testing climate regime shifts. Geophys. Res. Lett. 31 (9), L09204. doi: 10.1029/2004GL019448
Rodionov S., Overland J. E. (2005). Application of a sequential regime shift detection method to the Bering Sea ecosystem. ICES J. Mar. Sci. 62, 328–332. doi: 10.1016/j.icesjms.2005.01.013
Rosenfeld R. S., Hellmann L. (1971). Reduction and esterification of cholesterol and sitosterol by homogenates of feces. J. Lipid Res. 12 (2), 192–197. doi: 10.1016/S0022-2275(20)39529-8
Sánchez A., Juárez M., Ortiz-Hernández M. C., Domínguez-Samalea Y. (2022). Variability of the oxygen minimum zone associated with primary productivity and hydrographic conditions in the Eastern north pacific during the last 1200 years. Deep-Sea Res. Part I-Oceanogr. Res. Pap. 186, 103810. doi: 10.1016/j.dsr.2022.103810
Sarno C. T., Benitez-Nelson C. R., Ziolkowski L. A., Hendy I. L., Davis C. V., Tappa E. J., et al. (2020). The impacts of flood, drought, and turbidites on organic carbon burial over the past 2,000 years in the Santa Barbara basin, california. Paleoceanogr. Paleoclimatology 35, e2020PA003849. doi: 10.1029/2020PA003849
Schubert C. J., Calvert S. E. (2001). Nitrogen and carbon isotopic composition of marine and terrestrial organic matter in Arctic ocean sediments: implications for nutrient utilization and organic matter composition. Deep-Sea Res. Part I-Oceanogr. Res. Pap. 48, 789–810. doi: 10.1016/S0967-0637(00)00069-8
Schubert C., Villanueva J., Calvert S., Cowie G., Von Rad U., Schulz H., et al. (1998). Stable phytoplankton community structure in the Arabian Sea over the past 200,000 years. Nature 394 (6693), 563–566. doi: 10.1038/29047
Sigman D. M., Granger J., DiFiore P. J., Lehmann M. M., Ho R., Cane G., et al. (2005). Coupled nitrogen and oxygen isotope measurements of nitrate along the eastern north pacific margin. Glob. Biogeochem. Cycle 19 (4), GB4022. doi: 10.1029/2005GB002458
Sigman D. M., Robinson R., Knapp A. N., van Geen A., McCorkle D. C., Brandes J. A., et al. (2003). Distinguishing between water column and sedimentary denitrification in the Santa Barbara basin using the stable isotopes of nitrate. Geochem. Geophys. Geosyst. 4, 1–20. doi: 10.1029/2002GC000384
Sydeman W., Garcia-Reyes M., Schoeman D., Rykaczewski R., Thompson S., Black B., et al. (2014). Climate change and wind intensification in coastal upwelling ecosystems. Science 345, 77–80. doi: 10.1126/science.12516
Tems C. E., Berelson W. M., Prokopenko M. G. (2015). Particulate δ15N in laminated marine sediments as a proxy for mixing between the California undercurrent and the California current: A proof of concept. Geophys. Res. Lett. 42, 419–427. doi: 10.1126/science.1251635
Thornton S. F., McManus J. (1994). Application of organic carbon and nitrogen stable isotope and C/N ratios as source indicators of organic matter provenance in estuarine systems: evidence from the Tay estuary, Scotland. Estuar. Coast. Shelf Sci. 38 (3), 219–233. doi: 10.1006/ecss.1994.1015
Thunell R. C. (1998). Particle fluxes in a coastal upwelling zone: sediment trap results from Santa Barbara basin, California. Deep-Sea Res. Part II-Top. Stud. Oceanogr. 45 (8-9), 1863–1884. doi: 10.1016/S0967-0645(98)80020-9
Thunell R. C., Kepple A. B. (2004). Glacial-Holocene δ15N record from the gulf of tehuantepec, Mexico: Implications for denitrification in the eastern equatorial pacific and changes in atmospheric N2O. Glob. Biogeochem. Cycle 18, 1–12. doi: 10.1029/2002GB002028
Van Geen A. (2001). Baja California Coring cruise OXMZ01MV: core descriptions and CTD/Rosette data: RV Melville, Lamont-Doherty Earth Observatory, Technical Report LDEO 2001-01.
Venrick E. L. (2012). Phytoplankton in the California current system off southern California: Changes in a changing environment. Prog. Oceanogr. 104, 46–58. doi: 10.1016/j.pocean.2012.05.005
Volkman J. K. (1986). A review of sterol markers for marine and terrigenous organic matter. Org. Geochem. 9 (2), 83–99. doi: 10.1016/0146-6380(86)90089-6
Volkman J. K., Barrett S. M., Blackburn S. I., Mansour M. P., Sikes E. L., Gelin F. (1998). Microalgal biomarkers: a review of recent research developments. Org. Geochem. 29 (5-7), 1163–1179. doi: 10.1016/S0146-6380(98)00062-X
Wang Y., Hendy I., Napier T. J. (2017). Climate and anthropogenic controls of coastal deoxygenation on interannual to centennial timescales. Geophys. Res. Lett. 44, 11,528–511,536. doi: 10.1002/2017GL075443
Wang Y., Hendy I. L., Thunell R. (2019). Local and remote forcing of denitrification in the northeast pacific for the last 2,000 years. Paleoceanogr. Paleoclimatol. 34, 1517–1533. doi: 10.1029/2019PA003577
Ward B. B. (2011). “Nitrification in the ocean.B ,” in Nitrification, ed. Ward B. B., Arp D. J., Klotz M. G. (Washington, DC: American Society for Microbiology Press), 323–345.
White M. E., Rafter P. A., Stephens B. M., Wankel S. D., Aluwihare L. I. (2019). Recent increases in water column denitrification in the seasonally suboxic bottom waters of the Santa Barbara basin. Geophys. Res. Lett. 46, 6786–6795. doi: 10.1029/2019GL082075
Keywords: δ15Nsed variation, denitrification, Santa Barbara Basin, climatic forcing, Eastern Tropical Northern Pacific ventilation
Citation: Xu H, Li D-W, Li H-C, Zhao M, Berelson WM, Jin G, Li L and Misra S (2022) Local and remote forcing on the interannual variations of the sedimentary δ15N in Santa Barbara Basin during the past 80 years. Front. Mar. Sci. 9:982051. doi: 10.3389/fmars.2022.982051
Received: 30 June 2022; Accepted: 10 August 2022;
Published: 02 September 2022.
Edited by:
Jing Wei, Sun Yat-sen University, ChinaReviewed by:
Anirban Chakraborty, Idaho State University, United StatesCopyright © 2022 Xu, Li, Li, Zhao, Berelson, Jin, Li and Misra. This is an open-access article distributed under the terms of the Creative Commons Attribution License (CC BY). The use, distribution or reproduction in other forums is permitted, provided the original author(s) and the copyright owner(s) are credited and that the original publication in this journal is cited, in accordance with accepted academic practice. No use, distribution or reproduction is permitted which does not comply with these terms.
*Correspondence: Hong-Chun Li, aGNsaTE5NjBAbnR1LmVkdS50dw==
†These authors have contributed equally to this work
Disclaimer: All claims expressed in this article are solely those of the authors and do not necessarily represent those of their affiliated organizations, or those of the publisher, the editors and the reviewers. Any product that may be evaluated in this article or claim that may be made by its manufacturer is not guaranteed or endorsed by the publisher.
Research integrity at Frontiers
Learn more about the work of our research integrity team to safeguard the quality of each article we publish.