 Eunho Ko
 Maxim Y. Gorbunov
 Jinyoung Jung
 Youngju Lee
 Kyoung-Ho Cho
 Eun Jin Yang
 Jisoo Park
- 1Division of Ocean Sciences, Korea Polar Research Institute, Incheon, South Korea
- 2Department of Marine and Coastal Science, Rutgers University, New Brunswick, NJ, United States
Vertical distributions of phytoplankton in the Arctic Ocean are characterized by a very narrow subsurface chlorophyll maximum (SCM) layer formed every summer after the sea ice retreats. Despite the prevalence of this narrow SCM layer, phytoplankton photosynthetic response to climate change remains to be elucidated. Here, we examined the photophysiological properties of phytoplankton in the SCM layer in the northern Chukchi Sea during the summers of 2015–2018. There was a significant difference in the SCM depth between the northwestern and northeastern Chukchi Sea determined by the distribution of Pacific Summer Water (PSW) around the SCM layer (34 ± 14 m vs. 49 ± 10 m, respectively). The maximum quantum yield of photochemistry in photosystem II (Fv/Fm) in the SCM phytoplankton was high (Fv/Fm ≥ 0.54) and similar in both regions until 2016; however, since then, Fv/Fm in the northeastern Chukchi Sea has decreased by approximately 10%. This decrease was accompanied by a marked decrease in the fraction of microplankton, which are known to be susceptible to nutrient limitation. This result suggests a reduction in nitrogen availability in the SCM layer in the northeastern Chukchi Sea. Meanwhile, the maximum electron transfer rate (ETRmax) did not have a significant relationship with the nitrogen availability and phytoplankton community size structure in the SCM layer; however the improved light conditions (with an approximately two-fold increase in the relative ratio of surface PAR reaching the SCM layer) increased ETRmax by up to 30% in the SCM phytoplankton in the northwestern Chukchi Sea. Therefore, these results provide a better understanding of how changes in nitrogen and light availability could affect phytoplankton photosynthesis and primary production in the Arctic Ocean.
Introduction
Phytoplankton in the Arctic Ocean have been exposed to rapid changes in the marine environment, including sea ice reduction and warming (Wassmann et al., 2011; Tremblay et al., 2012). Observations in the Arctic Ocean showed that surface water temperature continued to rise from 1982 to 2018 (Carvalho and Wang, 2020), and the Arctic warming resulted in a drastic decline in sea ice (Comiso et al., 2017). For instance, the sea ice extent in September decreased by approximately 40% from 1981 to 2010 (Serreze and Stroeve, 2015). This reduction in sea ice led to an increase in fresh water content, which strengthened the stratification of the upper water column (Stroeve et al., 2007; Wang et al., 2019). The early retreat and thinning of sea ice allowed early light to penetrate into the water column, thus leading to the early development of spring phytoplankton bloom or developing massive under-ice phytoplankton bloom, which would have consumed nutrients in the surface layer (Wassmann et al., 2011; Arrigo et al., 2012). In addition, fall blooms have begun to be observed in the Arctic Ocean, and changes have occurred in the seasonal dynamics of phytoplankton (Ardyna et al., 2014; Ardyna and Arrigo, 2020). Changes in the marine environments due to climate change have been linked to nutrient availability and light conditions, which are a major factors affecting phytoplankton growth, community composition, and primary production in the Arctic Ocean (Lewis et al., 2020; Sugie et al., 2020; Song et al., 2021). However, only a few studies have comprehensively investigated how variations in these major factors affect the photosynthetic properties of phytoplankton estimated by variable fluorescence in the Arctic Ocean.
Recent studies on the variability of primary production have mainly been conducted based on ocean color data in the Arctic Ocean (Arrigo et al., 2008; Lewis et al., 2020). Satellite data is a powerful technology for remote and inaccessible marine environments, such as the Arctic Ocean; however, it does not include information on the vertical distribution of phytoplankton (Hill and Cota, 2005; Martin et al., 2010). It is well known that a distinct subsurface chlorophyll maximum (SCM) forms in the Arctic Ocean during the summer months (Martin et al., 2010). Arrigo and van Dijken (2011) have reported that the primary production in the SCM layer accounts for 0.2 to 16% of the annual primary production in the Arctic Ocean. In contrast, it has also been reported that by ignoring the presence of an SCM layer, integrated primary production can be underestimated by as much as 40–75% in the summer months (Hill et al., 2013), with potentially greater errors occurring in daily estimates when sharp SCM peaks are situated within the photic zone (Bouman et al., 2020). Therefore, in order to understand the changes in primary productivity in the Arctic Ocean, the growth conditions and the photosynthetic properties of phytoplankton at the SCM should be investigated.
Changes in the photosynthetic response of phytoplankton to environmental conditions are essential for determining phytoplankton growth and primary production. In a previous study, we investigated phytoplankton photosynthetic properties in the surface layer of the Arctic Ocean and revealed that severe nitrogen limitation leads to decrease in the photosynthetic rates and growth rates with the reduction in the fraction of microphytoplankton (e.g. > 20 μm) communities (Ko et al., 2020). Although phytoplankton in the SCM layer are generally known to have a relatively higher light-harvesting capability, photosynthetic efficiency, and growth rate than the surface phytoplankton (Coupel et al., 2012; Palmer et al., 2013), data on their photosynthetic response to environmental variation around the SCM layer are limited. Recently, the nutrient supply to the surface layer was confirmed to be influenced by the Atlantic-origin water in the northwestern Chukchi Sea, and this change affected the SCM depth and phytoplankton biomass (Jung et al., 2021). The SCM layer is usually formed below the pycnocline and is controlled by the vertical distribution of nitrogen, and thus Change in water column structure has affected the nutrient supply and environmental variables, which, in turn, affected phytoplankton photosynthesis in the SCM layer (Martin et al., 2010; Baldry et al., 2020). Therefore, we compared data by region to understand how changes in environmental variables (e.g. nitrogen availability and light conditions) affect the photophysiological properties of phytoplankton in the SCM layer.
The photosynthetic properties of the phytoplankton were identified using variable chlorophyll-a fluorescence. This method is useful for elucidating the spatial distribution of the photophysiological properties of phytoplankton because it is non-destructive, sensitive, and rapid for sampling in an extensive hydrographic region at higher spatial resolution than conventional 14C experiments (Behrenfeld and Kolber, 1999; Moore et al., 2008). High-resolution data of variable fluorescence are evaluated to have the potential to reveal large-scale patterns and trends in photosynthetic rate and primary production (Schuback et al., 2021). In particular, the photochemical efficiency of photosystem II (PSII) in phytoplankton cells has been used to diagnose nutrient limitations in the ocean, including coastal areas, ocean gyres, upwelling systems, and polar regions (Kolber et al., 1994; Cheah et al., 2013; Park et al., 2017). In addition, the maximum electron transfer rate (ETRmax) has been should be more useful for evaluating nitrogen limitation because it is more sensitive to nitrogen stress than photochemical efficiency alone (Gorbunov and Falkowski, 2020; Ko et al., 2020). Thus, the photophysiological properties derived using this method are suitable for investigating phytoplankton photosynthesis in relation to environmental conditions, such as nutrient limitation and photoacclimation.
The objectives of this work were to (1) examine the spatial distribution of the photophysiological properties of phytoplankton at the SCM depth in the northern Chukchi Sea and (2) investigate the response of the photophysiological properties in relation to the changes in nutrient availability and light conditions at the SCM depth. In addition, we analyzed photosynthetic parameters derived from the electron transfer rate versus irradiance (ETR-E) curve. To achieve these goals, we analyzed the phytoplankton photophysiology in the SCM layer through field surveys in the Chukchi Sea from 2015 to 2018. This study identified the effect of nitrogen availability and light conditions on biomass, community size fraction, and photophysiological properties of phytoplankton in the SCM layer of the Chukchi Sea.
Materials and methods
Water sampling and study area
Water samples were collected onboard the Korean icebreaker R/V Araon every August, from 2015 to 2018, in the northern Chukchi Sea (Figure 1). Water samples were obtained from 5 to 6 depths ranging from the surface to 100 m using 10L Niskin bottles mounted on a conductivity, temperature, and depth rosette system (CTD; SBE 911 plus). In detail, the two samples were collected in the mixed layer including the surface layer, and 3–4 samples were collected from the SCM depth and the upper and lower layers based on the SCM depth. Fluorescence and photosynthetically active radiation (PAR) profiles were obtained from chlorophyll fluorescence (ECO FL, WET Labs) and PAR sensor (SBE PAR sensor) mounted on the CTD frame. Temperature and salinity profiles were used to calculate the stratification index (Δσt), freshwater content (FWC) and mixed layer depth (MLD). Δσt was calculated as the difference in density between the surface layer and 100 m (Codispoti et al., 2005), and MLD was determined as the depth at which the difference in density of 0.05 kg m−3 from the surface layer (Coupel et al., 2015). The salinity profile was used to quantify the amount of freshwater in the upper layer as described by Coupel et al. (2015). The FWC was calculated by integrating the ratio of the reference salinity (34.8, Aagaard and Carmack, 1989) to the salinity profile and the detailed method was described by Ko et al. (2020). After estimating the vertical attenuation coefficient obtained from the slope of the regression of the natural log-transformed PAR profile, the euphotic depth was estimated as the depth at which the PAR was 1% of the surface values (Kirk, 1994). The ratio of PAR at the SCM depth to the surface PAR (PAR_ratio) was calculated from the PAR profile for each station. Daily sea ice concentrations were obtained from the National Snow and Ice Data Center (https://nsidc.org/). The sea ice concentration for each station was calculated by averaging the pixels around the stations. The upper layer (~ 150 m) of the western Arctic is mainly composed of Pacific-origin water and is classified into two types based on the seasonal modification: Pacific Summer Water (PSW; T > −1°C, 31 ≤ S ≤ 32 psu) and Pacific Winter Water (PWW; T< −1°C, S > 31.5 psu) (Gong and Pickart, 2015). Considering that the structure of the water column around the SCM layer is related to environmental factors, the study area was divided into two regions based on the distribution of PSW within 100 m depth. The PSW was mainly distributed in the eastern side of the northern Chukchi Sea, and it was named the northeastern Chukchi Sea (NEC). Conversely, the western side of the northern Chukchi Sea, where the PSW did not appear was expressed as the northwestern Chukchi Sea (NWC). A total of 84 stations were investigated over 4 years (2015 to 2018), with 40 stations in the NEC region and the remaining 44 stations in the NWC region (Table 1).
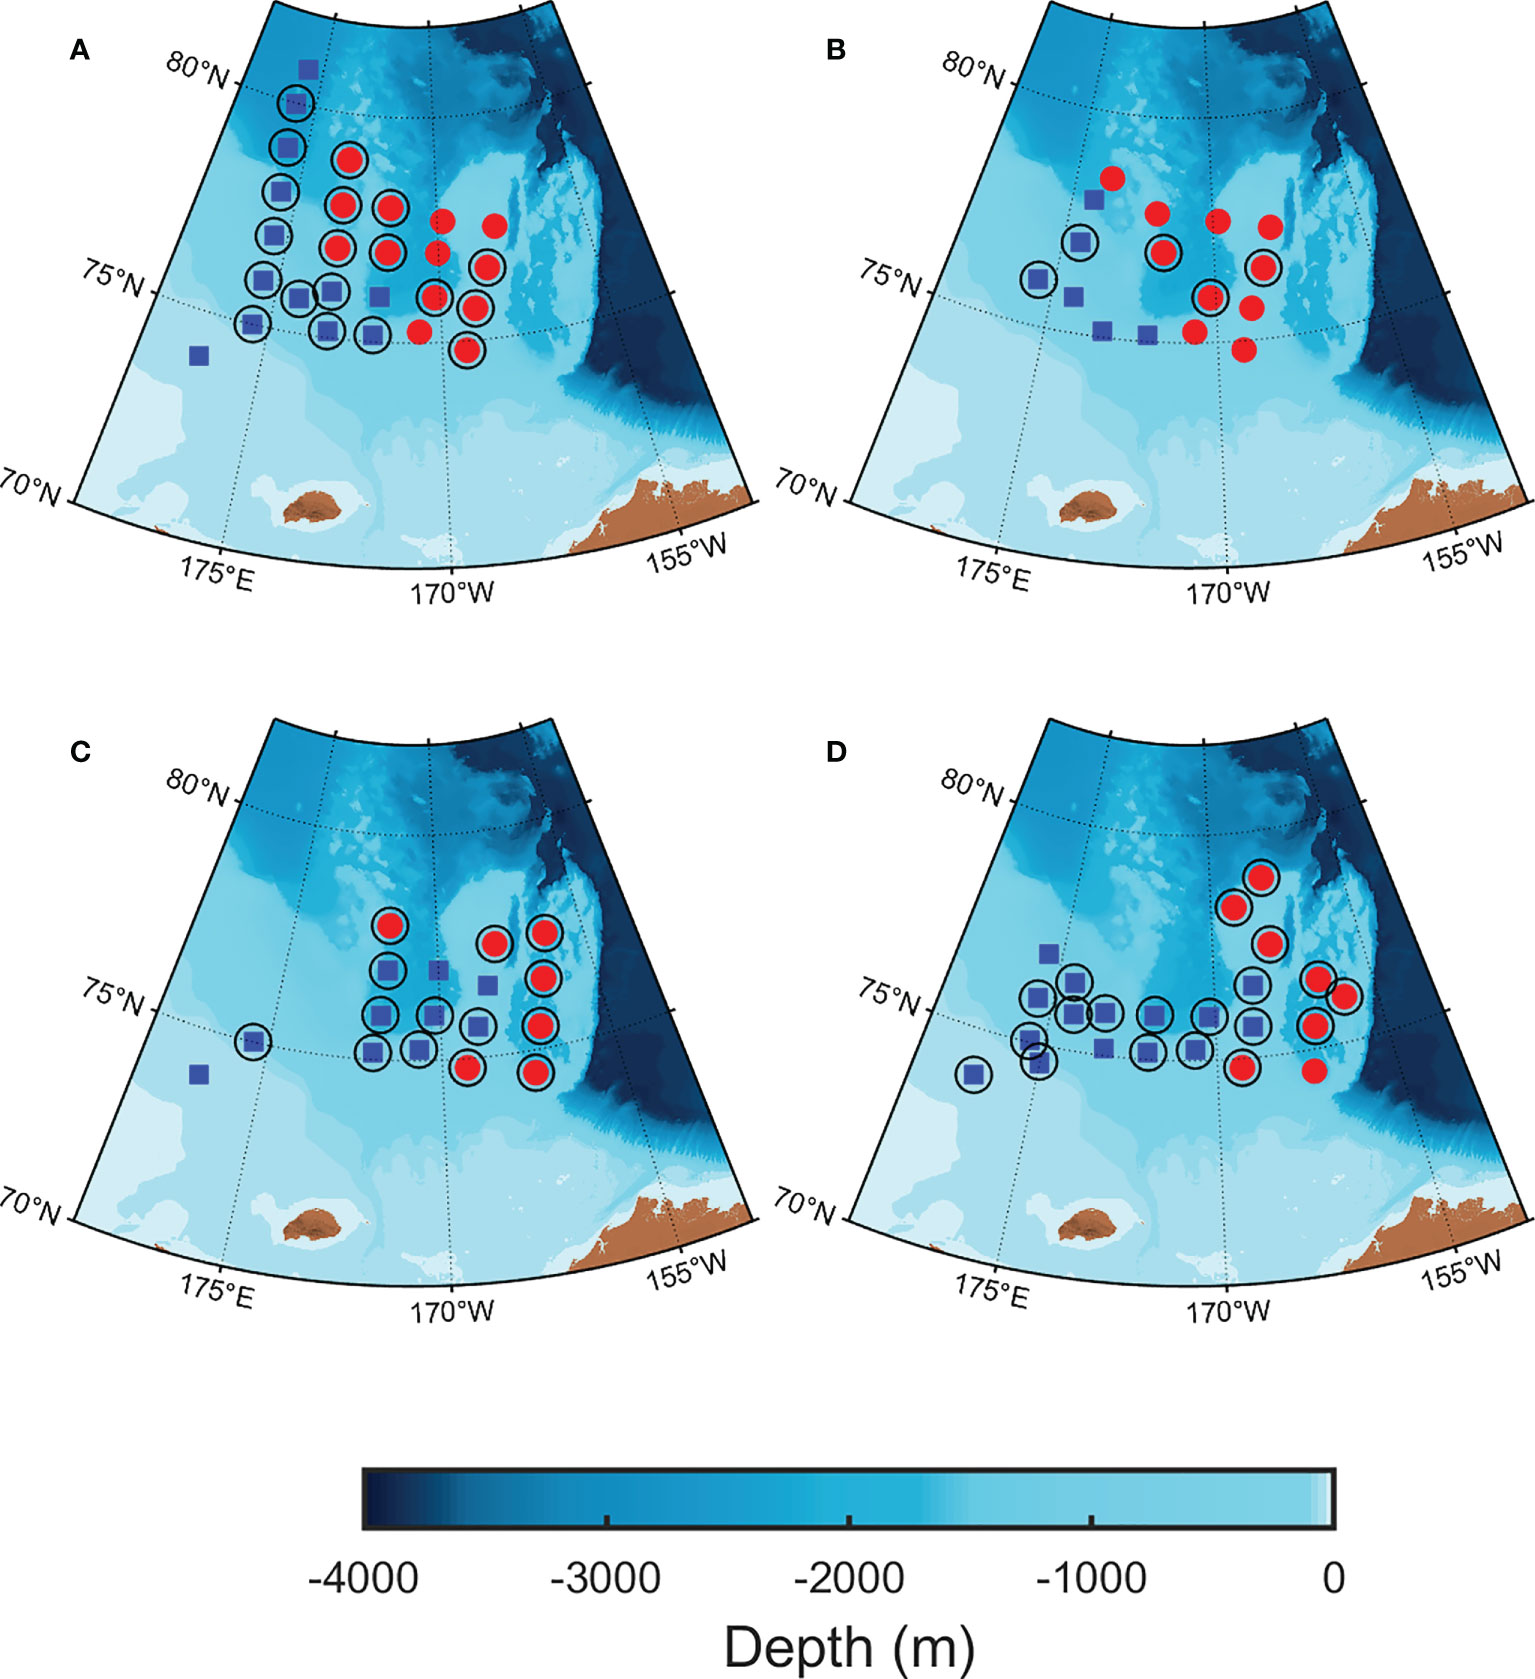
Figure 1 Maps of oceanographic stations in the northern Chukchi Sea. (A) 5–20 August, 2015; (B) 9–19 August, 2016; (C) 10–25 August, 2017; (D) 7–24 August, 2018. The study area was classified based on the distribution of Pacific Summer Water (PSW, T > −1°C, 31 ≤ S ≤ 32 psu) within 100 m of water depth. The blue square represents the northwestern Chukchi Sea (NWC) without PSW and the red circles represents the northeastern Chukchi Sea (NEC) with PSW, respectively. The empty circles represent the stations of the electron transfer rate versus irradiance curve.
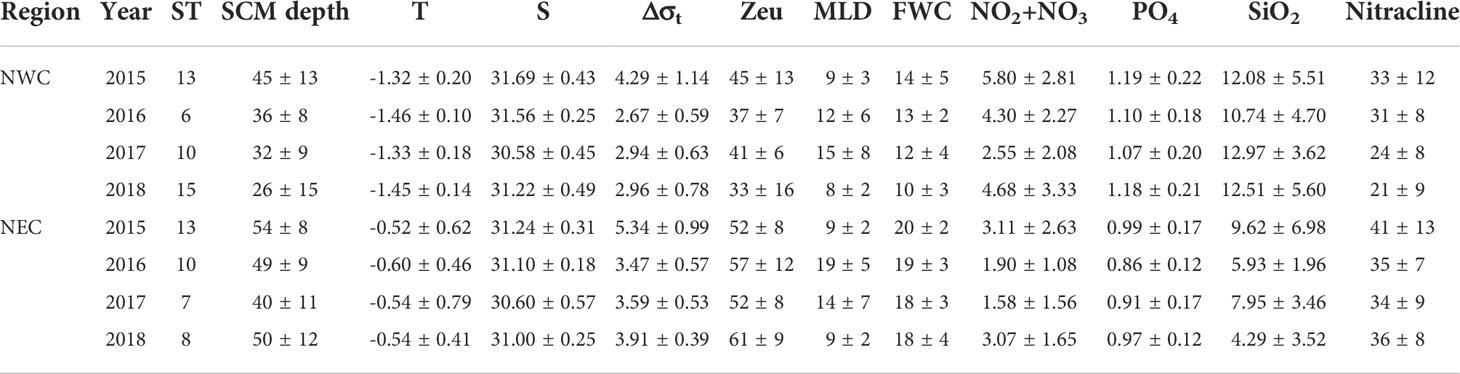
Table 1 Regional environmental variables at the subsurface chlorophyll maximum (SCM) in the northwestern Chukchi Sea (NWC) and northeastern Chukchi Sea (NEC). Temperature (T; °C); Salinity (S; psu); Stratification index (Δσt, kg m-3); Euphotic depth (Zeu; m); Mixed layer depth (MLD; m), Fresh water content (FWC; m), Stratification index (Δσt; kg m−3); nitrite + nitrate (NO2+NO3; μM); phosphate (PO4; μM); silicate (SiO2; μM); nitracline (m).
Nutrients, nitracline and chlorophyll-a concentration
Nutrient distribution, including nitrite + nitrate (NO2 + NO3), phosphate (PO4), silicate (SiO2), and ammonium (NH4) concentrations, were measured using a four-channel continuous auto-analyzer (QuAAtro, Seal Analytical) following the Joint Global Ocean Flux Study (JGOFS) protocols (Gordon et al., 1993). To evaluate accuracy and reproducibility, nutrient reference materials for seawater (Lot. No. BV, KANSO Techno) were measured with standards in all batches; the detailed methods are described by Jung et al. (2021). Nitracline depths were determined as the median of the shallowest depths where the gradient of NO2 + NO3 was greater than 0.1 μM m−1 (Coupel et al., 2015).
Chlorophyll-a (Chl-a) samples were filtered with 500 mL of seawater through a glass fiber filter (Whatman GF/F), and extracted in the dark for 24 h with 90% acetone. Chl-a concentration was measured using a fluorometer (Trilogy, Turner Designs) calibrated using a purified Chl-a standard solution (Sigma) (Parsons et al., 1984). In addition, size-fractionated Chl-a was measured using a cascade connection filtration system composed of a 20 μm nylon mesh and a nuclepore filter with a pore size of 2 μm (Whatman). Using this system, the micro (≥ 20 μm), nano (2–20 μm), and pico (≤ 2 μm) Chl-a concentration were obtained. The SCM depth was determined as the depth, which was the highest fluorescence from the chlorophyll fluorescence profile. The profile of Chl-a concentration was obtained by correcting the chlorophyll fluorescence profile with Chl-a concentration, the SCM layer was identified as a depth where the gradient of Chl-a concentration was ± 0.01 ug l-1 m-1 and above the threshold of Chl-a concentration (0.11 ug l-1) to calculate the contribution of the Chl-a concentration in the SCM layer (Martin et al., 2013).
Photophysiological properties of phytoplankton
The variable fluorescence of phytoplankton was determined using a new miniaturized fluorescence induction and relaxation (mini-FIRe) instrument (Gorbunov et al., 2020). The sensitivity and signal-to-noise ratio of this new instrument, which is suitable for use in oligotrophic waters, is approximately ca. 20 times better than the previous model (Gorbunov and Falkowski, 2004). For accurate measurements of quantum yields and functional absorption cross-sections, the FIRe instrument provides single photosynthetic turnover measurement within ca. 100 μs (Gorbunov et al., 1999).
For the measurement of variable fluorescence, seawater samples were kept at in situ temperature and under low-light conditions (~10 μmol quanta m−2 s−1) for approximately 60 min, which was necessary for recovery from photoinhibition and non-photochemical quenching. Then, each sample was measured to obtain the photophysiological properties of PSII, including minimal fluorescence yield (Fo; when all reaction centers are open), maximal fluorescence yield (Fm; all reaction centers are closed), photochemical efficiency (Fv/Fm), and functional absorption cross-section (σPSII), as described by Kolber et al. (1998). To calibrate the fluorescence parameters by depth, the blank signals were measured at two depths (ca. 0 and 100 m) after filtering the seawater with a syringe filter (0.2 μm), using the method described by Bibby et al. (2008). After subtracting the blank signal, Fv/Fm was calculated using the ratio of variable fluorescence (Fv = Fm – Fo) to the maximum fluorescence (Fm).
Photosynthetic parameters were obtained by applying the electron transfer rate versus irradiance curve. The electron transfer rate (ETR) of the sample obtained from the SCM layer was measured using a programmable actinic light source mounted on the mini-FIRe. The ETR for each PSII reaction center was calculated as described by Gorbunov et al. (2000, 2001). The detailed method for calculating ETR has been described by Ko et al. (2020). The photosynthetic rates as a function of irradiance can be calculated using the hyperbolic tangent equation (Jassby and Platt, 1976) as follows:
where ETRmax is the maximum electron transfer rate achievable at saturating light and Ek is the light saturation parameter. The light utilization efficiency (α) was estimated using ETRmax/Ek. To deduce the photosynthetic rates in absolute units (i.e., electrons per second per reaction center), cross-sections must be measured for the same spectral quality as the ambient irradiance. Therefore, both excitation and actinic light were kept in blue light range (455 nm, with a 20 nm half bandwidth) during the measurement of the photosynthesis versus irradiance curves.
Statistical analysis
Analysis of variance was performed using MATLAB (R2020a) to confirm the difference in parameters by region. Principal component analysis was performed to understand the relationship between environmental variables and the photophysiological properties of phytoplankton using the factoextra package (v1.0.6) in the R software.
Results
Physical and chemical environments of the water-column
The physical and chemical properties differed between the NWC and NEC regions. These two regions were identified by the distribution of PSW around the SCM layer, as described previously (Table 1, Figure 2). The water temperature of the SCM depth in the NWC region, where the PWW was mainly located below the SCM layer, was 0.84°C lower than that in the NEC region, where the PSW was located around the SCM layer (−1.39 ± 0.17°C and −0.55 ± 0.56°C, respectively; p< 0.01) (Figure 2 and Table 1). The salinity was similar at the SCM depth in both regions (31.26 ± 0.59 psu and 31.04 ± 0.39 psu, respectively), and the lowest value was observed in 2017 (30.57 ± 0.42 psu and 30.60 ± 0.53 psu, respectively). The mixed layer depth (MLD) was similar in these two regions (10 ± 6 m and 12 ± 6 m, respectively) (Table 1). The MLD was the deepest in 2017 in the NWC region (15 ± 6 m) and in 2016 in the NEC region (19 ± 5 m; p< 0.05). The FWC in the NEC region was 19 ± 3 m on average, which was 58% higher than that in the NWC region (12 ± 4 m; p< 0.01). The FWC maintained a similar range each year in the NEC region, whereas it gradually decreased from 2015 to 2018 in the NWC region (Table 1). The Δσt in the NEC region (4.23 ± 1.08 kg m-3) recorded higher values than that in the NWC region (3.31 ± 1.05 kg m-3, p< 0.01). The SCM depth was 49 ± 10 m in the NEC region, which was 15 m deeper than the 34 ± 14 m depth in the NWC region (p< 0.05, Table 1 and Figure 2). In addition, SCM depth showed a tendency to become shallower from 2015 to 2018 in the NWC region (p< 0.01). Although the SCM depth of the NEC region was the shallowest in 2017 (40 ± 11 m), it increased again in 2018 (Figures 2F, H). The nitracline of the two regions was also distinctly different (27 ± 10 m and 37 ± 10 m, respectively); in particular, that in the NWC region became shallow from 2015 to 2018 (p< 0.05). The euphotic depth (Zeu) also differed significantly between the two regions (39 ± 13 m and 55 ± 10 m, respectively; p< 0.01), but there was no significant linear trend by region such as the SCM depth and nitracline (Table 1). However, Zeu showed a significant negative correlation with Chl-a concentration at the SCM depth (r = -0.63, p< 0.01). The PAR of the SCM depth was similar between the two regions (5.69 ± 6.98 μmol m-2 s-1 and 4.40 ± 5.82 μmol m-2 s-1, respectively). Also, the PAR_ratio in the NWC region was slightly higher than that in the NEC region (4.94 ± 8.99 and 2.81 ± 1.49, respectively), there was no statistically significant difference (Supplementary Figure 1).
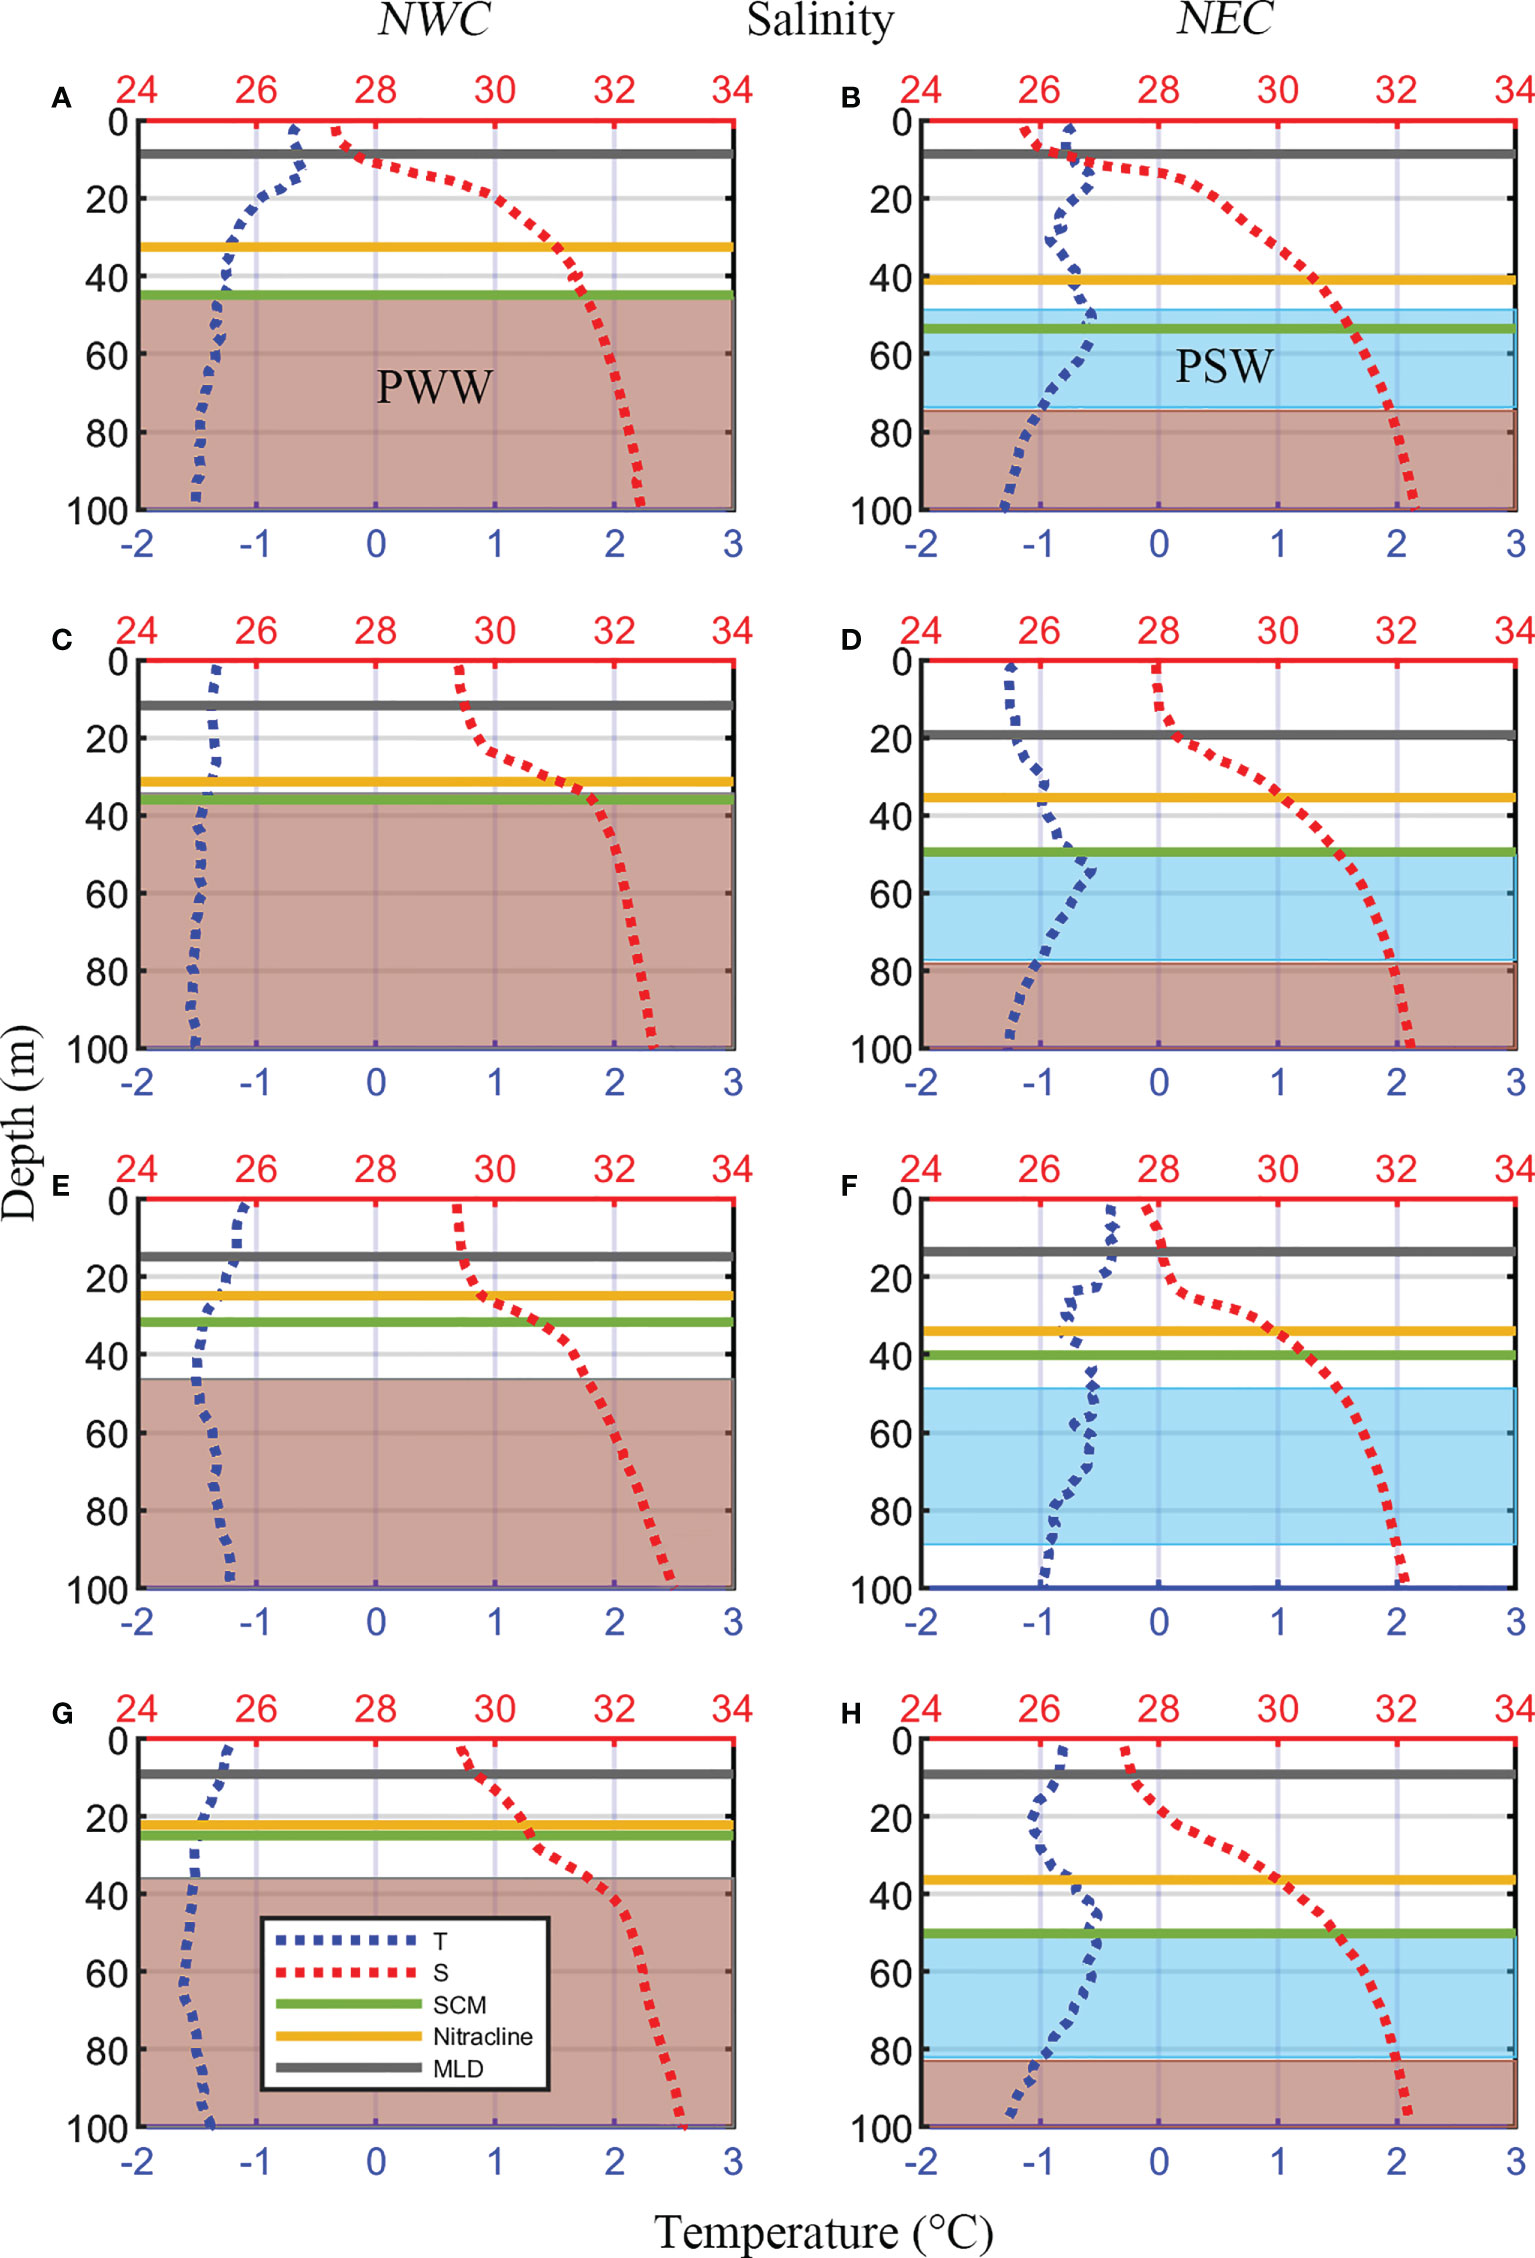
Figure 2 Vertical profiles of average temperature (blue dotted lines) and salinity (red dotted lines) by year in the northwestern Chukchi Sea (NWC, Left panels) and the northeastern Chukchi Sea (NEC, Right panels). Two horizontal dark gray, green and yellow lines indicate the mixed layer depth (MLD), subsurface chlorophyll maximum (SCM) layer and nitracline on average, respectively. The red and cyan shading represent the Pacific Winter Water (PWW, T > −1°C, S > 31.5 psu) and the Pacific Summer Water (PSW, T > −1°C, 31 ≤ S ≤ 32 psu) respectively. (A, B) 2015; (C, D) 2016; (E, F) 2017; (G, H) 2018.
In the case of nutrient distribution, the nutrient concentration at the SCM depth in the NWC region was relatively higher than that in the NEC region (Figure 3). There was a significant difference in the nitrate + nitrate concentration (NO2 + NO3) between the two regions (4.47 ± 2.92 μM and 2.49 ± 1.92 μM, respectively; p< 0.01) (Figure 3A), except in 2017. Regional differences in phosphate concentration (PO4) were also distinct (1.14 ± 0.20 and 0.94 ± 0.15 μM, respectively; p< 0.01) (Figure 3B), with a little interannual variation. In 2015, there was no statistically significant difference in silicate concentration (SiO2) between the two regions (12.08 ± 5.51 μM and 9.62 ± 6.98 μM, respectively), but regional differences have become clear since then (12.32 ± 4.79 μM and 5.97 ± 3.18 μM, respectively; p< 0.01) (Figure 3C). Ammonium concentration was almost depleted in the SCM layer of both regions during the study period (data not shown). Most environmental variables showed distinct regional differences, and the SCM layer and nitracline tended to gradually become shallow in the NWC region.
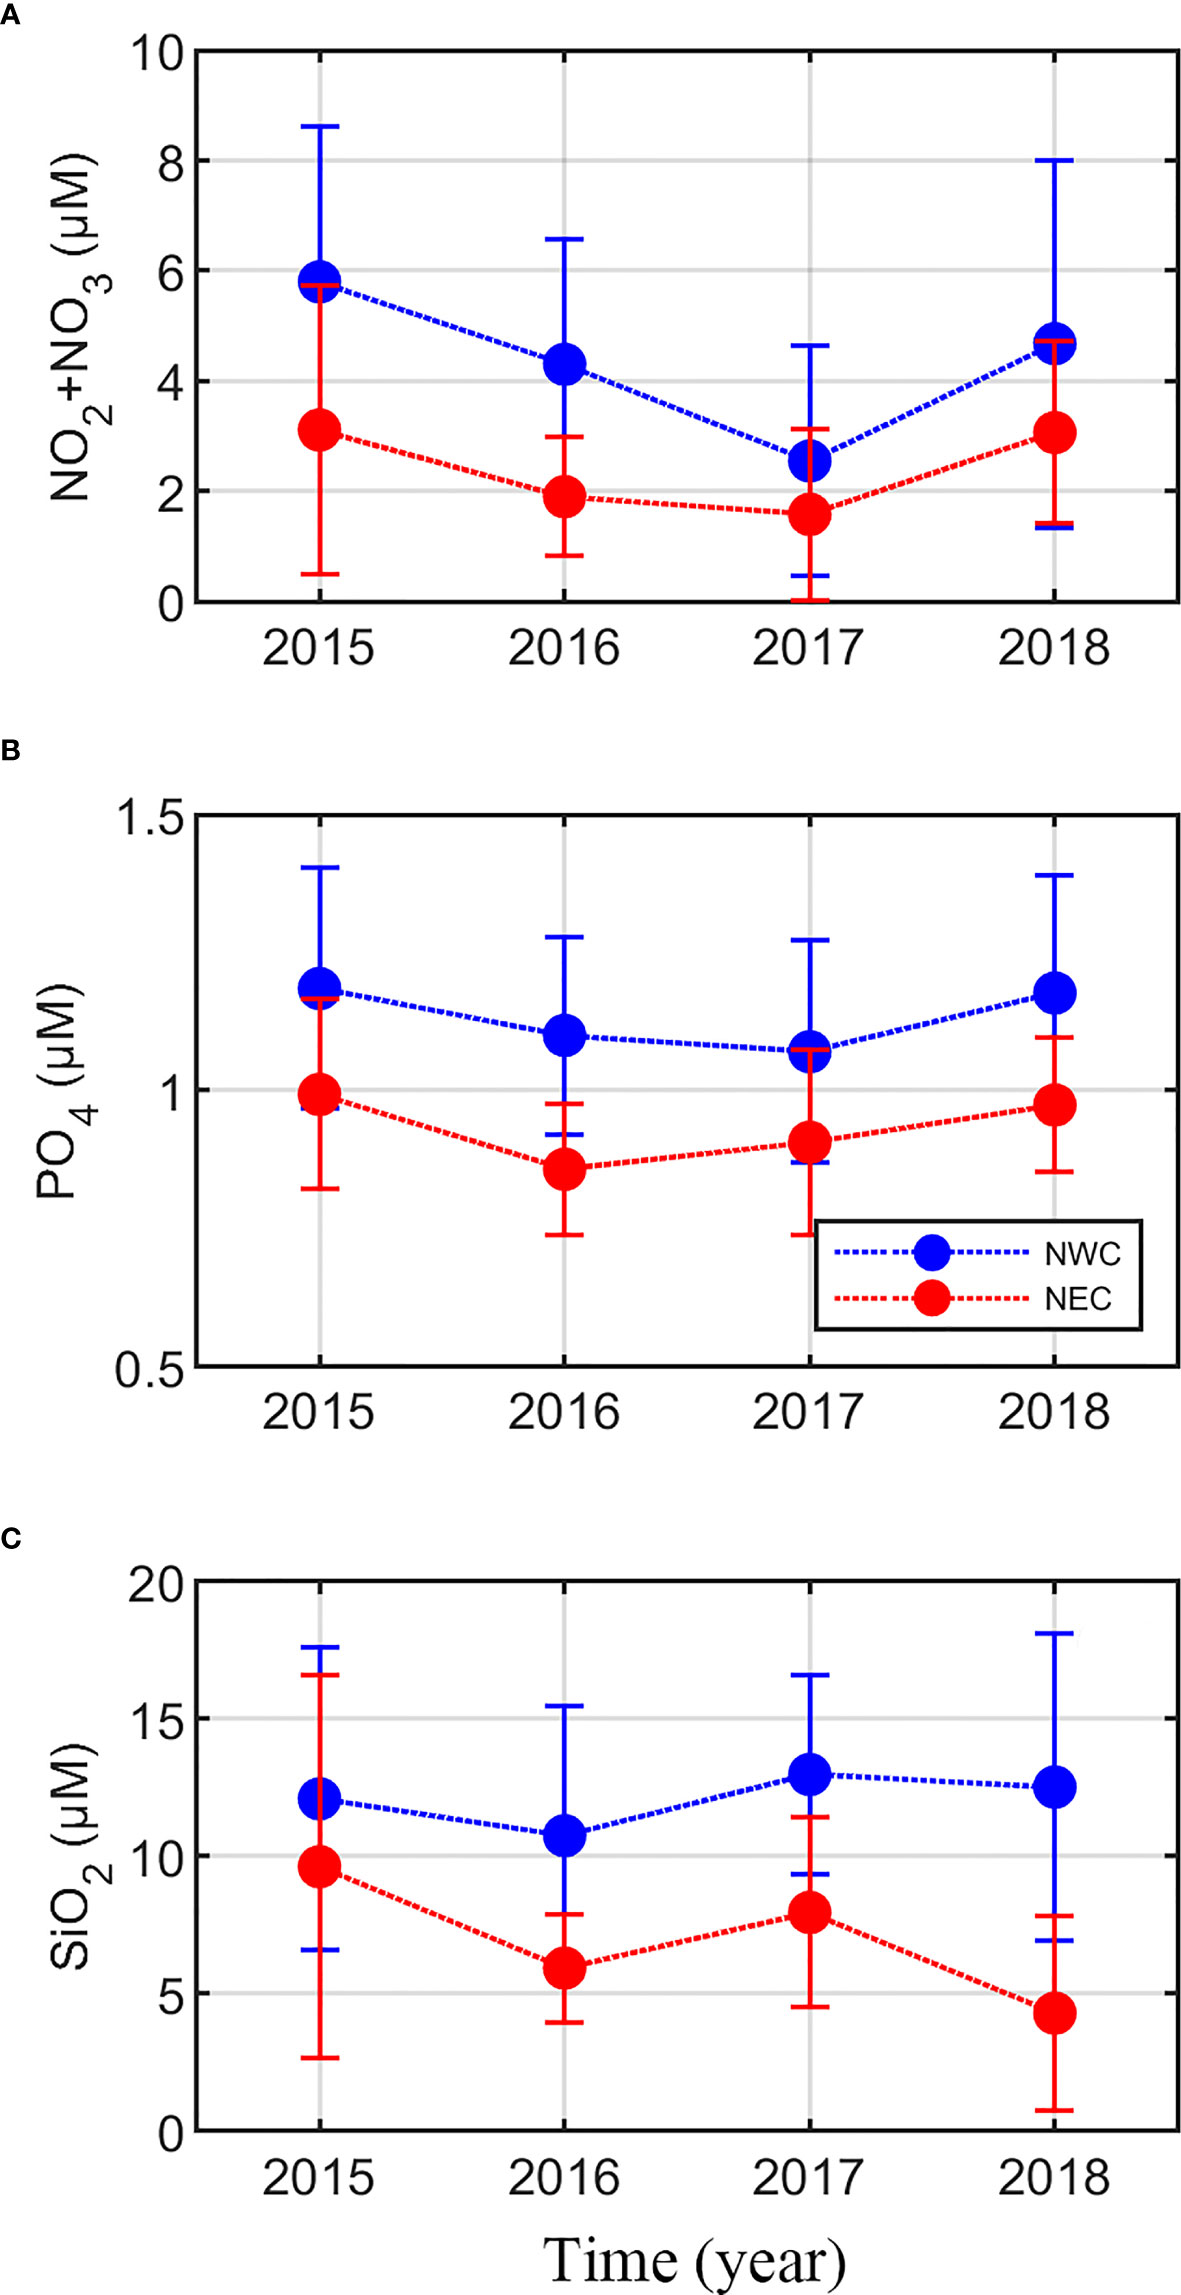
Figure 3 Regional distribution of nutrient concentration at the subsurface chlorophyll maximum by year (mean ± standard deviation). (A) nitrite + nitrate (NO2 + NO3; μM), (B) phosphate (PO4; μM), (C), and silicate (SiO2; μM). The blue and red lines represent the northwestern Chukchi Sea (NWC) and the northeastern Chukchi Sea (NEC), respectively.
Regional distribution of phytoplankton Chl-a concentration and community size structure at the SCM
Chl-a concentration and phytoplankton size structure showed distinct regional characteristics. The Chl-a concentration in the NWC region was higher than that in the NEC region (2.76 ± 3.08 mg m−3 and 0.88 ± 0.74 mg m−3, respectively; p< 0.01) (Figure 4 and Table 2). High Chl-a concentration (> 3 mg m−3) was observed in the NWC region in 2015 and 2018, and in the NEC region in 2015. However, Chl-a concentrations in 2017 were lowest in both regions (0.49 ± 0.26 mg m−3 and 0.48 ± 0.16 mg m−3, respectively) (Figure 4C). The ratio of the Chl-a concentration in the SCM layer to the depth-integrated Chl-a concentration in the water column (0 – 100 m) was calculated. In the NWC region, the ratio of Chl-a concentration in the SCM layer was approximately 80 ± 18%, slightly higher than 70 ± 19% in the NEC region (p< 0.01), indicating that the contribution of the SCM layer was high in both regions (Supplementary Figure 2). Excluding 2017, the microphytoplankton community size structure prevailed, with an average of 75% in the NWC region (Figure 5A). The fractions of nano and picophytoplankton were very low at 15% and 10%, respectively. In 2017, the fraction of nano and picophytoplankton communities were 27% and 46%, respectively, and that of the microphytoplankton community decreased to 28% in the NWC region. In the NEC region, the microphytoplankton community fraction decreased significantly from 55% in 2015 to 6% in 2018 (Figure 5B). Meanwhile, the picophytoplankton community fraction more than double on average, from 21% in 2015 to 59% in 2018. The nanophytoplankton community fraction also increased slightly from 25% to 35%. Taken together, phytoplankton communities showed high Chl-a concentrations and were dominated by large-cells in the SCM layer of the NWC region. Conversely, in the SCM layer of NEC, phytoplankton had a relatively low Chl-a concentration, and small-sized communities tended to increase during this study.
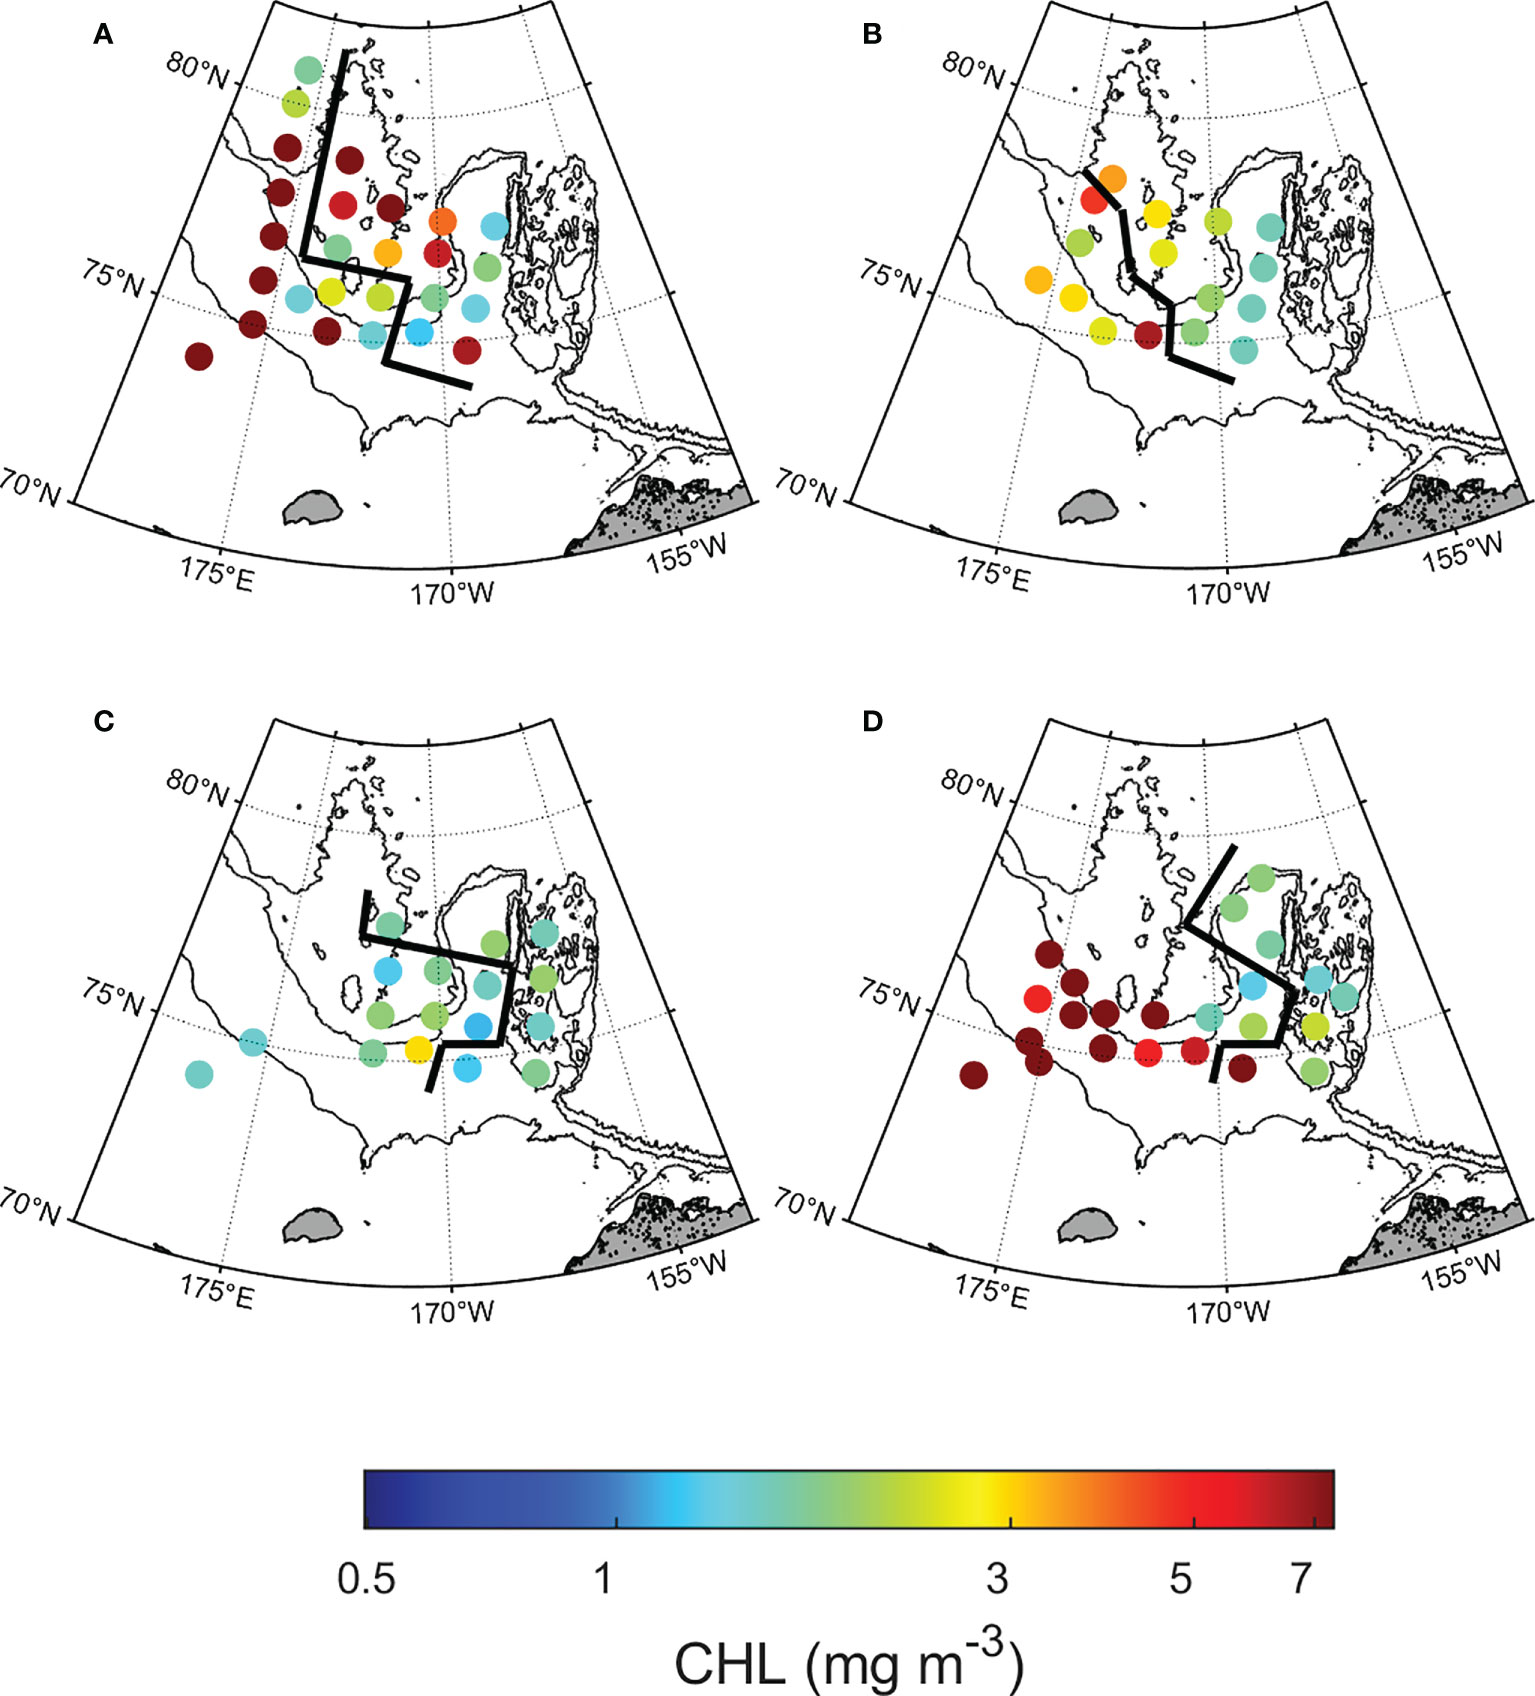
Figure 4 Spatial distribution of chlorophyll-a concentration (mg m−3) at the subsurface chlorophyll maximum by year. (A) 2015, (B) 2016, (C) 2017, and (D) 2018. The left side of the black line shows the northwestern Chukchi Sea; the right side shows the northeastern Chukchi Sea.
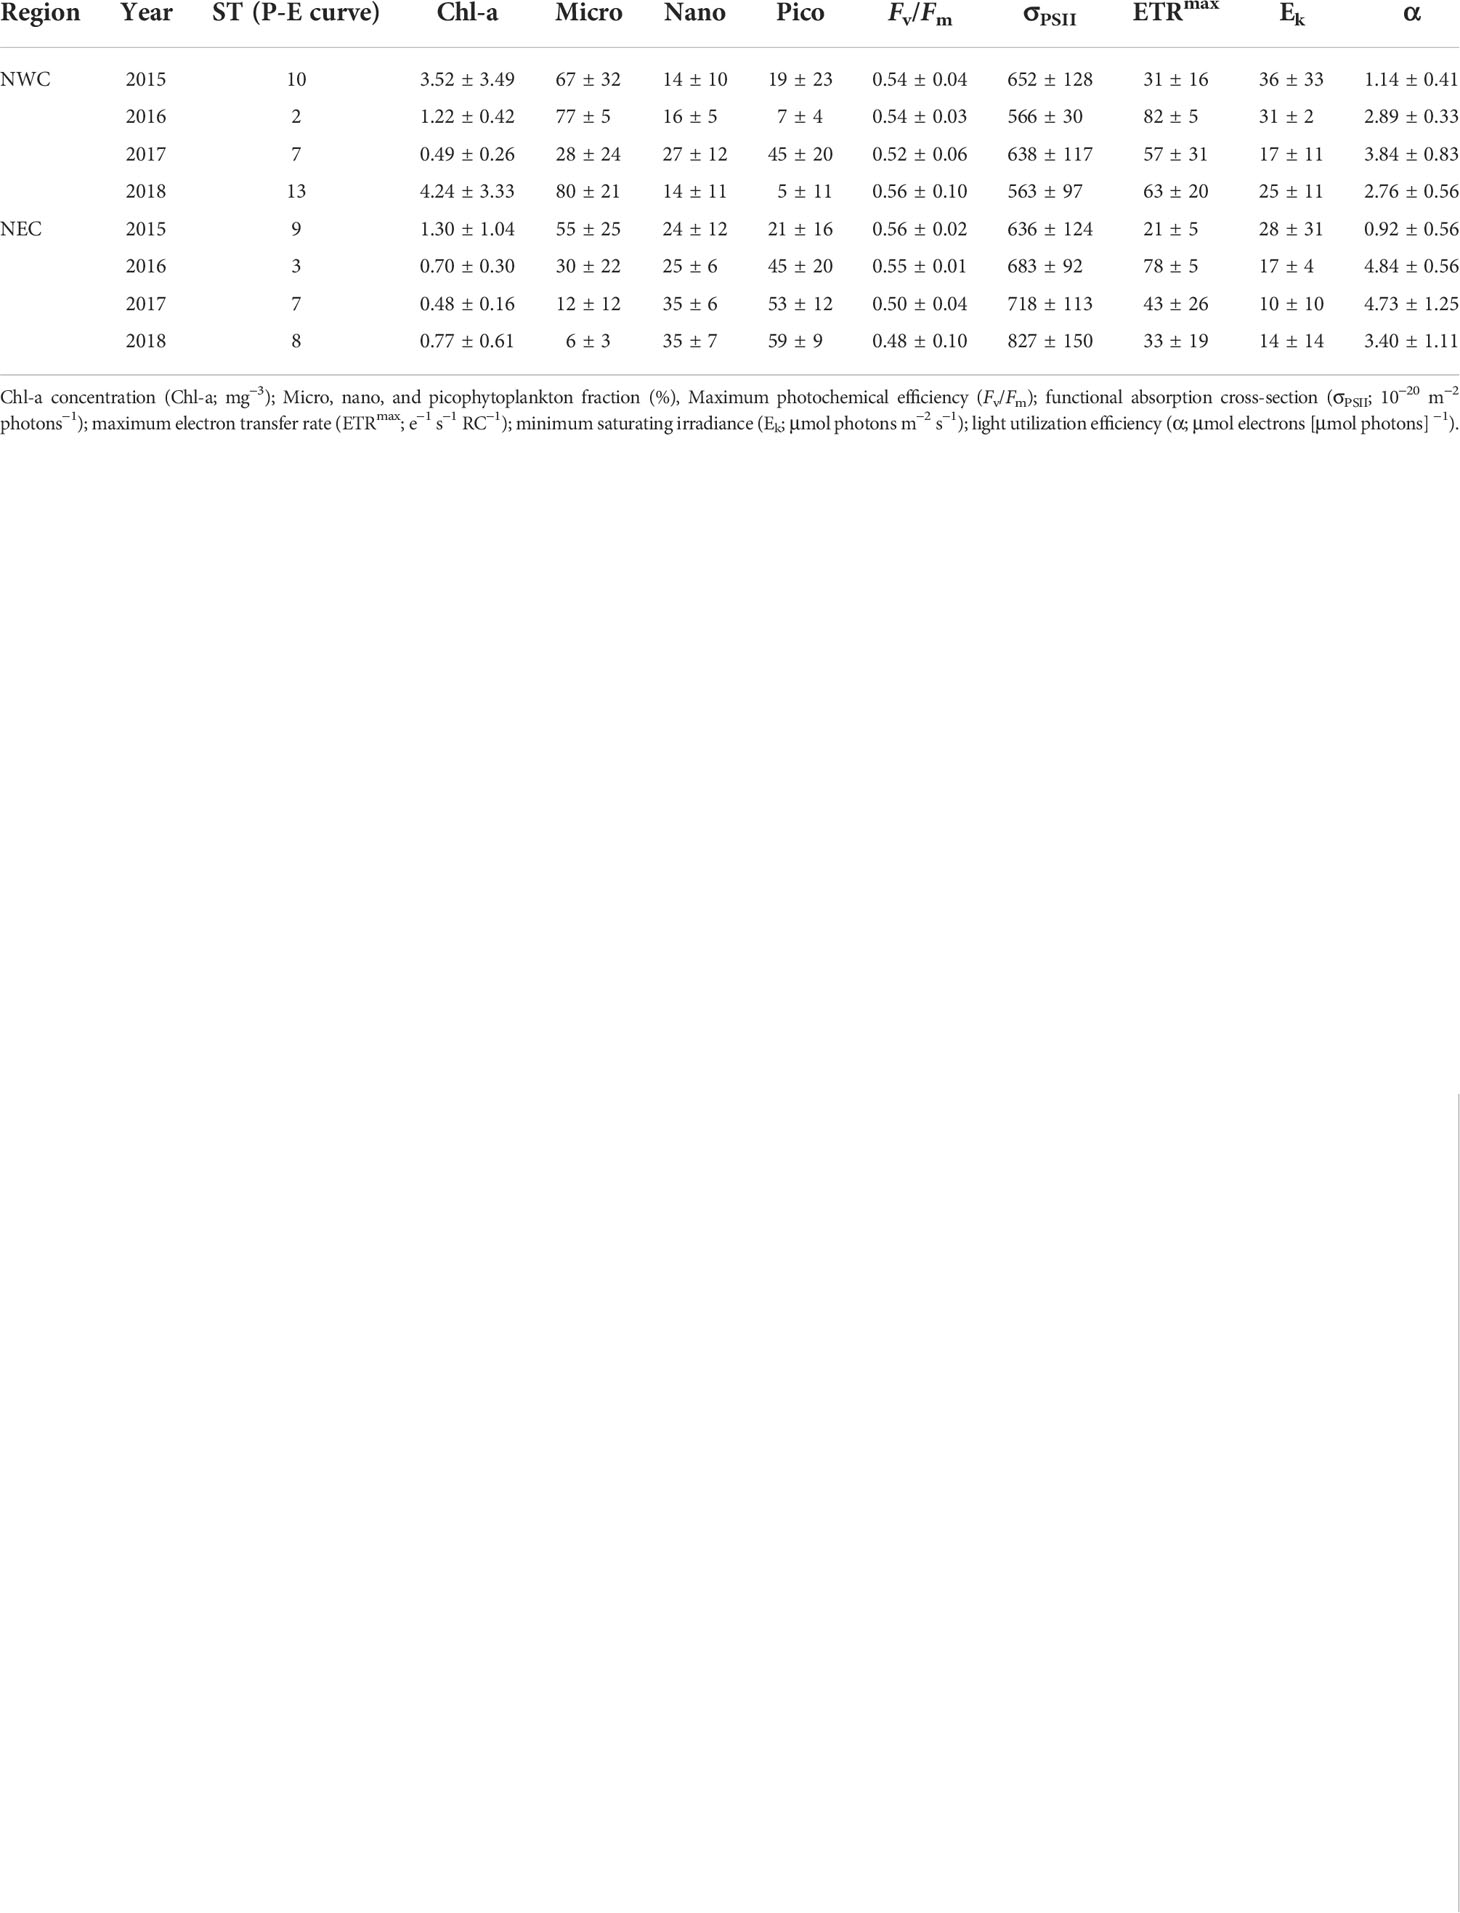
Table 2 Regional phytoplankton size fraction and photophysiology variables at the subsurface chlorophyll maximum in the northwestern Chukchi Sea (NWC) and the northeastern Chukchi Sea (NEC).
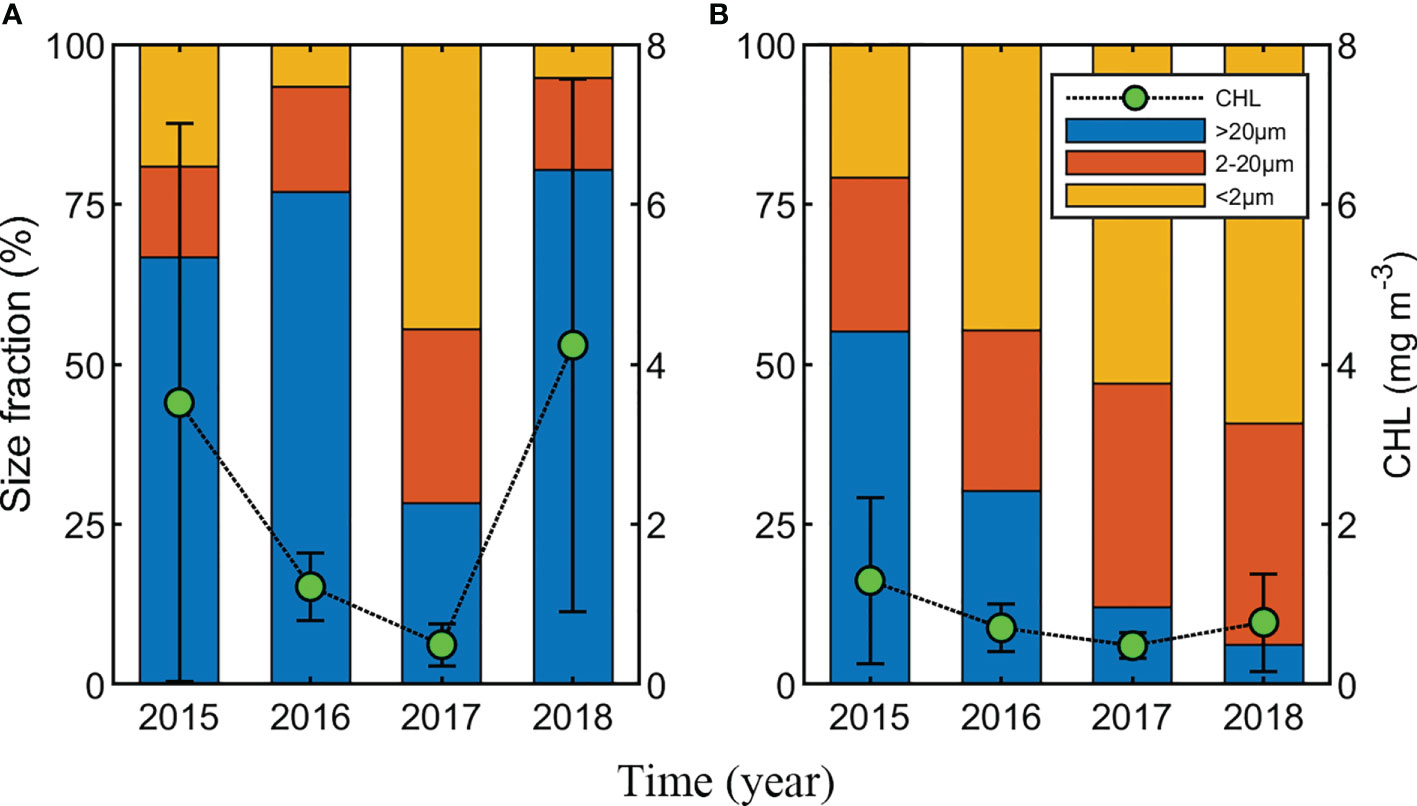
Figure 5 Distribution of phytoplankton Chlorophyll-a (Chl-a) concentration (mg m−3) and average phytoplankton community size fraction (%) by region. (A) The northwestern Chukchi Sea, (B) The northeastern Chukchi Sea. Green circles and black vertical lines represent Chl-a concentration (mean ± standard deviation). Phytoplankton community size consisted of > 20 μm, 2–20 μm, and< 2 μm, respectively.
Regional distribution of phytoplankton photophysiological properties at the SCM
The regional distribution of the maximum photochemical efficiency (Fv/Fm), functional absorption cross-section (σPSII), and P-E parameters are shown in Figures 6 and 7, and Table 2. Fv/Fm was higher than 0.5 at the SCM depth in most stations, and showed similar ranges in both regions when four-year data were combined (0.54 ± 0.07 and 0.53 ± 0.06, respectively). However, since 2017, the Fv/Fm of the NEC region has been significantly lower than that of the NWC region (0.49 ± 0.07 and 0.54 ± 0.09, respectively; p< 0.05), showing a clear difference between the East and West regions (Figures 6 and 7A). The σPSII in the NEC region was larger than that in the NWC region (710 ± 143 × 10−20 m−2 photons−1 and 607 ± 111 × 10−20 m−2 photons−1, respectively; p< 0.05) (Figure 7B and Table 2). σPSII maintained a similar range by year in the NWC region, whereas it increased by 17% in the NEC region from 2017 (655 ± 112 × 10−20 m−2 photons−1 and 772 ± 140 × 10−20 m−2 photons−1, respectively; p< 0.01) (Figure 7B). The photosynthetic parameters obtained from the P-E curve also differed by region. The maximum electron transfer rate (ETRmax) of the NWC region was higher than that of the NEC region (53 ± 26 e−1 s−1 R−1 and 36 ± 23 e−1 s−1 R−1, respectively; p< 0.01) (Figure 7C). This was similar in both regions before 2016 (39 ± 24 e−1 s−1 R−1 and 33 ± 24 e−1 s−1 R−1, respectively). However, the ETRmax of the NWC region has increased by approximately 36% compared to the NEC region since 2017, resulting in a significant difference between the two regions (61 ± 24 e−1 s−1 R−1 and 38 ± 23 e−1 s−1 R−1, respectively; p< 0.01). The light saturation (Ek) of the NWC region was slightly higher than that of the NEC region, but the difference was not significant (27 ± 21 μmol photons m−2 s−1 and 18 ± 21 μmol photons m−2 s−1, respectively; p = 0.08) (Figure 7D). The light utilization efficiency coefficient (α) showed distinct differences by region (2.43 ± 1.12 μmol electrons (μmol photons)−1 and 3.30 ± 1.97 μmol electrons (μmol photons)−1, respectively; p< 0.05) (Figure 7E). In particular, the α between the two regions was similar in 2015, but since then the α of the NEC region has become higher than that in the NWC region (4.44 ± 1.48 μmol electrons (μmol photons)−1 and 3.03 ± 0.76 μmol electrons (μmol photons)−1, respectively; p< 0.01). Overall, the photosynthetic parameters, excluding Ek, showed similar ranges in the two regions until 2016, but regional differences have become clear since 2017.
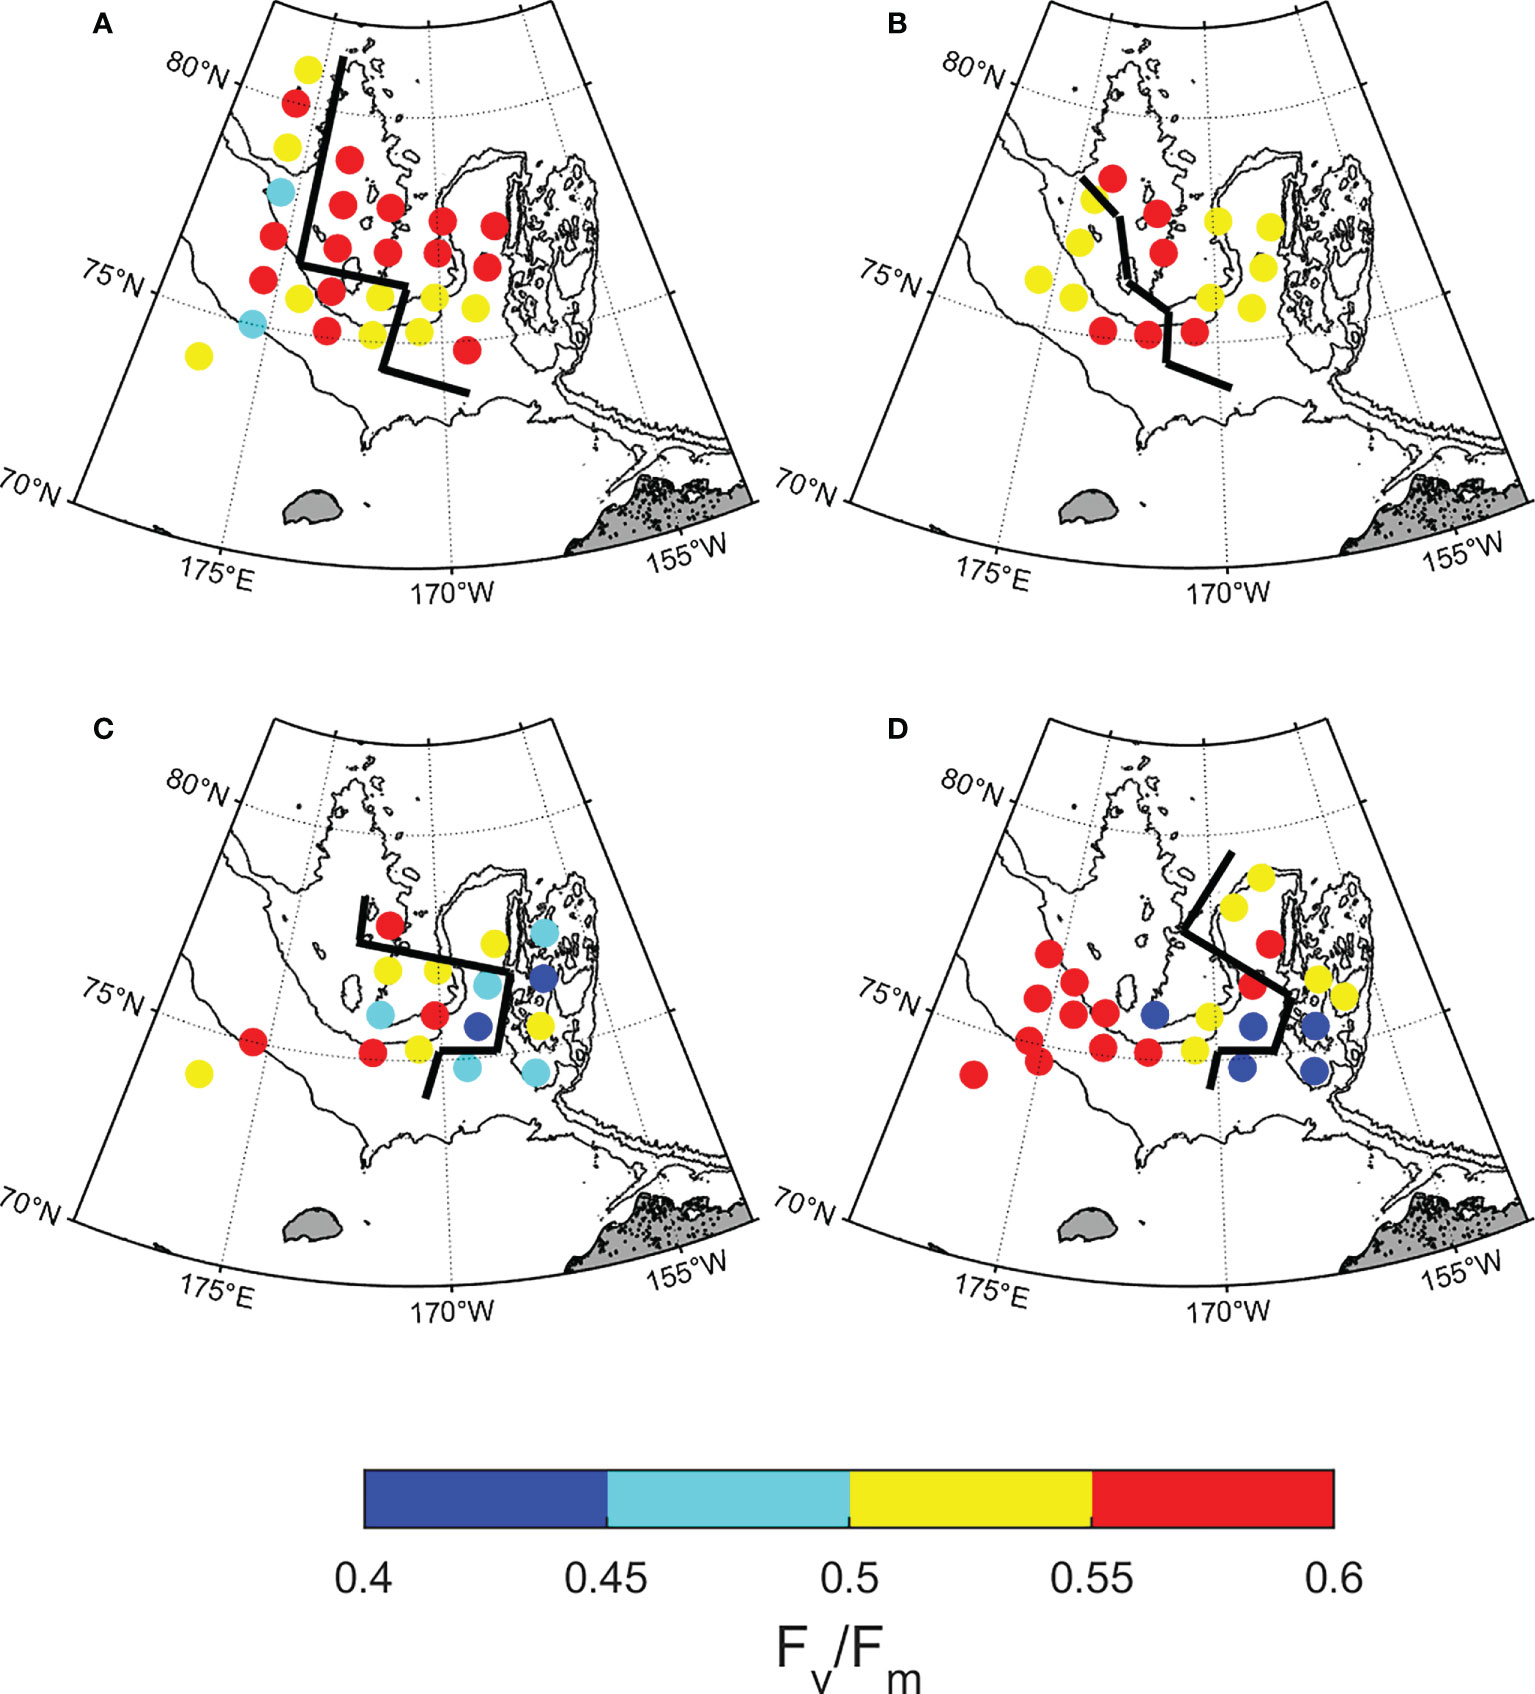
Figure 6 Spatial distribution of photochemical efficiency (Fv/Fm) at the subsurface chlorophyll maximum by year. (A) 2015, (B) 2016, (C) 2017, and (D) 2018. Based on the black line, the left side is the northwestern Chukchi Sea and the right side is the northeastern Chukchi Sea.
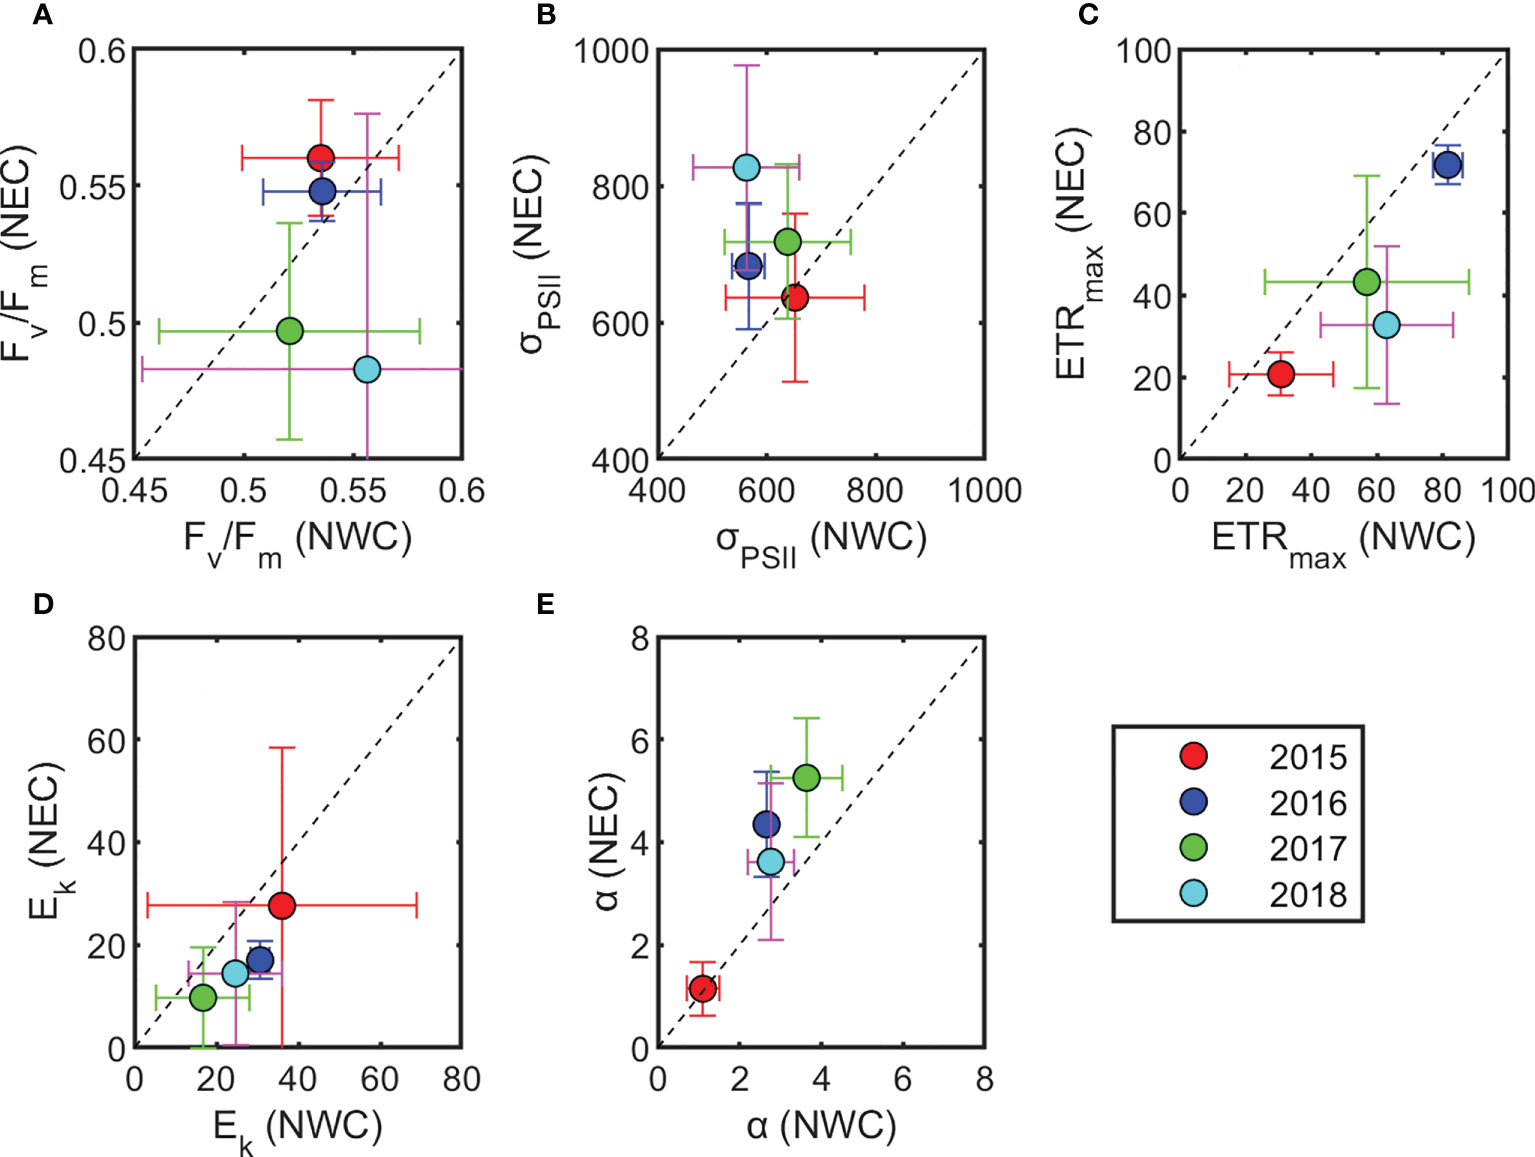
Figure 7 Distribution of phytoplankton photophysiological characteristics (mean ± standard deviation) by year. (A) Maximum photochemical efficiency (Fv/Fm), (B) functional absorption cross-section (σPSII; 10−20 m−2 photons−1), (C) maximum electron transfer rate (ETRmax; e−1 s−1 RC−1), (D) minimum saturating irradiance (Ek; μmol photons m−2 s−1), and (E) light utilization efficiency (α; μmol electrons [μmol photons] −1). For each variable, the x-axis and y-axis indicate the northwestern Chukchi Sea (NWC) and the northeastern Chukchi Sea (NEC), respectively.
Discussion
What determines the SCM depth in the northern Chukchi Sea?
The water mass structure, characterized by water temperature and salinity, affects the vertical distribution and flux of nutrients, which in turn controls the SCM depth (Ardyna et al., 2013; Brown et al., 2015). The upper layer (0–150m) of the western Arctic Ocean was mainly composed of a relatively fresh surface mixed layer and Pacific-origin water entering the Arctic via Bering Strait, which was a high nutrient and low dissolved oxygen water (Codispoti et al., 2005). The Pacific-origin water was divided into relatively warm and fresh PSW and cold and saline PWW, and the PSW lay directly above PWW (Nishino et al., 2013; Gong and Pickart, 2016). A warm and saline Atlantic-origin water layer was located below the Pacific-origin water layer (Korhonen et al., 2013; Alkire et al., 2019). In the NWC region, PWW was distributed below the SCM layer, and in the NEC region, PSW mainly existed around the SCM layer and PWW was distributed below it. In other words, the water masses around the SCM layer differ between these two regions (Figure 2). These differences in the water mass distribution contributed to the difference in water temperature and salinity at the SCM in these two regions, and thus, affected nutrient budget (Figure 3 and Table 1). In 2017, the intrusion of Atlantic-origin cold water caused by cyclonic atmospheric circulation raised the PWW, supplying nutrients to the upper layer of the northwestern Chukchi Sea (Jung et al., 2021). This variability in water masses has influenced the expansion of PWW in the northern Chukchi Sea since 2017, which can be related to the reduction in the spatial distribution of PSW to the Chukchi borderlands towards 2018 (Figures 1C, D). Therefore, the difference in physicochemical conditions (temperature, salinity, and nutrients) of the water layer would affect the variability of SCM depth by region.
We found a significant correlation between nitracline and SCM depth (r = 0.80, p< 0.01; Figure 8A), indicating that nitrogen availability is the key factor for the formation of the SCM layer in the Arctic Ocean. In addition, the nitracline position was significantly correlated with FWC (r = 0.72, p< 0.01; Figure 8B). This relationship suggests that the increased thickness of the freshwater surface layer deepens the sub-surface nutrients reservoir of PWW (Coupel et al., 2015). Freshwater produced by melting sea ice was one of the main factors controlling the FWC (Serreze et al., 2006). In our study, the FWC had a statistically significant negative correlation with sea ice concentration in the two regions (r = −0.59, p< 0.01; Figure 8C). Specifically, the period from the sea ice retreat to measurement in the NEC region was 44 days on average, and there was no significant difference by year. But, the averaged period was 35 days in the NWC region, which was the shortest in 2018 with 30 days. (p< 0.01, Supplementary Figure 3). The period in the two regions showed a positive correlation with FWC, suggesting that the sea ice melting was affecting the FWC (r = 0.50, p< 0.01, Figure 8D). The period of sea ice retreat was also related to the difference in the stability of the water column (stratification index) between both regions (r = 0.36, p< 0.05, Table 1). Furthermore, the position of the lower halocline between the Pacific-origin water and Atlantic-origin water in both regions was confirmed by another study (Alkire et al., 2019); in the NWC region, the lower halocline became shallower after 2016, meaning that the Pacific-origin waters have risen (Supplementary Figure 4). Thus, as mentioned earlier, the PWW uplift eventually increased the salinity and nutrients in the upper layer, which led to a decrease in FWC and shallower nitracline towards 2018 in the NWC region (Figure 2). Although the fluctuation of nitracline was not significant in the NEC region, the nutrient supply to the surface layer shallowly formed the position of the nitracline in the NWC region, resulting in a shallow SCM depth.
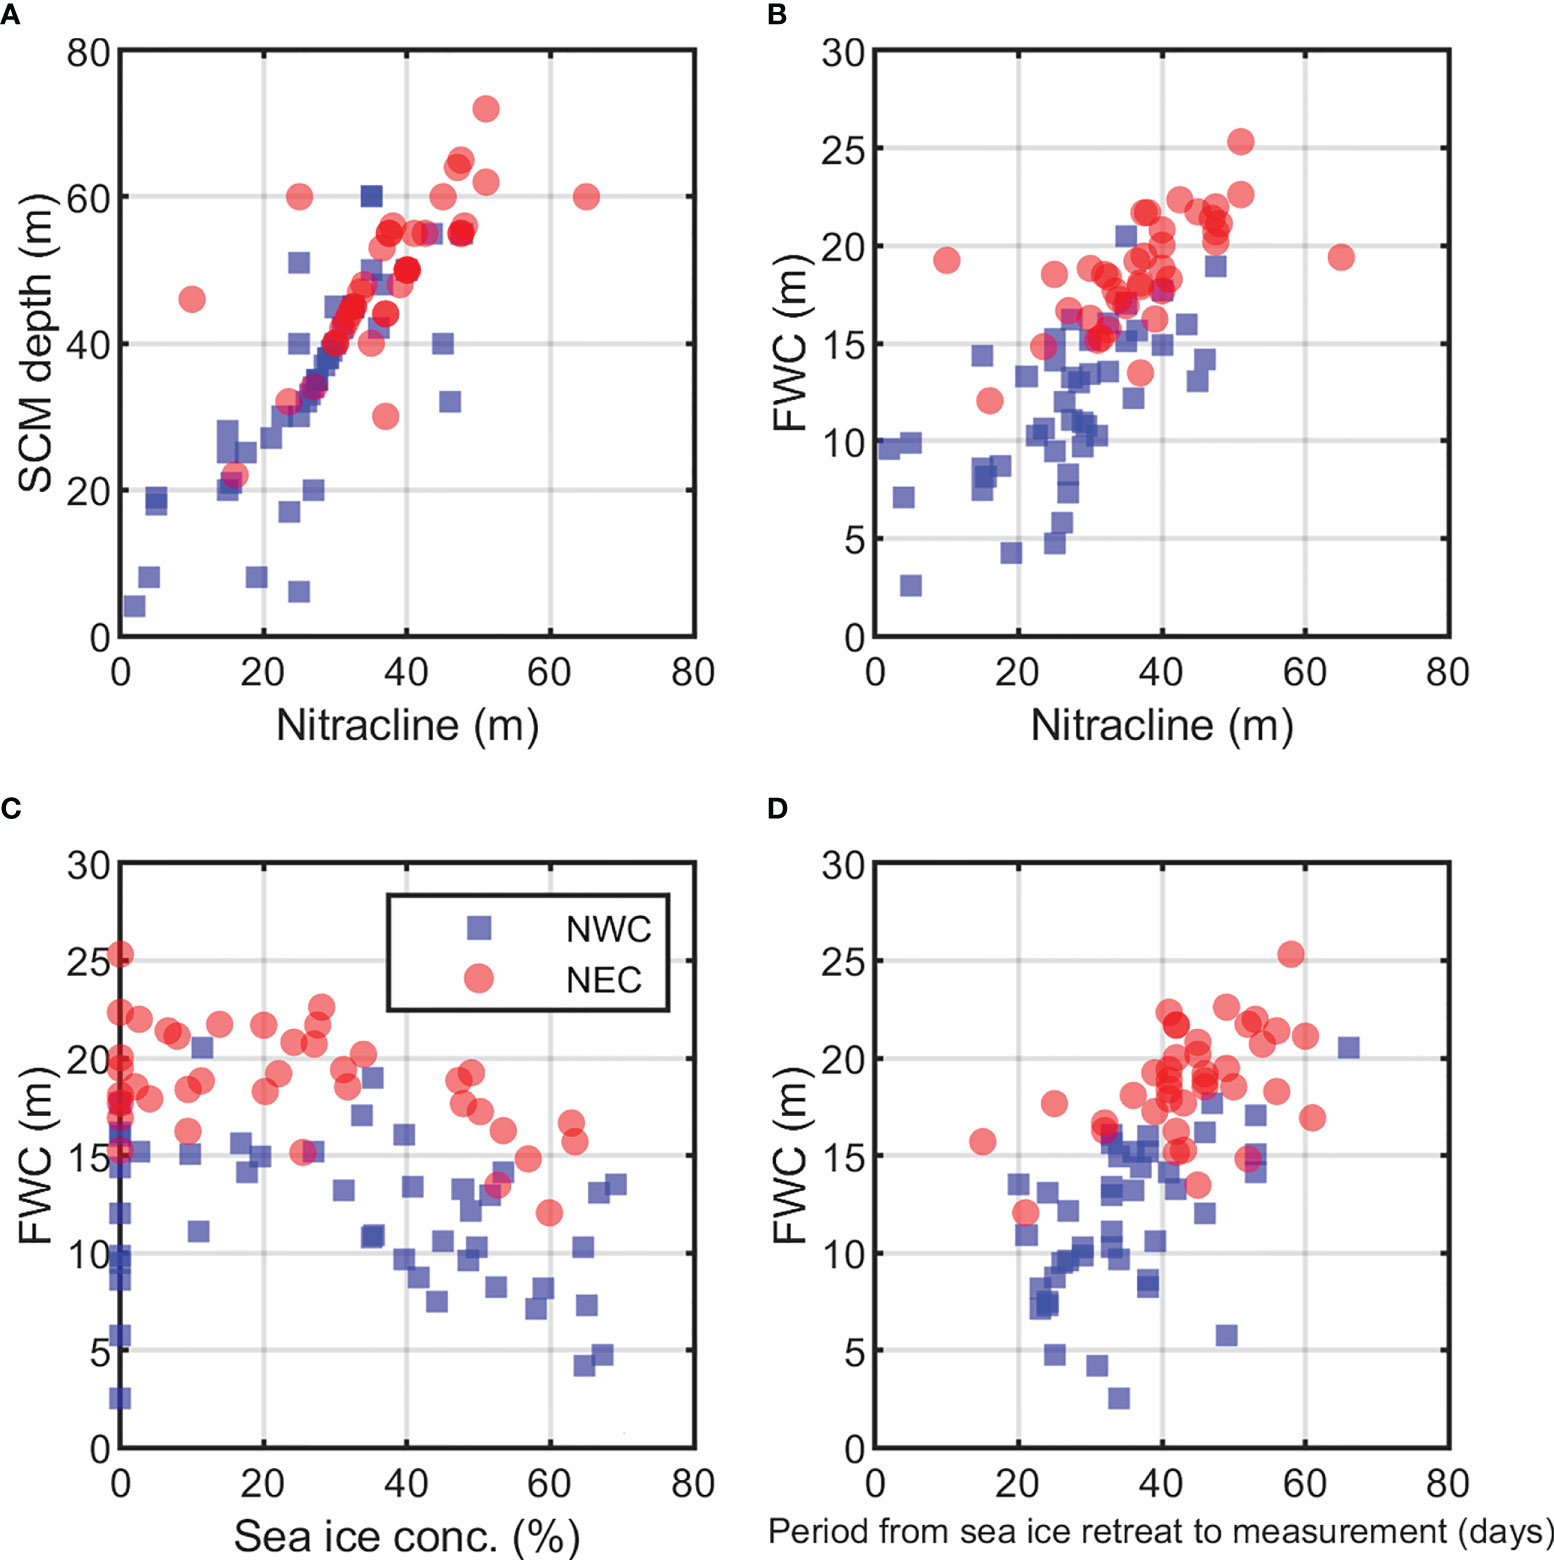
Figure 8 Variables related to the depth of subsurface chlorophyll maximum (SCM) by region from 2015 to 2018. (A) Relationship between nitracline and the SCM depth (r = 0.80, p< 0.01), (B) Relationship between nitracline and freshwater content (FWC; r = 0.72, p< 0.01), and (C) Sea ice concentration (%) and FWC (NWC: r = −0.61, p<0.01; NEC: r = −0.59, p< 0.01, Excluding 0% sea ice concentration). (D) FWC and the period from the sea ice retreat to measurement (days) (NWC: r = 0.53, p< 0.01; NEC: r = 0.50, p< 0.01). The blue squares and red circle represent the northwestern Chukchi Sea (NWC) and the northeastern Chukchi Sea (NEC), respectively.
Effects of nitrogen availability on phytoplankton photophysiology at the SCM
In the summer of the Arctic, phytoplankton in the SCM layer were reported to exhibit high nitrogen availability through assessment of nitrogen assimilation (Martin et al., 2012). We aimed at determining the effect of high nitrogen availability in the SCM layer on the photophysiological properties of phytoplankton. The variation in nitrogen availability may have contributed to regional differences in Chl-a concentration (2.76 mg m−3 vs.< 1 mg m−3) and dominant phytoplankton community size (micro vs. nano + pico), as well as the photosynthetic activity of phytoplankton (Figures 4 and 5). In the NWC region, the phytoplankton Fv/Fm at the SCM depth was high during the entire study period (Figure 6). This result suggests that phytoplankton in the SCM layer exhibited the highest photosynthetic activity because the nitrogen availability was not limited. Meanwhile, in the NEC region, Fv/Fm in the SCM layer remained high until 2016, and since then, it has decreased by approximately 10% (Figures 6C, D). Fv/Fm of the two regions showed a significant difference since 2017 (Figures 6C, D, 7A). The reduced Fv/Fm in the SCM layer was similar to that of surface phytoplankton (0.46 ± 0.09) in the Arctic Ocean, which was subject to severe nitrogen limitation (Mills et al., 2018; Ko et al., 2020). This result meant that the photosynthetic activity of phytoplankton decreased in the SCM layer because nutrient availability was lower than the cellular demands for photosynthesis (Parkhill et al., 2001). That is, the nitrogen availability in the SCM layer was probably inhibited, as the NEC region has shifted to the Chukchi borderlands since 2017. Therefore, our results revealed that the degree of nitrogen availability in the SCM layer was highly variable in the Arctic Ocean, which could be responsible for changes in the photosynthetic activity of phytoplankton.
In the first principal component (PC1: 39%), each photophysiological property of phytoplankton (Fv/Fm, Ek vs. σPSII, α) was negatively correlated with the dominant phytoplankton community size structure by region (r = −0.31 ~ −0.43, p< 0.01, Figure 9). σPSII refers to the ability to absorb light (i.e., the physical size of PSII antennae) and the efficiency of electron conversion in PSII (Falkowski et al., 2004). In particular, an inverse relationship between Fv/Fm and σPSII was evident in both regions, which is known to be associated with high σPSII and low Fv/Fm as light-harvesting strategies for smaller cells (Suggett et al., 2009). In the Chukchi Sea, diatoms and small flagellates were dominant (Lee et al., 2019), and large diatoms were known to show high Fv/Fm (≥ 0.5) and low σPSII (400 to 600 × 10−20 m−2 photon-1) (Moore et al., 2005; Suggett et al., 2009). We expected that large-sized phytoplankton communities with high Chl-a concentrations in the NWC region would exhibit low light absorption (i.e., σPSII and α) owing to the package effect (Kirk, 1975; Lavergne and Joliot, 2000). Therefore, phytoplankton in the NWC region would have shown high Fv/Fm and low σPSII by dominant large diatoms (Figures 7B and 10A). In addition, the Ek of the NWC region was relatively higher than that of the NEC region because large diatoms adapted to high light (Figures 7D and 10B) (Qiao et al., 2021). Along with the reduction in Fv/Fm since 2017, the large-sized phytoplankton community fraction decreased by 34% compared with that before 2016 in the NEC region (Figures 7E and 10C). At this time, σPSII and α increased, indicating an increase in antenna size in the NEC region. This could increase the probability of heat dissipation by increasing the lifetime of an exciton within the antenna. Hence, the photochemical efficiency of phytoplankton with high σPSII would have been reduced in the NEC region (Lavergne and Joliot, 2000). ETRmax did not show a correlation with nitrogen availability or phytoplankton community size structure (Figures 9 and 10D). Finally, the inhibition of nitrogen availability in the SCM layer contributed to a decrease in the photosynthetic activity of phytoplankton, with an increase in picophytoplankton communities in the NEC region (Almazán-Becerril et al., 2012; Kulk et al., 2018). Therefore, this analysis suggests that the extent of nitrogen availability in the SCM layer was a major factor regulating the photosynthetic activity and light absorption ability of the regionally dominant phytoplankton communities.
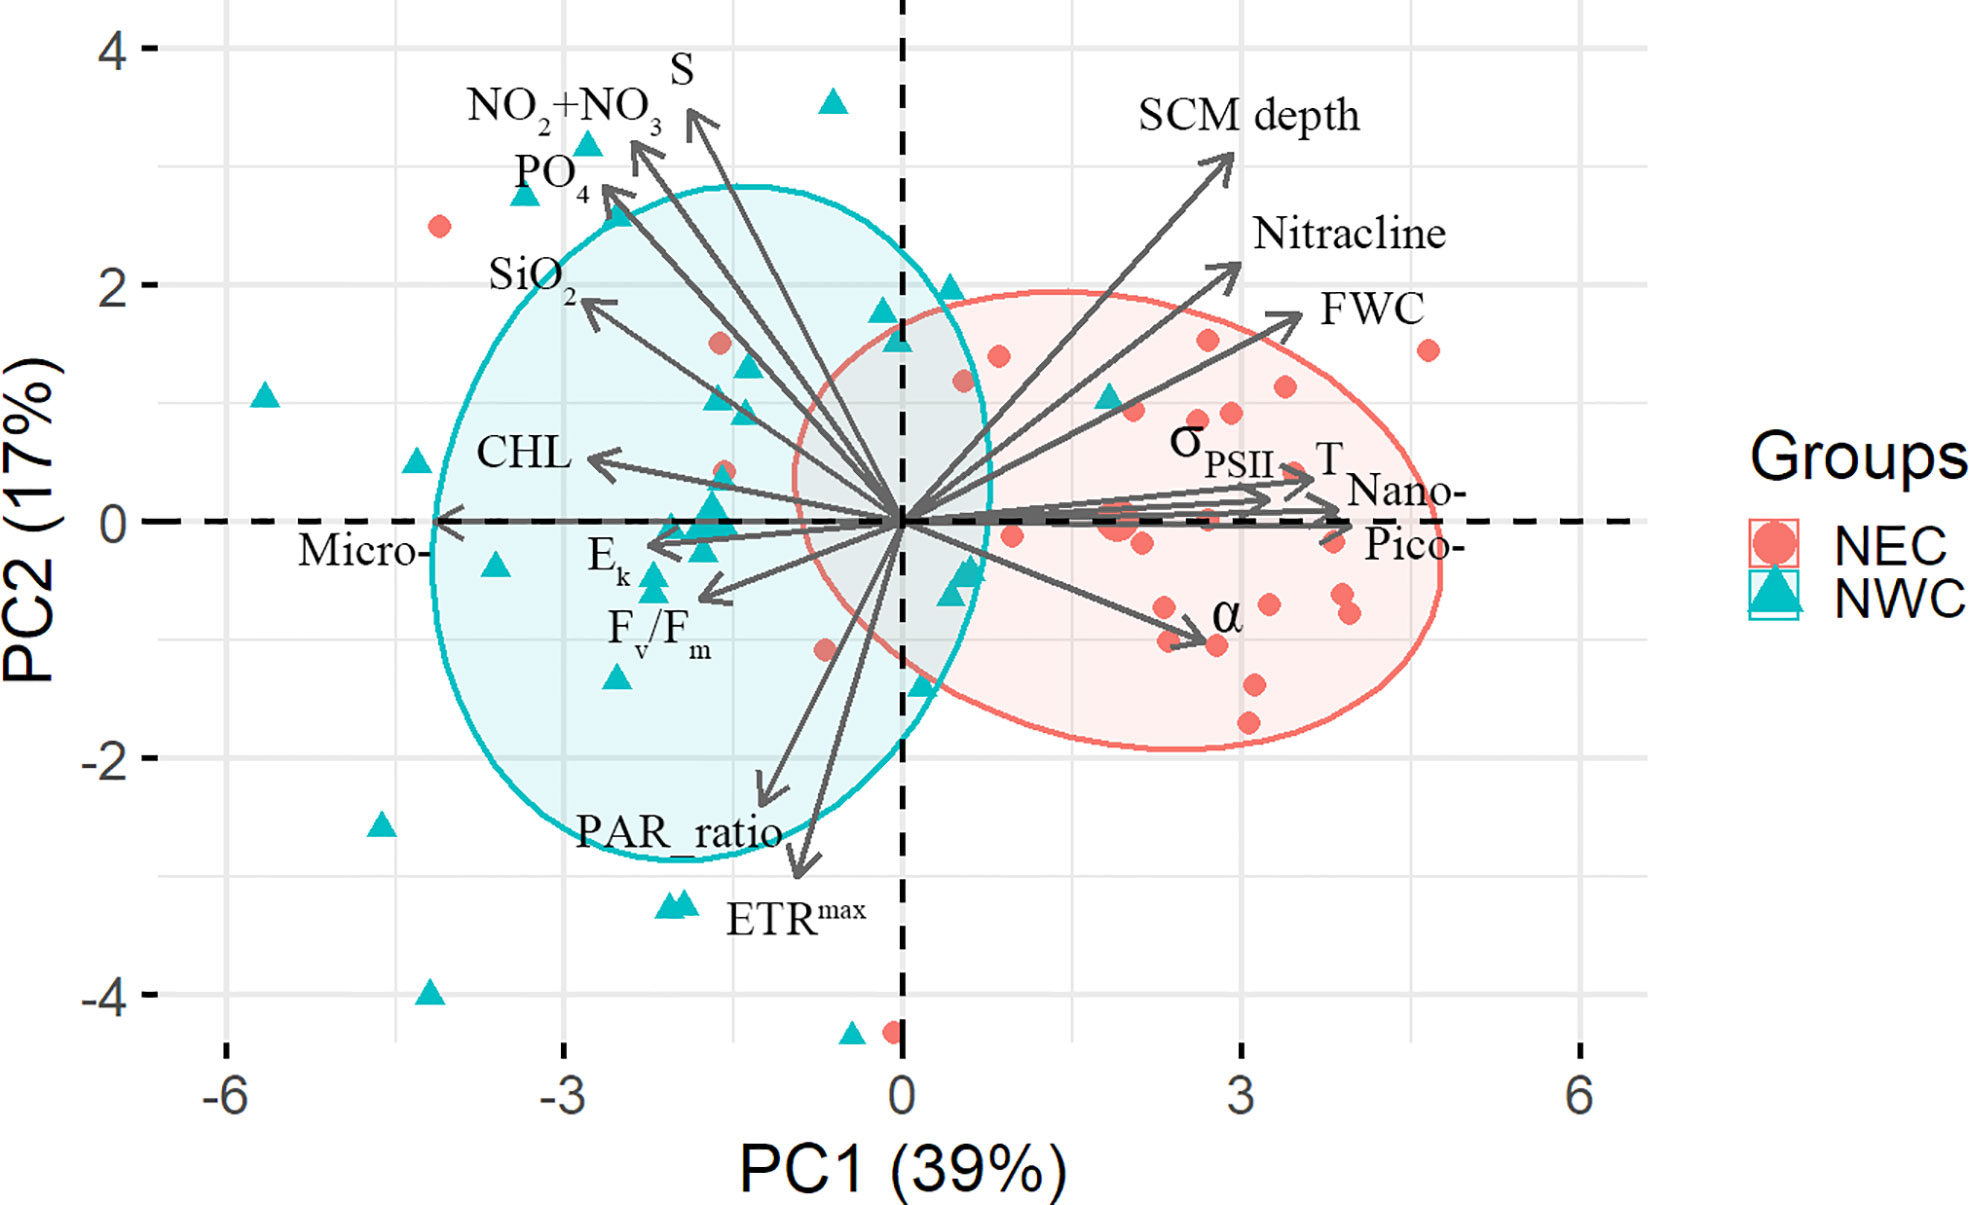
Figure 9 Biplot of the first and second principal components (PC1: 39%, PC2: 17%) between the environmental variables and phytoplankton photophysiological parameter in the subsurface chlorophyll maximum (SCM) grouped by regions. Terms and abbreviations: temperature (T); salinity (S); the SCM depth (SCM depth); nitracline; freshwater content (FWC); Chlorophyll‐a concentration (Chl‐a); size fraction (micro, nano, pico; %); photochemical efficiency (Fv/Fm); functional absorption cross‐section (σPSII); maximum electron transfer rate (ETRmax); light saturation for photosynthesis (Ek); light utilization efficiency (α); nitrite + nitrate (NO2 +NO3); phosphate (PO4); and silicate (SiO2); The ratio of photosynthetically available radiation (PAR) in the SCM layer to the surface layer (PAR_ratio).
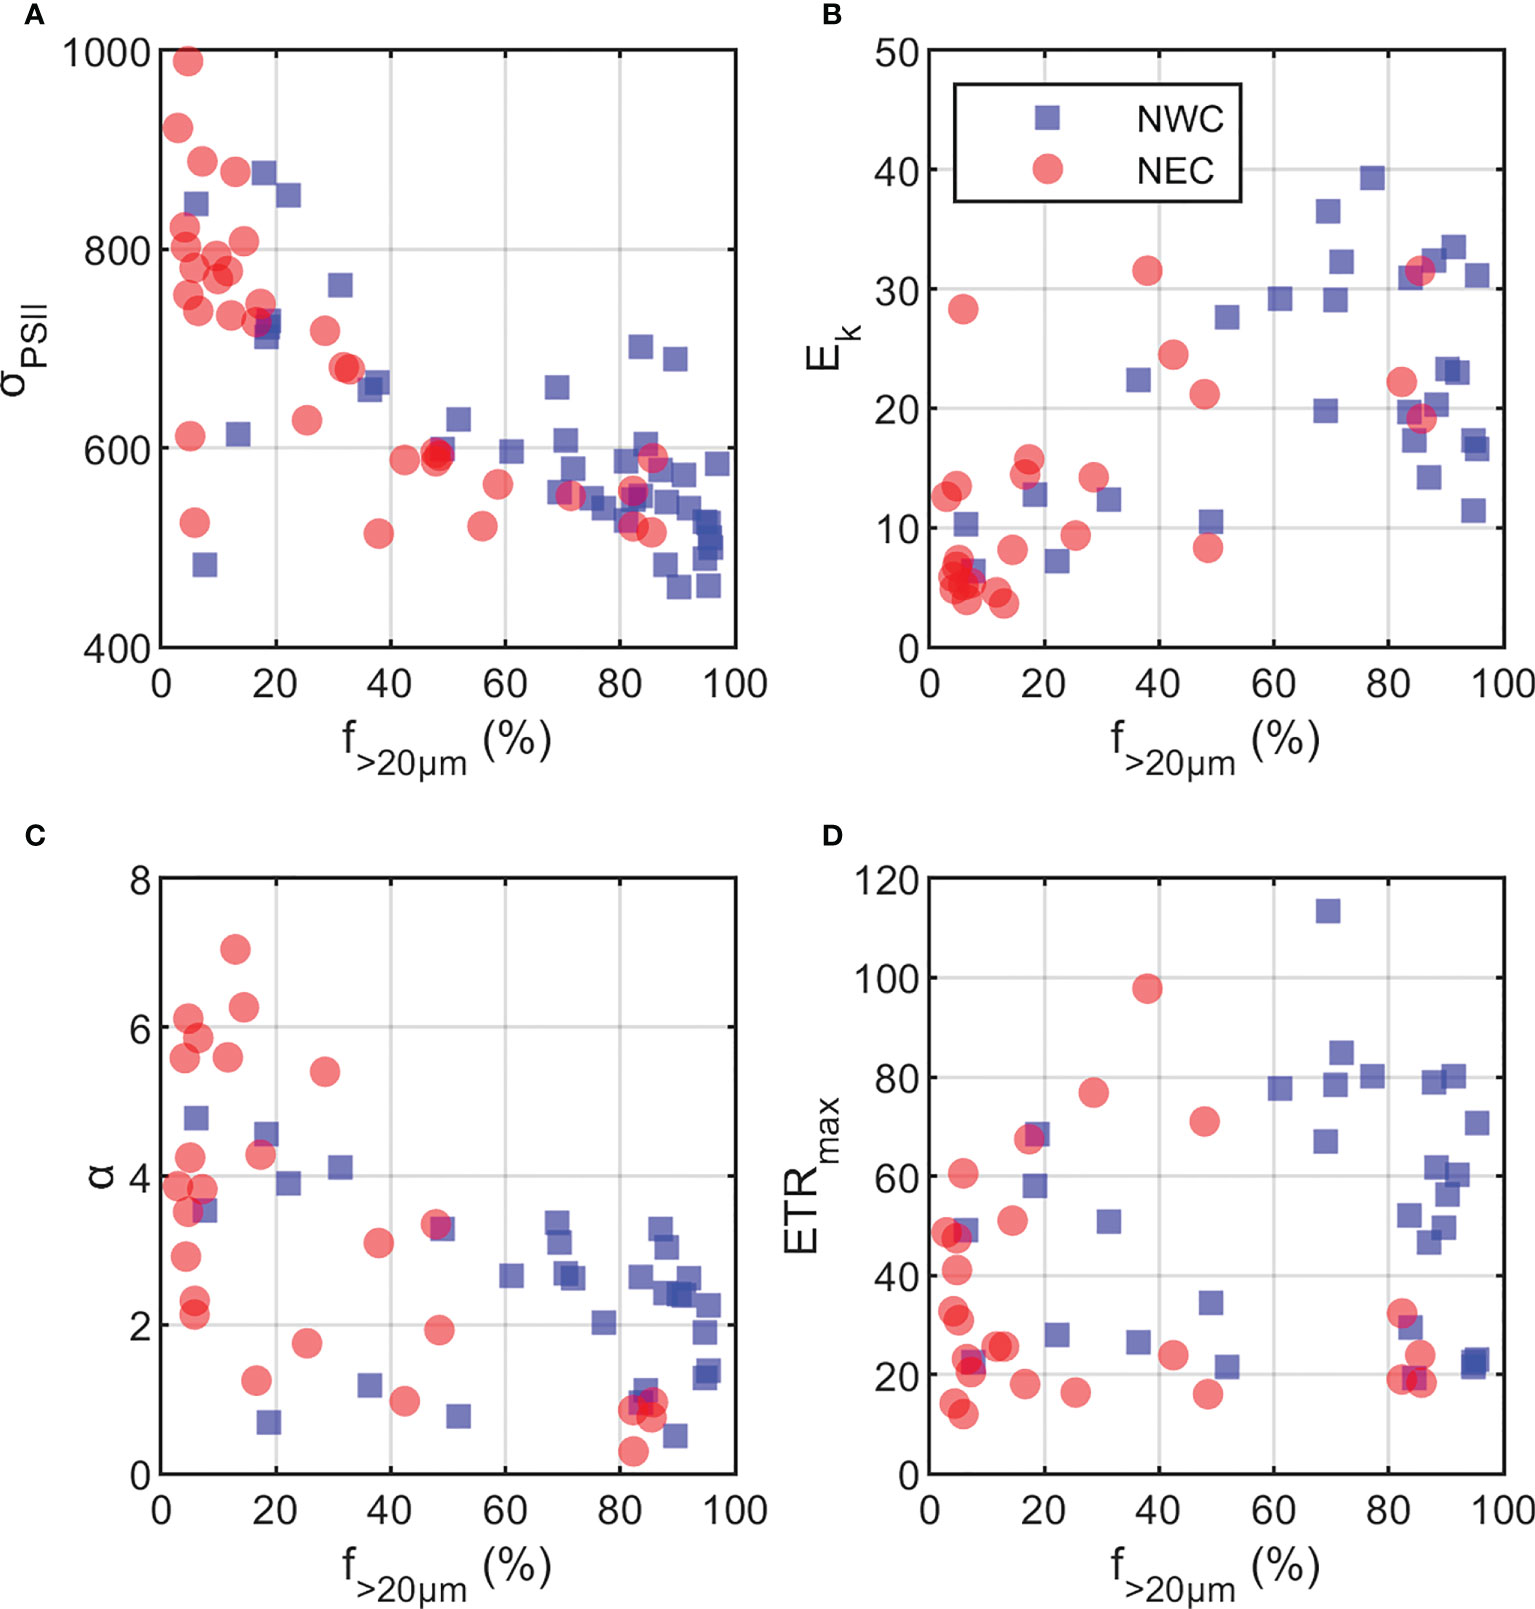
Figure 10 Relationships between microphytoplankton fraction (f>20μm; %) and photosynthetic variables. (A) functional absorption cross-section (σPSII; 10−20 m−2 photons−1), (B) minimum saturating irradiance (Ek; μmol photons m−2 s−1), and (C) light utilization efficiency (α; μmol electrons [μmol photons] −1), (D) maximum electron transfer rate (ETRmax; e−1 s−1 RC−1). The red circle and blue square represent the northeastern Chukchi Sea (NEC) and the northwestern Chukchi Sea (NWC), respectively.
Change in maximum electron transfer rate depending on light condition at the SCM
Nitrogen availability appeared to affect the distribution of Fv/Fm in the SCM layer, but did not show a significant relationship with ETRmax. Thus, we analyzed the factors that influenced the distribution of ETRmax by region. In the second principal component (PC2: 17%), ETRmax showed a positive correlation with PAR_ratio (r = 0.33, p = 0.07) and a negative correlation with the SCM depth (r = −0.56, p< 0.01, Figure 9). Arctic phytoplankton are well known for their adaptation to low-light conditions, resulting in high α and low Ek. (Platt et al., 1982; Gallegos et al., 1983; Palmer et al., 2011). The PAR_ratio in the Arctic Ocean is generally reported to be at a 1–5% level (Martin et al., 2012). This was similar to our results (~4.0%), with no regional differences in PAR_ratio. However, the PAR_ratio continued to increase from 2.7% in 2015 to 8.5% in 2018 as the SCM depth in the NWC region became shallow owing to the uplift of the nitracline described above. In fact, the PAR of the two years (2015 vs 2018) was not significantly different (4.6 ± 3.8 vs 7.0 ± 8.2 μmol photons m-2 s-1) in the NWC region (Supplementary Figure 1), but the increase in the PAR ratio considered that the light availability was improved in the SCM layer. For example, doubling of the average PAR_ratio between 2015 and 2018 resulted in a difference of approximately 30% in the ETRmax in the NWC region (41 e−1 s−1 RC−1 and 60 e−1 s−1 RC−1, respectively) (Figure 11A). In the surface layer, severe nitrogen limitation reduced the ETRmax by approximately 40% in the Chukchi Sea (Ko et al., 2020), which suggests a very strong reduction (ca. 80%) in net primary production (Gorbunov and Falkowski, 2020). In contrast to the surface layer, it was shown that the improvement in light conditions (e.g. a two-fold increase in the PAR ratio) increased ETRmax in the presence of sufficient nitrogen availability within the SCM layer (Palmer et al., 2013). This result suggests that the position of the SCM layer associated with light availability affects the photosynthetic rate (Bouman et al., 2020). Similarly, the maximum rate of photosynthesis measured by the 14C method was also regulated under a physical environment such as light (Harrison and Platt, 1986; Huot et al., 2013). Meanwhile, PAR_ratio was similar in the NEC region during the study period; thus, ETRmax did not change significantly (Figure 11B). We found that the photophysiological properties of phytoplankton at the SCM depth depending on the light and nitrogen availability could greatly contribute to the primary production in the water column. Since the contribution of Chl-a concentration in the SCM layer was high in the summer of the Arctic Ocean, understanding the photophysiological properties of phytoplankton at the SCM depth would be essential to confirming changes in primary production in the Arctic Ocean.
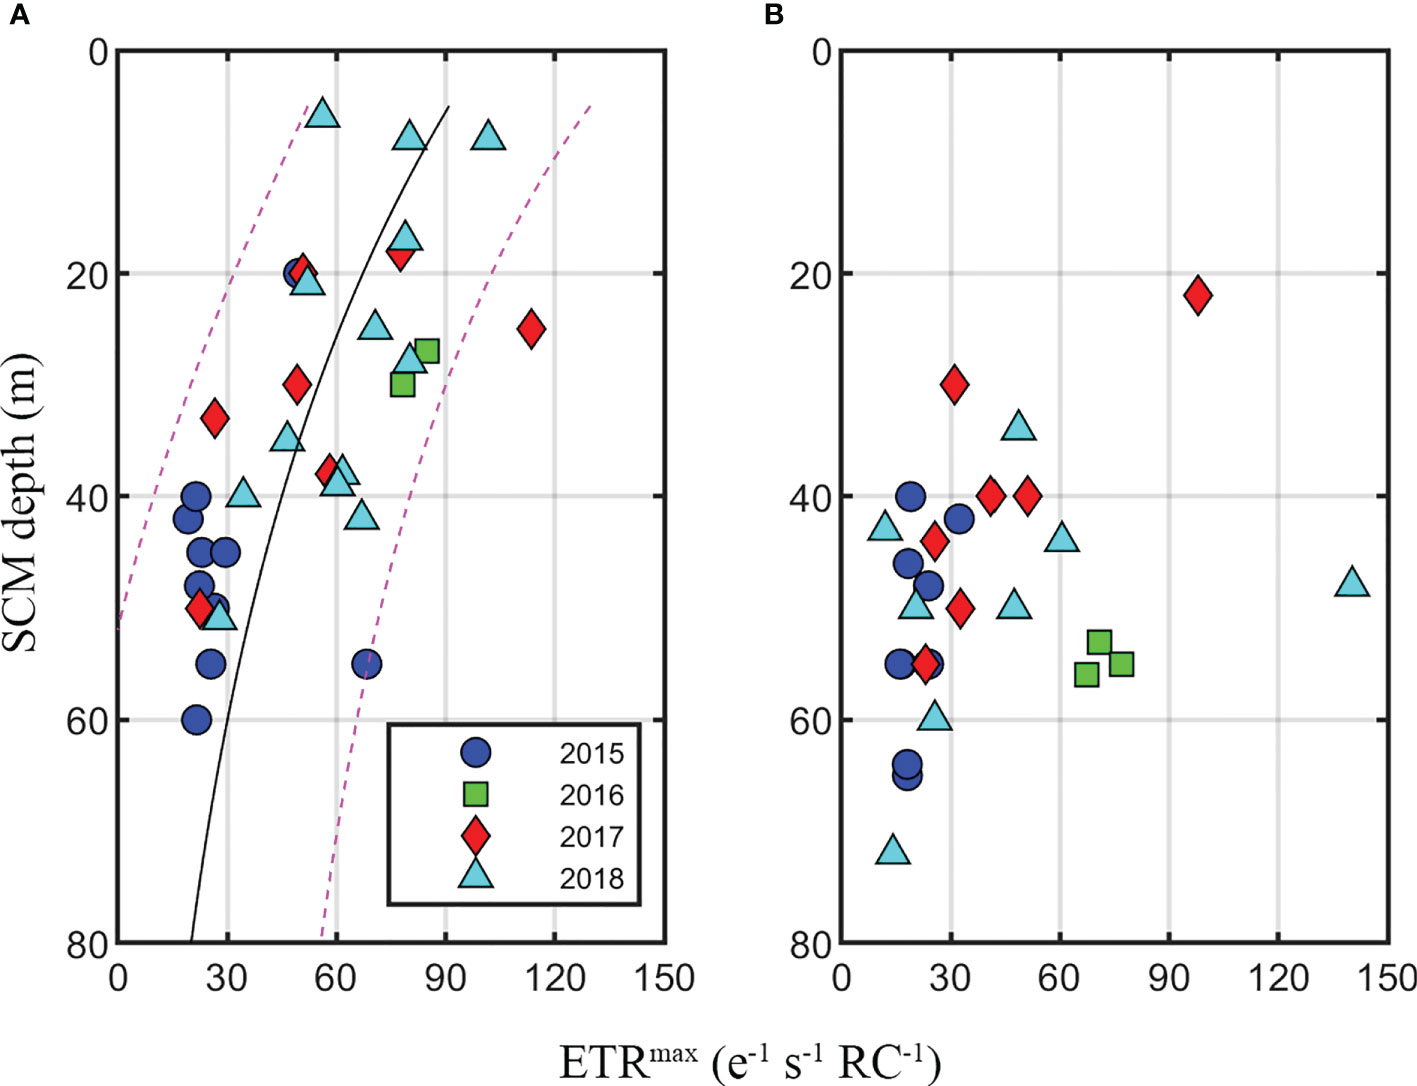
Figure 11 Regional distribution of maximum electron transfer rate (ETRmax) at the subsurface chlorophyll maximum (SCM) by year. (A) The northwestern Chukchi Sea and (B) the northeastern Chukchi Sea. The black line and blue dotted line represent a non-linear regression line and a 90% confidence interval.
Our study describes the responses of phytoplankton photophysiology to nitrogen availability and light conditions at the SCM in the Arctic Ocean in summertime. The extent of nitrogen availability in the SCM layer affects the photochemical activity (e.g. Fv/Fm) and light absorption ability (e.g. σPSII and α) depending on the phytoplankton community structure by region. Similar to the effect of nitrogen limitation on surface phytoplankton in the Arctic Ocean, the reduced nitrogen availability in the SCM layer decreased Fv/Fm by approximately 10% and also decreased the fraction of large phytoplankton in the NEC region. Despite the reduction in nitrogen availability in the NEC region, there was no significant change in ETRmax. Meanwhile, large phytoplankton in the NWC region, which showed sufficient nitrogen availability in the SCM layer, retained high photochemical efficiency but resulted in low light absorption ability due to the package effect. In addition, the improvement of the light conditions in the SCM layer caused by the shallower SCM depth contributed to an increase in ETRmax by up to 30%, which was similar to the increase in ETRmax of surface phytoplankton by the alleviation of nitrogen limitation. In other words, fluctuations in light conditions could have a greater effect on phytoplankton photosynthetic capacity and primary production, based on sufficient nitrogen availability in the SCM layer. The recent inflows of the Atlantic-origin and Pacific-origin waters have delivered additional nutrient fluxes to the Arctic Ocean, which has caused the increase in primary production in the Arctic Ocean (Lewis et al., 2020). The amount and duration of light transmitted to the water layer has increased owing to the reduced sea ice extent and thickness in the Arctic Ocean (Ardyna and Arrigo, 2020). Therefore, our findings have important implications for understanding how changes in light conditions and nutrient fluxes might affect phytoplankton photosynthesis and primary production in the subsurface layer of the Arctic Ocean.
Data availability statement
The datasets presented in this study can be found in online repositories. The names of the repository/repositories and accession number(s) can be found in the article/Supplementary Material.
Author contributions
EK performed a field survey and data analysis and wrote the manuscript. MG contributed instrumentation and corrected the manuscript. JJ provided and analyzed chemical data. YL processed and provided biological data. K-HC processed and provided physical data. EY was the leader of the Korea-Arctic Ocean Warming and Response of Ecosystem Program and provided scientific advice. JP conceived the study, participated in the design, and helped to draft the manuscript. All authors contributed to the article and approved the submitted version.
Funding
This research was a part of the project titled ‘Korea‐Arctic Ocean Warming and Response of Ecosystem (K-AWARE, KOPRI, 20210605)’, funded by the Ministry of Oceans and Fisheries, Korea. MYG was in part funded by NASA Ocean Biology and Biogeochemistry Program (grants NNX16AT54G and 80NSSC18K1416).
Acknowledgments
We thank the captain and the crew of the R/V Araon for assistance with field data collection, as well as members of the division of polar ocean science, KOPRI. We would like to thank Editage (www.editage.co.kr) for English language editing. The editor and reviewers for constructive comments.
Conflict of interest
The authors declare that the research was conducted in the absence of any commercial or financial relationships that could be construed as a potential conflict of interest.
Publisher’s note
All claims expressed in this article are solely those of the authors and do not necessarily represent those of their affiliated organizations, or those of the publisher, the editors and the reviewers. Any product that may be evaluated in this article, or claim that may be made by its manufacturer, is not guaranteed or endorsed by the publisher.
Supplementary material
The Supplementary Material for this article can be found online at: https://www.frontiersin.org/articles/10.3389/fmars.2022.979998/full#supplementary-material
References
Aagaard K., Carmack E. C. (1989). The role of Sea ice and other fresh-water in the Arctic circulation. J. Geophysical Research-Oceans 94 (C10), 14485–14498. doi: 10.1029/JC094iC10p14485
Alkire M. B., Rember R., Polyakov I. (2019). Discrepancy in the identification of the Atlantic/Pacific front in the central Arctic ocean: NO versus nutrient relationships. Geophysical Res. Lett. 46 (7), 3843–3852. doi: 10.1029/2018gl081837
Almazán-Becerril A., Rivas D., García-Mendoza E. (2012). The influence of mesoscale physical structures in the phytoplankton taxonomic composition of the subsurface chlorophyll maximum off western Baja California. Deep Sea Res. Part I: Oceanographic Res. Papers 70, 91–102. doi: 10.1016/j.dsr.2012.10.002
Ardyna M., Arrigo K. R. (2020). Phytoplankton dynamics in a changing Arctic ocean. Nat. Climate Change 10 (10), 892–903. doi: 10.1038/s41558-020-0905-y
Ardyna M., Babin M., Gosselin M., Devred E., Belanger S., Matsuoka A., et al. (2013). Parameterization of vertical chlorophyll a in the Arctic ocean: impact of the subsurface chlorophyll maximum on regional, seasonal, and annual primary production estimates. Biogeosciences 10 (6), 4383–4404. doi: 10.5194/bg-10-4383-2013
Ardyna M., Babin M., Gosselin M., Devred E., Rainville L., Tremblay J. E. (2014). Recent Arctic ocean sea ice loss triggers novel fall phytoplankton blooms. Geophysical Res. Lett. 41 (17), 6207–6212. doi: 10.1002/2014gl061047
Arrigo K. R., Perovich D. K., Pickart R. S., Brown Z. W., Dijken G., Lowry K. E., et al. (2012). Massive phytoplankton blooms under Arctic Sea ice. Science 336 (6087), 1408–1408. doi: 10.1126/science.1215065
Arrigo K. R., van Dijken G. L. (2011). Secular trends in Arctic ocean net primary production. J. Geophysical Research-Oceans. 116, C09011. doi: 10.1029/2011JC007151
Arrigo K. R., van Dijken G., Pabi S. (2008). Impact of a shrinking Arctic ice cover on marine primary production. Geophysical Res. Lett. 35 (19), 1–6. doi: 10.1029/2008GL035028
Baldry K., Strutton P. G., Hill N. A., Boyd P. W. (2020). Subsurface chlorophyll-a maxima in the southern ocean. Front. Mar. Sci. 7. doi: 10.3389/fmars.2020.00671
Behrenfeld M. J., Kolber Z. S. (1999). Widespread iron limitation of phytoplankton in the south pacific ocean. Science 283 (5403), 840–843. doi: 10.1126/science.283.5403.840
Bibby T. S., Gorbunov M. Y., Wyman K. W., Falkowski P. G. (2008). Photosynthetic community responses to upwelling in mesoscale eddies in the subtropical north Atlantic and pacific oceans. Deep-Sea Res. Part Ii-Topical Stud. Oceanography 55 (10-13), 1310–1320. doi: 10.1016/j.dsr2.2008.01.014
Bouman H. A., Jackson T., Sathyendranath S., Platt T. (2020). Vertical structure in chlorophyll profiles: influence on primary production in the Arctic ocean. Philos. Trans. A Math Phys. Eng. Sci. 378 (2181), 20190351. doi: 10.1098/rsta.2019.0351
Brown Z. W., Lowry K. E., Palmer M. A., van Dijken G. L., Mills M. M., Pickart R. S., et al. (2015). Characterizing the subsurface chlorophyll a maximum in the chukchi Sea and Canada basin. Deep-Sea Res. Part Ii-Topical Stud. Oceanography 118, 88–104. doi: 10.1016/j.dsr2.2015.02.010
Carvalho K. S., Wang S. (2020). Sea Surface temperature variability in the Arctic ocean and its marginal seas in a changing climate: Patterns and mechanisms. Global Planetary Change 193, 103265. doi: 10.1016/j.gloplacha.2020.103265
Cheah W., McMinn A., Griffiths F. B., Westwood K. J., Wright S. W., Clementson L. A. (2013). Response of phytoplankton photophysiology to varying environmental conditions in the Sub-Antarctic and polar frontal zone. PloS One 8 (8), e72165. doi: 10.1371/journal.pone.0072165
Codispoti L. A., Flagg C., Kelly V., Swift J. H. (2005). Hydrographic conditions during the 2002 SBI process experiments. Deep-Sea Res. Part Ii-Topical Stud. Oceanography 52 (24-26), 3199–3226. doi: 10.1016/j.dsr2.2005.10.007
Comiso J. C., Meier W. N., Gersten R. (2017). Variability and trends in the Arctic Sea ice cover: Results from different techniques. J. Geophysical Research-Oceans 122 (8), 6883–6900. doi: 10.1002/2017jc012768
Coupel P., Jin H. Y., Joo M., Horner R., Bouvet H. A., Sicre M. A., et al. (2012). Phytoplankton distribution in unusually low sea ice cover over the pacific Arctic. Biogeosciences 9 (11), 4835–4850. doi: 10.5194/bg-9-4835-2012
Coupel P., Ruiz-Pino D., Sicre M. A., Chen J. F., Lee S. H., Schiffrine N., et al. (2015). The impact of freshening on phytoplankton production in the pacific Arctic ocean. Prog. Oceanography 131, 113–125. doi: 10.1016/j.pocean.2014.12.003
Falkowski P. G., Koblfzek M., Gorbunov M., Kolber Z. (2004). “Development and application of variable chlorophyll fluorescence techniques in marine ecosystems,” in Chlorophyll a fluorescence. Eds. Papageorgiou G. C., Govindjee (Dordrecht: Springer Netherlands), 757–778.
Gallegos C. L., Platt T., Harrison W. G., Irwin B. (1983). Photosynthetic parameters of arctic marine phytoplankton: Vertical variations and time scales of adaptation. Limnology Oceanography 28 (4), 698–708. doi: 10.4319/lo.1983.28.4.0698
Gong D. L., Pickart R. S. (2015). Summertime circulation in the eastern chukchi Sea. Deep-Sea Res. Part Ii-Topical Stud. Oceanography 118, 18–31. doi: 10.1016/j.dsr2.2015.02.006
Gong D. L., Pickart R. S. (2016). Early summer water mass transformation in the eastern chukchi Sea. Deep-Sea Res. Part Ii-Topical Stud. Oceanography 130, 43–55. doi: 10.1016/j.dsr2.2016.04.015
Gorbunov M. Y., Falkowski P. (2004). Flourescence induction and relaxation (FIRE) technique and instrumentation for monitoring photosynthetic processes and primary production in aquatic ecosystems. Photosynthesis: Fundam. Aspects to Global Perspect. 13th International congress of photosynthesis. Montreal: Allen Press , 1029-1031.
Gorbunov M. Y., Falkowski P. G. (2020). Using chlorophyll fluorescence kinetics to determine photosynthesis in aquatic ecosystems. Limnology Oceanography 66 (1), 1–13. doi: 10.1002/lno.11581
Gorbunov M. Y., Falkowski P. G., Kolber Z. S. (2000). Measurement of photosynthetic parameters in benthic organisms in situ using a SCUBA-based fast repetition rate fluorometer. Limnology Oceanography 45 (1), 242–245. doi: 10.4319/lo.2000.45.1.0242
Gorbunov M. Y., Kolber Z. S., Falkowski P. G. (1999). Measuring photosynthetic parameters in individual algal cells by fast repetition rate fluorometry. Photosynthesis Res. 62 (2-3), 141–153. doi: 10.1023/A:1006360005033
Gorbunov M. Y., Kolber Z. S., Lesser M. P., Falkowski P. G. (2001). Photosynthesis and photoprotection in symbiotic corals. Limnology Oceanography 46 (1), 75–85. doi: 10.4319/lo.2001.46.1.0075
Gorbunov M. Y., Shirsin E., Nikonova E., Fadeev V. V., Falkowski P. G. (2020). A multi-spectral fluorescence induction and relaxation (FIRe) technique for physiological and taxonomic analysis of phytoplankton communities. Mar. Ecol. Prog. Ser. 644, 1–13. doi: 10.3354/meps13358
Gordon L., Jennings J., Ross A., Krest J. (1993). A suggested protocol for continuous flow automated analysis of seawater nutrients (Phosphate, nitrate, nitrite and silicic acid) in the WOCE hydrographic program and the joint global ocean fluxes study. Methods Manual WHPO, 68/91, 1–52.
Harrison W. G., Platt T. (1986). Photosynthesis-irradiance relationships in polar and temperate phytoplankton populations. Polar Biol. 5 (3), 153–164. doi: 10.1007/Bf00441695
Hill V., Cota G. (2005). Spatial patterns of primary production on the shelf, slope and basin of the Western Arctic in 2002. Deep-Sea Res. Part Ii-Topical Stud. Oceanography 52 (24-26), 3344–3354. doi: 10.1016/j.dsr2.2005.10.001
Hill V. J., Matrai P. A., Olson E., Suttles S., Steele M., Codispoti L. A., et al. (2013). Synthesis of integrated primary production in the Arctic ocean: II. In situ and remotely sensed estimates. Prog. Oceanography 110, 107–125. doi: 10.1016/j.pocean.2012.11.005
Huot Y., Babin M., Bruyant F. (2013). Photosynthetic parameters in the Beaufort Sea in relation to the phytoplankton community structure. Biogeosciences 10 (5), 3445–3454. doi: 10.5194/bg-10-3445-2013
Jassby A. D., Platt T. (1976). Mathematical formulation of the relationship between photosynthesis and light for phytoplankton. Limnology Oceanography 21 (4), 540–547. doi: 10.4319/lo.1976.21.4.0540
Jung J., Cho K. H., Park T., Yoshizawa E., Lee Y., Yang E. J., et al. (2021). Atlantic-Origin cold saline water intrusion and shoaling of the nutricline in the pacific Arctic. Geophysical Res. Lett. 48 (6), e2020GL090907. doi: 10.1029/2020GL090907
Kirk J. T. O. (1975). A theoretical analysis of the contribution of algal cells to the attenuation of light within natural waters ii. spherical cells. New Phytol. 75 (1), 21–36. doi: 10.1111/j.1469-8137.1975.tb01367.x
Kirk J. T. O. (1994). Light and photosynthesis in aquatic ecosystems (Cambridge: Cambridge University Press).
Ko E., Gorbunov M. Y., Jung J., Joo H. M., Lee Y., Cho K. H., et al. (2020). Effects of nitrogen limitation on phytoplankton physiology in the Western Arctic ocean in summer. J. Geophysical Research-Oceans 125 (11), e2020JC016501. doi: 10.1029/2020JC016501
Kolber Z. S., Barber R. T., Coale K. H., Fitzwater S. E., Greene R. M., Johnson K. S., et al. (1994). Iron limitation of phytoplankton photosynthesis in the equatorial pacific-ocean. Nature 371 (6493), 145–149. doi: 10.1038/371145a0
Kolber Z. S., Prasil O., Falkowski P. G. (1998). Measurements of variable chlorophyll fluorescence using fast repetition rate techniques: defining methodology and experimental protocols. Biochim. Et Biophys. Acta-Bioenergetics 1367 (1-3), 88–106. doi: 10.1016/S0005-2728(98)00135-2
Korhonen M., Rudels B., Marnela M., Wisotzki A., Zhao J. (2013). Time and space variability of freshwater content, heat content and seasonal ice melt in the Arctic ocean from 1991 to 2011. Ocean Sci. 9 (6), 1015–1055. doi: 10.5194/os-9-1015-2013
Kulk G., van de Poll W. H., Buma A. G. (2018). Photophysiology of nitrate limited phytoplankton communities in kongsfjorden, spitsbergen. Limnology Oceanography. 63 (6), 2606–2617. doi: 10.1002/lno.10963
Lavergne J., Joliot P. (2000). Thermodynamics of the excited states of photosynthesis. Biophysics textbook onLine. Biophys. Society Bethesda MD, 1–12.
Lee Y., Min J. O., Yang E. J., Cho K. H., Jung J., Park J., et al. (2019). Influence of sea ice concentration on phytoplankton community structure in the chukchi and East Siberian seas, pacific Arctic ocean. Deep-Sea Res. Part I-Oceanographic Res. Papers 147, 54–64. doi: 10.1016/j.dsr.2019.04.001
Lewis K. M., van Dijken G. L., Arrigo K. R. (2020). Changes in phytoplankton concentration now drive increased Arctic ocean primary production. Science 369 (6500), 198–202. doi: 10.1126/science.aay8380
Martin J., Dumont D., Tremblay J. E. (2013). Contribution of subsurface chlorophyll maxima to primary production in the coastal Beaufort Sea (Canadian arctic): A model assessment. J. Geophysical Research-Oceans 118 (11), 5873–5886. doi: 10.1002/2013jc008843
Martin J., Tremblay J. E., Gagnon J., Tremblay G., Lapoussiere A., Jose C., et al. (2010). Prevalence, structure and properties of subsurface chlorophyll maxima in Canadian Arctic waters. Mar. Ecol. Prog. Ser. 412, 69–84. doi: 10.3354/meps08666
Martin J., Tremblay J. E., Price N. M. (2012). Nutritive and photosynthetic ecology of subsurface chlorophyll maxima in Canadian Arctic waters. Biogeosciences 9 (12), 5353–5371. doi: 10.5194/bg-9-5353-2012
Mills M. M., Brown Z. W., Laney S. R., Ortega-Retuerta E., Lowry K. E., van Dijken G. L., et al. (2018). Nitrogen limitation of the summer phytoplankton and heterotrophic prokaryote communities in the chukchi Sea. Front. Mar. Sci. 5 (362). doi: 10.3389/fmars.2018.00362
Moore C. M., Lucas M. I., Sanders R., Davidson R. (2005). Basin-scale variability of phytoplankton bio-optical characteristics in relation to bloom state and community structure in the northeast Atlantic. Deep-Sea Res. Part I-Oceanographic Res. Papers 52 (3), 401–419. doi: 10.1016/j.dsr.2004.09.003
Moore C. M., Mills M. M., Langlois R., Milne A., Achterberg E. P., La Roche J., et al. (2008). Relative influence of nitrogen and phosphorous availability on phytoplankton physiology and productivity in the oligotrophic sub-tropical north Atlantic ocean. Limnology Oceanography 53 (1), 291–305. doi: 10.4319/lo.2008.53.1.0291
Nishino S., Itoh M., Williams W. J., Semiletov I. (2013). Shoaling of the nutricline with an increase in near-freezing temperature water in the makarov basin. J. Geophysical Research-Oceans 118 (2), 635–649. doi: 10.1029/2012jc008234
Palmer M. A., Arrigo K. R., Mundy C. J., Ehn J. K., Gosselin M., Barber D. G., et al. (2011). Spatial and temporal variation of photosynthetic parameters in natural phytoplankton assemblages in the Beaufort Sea, Canadian Arctic. Polar Biol. 34 (12), 1915–1928. doi: 10.1007/s00300-011-1050-x
Palmer M. A., van Dijken G. L., Mitchell B. G., Seegers B. J., Lowry K. E., Mills M. M., et al. (2013). Light and nutrient control of photosynthesis in natural phytoplankton populations from the chukchi and Beaufort seas, Arctic ocean. Limnology Oceanography 58 (6), 2185–2205. doi: 10.4319/lo.2013.58.6.2185
Parkhill J. P., Maillet G., Cullen J. J. (2001). Fluorescence-based maximal quantum yield for PSII as a diagnostic of nutrient stress. J. Phycology 37 (4), 517–529. doi: 10.1046/j.1529-8817.2001.037004517.x
Park J., Kuzminov F. I., Bailleul B., Yang E. J., Lee S., Falkowski P. G., et al. (2017). Light availability rather than fe controls the magnitude of massive phytoplankton bloom in the amundsen Sea polynyas, Antarctica. Limnology Oceanography 62 (5), 2260–2276. doi: 10.1002/lno.10565
Parsons T. R., Maita Y., Lalli C. M. (1984). A manual of chemical and biological methods for seawater analysis (Oxford, UK: Pergamon Press). doi: 10.25607/OBP-1830.
Platt T., Harrison W. G., Irwin B., Horne E. P., Gallegos C. L. (1982). Photosynthesis and photoadaptation of marine phytoplankton in the arctic. Deep Sea Res. Part A. Oceanographic Res. Papers 29 (10), 1159–1170. doi: 10.1016/0198-0149(82)90087-5
Qiao H., Zang S., Yan F., Xu Z., Wang L., Wu H. (2021). Physiological responses of the diatoms thalassiosira weissflogii and thalassiosira pseudonana to nitrogen starvation and high light. Mar. Environ. Res. 166, 105276. doi: 10.1016/j.marenvres.2021.105276
Schuback N., Tortell P. D. D., Berman-Frank I., Campbell D. A. A., Ciotti A., Courtecuisse E., et al. (2021). Single-turnover variable chlorophyll fluorescence as a tool for assessing phytoplankton photosynthesis and primary productivity: Opportunities, caveats and recommendations. Front. Mar. Sci. 8. doi: 10.3389/fmars.2021.690607
Serreze M. C., Barrett A. P., Slater A. G., Woodgate R. A., Aagaard K., Lammers R. B., et al. (2006). The large-scale freshwater cycle of the Arctic. J. Geophysical Research-Oceans 111, C11010. doi: 10.1029/2005JC003424
Serreze M. C., Stroeve J. (2015). Arctic Sea ice trends, variability and implications for seasonal ice forecasting. Philos. Trans. A Math Phys. Eng. Sci. 373 (2045), 20140159. doi: 10.1098/rsta.2014.0159
Song H. J., Ji R. B., Jin M. B., Li Y., Feng Z. X., Varpe O., et al. (2021). Strong and regionally distinct links between ice-retreat timing and phytoplankton production in the Arctic ocean. Limnology Oceanography 66 (6), 2498–2508. doi: 10.1002/lno.11768
Stroeve J., Holland M. M., Meier W., Scambos T., Serreze M. (2007). Arctic Sea ice decline: Faster than forecast. Geophysical Res. Lett. 34 (9), L09501. doi: 10.1029/2007GL029703
Suggett D. J., Moore C. M., Hickman A. E., Geider R. J. (2009). Interpretation of fast repetition rate (FRR) fluorescence: signatures of phytoplankton community structure versus physiological state. Mar. Ecol. Prog. Ser. 376, 1–19. doi: 10.3354/meps07830
Sugie K., Fujiwara A., Nishino S., Kameyama S., Harada N. (2020). Impacts of temperature, CO2, and salinity on phytoplankton community composition in the Western Arctic ocean. Front. Mar. Sci. 6. doi: 10.3389/fmars.2019.00821
Tremblay J. E., Robert D., Varela D. E., Lovejoy C., Darnis G., Nelson R. J., et al. (2012). Current state and trends in Canadian Arctic marine ecosystems: I. primary production. Climatic Change 115 (1), 161–178. doi: 10.1007/s10584-012-0496-3
Wang Q., Wekerle C., Danilov S., Sidorenko D., Koldunov N., Sein D., et al. (2019). Recent Sea ice decline did not significantly increase the total liquid freshwater content of the Arctic ocean. J. Climate 32 (1), 15–32. doi: 10.1175/jcli-d-18-0237.1
Keywords: photochemical efficiency, phytoplankton, nitrogen availability, maximum electron transfer rate, subsurface chlorophyll maximum, Arctic Ocean
Citation: Ko E, Gorbunov MY, Jung J, Lee Y, Cho K-H, Yang EJ and Park J (2022) Phytoplankton photophysiology varies depending on nitrogen and light availability at the subsurface chlorophyll maximum in the northern Chukchi Sea. Front. Mar. Sci. 9:979998. doi: 10.3389/fmars.2022.979998
Received: 28 June 2022; Accepted: 11 October 2022;
Published: 25 October 2022.
Edited by:
Connie Lovejoy, Laval University, CanadaReviewed by:
Emmanuel Devred, Fisheries and Oceans Canada (DFO), CanadaHeather Bouman, University of Oxford, United Kingdom
Copyright © 2022 Ko, Gorbunov, Jung, Lee, Cho, Yang and Park. This is an open-access article distributed under the terms of the Creative Commons Attribution License (CC BY). The use, distribution or reproduction in other forums is permitted, provided the original author(s) and the copyright owner(s) are credited and that the original publication in this journal is cited, in accordance with accepted academic practice. No use, distribution or reproduction is permitted which does not comply with these terms.
*Correspondence: Jisoo Park, anNwYXJrQGtvcHJpLnJlLmty