
94% of researchers rate our articles as excellent or good
Learn more about the work of our research integrity team to safeguard the quality of each article we publish.
Find out more
ORIGINAL RESEARCH article
Front. Mar. Sci. , 28 October 2022
Sec. Marine Ecosystem Ecology
Volume 9 - 2022 | https://doi.org/10.3389/fmars.2022.979987
This article is part of the Research Topic Seafloor Heterogeneity: Artificial Structures and Marine Ecosystem Dynamics - Recent Advances View all 16 articles
 Ronen Galaiduk1,2*Ben Radford1,2Mark Case1Todd Bond2,3Michael Taylor2,3Tim Cooper2,4Luke Smith2,5Dianne McLean1,2
Regional patterns of fish diversity, abundance, distribution, and assemblage composition are driven by a combination of biotic and abiotic conditions in the marine environment, but these conditions can be altered through anthropogenic activities, such as those associated with oil and gas extraction. The present study utilises data on fish relative abundance and diversity obtained from 1546 baited remote underwater video deployments conducted between 2004 – 2019 in depths of 9 – 170 m across 2000 km of coastline in north-west Australia on natural habitats and subsea pipelines to understand the influence of oil and gas infrastructure on fish assemblages. A total of 450 fish taxa from 56 families was observed, with populations dominated by generalist and invertebrate carnivore taxa. At the regional scale, subsea pipelines had lower diversity (lower taxonomic richness) than natural environments, but possessed a higher abundance of piscivorous and herbivorous fish taxa. Clear patterns in fish assemblage composition were observed in multivariate analyses, reflecting the proximity of oceanic shoals and banks, depth, and to a lesser extent, oil and gas infrastructure. Shallow-water and close to shoals assemblages were characterised by a diversity of site-attached (e.g., wrasses, tuskfish), reef-associated taxa (e.g., emperors). Mesophotic fish assemblages were characterised by commercially important (e.g., goldband snapper), wide-ranging (e.g., sharks) and sand-affiliated (e.g., toadfish, threadfin bream) taxa. Proximity to pipelines and platforms ranked low as predictors in the multivariate analyses suggesting a negligible regional influence of these structures on fish communities in comparison to depth and shoal habitats. Local-scale influences of subsea infrastructure, however, may be important for some fish species (infrastructure vs. immediate surrounds). Our study highlights the influence of abiotic factors on regional-scale patterns in fish assemblage structure across north-west Australia.
Fish-habitat relationships can govern assemblage structure and vary spatially, with such variability manifesting in contrasting patterns of ecosystem functioning and values across a region (Underwood et al., 2000; Bradley et al., 2021). This can lead to diverging perceptions of the importance of different habitats for fish and the impact that their loss or modification may have on species survival and community maintenance (Zanini et al., 2009; Randin et al., 2020). While the underlying mechanisms for variation in fish assemblage structure are often unclear (Bradley et al., 2021), at fine spatial scales, they likely reflect population processes (e.g. competition, predation, settlement, recruitment mortality; Hyndes et al., 1996; Hyndes et al., 2003; Willis & Anderson, 2003; Almany, 2004; Hixon & Jones, 2005; Galaiduk et al., 2013) and at broader spatial scales may reflect environmental factors (e.g. depth, temperature, complexity; Gratwicke & Speight, 2005; Tuya et al., 2011; Langlois et al., 2012; Galaiduk et al., 2017a; Bradley et al., 2021). Understanding the processes that influence fish assemblage structure from fine scale to those that occur across seascapes is required to disaggregate population processes and environmental drivers, with this information also key to informing conservation and resource management.
A challenge for fisheries and conservation managers is to understand the status and trend of fish assemblages, not only considering population processes and environmental drivers, but the multiple natural and anthropogenic pressures that fish assemblages may face such as climate change (Pratchett et al., 2011) and cyclones (Gilmour et al., 2019). Another type of anthropogenic influence in the marine environment globally, is the presence and operation of offshore oil and gas (O&G) infrastructure. These structures are placed strategically on continental shelfs (Claisse et al., 2014; Fujii, 2015) where crude oil and natural gas pockets are identified (van Elden et al., 2019) and typically comprise pipelines, wells, platforms or floating facilities with substantial additional subsea infrastructure (e.g. umbilicals, flowlines, etc) deployed to support these activities. The addition and subsequent removal (e.g., through the decommissioning of O&G infrastructure) of this prominent artificial habitat is likely to have a substantial impact on marine communities (Meyer-Gutbrod et al., 2019), including fish (Claisse et al., 2015), yet such impact assessment research is missing from published literature (but see Coolen et al., 2020; Meyer-Gutbrod et al., 2020).
The fish assemblages of natural shallow marine ecosystems across north-west (NW) Australia have been relatively well studied (Wilson et al., 2012; Evans et al., 2014; McLean et al., 2016), particularly in comparison to those present in mesophotic depths and beyond (Currey-Randall et al., 2021; Saunders et al., 2021; Wellington et al., 2021). Unique and diverse fish communities exist across the inshore shallow coral reefs, offshore emergent oceanic reefs, oceanic banks and shoals of the region (Heyward et al., 2012; Moore et al., 2014; Wilson et al., 2014; Moore et al., 2017) with lower fish diversity in sand-dominated regions offshore (Currey-Randall et al., 2021; McLean et al., 2021). The NW supports a number of commercial finfish fishery operations such as Northern Demersal Scalefish Managed Fishery, Pilbara Demersal Scalefish Fisheries and Northern Territory Demersal fishery as well as several others throughout this region (Newman et al., 2020; Gaughan & Santoro, 2021). Habitat, depth and latitude have a strong influence on fish assemblage structure across this region (McLean et al., 2016) and fish species richness declines with increasing latitude (Wellington et al., 2021). In recent years, research into fish-habitat relationships in the NW has extended to O&G infrastructure with the goal of quantifying communities that exist on previously unstudied structures. This region possesses a significant O&G precinct valued at $37 billion (DMIRS, 2021) with construction, operation and decommissioning activities all potentially interacting with diverse marine ecosystems in this region. A diversity of fish assemblages have been observed to associate with subsea wells (Cummings et al., 2011; Fowler et al., 2015; McLean et al., 2018), pipelines (McLean et al., 2017; Bond et al., 2018a; Bond et al., 2018b; McLean et al., 2020) and platforms (Pradella et al., 2014; McLean et al., 2019; Thomson et al., 2021). Few studies have compared local fish assemblages on subsea structures to those in natural ecosystems (Bond et al., 2018a; Bond et al., 2018b; McLean et al., 2021; Schramm et al., 2021), with a lack of comparable data from infrastructure and natural ecosystems remaining one of the biggest drawbacks to understanding the influence of O&G structures on marine communities.
The present study represents the first large-scale investigation of the relative influence of environmental predictors including O&G infrastructure in structuring fish assemblages in NW Australia. Utilising comparable data from subsea pipelines and natural habitats, we aimed to: i) compare fish abundance and species richness on subsea pipelines to those observed in neighbouring natural seabed environments, ii) investigate the relative influence of environmental predictors in structuring fish assemblages in NW Australia and, iii) understand how proximity to oil and gas infrastructure (platform jackets and pipelines) may influence these fish assemblages.
The study focussed on three subsea pipelines (Griffin, Echo Yodel and Bayu-Undan) located within natural habitats in Australia’s NW marine estate (Figure 1). Data for pipelines and surrounding ecosystems were contributed by three independent studies, namely Bond et al., 2018a (Griffin), Bond et al., 2018b (Echo Yodel) and McLean et al., 2021 (Bayu-Undan), which was combined with historical data collected by the Australian Institute of Marine Science (AIMS) on the fish faunas occupying a range of natural habitats across the NW shelf (Table 1).
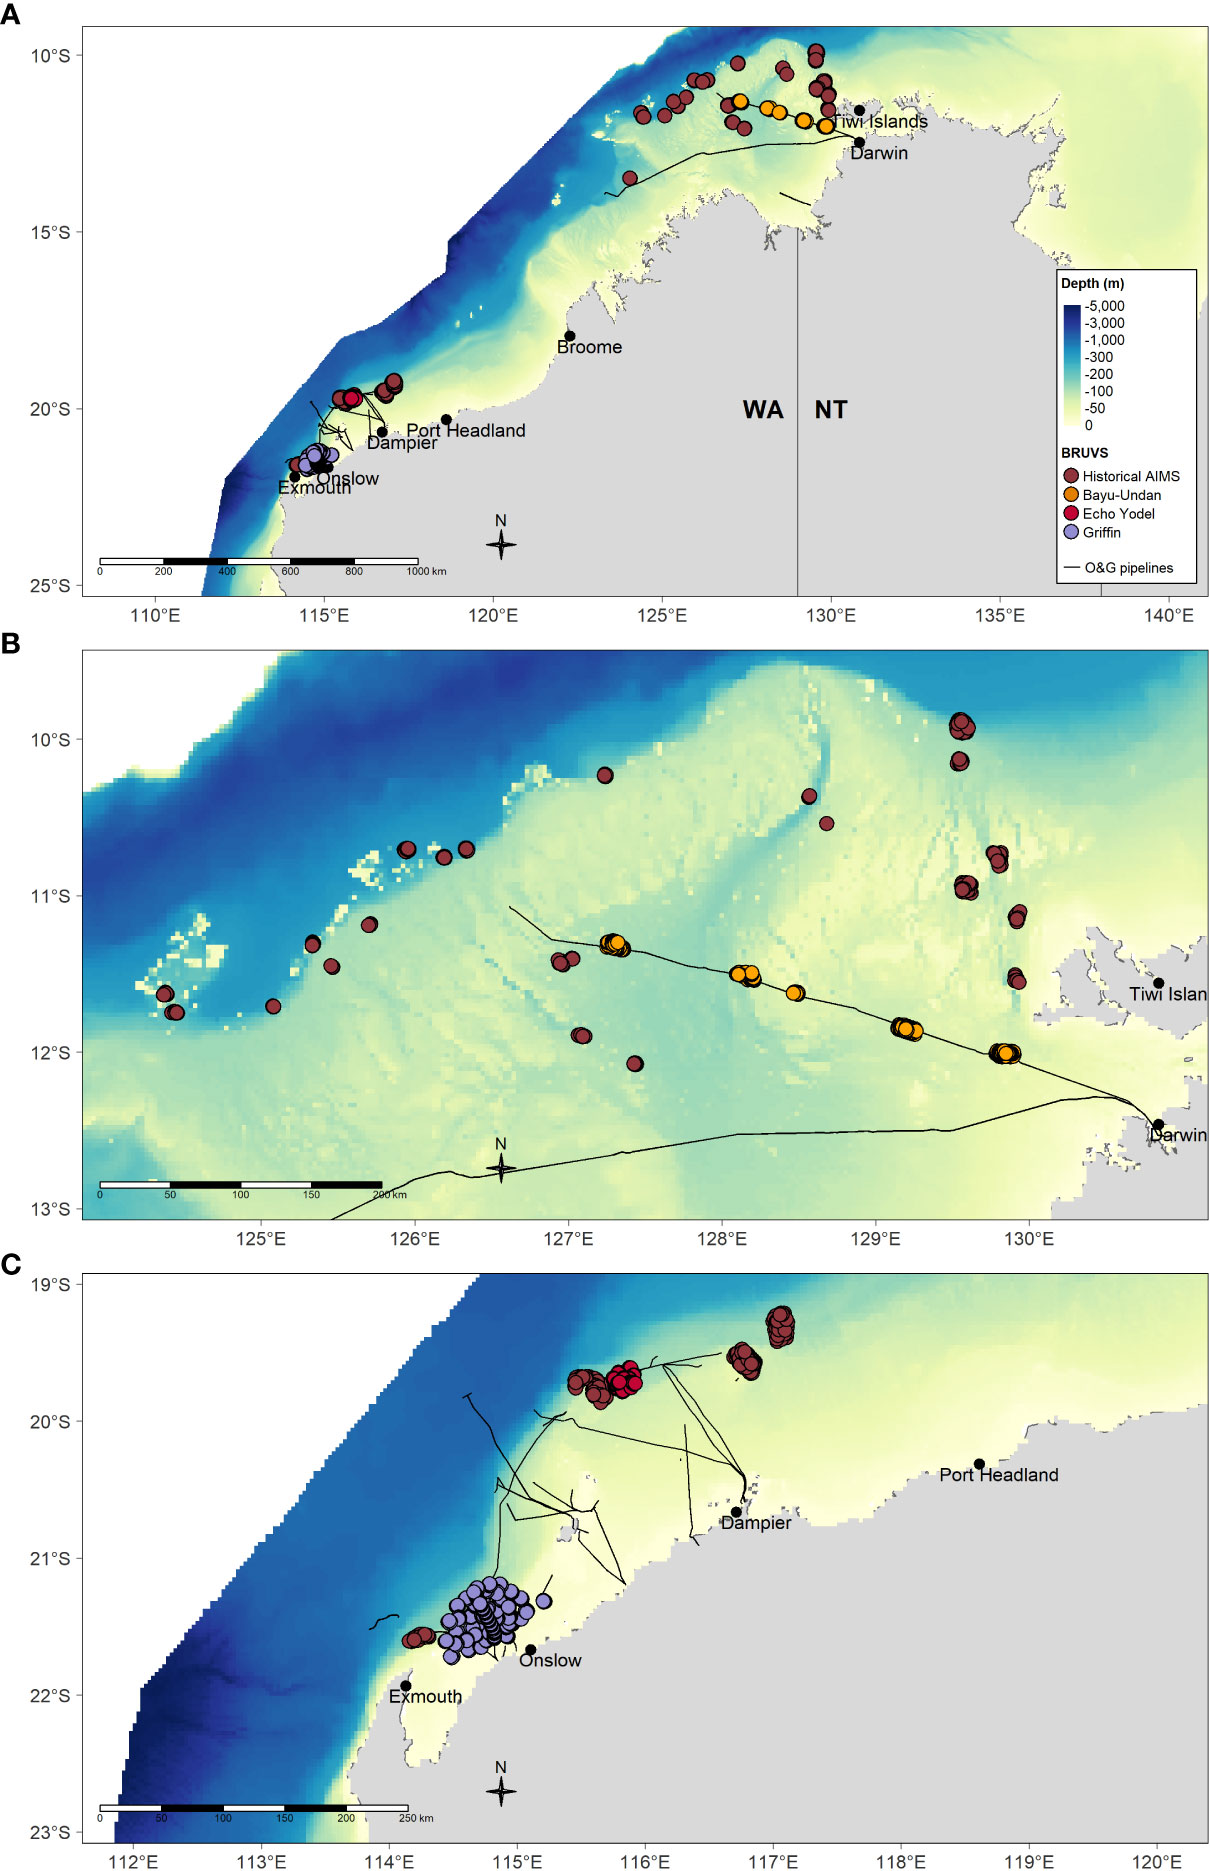
Figure 1 Location of individual BRUV deployments for which data were included in the present study from (A) across the region, (B) in the north and including the Bayu-Undan pipeline and, (C) in the north-west including Griffin and Echo Yodel pipelines and from historical AIMS BRUVs deployments in natural habitats. The studies for which the BRUVs data were collected are documented in Table 1. Depth raster sourced from Geoscience Australia 250 m bathymetry grid (Whiteway, 2009).
All surveys used baited remote underwater video systems (BRUVs) to sample fish communities according to standard protocols (Langlois et al., 2020). This included daytime surveys (one hour after sunrise to one hour before sunset), spacing of neighbouring deployments by at least 400 m, seabed filming times of 60 minutes and the use of ~1 kg of crushed pilchards (Sardinops sp.) as bait. EventMeasure software (www.seagis.com.au) was used to annotate individual fish within 8 m from the camera system, identify each fish to the finest taxonomic unit possible, and to obtain measures of relative abundance which was expressed as MaxN (the greatest abundance of each taxonomic unit record in a single frame of a deployment; Priede et al., 1994). Where fish could not be identified reliably to species level, they were recorded to the next lowest taxonomic level possible (typically genus or family, e.g., Nemipterus spp.). Use of BRUVs provides information on carnivorous fish species without precluding sampling of herbivores or prey species, yet tends to under-sample (as do other visual methods) very cryptic and small-bodied fishes such as Gobiidae (Watson et al., 2005; Harvey et al., 2007). Fishery target species were defined as those that are retained by commercial fisheries that operate in the NW region (Gaughan and Santoro, 2021). An additional range of fish metrics was recorded to facilitate investigation of how the trophic roles of species and assemblages compared across different habitats in the region. All species were assigned to feeding guilds based on dietary information obtained from Fishbase (Froese and Pauly, 2021a; Froese and Pauly, 2021b).
A range of environmental predictors considered to be potential ecological drivers for fish diversity and abundance were measured in order to examine their potential to predict the observed patterns in the fish assemblage structure across NW Australia.
We calculated proximity in metres between individual BRUV deployments and each of the nearest neighbour of a range of natural and artificial features: i) inshore shallow coral reefs (hereinafter reef; Kordi et al., 2016; UNEP-WCMC et al., 2021), ii) emergent oceanic reefs, oceanic banks, and oceanic shoals (hereinafter shoal; Moore et al., 2017; Heyward & Radford, 2019), as well as oil and gas iii) platform and iv) pipeline using the Euclidean distance tool in ArcGIS Pro 2.8.
Daily sea surface temperature (SST) data were acquired for all BRUV deployments from Modis Aqua Level 3 product satellite imagery with a spatial resolution of 500 m. The average SST for each historical campaign is indicated in Table 1. The nearest neighbour pixel extraction approach was used for deployments where SST data were not directly available using the NASA Appears application programming interface. This was necessary because data may not be available for a myriad of reasons (e.g., clouds, refraction and reflection, etc). The Level 3 product is geometrically and radiometrically corrected and cleaned to remove cloud artefacts with the SST calculated from surface reflectance bands using the algorithm outlined in Brown et al. (1999). Daily SST values from the time-series (2004-2019) were then averaged for each BRUV deployment location.
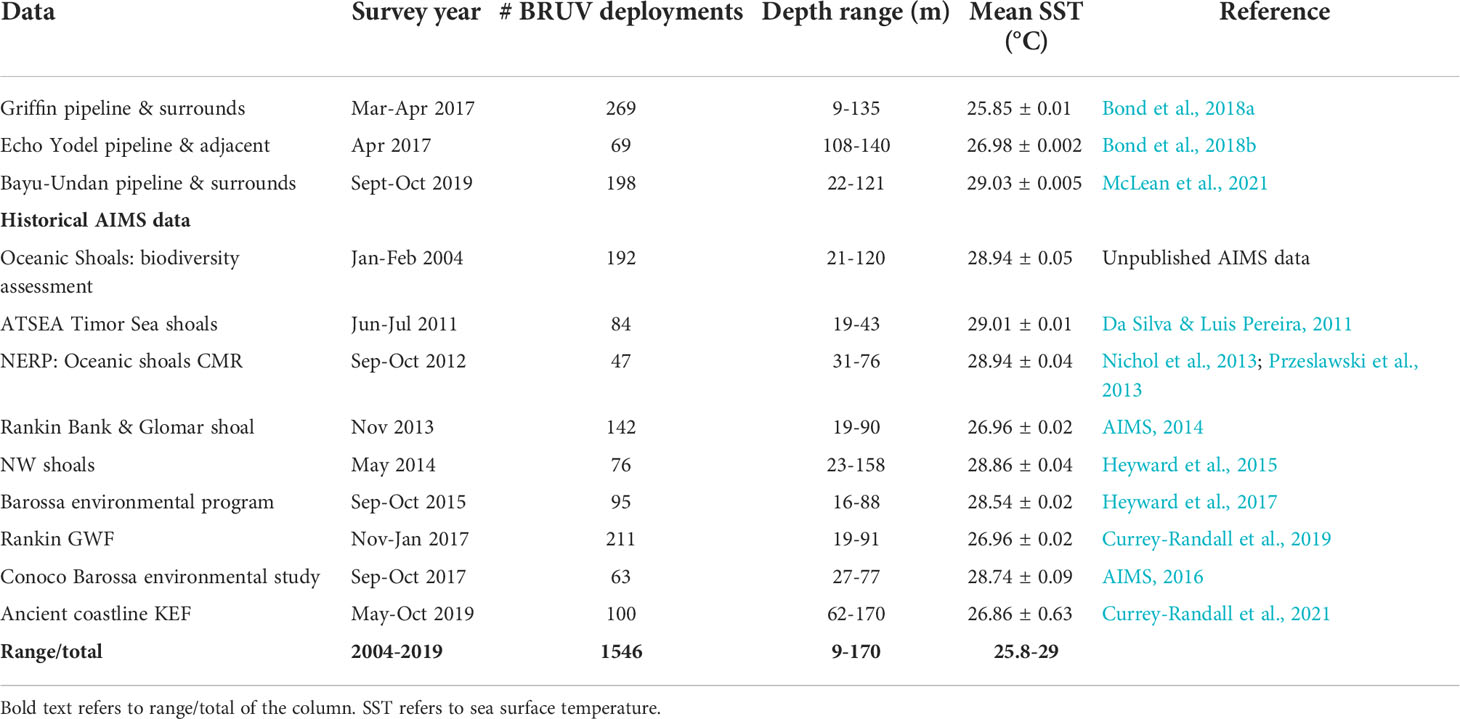
Table 1 A description of BRUVs data used and its source.
Seafloor depth and structural complexity were extracted and estimated for each BRUV deployment. Structural complexity variables (such as the mean or slope) were calculated from a 250 m resolution bathymetry raster (Whiteway, 2009) using ArcGIS Pro 2.8, custom-written code in Python, and terrain analysis techniques (Holmes et al., 2008). These techniques quantify the relationships among depth values in small neighbourhoods to reveal textural differences. Calculations are run on a small number of neighbourhood cells surrounding each pixel and the value assigned to the central cell in the output, thus creating a derivative dataset (see Cure et al., 2021; Currey-Randall et al., 2021; McLean et al., 2021) for additional information on secondary rasters). This produced a set of 23 secondary rasters that describe the structure and complexity of the seafloor (Supplementary Data Table S1). We then used a principal component analysis (PCA; Fung & LeDrew, 1987) and a geomorphic gradient isoclassification (Isoclass; Richards & Jia, 2006) to reduce the dimensionality of the secondary rasters and combine them into geomorphic clusters based on increasing levels of seafloor complexity (see Galaiduk et al., 2019; McLean et al., 2021 for additional details on geomorphic gradient analysis). We classified the seafloor complexity into three categories: ‘pipeline’, to represent the pipeline artificial habitat which was assigned based on a priori allocation of BRUV deployment locations from the sampling designs for each study; ‘low complexity off pipeline’ which consisted of the bottom two geomorphic clusters from the Isoclass analysis derived for natural habitats; and ‘high complexity off pipeline’ which included the top two geomorphic clusters of the natural seafloor complexity from the Isoclass analysis (hereafter pipeline, low and high complexity, respectively). All ‘off pipeline’ deployments are those >400 m away from subsea pipelines while ‘pipeline’ deployments were those specifically targeted at pipelines via either vessel’s echo sounder, GPS coordinates or visual observation in the camera systems, often with high accuracy (see Bond et al., 2018a; Bond et al., 2018b; McLean et al., 2021).
To test for differences among seafloor complexity categories and the relative abundance of feeding guilds of fish (summed MaxN’s for each deployment into six feeding guilds) we used a one way PERMANOVA analysis in PRIMER 7 with PERMANOVA extension (Anderson et al., 2008). We applied dispersion-based weighting first on the raw MaxN data to down weight the effects of highly abundant, schooling and clustered species (Clarke et al., 2006). We subsequently performed the PERMANOVA analysis which accounts for an unbalanced design (Anderson et al., 2008) using unrestricted permutation of the down-weighted data based on Bray-Curtis distance matrix with 9999 permutation and type III sum of squares. A post-hoc pairwise comparison was completed to investigate significant statistical results of the PERMANOVA. In addition, we ran individual PERMANOVA tests on each feeding guild separately (using the same method described above) to investigate guild-specific patterns.
To examine whether variation in fish assemblage composition could be predicted by a range of environmental variables, we performed two different tests, 1) distance-based linear model (DISTLM; McArdle and Anderson, 2001) and 2) multivariate regression tree (MRT) analysis (De’ath, 2002; Ouellette et al., 2012).
A DISTLM was used to partition multivariate variability in fish abundance that is explained by the environmental predictors included in the model (seafloor complexity, depth, mean SST, distance to platform, distance to pipeline, distance to shoal, distance to reef), with the best model visualised via distance-based redundancy analysis (dbRDA; McArdle & Anderson, 2001; Anderson et al., 2008) using the PRIMER-E statistical software package. Seafloor complexity was a categorical variable in the analysis and therefore assigned numerical values with 1 = low, 2 = high and 3 = pipe. Prior to undertaking the DISTLM analysis, a draftsman plot was produced to detect multicollinearity. This resulted in the removal of latitude and longitude from the analysis as each was unsurprisingly correlated with mean SST. The best model was selected using a stepwise procedure in which the relative contribution of each predictor in explaining fish abundance was assessed for 1) statistical significance using marginal tests (from 9999 permutations) and 2) percentage contribution of the variance explained (R2) of each set of variables (Anderson et al., 2008). Adjusted R2 was used as the selection criterion as it considers predictor variables with different numbers of levels.
MRT is a type of constrained clustering that recursively partitions the dataset into homogenous clusters using explanatory environmental variables, is robust to the co-variation in explanatory variables and is well-suited for modelling complex linear and nonlinear relationships (De’ath & Fabricius, 2000; De’ath, 2002). After excluding rare species (those that occurred less than five times in the dataset), fourth root transformed MaxN fish abundance was the response variable in the MRT with all available environmental variables, including the seafloor complexity variables (low, high, pipe), used as predictors. Rare species tend to amplify the importance of rare habitat types and so by removing them we avoided biasing results based on a shared common absence of rare species, instead concentrating specifically on common conditions found throughout the region (Gust et al., 2001).
In each split of the MRT, the machine learning algorithm considered all explanatory variables and selected the variable that maximised the reduction in group heterogeneity. The most parsimonious tree (i.e. the simplest possible tree given the data) was selected using cross-validation and the 1-SE rule (De’ath & Fabricius, 2000). To identify representative species in each community derived from the MRT, Dufrêne-Legendre index (DLI) values were calculated for all species across all leaves of the tree (Dufrene and Legendre, 1997). Each species was assigned to the terminal node (leaf) of the tree where its DLI value was highest. Species with the highest DLI values are considered representative of that assemblage, and the spatial extent of the assemblage indicated the region where the species was predominantly found (DeVantier et al., 2006). This analysis was performed in R statistical software (R Core Team, 2019), using the packages mvpart (De’ath, 2011), vegan (Oksanen et al., 2013) and labdsv (Roberts & Roberts, 2016).
To make a broad comparison of alpha diversity (i.e., species richness) between fish communities on pipelines and those observed in natural habitats, individual BRUV deployments were grouped by habitat type (low/high complexity seafloor and pipeline). We derived species rarefaction and extrapolation sampling curves for the observed species richness in each habitat type using iNEXT package in R (Hsieh et al., 2016). The species richness was calculated based on observed cumulative number of individuals and unique species for the three habitat types. This approach allowed for an unbiased comparison of species richness across assemblages irrespective of sample size or sampling effort (Colwell et al., 2012; Chao et al., 2014).
The 1546 BRUV deployments detected a total of 90,435 individual fishes from 450 taxa spanning 56 families. The most ubiquitous taxa across the region were Nemipterus spp. (threadfin bream; present on 37% of BRUV deployments), Abalistes stellatus (starry triggerfish; 28% of BRUVs), Carangoides coeruleopinnatus (onion trevally; 27%), Lethrinus rubrioperculatus (spotcheek emperor; 27%) and Sufflamen fraenatum (bridled triggerfish; 25%) (Supplementary Data Table S2). The most numerically abundant fishes were Parupeneus heptacanthus (opalescent goatfish; n = 5253), Nemipterus spp. (n = 3015), Scarus dimidiatus (bluebridled parrotfish; n = 2712), Pomacentrus nagasakiensis (blue-scribble damsel; n = 2598), Caranx sexfasciatus (bigeye trevally; n = 2315) and Lutjanus fulviflamma (blackspot snapper; n = 2083) (Supplementary Data Table S2). The most abundant and commonly observed feeding guild of fishes was generalist carnivores (n = 30,238 individuals on 99% BRUVs) followed by invertebrate carnivores (n = 24,754 on 80% BRUVs). While zooplanktivores were the next most abundant (n = 23,053 on 40% BRUVs), piscivores were the third most ubiquitous feeding guild across the samples (n = 2329 on 51% of BRUVs) (Supplementary Data Table S2).
Mean abundance of specific feeding guilds varied significantly among seafloor complexity categories (PERMANOVA: MS = 4734.9, Pseudo-F = 9.85, P(perm) = 0.0001), but not for zooplanktivores, invertebrate carnivores, and generalist carnivores (P(pairwise) = 0.12, 0.85, 0.35, respectively). The mean abundance of piscivores differed between all seafloor complexities (all t > 2.4, all P(pairwise) < 0.02), largely due to being most abundant on pipelines and least abundant on low complexity seafloor (Figure 2). Piscivores (see Supplementary Data Table S2) typically included large-bodied taxa such as sharks, barracuda, groupers, and tuna. The abundance of algae/invertebrate consumers was greater on high complexity seafloor than low complexity (t = 2.46, P(pairwise) = 0.016) (Figure 2). Herbivore abundance was similar on low and high complexity seafloor (P(pairwise)= 0.95) but higher on pipelines (both t > 3.9, P(pairwise) < 0.001) with this group represented by many parrotfish and surgeonfish species.
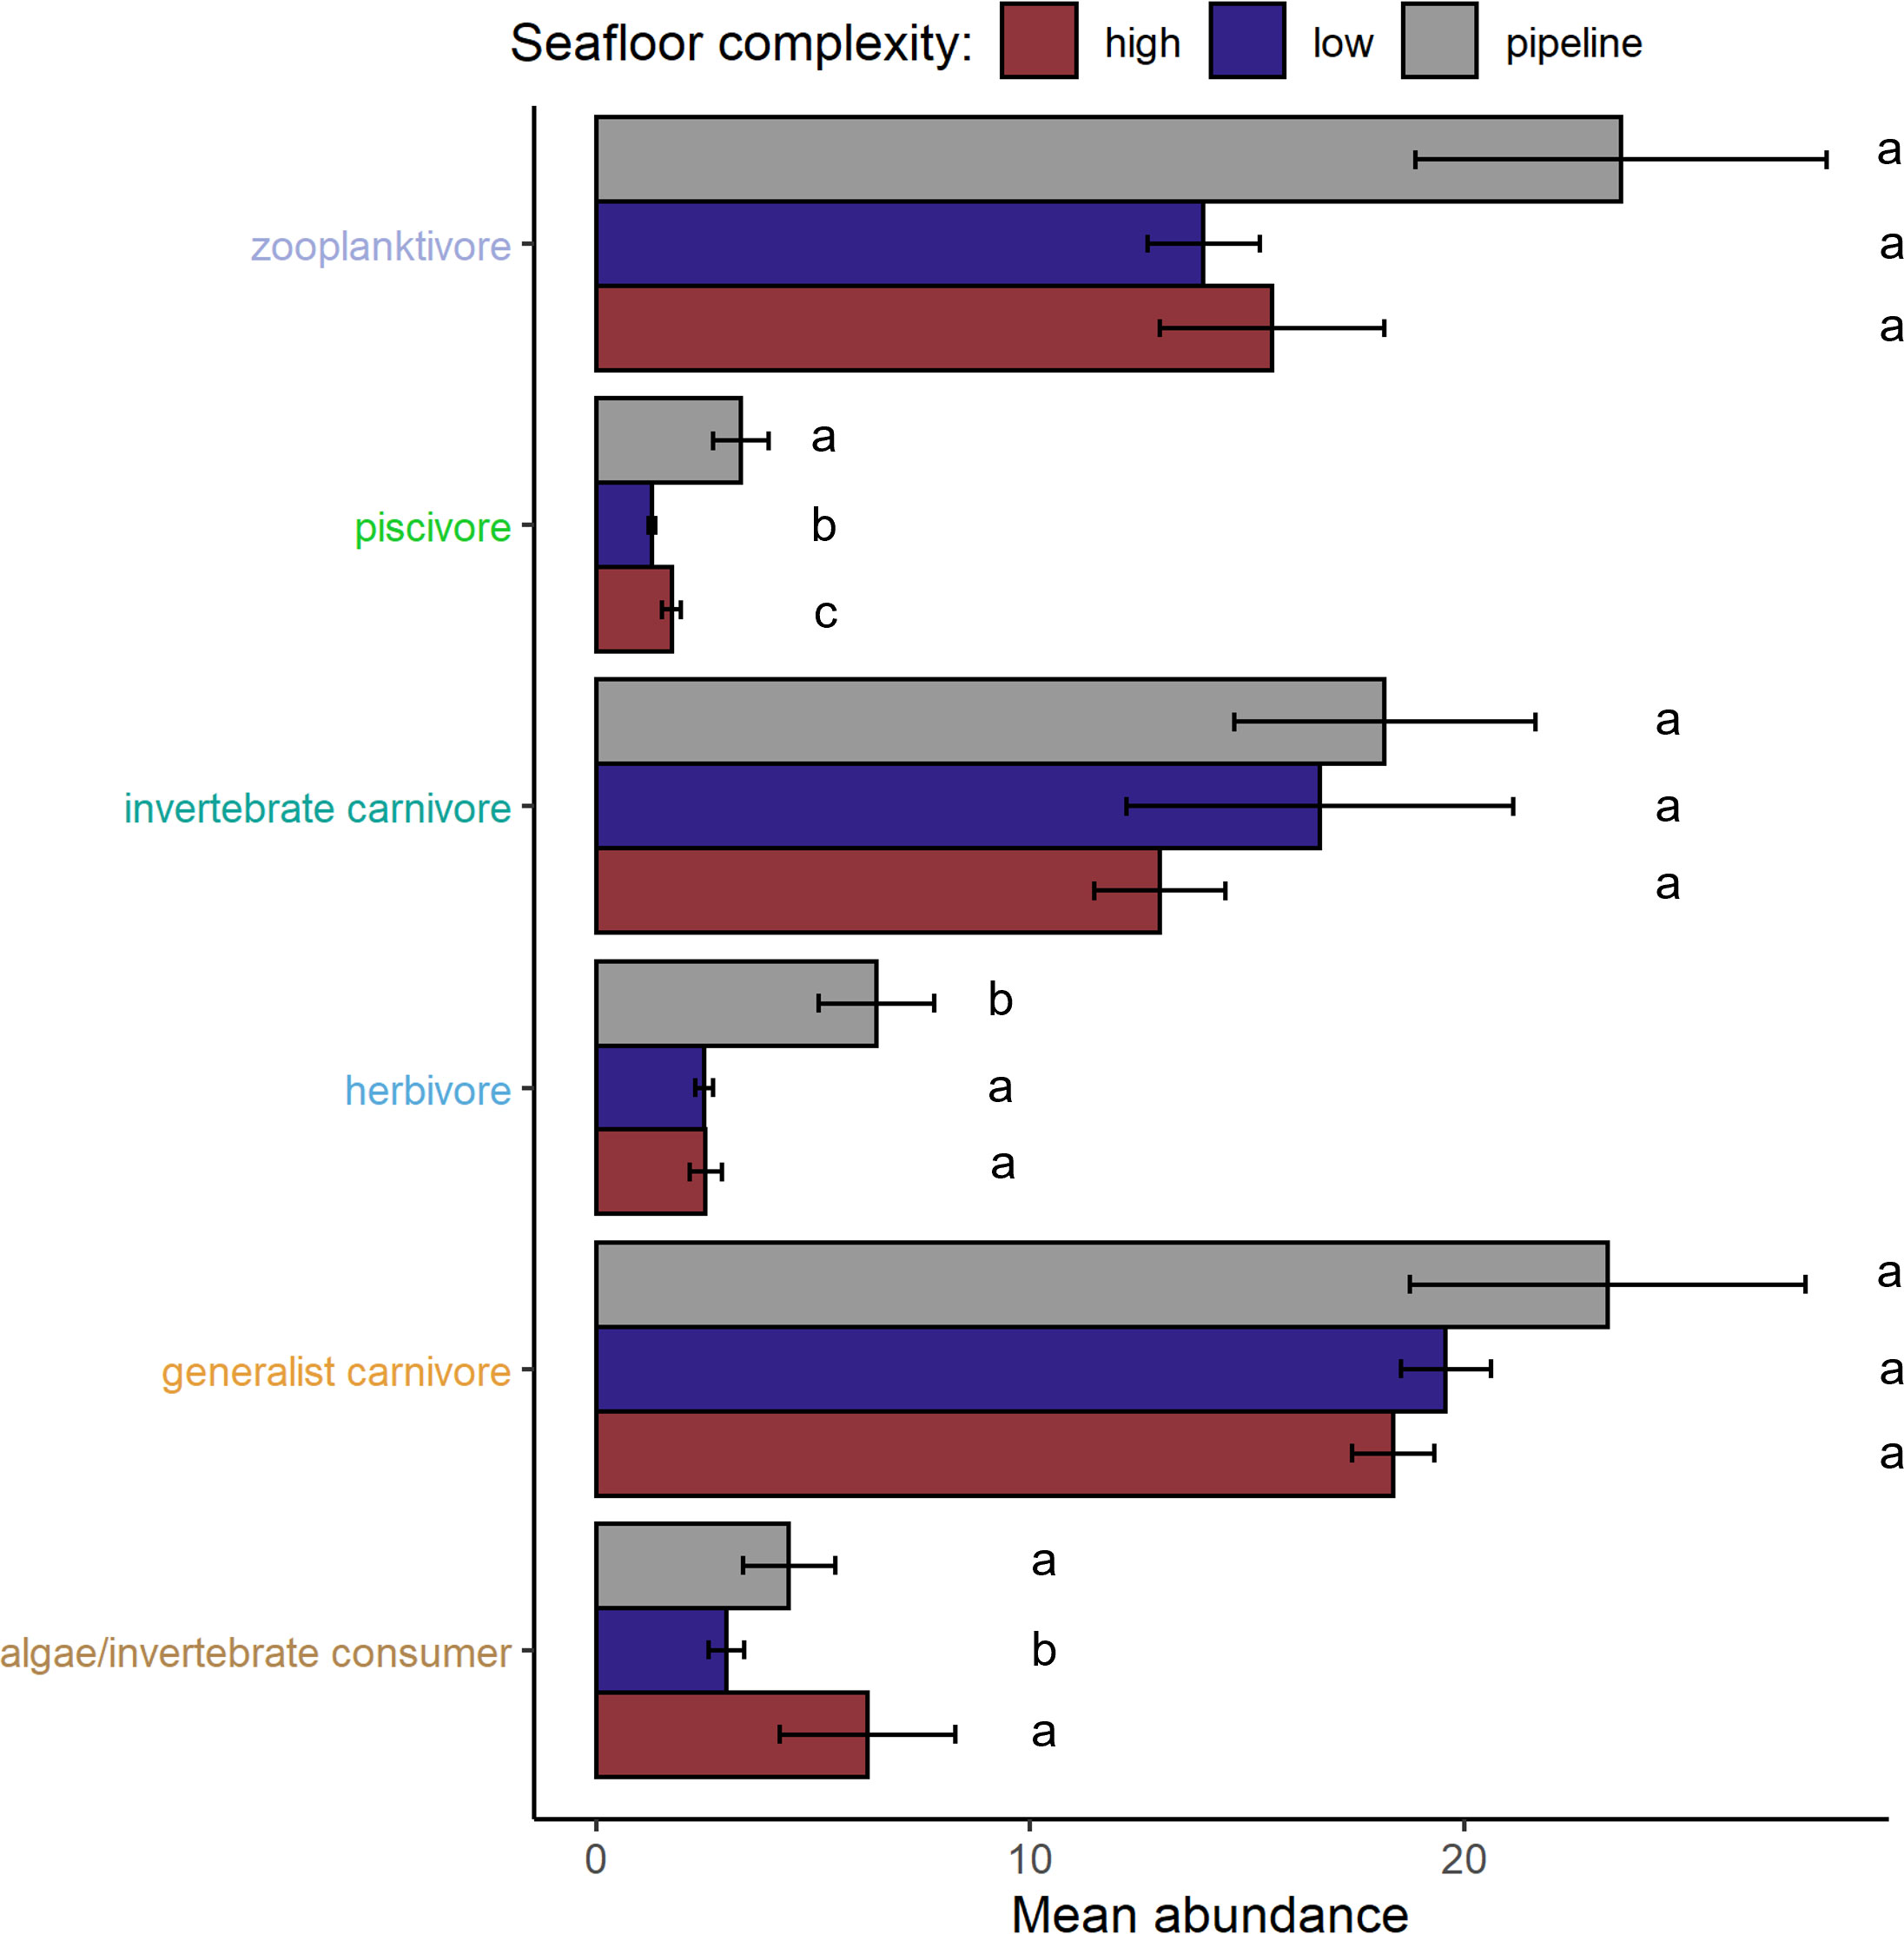
Figure 2 Mean (± SE) abundance fish per BRUV deployment for fish six feeding guilds represented on the vertical axis and between seafloor complexities: pipelines, low complexity natural habitat and high complexity natural habitat. Statistically similar means are indicated by the same letter (e.g., a/b/c).
Marginal tests from DISTLM suggested a significant relationship between the variation in fish assemblages (all p < 0.01) and all the potential environmental predictors. Depth explained the greatest amount of variation in fish abundance (5%). The variables that increased the value of adjusted R2 after depth were distance to shoal (3%, 8% cumulative), mean SST (2%, 10% cumulative), distance to pipeline (2%, 11.9% cumulative), distance to platform (1%, 13% cumulative), distance to reef (0.8%, 13.8% cumulative) and then seafloor complexity (0.7%, 14.6% cumulative). All conditional tests associated with these sequential additions were significant (p < 0.01). The best solution in the stepwise model included all seven variables and explained 14% of the variation in fish relative abundance (Figure 3). The first two dbRDA axes captured ~63.5% of the variability in the fitted model (primarily along axis 1 - horizontal) and 9.2% of total variation in the data (Figure 3). The dbRDA plot clearly illustrates separation in fish assemblages across the sampling region (north = offshore Broome, Darwin; south = Pilbara, Dampier; Figure 1), reflecting these relationships with depth, distance to shoals, mean SST and other factors, with patterns across the different habitats (structural complexity of seafloor) less clear.
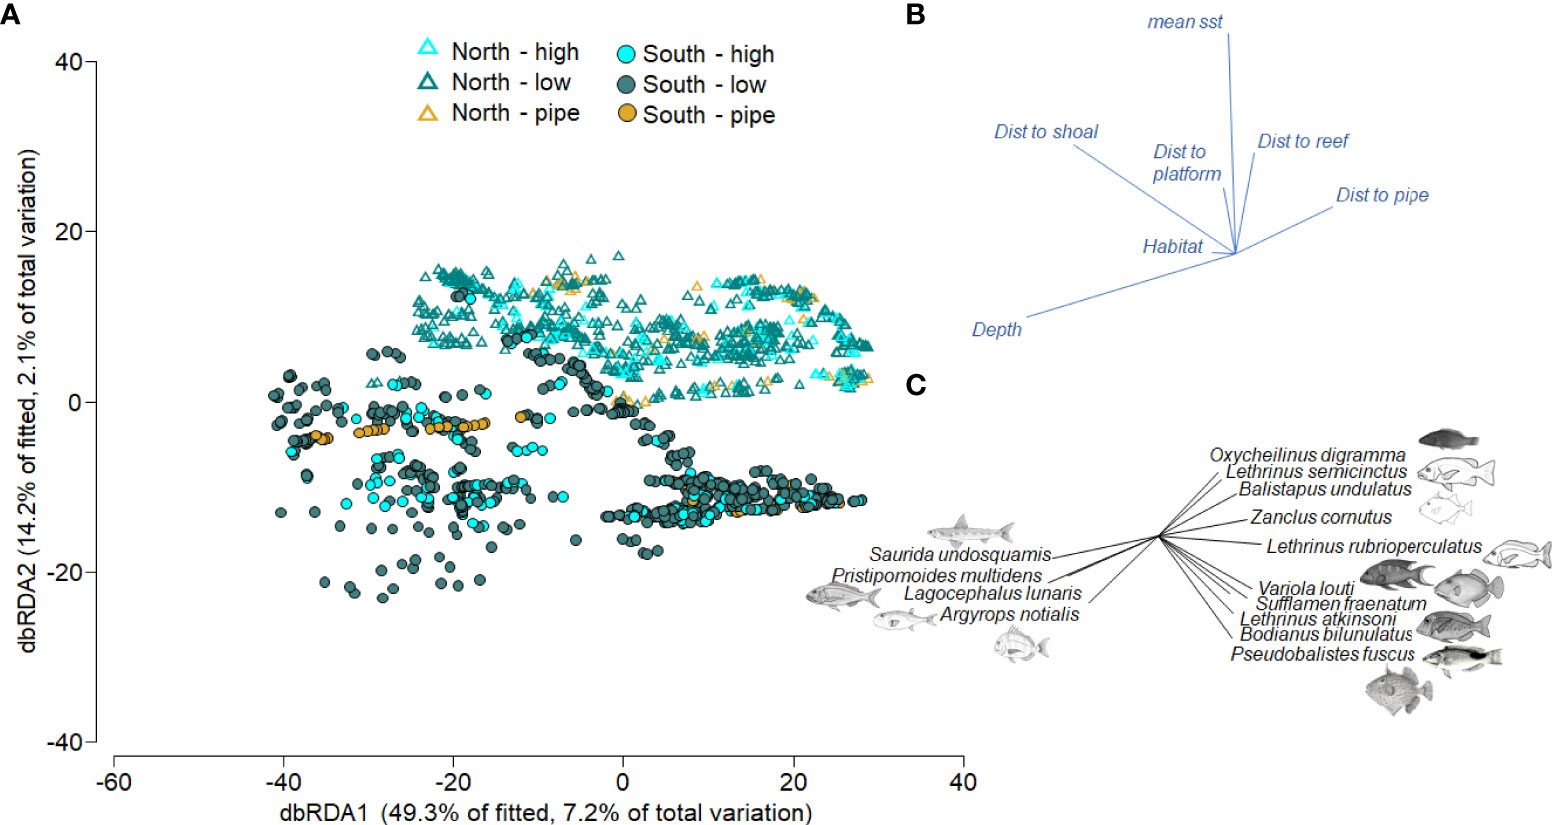
Figure 3 (A) dbRDA ordination plot displaying relationships between predictor variables and fish relative abundance data (MaxN of all species). Colours represent seafloor complexity (low & high refer to seafloor complexity; pipe = pipeline) while symbols represent regions along the coast of NW Australia (south = Pilbara and Dampier, north = Broome and Darwin). (B) Vectors indicate the direction of the relationship, and their length indicates the strength of their effect on fish abundance. (C) Fish species with Pearson correlations of |R| ≥ 0.30 to either axis are overlaid with vectors in the bottom right indicating the strength and direction of this association, i.e. how these fish species correlate with seafloor complexity categories and regions and predictor variables.
Fish communities in the southern end of the sampling region were distinct from those in the north, but there was little distinction between fish communities according to seafloor complexity (Figure 3A). The spread of data in the DISTLM plot suggests the fish community is more variable on low and high seafloor complexities and more uniform on pipelines. A number of sand-affiliated taxa were associated with deep BRUV deployments, including Saurida undosquamis (largescale saury), Lagocephalus lunaris (rough golden toadfish), Argyrops notialis (Australian soldierbream) and an important fishery species Pristipomoides multidens (goldband snapper; Figures 3B, C). A range of fish taxa were most abundant in shallow depths including Oxychelinus digramma (violetline Maori wrasse), Lethrinus semisinctus (blackspot emperor) and Balistapus undulatus (orangestripe triggerfish). Also abundant in the shallows but close to shoals and pipelines were several triggerfish (S. fraenatum, Pseudobalistes fuscus) and some fishery target generalist/invertebrate carnivores (Variola louti, L. rubrioperculatus, Lethrinus atkinsoni), in addition to triggerfish (P. fuscus, S. fraenatum) and the pigfish Bodianus bilunulatus (Figures 3B, C).
The MRT explained approximately 13% of the variation in fish abundance data with the most parsimonious community structure defined by five terminal nodes (where membership to each group is as ‘pure’ as possible given the data variation) and constrained by three environmental predictors with distance to shoal and depth as primary predictors (Figure 4). The primary split in the MRT separated fish communities far from shoals (≥11.6 km) from those located closer to shoals. Subsequently, the fish community was split by depth with a terminal node identifying a shallow-water assemblage (depth <18.7 m) and mesophotic assemblage (depth ≥ 18.7 m). The shallow water assemblage occurred primarily offshore of Onslow in the southern Pilbara with a small number of sites west of Tiwi Islands attributed to this assemblage (Figures 5A–C). This assemblage included many invertebrate and generalist carnivore taxa, dominated by indicator taxa within the families Labridae (wrasses, tuskfish), Nemipteridae (monocle breams, threadfin bream) and Lethrinidae (emperors) (Table 2). It was characterised by the second lowest proportion of BRUV deployments (6.7%) but had the third highest proportion of indicator taxa (15.5% of DLI taxa).
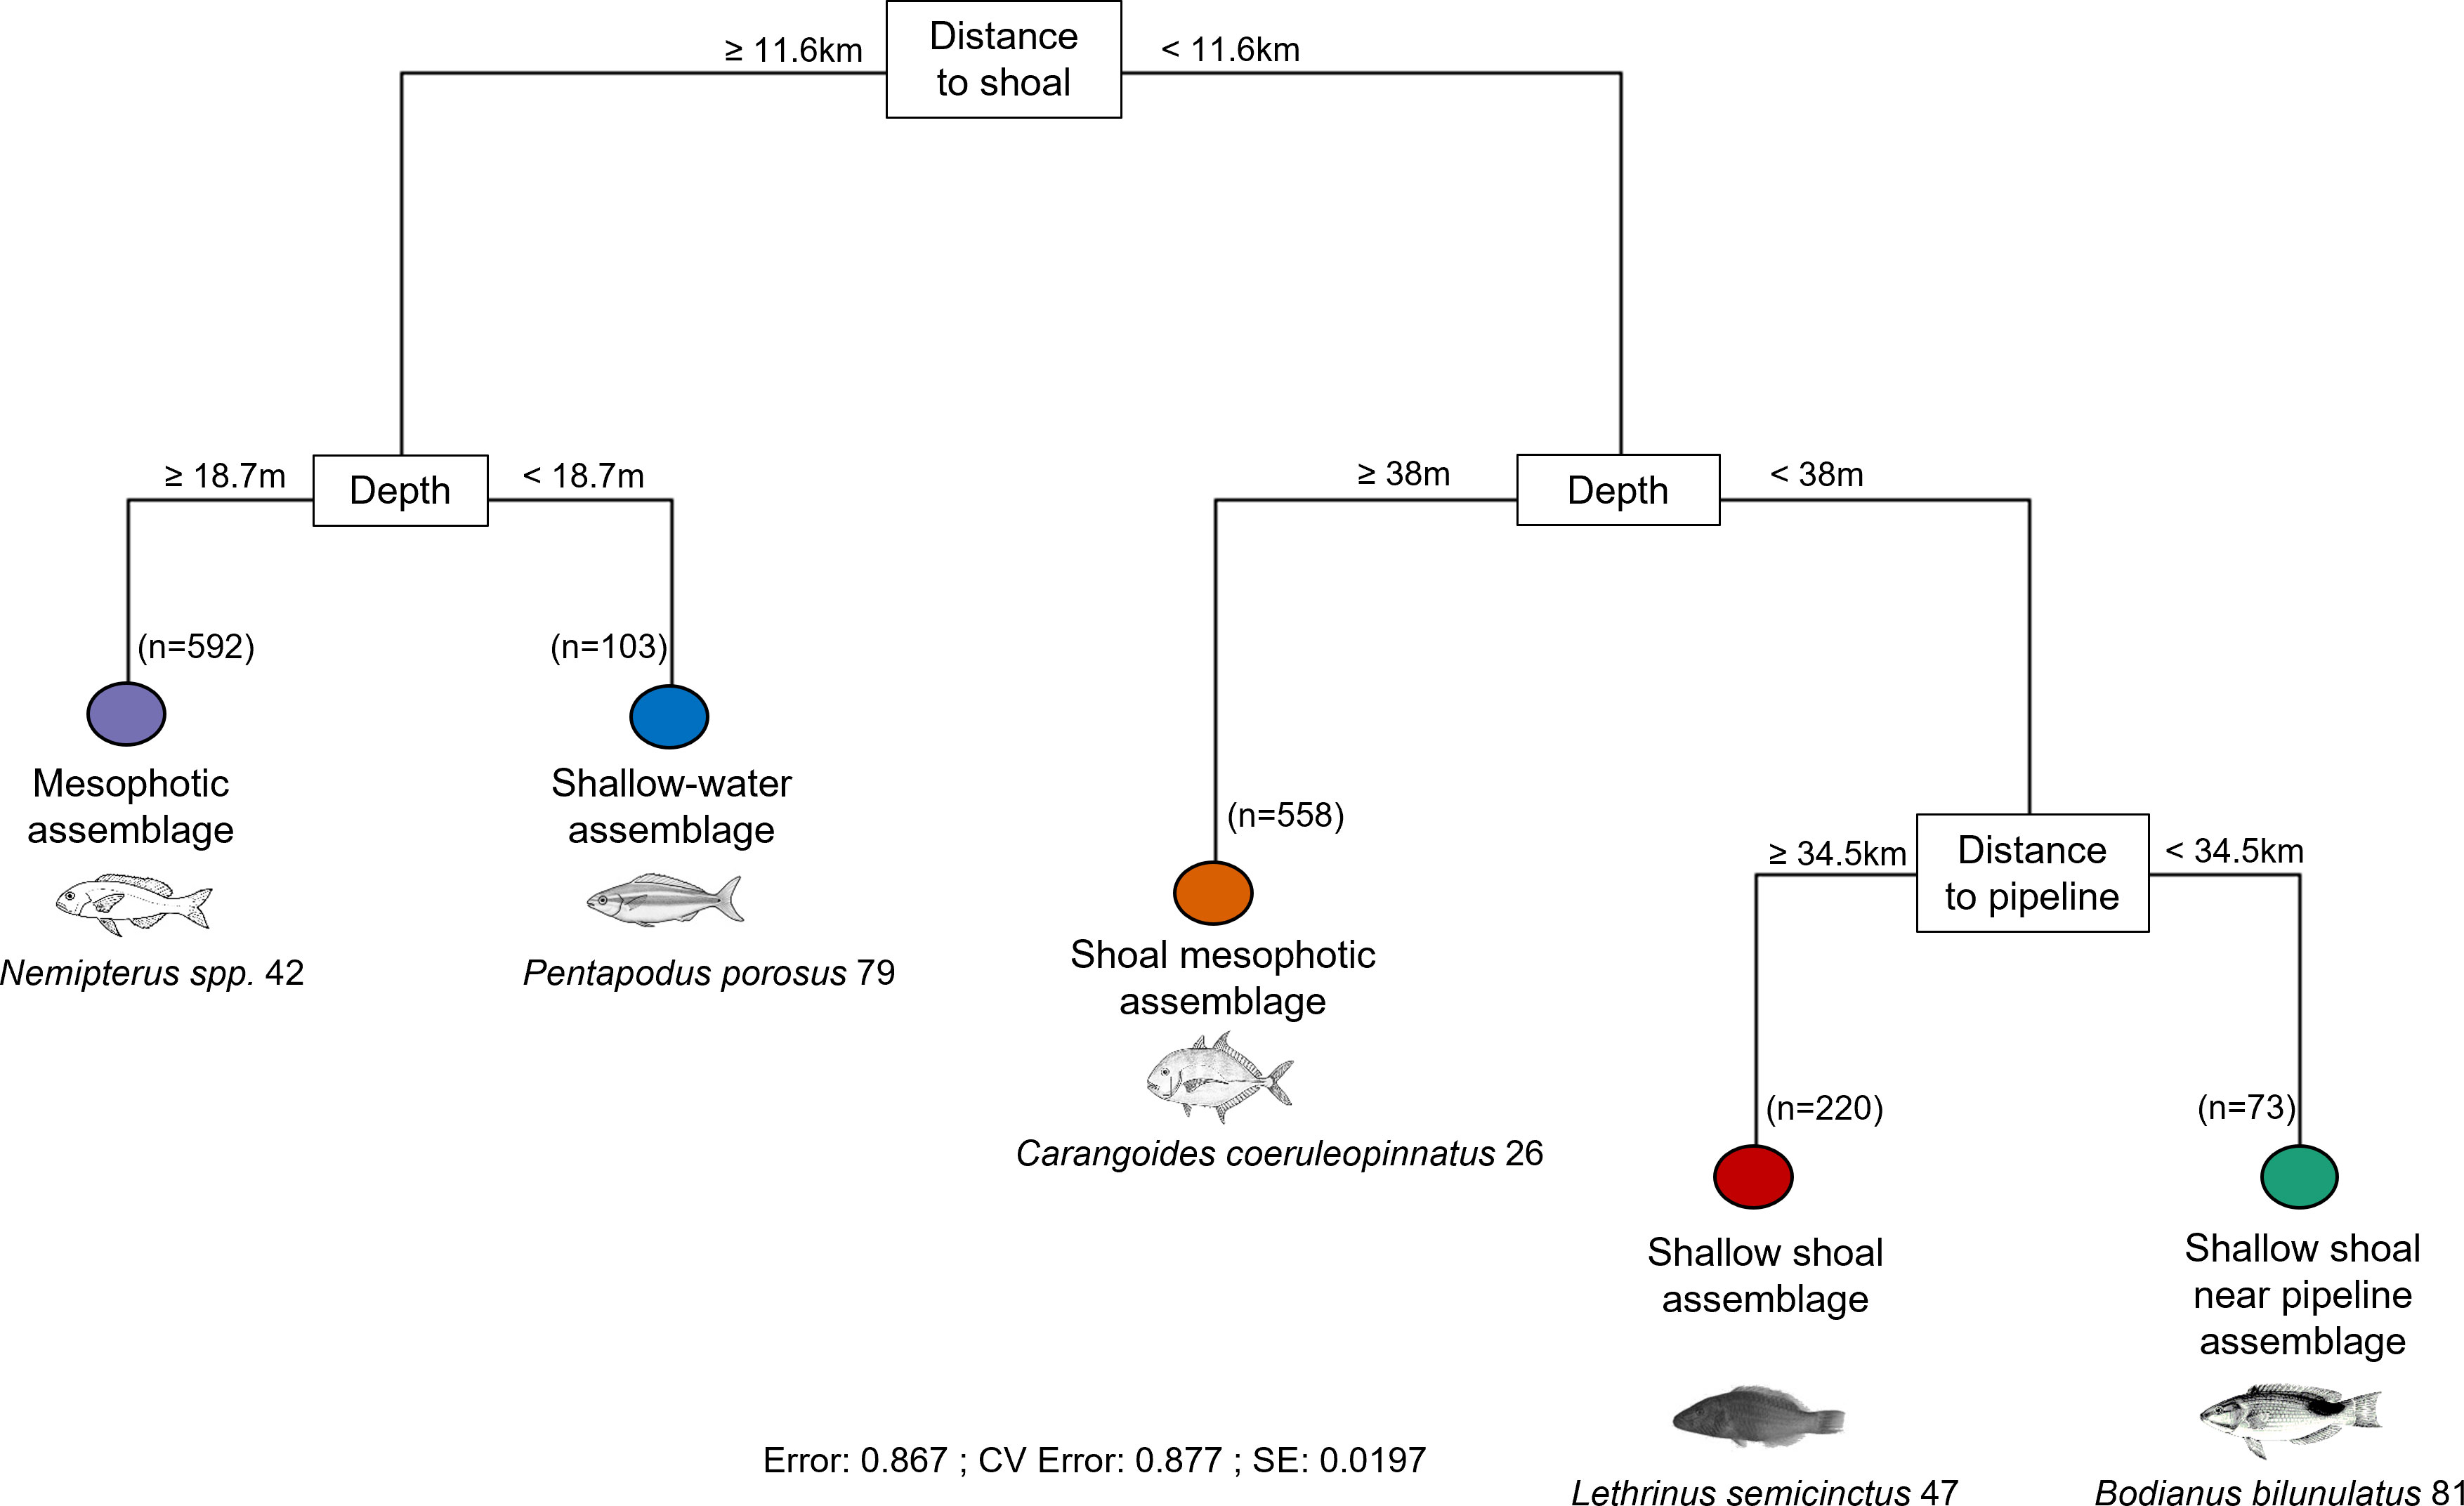
Figure 4 Pruned (1 SE) multivariate regression tree (MRT) defining assemblage composition of demersal fishes (n=1546 BRUV deployments) on the NW Shelf constrained by environmental predictors. The terminal nodes identified five distinct assemblages (see Table 2) with breaks labelled with the environmental predictor that best split the data into the most homogenous groups possible and the value of each predictor that best distinguished them. The number of BRUV deployments within each terminal node is also indicated (n). Top indicator taxa with highest values of Dufrene-Legendre index (DLI) are shown for each terminal node.
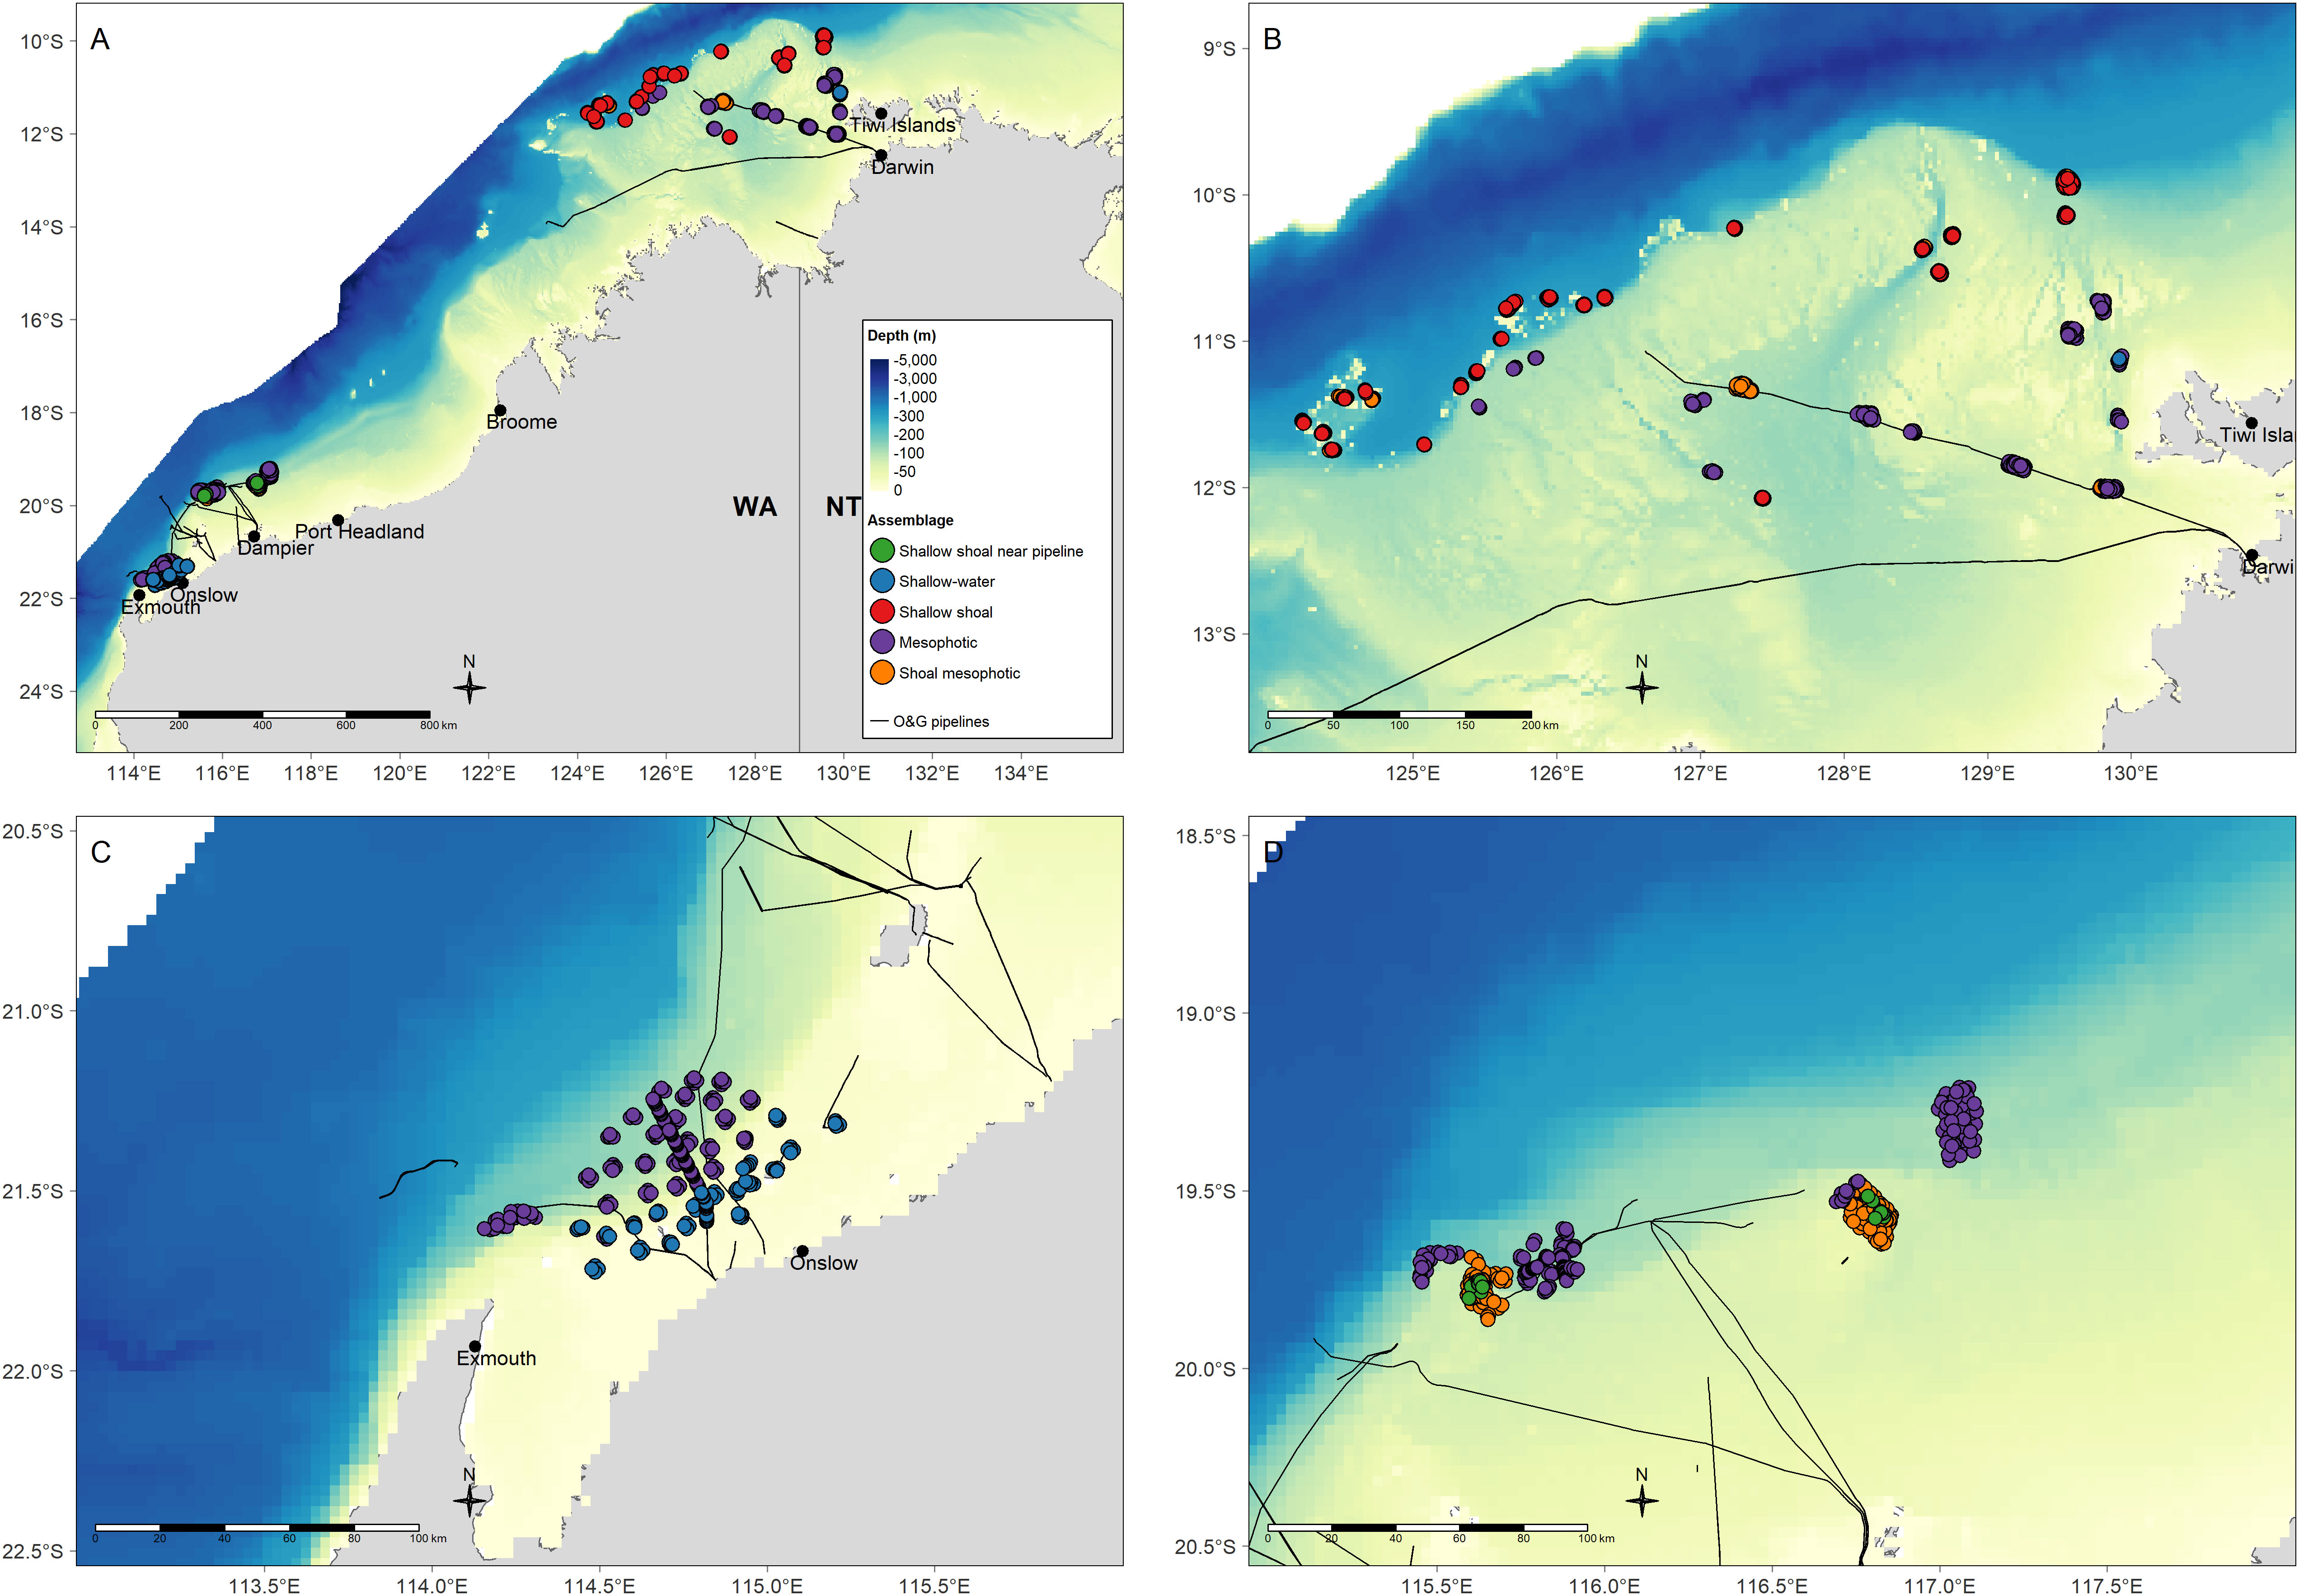
Figure 5 Spatial distribution of five fish assemblages obtained from the MRT analysis of BRUVs data from three pipelines and historical AIMS surveys in NW Australia. (A) A regional setting of the NW Australia with the five assemblages mapped. (B) The northern part of the study region west of Tiwi Islands and offshore from Darwin. (C) The southern part of the study region, southern Pilbara offshore from Onslow and north of Exmouth. (D) The southern part of the study region, mid-coast Pilbara and offshore from Dampier.
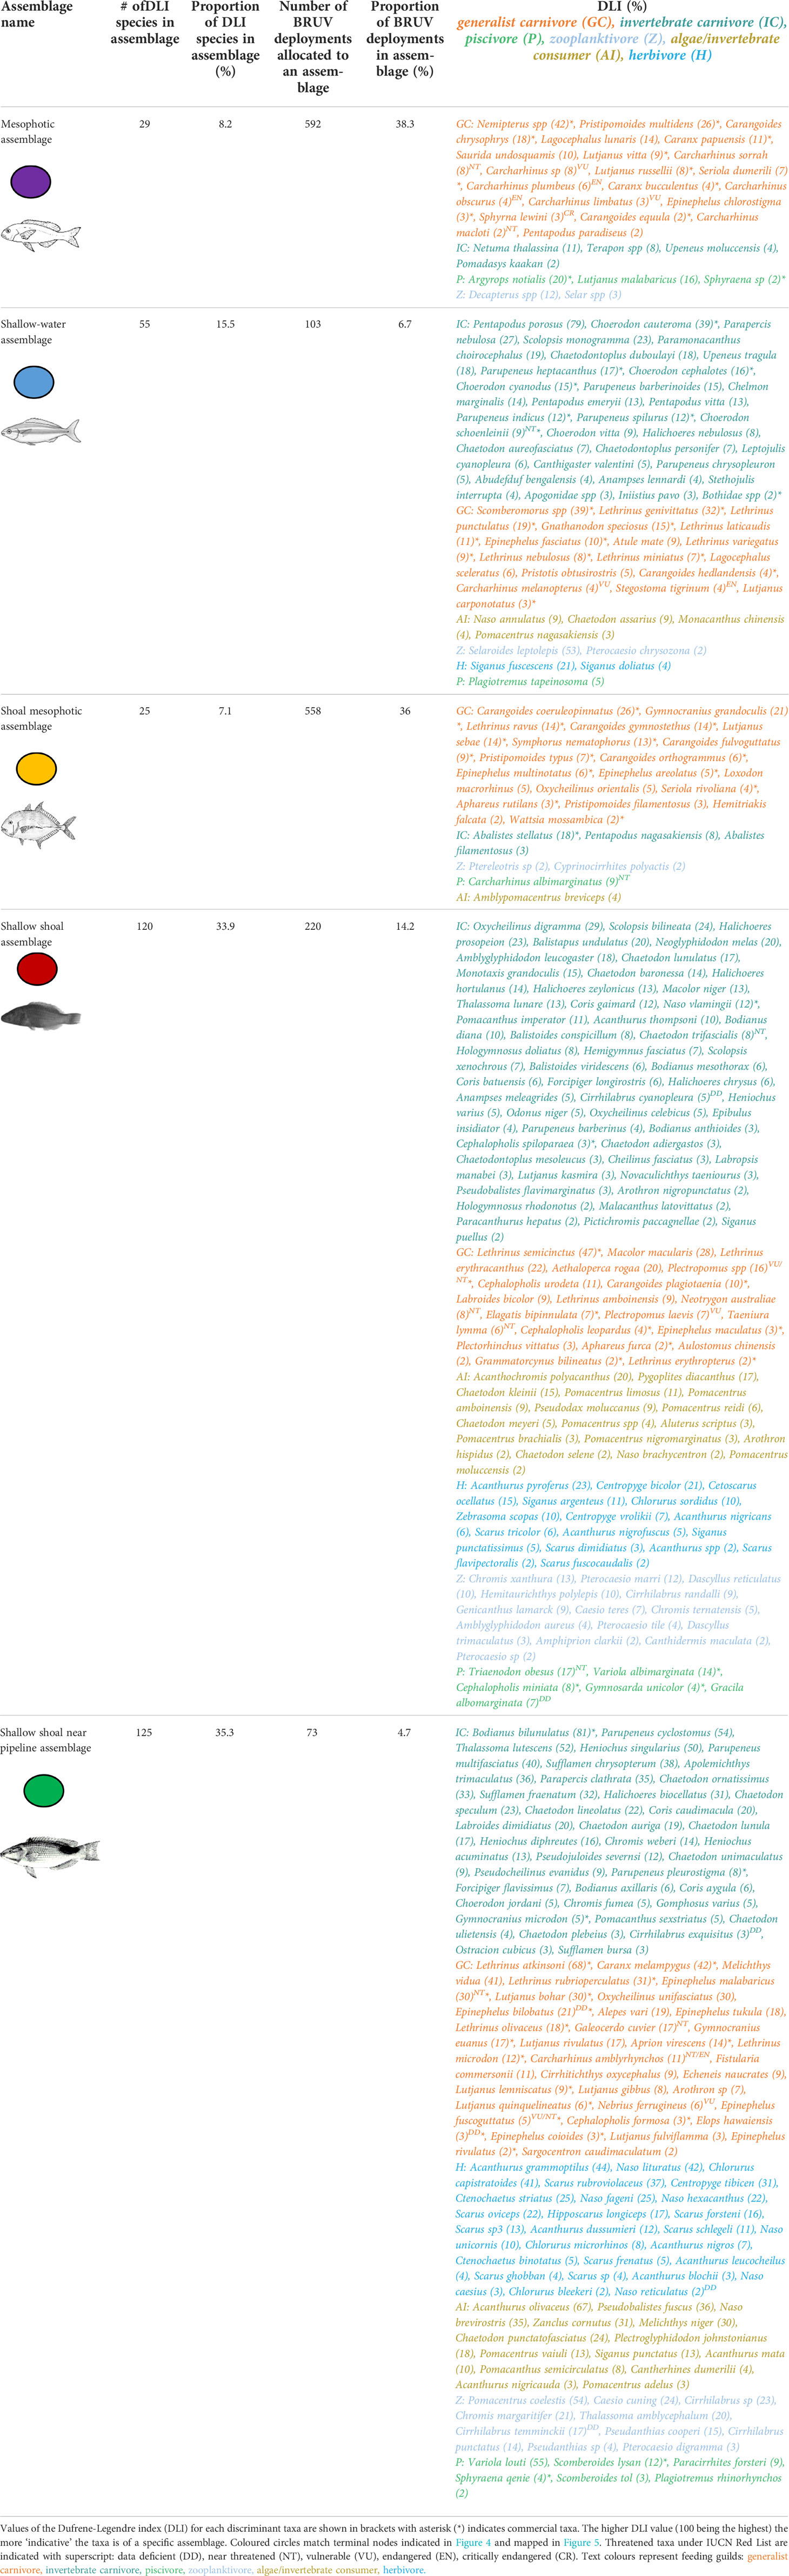
Table 2 Summary of indicator taxa in the five fish assemblages of the multivariate regression tree (MRT; Figure 4).
The mesophotic fish assemblage (Figure 4) occurred both in the southern (offshore Pilbara; Figures 5A, C, D) and the northern (west of Tiwi Islands and offshore from Darwin; Figures 5A, B) parts of the NW region. This assemblage was characterised by the highest proportion of BRUV deployments (n = 592 or 38.3%) and second lowest proportion of indicator taxa (8.2%) with a majority of high DLI taxa being generalist carnivore taxa from the ubiquitous Nemipteridae and Carcharhinidae (requiem sharks) families (Table 2). This assemblage also had a high proportion of taxa listed on the IUCN threatened species list (IUCN, 2021), especially sharks from the genus Carcharhinus and critically endangered scalloped hammerhead shark (Sphyrna lewini).
The near-shoal branch of the MRT was further split by depth (≥38 m) with a terminal node identifying a shoal mesophotic assemblage (Figure 4). This assemblage occurred in the northern part of the study region (Figures 5A, B, D) and was also prominent offshore from Dampier (Figures 5A, D). It was characterised by the second highest proportion of BRUV deployments (36%) yet lowest proportion of indicator taxa (7.1%) which were primarily commercially targeted generalist carnivores from Carangidae (jacks) and Lethrinidae (emperors) families (Table 2).
The shallow, near-shoal branch was further split by distance to pipeline with one terminal node at the shallow shoal assemblage (distance to pipeline ≥34.5 km) and another at the shallow shoal near pipeline assemblage (distance to pipeline <34.5 km; Figure 4). The shallow shoal assemblage was only characteristic of shoals offshore from Darwin (Figures 5A, B) and was characterised by the third lowest proportion of BRUV deployments (14.2%) and second highest proportion of DLI taxa (33.9%; Table 2). It was primarily dominated by invertebrate carnivore taxa from Labridae (wrasses) family with relatively low DLI values (≤47) for all indicator taxa in this assemblage. It had several near threatened and vulnerable taxa from the IUCN Red List particularly from Dasyatidae family (stingrays) and Plectropomus species (coral trout; Table 2). The shallow shoal near pipeline assemblage only occurred offshore from Dampier (Figures 5A, D). This assemblage was characterised by the lowest proportion of BRUV deployments (4.7%) yet the highest proportion of DLI taxa (35.3%; Table 2). The indicator taxa were roughly equally split between invertebrate carnivores e.g., Labridae and Chaetodontidae families, and generalist carnivores e.g., Lethrinidae family, followed by roughly equal numbers of herbivores and algae/invertebrate consumers (Table 2). In addition, it had several taxa from the IUCN Red List including two commercially targeted Epinephelus (grouper) species and two members of Carcharhinidae family (Table 2).
Individual-based and sample-based rarefaction curves and associated confidence bands made for the three types of seafloor complexity indicated that taxonomic richness on the pipelines was substantially lower than in both types of natural habitat (Figure 6). The three curves overlapped at lower cumulative abundance of individuals (< 150 individuals) then diverged with the curve for pipelines reaching asymptote approximately around 300 taxa whereas the other two curves and their 95% confidence bands remained closely overlapping and did not reach asymptote (Figure 6A).
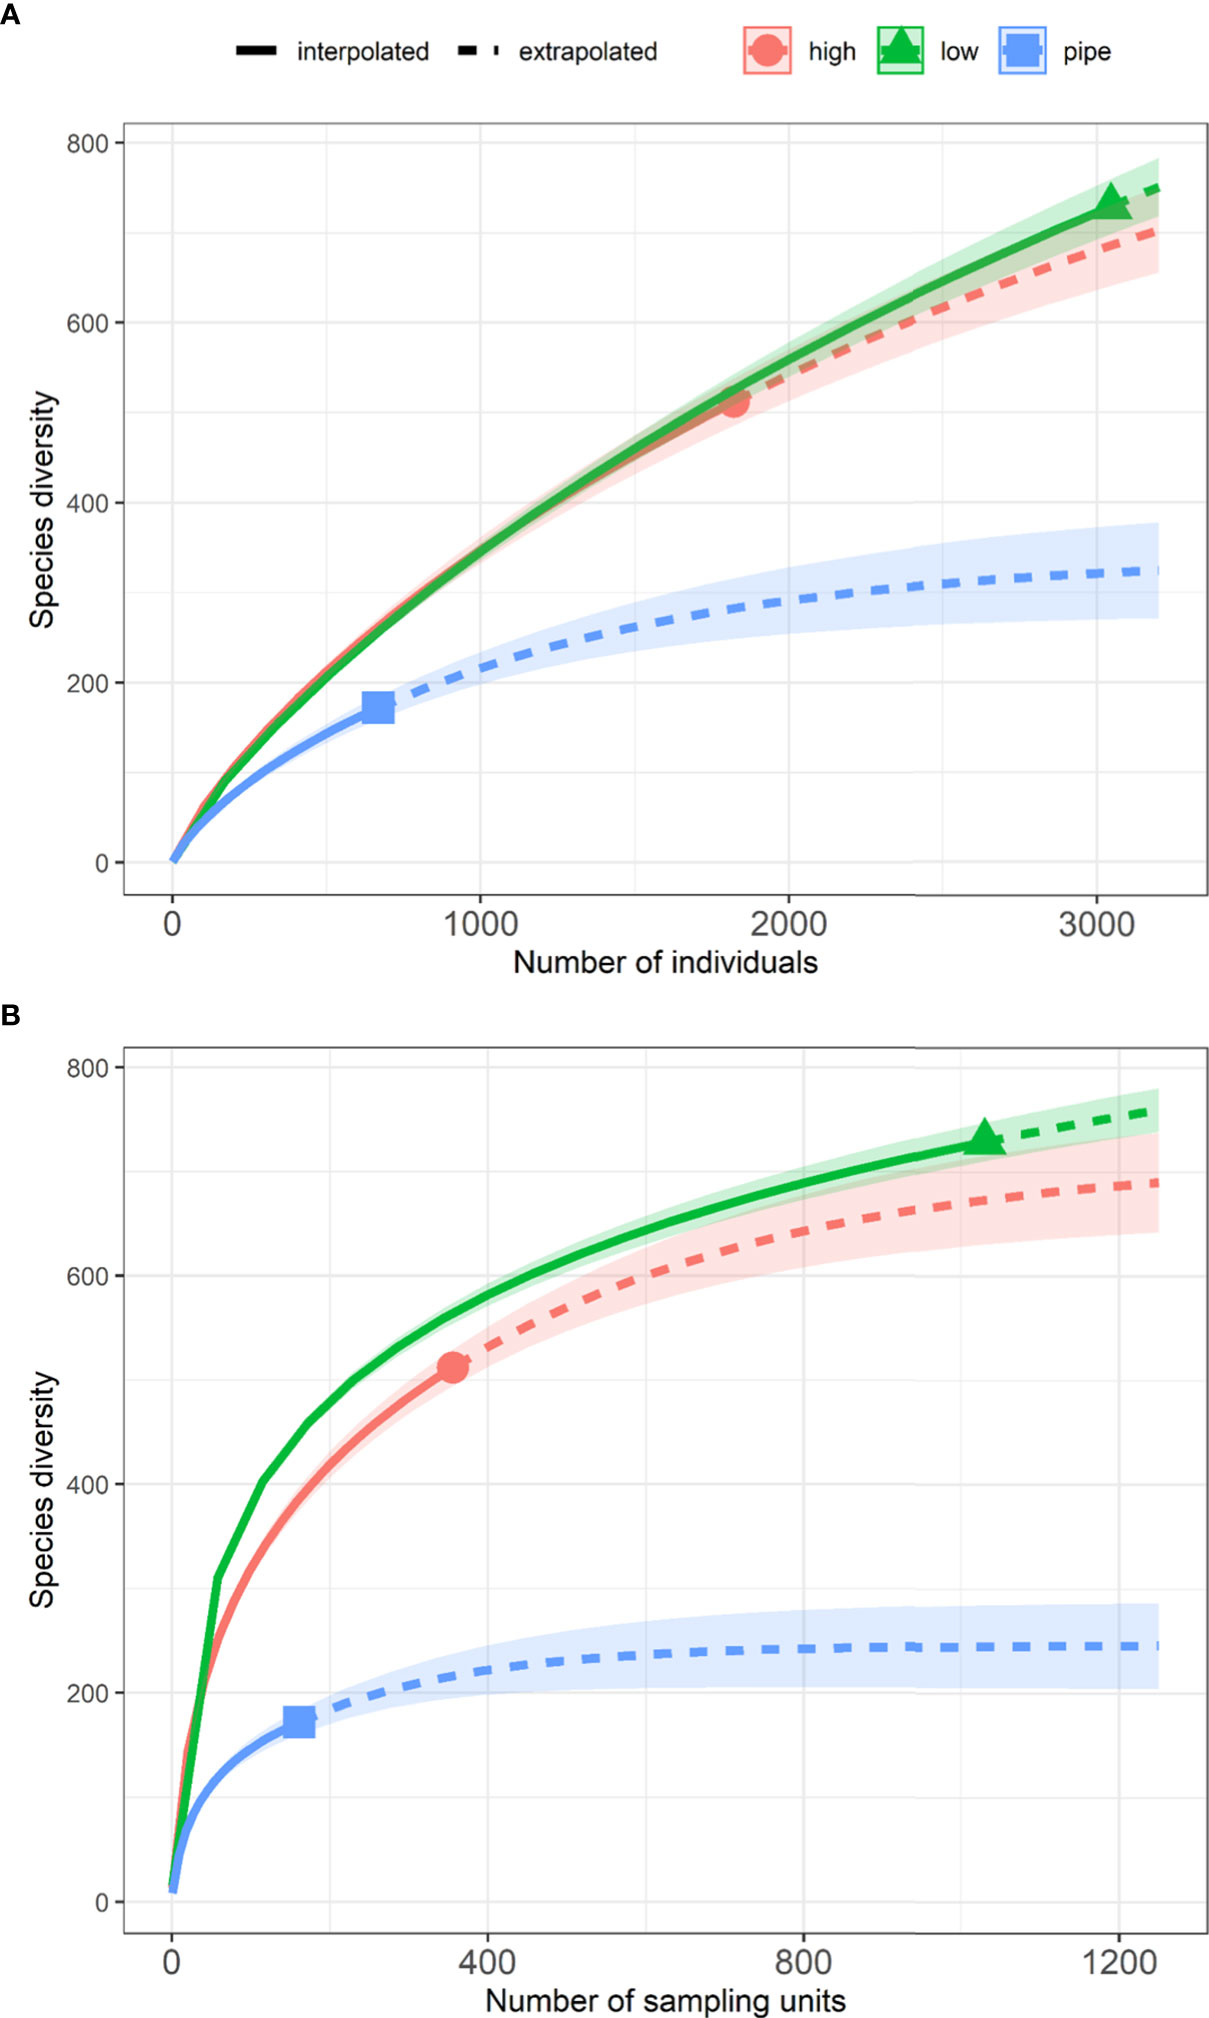
Figure 6 (A) Individual-based and (B) Sample-size-based rarefaction (solid lines) and extrapolation (dotted lines) sampling curves with 95% confidence intervals (shaded areas) for the species diversity (number of taxa) data across three seafloor complexities: pipelines, low complexity natural habitat and high complexity natural habitat. Solid line indicates the rarefied curve, dashed line indicates the extrapolated curve, symbol indicates the observed taxonomic richness, the shaded area indicates the 95% confidence interval.
Similarly, the sample-size based curves grew quickly at initial parts and overlapped at small sample sizes (< 50 BRUV sites) but quickly diverged afterwards with the pipeline-associated curve reaching asymptote at approximately 250 taxa. Fish taxonomic richness on low and high seafloor complexity diverge with increased sampling effort with both curves approaching asymptote at maximum number of samples. Overall, the curves for low and high seafloor complexity and their confidence bands mostly overlapped with increased sampling effort indicating that the taxonomic richness were roughly similar (Figure 6B).
Our regional study spanned almost 2000 km of coastline to demonstrate overarching influences from oceanic shoal environments (presented as distance to shoals in our study) and depth on the composition of demersal fish assemblages across the NW region, with O&G infrastructure playing a relatively minor role in explaining the observed regional patterns in fish assemblage composition. The diversity of fishes on pipelines (in terms of taxonomic richness) was substantially lower in comparison to the diversity observed on natural habitats (both low and high seafloor complexity). The abundance of most fish feeding guilds was equal across natural and artificial habitats, except for piscivore and herbivore taxa that were more abundant on pipelines.
Submerged oceanic banks and shoals of the NW region are known hotspots of fish diversity where fish abundance and richness can exceed those recorded on similar features of the Great Barrier Reef (Nichol et al., 2013; Heyward et al., 2017; Moore et al., 2017; Heyward & Radford, 2019). Proximity to these features was the primary split in the MRT analysis, followed by depth, with strong alignment in patterns observed by the MRT with DISTLM analyses. Depth is often among the most common predictors of fish distributions (Moore et al., 2009; Monk et al., 2010; Galaiduk et al., 2017b), assemblage composition (Cappo et al., 2007; Moore et al., 2010; Harvey et al., 2013) and fish species richness (Young & Carr, 2015; McLean et al., 2021; Currey-Randall et al., 2021). Proximity to infrastructure, such as platform jackets and/or pipelines, featured in both statistical analyses but were ranked low as predictors each explaining <2% of variation in the fish abundance data in both instances. This suggests that while infrastructure can have a strong influence on fish assemblage composition at a local scale (i.e. Bond et al., 2018a; Bond et al., 2018b; McLean et al., 2021; Schramm et al., 2021), the influence of natural features (e.g., oceanic shoals) and broader scale environmental gradients (e.g., depth) are stronger factors at a regional scale.
This study represents the first quantitative bioregional scale analysis that includes O&G infrastructure among a set of environmental predictors commonly found to be important in explaining fish diversity and distributions (Pittman et al., 2007; Pittman et al., 2009; Chatfield et al., 2010; Costa et al., 2014; Galaiduk et al., 2017a; Moore et al., 2017). The relatively low explanatory performance of the MRT and DISTLM models is expected, given the high alpha diversity (taxonomic richness; 450 taxa) of the BRUV abundance data and vast span of the study area. It is likely that key variables (such as oceanographic covariates e.g., chlorophyll concentration or wave exposure) that could improve the explanatory performance and ecological realism of these analyses (Elith and Leathwick, 2009) are missing. Inclusion of additional data such as substrate type, could also provide further insights, but would require re-examination of imagery from >1500 BRUV deployments and was beyond the scope of this study. Further, processes affecting fish population size and dynamics (e.g., competition, predation) and behaviour (e.g., attraction to O&G infrastructure to access encrusting invertebrates as a food source) are likely to have a significant influence on fish abundance and distribution, yet such population processes and behaviours require dedicated research programs to indicate their relative strength for different taxa, data which is not yet available for this region. Regardless, the results here align with previous bioregional studies on fish communities that demonstrated strong regional trends and varying scales of influence of environmental predictors (Travers et al., 2010; Galaiduk et al., 2017a; Wellington et al., 2021).
Both mesophotic fish assemblages were characterised by fishes associating with sand and hard substrata, with almost 75% of all BRUV deployments attributed to these two assemblages. This highlighting the presence of mixed habitat communities within these depths (Currey-Randall et al., 2019; Currey-Randall et al., 2021). Indeed, an assemblage characterised by Synodontidae (lizardfish), Tetraodontidae (toadfish) and Nemipteridae (threadfin bream) is typical of those ecosystems dominated by sand including those observed in impacted areas (historically trawled; Sainsbury et al., 1997; Travers et al., 2012). An indicator species for monitoring and assessment for the commercial fishery in the region and also for the mesophotic assemblage identified here was Pristipomoides multidens (goldband snapper), a vagile species (able to disperse widely) known to associate with hard bottom areas in depths of 60 to at least 180 m (Ovenden et al., 2002; Ovenden et al., 2004). Both mesophotic assemblages were characterised by a higher number of vagile taxa such as Carangidae (trevallies) and Carcharhinidae (whaler shark) species which were indicated by the relatively low DLI values of indicator taxa in those assemblages (Table 2). The association of trevallies and whaler species with mesophotic depths supports previous research findings in Australia for these typically wide-ranging species (e.g. Stevens and Wiley, 1986; Harry et al., 2019). Cosmopolitan distributions, conservative life-histories, and susceptibility to overfishing are primarily reasons that most of the indicator shark species surveyed in this study are found on the threatened species list (McAuley et al., 2007; Dulvy et al., 2014; Geraghty et al., 2015). Major declines in apex predator population can alter entire food webs (Estes et al., 2011). However, some practical tools such as fishing area closure, reduced fishing effort, and various enforcement tools may improve shark management and conservation efforts and contribute to population recovery (Braccini et al., 2020; Gaughan & Santoro, 2021).
Shoal mesophotic assemblage included relatively few indicator taxa (and low DLI values), with many quite mobile and wide-ranging taxa (e.g., Carangoides coeruleopinnatus, Carangoides fulvoguttatus, Carangoides gymnostethus, Carangoides orthogrammus, Carcharhinus albimarginatus, Loxodon macrorhinus, Hemitriakis falcata, etc). Such species can be attracted to shoals as these habitats support high biodiversity and an abundance of prey (Pinheiro et al., 2016; Moore et al., 2017) and deeper areas around shoals may provide refugia from physical disturbances (e.g., cyclones) or fishing pressures (Lindfield et al., 2016; Abdul Wahab et al., 2018). An abundance of mobile, predatory reef-associated finfish and sharks supports previous research by Letessier et al. (2019) that showed remote regions in the Timor Sea that were far from human influence, and possessed submerged shoals, were hotspots for shark abundance.
In contrast, the three shallow water assemblages were characterised by low proportion of BRUV deployments but collectively consist of almost 85% of indicator taxa which is a common pattern of shallow tropical environments which are often associated with higher abundance and diversity of fish (Fitzpatrick et al., 2012; McLean et al., 2016; Abdul Wahab et al., 2018). The shallow fish assemblages were characterised by many Choerodon (tuskfish), Parupeneus (goatfish) and Lethrinus (emperor) taxa that are known to associate with reefs and sandy patches between reefs where they can forage for invertebrates amongst the sediment (McCormick, 1995; Travers et al., 2010). The representation of various feeding guilds within these shallow ecosystems aligns strongly with previous characterisation of fish assemblages in this region, with many of the indicator taxa identified here among the most ubiquitous identified by McLean et al. (2016). High relative abundance of zooplanktivores in two shallow shoal assemblages can support high biomass of generalist carnivore and piscivore taxa in their vicinity (Bejarano et al., 2014; Pinheiro et al., 2016). While the greatest proportion of indicator taxa were observed on shallow BRUV deployments especially near to shoals, very few fishery-target taxa were observed in comparison to those in deeper areas across the region (the two mesophotic assemblages). As many of these shallow and shoal-associated taxa had high DLI values, this also could indicate site attachment (Dufrene & Legendre, 1997). A high degree of site-attachment by low-mobility species might be expected for fish observed on shallow offshore shoal features remote from similar habitat features (e.g., a break in habitat continuity) or where surrounding ecosystems are oligotrophic (Papastamatiou et al., 2009; Martinez et al., 2017).
The shallow shoal near pipeline fish assemblage comprised substantial numbers of indicator taxa with high DLI values, including numerous Epinephelus (grouper), Chaetodon (butterflyfish) and herbivorous fish taxa (e.g., Scarus spp.). These locations offshore of Dampier are typically of a mix of hard coral habitat and patchy soft sediment communities (Abdul Wahab et al., 2018; McLean et al., 2021) and are situated near Glomar Shoal and Rankin Bank, and adjacent to several pipelines. In contrast, the shallow shoal assemblage had indicator taxa with comparatively low DLI values which may reflect an overall ubiquity of these taxa across the region (Dufrene & Legendre, 1997). The shallow shoal near pipeline assemblage included many similar families and feeding guilds to other shallow water assemblages but did have fewer Epinephelidae (grouper) species and a greater number of Pomacentridae (damsels) and Acanthuridae (surgeonfish). Scaridae (parrotfish) and various Acanthuridae and Pomacanthidae (angelfish) species, in particular, were distinctive of both shoal assemblages, aligning strongly with published works on shoals in these areas (Bellwood et al., 2012; Moore et al., 2017; Abdul Wahab et al., 2018). Herbivorous fish species play an important role in maintaining low macroalgal cover on reefs, thus enhancing juvenile coral densities (Evans et al., 2020), with parrotfishes also playing a role in removing live and dead corals and transporting sediment (Graham et al., 2006; Adam et al., 2011).
The mean relative abundance of all feeding guilds was similar across seafloor complexities except for piscivore and herbivore taxa which had higher relative abundance on pipelines than on low and high complexity seafloor. The high relative abundance of piscivores near pipelines supported previous findings by Schramm et al. (2021) where piscivore species were more abundant on shallow pipelines where they were feeding on prey from lower trophic levels. However, our results for herbivore relative abundance are different from those of Schramm et al. (2021). This difference likely reflects the local scale of research by Schramm et al. (2021) where herbivores were abundant in surrounding macroalgae habitats.
The taxonomic richness on pipelines was notably low in comparison to the taxonomic richness in the natural ecosystems. This aligns well with a previous local study identifying lower diversity of fish (number of species) on the Griffin pipeline in comparison to adjacent off-pipeline habitats (Bond et al., 2018a). Furthermore, the rising slope of all rarefaction curves indicated that there are additional fish taxa to be discovered with extra sampling. For pipelines, however, the extrapolated part of the curve reached asymptote at around 400 BRUV deployments which indicates the appropriate sample size required to exhaustively sample fish diversity on this type of infrastructure for this region. It appears that current sampling effort reported for pipeline surveys in the NW (including our study) is insufficient to adequately sample the full range of associated fish diversity. However, such sampling designs for pipelines are limited by space, with a requirement for at least 400 m between neighbouring BRUV deployments to avoid resampling of fish species capable of visiting more than one BRUV within a one-hour sampling period. Higher taxonomic richness was attributed to low seafloor complexity which likely results from the coarse resolution of the regional bathymetry raster used to derive seafloor complexity categories. While our method for deriving seafloor complexity categories is well suited for high resolution rasters and landscape-scale studies (Galaiduk et al., 2019; McLean et al., 2021) the resolution of the regional raster (cell size of 250m * 250m) likely misses many small seafloor features such as small reef outcrops and bommies and patches of sponge gardens which are known to harbour high diversity of fishes (Butler et al., 2002; Marliave et al., 2009; Kerry & Bellwood, 2012; Abdul Wahab et al., 2018). The small seafloor features could be detected using appropriate remote sensing techniques, such as multibeam echosounder surveys. However, given the spatial extent of this regional study, obtaining these data across the study area would require significant time and resources. Further, the BRUV monitoring technique itself can draw some fish species in from surrounding areas to the bait which limits the effectiveness of the technique for targeting small habitat patches specifically, i.e., a pipeline deployment could include fish drawn from immediate surrounds. We are confident, however, that the presented patterns of difference in diversity between pipelines and natural environments are valid because the pipeline was observed directly from the BRUV video deployments. In addition, McLean et al. (2021) used real-time USBL positioning to assess drift of systems during deployment with 86% of deployments within 10 m of the pipeline. This also highlights the urgent need for expanding the fine scale bathymetric surveys for the NW region so it can facilitate future studies and sustainable management of this highly diverse region.
Decommissioning decisions are typically made for singular or small groups of interconnected assets and do not consider the potential impact of cumulative decommissioning activities over large areas or through time. Our study shows that there is value in considering regional scale processes and environmental gradients to better understand potential broad ecological implications of such activities. At a regional scale, pipelines do not hold heightened fish taxonomic richness which is not surprising given the vast extent and diversity of natural habitats that exist across the NW region (Moore et al., 2017; Abdul Wahab et al., 2018; Currey-Randall et al., 2021). Such patterns may be different for other types of infrastructure, such as platform jackets which are known to be structurally more complex and consequentially have a high fish diversity (McLean et al., 2019; van Elden et al., 2019). This does not, however, suggest that removal of pipelines in this NW region will not impact fish diversity, as these anthropogenic features can influence fish communities in a manner of ways not investigated by this study, e.g., influencing fish behaviour (Bond et al., 2018b), facilitating depth range extensions of associated taxa (Sammarco et al., 2014), concentrating fishing activities (Bond et al., 2021), and potential adverse impacts of contaminants trough bioaccumulation in food webs or toxicity to local organisms (MacIntosh et al., 2021; Koppel et al., 2022). Further, there is a clear paucity of research into the influence O&G infrastructure on seascape ecological connectivity (McLean et al., 2022), yet this is a critical consideration for decommissioning (NOPSEMA, 2022). Without understanding the level and nature of connectedness across marine ecosystems that include infrastructure, it is difficult to predict the impact that decommissioning of infrastructure (complete or partial removal) might have on marine ecosystems. We suggest that a logical expansion of this research include examination of fish population and demographic processes (most notably larvae distribution, metapopulation connectivity processes and movement patterns of some of the indicator species identified in this study) to obtain a more holistic understanding of fish community processes in the region and how important infrastructure is for these processes. Such a study would also be particularly relevant for highly mobile species such as megafauna (e.g. sharks, rays, turtles, whales), many of which occur and transit across this region and are threatened by anthropogenic activities (e.g., turtles, sawsharks; Morgan et al., 2011; Wilson et al., 2018).
The original contributions presented in the study are included in the article/Supplementary Material. Further inquiries can be directed to the corresponding author.
Ethical review and approval was not required for the animal study because this study used historical datasets e.g. no new data was collected. All historical datasets were recorded with video using non-destructive methods. When required, Animal Ethics Committee approvals and Australian Marine Park activity permits were obtained for the individual studies and were stated in the individual reports and publications.
RG, BR, and DM conceived the ideas and perform the analyses. TB and MT analysed BRUVS footage and contributed BRUVS data. RG and DM prepared the manuscript. All authors contributed to the article and approved the submitted version.
This study received funding from the National Decommissioning Research Initiative (NDRI) who manages all contributing industry partners, namely Shell Australia Pty Ltd, Esso Australia Pty Ltd, Chevron Australia Pty Ltd, BHP Petroleum Pty Ltd, Woodside Energy Ltd, Santos Ltd, Vermillion Oil and Gas Australia Ltd, Cooper Energy Ltd. The funder was involved in the review of this article.
We thank Andrew Taylor for his tireless efforts as the founding Director and most recently, Sam Jarvis as the new Director of the National Decommissioning Research Initiative (NDRI). We acknowledge PTTEP Australasia Ltd., a joint voyage under the auspices of the Arafura and Timor Seas Ecosystem Action (ATSEA) program, and the Australian Government’s National Environmental Research Program (NERP), Woodside Energy and BHP petroleum for supporting previous projects that contributed historical data. We thank Juliet Corley and Katrina Bornt for the hand drawn fish images. We thank all those who were involved in the collection of historical AIMS data utilised here (see References). We thank Dr Michele Thums and Dr Marji Puotinen for their detailed reviews and comments on previous drafts of the manuscript. AIMS acknowledges the Traditional Owners of the Country adjacent to where historical BRUVS surveys were undertaken. We recognise these People’s ongoing spiritual and physical connection to Country and pay our respects to their Aboriginal Elders past, present and emerging.
LS is employed by Woodside Energy and TC is employed by BHP Petroleum.
The remaining authors declare that the research was conducted in the absence of any commercial or financial relationships that could be construed as a potential conflict of interest.
NDRI science advisory board, in particular Prof Peter Macreadie and Prof Iain Suthers contributed ideas and provided guidance in the conceptual framework of the study.
The authors declare that this study received funding from the National Decommissioning Research Initiative (NDRI). The funder had the following involvement with the study: review.
All claims expressed in this article are solely those of the authors and do not necessarily represent those of their affiliated organizations, or those of the publisher, the editors and the reviewers. Any product that may be evaluated in this article, or claim that may be made by its manufacturer, is not guaranteed or endorsed by the publisher.
The Supplementary Material for this article can be found online at: https://www.frontiersin.org/articles/10.3389/fmars.2022.979987/full#supplementary-material
Abdul Wahab M. A., Radford B., Cappo M., Colquhoun J., Stowar M., Depczynski M., et al. (2018). Biodiversity and spatial patterns of benthic habitat and associated demersal fish communities at two tropical submerged reef ecosystems. Coral Reefs 37, 327–343. doi: 10.1007/s00338-017-1655-9
Adam T. C., Schmitt R. J., Holbrook S. J., Brooks A. J., Edmunds P. J., Carpenter R. C., et al. (2011). Herbivory, connectivity, and ecosystem resilience: Response of a coral reef to a Large-scale perturbation. PLoS One 6, e23717. doi: 10.1371/journal.pone.0023717
AIMS (2014). “Biodiversity survey of glomar shoal and rankin bank,” in Report prepared by the Australian institute of marine science for woodside energy Ltd, vol. 1. (Townsville: Australian Institute of Marine Science), 153.
AIMS (2016). Addressing strategic knowledge gaps in the oceanic shoals bioregion, Western Australia [Perth: Australian Institute of Marine Science (AIMS)].
Almany G. R. (2004). Differential effects of habitat complexity, predators and competitors on abundance of juvenile and adult coral reef fishes. Oecologia 141, 105–113. doi: 10.1007/s00442-004-1617-0
Anderson M. J., Gorley R. N., Clarke K. R. (2008). PERMANOVA+ for PRIMER: guide to software and statistical methods (PRIMER-E: Plymouth, UK: PRIMER-E, Plymouth).
Bejarano I., Appeldoorn R. S., Nemeth M. (2014). Fishes associated with mesophotic coral ecosystems in la parguera, Puerto Rico. Coral Reefs 33, 313–328. doi: 10.1007/s00338-014-1125-6
Bellwood D. R., Hoey A. S., Hughes T. P. (2012). Human activity selectively impacts the ecosystem roles of parrotfishes on coral reefs. Proc. R. Soc. B: Biol. Sci. 279, 1621–1629. doi: 10.1098/rspb.2011.1906
Bond T., McLean D. L., Wakefield C. B., Partridge J. C., Prince J., White D., et al. (2021). Quantifying fishing activity targeting subsea pipelines by commercial trap fishers. Rev. Fish Biol. Fish. 31, 1009–1023. doi: 10.1007/s11160-021-09686-4
Bond T., Partridge J. C., Taylor M. D., Cooper T. F., McLean D. L. (2018a). The influence of depth and a subsea pipeline on fish assemblages and commercially fished species. PLoS One 13, e0207703. doi: 10.1371/journal.pone.0207703
Bond T., Partridge J. C., Taylor M. D., Langlois T. J., Malseed B. E., Smith L. D., et al. (2018b). Fish associated with a subsea pipeline and adjacent seafloor of the north West shelf of Western Australia. Mar. Environ. Res. 141, 53–65. doi: 10.1016/j.marenvres.2018.08.003
Braccini M., Molony B., Blay N. (2020). Patterns in abundance and size of sharks in northwestern Australia: cause for optimism. ICES J. Mar. Sci. 77, 72–82. doi: 10.1093/icesjms/fsz187
Bradley M., Nagelkerken I., Baker R., Travers M., Sheaves M. (2021). Local environmental context structures animal-habitat associations across biogeographic regions. Ecosystems. 25 (2), 237–251 doi: 10.1007/s10021-021-00651-7
Brown O. B., Minnett P. J., Evans R., Kearns E., Kilpatrick K., Kumar A., et al. (1999). MODIS infrared sea surface temperature algorithm algorithm theoretical basis document version 2.0. Univ. Miami 31, 098–033. Available at: https://mmodis.gsfc.nasa.gov/data/atbd/atbd_mod25.pdf.
Butler A., Althaus F., Furlani D., Ridgway K. (2002). Assessment of the conservation values of the bass strait sponge beds area, Vol. 71.
Cappo M., De’ath G., Speare P. (2007). Inter-reef vertebrate communities of the great barrier reef marine park determined by baited remote underwater video stations. Mar. Ecol. Prog. Ser. (Hobart, Tasmania: CSIRO Marine Research) 350, 209–221. doi: 10.3354/meps07189
Chao A., Gotelli N. J., Hsieh T. C., Sander E. L., Ma K. H., Colwell R. K., et al. (2014). Rarefaction and extrapolation with hill numbers: a framework for sampling and estimation in species diversity studies. Ecol. Monogr. 84, 45–67. doi: 10.1890/13-0133.1
Chatfield B. S., Van Niel K. P., Kendrick G. A., Harvey E. S. (2010). Combining environmental gradients to explain and predict the structure of demersal fish distributions. J. Biogeogr. 37, 593–605. doi: 10.1111/j.1365-2699.2009.02246.x
Claisse J. T., Ii D. J. P., Love M., Zahn L. A., Williams C. M., Bull A. S. (2015). Impacts from partial removal of decommissioned oil and gas platforms on fish biomass and production on the remaining platform structure and surrounding shell mounds. PLoS One 10, e0135812. doi: 10.1371/journal.pone.0135812
Claisse J. T., Pondella D. J., Love M., Zahn L. A., Williams C. M., Williams J. P., et al. (2014). Oil platforms off California are among the most productive marine fish habitats globally. Proc. Natl. Acad. Sci. 111, 15462–15467. doi: 10.1073/pnas.1411477111
Clarke K., Chapman M., Somerfield P., Needham H. (2006). Dispersion-based weighting of species counts in assemblage analyses. Mar. Ecol. Prog. Ser. 320, 11–27. doi: 10.3354/meps320011
Colwell R. K., Chao A., Gotelli N. J., Lin S.-Y., Mao C. X., Chazdon R. L., et al. (2012). Models and estimators linking individual-based and sample-based rarefaction, extrapolation and comparison of assemblages. J. Plant Ecol. 5, 3–21. doi: 10.1093/jpe/rtr044
Coolen J. W. P., Bittner O., Driessen F. M. F., van Dongen U., Siahaya M. S., de Groot W., et al. (2020). Ecological implications of removing a concrete gas platform in the north Sea. J. Sea Res. 166, 101968. doi: 10.1016/j.seares.2020.101968
Core Team R. (2019). R: A language and environment for statistical computing, r foundation for statistical computing, Vienna, Austria (Vienna, Austria: R Foundation for Statistical Computing).
Costa B., Taylor J. C., Kracker L., Battista T., Pittman S. (2014). Mapping reef fish and the seascape: using acoustics and spatial modeling to guide coastal management. PLoS One 9, e85555. doi: 10.1371/journal.pone.0085555
Cummings D. O., Lee R. W., Simpson S. J., Booth D. J., Pile A. J., Holmes S. P. (2011). Resource partitioning amongst co-occurring decapods on wellheads from australia’s north–West shelf. Anal. carbon nitrogen stable isotopes J. Exp. Mar. Biol. Ecol. 409, 186–193. doi: 10.1016/j.jembe.2011.08.021
Cure K., Currey-Randall L., Galaiduk R., Radford B., Wakeford M., Heyward A. (2021). Depth gradients in abundance and functional roles suggest limited depth refuges for herbivorous fishes. Coral Reefs 40 (2), 365–379. doi: 10.1007/s00338-021-02060-7
Currey-Randall L. M., Galaiduk R., Stowar M., Vaughan B. I., Miller K. J. (2021). Mesophotic fish communities of the ancient coastline in Western Australia. PLoS One 16, e0250427. doi: 10.1371/journal.pone.0250427
Currey-Randall L., Wakeford M., Colquhoun J., Cappo M., Stowar M., Birt M., et al. (2019). “Temporal trends in benthic communities and demersal fishes at rankin bank and glomar shoal,” in Report prepared for woodside energy Ltd (Perth: Australian Institute of Marine Science), 62.
Da Silva F., Luis Pereira F. X. (2011). ATSEA (Arafura and timor Sea environmental actions) cruise 2 report. (Perth: Australian Institute of Marine Science)
De’ath G. (2002). Multivariate regression trees: a new technique for modeling species-environment relationships. Ecology 83, 1105–1117.
De’ath G. (2011). “Mvpart: multivariate partitioning,” in R package version 1.4-0. [computer program]
De’ath G., Fabricius K. (2000). Classification and regression trees: a powerful yet simple technique for ecological data analysis. Ecology 81, 3178–3192. doi: 10.1890/0012-9658(2000)081[3178:CARTAP]2.0.CO;2
DeVantier L. M., De’ath G., Turak E., Done T. J., Fabricius K. E. (2006). Species richness and community structure of reef-building corals on the nearshore great barrier reef. Coral Reefs 25, 329–340. doi: 10.1007/s00338-006-0115-8
DMIRS (2021). DMIRS (Department of mines, industry regulations and safety): An overview of the latest key information on the performance of the state’s resources industry.
Dufrene M., Legendre P. (1997). Species assemblages and indicator species: The need for a flexible asymmetrical approach. (Perth: Government of Western Australia) Ecol. Monogr. 67, 345–366. doi: 10.2307/2963459
Dulvy N. K., Fowler S. L., Musick J. A., Cavanagh R. D., Kyne P. M., Harrison L. R., et al. (2014). Extinction risk and conservation of the world’s sharks and rays. elife 3, e00590. doi: 10.7554/eLife.00590
Elith J., Leathwick J. R. (2009). Species distribution models: ecological explanation and prediction across space and time. Annu. Rev. Ecol. Evolution Systematics 40, 677–697. doi: 10.1146/annurev.ecolsys.110308.120159
Estes J. A., Terborgh J., Brashares J. S., Power M. E., Berger J., Bond W. J., et al. (2011). Trophic downgrading of planet earth. Science 333, 301–306. doi: 10.1126/science.1205106
Evans R. D., Wilson S. K., Field S. N. (2014). Importance of macroalgal fields as coral reef fish nursery habitat in north-west Australia. Mar. Biol. 161, 599–607. doi: 10.1007/s00227-013-2362-x
Evans R. D., Wilson S. K., Fisher R., Ryan N. M., Babcock R., Blakeway D., et al. (2020). Early recovery dynamics of turbid coral reefs after recurring bleaching events. J. Environ. Manage. 268, 110666. doi: 10.1016/j.jenvman.2020.110666
Fitzpatrick B. M., Harvey E. S., Heyward A. J., Twiggs E. J., Colquhoun J. (2012). Habitat specialization in tropical continental shelf demersal fish assemblages. PloS One 7, e39634. doi: 10.1371/journal.pone.0039634
Fowler A. M., Macreadie P. I., Bishop D. P., Booth D. J. (2015). Using otolith microchemistry and shape to assess the habitat value of oil structures for reef fish. Mar. Environ. Res. 106, 103–113. doi: 10.1016/j.marenvres.2015.03.007
Froese R., Pauly D. (2021a). FishBase (Fisheries Centre: University of British Columbia). Available at: www.fishbase.de, accessed 10/18/2022.
Froese R., Pauly D. (2021b). The ecology table. Available at: www.fishbase.de, accessed 10/18/2022.
Fujii T. (2015). Temporal variation in environmental conditions and the structure of fish assemblages around an offshore oil platform in the north Sea. Mar. Environ. Res. 108, 69–82. doi: 10.1016/j.marenvres.2015.03.013
Fung T., LeDrew E. (1987). Application of principal components analysis to change detection. Photogrammetric Eng. Remote Sens. 53, 1649–1658.
Galaiduk R., Figueira W. F., Kingsford M., Curley B. G. (2013). Factors driving the biogeographic distribution of two temperate Australian damselfishes and ramifications for range shifts. Mar. Ecol. Prog. Ser. 484, 189–202. doi: 10.3354/meps10300
Galaiduk R., Halford A. R., Radford B. T., Moore C. H., Harvey E. S. (2017a). Regional-scale environmental drivers of highly endemic temperate fish communities located within a climate change hotspot. Diversity Distributions 23 (11), 1256–1267. doi: 10.1111/ddi.12614
Galaiduk R., Radford B., Harries S., Case M., Williams D., Low Choy D., et al. (2019). Technical report: Darwin – bynoe harbours predictive mapping of benthic communities (Perth: Australian Institute of Marine Science).
Galaiduk R., Radford B. T., Saunders B. J., Newman S. J., Harvey E. S. (2017b). Characterizing ontogenetic habitat shifts in marine fishes: advancing nascent methods for marine spatial management. Ecol. Appl. 27, 1776–1788. doi: 10.1002/eap.1565
Gaughan D., Santoro K. (2021). Status reports of the fisheries and aquatic resources of Western Australia 2019/20: The state of the fisheries (Perth, Australia: Department of Primary Industries and Regional Development).
Geraghty P., Macbeth W., Williamson J. (2015). “Aspects of the reproductive biology of dusky, spinner and sandbar sharks (Family carcharhinidae) from the Tasman Sea,” in Marine and freshwater research 67 (4), 513–525.
Gilmour J. P., Cook K. L., Ryan N. M., Puotinen M. L., Green R. H., Shedrawi G., et al. (2019). The state of Western australia’s coral reefs. Coral Reefs 38, 651–667. doi: 10.1007/s00338-019-01795-8
Graham N. A. J., Wilson S. K., Jennings S., Polunin N. V. C., Bijoux J. P., Robinson J. (2006). Dynamic fragility of oceanic coral reef ecosystems. Proc. Natl. Acad. Sci. 103, 8425–8429. doi: 10.1073/pnas.0600693103
Gratwicke B., Speight M. R. (2005). The relationship between fish species richness, abundance and habitat complexity in a range of shallow tropical marine habitats. J. Fish Biol. 66, 650–667. doi: 10.1111/j.0022-1112.2005.00629.x
Gust N., Choat J. H., McCormick M. I. (2001). Spatial variability in reef fish distribution, abundance, size and biomass: a multi-scale analysis. Mar. Ecol. Prog. Ser. 214, 237–251. doi: 10.3354/meps214237
Harry A. V., Butcher P. A., Macbeth W. G., Morgan J. A. T., Taylor S. M., Geraghty P. T., et al. (2019). Life history of the common blacktip shark, carcharhinus limbatus, from central eastern Australia and comparative demography of a cryptic shark complex. Mar. Freshw. Res. 70, 834–848. doi: 10.1071/MF18141
Harvey E. S., Cappo M., Butler J. J., Hall N., Kendrick G. A. (2007). Bait attraction affects the performance of remote underwater video stations in assessment of demersal fish community structure. Mar. Ecol. Prog. Ser. 350, 245–254. doi: 10.3354/meps07192
Harvey E. S., Cappo M., Kendrick G. A., McLean D. L. (2013). Coastal fish assemblages reflect geological and oceanographic gradients within an Australian zootone. PloS One 8, 1–17. doi: 10.1371/journal.pone.0080955
Heyward A., Cappo M., Case M., Colquhoun J., Fisher R., Radford B., et al. (2015). AIMS ARP7 shoals – annual report on the outcome of the 2015 shoals survey (Perth: Prepared for Shell and INPEX by the Australian Institute of Marine Science).
Heyward A., Jones R., Meeuwig J., Burns K., Radford B., Colquhoun J., et al. (2012). “Monitoring study S5. montara: 2011 offshore banks assessment survey,” in Final report prepared by the Australian institute of marine science for PTTEP Australasia (Ashmore Cartier) pty. Ltd (Perth: Australian Institute of Marine Science).
Heyward A., Radford B. (2019). Northwest Australia. In: Mesophotic Coral Ecosystems Springer p, 337–349. doi: 10.1007/978-3-319-92735-0_19
Heyward A., Radford B., Cappo M., Wakeford M., Fisher J., Colquhoun J., et al. (2017). “Barossa environmental baseline study, regional shoals and shelf assessment 2015 final report,” in A report for ConocoPhillips Australia exploration pty Ltd by the Australian institute of marine science (Perth: Western Australia).
Hixon M. A., Jones G. P. (2005). Competition, predation, and density-dependent mortality in demersal marine fishes. Ecol. (Washington DC) 86, 2847–2859. doi: 10.1890/04-1455
Holmes K. W., Van Niel K. P., Radford B., Kendrick G. A., Grove S. L. (2008). Modelling distribution of marine benthos from hydroacoustics and underwater video. Continental Shelf Res. 28, 1800–1810. doi: 10.1016/j.csr.2008.04.016
Hsieh T. C., Ma K. H., Chao A. (2016). INEXT: an r package for rarefaction and extrapolation of species diversity (Hill numbers). Methods Ecol. Evol. 7, 1451–1456. doi: 10.1111/2041-210X.12613
Hyndes G. A., Kendrick A. J., MacArthur L. D., Stewart E. (2003). Differences in the species-and size-composition of fish assemblages in three distinct seagrass habitats with differing plant and meadow structure. Mar. Biol. 142, 1195–1206. doi: 10.1007/s00227-003-1010-2
Hyndes G. A., Potter ’ I. C., Lenanton R. C. J. (1996). Habitat partitioning by whiting species (Sillaginidae) in coastal waters. Environ. Biol. Fishes 45, 21–40. doi: 10.1007/BF00000625
IUCN (2021). The IUCN red list of threatened species. version 2021-3. Available at: www.iucnredlist.org., accessed 04/01/2022.
Kerry J. T., Bellwood D. R. (2012). The effect of coral morphology on shelter selection by coral reef fishes. Coral Reefs 31, 415–424. doi: 10.1007/s00338-011-0859-7
Koppel D. J., Kho F., Hastings A., Crouch D., MacIntosh A., Cresswell T., et al. (2022). Current understanding and research needs for ecological risk assessments of naturally occurring radioactive materials (NORM) in subsea oil and gas pipelines. J. Environ. radioact. 241, 106774. doi: 10.1016/j.jenvrad.2021.106774
Kordi M. N., Collins L. B., O’Leary M., Stevens A. (2016). ReefKIM: An integrated geodatabase for sustainable management of the Kimberley reefs. (North West Australia: Ocean & Coastal Management) 119, 234–243
Langlois T., Goetze J., Bond T., Monk J., Abesamis R. A., Asher J., et al. (2020). A field and video annotation guide for baited remote underwater stereo-video surveys of demersal fish assemblages. Methods Ecol. Evol. 11, 1401–1409. doi: 10.1111/2041-210X.13470
Langlois T. J., Radford B. T., Van Niel K. P., Meeuwig J. J., Pearce A. F., Rousseaux C. S. G., et al. (2012). Consistent abundance distributions of marine fishes in an old, climatically buffered, infertile seascape. Global Ecol. Biogeogr. 21, 886–897. doi: 10.1111/j.1466-8238.2011.00734.x
Letessier T. B., Mouillot D., Bouchet P. J., Vigliola L., Fernandes M. C., Thompson C., et al. (2019). Remote reefs and seamounts are the last refuges for marine predators across the indo-pacific. PLoS Biol. 17, e3000366. doi: 10.1371/journal.pbio.3000366
Lindfield S. J., Harvey E. S., Halford A. R., McIlwain J. L. (2016). Mesophotic depths as refuge areas for fishery-targeted species on coral reefs. Coral Reefs 35, 125–137. doi: 10.1007/s00338-015-1386-8
MacIntosh A., Dafforn K., Penrose B., Chariton A., Cresswell T. (2021). Ecotoxicological effects of decommissioning offshore petroleum infrastructure: A systematic review. Crit. Rev. Environ. Sci. Technol., 52 (18), 3283–3321. doi: 10.1080/10643389.2021.1917949
Marliave J. B., Conway K. W., Gibbs D. M., Lamb A., Gibbs C. (2009). Biodiversity and rockfish recruitment in sponge gardens and bioherms of southern British Columbia, Canada. Mar. Biol. 156, 2247–2254. doi: 10.1007/s00227-009-1252-8
Martinez A. S., Queiroz E. V., Bryson M., Byrne M., Coleman R. A. (2017). Incorporating in situ habitat patchiness in site selection models reveals that site fidelity is not always a consequence of animal choice. J. Anim. Ecol. 86, 847–856. doi: 10.1111/1365-2656.12668
McArdle B., Anderson M. (2001). Fitting multivariate models to community data: a comment on distance-based redundancy analysis. Ecology 82, 290–297. doi: 10.1890/0012-9658(2001)082[0290:FMMTCD]2.0.CO;2
McAuley R. B., Simpfendorfer C. A., Hall N. G. (2007). A method for evaluating the impacts of fishing mortality and stochastic influences on the demography of two long-lived shark stocks. ICES J. Mar. Sci. 64, 1710–1722. doi: 10.1093/icesjms/fsm146
McCormick M. (1995). Fish feeding on mobile benthic invertebrates: influence of spatial variability in habitat associations. Mar. Biol. 121, 627–637. doi: 10.1007/BF00349298
McLean D., Cure K., Wahab M. A., Galaiduk R., Birt M., Vaughan B., et al. (2021). A comparison of marine communities along a subsea pipeline with those in surrounding seabed areas. Continental Shelf Res., 219, 104394. doi: 10.1016/j.csr.2021.104394
McLean D. L., Ferreira L. C., Benthuysen J. A., Miller K. J., Schläppy M.-L., Ajemian M. J., et al. (2022). Influence of offshore oil and gas structures on seascape ecological connectivity. Global Change Biol. 28 (11), 3515–3536 doi: 10.1111/gcb.16134
McLean D. L., Langlois T. J., Newman S. J., Holmes T. H., Birt M. J., Bornt K. R., et al. (2016). Distribution, abundance, diversity and habitat associations of fishes across a bioregion experiencing rapid coastal development. Estuarine Coast. Shelf Sci. 178, 36–47. doi: 10.1016/j.ecss.2016.05.026
McLean D. L., Partridge J. C., Bond T., Birt M. J., Bornt K. R., Langlois T. J. (2017). Using industry ROV videos to assess fish associations with subsea pipelines. Continental Shelf Res. 141, 76–97. doi: 10.1016/j.csr.2017.05.006
McLean D. L., Taylor M. D., Giraldo Ospina A., Partridge J. C. (2019). An assessment of fish and marine growth associated with an oil and gas platform jacket using an augmented remotely operated vehicle. Continental Shelf Res. 179, 66–84. doi: 10.1016/j.csr.2019.04.006
McLean D. L., Taylor M. D., Partridge J. C., Gibbons B., Langlois T. J., Malseed B. E., et al. (2018). Fish and habitats on wellhead infrastructure on the north west shelf of Western Australia. Continental Shelf Res. 164, 10–27. doi: 10.1016/j.csr.2018.05.007
McLean D. L., Vaughan B. I., Malseed B. E., Taylor M. D. (2020). Fish-habitat associations on a subsea pipeline within an Australian marine park. Mar. Environ. Res. 153, 104813. doi: 10.1016/j.marenvres.2019.104813
Meyer-Gutbrod E., Love M., Claisse J., Page H., Schroeder D., Miller R. (2019). Decommissioning impacts on biotic assemblages associated with shell mounds beneath southern California offshore oil and gas platforms. Bull. Mar. Sci. 95, 683–702. doi: 10.5343/bms.2018.0077
Meyer-Gutbrod E. L., Love M. S., Schroeder D. M., Claisse J. T., Kui L., Miller R. J. (2020). Forecasting the legacy of offshore oil and gas platforms on fish community structure and productivity. Ecol. Appl. 30, e02185. doi: 10.1002/eap.2185
Monk J., Ierodiaconou D., l. V. V., Bellgrove A., Harvey E., Rattray A., et al. (2010). Habitat suitability for marine fishes using presence-only modelling and multibeam sonar. Mar. Ecol. Prog. Ser. 420, 157–174. doi: 10.3354/meps08858
Moore C., Cappo M., Radford B., Heyward A. (2017). Submerged oceanic shoals of north Western Australia are a major reservoir of marine biodiversity. Coral Reefs 36, 719–734. doi: 10.1007/s00338-017-1564-y
Moore C. H., Harvey E. S., Van Niel K. P. (2009). Spatial prediction of demersal fish distributions: enhancing our understanding of species-environment relationships. ICES J. Mar. Sci. 66, 2068–2075. doi: 10.1093/icesjms/fsp205
Moore C. H., Harvey E. S., Van Niel K. (2010). The application of predicted habitat models to investigate the spatial ecology of demersal fish assemblages. Mar. Biol. 157, 2717–2729. doi: 10.1007/s00227-010-1531-4
Moore G., Morrison S., Hutchins J. B., Allen G. R., Sampey A. (2014). Kimberley Marine biota. Historical data: fishes. Records Western Aust. Museum Supplement 84, 161–206. doi: 10.18195/issn.0313-122x.84.2014.161-206
Morgan D. L., Whitty J. M., Phillips N. M. (2011). North-western Australia as a hotspot for endangered elasmobranchs with particular reference to sawfishes and the northern river shark. J. R. Soc. Western Aust. 14, 345–358.
Newman S., Wakefield C., Skepper C., Boddington D., Steele A. (2020). “North coast demersal resource status report 2020,” in Status reports of the fisheries and aquatic resources of Western Australia 2019/20: The state of the fisheries. Eds. Gaughan D. J., Santoro K. (Western Australia: Department of Primary Industries and Regional Development).
Nichol S., Howard F. J. F., Kool J., Siwabessy J., Przeslawki R., Stowar M., et al. (2013). Oceanic shoals commonwealth marine reserve (Timor Sea) biodiversity survey: GA0339/SOL5650 post-survey report (Canberra: Geoscience Australia).
NOPSEMA (2022). NOPSEMA (National offshore petroleum safety and environmental management authority) research strategy. (Perth: NOPSEMA)
Oksanen J., Blanchet F. G., Kindt R., Legendre P., Minchin P., O’hara R., et al. (2013). “Community ecology package,” in R package version 2 (0), 321–326.
Ouellette M.-H., Legendre P., Borcard D. (2012). Cascade multivariate regression tree: a novel approach for modelling nested explanatory sets. Methods Ecol. Evol. 3, 234–244. doi: 10.1111/j.2041-210X.2011.00171.x
Ovenden J. R., Lloyd J., Newman S. J., Keenan C. P., Slater L. S. (2002). Spatial genetic subdivision between northern Australian and southeast Asian populations of pristipomoides multidens: a tropical marine reef fish species. Fish. Res. 59, 57–69. doi: 10.1016/S0165-7836(01)00415-5
Ovenden J. R., Salini J., O’connor S., Street R. (2004). Pronounced genetic population structure in a potentially vagile fish species (Pristipomoides multidens, teleostei; perciformes; lutjanidae) from the East indies triangle. Mol. Ecol. 13, 1991–1999. doi: 10.1111/j.1365-294X.2004.02210.x
Papastamatiou Y. P., Lowe C. G., Caselle J. E., Friedlander A. M. (2009). Scale-dependent effects of habitat on movements and path structure of reef sharks at a predator-dominated atoll. Ecology 90, 996–1008. doi: 10.1890/08-0491.1
Pinheiro H. T., Goodbody-Gringley G., Jessup M. E., Shepherd B., Chequer A. D., Rocha L. A. (2016). Upper and lower mesophotic coral reef fish communities evaluated by underwater visual censuses in two Caribbean locations. Coral Reefs 35, 139–151. doi: 10.1007/s00338-015-1381-0
Pittman S. J., Christensen J. D., Caldow C., Menza C., Monaco M. E. (2007). Predictive mapping of fish species richness across shallow-water seascapes in the Caribbean. Ecol. Model. 204, 9–21. doi: 10.1016/j.ecolmodel.2006.12.017
Pittman S. J., Costa B. M., Battista T. A. (2009). Using lidar bathymetry and boosted regression trees to predict the diversity and abundance of fish and corals. J. Coast. Res. 10053, 27–38. doi: 10.2112/SI53-004.1
Pradella N., Fowler A. M., Booth D. J., Macreadie P. I. (2014). Fish assemblages associated with oil industry structures on the continental shelf of north-western Australia. J. Fish Biol. 84, 247–255. doi: 10.1111/jfb.12274
Pratchett M. S., Bay L. K., Gehrke P. C., Koehn J. D., Osborne K., Pressey R. L., et al. (2011). Contribution of climate change to degradation and loss of critical fish habitats in Australian marine and freshwater environments. Mar. Freshw. Res. 62, 1062–1081. doi: 10.1071/MF10303
Priede I. G., Bagley P. M., Smith A., Creasey S., Merrett N. (1994). Scavenging deep demersal fishes of the porcupine seabight, north-east Atlantic: observations by baited camera, trap and trawl. J. Mar. Biol. Assoc. U. K. 74, 481–498. doi: 10.1017/S0025315400047615
Przeslawski R., Alvarez de Glasby B., Smit N., Evans-Illidge L., Dethmers K. (2013). Benthic biota of northern Australia: SS2012t07 post-survey report. (Canberra: Geoscience Australia)
Randin C. F., Ashcroft M. B., Bolliger J., Cavender-Bares J., Coops N. C., Dullinger S., et al. (2020). Monitoring biodiversity in the anthropocene using remote sensing in species distribution models. Remote Sens. Environ. 239, 111626. doi: 10.1016/j.rse.2019.111626
Richards J., Jia X. (2006). Interpretation of hyperspectral image data. Remote Sensing Digital Image Analysis: An Introduction. 359–388.
Roberts D. W., Roberts M. D. W. (2016). Package ‘labdsv.’ ordination and multivariate 775. Available at: https://cran.r-project.org/web/packages/labdsv/index.html, accessed 10/18/2022
Sainsbury K., Campbell R., Lindholm R., Whitelaw A. (1997). Experimental management of an Australian multi-species fishery: examining the possibility of trawl-induced habitat modification. (Maryland, USA: American Fisheries Society).
Sammarco P., Porter S., Sinclair J., Genazzio M. (2014). Population expansion of a new invasive coral species, tubastraea micranthus, in the northern gulf of Mexico. Mar. Ecol. Prog. Ser. 495, 161–173. doi: 10.3354/meps10576
Saunders B. J., Galaiduk R., Inostroza K., Myers E. M. V., Goetze J. S., Westera M., et al. (2021). Quantifying patterns in fish assemblages and habitat use along a deep submarine canyon-valley feature using a remotely operated vehicle. Front. Mar. Sci. 8, 1267. doi: 10.3389/fmars.2021.608665
Schramm K. D., Marnane M. J., Elsdon T. S., Jones C. M., Saunders B. J., Newman S. J., et al. (2021). Fish associations with shallow water subsea pipelines compared to surrounding reef and soft sediment habitats. Sci. Rep. 11, 6238. doi: 10.1038/s41598-021-85396-y
Stevens J. D., Wiley P. D. (1986). Biology of two commercially important carcharhinid sharks from northern Australia. Mar. Freshw. Res. 37, 671–688. doi: 10.1071/MF9860671
Thomson P. G., Pillans R., Jaine F. R. A., Harcourt R. G., Taylor M. D., Pattiaratchi C. B., et al. (2021). Acoustic telemetry around Western australia’s oil and gas infrastructure helps detect the presence of an elusive and endangered migratory giant. Front. Mar. Sci. 8, 631449. doi: 10.3389/fmars.2021.631449
Travers M. J., Potter I. C., Clarke K. R., Newman S. J. (2012). Relationships between latitude and environmental conditions and the species richness, abundance and composition of tropical fish assemblages over soft substrata. Mar. Ecol. Prog. Ser. 446, 221–241. doi: 10.3354/meps09501
Travers M. J., Potter I. C., Clarke K. R., Newman S. J., Hutchins J. B. (2010). The inshore fish faunas over soft substrates and reefs on the tropical west coast of Australia differ and change with latitude and bioregion. J. Biogeogr. 37, 148–169. doi: 10.1111/j.1365-2699.2009.02183.x
Tuya F., Wernberg T., Thomsen M. S. (2011). The relative influence of local to regional drivers of variation in reef fishes. J. Fish Biol. 79, 217–234. doi: 10.1111/j.1095-8649.2011.03015.x
Underwood A. J., Chapman M. G., Connell S. D. (2000). Observations in ecology: you can’t make progress on processes without understanding the patterns. J. Exp. Mar. Biol. Ecol. 250, 97–115. doi: 10.1016/S0022-0981(00)00181-7
UNEP-WCMC, WorldFish Centre, WRI, TNC (2021). “Global distribution of warm-water coral reefs, compiled from multiple sources including the millennium coral reef mapping project,” in Version 4.1. includes contributions from IMaRS-USF and IRD 2005). Ed. Spalding, et al (Cambridge (UK: UN Environment World Conservation Monitoring Centre). doi: 10.34892/t2wk-5t34
van Elden S., Meeuwig J. J., Hobbs R. J., Hemmi J. M. (2019). Offshore oil and gas platforms as novel ecosystems: A global perspective. Front. Mar. Sci. 6, 548. doi: 10.3389/fmars.2019.00548
Watson D. L., Harvey E. S., Anderson M. J., Kendrick G. A. (2005). A comparison of temperate reef fish assemblages recorded by three underwater stereo-video techniques. Mar. Biol. 148, 415–425. doi: 10.1007/s00227-005-0090-6
Wellington C. M., Harvey E. S., Wakefield C. B., Abdo D., Newman S. J. (2021). Latitude, depth and environmental variables influence deepwater fish assemblages off Western Australia. J. Exp. Mar. Biol. Ecol. 539, 151539. doi: 10.1016/j.jembe.2021.151539
Willis T. J., Anderson M. J. (2003). Structure of cryptic reef fish assemblages: relationships with habitat characteristics and predator density. Mar. Ecol. Prog. Ser. 257, 209–221. doi: 10.3354/meps257209
Wilson S. K., Babcock R. C., Fisher R., Holmes T. H., Moore J. A. Y., Thomson D. P. (2012). Relative and combined effects of habitat and fishing on reef fish communities across a limited fishing gradient at ningaloo. Mar. Environ. Res. 81, 1–11. doi: 10.1016/j.marenvres.2012.08.002
Wilson S. K., Fulton C. J., Depczynski M., Holmes T. H., Noble M. M., Radford B., et al. (2014). Seasonal changes in habitat structure underpin shifts in macroalgae-associated tropical fish communities. Mar. Biol. 161, 2597–2607. doi: 10.1007/s00227-014-2531-6
Wilson P., Thums M., Pattiaratchi C., Meekan M., Pendoley K., Fisher R., et al. (2018). Artificial light disrupts the nearshore dispersal of neonate flatback turtles natator depressus. Mar. Ecol. Prog. Ser. 600, 179–192. doi: 10.3354/meps12649
Young M., Carr M. H. (2015). Application of species distribution models to explain and predict the distribution, abundance and assemblage structure of nearshore temperate reef fishes. Diversity Distributions 21, 1428–1440. doi: 10.1111/ddi.12378
Keywords: multivariate regression trees (MRT), subsea oil and gas infrastructure, decommissioning, north-west Australia, species richness
Citation: Galaiduk R, Radford B, Case M, Bond T, Taylor M, Cooper T, Smith L and McLean D (2022) Regional patterns in demersal fish assemblages among subsea pipelines and natural habitats across north-west Australia. Front. Mar. Sci. 9:979987. doi: 10.3389/fmars.2022.979987
Received: 28 June 2022; Accepted: 11 October 2022;
Published: 28 October 2022.
Edited by:
Toyonobu Fujii, Tohoku University, JapanReviewed by:
Astrid Brigitta Leitner, Monterey Bay Aquarium Research Institute (MBARI), United StatesCopyright © 2022 Galaiduk, Radford, Case, Bond, Taylor, Cooper, Smith and McLean. This is an open-access article distributed under the terms of the Creative Commons Attribution License (CC BY). The use, distribution or reproduction in other forums is permitted, provided the original author(s) and the copyright owner(s) are credited and that the original publication in this journal is cited, in accordance with accepted academic practice. No use, distribution or reproduction is permitted which does not comply with these terms.
*Correspondence: Ronen Galaiduk, r.galaiduk@aims.gov.au
Disclaimer: All claims expressed in this article are solely those of the authors and do not necessarily represent those of their affiliated organizations, or those of the publisher, the editors and the reviewers. Any product that may be evaluated in this article or claim that may be made by its manufacturer is not guaranteed or endorsed by the publisher.
Research integrity at Frontiers
Learn more about the work of our research integrity team to safeguard the quality of each article we publish.