 Tiffany L. Sih
 Katherine Cure2,3
 Dianne McLean
 Peter I. Macreadie
95% of researchers rate our articles as excellent or good
Learn more about the work of our research integrity team to safeguard the quality of each article we publish.
Find out more
ORIGINAL RESEARCH article
Front. Mar. Sci. , 21 November 2022
Sec. Marine Ecosystem Ecology
Volume 9 - 2022 | https://doi.org/10.3389/fmars.2022.979212
This article is part of the Research Topic Seafloor Heterogeneity: Artificial Structures and Marine Ecosystem Dynamics - Recent Advances View all 16 articles
The Gippsland Basin is the location of Australia’s oldest offshore oil and gas (O&G) structures, with hydrocarbon production beginning in the 1960s. The Bass Strait flows over this area with fisheries providing seafood for the major population centers of Melbourne, Sydney and beyond. Since Australia’s maritime legislation restricts activities to outside of 500 meters from O&G structures as a security exclusion zone, these O&G structures may serve as de facto marine protected areas that may have spillover effects to local fisheries. Therefore, it is critical to understand the habitat value of O&G infrastructure to marine life in the Bass Strait and whether decommissioning of these structures affect local marine ecosystems and fisheries. We analyzed industry-collected remotely operated vehicle (ROV) imagery from 2008-2018 and compared this data with reported catch data from fishing vessels operating in this region collected by the Australian Fisheries Management Authority (AFMA) from 2008-2018. We assessed species richness and relative abundance on two platforms and two pipelines and compared the species composition with retained catch reported by commercial fishers operating in Commonwealth fisheries. We found diverse communities of fishes and invertebrates around O&G structures, with a different subset of species inhabiting pipelines than platforms. We found little overlap between the species that were targeted by commercial fishers and those found around O&G structures (10% overlap), however, species composition data from fisheries often groups species making the data coarse and under-representative of true species diversity. Fishery-independent data from ROV imagery or other methods greatly augments our understanding of deepwater marine communities, including those around O&G structures. Combining data sources provides a holistic look at these novel ecosystems and provides better insight into future decommissioning scenarios.
Worldwide, as offshore oil and gas (O&G) structures reach the end of their intended use, decommissioning discussions consider what to do with these physical structures and what the resulting impact may be on the surrounding marine environment. O&G structures are analogous to ‘artificial reefs’, which may create habitat and feeding opportunities for marine communities where those are often limited or in decline (Macreadie et al., 2011; Fowler and Booth, 2012; Bull and Love, 2019). Artificial reefs may provide habitat for fishes, invertebrates and sessile biota, and serve a purpose for biodiversity or fisheries enhancement via habitat rehabilitation or habitat augmentation (Becker et al., 2017; Paxton et al., 2020), though O&G structures were not expressly built for these purposes. Decommissioning decisions on these structures in Australian State and Commonwealth waters is governed by the National Offshore Petroleum Safety and Environmental Management Authority (NOPSEMA) via an Offshore Petroleum and Greenhouse Gas Storage Act 2006 (OPGGS Act, 6.4 Restoration of the Environment). A titleholder may only leave O&G infrastructure in place if it can be demonstrated that this delivers equal or better environmental and safety outcomes compared to complete removal and that all impacts and risks are reduced to ‘as low as reasonably practicable’ (ALARP; Australian Government, 2018) and has an exemption through an accepted environment plan. Such a decision requires an understanding of the potential habitat value of a structure and its associations with fauna, as well as knowledge of the risks posed to marine ecosystems by different decommissioning options. With many countries entering an era of large-scale decommissioning, this agenda is driving focused marine research activities around the globe (Shaw et al., 2018; Sommer et al., 2018; Birchenough and Degraer, 2020; Fowler et al., 2020).
Better understanding of marine communities on O&G structures, as well as their surrounding ecosystems, are key for informing the decommissioning agenda. Further linking this information with data on local industries such as fisheries, that may benefit from spillover effects of existing infrastructure, adds key value to the decision-making process. Gippsland Basin O&G structures are placed among Australia’s ‘Great Southern Reef’ (Great Southern Reef (GSR), 2021), a series of interconnected temperate rocky reefs that are understudied yet likely highly valuable for fishery production and biodiversity. Australia’s unique marine ecosystems exhibit high rates of endemism in its flora and fauna (Australian Biological Resources Study (ABRS), 2020) and this region is also biologically and geographically distinct. More than 100 species of teleosts (bony fishes) and elasmobranchs (sharks and rays) are commercially caught in south-east Australian fisheries (Williams and Bax, 2001; Emery et al., 2021), which have been active since the early 1900s and where fishing effort has continuously intensified (Novaglio et al., 2018). Currently, the South-east Australian fishery is the largest fishery for benthic or near-bottom ‘groundfishes’ and the most important Australian fishery in terms of the domestic seafood market (Williams and Bax, 2001). The potential contributions of O&G structures to these fisheries have not yet been evaluated.
Presently, no published research exists that documents the ecological role or habitat value of O&G infrastructure for comprehensive marine communities in the Bass Strait region of Australia. Two previous research studies have investigated the role of these offshore structures specifically to ichthyoplankton (Neira, 2005) and fur seal populations (Arnould et al., 2015) but there is a direct need to understand whether decommissioning might influence the larger ecosystem. Broader research efforts have been limited due to two primary reasons: 1) historical scientific data only existed in industry-held reports and 2) 500-m exclusion zones around platforms have limited access to scientists and other sectors (e.g., fishing, shipping). During routine inspection and maintenance activities, Remotely Operated Vehicles (ROVs) collect imagery of O&G structures and their associated underwater communities (e.g., fish, invertebrates, mammals). The imagery and metadata that is collected can be a tremendous (and under-utilized) resource for scientists (Macreadie et al., 2018). When O&G infrastructure nears its end-of-use, such information is critical for understanding the consequences of different O&G decommissioning scenarios on associated marine life, and potentially more broadly to ocean health.
Offshore O&G platforms are often the only dominant underwater hard structure in the area where they are positioned, providing unique habitats for marine species. Most of these structures are large and provide vertically connected habitats that span the water column from the surface to the seabed. A 70-m structure is analogous to a > 20-story building on land and may result in micro- or macro-level changes to surrounding biological or oceanographic processes (Hastings et al., 1976; Love et al., 2000; Hernandez et al., 2003). Detailed analysis of platform ecology can provide greater insight into whether these structures provide ecological value to fish and invertebrate species. For example, O&G structures exhibit non-uniform distributions of marine communities throughout a platform’s structure (Ajemian et al., 2015; McLean et al., 2019) often with depth-driven differences in fish (e.g., North Sea, Todd et al., 2018; North-west Australia, McLean et al., 2019) and invertebrate assemblages (e.g., North Sea, van der Stap et al., 2016; North-west Australia, Thomson et al., 2018). Assessing temporal change in O&G communities colonizing structures is also important to improve understanding of ecological succession of anthropogenic structures, compared to more natural habitats. Such knowledge may inform decisions regarding the maintenance, removal or retention of structures and provide insight into potential future installations (Bull and Love, 2019). In one case study, industry ROV surveys indicated that marine communities in subsea infrastructures undergo rapid succession, with a ‘first wave’ of colonization by fish and invertebrates often occurring within a week (Todd et al., 2020b). What these structures represent in terms of ‘attracting’ marine life or ‘producing’ benefits for local fisheries and marine ecosystems has to date been treated largely on a case-by-case basis, with few widespread geographic (i.e., with neighboring habitats, among structures within a region) or temporal comparisons (e.g., Love et al., 2019). Describing the marine communities is only the first step, but essential, to understanding the ecological and successional role of infrastructure communities.
Pipelines are important conduits in O&G infrastructure and may have different habitat value as pipelines are laid on the seabed (or in trenches) and can become partially or fully buried in the sediment over time. Industry typically use ROVs or Autonomous Underwater Vehicles (AUVs), to conduct visual inspections of pipelines or perform specific tasks such as monitoring free-spans/anodes. Pipelines can vary in diameter from ~12 cm to > 1 m and in length from meters to > 1000 km, they can provide attachment points and available habitat where little hard substrate exists (e.g., sandy environments) and may be important structures to fish and local fisheries (McLean et al., 2020b; Bond et al., 2021). Pipelines may provide food sources and refuges for fish and invertebrates and are often characterized by high abundances of larval fishes (McLean et al., 2017; McLean et al., 2021b). Commercially important fish species can occur in higher abundance and biomass along pipelines than in nearby natural environments (Bond et al., 2018b, Bond et al., 2018b; McLean et al., 2021b). Differences in pipeline position (i.e., how much is buried and how much is exposed) and in the complexity and extent of colonizing benthic communities (marine growth) along the pipeline may account for differences in species presence or abundance. In North-west Australia for example, the high proportion of sponges along a pipeline was correlated with high abundances of Moses snapper (Lutjanus russellii, McLean et al., 2020b).
This research project used fishery data and historical ROV footage to address the question: What marine communities associate with O&G infrastructure in the Bass Strait, and how might decommissioning influence these communities? Our specific aims were to investigate: 1) broad patterns in fish, invertebrate and benthic communities for the region using industry-collected fishery data between 2008-2018 and 2) similarities and differences in fish and invertebrate communities among two platforms and two pipelines. This research is novel in combining two sets of industry-collected data for a region in southeastern Australia that has a long history of anthropogenic use. This information may be important for assessing the ecological value of O&G structures in temperate environments considering Australia’s unique marine taxa.
In the Bass Strait region of southeastern Australia, the Gippsland Basin is an important region for Australian industries including energy (Department of Jobs, Precincts and Regions (DJPR), 2021) and fisheries. It includes an extensive network of O&G infrastructure, operated by Esso website, on behalf of joint ventures, with the first O&G infrastructure installed in the late 1960s (Esso Australia, 2022). The O&G infrastructure operated by Esso in the Gippsland Basin includes 19 platforms and about 800 km of pipelines, with data from two platforms and two pipelines used in this study (Figure 1). There is other O&G infrastructure in the Gippsland Basin that is managed by other operators.
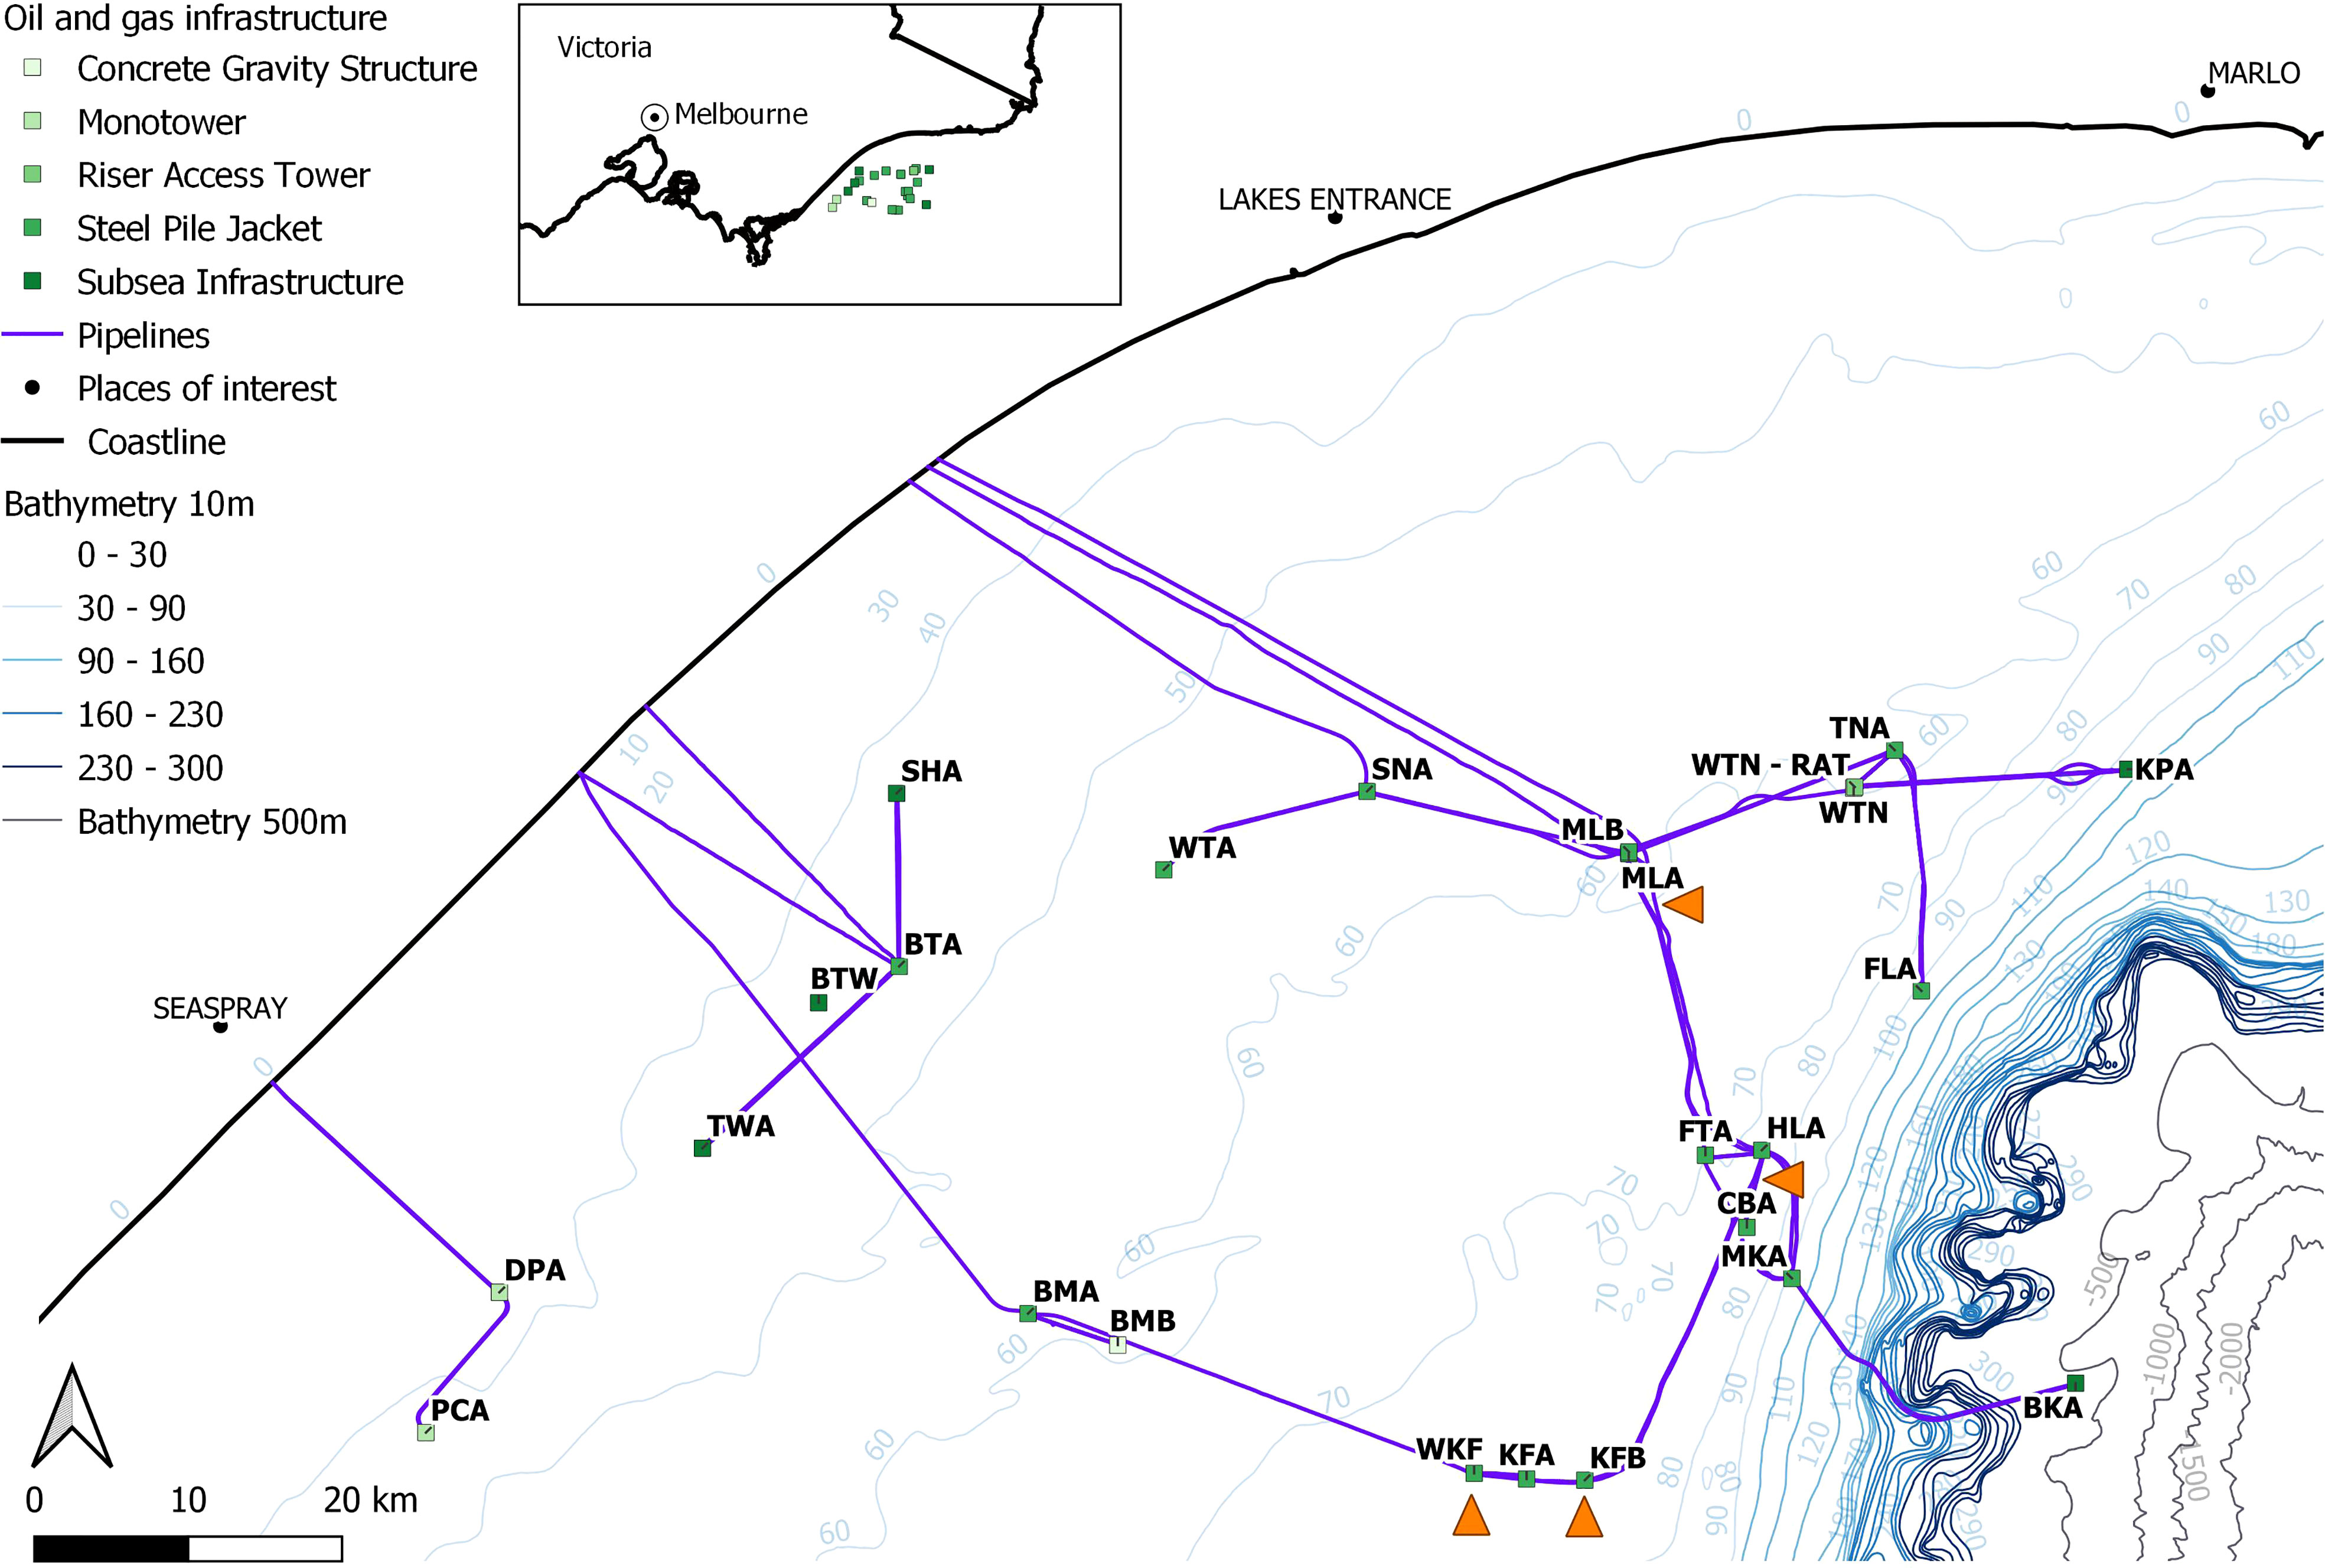
Figure 1 Map of Esso Australia Resources Pty Ltd (EARPL)-operated oil and gas structures in the Gippsland Basin of the Bass Strait region, south-east Australia. An inset map shows the location of the structures along the coastline east of Melbourne in the state of Victoria. Each platform is identified with the structure type. The platforms and pipelines included in this study are indicated by the orange triangles. Map created in QGIS.
To provide a marine ecological context, we also requested commercial fishing data for the region from the same period (2008-2018). The Australian Fisheries Management Authority (AFMA) collects information on species retained and discarded from all Commonwealth commercial fishing vessels as part of the agreement to participate in those fisheries. This information, compiled across multiple years, was used to describe fleet-wide fishing behaviors, including the composition of target species going to local markets and the spatial distribution of fishing effort in areas neighboring the O&G infrastructure. Australia’s Commonwealth fisheries integrate data collection and adaptive management practices (Commonwealth Scientific and Industrial Research Organisation (CSIRO), 2014; Fisheries Research and Development Corporation (FRDC), 2020), however, there are few sources of fishery-independent data.
The Australian Fisheries Management Authority provided reported data from 1 January 2008-31 December 2018 covering the area between latitudes 147.210255 to 148.703841°S and longitudes 37.782502 to 38.650937°E. This created an area around the offshore structures to help understand the spatial distribution and intensity of localised fishing effort. Commonwealth fisheries operate outside of state waters (3 nm from the coastline). Data included the date, location, participating fishery and retained and discarded catch expressed in estimated kilograms (kg) by species or species group. Taxa are reported as a species or lowest grouping, which can vary from phyla (e.g., sponges, Phylum Porifera), family (e.g., flatheads, Platycephalidae), and order (e.g., squids, Order Teuthoidea). Reports are submitted after each trip and this information contributes to fisheries management (Australian Fisheries Management Authority (AFMA), 2022).
Fishing data was checked for quality and individual species were allocated to family for some comparisons. We then analyzed the reported catch information to understand the intensity and distribution of fishing effort around the O&G structures.
Cumulative retained and discarded catch was summed annually to understand the intensity of fishing effort over the ten-year period. The retained catch over ten years was summed for the 12 most abundantly caught families. Cumulative catch of the most important 30 fishery species or species groups was also summarized.
Spatial distribution of fishing effort was mapped by the six participating fisheries with heat maps presenting the areas of greatest to lowest retained catch. To represent the fishing activities fairly precisely, each pixel represented an area 500 m x 500 m with a radius for the quartic kernel density estimate of 1000 m. Maps were created in QGIS (QGIS.org, 2022).
We screened imagery of many offshore assets to determine the quality and coverage of existing videos obtained between 2008 – 2018 to describe marine communities in the Bass Strait region. The assessment first established the utility of historical industry-collected ROV video and was used to inform the planning of future marine ecological surveys to address knowledge gaps, re-visit areas of interest, and/or refine ROV surveys for collection of more quantitative scientific information (e.g., McLean et al., 2019). Through this screening process we identified specific assets with good imagery coverage and quality for further assessment. We focused on two platforms (steel pile jackets) located in similar depths and distances from shore (West Kingfish-WKF and Kingfish B-KFB), and two pipelines (CBA300 and MLA100). These structures were selected from other platforms and pipelines for having better quality ROV imagery and more comprehensive coverage of each structure. Since industry ROVs were not collecting data with ecological sampling design in mind, there were some limitations to more robust sampling with the available imagery. For instance, video quality differed between years, not all structures and pipelines were sampled every year, and ROV swim distances from structures and pipelines varied considerably, altering species composition visible from the imagery (more details in imagery selection below).
Two steel pile jackets, West Kingfish (WKF) and Kingfish B (KFB), are platforms similar in position (water depth and location). KFB became operational in November 1971 and WKF in December 1982. As such, they were 46 and 36 years of age at the time of ROV survey (2015 imagery for KFB and 2017 imagery for WKF). Both platforms are lit at night with a 500-m exclusion zone to all ships as a minimum safety precaution (Kashubsky and Morrison, 2013). KFB is located in 78 m and WKF in 76 m of water depth. The structures are connected with Kingfish A in between, with WKF slightly further inshore (72 km) and KFB further offshore (78 km from shore, Figure 1). Both platforms supply crude oil but have some differences in construction. Both structures are eight-legged steel pile jackets. WKF is wider and the sub-structure weighs approximately 6955 tonnes with 32 well-conductors and KFB’s sub-structure weighs about 4309 tonnes with 21 well-conductors. KFB is asymmetrical in configuration with a strut than spans the height of the structure from a few meters below the surface to the mudline.
The two subsea pipelines included “CBA300”, which extends from the Cobia platform to the Halibut platform for a total length of 5.5 km, and “MLA100”, which runs between the Marlin and Mackerel platforms and is 32 km long. CBA300 currently holds inhibited seawater with an outside diameter of 324 mm and 12.7 mm thickness. MLA100 has an outside diameter of 114.3 mm and 12.7 mm thickness and currently transports gas. The two pipelines run perpendicular to each other, with CBA300 following a single depth contour (73 to 78 m), while MLA100 extends across a depth gradient from 60 to 93 m. At the time of the ROV surveys of these structures, both had been installed for a similar amount of time (32 years for CBA300 and 33 years for MLA100).
Hard drives containing a combined 4.9 TB of ROV videos and associated metadata were provided by Esso Australia, documenting pipeline and platform ROV activities over a ten-year period (2008-2018). These activities included visual inspections, maintenance activities and free-span inspections. Videos were assessed using methods described in McLean et al. (2020a), which scored the suitability of imagery for facilitating ecological assessments of marine communities. Videos were discarded from further analysis if the field of view was restricted by equipment or the ROV activity was focused on a specific, small area. As ROVs operate 24-hours a day, imagery is collected at night and during the day. Typically, scientific studies only utilize day-time imagery as very different communities can be present at night, and ROV lighting can influence marine life present (Bond et al., 2018a). Day-time ROV imagery (between 730 – 1500 hours) of KFB and WKF was analyzed to quantify marine life across their full depth. This opportunistic imagery was collected for industry purposes rather than a planned scientific survey, so video replicates spanned different years and seasons (8 – 25 Oct 2015, austral spring, for KFB vs. 25 Apr – 5 Jun 2017, autumn to winter, for WKF). Both platforms were operational at the time the ROV imagery was collected
To test for the influence of depth on marine communities, we divided each jacket into five water column depth bands (0 – 15, 15 – 30, 30 – 45, 45 – 60, > 60 m; Supplementary Figure 1) covering the underwater span of these structures. A selection of five to seven replicate videos was then used to survey marine life associated with each of these depth bands at both platforms (Supplementary Table 1). Videos ranged in length from 1 to 21 minutes with those selected for analysis having good visibility, a field of view adequate for counting fish and benthos, and slow movement of the ROV.
A total of 4.28 hours of ROV imagery were suitable for the study (2.1 hours for KFB and 2.18 for WKF) and used to estimate: 1) relative abundance of associated marine fauna (fish, mobile invertebrates and mammals), and 2) percent cover of benthic/encrusting groups growing on the underwater structures. To supplement species diversity estimates, and obtain the best possible images for habitat analyses, we further viewed 26.8 hours of ROV imagery at high speed (x 2) to identify extra species that were not present in selected replicates, and took still images where appropriate for benthos identification.
Industry-collected ROV imagery for the CBA300 and MLA100 pipelines was analyzed for a quantitative assessment of marine life (fish, invertebrates and benthic communities). Imagery was collected during 2014, when both pipelines were operational, and a continuous visual inspection was conducted on sections of each pipeline. Imagery consisted of a single central view of the pipeline. A subset of this imagery recorded between 730 – 1500 hours was selected, to minimize the influence of time of day on assessments of marine life. Based on this selected time range, an approximate 1.8 km total length of imagery was available for analysis (from 0.7 to 1 KP and 4.3 to 5.2 KP for CBA300, and from 0.04 to 2 KP for MLA100). KP stands for kilometer point and provides a location (distance) along each pipeline. These pipeline sections were located in depths of 65 to 73.5 m for CBA300 (KP4.3 to 5.2) and in depths of 63.5 to 71.4 m for MLA100 (0.04 to 2 KP). The imagery was collected in March 2014 for CBA300 and April 2014 for MLA100.
Selected imagery was examined for all fish and invertebrates encountered along 50 m transects, separated from a subsequent transect by a 10 m gap. Transect and pipeline distances were defined using georeferenced KP information presented in real time. A total of 31 x 50 m transects were analyzed for each pipeline, with every fish and invertebrate encountered recorded. Observations were made along the pipeline and immediately adjacent to the pipeline to a distance of ~2 m on either side.
Analysis of ROV imagery to quantify marine fauna was conducted in EventMeasure™ Stereo (SeaGIS, 2021a) aided with reference literature for the region (Edgar, 1997; Jones and Morgan, 2002; Gomon et al., 2008; Gowlett-Holmes, 2008; Wilson et al., 2010; Bray and Gomon, 2021). Each ROV video was treated as an independent sample, with the aim of getting comparable estimates of species richness and relative abundance. All fish, mobile invertebrates (e.g., crustaceans, squids, octopus) and mammals observed were recorded to the lowest taxonomic level possible. In several cases, species could not be identified reliably to species level due to either low video quality, low visibility, or ROV swimming patterns (high speed, too close or too far from the structure). These species were recorded to genus or family level where possible (e.g., Lepidotrigla spp., gurnards, Trachurus spp., jack mackerels).
Relative abundance of all recorded fish, mobile invertebrates and mammals was estimated using MaxN, a relative and conservative measure of abundance that counts only the maximum number of individuals observed at a single video frame during each video sample (Ellis and DeMartini, 1995; Willis and Babcock, 2000). By using MaxN, possible recounting of individuals of the same species at each replicate was avoided.
To test for differences in benthic biota throughout the platform, ten opportunistic quadrats were obtained at each depth band (0 – 15, 15 – 30, 30 – 45, 45 – 60, > 60 m) by taking images with the best visibility of the biota from ROV imagery. As the diameter of the horizontal, diagonal, and vertical piles of the jacket varied, benthic quadrats were 0.25 – 1 m2 estimated based on detailed platform schematics showing the diameter of each component.
Quadrats were analyzed using TransectMeasure™ software (SeaGIS, 2021b), to assess benthic cover according to modified CATAMI categories (Collaborative and Annotation Tools for Analysis of Marine Imagery; Althaus et al., 2015). For each quadrat, 25 points were randomly allocated on the image, and benthos directly underneath the point was identified to biota categories (e.g., macroalgae, sponges, ascidians, zoanthids) and morphological characteristics (e.g., encrusting, complex or taller erect forms). For each quadrat, a measure of habitat complexity was also recorded by estimating epibenthic height according to four categories: 0: negligible; 1: low (0 – 20 cm); 2: medium (20 – 40 cm); and 3: high (> 40 cm). We used the diameter of columns and other structural elements from available platform schematics as a relative scale for these estimates. Ten quadrats of 25 random points in five depth categories resulted in 1250 data points for each platform. Similar methods have been used in other O&G studies (e.g., Thomson et al., 2018).
For each 50 m transect, measurements of “pipeline position” (0 to 4; completely buried to having a gap > 0.5 m) and “epibenthic height” (0 to 3; negligible to high > 40 cm; Figure 2) were taken along five points (0, 10, 20, 30 and 40 m).
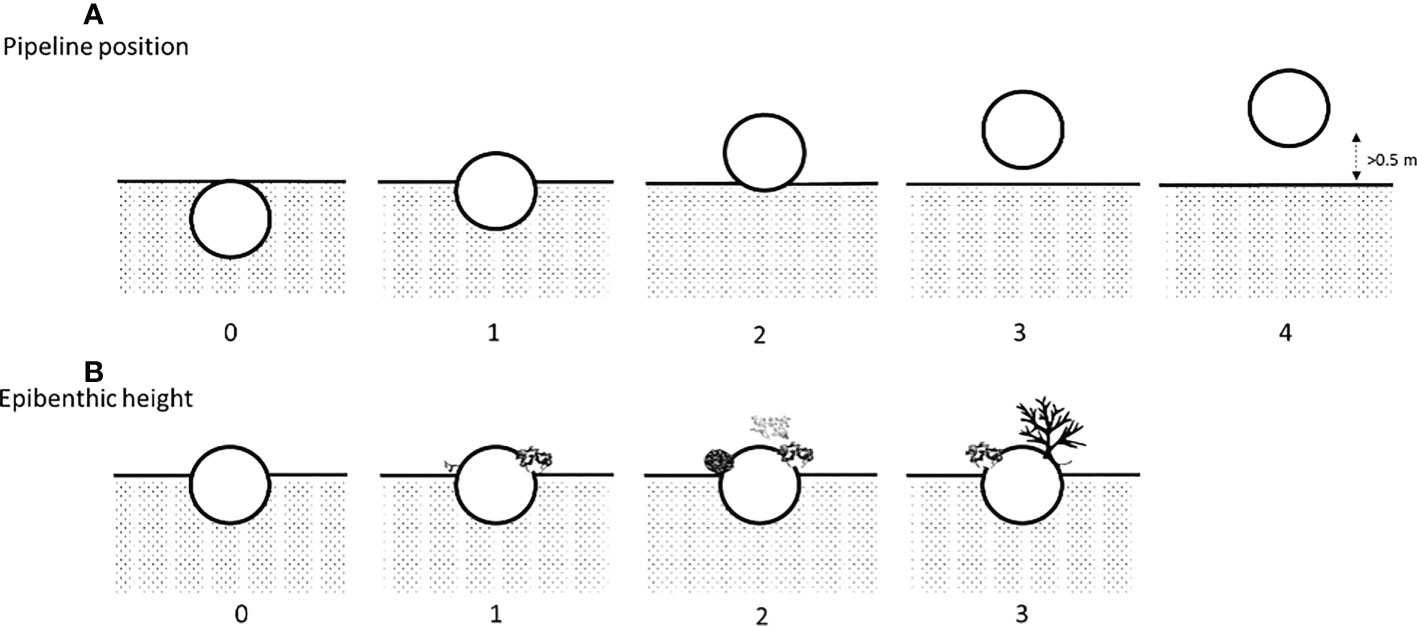
Figure 2 (A) Method of assessing pipeline position with 0: buried; 1: more than half buried; 2: resting on the seafloor; 3: span< 0.5 m; and 4: span > 0.5 m and (B) epibenthic height with 0: negligible; 1: low (0 – 20 cm); 2: medium (20 – 40 cm); and 3: high (> 40 cm). A version of this figure has previously been published in McLean et al., 2020b.
Benthic composition along each pipeline was assessed using TransectMeasure by analyzing a virtual quadrat of about 4 m2 (~150 cm x ~270 cm, depending on ROV altitude) placed on a freeze-framed image taken every 60 m along each pipeline (one per 50 m transect). Within each quadrat, 20 random points were allocated and the benthos under each point was identified to the lowest taxonomic resolution possible. This classification resulted in fourteen broad categories based on a modified CATAMI guide (Collaborative and Annotation Tools for Analysis of Marine Imagery; Althaus et al., 2015), which included biotic and abiotic components: ascidian, biofilm, calcareous, dead shell, encrusting, hydrozoa, macroalgae, rubble, sand, shells, soft coral, sponge, turf and other. The position of each random point in the allocated quadrat was recorded as either “on” or “off” the pipeline. Descriptions of benthic biota on the pipeline used just the points “on” the pipeline, whereas all habitat points (on and off pipeline) were used for assessment of relationships between benthic biota and fish species richness and relative abundance. Habitat components were grouped (for plotting) according to the most frequent biotic categories including sponges, encrusting (e.g., ascidians and biofilm), other (e.g., macroalgae, hydroids) and the abiotic categories of dead shell, sand and rubble.
All data were exported from EventMeasure and TransectMeasure, checked, formatted, and summarized via plots using the R Language for Statistical Computing (R Core Team, 2020, v. 4.0.2), via the tidyr, dplyr (Wickham et al., 2019) and ggplot2 (Wickham, 2016) packages. Permutational Analyses of Variance (PERMANOVA) using the PRIMER-E statistical software (Clarke and Gorley, 2005) was used to investigate multivariate species richness and relative abundance data.
For multivariate abundance data, PERMANOVA analyses were performed on a Bray-Curtis similarity matrix, generated from either fourth-root (fish) or square-root (invertebrates) transformed abundance data. In the case of univariate response metrics, analyses were performed on Euclidean dissimilarity matrices constructed from untransformed total abundance and species richness data for fish and invertebrates (Anderson, 2001; Anderson and Millar, 2004). PERMANOVAs were run using a two-factor design with platform (two levels; KFB and WKF), and depth band (five levels; 0 – 15 m, 15 – 30 m, 30 – 45 m, 45 – 60 m, > 60 m) as fixed effects, 9,999 permutations, Type III sums of squares, and with the option to permutate residuals under a reduced model.
To further test for differences in fish community composition between platforms and depth bands, multivariate ordination plots via Principal Coordinates Analysis (PCO; Anderson et al., 2008) were constructed. PCO analysis was based on a Bray-Curtis similarity matrix, generated from fourth-root transformed data on individual fish species abundance. Arrows representing species with significant correlation (|R| ≥ 0.4) with the PCO axes, were then overlaid on the PCO (Anderson et al., 2008).
To test for differences in fish communities between pipelines and their relationship with benthic diversity/cover and pipeline characteristics, we used generalized additive models (GAMs; Hastie and Tibshirani, 1986). GAMs were chosen to account for the non-linear relationships between dependent and predictor variables in our models (Austin, 2007). We used a Tweedie GAM with a log-link function to model total fish abundance (MaxN) and taxonomic richness as a function of one fixed (pipeline identity; categorical with two levels), and nine continuous variables (pipeline position, epibenthic height, depth, % cover dead shell, % cover encrusting organisms, % cover other benthic organisms, % cover rubble, % cover sand and % cover sponge) (Equation 1). Eight habitat predictors were excluded because of their limited coverage (> 85% zeros; e.g., ascidians, hydrozoans). Exploratory analyses suggested kilometer point information was an important predictor of differences in fish communities along pipelines with proximity to a platform, but this variable had uneven distribution for modelling and was excluded (for example, at CBA300 imagery spanned 0.07 to 1 KP, and then 4.3 to 5.2 KP).
N (Abundance/Richness) ij ~ Tweedie (µij)
E (NAbundance ij/Richness ij) = µij
ϵ ~ N(0,σ2)
where N(Abundance/Richness)ij is the jth observation in transect i, and i= 1, …, 31, and f1 to f8 are spline based smooth functions estimated by the model (k = 3)
(Equation 1)
The Tweedie distribution was selected because it allows for responses to have a mass at zero, but otherwise continuous and positive values. This distribution also provided the best fit to our data as assessed by comparing diagnostic plots of residuals with alternative distributions (least overdispersion). We chose not to evaluate interaction terms to simplify model interpretation. All observations were independent, so there were no random intercepts.
Models were fitted using package FSSgam (Fisher et al., 2018; Goetze et al., 2018; McLean et al., 2020b). This package allows for the construction of a complete set of competing models, which are compared to determine the most plausible fitting model. Model construction was restricted to a maximum of three predictors to avoid overfitting and excluded correlated variables (R > 0.28). Selection of the most plausible model was based on a multivariate analogue of the Akaike Information Criterion corrected for small sample sizes (AICc, Anderson et al., 2008), which was used to compare models and select the most parsimonious (fewer number of predictors and within 2 AICc units of the model with the lowest AICc value). Models were further cross-validated using five-fold cross validation 50 times (Brunsdon et al., 1996; Lehmann et al., 2002), and normalized root mean square errors (normalized RMSE) calculated to assess the average magnitude of predictive errors in all sub-models (Potts and Elith, 2006). Finally, to assist model interpretation and identify the most important predictors of fish relative abundance and diversity, variable importance metrics were calculated for all GAMs, based on a weighted AICc (wAICc, Burnham and Anderson, 2002).
To compare the overlap of marine communities from ROV imagery, a Venn diagram was created for each of the two pipelines and platforms (package ggvenn, Yan, 2021). Lastly, to compare the community composition caught in fisheries with the species identified among pipelines and platform imagery, a Euler diagram was used to illustrate the proportion of overlap between communities found in the two main fisheries, pipelines and platforms. Overlapping ellipses indicated the percent shared by those structures or fishery with the area of non-overlapping sections representing the unique number of species per assemblage (package eulerr, Wilkinson, 2012; Larsson, 2021).
Six Commonwealth fisheries operated within the area from 2008-2018 (from greatest fishing effort to least): the Commonwealth Trawl Sector (CTS, 86% of the reported data), Gillnet, Hook and Trap Fishery (GHAT, 13%), Southern Squid Jig Fishery (SSJF,< 1%), Bass Strait Central Zone Scallop Fishery (BSCZSF,< 1%), High Seas Fishery (HSF,< 1%), and Small Pelagic Fishery (SPF,< 1%). Fishing gears used in this area included (in descending order, according to the percentage of reported data): Danish seine (a type of trawl fishing, 73%), bottom otter trawl (13%), set gillnet (demersal gillnet, 13%), set auto-longline (demersal longline,< 1%), set longline (demersal longline,< 1%), and squid jigs (mechanized,< 1%). Cumulative annual reported retained catch varied between 1,042,278 kg (in 2018) - 1,513,793 kg (in 2009, Figure 3). Reported discarded catch weight was a small fraction compared to retained catch (17,034 - 375,135 kg).
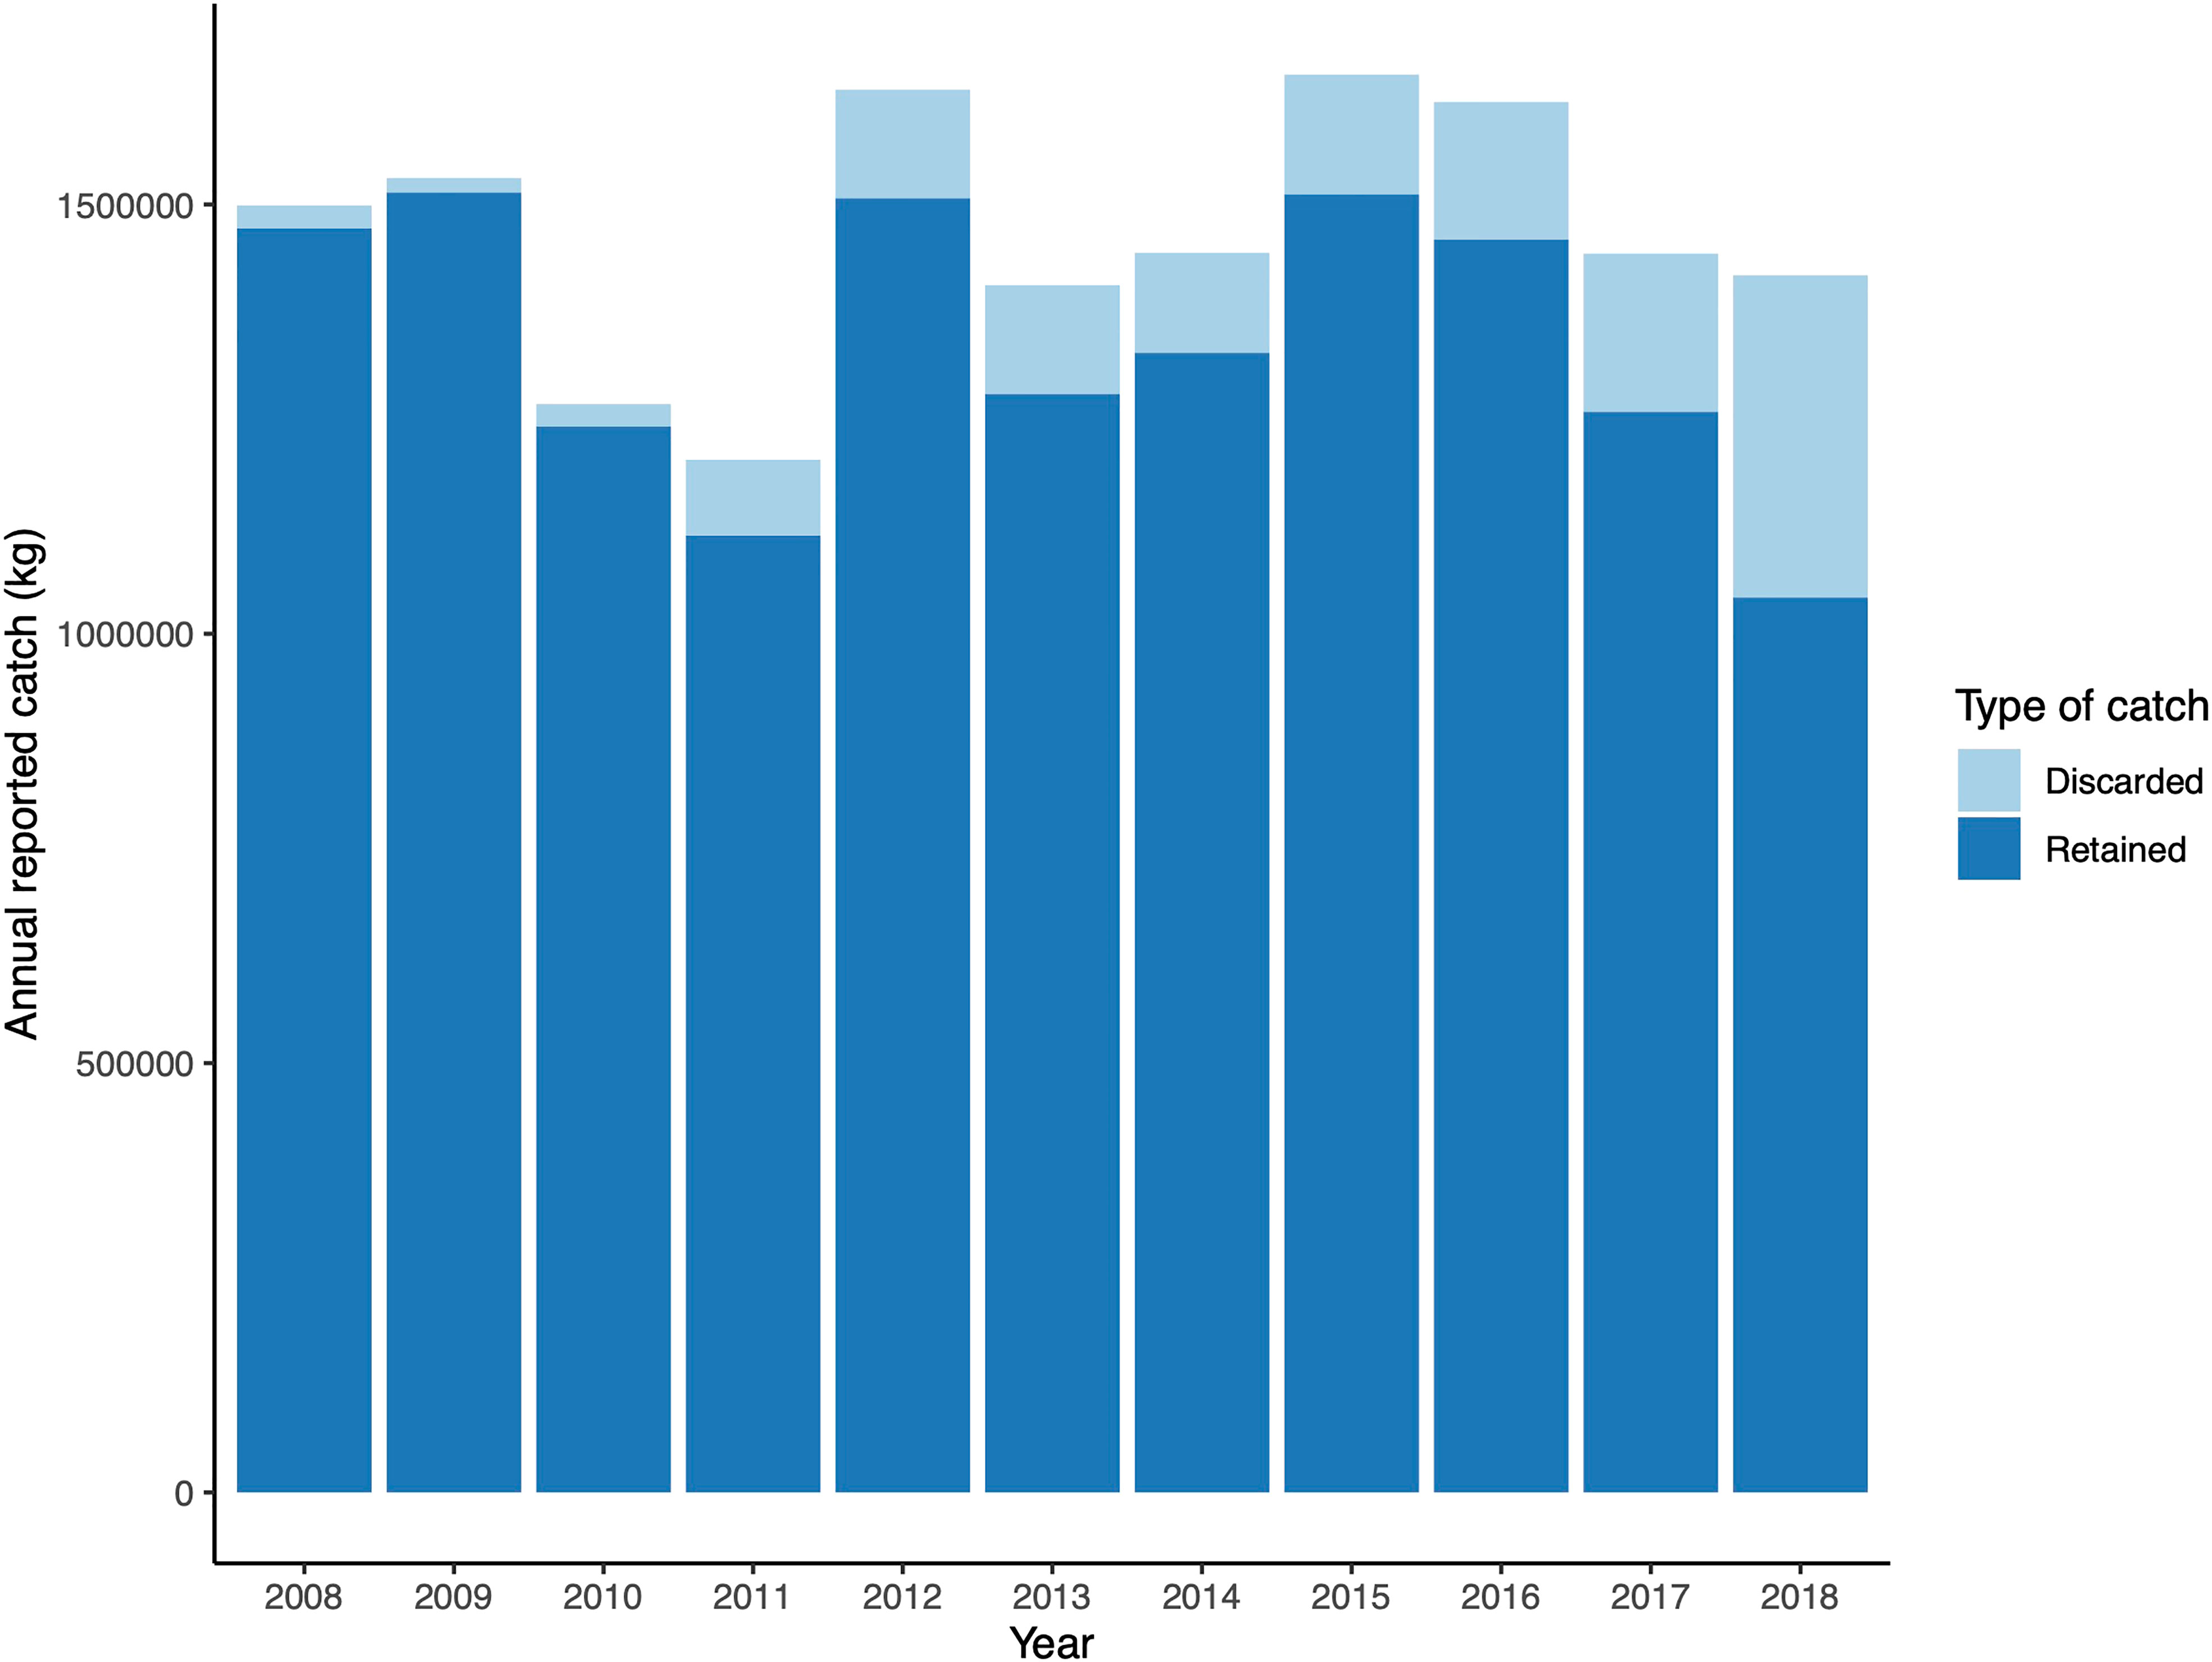
Figure 3 Retained and discarded catch data near oil and gas structures in the Bass Strait from 2008-2018.
Species composition from reported catch was quite diverse, with 248 species or species groups reported from 110 families of fishes and invertebrates. It is important to note that this is an underestimate of true species diversity as many species are reported to family or order. Ninety-nine of these species/groups were rarely caught, being reported fewer than ten times in ten years. The most frequently retained species (in terms of cumulative catch weight) were from the following families (Figure 4): Platycephalidae (flatheads), Sillaginidae (whitings), Triakidae (houndsharks), Ophidiidae (cusk-eels), Ommastrephidae (squids), Pristiophoridae (sawsharks), Centrolophidae (medusafish), Latridae (trumpeters), Pectinidae (scallop), and Octopodidae (octopus). Other commercially important families include Monacanthidae (leatherjackets), Callorhinchidae (elephantfish), Zeidae (true dories), and Mullidae (goatfishes) with all other families contributing less than 100,000 kg over the ten-year period. The category “Mixed Fish” is a frequent allocation for any species not caught in high abundance per deployment of fishing gear. This could represent any number of species caught in smaller quantities and comprised a substantial portion of the fishery catch over time.
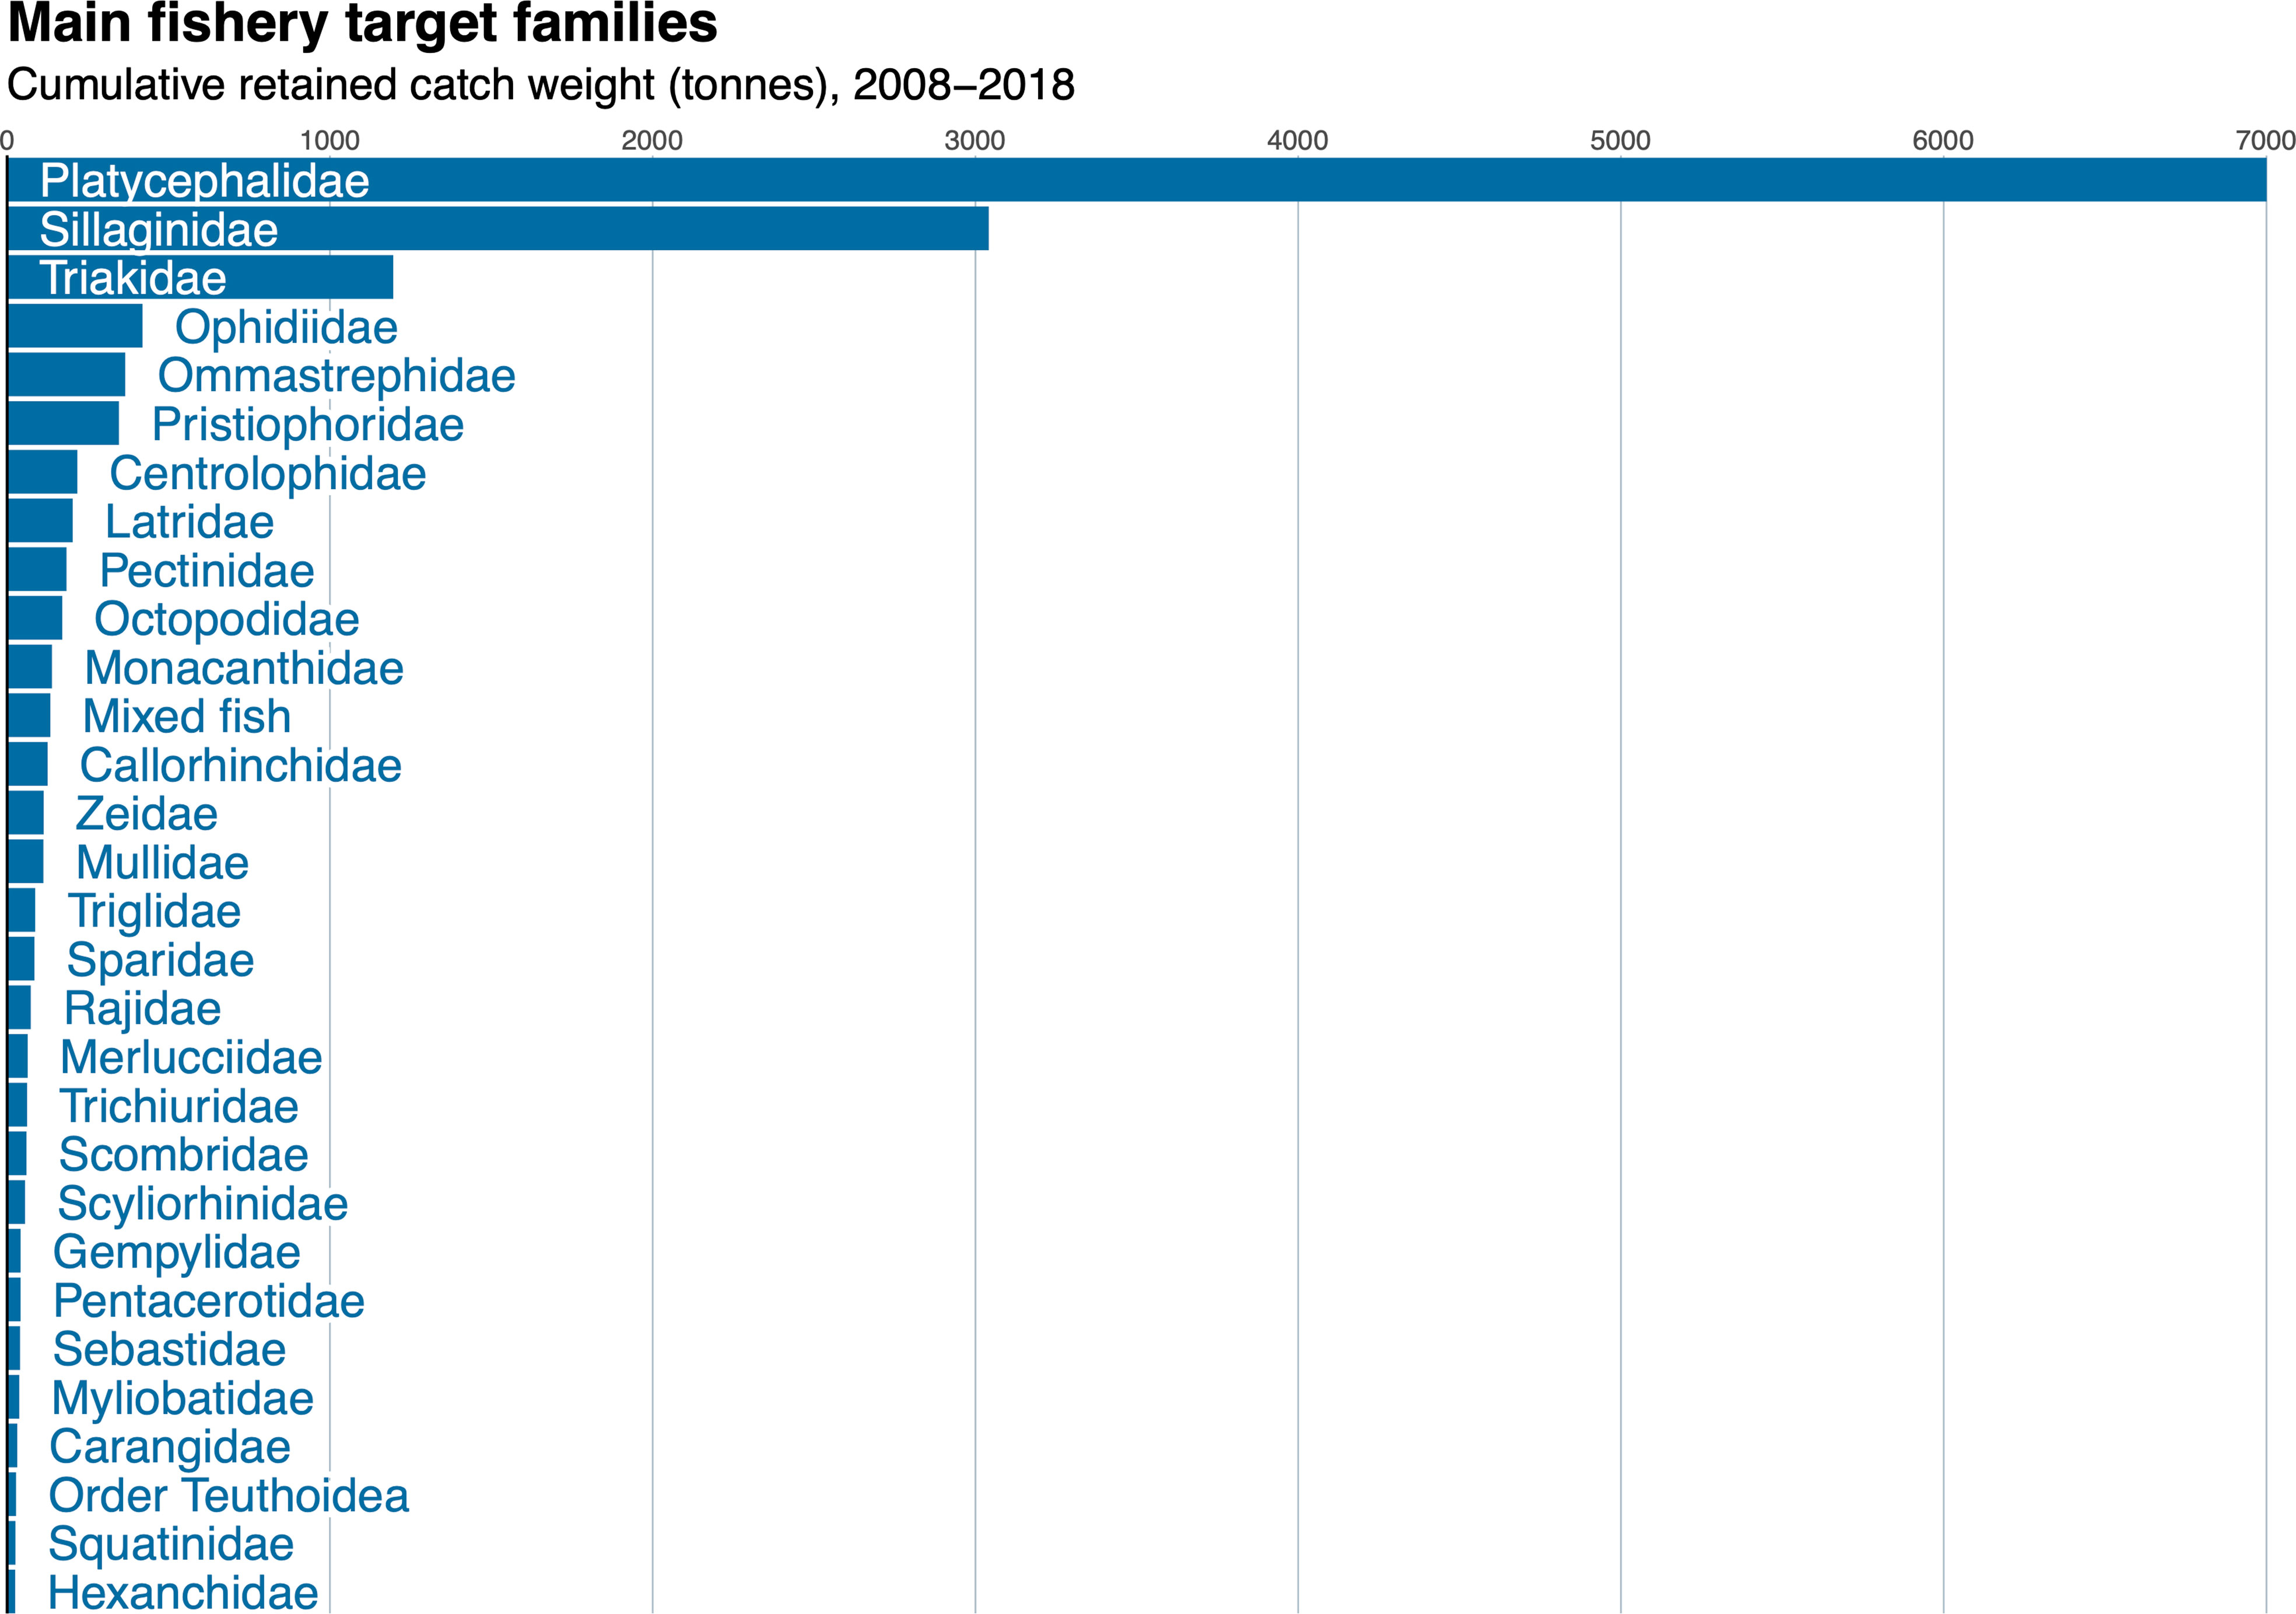
Figure 4 Cumulative fishery catch near oil and gas structures in the Bass Strait from 2008-2018 by family.
The two main fisheries operating around O&G structures were the CTS and GHAT fisheries, which are both managed as part of the Southern and Eastern Scalefish and Shark Fishery (SESSF). These fishers operated fairly ubiquitously around all O&G infrastructure and target tiger flathead, Platycephalus richardsoni, eastern school whiting, Sillago flindersi, and gummy shark, Mustelus antarcticus (Figure 5, Supplementary Figures 2, 3). The SESSF catch a diverse range of species with Danish seine, bottom otter trawl and gillnet equipment. From 2008-2018 CTS caught 183 species, with only 70 species > 1000 kg cumulatively caught. The GHAT catch included 118 species with 29 species > 1000 kg over the ten-year period.
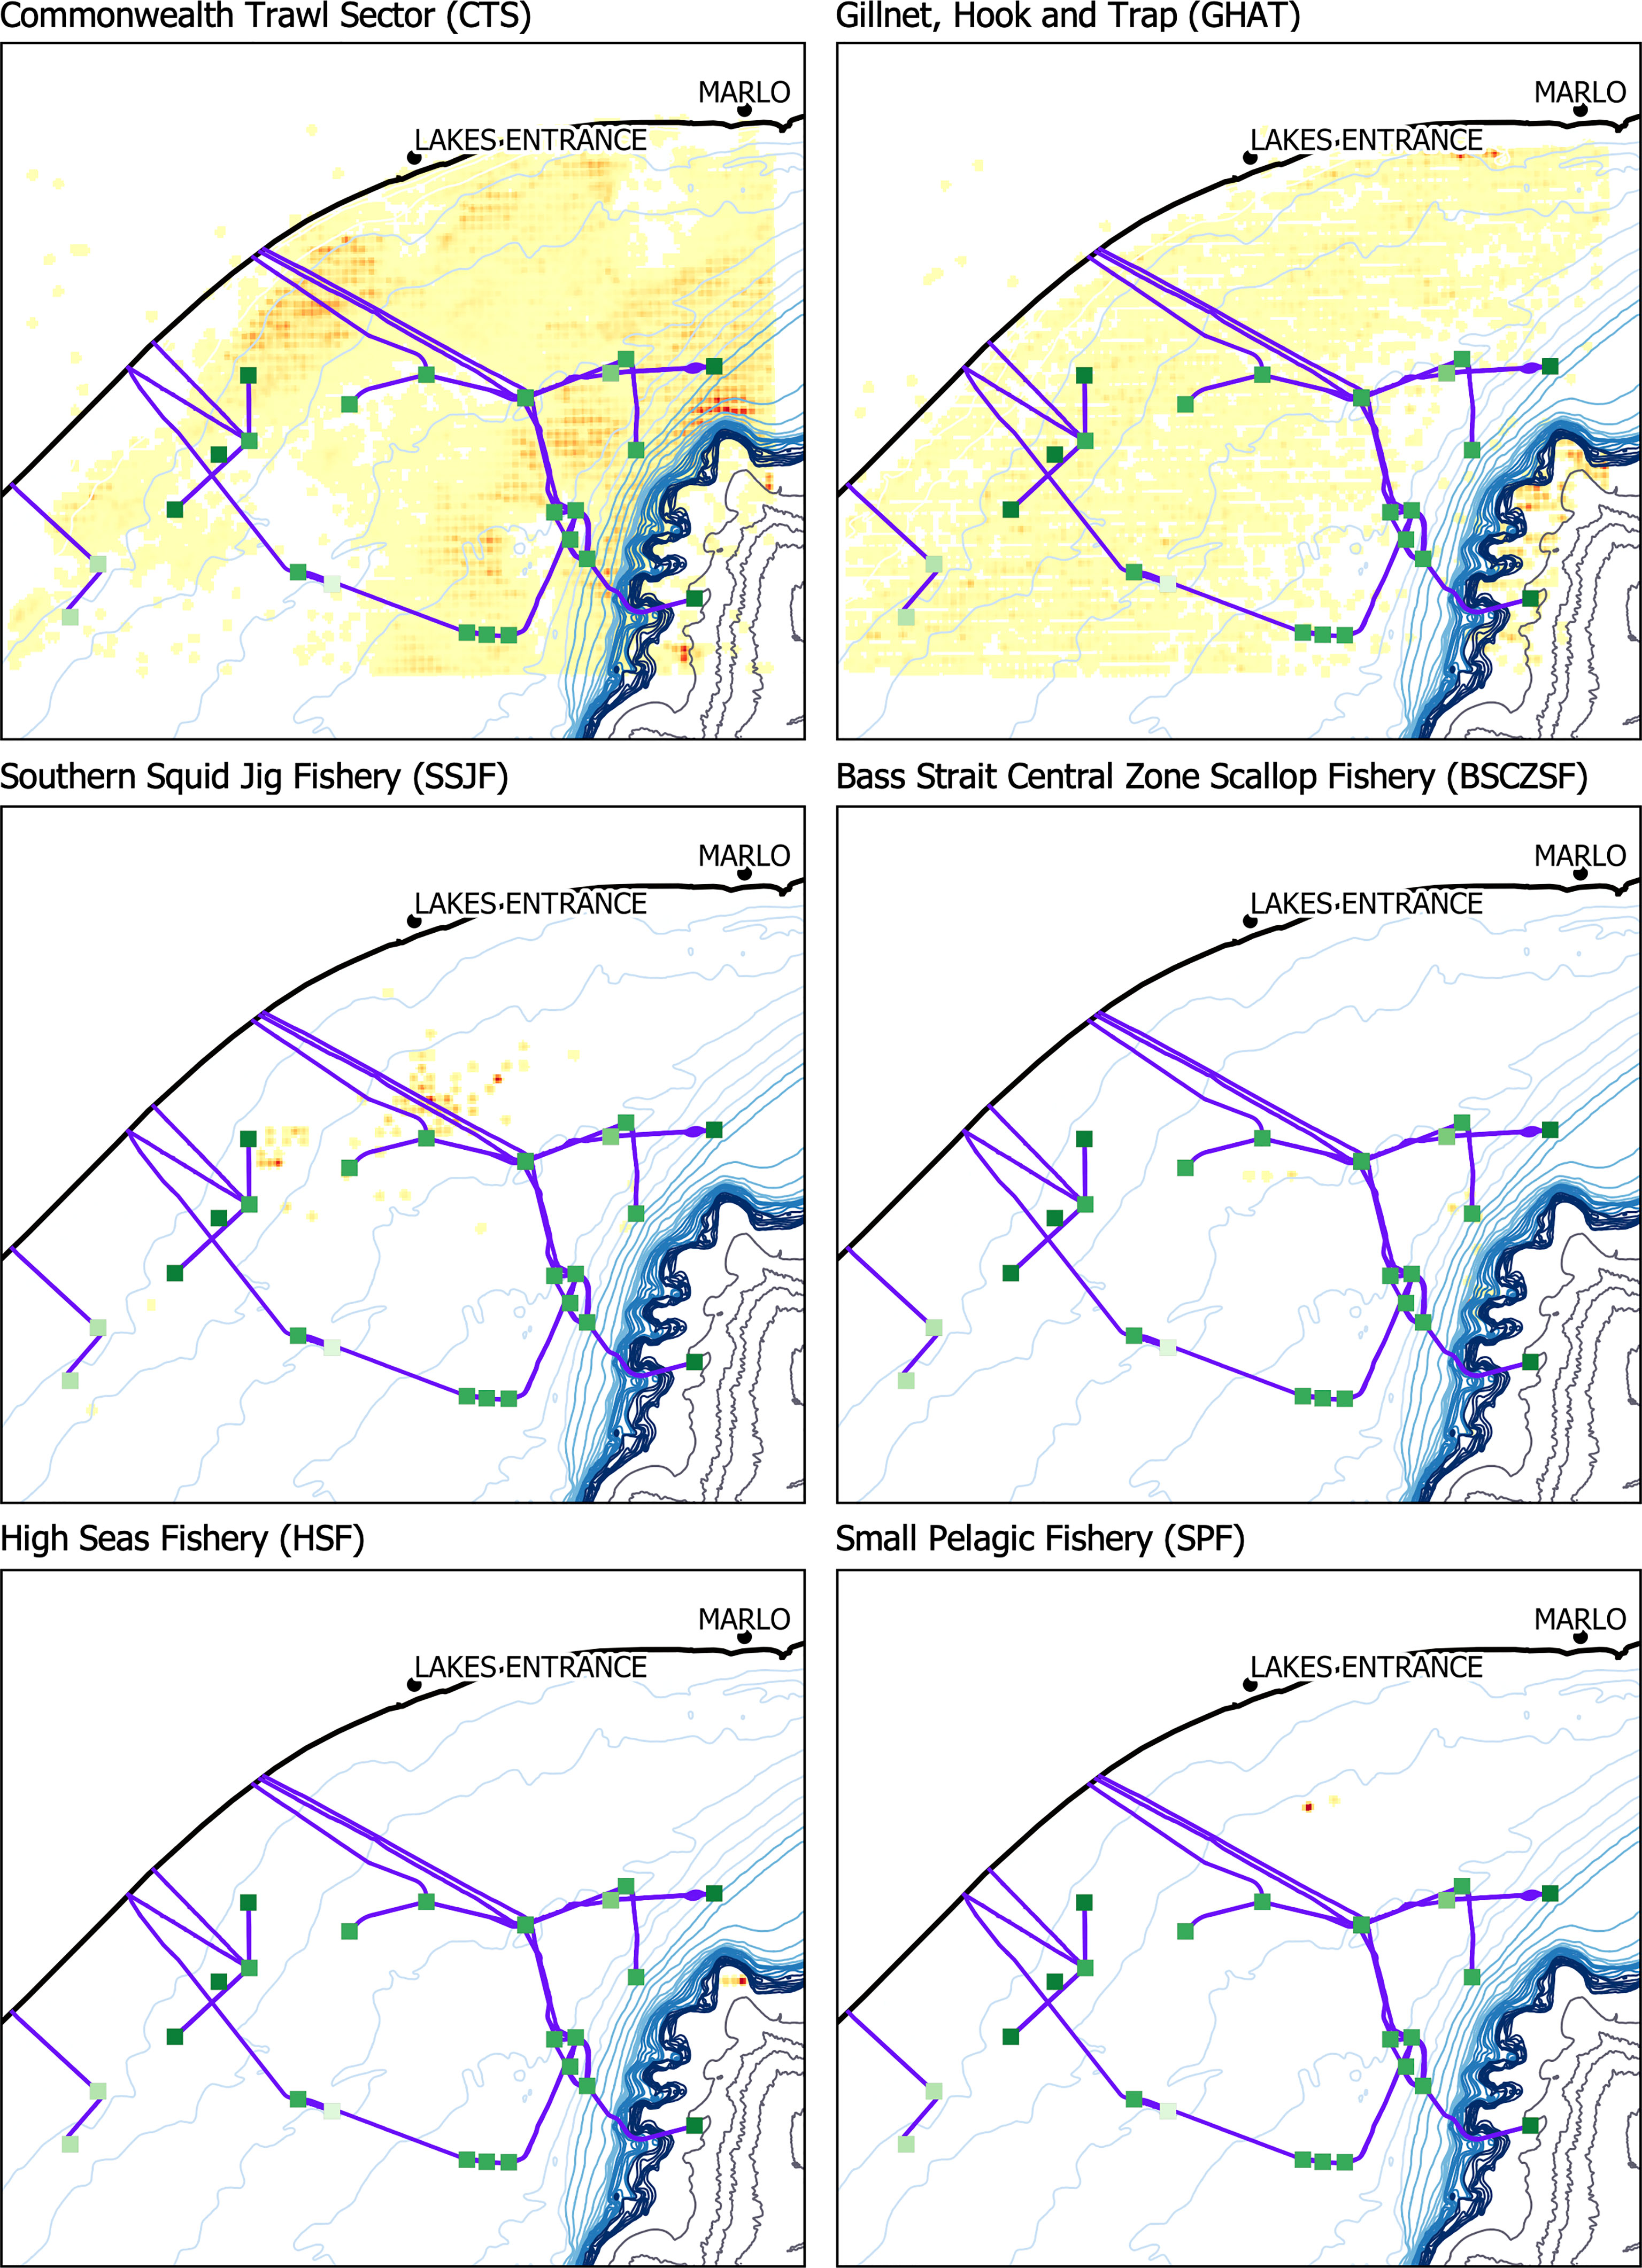
Figure 5 Spatial distribution of fishing effort for six Commonwealth fisheries among the offshore oil and gas structures in the Gippsland Basin. Maps were made in QGIS. Individual versions of these maps with accompanying legends are included in the Supplementary Materials.
The other four fisheries had limited fishing operations in this region. The BSCZSF only targets the commercial scallop, Pecten fumatus (183,885 kg) and retained a small quantity of the doughboy scallop, Mimachlamys asperrima (85 kg), which has little commercial value. The fishing effort was not spread evenly during this period with trips only in 2009, 2010, 2012, 2013 (Figure 6). The HSF only operated in a small area outside of the 300 m bathymetric contour. During three trips in 2014 and 2016, retained catch reports included only nine species, with the majority pink ling, Genypterus blacodes (6970 kg), and incidental quantities of reef ocean perch, Helicolenus percoides (62 kg), ribaldo, Mora moro (24 kg), greeneye spurdog, Squalus chloroculus, and southern dogfish, Centrophorus zeehaani (15 kg each). The SPF rarely fished in this area during the period analyzed and retained skipjack tuna, Katsuwonus pelamis (15200 kg) and common jack mackerel, Trachurus declivis (9000 kg) in only one trip in 2008. The SSJF fishing effort was concentrated around the platforms between the 40-60 m bathymetric contours, with most of the fishing effort concentrated in 2012. SSJF targets Gould’s squid, Nototodarus gouldi (116,696 kg), which is also referred to as arrow squid.
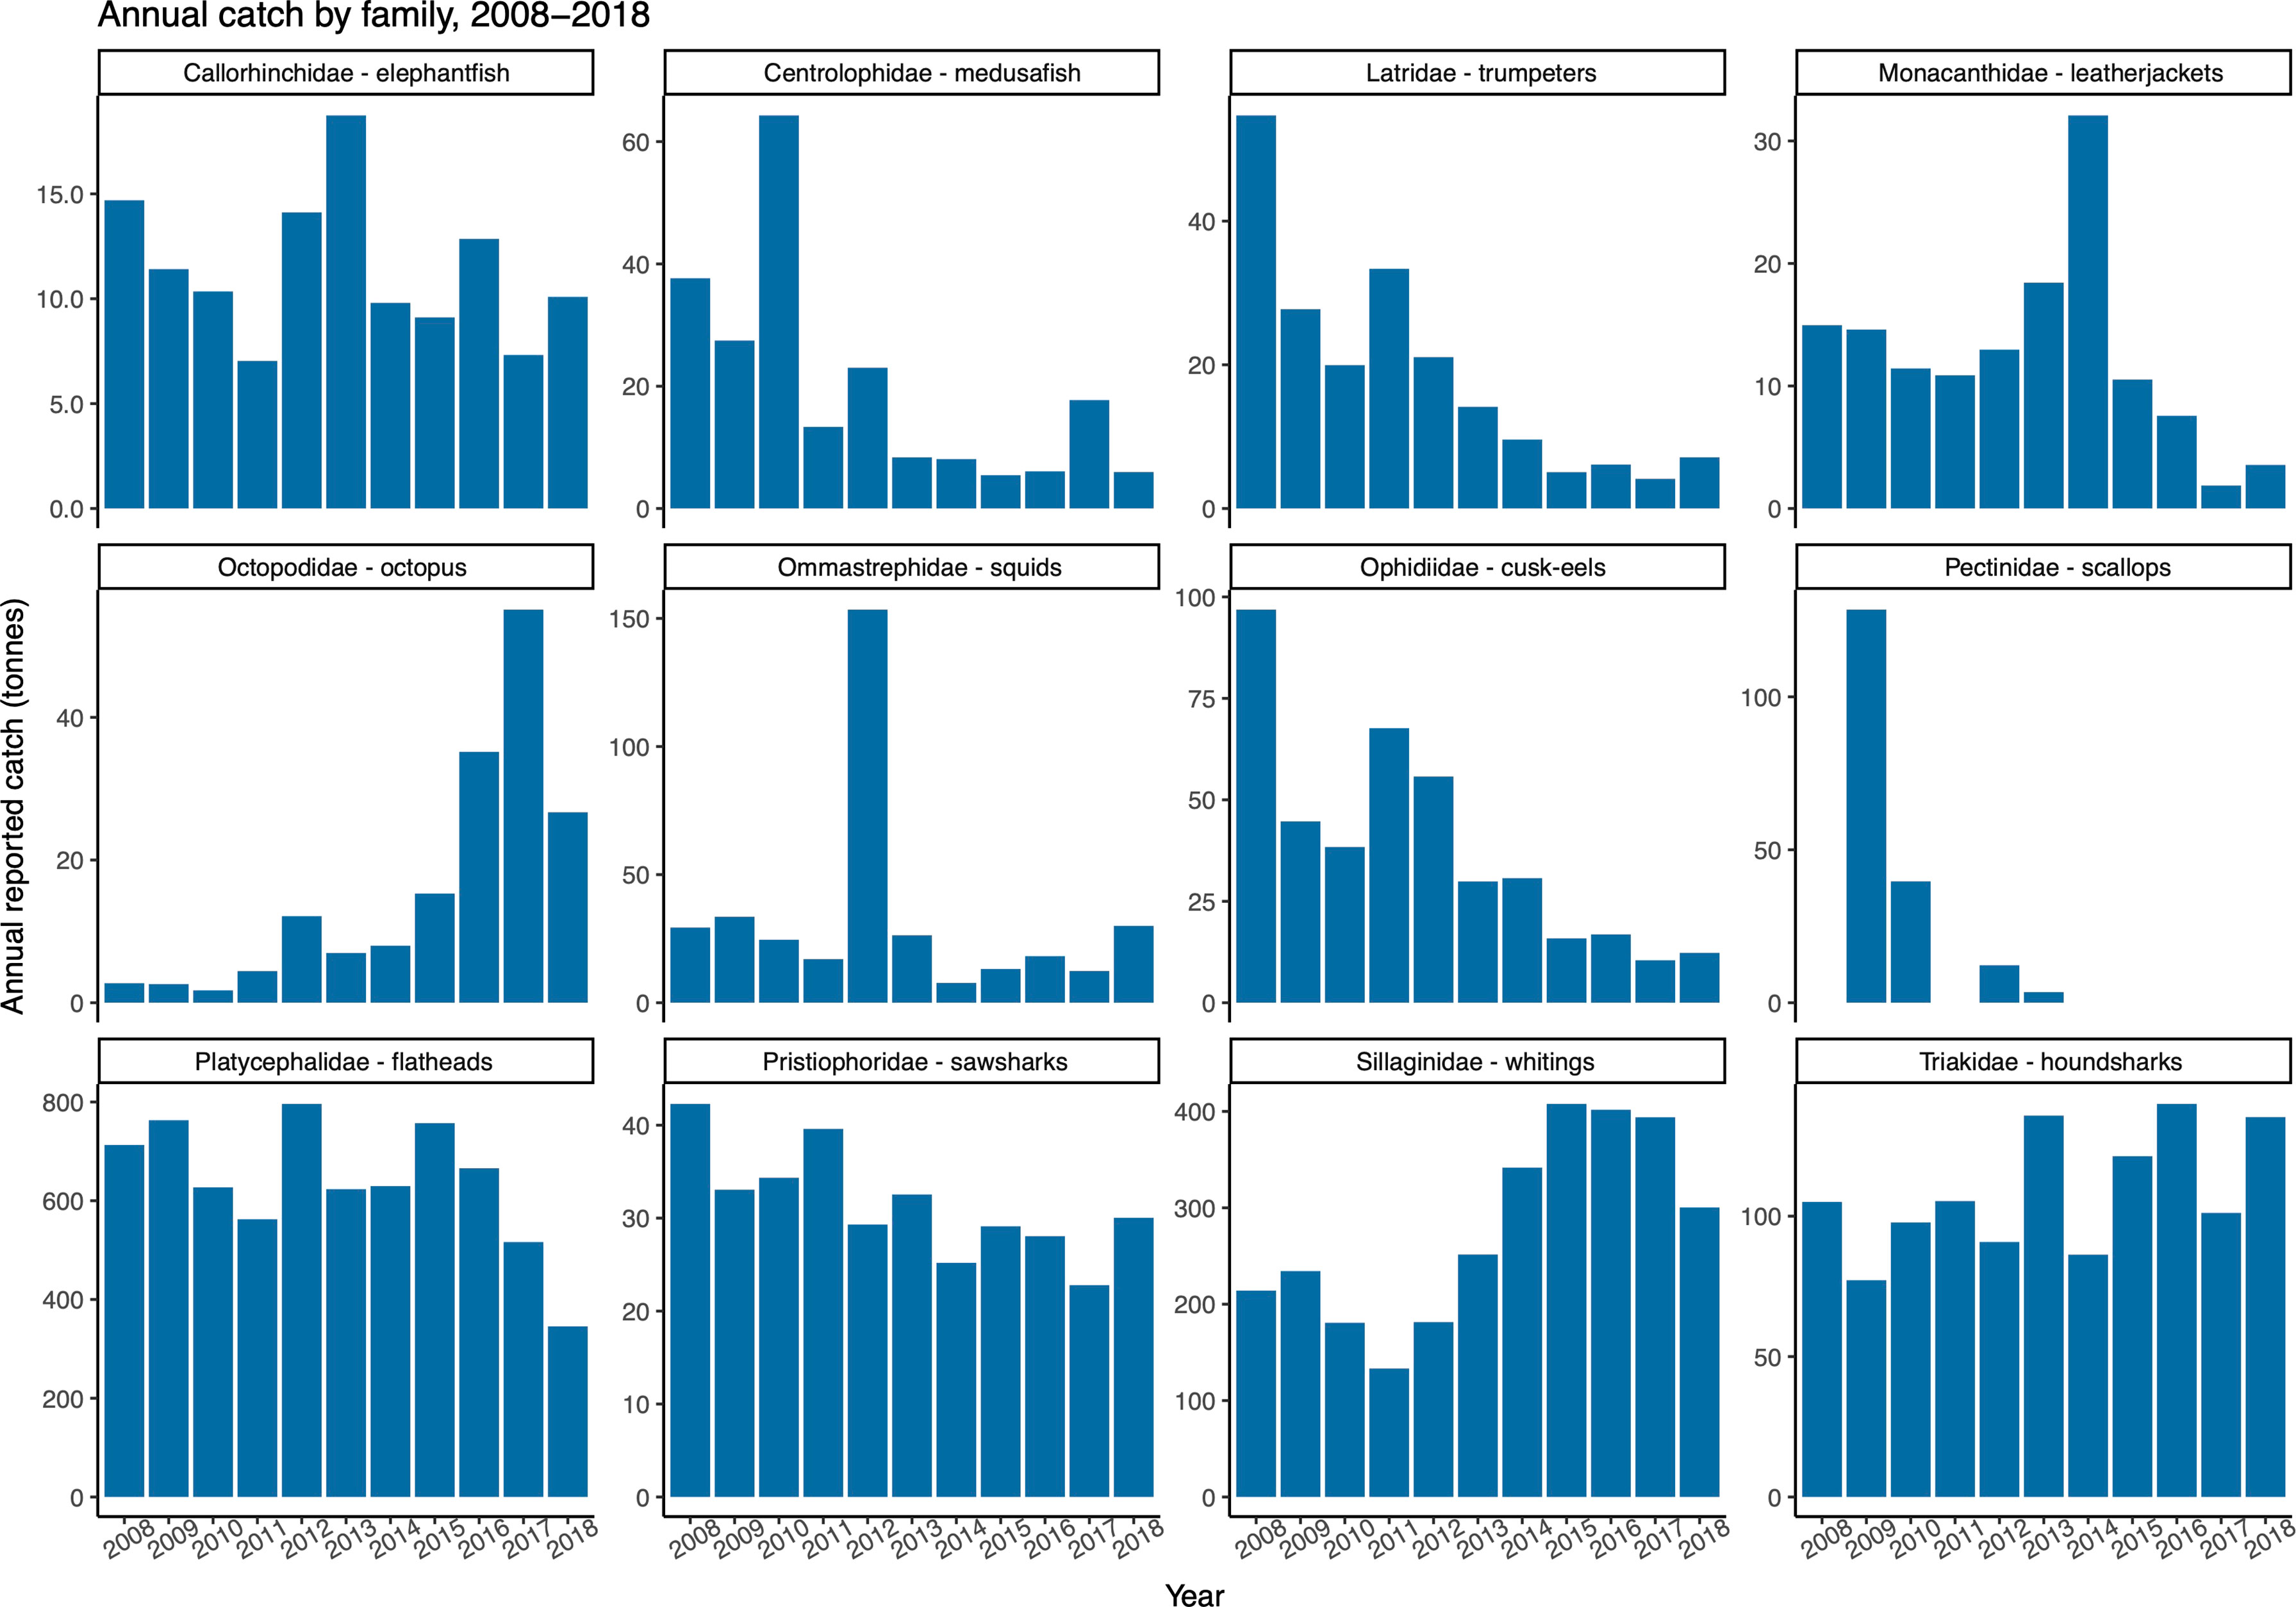
Figure 6 Annual catch of 12 families by fisheries operating near oil and gas structures 2008-2018.
From the full collection of ROV imagery from Esso Australia O&G structures, we provide a brief description of the broader marine community. Species important to State and Commonwealth fisheries that were documented in the ROV imagery included the bluespotted goatfish (in local seafood markets referred to as red mullet, Upeneichthys vlamingii), longsnout boarfish (also known as duckfish, Pentaceropsis recurvirostris), trevally (Pseudocaranx spp.), jackass morwong (Nemadactylus macropterus), elephantfish (Callorhinchus milii), pink ling (Genypterus blacodes) and the bluethroat wrasse (Notolabrus tetricus, Figure 7). Abundant species included jack mackerels (Trachurus spp.), sweeps (e.g., sea sweep, Scorpis aequipinnis), scorpionfishes (e.g., common gurnard perch, Neosebastes scorpaenoides), stinkfish (e.g., common stinkfish, Foetorepus calauropomus), and perches (e.g., butterfly perch, Caesioperca lepidoptera). Larger species (often highly mobile) included the smooth stingray (Bathytoshia brevicaudata), banded stingaree (Urolophus cruciatus), Port Jackson sharks (Heterodontus portusjacksoni), and draughtboard sharks (Cephaloscyllium laticeps).
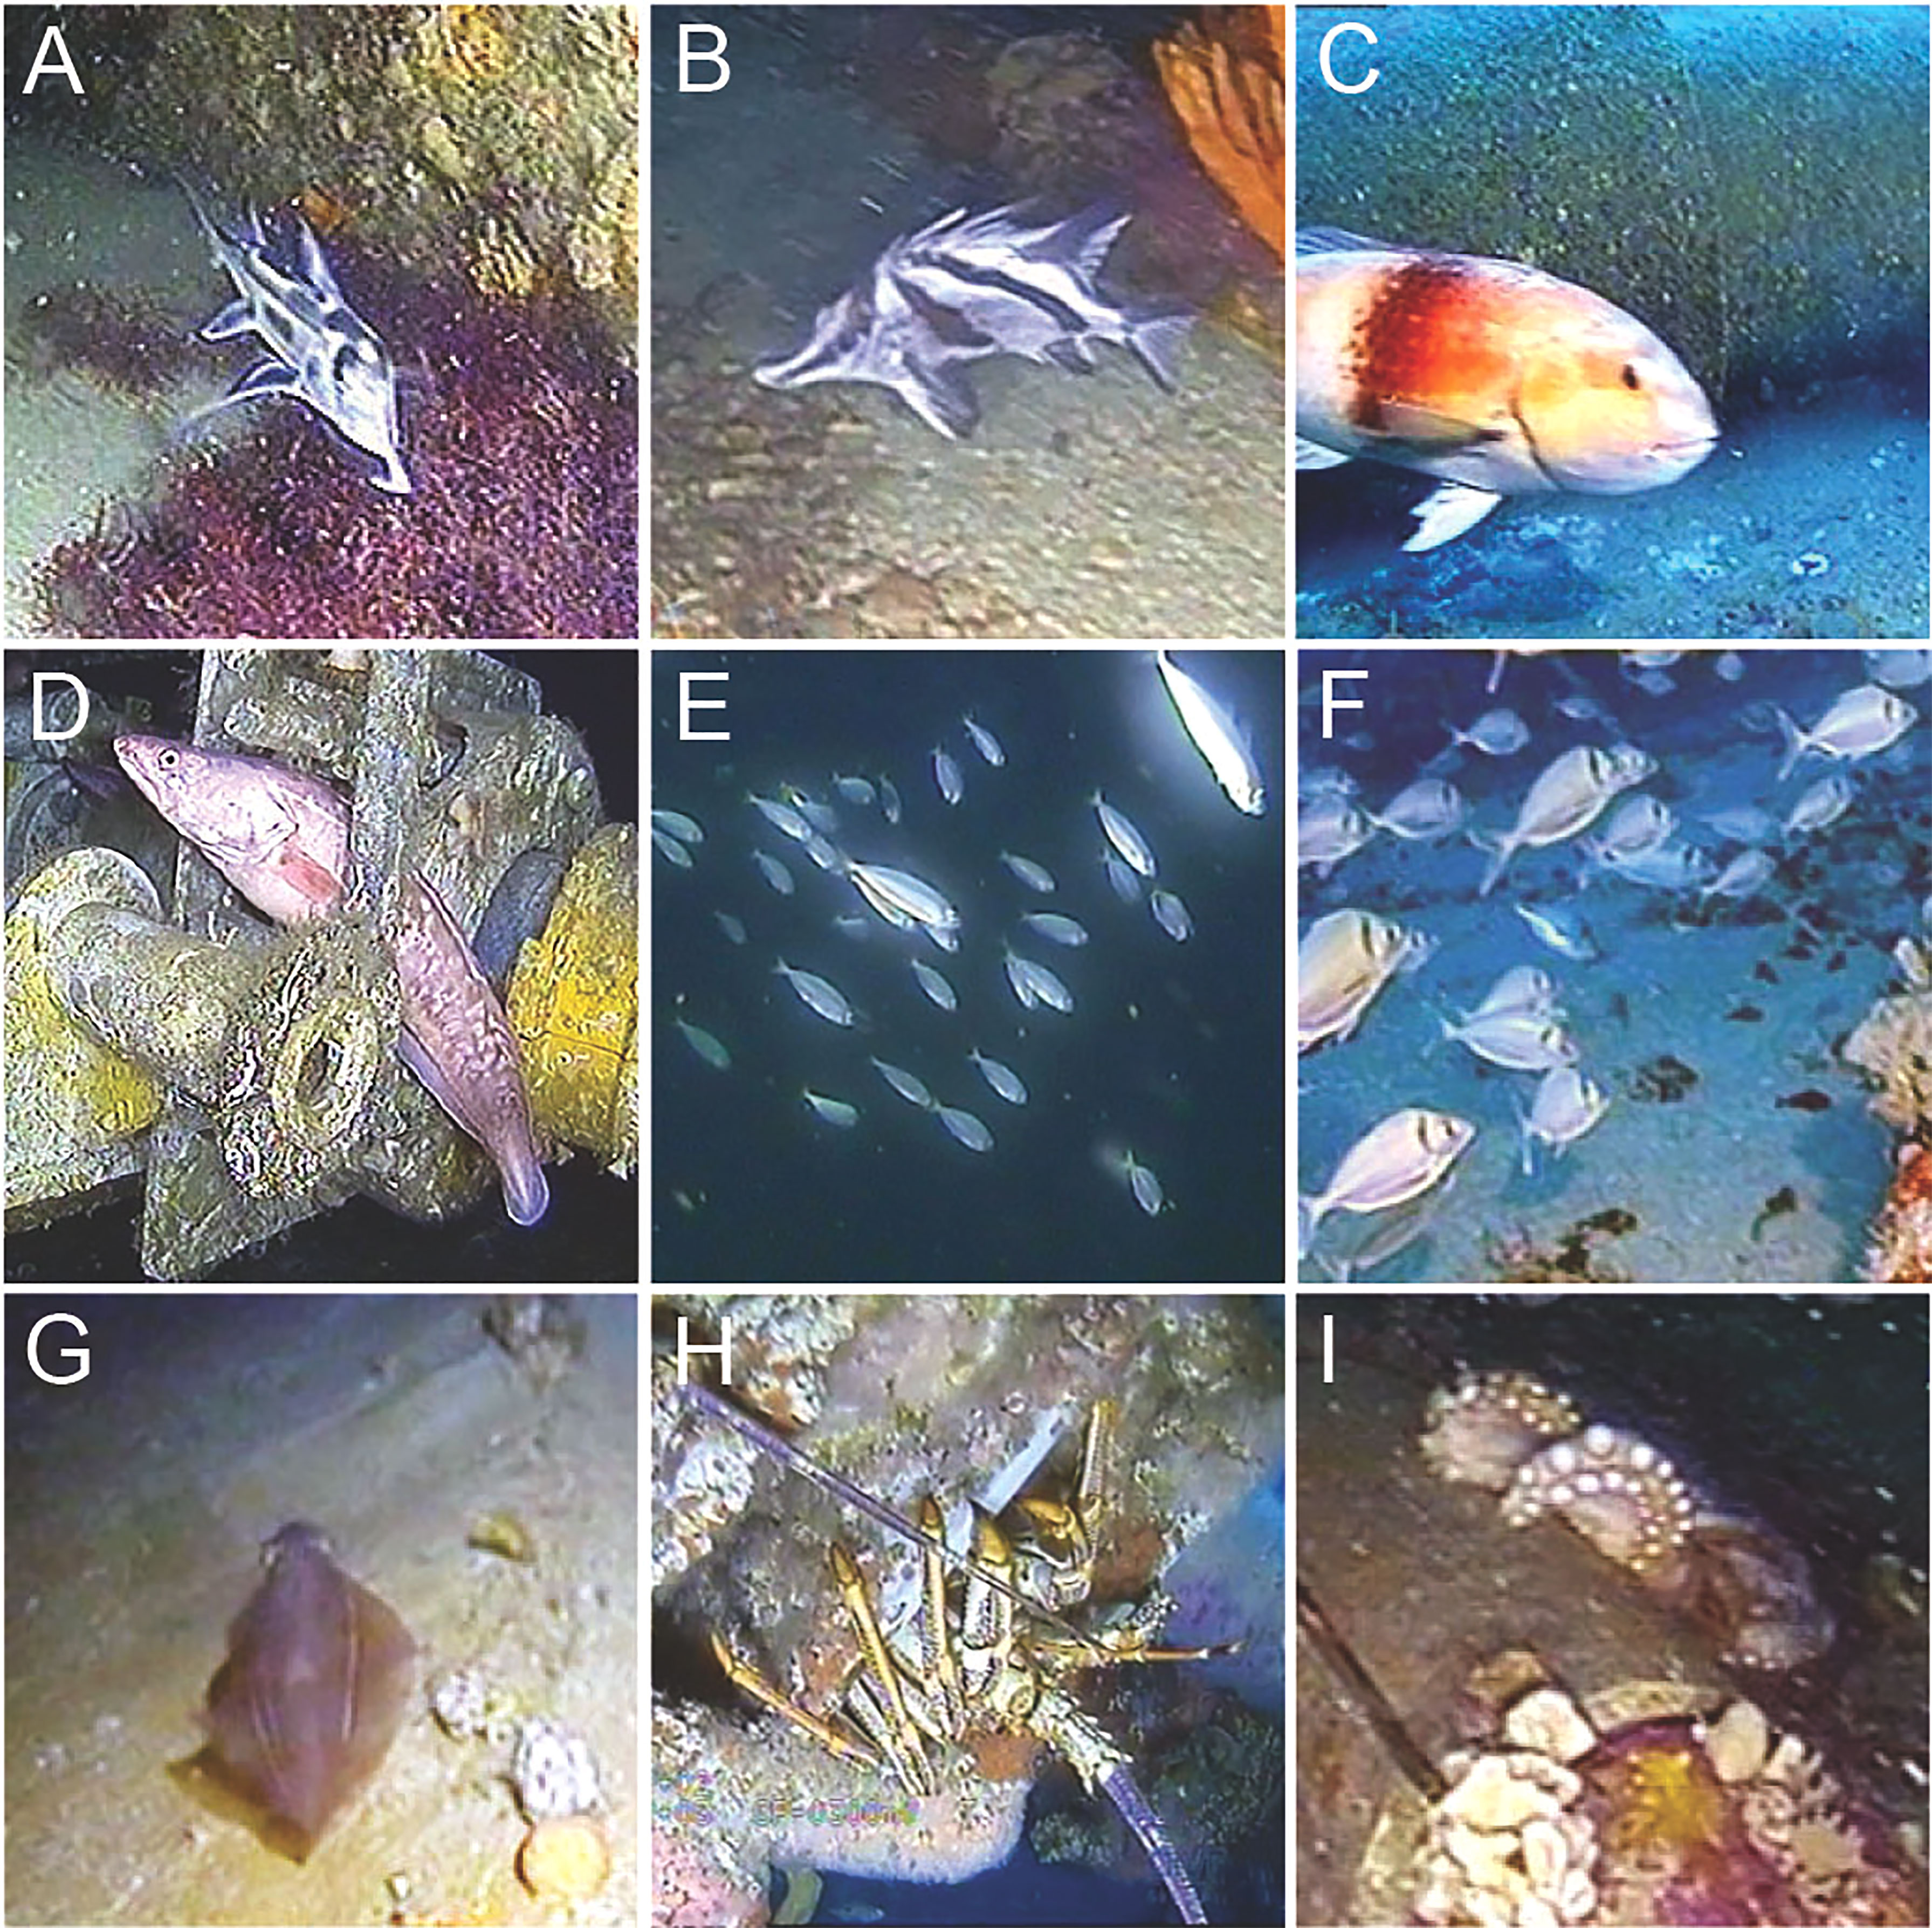
Figure 7 Examples of fishery species observed during industry-collected ROV surveys: (A) elephantfish, Callorhinchus milii, (B) longsnout boarfish, Pentaceropsis recurvirostris (C) bluethroat wrasse, Notolabrus tetricus, (D) pink ling, Genypterus blacodes, (E) jack mackerels, Trachurus spp., (F) jackass morwong, Nemadactylus macropterus, (G) squid, (H) southern rock lobster, Jasus edwardsii, and (I) an octopus.
Greater richness of invertebrate taxa was generally observed near pipelines than on platforms, likely due to the proximity of the benthos and the maneuverability of the ROV. Rock lobsters (also referred to as crayfish, family Palinuridae, including southern rock lobsters Jasus edwardsii) were observed near the base of at least six of the platforms and other subsea infrastructure. Smaller crustaceans including shore crabs (Grapsidae) were observed in water depths < 15 m. Jellyfish were also observed in the water column and were sometimes entrained downcurrent of the platform structures. On the benthos, hermit crabs (superfamily Paguroidea) were the most abundant, typically crawling along or beside the pipelines. Sea urchins (class Echinoidea), including the purple sea urchin, Centrostephanus rodgersii, were infrequently observed, but where they appeared, they were often clustered along the pipelines. Larger sea stars (Asterodiscides truncatus), decorator crabs (family Majidae) and mantis shrimp (order Stomatopoda) were visible in the imagery. Occasionally squid such as the southern calamari squid (Sepioteuthis australis), octopus such as the Maori octopus (Octopus maorum), and the giant cuttlefish (Sepia apama) were present along the pipelines. Also present in ROV videos were gastropods such as spindle shells and whelks. Near the pipelines mobile invertebrates were documented in the soft sediments, including sea cucumbers (family Holothuridae), sea pens (order Pennatulacea), and featherstars (class Crinoidea). In deep water (> 300 m), carrier crabs (family Homolidae) and large anemones (order Actinaria) were attached to the pipeline and were observed on the pipeline down to ~ 400 m depths. Squat lobsters (family Galatheidae), which have squat bodies, slender arms and claws were also only found in deep water.
The predominant forms of benthic biota documented in the ROV imagery included many forms of sponges (Phylum Porifera), bivalves (e.g., commercial scallops, oysters, doughboy scallops), hydrozoans, tunicates (e.g., sea squirts, salps), free-living and colonial ascidians, tube worms, anemones and sea whips. Platforms were covered in benthic biota, mostly encrusting morphs of colonial ascidians, jewel anemones, anemone-like zoanthids (not true anemones), and sponges. Observations suggested that the encrusting height increased with depth with erect and branching morphs of sponges found on the seabed and deepest sections of the platforms. The shallowest areas of the platforms were characterized by invertebrate complexes of barnacles, macroalgae, and smaller mounding morphs of sponges.
Sixty-seven species of marine fauna were recorded from the two steel piled jackets in the Bass Strait. Of these, 55 were fish, 11 were mobile invertebrates and one was a mammal. Seven of these species are regularly caught in commercial fisheries (redfish Centroberyx affinis, silver trevally Pseudocaranx georgianus, jackass morwong Nemadactylus macropterus, banded morwong Cheilodactylus spectabilis, blue throat wrasse Notolabrus tetricus, rosy wrasse Pseudolabrus rubicundus, and southern rock lobster Jasus edwardsii, Supplementary Table 2). The only species of mammal found was the Australian fur seal, Arctocephalus pusillus doriferus, observed swimming through the water column at both platforms. Although most species richness was accounted for by fish, numerous species of crabs and jellyfishes were likely not accounted for during imagery analyses due to low video image quality (e.g., most crabs could only be identified to the level of Infraorder Brachyura).
At KFB, 43 species were recorded (34 species of fish, eight invertebrates and one mammal), and 46 at WKF (39 species of fish, six invertebrates, one mammal). Of the 67 species recorded across both platforms, only 22 species were observed at both platforms, while 21 were unique to KFB and 24 unique to WKF. Additional species included the world’s largest bony fish, the sunfish (Mola spp.). Fish species that were common on both platforms were also abundant at each platform (e.g., C. lepidoptera, N. macropterus, Table 1). Other fish species were unique to WKF (e.g., Trachurus spp., Pseudocaranx spp.).
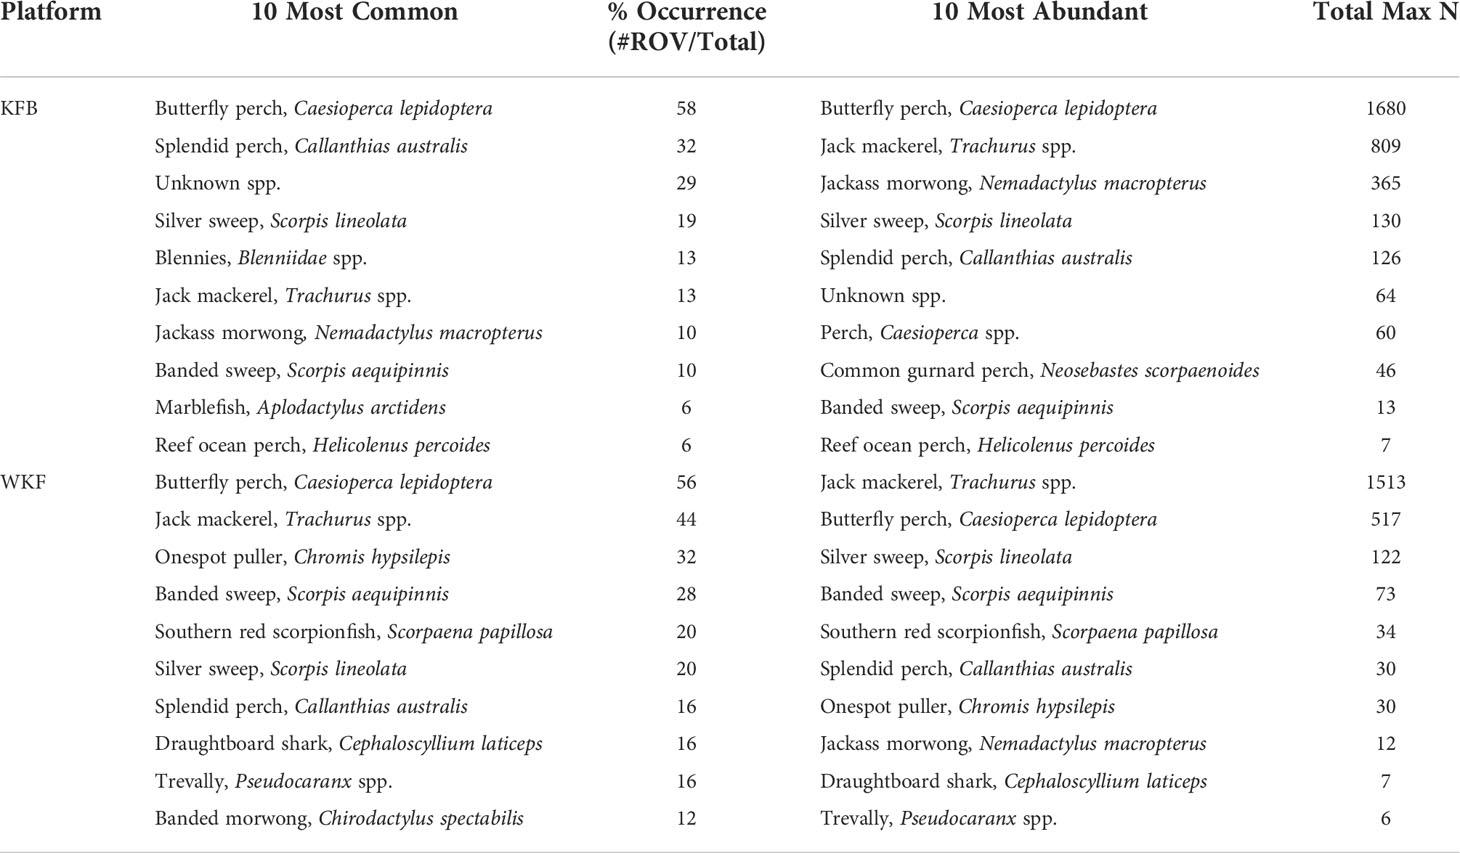
Table 1 Summary of the ten most common (% of occurrence: #ROV videos/total ROV videos sampled), and the ten most abundant (Total MaxN) fish species present at the Kingfish B (KFB) and West Kingfish (WKF) steel jacket oil and gas platforms.
Marked differences in species relative abundance were observed across depths at the two platforms (Supplementary Table 3, Figure 8). Patterns also differed between fish, invertebrates and mammal species. Highest overall taxonomic richness (both total and average) was found in the deepest depth band at both platforms (> 60 m, n=33 species for KFB and n=27 species for WKF). Lowest taxonomic richness was recorded at water depths of 0 – 15 m for KFB (n=9 species), and 45 – 60 m for WKF (n=10), although average taxonomic richness (# species/video sample) was lower at 15 – 30 m at the latter. Fish accounted for most of the taxonomic richness patterns, with invertebrate taxonomic richness being more uniform across depth. Fish taxonomic richness was similar between the KFB and WKF platforms but varied significantly according to depth band (P(perm)=0.006, Supplementary Table 3, Supplementary Figure 8), with water depths > 60 m having higher species richness than all other depth bands (Platform x Depth band, all P(perm)<0.009).
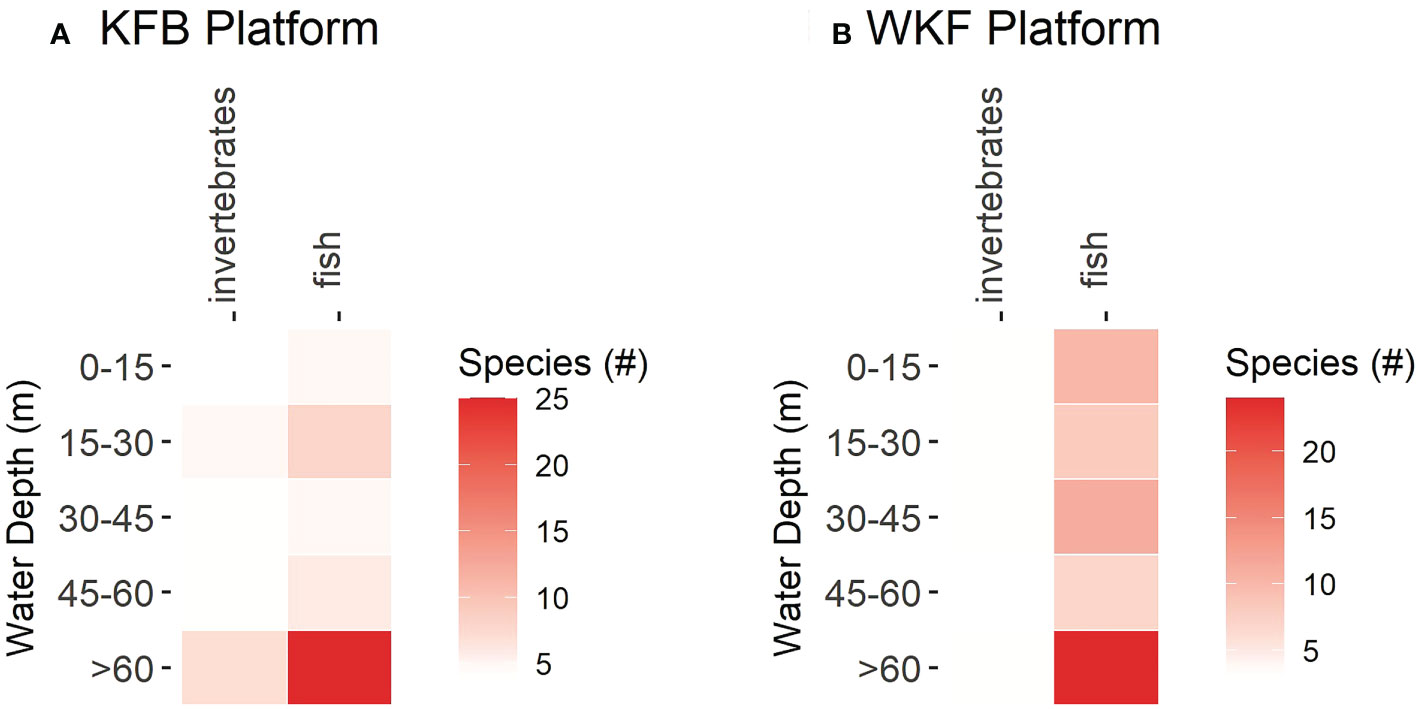
Figure 8 Heatmap showing species richness (total # of species) at platforms Kingfish B (KFB, A) and West Kingfish (WKF, B) surveyed for fish and invertebrates at the five depth bands for which ROV imagery were surveyed (0 – 15, 15 –30, 30 – 45, 45 – 60, – 60 m). Only one species of mammal, the Australian fur seal, Arctocephalus pusillus doriferus, was found.
Species relative abundance also differed across depth for both platforms (Figure 9, Supplementary Table 3). Total fish abundance (univariate) was similar between platforms but varied significantly according to depth band (P(perm)=0.006), with this pattern differing between platforms (Platform x Depth band interaction, Supplementary Figure 9). At KFB, three distinct water depth groups for total fish abundance were evident: 0 – 15, 30 – 45 and > 45 m (based on significant differences for post-hoc tests on the Platform x Depth band interaction, all P(perm)<0.04). This platform had a higher abundance of fish at its base (> 45 m) compared to shallower depths. Fish in the deeper areas included large schools of jackass morwong (N. macropterus), butterfly perch (C. lepidoptera) and splendid perch (C. australis). Common gurnard perch (Neosebastes scorpaenoides) and reef ocean perch (Helicolenus percoides), two types of bottom-dwelling perches were also common on the seabed around and underneath the KFB platform. In contrast, total fish abundance at the WKF platform was more evenly distributed across depths (Supplementary Figure 9). Lack of depth differentiation at this platform was largely due to abundant schools of jack mackerels (Trachurus spp.), a pelagic group of fishes, that was mostly ubiquitous across 0 – 60 m water depths (Figure 9). Species relative abundance patterns for the ten most abundant fish species, showed clear association of butterfly perch (C. lepidoptera), jack mackerels (Trachurus spp.), and jackass morwongs (N. macropterus) with deep sections of the KFB platform (> 45 m), with other species more evenly distributed across depth (Supplementary Table 2). Similar to KFB, C. lepidoptera were associated with deep sections of this platform, and other fish species were more evenly distributed across depth.
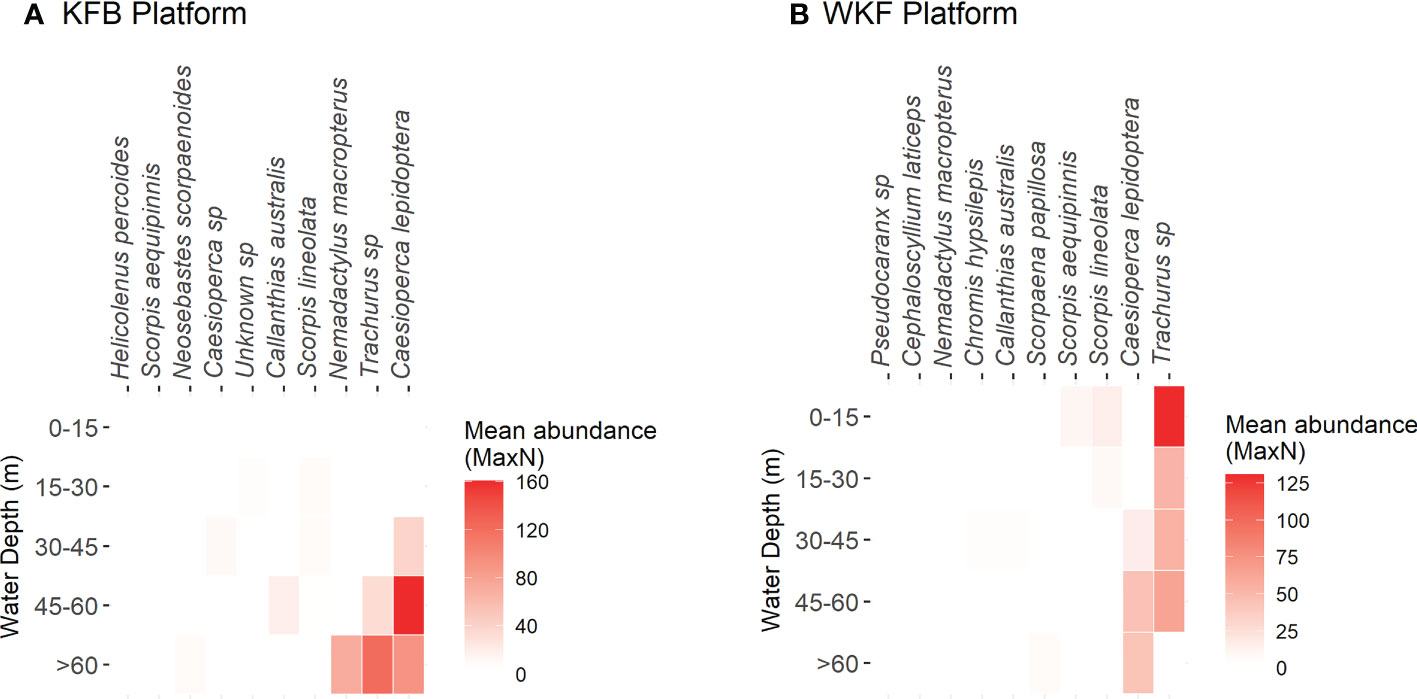
Figure 9 Heatmap showing average abundance (mean MaxN) of the ten most abundant species at each of the five depth bands (0 – 15, 15 – 30, 30 – 45, 45 – 60, > 60 m) for each platform Kingfish B (KFB, A) and West Kingfish (WKF, B).
Invertebrate relative abundance (univariate) was significantly lower in deeper waters at both platforms (> 60 m) (all P(perm)<0.03), with other depth bands showing no statistically significant differences in abundance (Supplementary Figure 9). At KFB, the high relative abundance of invertebrates observed at 15 – 30 m water depth was accounted for by large schools of krill (Nyctiphanes australis), with crabs and jellyfishes more evenly distributed throughout depth. At WKF, the highest average invertebrate abundance was recorded at intermediate depths (30 – 45 m). Both platforms had significantly different invertebrate community composition (multivariate abundance, P(perm)=0.0001), which also varied according to depth band (P(perm)=0.02).
Australian fur seals, the only mammals associated with both platforms (n= 9; total mammals recorded at both platforms), were most abundant towards the water surface at KFB (0 – 15 m) (no statistics conducted due to very high proportion of zeros). Some of these individuals may be the same individuals but recorded on different videos, so true total abundance may be less than nine. Australian fur seals were found in lower relative abundance at WKF and only at the 0 – 15 and 45 – 60 m water depth bands; this is presumably due to low sampling frequency and chance observation of these mammals, with their distribution likely being ubiquitous across depths.
Multivariate patterns in abundance showed a clear separation between shallow sections of the platforms, driven by the presence of Trachurus spp. and one-spot puller (Chromis hypsilepis) at the WKF platform (Figure 10). Both of these species were present at KFB, but in deeper waters > 45 m. At deep sections of both platforms (> 45 m), species composition appeared to be more similar, with C. lepidoptera common and abundant. The PCO axes presented explained a total of 50.2% variation in fish assemblage data.
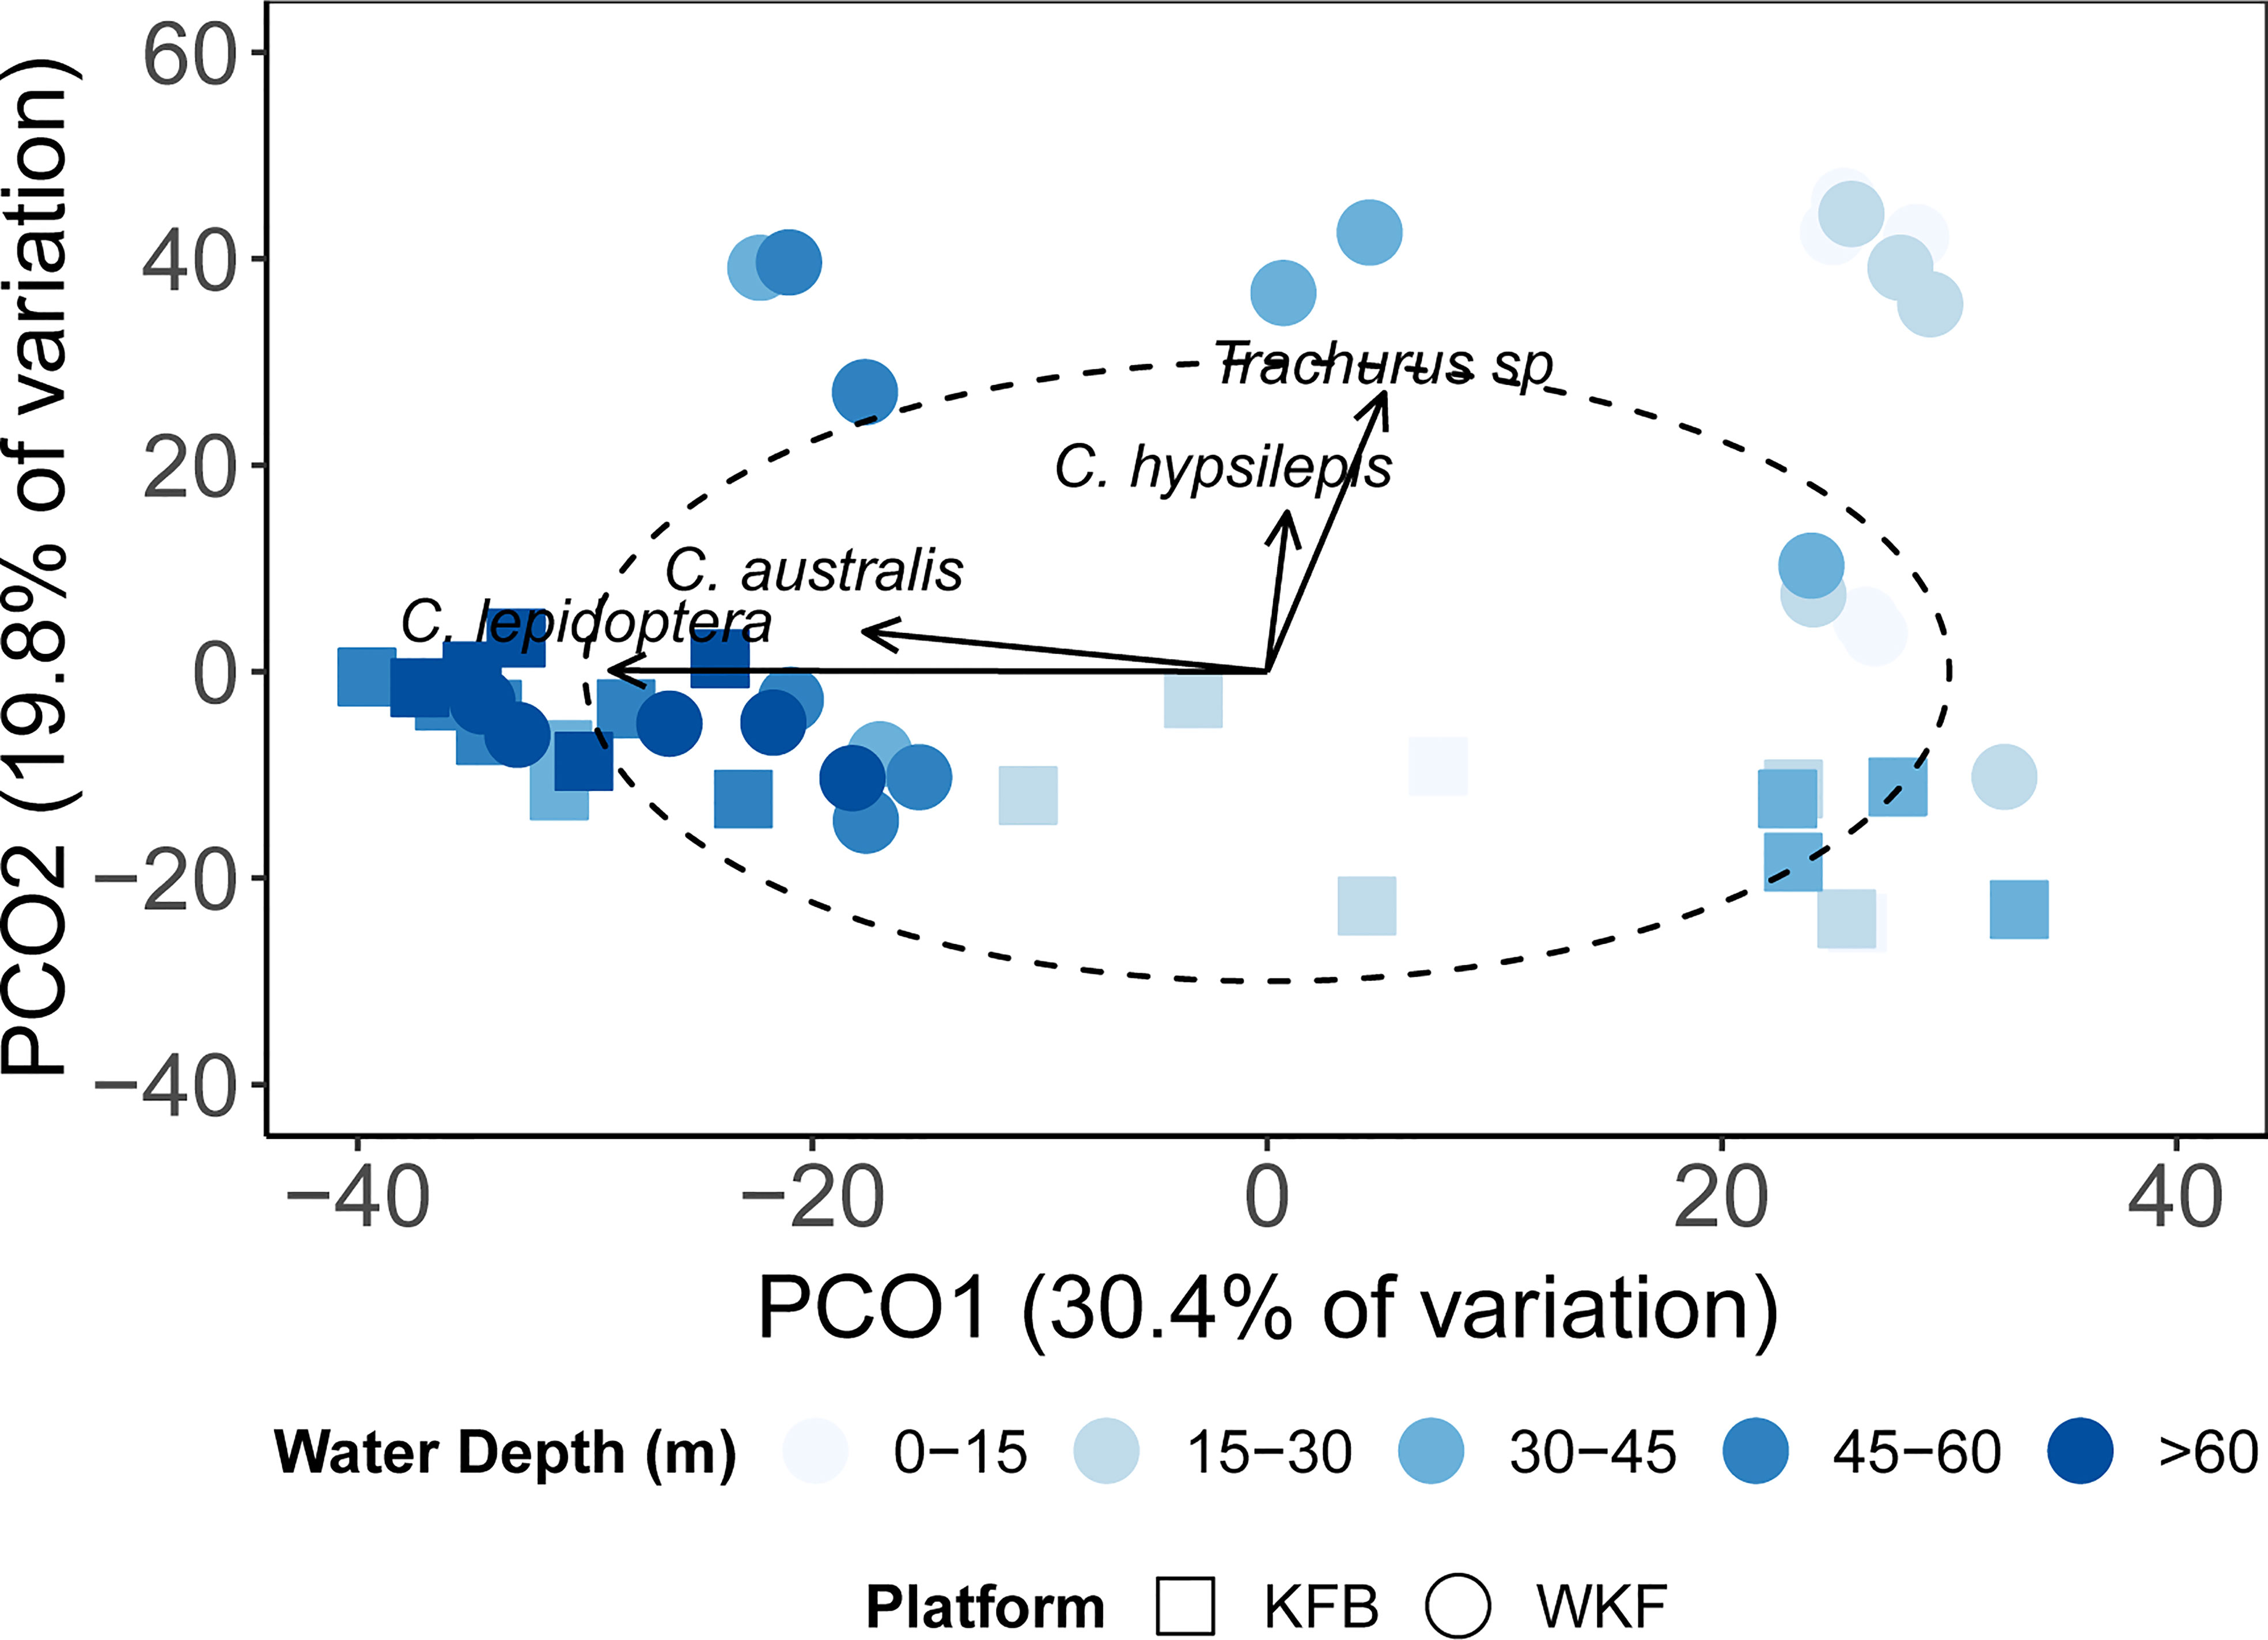
Figure 10 Principal Coordinates Analysis (PCO) showing multivariate fish data (fourth-root transformed) at the two platforms surveyed (KFB- squares, WKF- circles), according to the five depth bands selected. Arrows represent fish species showing significant correlation (|R| ≥ 0.4) with the PCO axes.
These multivariate patterns were validated by PERMANOVA results showing platform and depth band were significant factors separating multivariate fish species composition (P(perm)=0.0001), with a significant interaction between them (P(perm)=0.0001; Supplementary Table 3). At both platforms there were three distinct depth groups: 0 – 45 m, 45 – 60 m and > 60 m water depth (based on significant differences for post-hoc tests on the Platform x Depth band interaction; all P(perm)<0.03). However, at WKF this distinction was less clear with the fish assemblage similar among 0 – 60 m water depths.
Both KFB and WKF platforms were 100% covered by benthic biota. Colonial ascidians and sponges were the most common benthic biota categories observed (Supplementary Figure 10). Shallow sections of the platforms (0 – 15 m) had more macroalgae and ‘invertebrate complexes’ such as bivalves or barnacles. Most of the benthic biota were encrusting and unstalked types, forming short continuous coverage over the entire platform. Taller erect forms of sponges were present below 45 m, with similar levels at KFB and WKF. ‘Small mixed’ morphs and ‘articulated calcareous’ types of macroalgae were more common in the 0 – 15 m water depth. Small mixed morphs were also present in greater proportions below 45 m water depth creating habitat for fishes lying on or among the benthos on the structure. Epibenthic height variation was overall very low, with 20 – 30% of higher growth (2: medium 20 – 40 cm) in the shallowest and deepest categories. There was more uniformly low growth between 15 – 60 m. However, benthic quadrats were opportunistically sampled and the quality of still images from standard definition ROV videos that were not collected for this purpose limited the ability to quantify the benthic biota. This information is therefore considered qualitatively representative of the benthic communities present.
At the CBA300 pipeline, 1200 fishes were recorded across 29 species and 20 families (Supplementary Table 4). Total fish abundance ranged from 0 to 358 individuals per 50 m transect (mean ± SD: 38.71 ± 71.57), and fish species richness ranged from 0 to 16 species per 50 m transect (mean ± SD: 4.03 ± 3.28). Only a few species of commercial importance were recorded: the jackass morwong (Nemadactylus macropterus), bluespotted goatfish (Upeneichthys vlamingii) and octopus species. Ninety-three invertebrates from five categories were recorded (sea star Asterodiscides truncatus, hermit crabs, crabs, decapods, octopus), with most of these being hermit crabs (86%).
At the MLA100 pipeline, 4199 fishes were recorded across 47 species and 28 families; with ~30% of species also present at the CBA300 pipeline. Abundance per each 50 m transect varied from 4 to 620 (mean ± SD: 135.45 ± 148.37), and species richness from 3 to 17 (mean ± SD: 7.16 ± 3.20). As with the CBA300 pipeline, the same commercial species were present, with N. macropterus in lower abundance (89 individuals recorded at CBA300 and only 44 fish at MLA100). A total of 49 invertebrates were also recorded from nine categories, with most of them being hermit crabs (67%).
The fish assemblage along the CBA300 pipeline was dominated by small benthic species such as stinkfish (Foetorepus calauropomus) and grubfish (Parapercis allporti) (Table 2). Schools of jacks/trevallies were also common along this pipeline and responsible for a large percentage of the total fish abundance recorded (~26%). Abundance of N. macropterus, was ~7.5% of the total fish abundance at the CBA300 pipeline. At the MLA100 pipeline, butterfly perch were the most abundant. Schools of jacks/trevallies were also present, although in less abundance than at CBA300, and the abundance of N. macropterus was ~1% of total fish abundance recorded at this pipeline. Benthic and relatively sedentary fish species such as reef ocean perch (Helicolenus percoides) and the southern red scorpionfish (Scorpaena papillosa) were common and abundant at both pipelines surveyed.
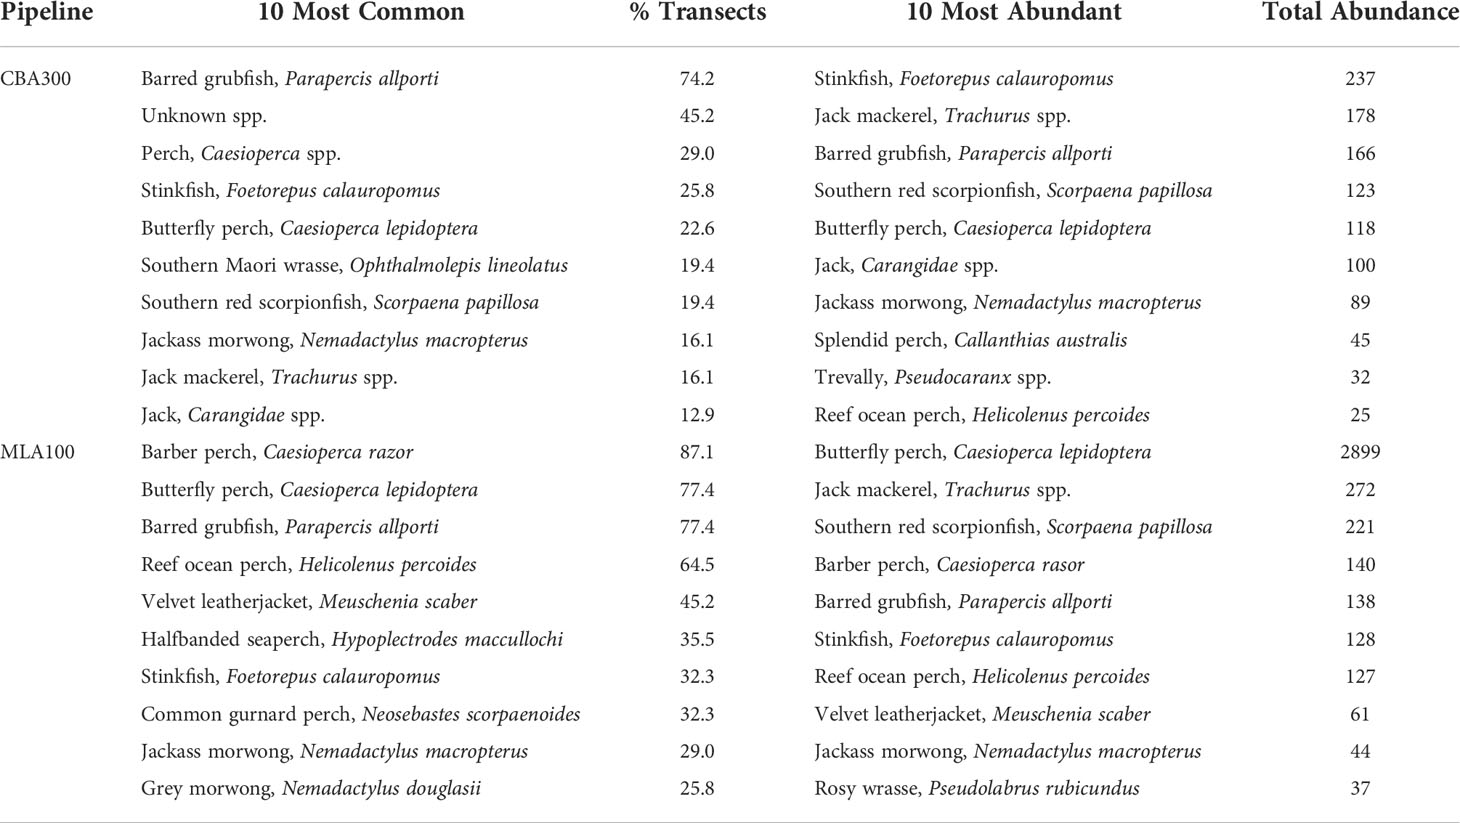
Table 2 Summary of the ten most common (% of occurrence: #transects/total # of transects sampled), and the ten most abundant (Total #) fish species present at the CBA300 and MLA100 pipelines.
Total fish abundance and species richness were higher along the MLA100 pipeline while invertebrate abundance was higher on the CBA300 pipeline and invertebrate species richness was similar between pipelines (Supplementary Figure 11, Supplementary Table 5).
A combination of epibenthic height and pipeline position were important variables for explaining fish total abundance and richness (Figure 11, Table 3). Total fish abundance was higher when more complex epibenthic communities were present and when the pipeline was more exposed, for both pipelines (Supplementary Figure 12A). Pipeline identity (CBA300 vs. MLA100) explained very little of the variation in total fish abundance and this variable was not selected in the top model. Pipeline identity and percent cover of sponges (%) were the main drivers of fish species richness. The MLA100 pipeline showed higher species richness on average than CBA300 (Supplementary Figure 12B). Species richness increased with availability of sponge habitat present at both pipelines.
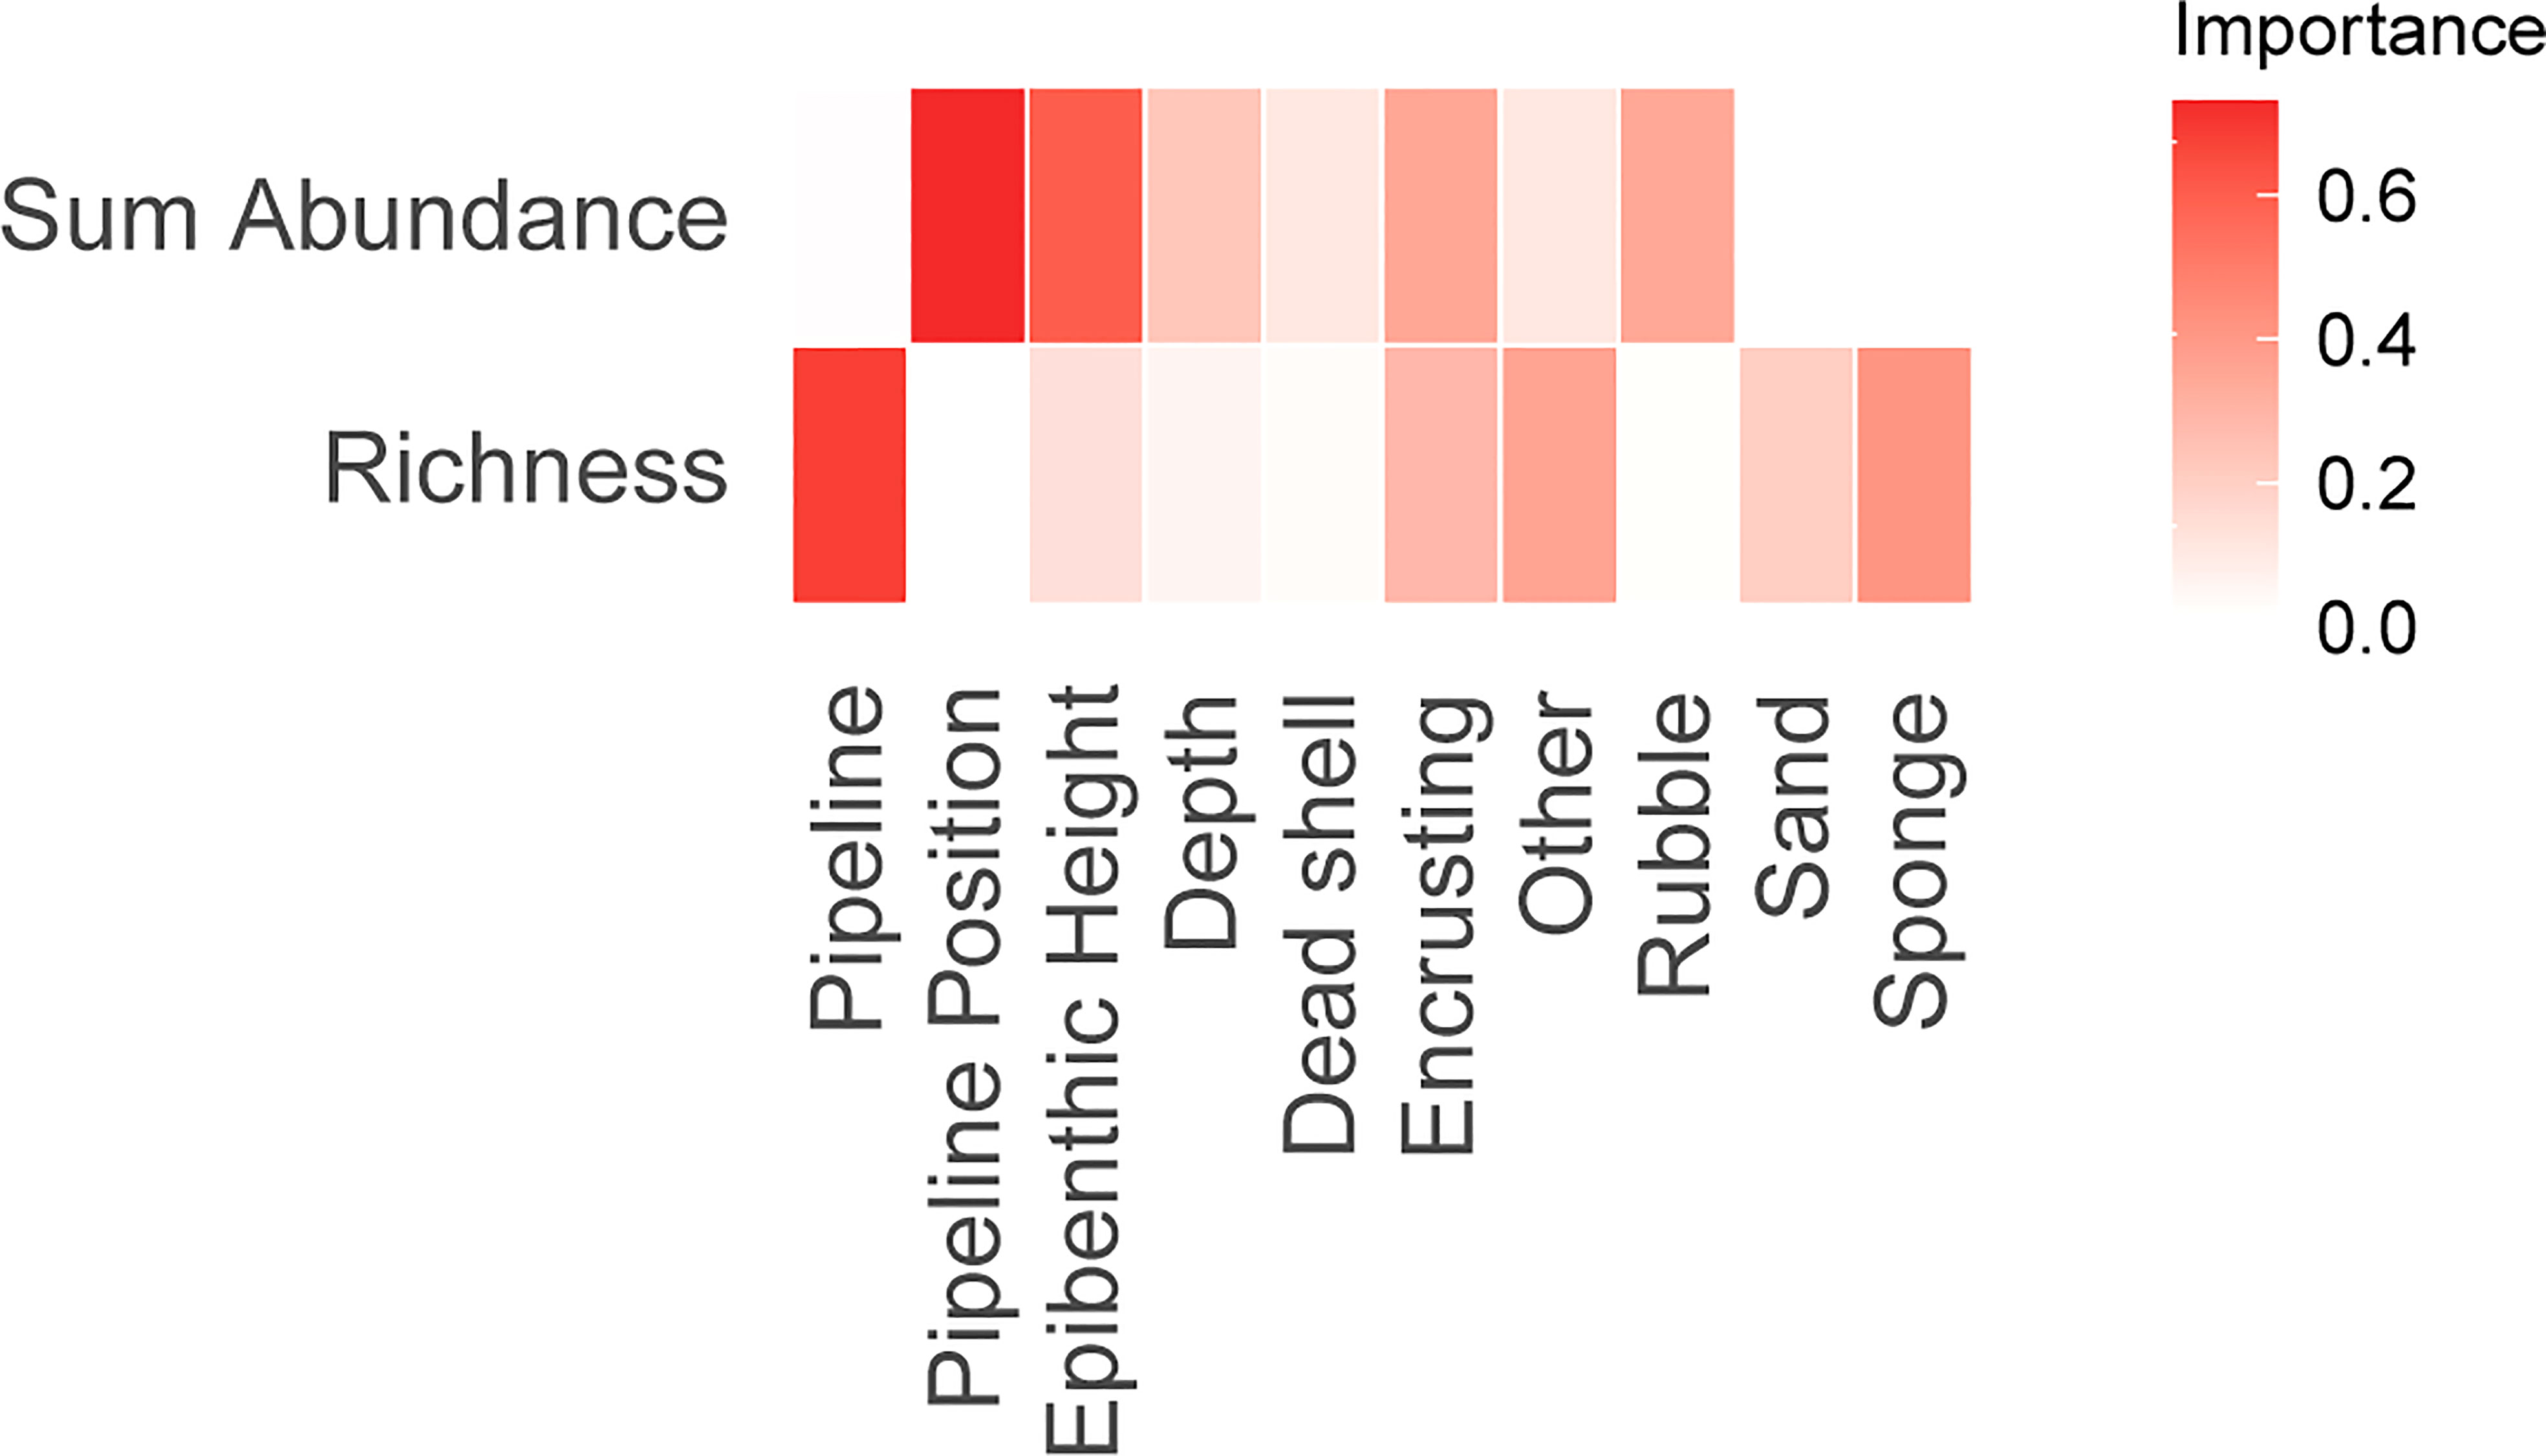
Figure 11 Variable importance plots for generalized additive models (GAM). Variables in dark red are the most important contributors. Variables in white were not selected in any of the fitted GAMs due to their low importance. Pipeline position refers to the extent of burial/spanning (see Figure 2). Other refers to instances where the habitat could not be determined.
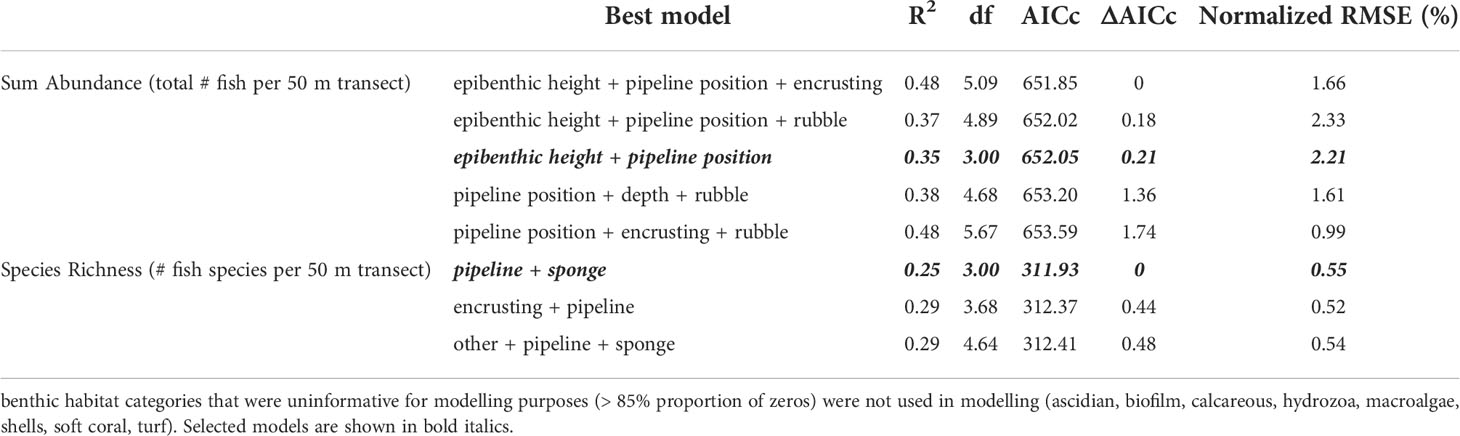
Table 3 Top Generalized Additive Models (GAM) for explaining relationships between fish abundance (total # fish/50 m) and fish species richness (# species/50 m), with explanatory variables relating to pipeline characteristics and benthic community composition (epibenthic height, pipeline position, depth, % cover of: dead shells, encrusting, other, rubble, sand, sponge).
Comparison of variable importance plots for sum abundance and species richness models confirmed GAM patterns. Pipeline identity was important for species richness but not abundance. Pipeline position was important for abundance but not species richness. Epibenthic height was important for both univariate metrics of the fish assemblage.
Pipelines communities comprised a different subset of fish and invertebrate species than platforms, with only ~25% of species (29 species out of 111 total species found among the four structures) observed at both types of structures (Figure 12). Overall, the platform communities of KFB and WKF were more similar to each other (20% shared species), than the pipeline communities (15% shared species).
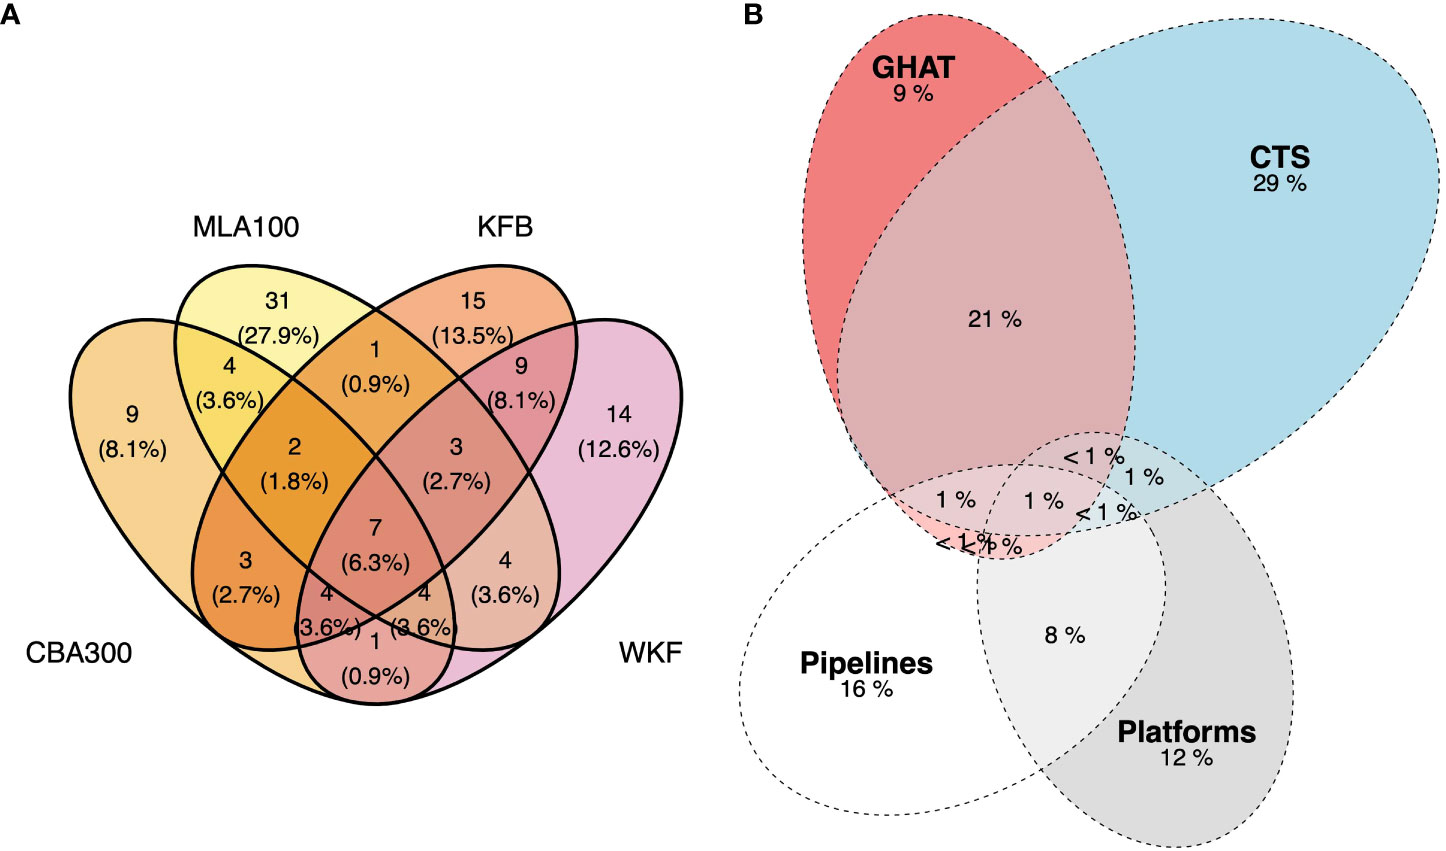
Figure 12 (A) Venn diagram showing the number and percent of shared species among the pipelines CBA300 and MLA100 and platforms KFB and WKF, (B) Euler diagram showing the percent overlap between retained catch species from commercial fisheries with oil and gas pipeline and platform communities. Species data included imagery analysis from Remotely Operated Vehicle surveys of two pipelines and two steel pile jackets and cumulative catch data from 2008-2018.
When compared to the fishery data, the representation of fishery species among the O&G structures was low in terms of the number of species represented (< 10% of the total species accounted for in this study). The CTS and GHAT, the two main fisheries operating among the O&G structures, retained a diverse composition of fish and invertebrate species, with about a quarter of the total species retained in both fisheries despite differences in fishing gear and target species. The marine communities at the four O&G structures studied were diverse but hosted a different composition of species. Of the species documented in the ROV imagery, few species of commercial interest were observed (Supplementary Tables 2 and 4). ROV imagery included species not targeted for seafood markets, including fur seals, invertebrates such as sea stars, crabs and jellyfish, as well as fish species too small to be selected for in fishing gears, or considered not commercially valuable for a number of reasons.
This is the first quantitative evaluation of marine communities of O&G structures comparing ROV imagery analysis with reported fishery data in Bass Strait. These descriptions also form important baseline data for future decommissioning discussions as these structures are > 40 years old with KFB one of the first platforms (installed in 1971) in Bass Strait and WKF in 1981, which make these the oldest Australian O&G structures and marine communities studied to-date (McLean et al., 2021a) and potentially the oldest de facto offshore ‘no-take’ areas in Bass Strait since fishing is excluded by default.
ROV imagery of the platforms showed diverse and well-established marine communities with significant depth variations. Greatest species richness and total abundance was in > 60 m water depth and included many reef-associated fish species. Jackass morwong (Nemadactylus macropterus) and butterfly perches (Caesioperca lepidoptera) were abundant schooling species near the base of each platform. Jack mackerels (Trachurus spp.) formed large, dense schools at each platforms. These species are common to the soft sediments and rocky reefs of south-east Australia at similar depths (Williams and Bax, 2001).
Fish and invertebrate communities along pipelines were slightly more diverse (74 spp.) and comprised a different composition than platform communities (67 spp.). Pipelines, although not as vertically complex as platform environments, cover a larger spatial area across the seafloor. A few important fishery species were observed along pipelines including jackass morwong (Nemadactylus macropterus), bluespotted goatfish (Upeneichthys vlamingii), trevallies (Carangidae), rosy wrasse (Pseudolabrus rubicundus), flathead (Platycephalidae), flatfishes (Pleuronectiformes), gurnards (Triglidae) and octopus species. Pipeline communities included some important fishery species (e.g., flatheads Platycephalus spp. and octopus) not documented on platforms, as well as more benthic associated fish species. Pipelines also exhibited a different invertebrate community to platforms with sea urchins, mantis shrimps, sea stars, hermit crabs, and octopus observed. Some of these taxa burrow in the soft sediments surrounding the pipeline (e.g., octopuses’ nest in soft sediments), and others may use pipelines as sources of food or shelter.
The fishing data provided an interesting direct comparison and also ecological and economic context to these marine communities. In terms of direct overlap with the fisheries data, O&G structures appear to provide little evidence for the species sought after commercially (i.e., target species), with few observations in the ROV imagery and relatively small subset of the total species included in this study (< 10%). Whether or not these O&G structures are important to fishery species and thus, important to fisheries, cannot be surmised yet and future research is needed to investigate these possible connections. Our study is the first to describe the diverse marine communities on a number of O&G structures in this region, and also the first to directly compare fishing effort and species composition. These structures may provide holistic benefits to the adjacent ecosystems by supporting abundant lower trophic level species and critical habitat for fish where comparable habitats would be few and far between. This is demonstrated by the pervasive fishing effort allocated throughout the area around O&G structures for the period studied. Fishery data and ROV imagery were collected by industry for different purposes and the historical imagery and the fishery reported species’ catch data provided coarse taxonomic resolution. This lessens the ability to make meaningful interpretations from some of the data convergence as some species may be grouped together, and, therefore, result in underestimates of species diversity and richness. Further, the analysis of pipeline footage was a small proportion of the total pipeline network (~800 km) and ROV surveys were limited over short survey periods and could only provide ‘snapshots’ of species that may more broadly inhabit the region and structures. Each data sampling type has inherent biases, and it is noteworthy that some fishery species (e.g., whiting) may be more active at night and thus not observed in the subset of daytime imagery. Species like flatheads may be harder to observe if the benthic environment is not agitated as it is during fishing activities. It is possible to use imagery data for relative abundance estimates, however, we were limited to conservative measures as the ROV imagery was not gathered for the purposes of ecological assessment.
Of the 67 species recorded across both platforms, half of the species were unique to each platform (21 unique to KFB and 24 unique to WKF). This suggests there is high variance among O&G structures, despite similarities in age and location. Differences in the communities between KFB and WKF may point to differences between the platforms (e.g., jacket age or design) or sampling differences, such as the timing of the ROV surveys (Oct 2015 vs Apr – Jun 2017 respectively) and the limitations based on the quality and quantity of available imagery. Marine communities are temporally and spatially dynamic. There are likely differences in the seasonal distributions of fishes and invertebrates at O&G structures in Bass Strait. The presence of jellyfish and krill, as well as transitory species like sunfish (Mola spp.) may support this hypothesis. Jellyfish, krill (Nyctiphanes australis) and pyrosomes are key diet items linked to important South-east Australian fishery species (Blaber and Bulman, 1987; Young et al., 1996) and may indirectly be important to local fisheries. Gelatinous zooplankton temporarily store energy from seasonal phytoplankton blooms until they are eaten by jack mackerels or their predators southern bluefin tuna (Thunnus maccoyii, Young et al., 1996; Young et al., 1997). Krill is an important diet item for barracouta (Thyrsites atun) southern bluefin tuna, skipjack tuna (Katsuwonus pelamis), tiger flathead (Platycephalus richardsoni), and jack mackerel (Trachurus spp.) in continental shelf waters (Prince, 2001). The number of species common to both platforms (22 out of 67 total species observed) also highlight that greater sampling effort (both more replication and over a longer period of time) is needed to clarify which species are unique or if fish assemblages are mostly homogeneous with some seasonal differences. For instance, Trachurus spp., were highly abundant at WKF and KFB, these species are highly mobile and form dense schools but may be difficult to measure for accurate biomass estimates.
The frequent presence of large schools of mackerel/scads (Trachurus spp.) and other schooling fishes suggests that O&G platforms may attract these species. These fishes are important to the Small Pelagic Fishery of the Bass Strait and are important in marine food webs. South-east Australian fisheries may be sustained by offshore and pelagic resources with up to 90% of the primary productivity taken up by foraging fish species, which support the more commercially valuable piscivorous fishes (Prince, 2001). In other marine ecosystems these ‘pelagic subsidies’ support higher rates of productivity than would otherwise be expected (e.g., coral reefs, Morais and Bellwood, 2019 and deep ecosystems, Stasko et al., 2016). O&G structures are three-dimensional structures that extend throughout the water column; they may function as either a stopover or habitat refuge for transient species. Many offshore platforms are well-lit, which is the main attractant for squid jigging methods (Koopman et al., 2018) and may influence other species drawn in by light or light-attracted prey. Pelagic species are often attracted to fish aggregation devices (FADs, e.g., Rountree, 1989; Dempster and Kingsford, 2003), coastal fish farms (Sanchez-Jerez et al., 2011), and artificial reefs (Caley and St John, 1996; Champion et al., 2015). Without consistent standardized surveys it would be difficult to estimate potential fishery biomass for these (and other) species. For pelagic species egg and larval sampling are used for fishery production estimates. None of these species in the Small Pelagic Fishery are considered overfished or subject to overfishing. Compared to other fishery species, they are not of high commercial value, but total fishery value is not disclosed due to the small number of participating fishers (Australian Fisheries Management Authority (AFMA), 2021).
Analyzing marine communities around O&G pipelines revealed interesting parallels to other O&G regions around Australia, despite differences between tropical and temperate marine ecosystems. Quantitative models highlighted the importance of the type of benthic biota growing on pipelines and the space available under pipelines (free-spans), as drivers of higher fish abundance and species richness in North-west Australia (McLean et al., 2017; Bond et al., 2018b; McLean et al., 2020b). Sponges form important components of marine communities in tropical and temperate Australia (e.g., Pitcher et al., 2009; Schultz et al., 2014) and provide important habitats for many species. In this study, fish species richness increased with the extent of sponge habitat present, with this result similar to other studies where the percent cover of sponges was correlated with commercial fish species (McLean et al., 2017; McLean et al., 2020b). Parts of Bass Strait are known for extensive sponge habitats (Butler et al., 2002), and many of these benthic habitats have been modified by various fishing techniques (e.g., scallop dredges, trawl). Pipelines and platforms may provide large enough exclusion zones for pockets of habitat needed for fish and invertebrates to shelter, reproduce and forage similar to how wildlife corridors are used in terrestrial conservation practices (Lindenmayer and Nix, 1993).
O&G structures may fill similar roles to artificial reefs to augment habitat for marine communities, with the aim of benefitting local fisheries. O&G platforms demonstrate high productivity to comparable marine habitats (Claisse et al., 2014; Smith et al., 2016; Meyer-Gutbrod et al., 2020). Established (~20 year old) deeper O&G structures (82-135 m) could sustain both juvenile and adults of the serranid Pseudanthias rubrizonatus (Fowler and Booth, 2012) in NW Australia, which provide evidence that these structures do not just attract mobile species but may be self-sustaining. While research on offshore Australian temperate O&G structures is limited, there is a longer history of placing artificial reefs in near-coastal (e.g., Becker et al., 2017; Smith et al., 2017), or estuarine Australian temperate environments (e.g., Lowry et al., 2014) to benefit recreational fishers. These artificial reefs are not at similar depths or scales of construction, and therefore, can only cautiously inform how larger O&G structures in deeper (> 50 m depths), offshore environments may perform in this capacity. Artificial reefs have demonstrated that size, placement and design are important to consider (Champion et al., 2015; Blount et al., 2021) and this would be necessary if decommissioned O&G platforms are to be converted to artificial reefs. Becker et al., 2017 monitored a purpose-built artificial reef for fisheries enhancement in 38 m of water near Sydney Harbour. Over the four years of monitoring, they recorded high species richness (53 species) on the high-relief structure on par with the taxonomic richness of the steel pile jackets KFB and WKF. Similar to a caveat of this study, Becker et al. (2017) found it difficult to compare to ‘control reefs’ that differed fundamentally in design and isolation. A converted O&G structure off of Exmouth in NW Australia was repurposed in 2018 and artificial reef modules were added to increase the available habitat to 27,000 m3, and within two years over 90 fish species were observed (Florisson et al., 2020). If decommissioned O&G structures are to be used to enhance local fisheries, then the autecology of target fishes should be considered (Champion et al., 2015; Smith et al., 2015). The optimal design and placement of underwater structures will differ for commercial and recreational fisheries, which use different fishing gears. Decommissioned O&G structures could provide both positive and negative impacts on fisheries and deep marine habitats and these should be carefully considered (reviewed in Macreadie et al., 2011).
South-east Australia is the largest fishery for benthic or near-bottom ‘groundfishes’ and is important for the domestic Australian seafood market (Williams and Bax, 2001). Many types of commercial fishing off the Victorian coast target soft-bottomed habitats, to prevent benthic gear (e.g., Danish seine, trawl, gillnets, scallop dredges) from being destroyed or lost (Prince, 2001; Williams and Bax, 2001). Ensnarement on the seabed is one of the most common causes of lost fishing gear (Richardson et al., 2019). Fishers avoid unknown habitats (where they have not fished before) and rely on benthic sounders to investigate the seabed and look for acoustic fish signals (Prince, 2001). Future decommissioning decisions that involve leaving pipelines in place may result in impacts to fishers, dependent on their subsequent ability to fish around these pipelines. For example, commercial trap fishers in North-west Australia target subsea pipelines (Bond et al., 2021) while commercial trawlers in the North Sea experience gear loss associated with pipelines (Rouse et al., 2020). Pipelines host a different subset of fishery species and fishers may avoid risky situations depending on fishing gear type (e.g., pipeline spans that may hook gear). If pipelines are left in place, they will have different consequences for future Bass Strait navigation and fishing activities.
The O&G structures are likely important fishing exclusion zones for certain length classes of important fishery species, but without accurate length information (e.g., confirmation from extractive surveys or calibrated stereo imagery) and information on the movements of these species (e.g., tag-recapture, acoustic tracking), we can only hypothesize as to the potential ecological role of these structures. Based on what has been documented in other areas of south-east Australia (New South Wales, Tasmania), these O&G platforms off the Victorian coast may benefit local fisheries but these direct links have not been established. How far offshore these species move, either with adult or larval dispersal, is not known. Neira (2005) used opportunistic plankton surveys on O&G structures and provided some evidence that these structures may be important for early life history stages of some fish species. The plankton catch included larval forms of adult fish observed by ROV around the KFB and WKF platforms (e.g., Trachurus spp., Pseudocaranx spp. and C. affinis) but these plankton surveys also sampled many fish species not documented in the ROV imagery. Plankton surveys will collect a different subset of species, which may connect O&G structures to other components of the Bass Strait ecosystem. For instance, some of the plankton caught included species not found among the platforms from shallow water (e.g., dragonet, Bovichtus angustifrons and king gar, Scomberesox saurus), inshore species (e.g., eastern Australian salmon, Arripis trutta), pelagic species (e.g., mahi mahi, Coryphaena hippurus) and deep mesopelagic species (e.g., Myctophidae, Neira, 2005). Other complementary sampling methods will be necessary to establish larval connectivity and evidence of juveniles recruiting to local fisheries. Research on the role of platforms for larval fish in California (Love et al., 2019) and the Gulf of Mexico (Hernandez et al., 2003), indicate platforms can perform functions similar to nursery grounds for commercially important fish species. Genetic techniques such as parentage analysis may also be useful for establishing if platform communities have direct linkages to fishes caught elsewhere (Harrison et al., 2012).
Australian fur seals (Arctocephalus pusillus) were observed in footage from both platforms. These marine mammals are known to associate with O&G structures (Todd et al., 2020a) but the types of interactions have not been quantified for Bass Strait platforms. Fur seals have been documented foraging along O&G pipelines in this region (Arnould et al., 2015). From the ROV imagery this is also a common behavior that may be correlated with ROV activities (i.e., using lights or waiting for the ROV to stir up prey). Prey items including jack mackerels (Trachurus spp.), rock cods (Pseudophycis spp.), wrasses (Labridae), marblefish (Aplodactylus arctidens), common gurnard perch (Neosebastes scorpaenoides), reef ocean perch (H. percoides) and leatherjackets (Monocanthidae) were identified from otoliths retrieved from fur seal diet and scat samples (Kirkwood et al., 2008). The northern Bass Strait has been a key location of fur seal breeding since the 1980s and Australian populations are still in recovery (Kirkwood et al., 2010). Primary pupping occurs on neighboring Bass Strait islands and fur seals may use platforms for teaching and hunting opportunities. Fur seals that use platforms may also gain some temporary protection from fishing as fur seals are sometimes accidental bycatch during fishing activities in south-east Australia (Australian Fisheries Management Authority (AFMA), 2019).
Although there were limitations on both data types used in this study, both are important to document the ecology of the region, which has been anthropogenically modified through fishing and O&G activities, resulting in a ‘novel ecosystem’ (Hobbs et al., 2006; Morse et al., 2014; van Elden et al., 2019). Visual imagery is useful to understand the behavior and location of marine life within O&G structures (Macreadie et al., 2018), which complements the fishery-dependent data of how communities vary in space and time. Future studies would benefit from more precise and robust data collection. The implementation of electronic logbooks has improved the timeliness of data capture, for example, but there is still room for improvement in species identification. When O&G structures began being built off the Victorian coastline in the late 1960s, these anthropogenic structures also influenced the marine communities but the direct and indirect effects of these physical structures on the biological community have largely been unknown. Many of these offshore structures are deep (> 30 m), restricting the ability of direct observations until the advent of underwater visual survey methods (e.g., towed cameras, ROVs, BRUVS). The marine communities around O&G structures may resemble some natural communities but are ‘novel ecosystems’ from the intentional or unintentional results of human activities (Hobbs et al., 2006). Novel ecosystems may have different species compositions and relative abundances than natural states (van Elden et al., 2019). The information on marine communities in the region is largely fishery-dependent data (e.g., Coleman and Mobley, 1984), with some O&G-specific information from limited past surveys on larval fish abundances near O&G structures (Neira, 2005). There have been no other published studies of the marine communities associated with these structures, which include some of the oldest O&G assets in Australia’s Exclusive Economic Zone, providing a historical element to the ecosystem modifications through time. Therefore, the information on fish and invertebrate species near and around O&G structures from this study provide useful ‘snapshots’ for this area of Australia. This information also contributes to understanding how Australian O&G structures compare to the infrastructure in other places of the world (e.g., North Sea, Gulf of Mexico, California) and provides a better understanding of how fish and invertebrate communities are adapting in the Anthropocene.
In summary, platforms house diverse and well-established communities of fish, invertebrates and benthic biota, with the greatest abundance of marine life at the base of these structures. Further, pipelines provide complex habitat where abundant invertebrates and fish are found but the composition of species is different among platforms and pipelines, with different subsets of fishery species observed near the platforms and pipelines surveyed. This means that pipeline and platform may have different decommissioning scenarios with some structures left in place for their habitat value. Although there was some overlap in fishery species observed between O&G structures it would be difficult to quantify direct and measured consequences of decommissioning with the caveats of the available data. We have described the marine communities around O&G structures using the existing industry-collected data, which is a critical first step to both understanding the ecological and successional role of O&G structures and how decommissioning these structures may affect the broader ecosystem. We have also identified a number of ways to improve future data collection for this region. It is important to remember that decommissioning activities will have direct effects on other local industries, such as fishing, with the greatest influence on local fishing fleets that regularly fish near the O&G structures.
The original contributions presented in the study are included in the article/Supplementary Material. Further inquiries can be directed to the corresponding author.
Ethical review and approval was not required for the animal study because no animals were collected as part of this research. This study included existing data sets of commercial fishing catch and underwater video methods.
TS, PM and DM conceived the study. TS and KC analyzed video data. TS analyzed fishery data. IY assisted with figures and formatting. TS and KC wrote the first draft of the manuscript and all authors contributed during multiple rounds of feedback. All authors contributed to the article and approved the submitted version.
EARPL provided the funding for publication fees of this manuscript and for the research allocation for TS, IY and KC.
We appreciate Esso Australia Resources Pty Ltd. for providing us access to their ROV imagery. Azivy Che Aziz and Sheela Veluayitham supported this research and provided contextual information on EARPL operations. Part of this manuscript appeared as an internal report for EARPL in 2021. We would like to thank Kehani Manson for fulfilling our AFMA data request. Thanks to our colleagues Martin Gomon, Dianne Bray and Joanne Taylor at Museums Victoria, Jeff Leis and Rudy Kuiter for their expertise and invaluable resources.
The reviewer SVE declared a shared affiliation with the authors KC and DM to the handling editor at the time of review.
The remaining authors declare that the research was conducted in the absence of any commercial or financial relationships that could be construed as a potential conflict of interest.
All claims expressed in this article are solely those of the authors and do not necessarily represent those of their affiliated organizations, or those of the publisher, the editors and the reviewers. Any product that may be evaluated in this article, or claim that may be made by its manufacturer, is not guaranteed or endorsed by the publisher.
The Supplementary Material for this article can be found online at: https://www.frontiersin.org/articles/10.3389/fmars.2022.979212/full#supplementary-material
Ajemian M. J., Wetz J. J., Shipley-Lozano B., Stunz G. W. (2015). Rapid assessment of fish communities on submerged oil and gas platform reefs using remotely operated vehicles. Fisheries Res. 167, 143–155. doi: 10.1016/j.fishres.2015.02.011
Althaus F., Hill N., Ferrari R., Edwards L., Przeslawski R., Schönberg C. H. L., et al. (2015). A standardised vocabulary for identifying benthic biota and substrata from underwater imagery: the CATAMI classification scheme. PLOS ONE doi: 10.1371/journal.pone.0141039
Anderson M. J. (2001). A new method for non-parametric multivariate analysis of variance. Aust. Ecol. 26, 32–46. doi: 10.1111/j.1442-9993.2001.01070.pp.x
Anderson M., Gorley R. N., Clarke R. K. (2008). Permanova+ for primer: Guide to software and statistical methods (Plymouth, UK: Primer-E).
Anderson M. J., Millar R. B. (2004). Spatial variation and effects of habitat on temperate reef fish assemblages in northeastern New Zealand. J. Exp. Mar. Biol. Ecol. 305, 191–221. doi: 10.1016/j.jembe.2003.12.011
Arnould J. P. Y., Monk J., Ierodiaconou D., Hindell M. A., Semmens J., Hoskins A. J., et al. (2015). Use of anthropogenic sea floor structures by Australian fur seals: potential positive ecological impacts of marine industrial development? PloS One 10 (7), e0130581. doi: 10.1371/journal.pone.0130581
Austin M. (2007). Species distribution models and ecological theory: A critical assessment and some possible new approaches. Ecol. Model. 200, 1–19. doi: 10.1016/j.ecolmodel.2006.07.005
Australian Biological Resources Study (ABRS) (2020) Australian Faunal directory. Available at: https://biodiversity.org.au/afd/home.
Australian Fisheries Management Authority (AFMA) (2019) Commonwealth trawl sector (Otterboard trawl and Danish seine) bycatch and discarding workplan 2018-2019. Available at: https://www.afma.gov.au/sites/default/files/cts_bycatch_and_discarding_workplan_2018-19_0.pdf?acsf_files_redirect.
Australian Fisheries Management Authority (AFMA) (2021) Small pelagic fishery (Canberra, ACT). Available at: https://www.afma.gov.au/fisheries/small-pelagic-fishery.
Australian Fisheries Management Authority (AFMA) (2022) Reported retained annual catch from commonwealth fisheries logbooks - dataset. Available at: https://data.gov.au/data/dataset/reported-retained-annual-catch-from-commonwealth-fisheries-logbooks (Accessed April 11, 2022).
Australian Government (2018). Offshore petroleum decommissioning guideline (Canberra, ACT: Australian Government Department of Industry, Science, Energy and Resources). Available at: www.nopta.gov.au.
Becker A., Taylor M. D., Lowry M. B. (2017). Monitoring of reef associated and pelagic fish communities on australia’s first purpose built offshore artificial reef. ICES J. Mar. Sci. 74, 277–285. doi: 10.1093/icesjms/fsw133
Birchenough S. N. R., Degraer S. (2020). Science in support of ecologically sound decommissioning strategies for offshore man-made structures: taking stock of current knowledge and considering future challenges. ICES J. Mar. Sci. 77 (3), 1075–1078. doi: 10.1093/icesjms/fsaa039
Blaber S. J. M., Bulman C. M. (1987). Diets of fishes of the upper continental slope of eastern Tasmania: content, calorific values, dietary overlap and trophic relationships. Mar. Biol. 95 (3), 345–356. doi: 10.1007/BF00409564
Blount C., Komyakova V., Barnes L., Smith M. L., Zhang D., Reeds K., et al. (2021). Using ecological evidence to refine approaches to deploying offshore artificial reefs for recreational fisheries. Bull. Mar. Sci. 97, 665–698. doi: 10.5343/bms.2020.0059
Bond T., Langlois T. J., Partridge J. C., Birt M. J., Malseed B. E., Smith L., et al. (2018a). Diel shifts and habitat associations of fish assemblages on a subsea pipeline. Fisheries Res. 206, 220–234. doi: 10.1016/j.fishres.2018.05.011
Bond T., McLean D. L., Wakefield C. B., Partridge J. C., Prince J., White D., et al. (2021). Quantifying fishing activity targeting subsea pipelines by commercial trap fishers. Rev. Fish Biol. Fish. 31, 1009–1023. doi: 10.1007/S11160-021-09686-4/FIGURES/8
Bond T., Partridge J. C., Taylor M. D., Langlois T. J., Malseed B. E., Smith L. D., et al. (2018b). Fish associated with a subsea pipeline and adjacent seafloor of the north West shelf of Western Australia. Mar. Environ. Res. 141, 53–65. doi: 10.1016/j.marenvres.2018.08.003
Bray D. J., Gomon M. F. (2021) Fishes of australia. museums Victoria and OzFishNet. Available at: http://fishesofaustralia.net.au.
Brunsdon C., Fotheringham A. S., Charlton M. E. (1996). Geographically weighted regression: A method for exploring spatial nonstationarity. Geogr. Anal. 28, 281–298. doi: 10.1111/j.1538-4632.1996.tb00936.x
Bull A. S., Love M. S. (2019). Worldwide oil and gas platform decommissioning: A review of practices and reefing options. Ocean Coast. Manage. 168 (October 2018), 274–306. doi: 10.1016/j.ocecoaman.2018.10.024
Burnham K., Anderson D. (2002). Model selection and multimodel inference: A practical information-theoretic approach (Berlin, New York: Springer-Verlag).
Butler A., Althaus F., Furlani D., Ridgway K. (2002). Assessment of the conservation values of the bass strait sponge. Available online: https://parksaustralia.gov.au/marine/pub/scientific-publications/archive/conservation-assessment-bass.pdf.
Caley M. J., St John J. (1996). Refuge availability structures assemblages of tropical reef fishes. J. Anim. Ecol. 65, 414–428. doi: 10.2307/5777
Champion C., IM S., JA S. (2015). Zooplanktivory is a key process for fish production on a coastal artificial reef. Mar. Ecol. Prog. Ser. 541, 1–14. doi: 10.3354/meps11529
Claisse J. T., Pondella D. J., Love M., Zahn L. A., Williams C. M., Williams J. P., et al. (2014). Oil platforms off California are among the most productive marine fish habitats globally. Proc. Natl. Acad. Sci. 111, 15462–15467. doi: 10.1073/pnas.1411477111
Coleman N., Mobley M. (1984). Diets of commercially exploited fish from bass strait and adjacent Victorian waters, south-eastern Australia. Mar. Freshw. Res. 35 (5), 549–560. doi: 10.1071/MF9840549
Commonwealth Scientific and Industrial Research Organisation (CSIRO) (2014) Securing the future of australia’s commercial fisheries - CSIRO. Available at: https://www.csiro.au/en/research/animals/Fisheries/Harvest-Strategy-Policy (Accessed May 3, 2022).
Dempster T., Kingsford M. J. (2003). Homing of pelagic fish to fish aggregation devices (FADs): the role of sensory cues. Mar. Ecol. Prog. Ser. 258, 213–222. doi: 10.3354/meps258213
Department of Jobs, Precincts and Regions (DJPR) (2021) Oil and gas in Victoria - earth resources. Available at: https://earthresources.vic.gov.au/geology-exploration/oil-gas/oil-and-gas-in-victoria (Accessed March 24, 2022).
Edgar G. J. (1997). “Australian Marine life the plants and animals of temperate waters,” in Reed books (Victoria, Australia: New Holland).
Ellis D., DeMartini E. (1995). Evaluation of a video camera technique for indexing abundances of juvenile pink snapper, Pristipomoides filamentosus, and other Hawaiian insular shelf fishes. Fish Bull. 93, 67–77. Available at: https://spo.nmfs.noaa.gov/content/evaluation-video-camera-technique-indexing-abundances-juvenile-pink-snapper-pristipomoides
Emery T., Marton N., Woodhams J., Curtotti R. (2021). “Commonwealth trawl and scalefish hook sectors,” in Department of agriculture, water and the environment commonwealth trawl and scalefish hook sectors (Canberra, ACT: Department of Agriculture). Available at: https://www.agriculture.gov.au/abares/research-topics/fisheries/fishery-status/trawl-scalefish-hook-sectors.
Esso Australia (2022) Esso history. Available at: https://www.exxonmobil.com.au/company/who-we-are/esso-history (Accessed October 11, 2022).
Fisheries Research and Development Corporation (FRDC) (2020) Status of Australian fish stocks reports. Available at: https://www.fish.gov.au (Accessed May 3, 2022).
Fisher R., Wilson S. K., Sin T. M., Lee A. C., Langlois T. J. (2018). A simple function for full-subsets multiple regression in ecology with r. Ecol. Evol. 8, 6104–6113. doi: 10.1002/ece3.4134
Florisson J. H., Rowland A. J., Harvey E. S., Allen M. B., Watts S. L., Saunders B. J., et al. (2020). King reef: An Australian first in repurposing oil and gas infrastructure to benefit regional communities. APPEA J. 60, 435–439. doi: 10.1071/AJ19134
Fowler A. M., Booth D. J. (2012). Evidence of sustained populations of a small reef fish on artificial structures. does depth affect production on artificial reefs? J. Fish Biol. 80, 613–629. doi: 10.1111/j.1095-8649.2011.03201.x
Fowler A. M., Jørgensen A. M., Coolen J. W. P., Jones D. O. B., Svendsen J. C., Brabant R., et al. (2020). The ecology of infrastructure decommissioning in the north Sea: what we need to know and how to achieve it. ICES J. Mar. Sci. 77 (3), 1109–1126. doi: 10.1093/icesjms/fsz143
Goetze J. S., Langlois T. J., McCarter J., Simpfendorfer C. A., Hughes A., Leve J. T., et al. (2018). Drivers of reef shark abundance and biomass in the Solomon islands. PlosONE 13, e0200960. doi: 10.1371/journal.pone.0200960
Gomon M., Bray D., Kuiter R. H. (2008). Fishes of australia’s southern coast (Australia: New Holland Publishers).
Gowlett-Holmes K. (2008). A field guide to the marine invertebrates of south Australia (Tasmania, Australia: Notomares).
Great Southern Reef (GSR) (2021). Great southern reef (Australia: The Great Southern Reef project). Available at: https://greatsouthernreef.com.
Harrison H. B., Williamson D. H., Evans R. D., Almany G. R., Thorrold S. R., Russ G. R., et al. (2012). Larval export from marine reserves and the recruitment benefit for fish and fisheries. Curr. Biol. 22, 1023–1028. doi: 10.1016/j.cub.2012.04.008
Hastie T., Tibshirani R. (1986). Generalized additive models. Stat. Sci. 1, 297–310. doi: 10.1214/ss/1177013604
Hastings R. W., Ogren L. H., Mabry M. T. (1976). Observations on the fish fauna associated with offshore platforms in the northeastern gulf of Mexico. Fish. Bull.;(United States) 74 (2), 387–402. Available at: https://spo.nmfs.noaa.gov/content/observations-fish-fauna-associated-offshore-platforms-northeastern-gulf-mexico
Hernandez F. J., Shaw R. F., Cope J. S., Ditty J. G., Farooqi T., Benfield M. C. (2003). The across-shelf larval, postlarval, and juvenile fish assemblages collected at offshore oil and gas platforms west of the Mississippi river delta. Am. Fisheries Soc. Symposium 36, 39–72.
Hobbs R. J., Arico S., Aronson J., Baron J. S., Bridgewater P., Cramer V. A., et al. (2006). Novel ecosystems: Theoretical and management aspects of the new ecological world order. Global Ecol. Biogeography 15 (1), 1–7. doi: 10.1111/j.1466-822X.2006.00212.x
Jones D. S., Morgan G. J. (2002). A field guide to crustaceans of Australian waters: 2nd edition (Australia: New Holland Publishers).
Kashubsky M., Morrison A. (2013). Security of offshore oil and gas facilities: exclusion zones and ships’ routeing. Aust. J. Maritime Ocean Affairs 5 (1), 1–10. doi: 10.1080/18366503.2013.10815725
Kirkwood R., Hume F., Hindell M. (2008). Sea Temperature variations mediate annual changes in the diet of Australian fur seals in bass strait. Mar. Ecol. Prog. Ser. 369, 297–309. doi: 10.3354/meps07633
Kirkwood R., Pemberton D., Gales R., Hoskins A. J., Mitchell T., Shaughnessy P. D., et al. (2010). Continued population recovery by Australian fur seals. Mar. Freshw. Res. 61, 695–701. doi: 10.1071/MF09213
Koopman M., Knuckey I., Cahill M. (2018) Improving the location and targeting of economically viable aggregations of squid available to the squid jigging method and the fleet’s ability to catch squid (Queenscliff, VIC). Available at: https://www.afma.gov.au/sites/default/files/afma_project_2016_0809_-_improving_targeting_of_squid.pdf (Accessed May 3, 2022).
Larsson J. (2021) Eulerr: Area-proportional Euler and Venn diagrams with ellipses_. r package version 6.1.1. Available at: https://CRAN.R-project.org/package=eulerr.
Lehmann A., Overton J. M., Leathwick J. R. (2002). GRASP: generalized regression analysis and spatial prediction. Ecol. Modell 157, 189–207. doi: 10.1016/S0304-3800(02)00195-3
Lindenmayer D. B., Nix H. A. (1993). Ecological principles for the design of wildlife corridors. Conserv. Biol. 7, 627–630. doi: 10.1046/j.1523-1739.1993.07030627.x
Love M. S., Caselle J. E., Snook L. (2000). Fish assemblages around seven oil platforms in the Santa Barbara channel area. Fishery Bull. 98 (1), 96–117. Available at: https://spo.nmfs.noaa.gov/content/fish-assemblages-around-seven-oil-platforms-santa-barbara-channel-area
Love M. S., Claisse J. T., Roeper A. (2019). An analysis of the fish assemblages around 23 oil and gas platforms off California with comparisons with natural habitats. Bull. Mar. Sci. 95 (4), 477–514. doi: 10.5343/bms.2018.0061
Lowry M. B., Glasby T. M., Boys C. A., Folpp H., Suthers I., Gregson M. (2014). Response of fish communities to the deployment of estuarine artificial reefs for fisheries enhancement. Fisheries Manage. Ecol. 21, 42–56. doi: 10.1111/fme.12048
Macreadie P. I., Fowler A. M., Booth D. J. (2011). Rigs-to-reefs: will the deep sea benefit from artificial habitat? Front. Ecol. Environ. 9, 455–461. doi: 10.1890/100112
Macreadie P. I., McLean D. L., Thomson P. G., Partridge J. C., Jones D. O. B., Gates A. R., et al. (2018). Eyes in the sea: unlocking the mysteries of the ocean using industrial, remotely operated vehicles (ROVs). Sci. Total Environ. 634, 1077–1091. doi: 10.1016/j.scitotenv.2018.04.049
McLean D., Bond T., Harvey E. S., Ierodiaconou D., Cure K., Taylor M., et al. (2021a). Importance of australia’s offshore oil and gas infrastructure for fish. APPEA J. 61, 429–437. doi: 10.1071/AJ20106
McLean D. L., Cure K., Abdul Wahab M. A., Galaiduk R., Birt M., Vaughan B., et al. (2021b). A comparison of marine communities along a subsea pipeline with those in surrounding seabed areas. Continental Shelf Res. 219, 104394. doi: 10.1016/j.csr.2021.104394
McLean D. L., Parsons M. J. G., Gates A. R., Benfield M. C., Bond T., Booth D. J., et al. (2020a). Enhancing the scientific value of industry remotely operated vehicles (ROVs) in our oceans. Front. Mar. Sci. 7 (April). doi: 10.3389/fmars.2020.00220
McLean D. L., Partridge J. C., Bond T., Birt M. J., Bornt K. R., Langlois T. J. (2017). Using industry ROV videos to assess fish associations with subsea pipelines. Continental Shelf Res. 141 (December 2016), 76–97. doi: 10.1016/j.csr.2017.05.006
McLean D. L., Taylor M. D., Ospina A. G., Partridge J. C. (2019). An assessment of fish and marine growth associated with an oil and gas platform jacket using an augmented remotely operated vehicle. Continental Shelf Res. 179, 66–84. doi: 10.1016/j.csr.2019.04.006
McLean D. L., Vaughan B. I., Malseed B. E., Taylor M. D. (2020b). Fish-habitat associations on a subsea pipeline within an Australian marine park. Mar. Environ. Res. 153, 104813. doi: 10.1016/j.marenvres.2019.104813
Meyer-Gutbrod E. L., Love M. S., Schroeder D. M., Claisse J. T., Kui L., Miller R. J. (2020). Forecasting the legacy of offshore oil and gas platforms on fish community structure and productivity. Ecol. Appl. 30 (8), 1–16. doi: 10.1002/eap.2185
Morais R. A., Bellwood D. R. (2019). Pelagic subsidies underpin fish productivity on a degraded coral reef. Curr. Biol. 29 (9), 1521–1527.e6. doi: 10.1016/j.cub.2019.03.044
Morse N. B., Pellissier P. A., Cianciola E. N., Brereton R. L., Sullivan M. M., Shonka N. K., et al. (2014). Novel ecosystems in the anthropocene: A revision of the novel ecosystem concept for pragmatic applications. Ecol. Soc. 19 (2), 12. doi: 10.5751/ES-06192-190212
Neira F. J. (2005). Summer and winter plankton fish assemblages around offshore oil and gas platforms in south-eastern Australia. Estuarine Coast. Shelf Sci. 63 (4), 589–604. doi: 10.1016/j.ecss.2005.01.003
Novaglio C., Smith A. D. M., Frusher S., Ferretti F., Klaer N., Fulton E. A. (2018). Fishery development and exploitation in south East Australia. Front. Mar. Sci. 5, 145. doi: 10.3389/fmars.2018.00145
Paxton A. B., Shertzer K. W., Bacheler N. M., Kellison G. T., Riley K. L., Taylor J. C. (2020). Meta-analysis reveals artificial reefs can be effective tools for fish community enhancement but are not one-Size-Fits-All. Front. Mar. Sci. doi: 10.3389/fmars.2020.00282
Pitcher C. R., Doherty P. J., Anderson T. J. (2009). “Seabed environments, habitats and biological assemblages,” in The great barrier reef: biology, environment and management (Dordrecht: Springer), 551–558.
Potts J. M., Elith J. (2006). Comparing species abundance models. Ecol. Modell 199, 153–163. doi: 10.1016/j.ecolmodel.2006.05.025
Prince J. D. (2001). Ecosystem of the south East fishery (Australia), and fisher lore. Mar. Freshw. Res. 52 (4), 431–449. doi: 10.1071/MF00042
QGIS.org (2022). QGIS geographic information system (QGIS Association). Available at: https://www.qgis.org/en/site/.
R Core Team (2020). “R: A language and environment for statistical computing,” in R foundation for statistical computing (Vienna, Austria: the R Project). Available at: https://www.R-project.org/.
Richardson K., Hardesty B. D., Wilcox C. (2019). Estimates of fishing gear loss rates at a global scale: A literature review and meta-analysis. Fish Fisheries 20 (6), 1218–1231. doi: 10.1111/faf.12407
Rountree R. A. (1989). Association of fishes with fish aggregation devices: effects of structure size on fish abundance. Bull. Mar. Sci. 44 (2), 960–972. Available at: https://www.ingentaconnect.com/content/umrsmas/bullmar/1989/00000044/00000002/art00040
Rouse S., Hayes P., Wilding T. A. (2020). Commercial fisheries losses arising from interactions with offshore pipelines and other oil and gas infrastructure and activities. ICES J. Mar. Sci. 77 (3), 1148–1156. doi: 10.1093/icesjms/fsy116
Sanchez-Jerez P., Fernandez-Jover D., Uglem I., Arechavala-Lopez P., Dempster T., Bayle-Sempere J. T., et al. (2011). “Coastal fish farms as fish aggregation devices (FADs),” in Artificial reefs in fishery management (FL, USA: CRC Press. Taylor & Francis Group), 187–208.
Schultz A. L., Malcolm H. A., Bucher D. J., Linklater M., Smith S. D. A. (2014). Depth and medium-scale spatial processes influence fish assemblage structure of unconsolidated habitats in a subtropical marine park. PloS One 9 (5). doi: 10.1371/journal.pone.0096798
SeaGIS (2021a) EventMeasure software. Available at: https://www.seagis.com.au/event.html.
SeaGIS (2021b) TransectMeasure software. Available at: https://www.seagis.com.au/transect.html.
Shaw J. L., Seares P., Newman S. J. (2018). Decommissioning offshore infrastructure: A review of stakeholder views and science priorities (Perth: Western Australian Marine Science Institute). Available at: www.wamsi.org.au/decommissioning-offshore-infrastructure-reviewstakeholder-views-and-science-priorities.
Smith J. A., Cornwell W. K., Lowry M. B., Suthers I. M. (2017). Modelling the distribution of fish around an artificial reef. Mar. Freshw. Res. 68, 1955. doi: 10.1071/MF16019
Smith J. A., Lowry M. B., Champion C., Suthers I. M. (2016). A designed artificial reef is among the most productive marine fish habitats: new metrics to address ‘production versus attraction.’. Mar. Biol. 163, 188. doi: 10.1007/s00227-016-2967-y
Smith J. A., Lowry M. B., Suthers I. M. (2015). Fish attraction to artificial reefs not always harmful: A simulation study. Ecol. Evol. 5, 4590–4602. doi: 10.1002/ece3.1730
Sommer B., Fowler A. M., Macreadie P. I., Palandro D. A., Aziz A. C., Booth D. J. (2018). Decommissioning of offshore oil and gas structures - environmental opportunities and challenges. Sci. Total Environment. 658, 973–981. doi: 10.1016/j.scitotenv.2018.12.193
Stasko A. D., Swanson H., Majewski A., Atchison S., Reist J., Power M. (2016). Influences of depth and pelagic subsidies on the size-based trophic structure of Beaufort Sea fish communities. Mar. Ecol. Prog. Ser. 549, 153–166. doi: 10.3354/meps11709
Thomson P. G., Fowler A. M., Davis A. R., Pattiaratchi C. B., Booth D. J. (2018). Some old movies become classics – a case study determining the scientific value of ROV inspection footage on a platform on australia’s north West shelf. Front. Mar. Sci. 5 (DEC). doi: 10.3389/fmars.2018.00471
Todd V. L. G., Lavallin E. W., Macreadie P. I. (2018). Quantitative analysis of fish and invertebrate assemblage dynamics in association with a north Sea oil and gas installation complex. Mar. Environ. Res. 142, 69–79. doi: 10.1016/j.marenvres.2018.09.018
Todd V. L. G., Lazar L., Williamson L. D., Peters I. T., Hoover A. L., Cox S. E., et al. (2020a). Underwater visual records of marine megafauna around offshore anthropogenic structures. Front. Mar. Sci. 7, 230. doi: 10.3389/fmars.2020.00230
Todd V. L. G., Williamson L. D., Cox S. E., Todd I. B., Macreadie P. I. (2020b). Characterizing the first wave of fish and invertebrate colonization on a new offshore petroleum platform. ICES J. Mar. Sci. 77 (3), 1127–1136. doi: 10.1093/icesjms/fsz077
van der Stap T., Coolen J. W. P., Lindeboom H. J. (2016). Marine fouling assemblages on offshore gas platforms in the southern north Sea: Effects of depth and distance from shore on biodiversity. PloS One 11 (1), e0146324. doi: 10.1371/journal.pone.0146324
van Elden S., Meeuwig J. J., Hobbs R. J., Hemmi J. M. (2019). Offshore oil and gas platforms as novel ecosystems: A global perspective. Front. Mar. Sci. 6 (548). doi: 10.3389/fmars.2019.00548
Wickham H., Averick M., Bryan J., Chang W., McGowan L. D., Francois R., et al. (2019). Welcome to the tidyverse. J. Open Source Software 4 (43), 1686. doi: 10.21105/joss.016861
Wilkinson L. (2012). Exact and approximate area-proportional circular Venn and Euler diagrams. IEEE Trans. Visualization Comput. Graphics (Internet). 18 (2), 321–31. doi: 10.1109/TVCG.2011.56
Williams A., Bax N. J. (2001). Delineating fish-habitat associations for spatially based management: An example from the south-eastern Australian continental shelf. Mar. Freshw. Res. 52 (4), 513–536. doi: 10.1071/MF00017
Willis T., Babcock R. (2000). A baited underwater video system for the determination of relative density of carnivorous reef fish. Mar. Freshw. Res. 51, 755–763. doi: 10.1071/MF00010
Wilson R., Norman M., Syme A. (2010). An introduction to marine life (Melbourne, Australia: Museums Victoria), 166 p.
Yan L. L. (2021) Ggvenn: Draw Venn diagram by 'ggplot2'. r package version 0.1.9. Available at: https://CRAN.R-project.org/package=ggvenn.
Young J. W., Bradford R. W., Lamb T. D., Lyne V. D. (1996). Biomass of zooplankton and micronekton in the southern bluefin tuna fishing grounds off eastern Tasmania, Australia. Mar. Ecol. Prog. Ser. 138, 1–14. doi: 10.3354/meps138001
Young J. W., Lamb T. D., Le D., Bradford R. W., Whitelaw A. W. (1997). Feeding ecology and interannual variations in diet of southern bluefin tuna, Thunnus maccoyii, in relation to coastal and oceanic waters off eastern Tasmania, Australia. Environ. Biol. Fishes 50 (3), 275–291. doi: 10.1023/A:1007326120380
Keywords: oil & gas infrastructure, fisheries, anthropogenic structures, marine communities, temperate marine ecosystems, remotely operated vehicle (ROV)
Citation: Sih TL, Cure K, Yilmaz IN, McLean D and Macreadie PI (2022) Marine life and fisheries around offshore oil and gas structures in southeastern Australia and possible consequences for decommissioning. Front. Mar. Sci. 9:979212. doi: 10.3389/fmars.2022.979212
Received: 27 June 2022; Accepted: 21 October 2022;
Published: 21 November 2022.
Edited by:
Victoria Louise Georgia Todd, Ocean Science Consulting Ltd., United KingdomReviewed by:
Holden Earl Harris, University of Florida, United StatesCopyright © 2022 Sih, Cure, Yilmaz, McLean and Macreadie. This is an open-access article distributed under the terms of the Creative Commons Attribution License (CC BY). The use, distribution or reproduction in other forums is permitted, provided the original author(s) and the copyright owner(s) are credited and that the original publication in this journal is cited, in accordance with accepted academic practice. No use, distribution or reproduction is permitted which does not comply with these terms.
*Correspondence: Tiffany L. Sih, dC5zaWhAZGVha2luLmVkdS5hdQ==
Disclaimer: All claims expressed in this article are solely those of the authors and do not necessarily represent those of their affiliated organizations, or those of the publisher, the editors and the reviewers. Any product that may be evaluated in this article or claim that may be made by its manufacturer is not guaranteed or endorsed by the publisher.
Research integrity at Frontiers
Learn more about the work of our research integrity team to safeguard the quality of each article we publish.