 Jed Kempf
 Patricia Breen2
 Emer Rogan
 David G. Reid
- 1'School of Biological, Earth & Environmental Sciences, University College Cork, Cork, Ireland
- 2Marine Institute, Rinville, Oranmore Co., Galway, Ireland
The Celtic Sea is a productive fishing ground, therefore identifying the relative importance of fishing and environmental factors on fish stock dynamics is crucial for developing our understanding of sustainable yields and to operationalize Ecosystem Based Fisheries Management (EBFM). We investigated the effect of environmental variables and fishing on the relative abundance inferred from catch-per-unit-effort (CPUE), of twelve demersal stocks (i.e., cod, haddock, whiting, anglerfish, hake, megrim, plaice, sole, lesser-spotted dogfish, spurdog, Trisopterus spp., skates and rays) in the Celtic Sea from 1997 to 2019 (23 years). Annualized time series (1997-2019) of net primary production, bottom temperature, copepod abundance (Calanus finmarchicus and Calanus helgolandicus) and North Atlantic Oscillation index were used to characterize key environmental variables. Fishing exploitation rates (F/FMSY) were used to represent fishing pressure and CPUE trends derived from an International Bottom Trawl Survey (IBTS) were used to infer abundance. We used redundancy analysis to identify key explanatory variables and then dynamic factor analysis to assess their relationships with the CPUE series and identify underlying patterns in the unexplained temporal variation. Our results show that for the majority of demersal fish species, the CPUE trends were strongly influenced by fishing exploitation rates. The gradual reduction in exploitation rates observed throughout the study period most likely led to the partial recovery of cod, spurdog, hake, megrim, plaice, whiting, Trisopterus spp., and the skates and rays. In addition, exploitation patterns on one stock influenced CPUE trends of other demersal stocks (e.g., hake, megrim, plaice, lesser-spotted dogfish, sole). We also observed that the CPUE of whiting, hake and plaice increased when C. finmarchicus were abundant in the plankton. We infer from our findings in the investigated time series that the recovery of cod, spurdog, hake, megrim, plaice, whiting, Trisopterus spp., and the skates and rays in the Celtic Sea remains dependent on controlling fishing mortality, and this would not, at least for now, be confounded by the environmental conditions.
1 Introduction
Food security, livelihoods and coastal economies dependent on marine capture fisheries are connected to the dynamics of the fish populations they exploit. Fish populations fluctuate when gains attributed to recruitment and growth, and losses caused by natural and fishing mortality are imbalanced (Sissenwine, 1984). Fishing mortality (F) – the proportion of stock removed by fishing - is the most influential demographic factor that fisheries managers have direct control over, yet there are several demersal stocks (e.g., Irish Sea cod, Baltic Sea cod and herring) that have failed to rebuild despite marked reductions in fishing mortality (e.g., Möllmann et al., 2014; Bentley et al., 2020). It is likely that the environmental conditions play a role, particularly on recruitment success (Szuwalski et al., 2015; Zimmermann et al., 2019), because species are constrained by multiple dimensions of their ecological niche (e.g., temperature, salinity, habitat, predator and prey abundance) (Hutchinson, 1957). Identifying the relative importance of fishing and environmental factors on commercial stock dynamics is essential for effective management (Bindoff et al., 2019; Baudron et al., 2020) and to operationalize Ecosystem-Based Fisheries Management (EBFM) (Link et al., 2020).
To identify the relative roles of fishing and environmental conditions, biotic and abiotic variables are combined into an ecological time series (e.g., Erzini, 2005; Möllmann et al., 2009; Möllmann et al., 2014; Eriksen et al., 2017). In ecosystems that have been extensively monitored (e.g., Irish Sea, North Sea, Baltic Sea and the Barents Sea) and where long ecological time series have been maintained, research has identified environmental drivers (Erzini, 2005; Eriksen et al., 2017; Bentley et al., 2020) and regime shifts (Möllmann et al., 2009; Möllmann et al., 2014). Bentley et al. (2020), for example, proposed that cod (Gadus morhua) and whiting (Merlangius merlangus) recruitment - an important parameter in stock dynamics - in the Irish Sea was impaired by unsustainable fishing pressure coupled with the Atlantic Multidecadal Oscillation transitioning from a negative to a positive phase. In addition, herring (Clupea harengus) recruitment was positively correlated with large zooplankton abundance. In the Baltic Sea, unsustainable fishing pressure followed by an abrupt period of low salinity, hypoxic conditions, high temperatures and increased nutrient concentration reorganized the biotic component from a cod (Gadus morhua) to sprat (Sprattus sprattus) dominated ecosystem (Möllmann et al., 2009; Möllmann et al., 2014). In the North Sea, flatfish recruitment was linked to salinity changes and gadoid recruitment changed with sea surface temperature and calanoid copepod composition (Beaugrand, 2004). In southern Portugal, the landings of sardine (Sardina pilchardus) and cuttlefish (Sepia officinalis) had a positive relationship with the discharge of the Guadiana river (Erzini, 2005). Finally, the increase of recruitment of herring, blue whiting and cod in the Barents Sea was associated with the increased influx of warm Atlantic water transporting krill and 0-group fish into the ecosystem (Eriksen et al., 2017). From these studies it is clear that environmental variability affects fish stock dynamics and this understanding is required to make EBFM operational.
However, identifying drivers of ecosystem change is challenging because marine ecosystems are complex and dynamic. Ideally, all ecosystem components should be integrated into an ecosystem assessment to capture the totality of the system but short ecological time series, and therefore small sample sizes, limits statistical robustness. Including numerous explanatory variables to identify drivers increases model complexity which may overfit models, identify spurious relationships and fail to replicate findings with additional observations (Babyak, 2004; Heinze and Dunkler, 2017). Furthermore, time series often contain autocorrelated and non-stationary processes that can inflate correlation values and therefore temporal structures need be accounted for when applying numerical analyses (Vanhatalo and Kulahci, 2016; Planque and Arneberg, 2018). Principal component analysis (PCA) is a common multivariate technique used to summarize the dynamics of marine ecosystems (Möllmann et al., 2009; Möllmann et al., 2014; Eriksen et al., 2017). However, temporal structures can severely impair the descriptive performance of PCA to the point that strong patterns and spurious correlations emerge from randomly-generated time series (Planque and Arneberg, 2018). An evaluation of the descriptive performance of several multivariate techniques identified redundancy analysis (RDA) and dynamic factor analysis (DFA) as potentially useful tools for analyzing short time series that contain autocorrelated and stationary processes (ICES, 2022a).
This study focuses on the Celtic Sea, a productive shelf sea (Moullec et al., 2017) located south of Ireland, where there are substantial commercial stocks which are important both commercially and socially. Intensive fishing since World War II has led to a depleted ecosystem (Gascuel et al., 2016; Hernvann and Gascuel, 2020) where commercial fish exhibit truncated length distributions and impoverished age structures (Guénette and Gascuel, 2012). A long fishing history may have selected the most resilient species and shaped adaptable communities (Blanchard et al., 2004). Fishing itself produces other pressures on the ecosystem (e.g., bycatch, abrasion, litter) and likely contravenes legislative requirements set out in various EU policies (Pedreschi et al., 2019). Enforceable management measures introduced by successive reforms of the Common Fisheries Policy (CFP) (European Commission, 2002; European Parliament and European Council, 2013) have gradually reduced fishing mortality and the biomass of some commercial Celtic Sea stocks appear to have gradually recovered (Fernandes and Cook, 2013; ICES, 2020; ICES, 2021). Consequently, the latest Celtic Sea ecological model (i.e., Ecopath with Ecosim) identified fishing pressure as the primary driver of ecosystem change from 1985 to 2016 (Hernvann et al., 2020). Although fishing pressure was found to be the dominant driver in the Celtic Sea the integration of environmental variables, particularly temperature and primary production, improved the fit of the ecological model (Hernvann et al., 2020). Interestingly, other studies that focused on the Celtic Sea in a similar time frame found that the structure of demersal assemblages were driven by depth, chlorophyll a and bottom temperature (Mérillet et al., 2020) and the abundance of demersal species was driven by the abundance of small pelagics (e.g., European anchovy) via a bentho-pelagic trophic link (Eme et al., 2022). Considering the different results of the reported studies the relative importance of fishing and the environment on the abundance of demersal populations in the Celtic Sea remains unclear. Additional time points and the application of multivariate techniques that account for temporal structures in the data may reveal subtle ecological relationships that are important for informing and operationalizing EBFM.
We tested the hypothesis that the abundance of demersal stocks in the Celtic Sea from 1997 to 2019 (23 years) was driven by both fishing pressure and the environment. To reduce the risk of identifying spurious relationships and overfitting models we selected variables that characterize key components of the Celtic sea ecosystem based on recent studies (Goikoetxea and Irigoien, 2013; Hernvann et al., 2020; Mérillet et al., 2020; Eme et al., 2022). To account for autocorrelation and non-stationary processes in the data we applied multivariate techniques that account for temporal structures.
2 Materials and methods
2.1 Study area, sampling, and taxa
This study focused on demersal shelf communities within the 200m isobath. Data from variables that occurred within the boundary of the study area (Figure 1) were extracted (spatially subset) and used in the analysis, except for the North Atlantic Oscillation index which is a global variable. We used data from the French bottom trawl survey (EVHOE), part of the International Bottom Trawl Survey (IBTS), to calculate catch-per-unit-effort (CPUE) because this survey has the greatest spatio-temporal coverage of the Celtic Sea and is a reliable source of fisheries independent data (ICES, 2017). In addition, the survey records non-commercial species (e.g., Trisopterus spp.) and the small mesh size (20mm in the cod end) captures small species and juveniles of commercial species whose biomass is underrepresented in fisheries dependent data. The annual survey takes place during the fourth quarter (October-December) and uses the same vessel (RV Thallassa II), gear (GOV 36/47 bottom otter trawl) and sampling strategy for the study period (ICES, 2017). This consistency ensures comparability between consecutive years. Considerable efforts by Moriarty et al. (2017) have produced a quality assured version of the EVHOE dataset for the period 1997-2016 (Moriarty and Greenstreet, 2017). We extended the time series to 2019 using the same procedure (Moriarty et al., 2017) to calculate effort (i.e., swept area) and maintain consistent time series.
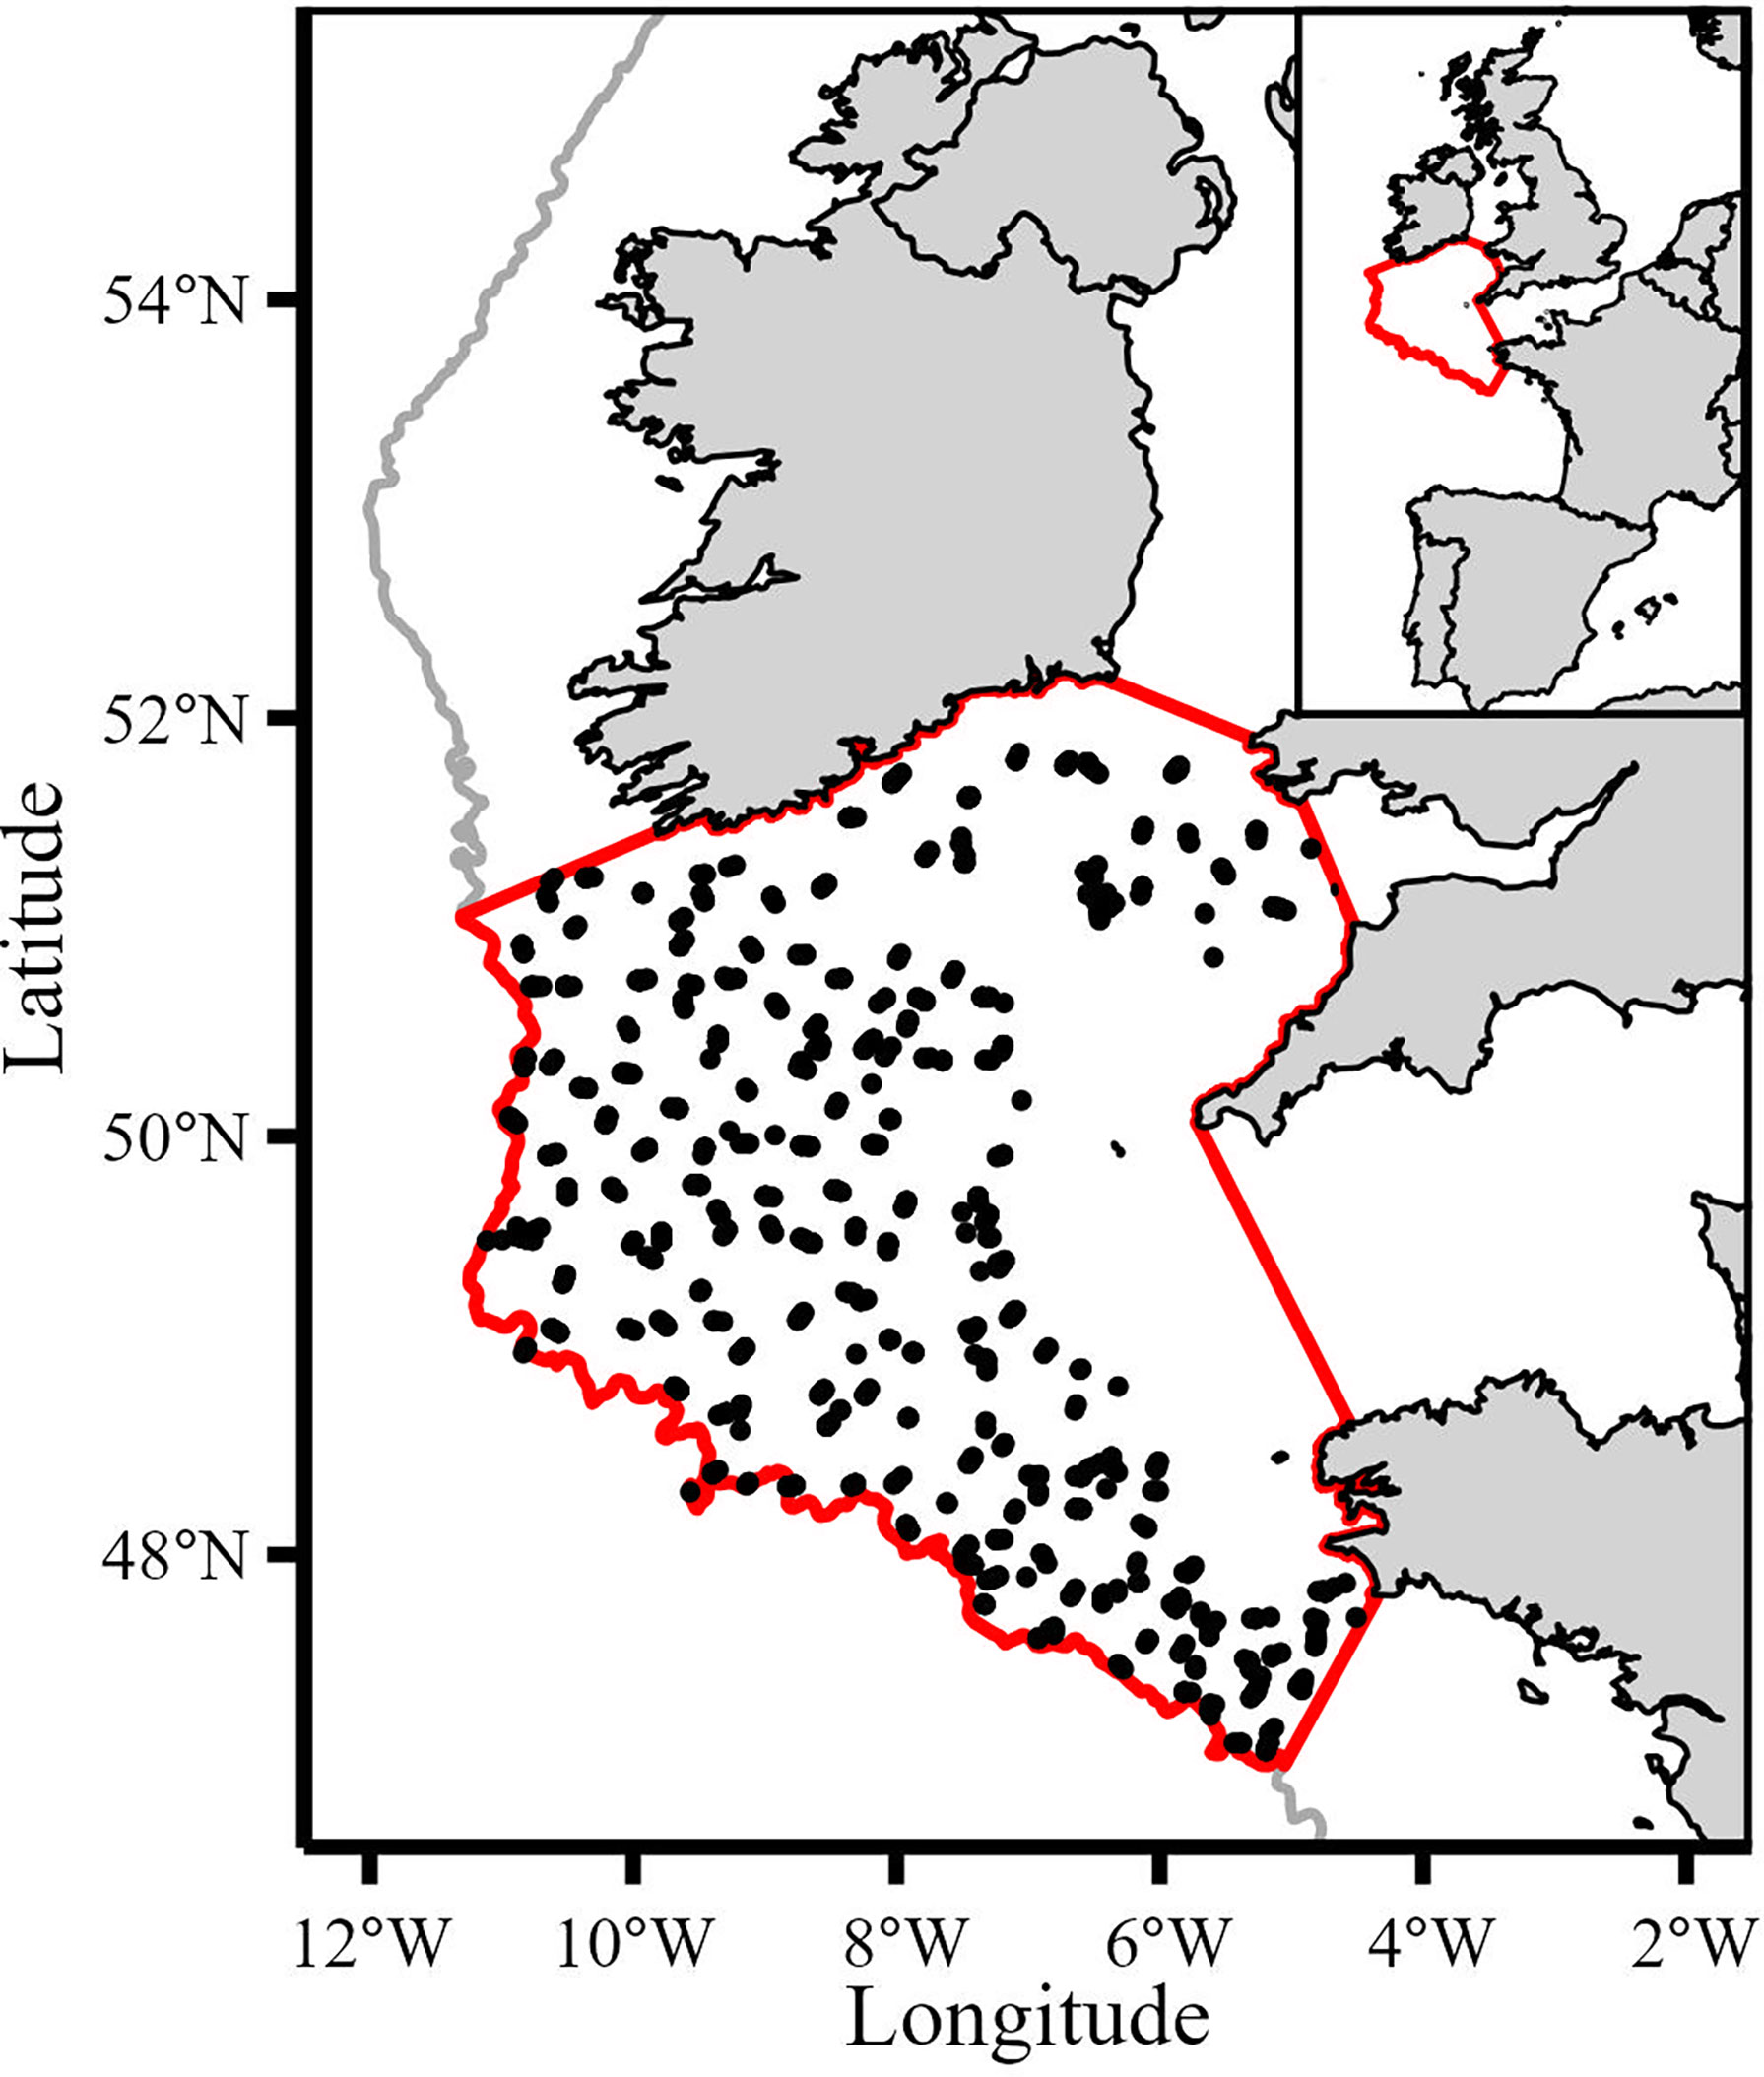
Figure 1 Map of study area (bounded by the red line) and the 1534 IBTS haul locations used (black points). Grey line denotes 200m isobath.
The dataset was spatially subset to the study area resulting in 1534 valid hauls from 1997 to 2019. Biomass (kg) was calculated by summing the weight across all length classes for each taxon in each haul. Swept area (km2) was calculated by multiplying wing spread by haul distance for each haul. To calculate annual CPUE values we used the geometric mean because it is scale invariant and less sensitive to outliers (Fraser et al., 2007; Campbell, 2015; Sala, 2018). Catch composition varied between hauls with some observations containing zero values so we added an offset of one to all values to calculate the geometric mean. This offset had no impact on the dataset because this study investigated trends in the index of relative abundance (CPUE) and not absolute values. Annualized CPUE series were expressed as biomass per swept area (kg per km2). Several species in the Celtic Sea are managed under a single Total Allowable Catch (TAC). For example, black-bellied anglerfish (Lophius budegessa) and white anglerfish (Lophius piscatorius) are managed under a combined TAC. We combined the CPUE of species that are managed under combined TAC based on the assumption that changes in exploitative patterns imposed on species with combined TACs would manifest as signals in the combined CPUE. CPUEs represented by several species/stocks were anglerfish (ANF; Lophius piscatorius, L. budegassa), megrim (LEZ; Lepidorhombus whiffiagonis and L. boscii) and skates and rays (RAJ; Dipturus batis, Leucoraja naevus, Raja montagui, Raja clavata, Raja microocellata, Raja brachyura and Leucoraja fullonica). The CPUE at the species level were cod (COD; Gadus morhua), haddock (HAD; Melanogrammus aeglefinus), whiting (WHG: Merlangius merlangus), hake (HKE; Merluccius merluccius), lesser-spotted dogfish (SYC; Scyliorhinus canicula), sole (SOL; Solea solea), plaice (PLE; Pleuronectes platessa) and spurdog (DGS; Squalus acanthias). Although not managed or commercially exploited, Trisopterus spp. are important prey for higher trophic levels (Crozier, 1985; Trenkel et al., 2005; Gosch et al., 2014) so we combined Trisopterus minutus, T. esmarkii and T. luscus into a combined CPUE (XOD). The IBTS survey did not operate in the Celtic Sea in 2017 due to mechanical failure so the missing time points in 2017 were interpolated using a centered 5-year moving average for each CPUE series.
2.2 Fishing variables
To capture broad trends in fishing pressure in the study area we used fishing exploitation rates (FER) for commercially important stocks delineated by the International Council for the Exploration of the Sea (ICES). FER was calculated by dividing instantaneous fishing mortality (F) by the fishing mortality required to achieve Maximum Sustainable Yield (FMSY) for stocks whose time series were of sufficient length (i.e., 1997-2019) and where the stock assessment areas were compatible with the study area (i.e., not including stocks which extended well beyond the study area such as hake).We used F/FMSY as an indicator of the degree to which stocks were fished sustainably (i.e., F/FMSY ≤ 1 indicates a sustainably fished stock). Reference values (F and FMSY) were sourced from ICES stock assessment summaries (ICES, 2020; ICES, 2021). Further details on the stock assessment models used to calculate F and FMSY can be found in the stock assessment summaries (ICES, 2020; ICES, 2021). The ICES Celtic Sea stocks included in the analysis were haddock (had.27.7b-k), megrim (meg.27.7b-k,8abd), plaice (ple.27.7fg), sole (sol.27.7fg) and cod (cod.27.7e-k). Initially, stock-specific F/FMSY series were included as separate variables however the trends were remarkably similar (Figure 2) with Pearson’s correlation coefficient indicating high degrees of collinearity between haddock, megrim, sole and plaice F/FMSY series, r(21) ≥.41, p ≤ 0.05 (Supplementary Figure 1). To reduce the risk of overfitting models by introducing too many correlated explanatory variables we used stock-specific catches (landings plus discards) available from the stock assessment summaries (ICES, 2020; ICES, 2021) to calculate a catch weighted mean exploitation rate (FER) for haddock, megrim, plaice and sole stocks (Figure 2). This reduced the number of variables that characterized exploitation rates from five to two variables while still capturing the main trends in exploitation patterns.
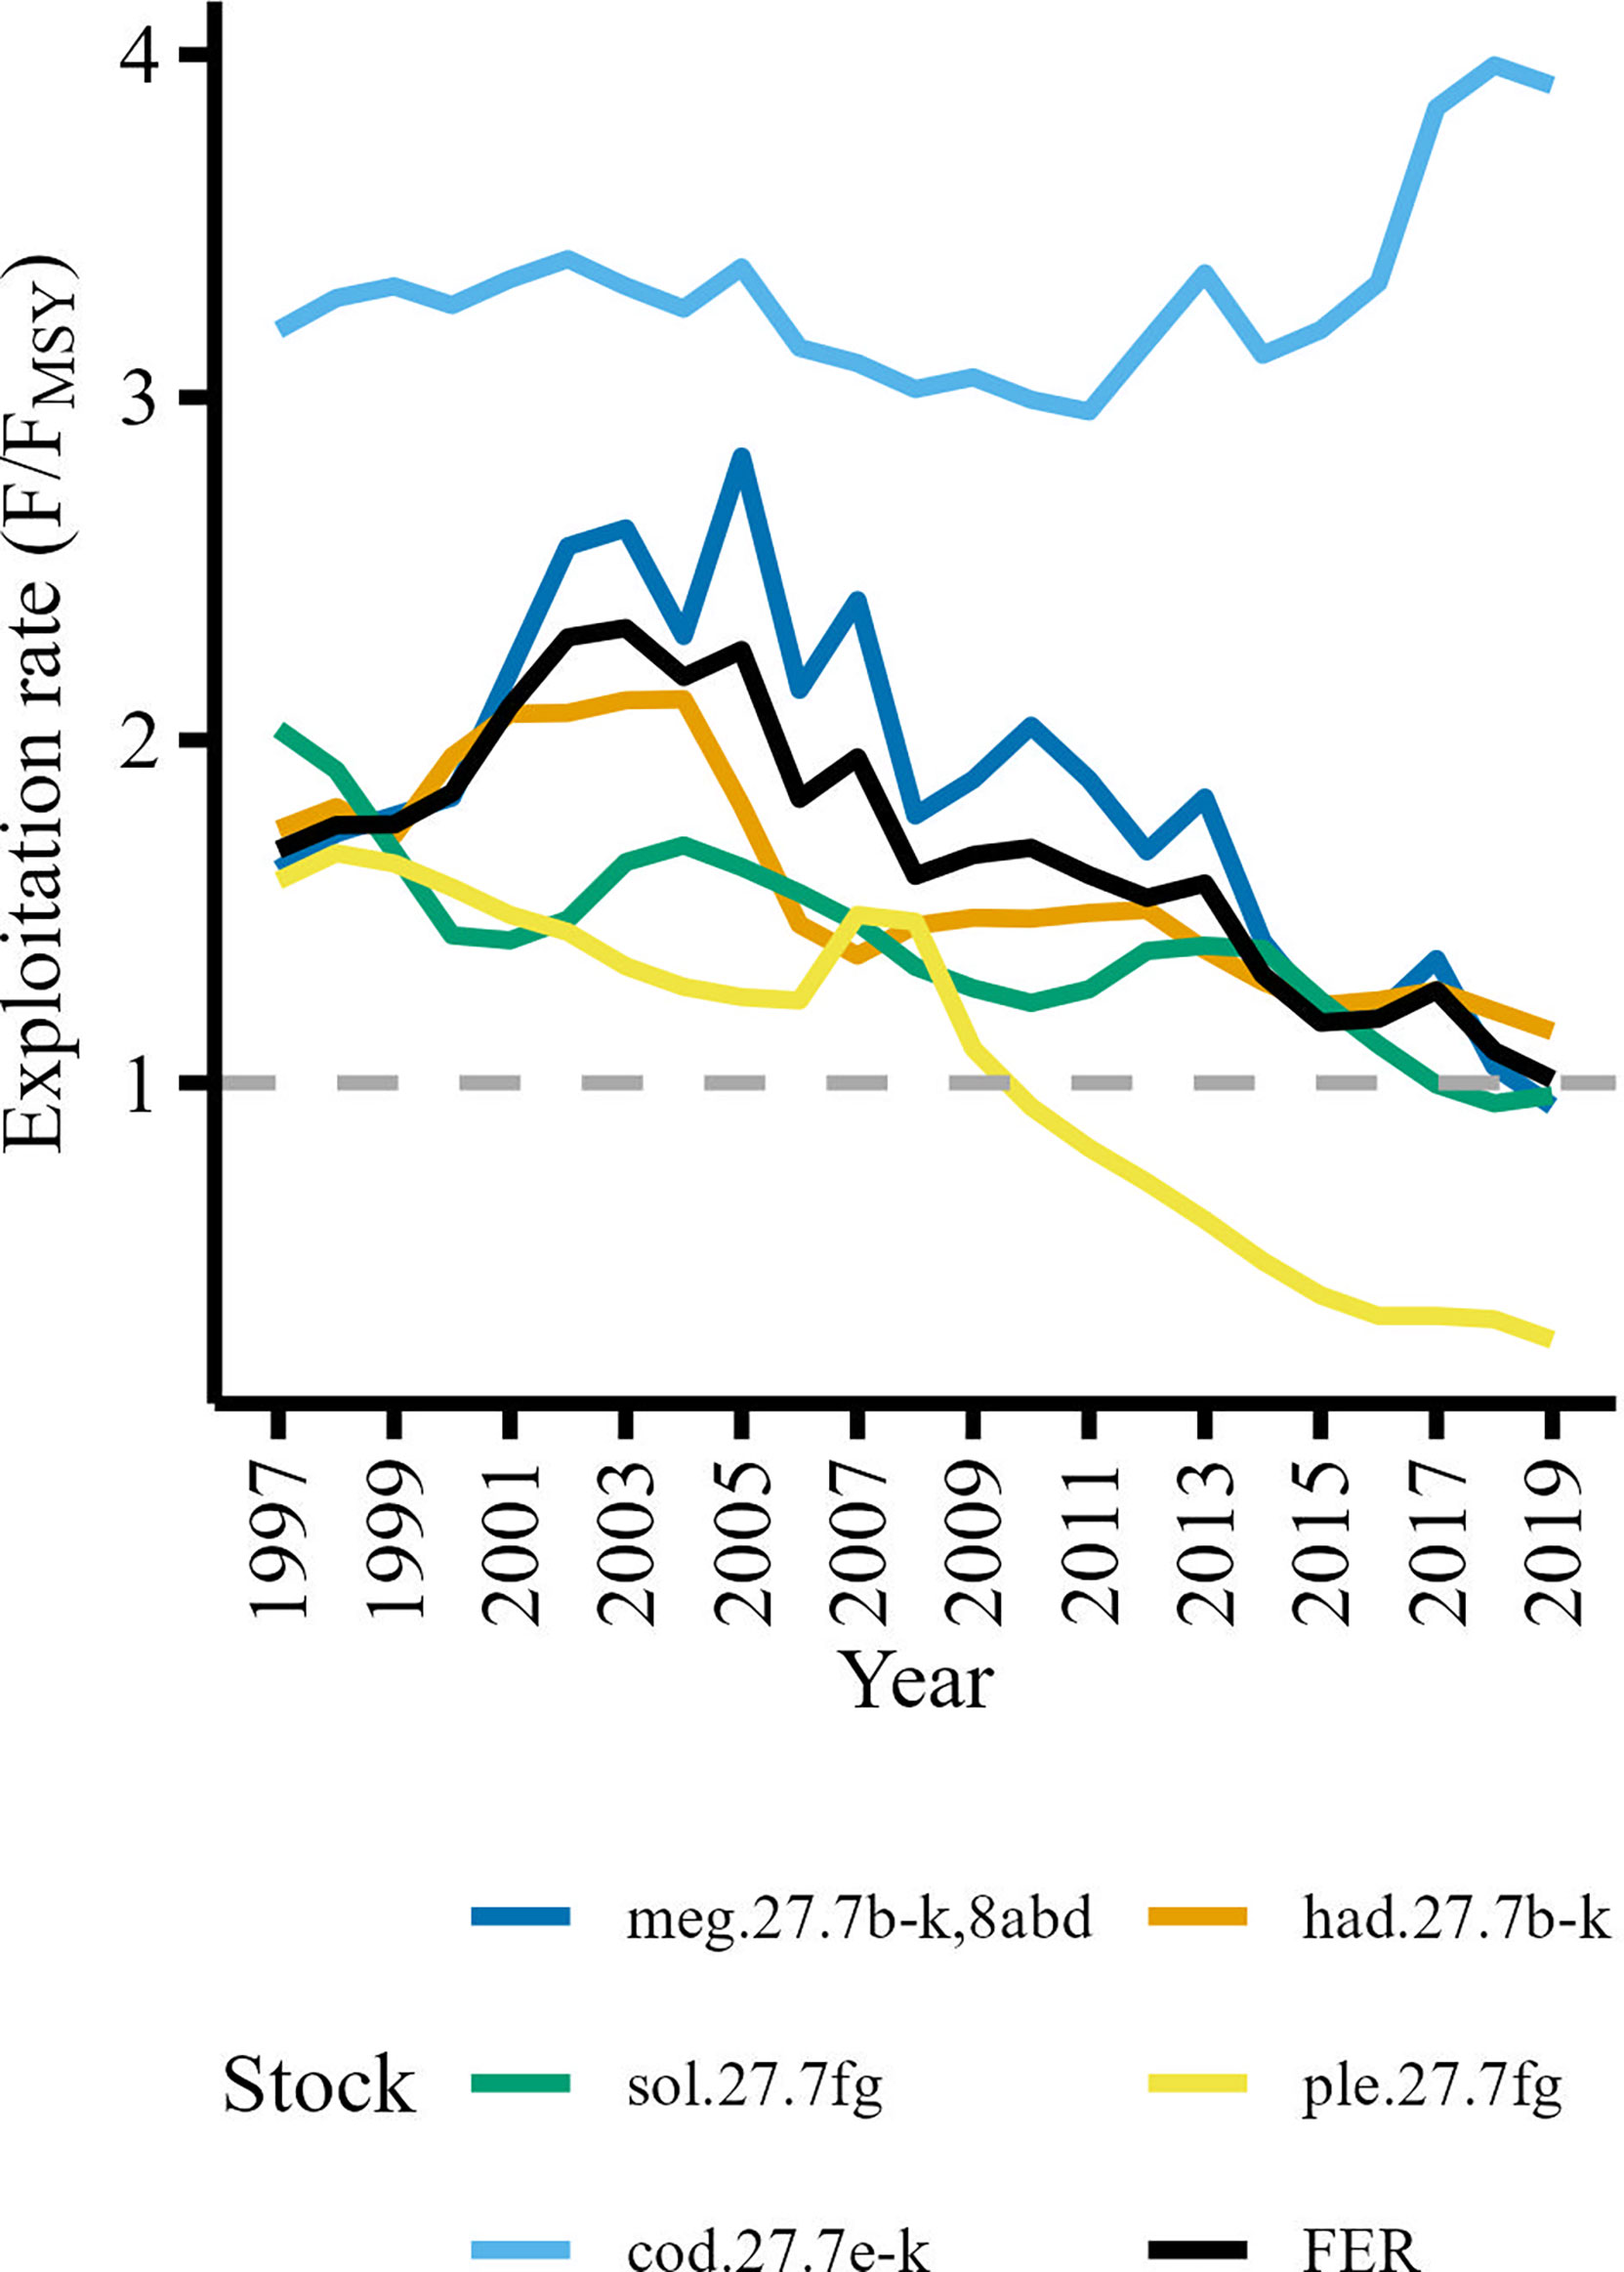
Figure 2 Fishing exploitation rates of commercially important Celtic Sea demersal stocks. The mean fishing exploitation rate (FER) represented by the black line is the catch weighted mean of haddock (had.27.7b-k), megrim (meg.27.7b-k8abd), plaice (ple.27.7fg), and sole (sol.27.7fg) exploitation rates. The grey dashed line delineates the upper threshold for a sustainably exploited stock (F/FMSY ≤ 1).
Many species are caught together by demersal fisheries in the Celtic Sea and is therefore considered a mixed fishery (Moore et al., 2019). We assumed that the FER derived from stocks with similar exploitation trends would be a suitable metric to characterize the general trend in fishing pressure in the Celtic Sea. The Cod F/FMSY series was not significantly correlated, r(21)<.41, p > 0.05, with the haddock, megrim, sole and plaice F/FMSY series (Supplementary Figure 1), so we included cod exploitation rate (FERcod) as a separate explanatory variable. Furthermore, cod is considered a ‘choke’ species (Ulrich et al., 2017; ICES, 2021; ICES, 2022b) so low quotas in the Celtic Sea can force vessels to cease fishing without meeting quotas of other target species. The vessels limited by the cod quota would catch fewer demersal species (e.g., haddock, whiting, plaice) consequently reducing the fishing mortality (F) on other demersal species and cause an increase in CPUE.
2.3 Environmental variables
Spatio-temporal data for net primary production (NPP; mg C/m2/day) - the rate at which carbon is converted into biomass by photosynthesis - and sea bottom temperature (SBT; °C) were sourced from the Copernicus Marine Environment Monitoring Services (http://marine.copernicus.eu). Data of SBT and NPP that occurred within the boundary of the study area were spatially subset to the study area for the period 1997-2019. SBT was included as an explanatory variable because the Celtic Sea contains species with cold-water and warm-water affinities (ter Hofstede et al., 2010; Simpson et al., 2011). An increase in temperature could, through shifts in species distribution, increase the CPUE of warm-water species and decrease the CPUE of cold-water species in the study area. Annual mean SBT was calculated from the monthly-mean Atlantic-European Iberian-Biscay-Ireland Ocean Physics Reanalysis data product at a spatial resolution of 0.083 x 0.083 decimal degrees. Seasonal stratification of the Celtic Sea limits the transfer of nutrients into the photic zone (Hickman et al., 2012) so to better capture NPP throughout the water column depth integrated monthly mean NPP values were calculated using values from the surface to the 75m depth stratum. Annual mean NPP was then calculated from the depth integrated monthly values derived from the monthly-mean Atlantic-European Iberian-Biscay-Ireland Ocean Biogeochemistry Reanalysis data product at 0.083 x 0.083 decimal degree resolution.
Calanoid copepods are an important food source for fish larvae (Cushing, 1990; Rowlands et al., 2008; Morote et al., 2011) therefore to represent bottom-up effects of mesozooplankton on CPUE we spatially subset sample level data from the Continuous Plankton Recorder (CPR) survey to the study area (Johns, 2022). Mean annual counts of Calanus helgolandicus and C. finmarchicus were calculated from the monthly means and used to infer abundance.
The North Atlantic Oscillation (NAO) index measures the difference in sea-level air pressure between Iceland and Portugal (Hurrell, 1995) and has been shown to influence abundance of fish stocks in the Irish Sea (Bentley et al., 2020) and recruitment in the Celtic Sea (Goikoetxea and Irigoien, 2013). The Principal Component based NAO index is less sensitive to ‘noise’ so we used the annual PC-based NAO index (https://climatedataguide.ucar.edu) as a proxy for climatic forcing the study area (Hurrell, 1995; Hurrell and Deser, 2010).
2.4 Statistical analysis
Dynamic factor analysis (DFA) was used to examine the relationship between demersal CPUE trends and explanatory variables. DFA is a multivariate technique used to detect relationships between a set of short time series (e.g., CPUE series) and explanatory variables while estimating common trend(s) in the unexplained temporal variation (Zuur et al., 2003a; Zuur et al., 2003b). DFA was identified as the most suitable statistical tool for our data because it can analyze short and non-stationary CPUE series. Furthermore, the common trends identified and CPUE series correlated with the common trend can be informative. For example, the common trend can be compared against time series of variables not included in the optimal model to identify potential associations (e.g., Chen, 2010) and the composition of species correlated with the common trend may share similar life histories (e.g., Erzini, 2005). Further technical details on DFA can be found in (Zuur et al., 2003a; Zuur et al., 2003b). DFA models are computationally demanding and time consuming because the Akaike’s information criterion (AIC) of a set of models containing all possible permutations of explanatory variables, M number of common trends and two error covariance matrices are compared to find the ‘best’ model (Zuur et al., 2003a; Zuur et al., 2003b) and can produce overfitted models if too many explanatory variables are included as covariates. Therefore, we reduced the set of explanatory variables into a subset of relevant and appropriate explanatory variables using redundancy analysis (RDA). This decreased the number of permutations of explanatory variables required to identify the optimal DFA model and reduced risk of overfitting models. We tested for lagged relationships between CPUE trends and basal productivity (i.e., net primary production and zooplankton abundance) under the assumption that changes to production at lower trophic levels may take several years to manifest as signals in the CPUE trends. Cross correlation coefficients revealed that some lagged effects did exist (Supplementary Figure 2), but the majority of cross-correlations were strongest on the observation year, so we did not include lagged variables in the analysis. All variables were standardized prior to analysis by subtracting the mean and dividing by the standard deviation using R v4.1.0 (R Core Team, 2021).
2.4.1 Identifying the most influential explanatory variables
Redundancy analysis (RDA) is a canonical ordination technique that estimates the relationships between a set of response (e.g., CPUE series) and a set of explanatory variables (e.g., environmental and fishing variables) (ter Braak, 1994; Borcard et al., 2018). The method computes, in successive order, a series of orthogonal axes consisting of specific linear combinations of explanatory variables that maximize the explained variance in the set of response variables. However, RDA is a regression technique and the autocorrelated processes present in our CPUE series (Supplementary Figure 3) violates the assumption that values are independent of each other. To account for the autocorrelated processes in our data within the RDA we applied a restricted permutation test (i.e., cyclic shift permutations) to preserve the temporal ordering of each CPUE series (Simpson, 2012). Essentially, this involves picking a random starting point in the CPUE series, linking it to the start of the explanatory variables’ series (i.e., 1997), computing the F-statistic and then repeating it for every other possible starting point (permutation) of the CPUE series. The observed F-statistic is then compared to a reference distribution of the permuted F-statistics and the p-value is the proportion of permuted F-statistic values equal to or larger than the observed F-statistic. The null hypothesis (i.e., no linear relationships exist between the CPUE series and the explanatory variables) is rejected if the p-value is equal to or smaller than the predefined significance level (e.g., α =0.05). The proportion of variance explained by each explanatory variable was determined by ranking the eigenvalues of RDA models that contained a single but different explanatory variable. To reduce the number of unique combinations of covariates (permutations) in the Dynamic Factor Analysis (DFA) we used the RDA eigenvalues (Table 1) to identify the four most statistically influential explanatory variables (i.e., mean exploitation rate, C. finmarchicus abundance, cod exploitation rate and net primary production). We used four explanatory variables to include in the DFA because it produces a tractable number of models (84) which balances computational time while still best representing the system. Including five explanatory variables would nearly double the number of unique models (150). RDA was conducted using the ‘vegan’ package v2.6-2 (Oksanen et al., 2022).
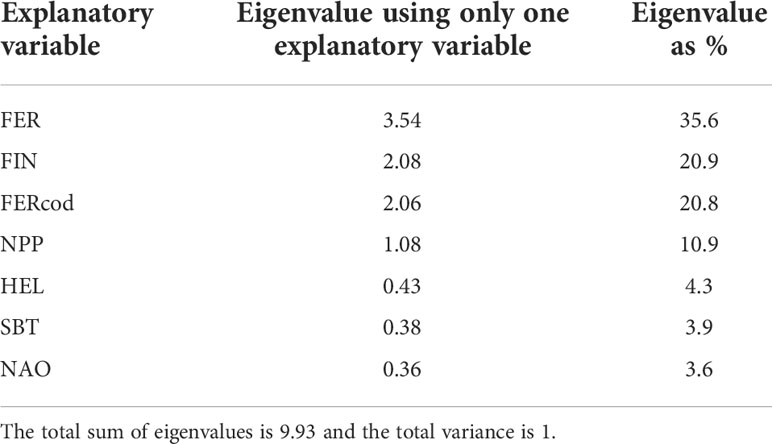
Table 1 Marginal effects of the explanatory variables.
2.4.2 Identifying relationships between CPUE and explanatory variables
We used DFA to test for linear relationships between CPUE series and the four most statistically influential explanatory variables identified in the RDA while also identifying common trends in the temporal variation. The procedure for finding the optimal model is to fit a series of models that include combinations with and without the explanatory variables, one to three common trends as well as a diagonal or symmetric non-diagonal error covariance matrix (Zuur et al., 2003a; Zuur et al., 2003b). The purpose of comparing models with different error covariance matrices was to determine if accounting for relationships in the error component of the CPUE series improved the model fit. To reduce the risk of overfitting models we limited the maximum number of covariates included in any DFA model to three. The optimal model was selected based on the lowest AIC value and visual inspection of the fitted and residual values (Zuur et al., 2003a; Zuur et al., 2003b).The fit of the optimal model to each observational CPUE series, termed the ‘fit ratio’, was quantified by dividing the sum-of-squared residuals by the sum-of-squared observations. Lower fit ratios indicate a better model fit. The optimal DFA model had one common trend, with a symmetric non-diagonal matrix and the mean exploitation rate (FER), cod exploitation rate (FERcod) and C. finmarchicus abundance (FIN) as covariates (Table 2). To identify whether we could begin to explain the common trend, which in turn could explain some of the variance in the CPUE series, we tested for monotonic associations between explanatory variables not included in the optimal DFA model and the estimated common trend using Spearman’s correlation coefficient with R v4.1.0 (R Core Team, 2021). DFA was conducted using the software package Brodgar v2.7.5 (Highland Statistics Ltd, http://www.brodgar.com).
3 Results
3.1 Observed trends
CPUE series were characterized by interannual variability with several CPUE series showing similar trends (Figure 3). The CPUE of spurdog (DGS), haddock (HAD), hake (HKE), megrim (LEZ), plaice (PLE), the skates and rays (RAJ) and lesser-spotted dogfish (SYC) increased since 1997, particularly in the last decade. Cod (COD), whiting (WHG) and Trisopterus spp. (XOD) CPUE series remained relatively stable although there appears to be a period of decline since 2015. The CPUE of anglerfish (ANF) and sole (SOL) showed periodic fluctuations although the tendency is towards an increasing CPUE for the study period.
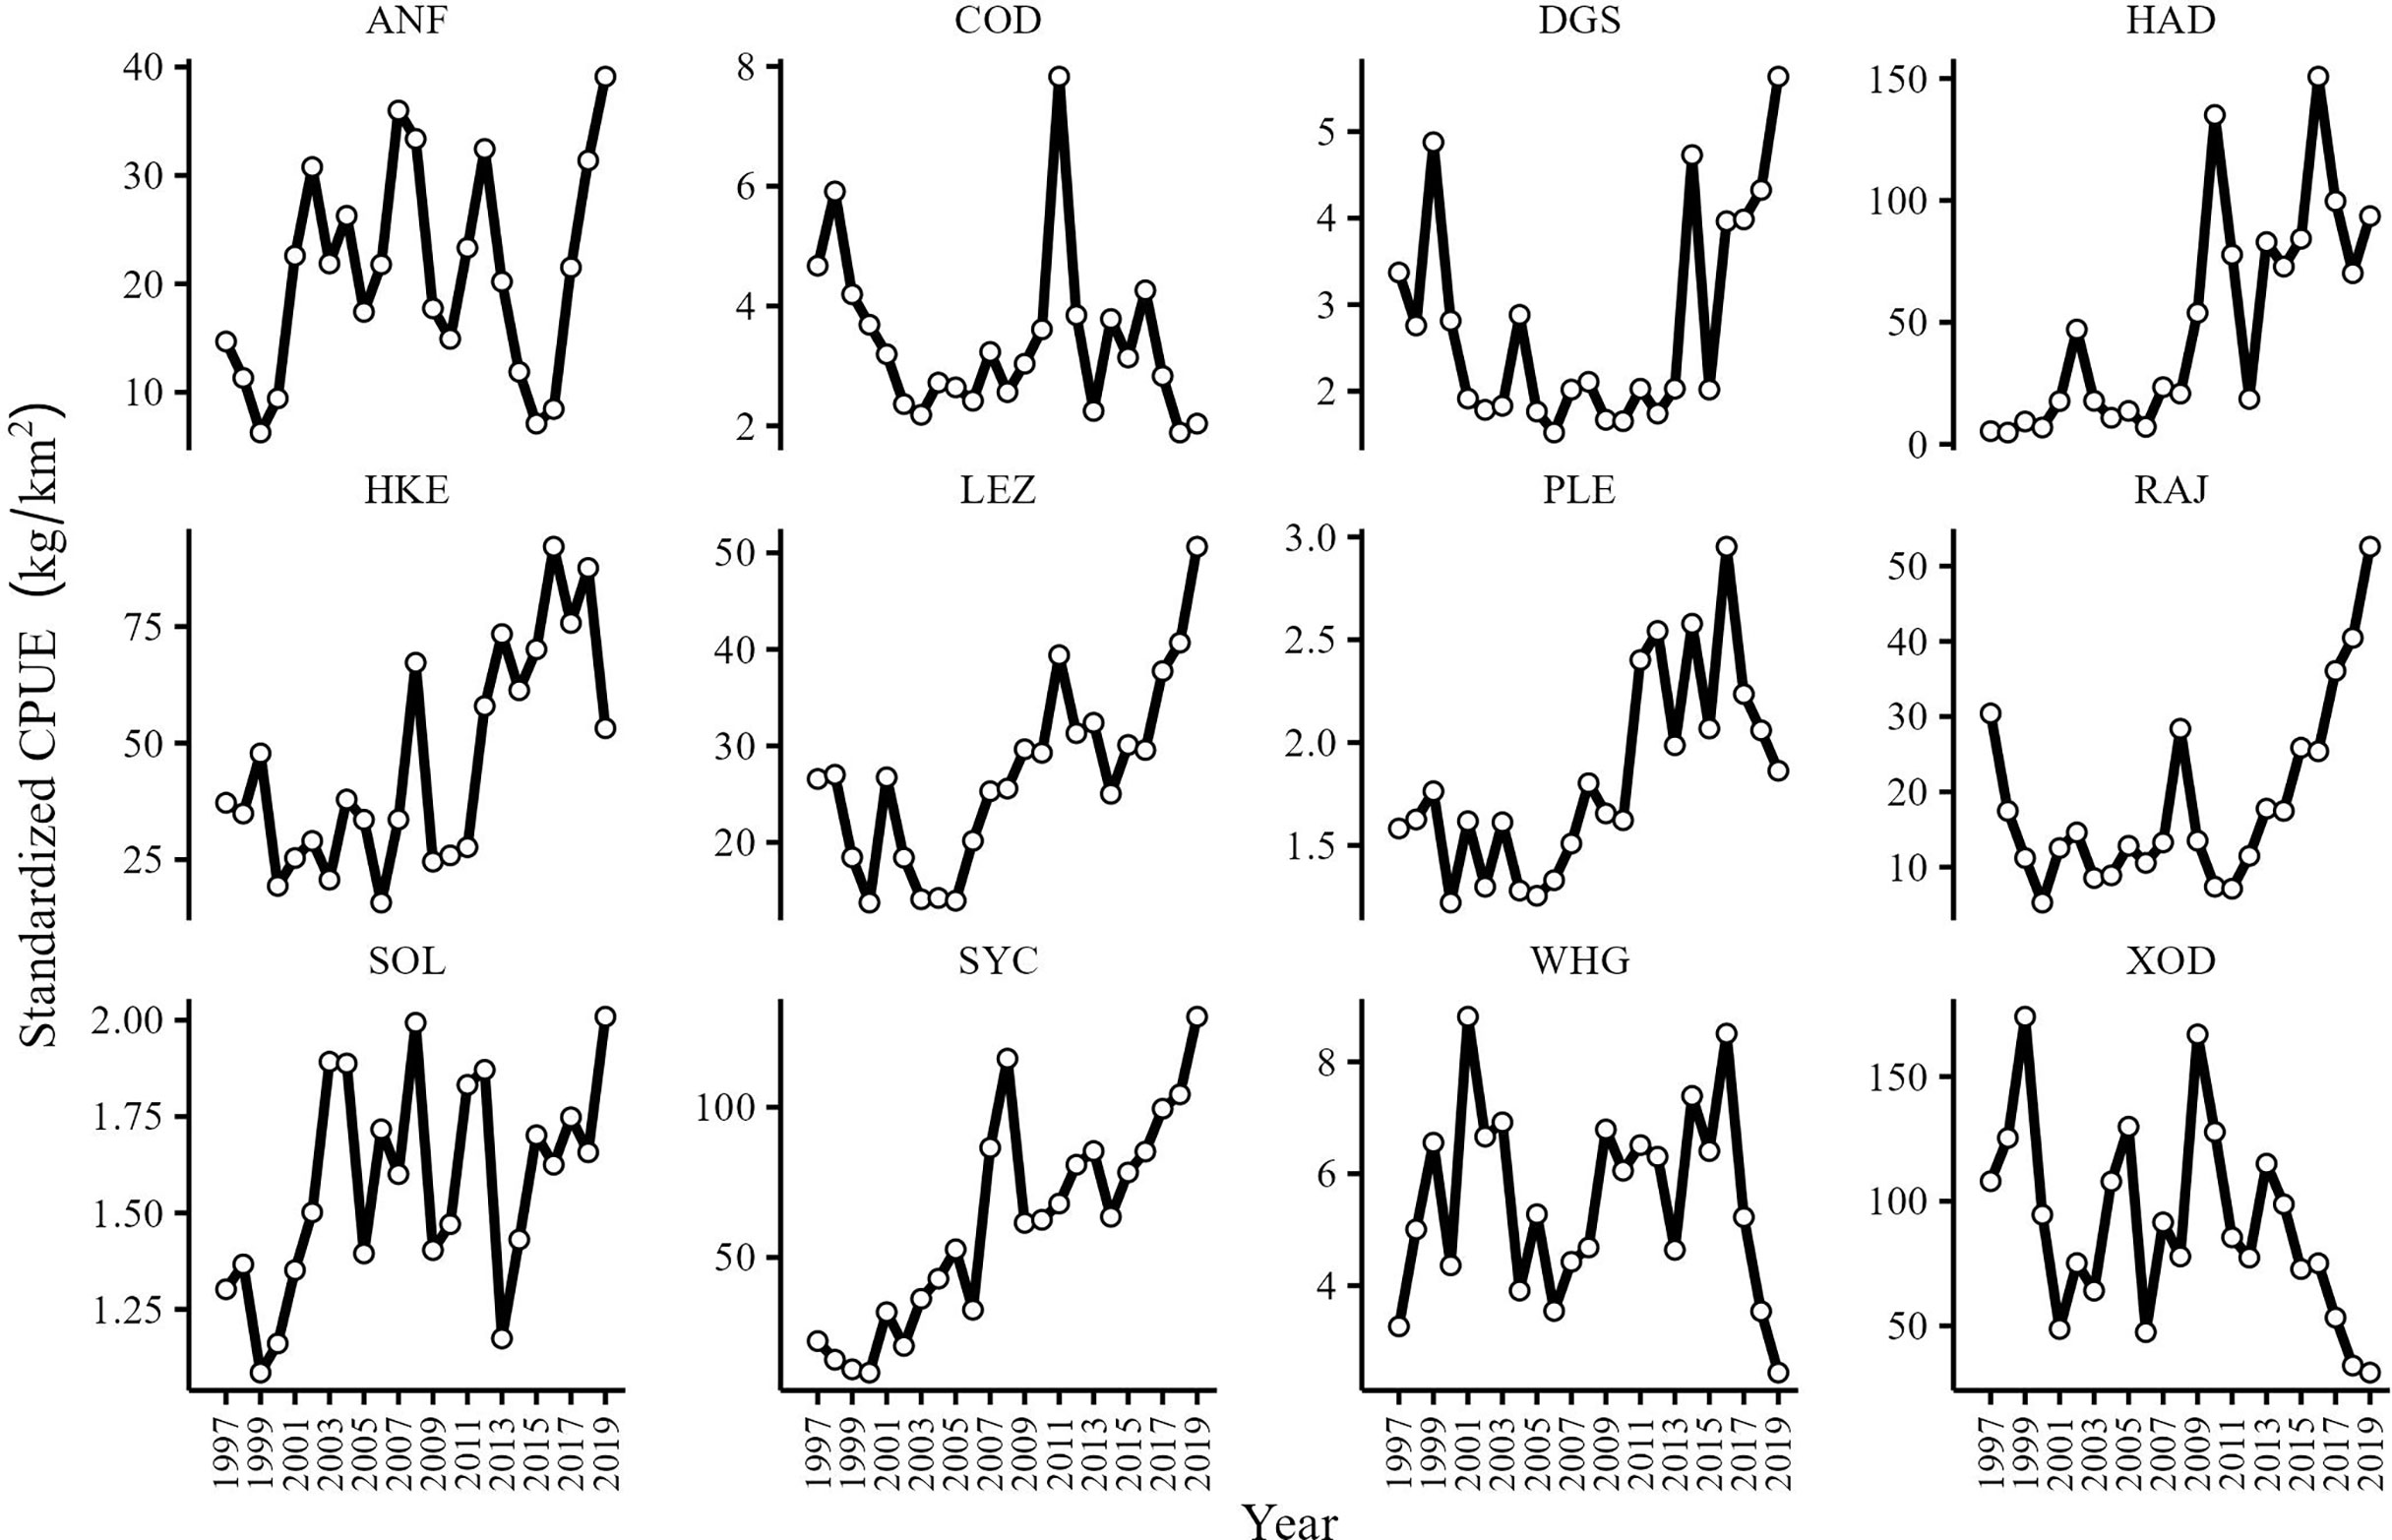
Figure 3 CPUE (kg/km2) series of anglerfish (ANF), cod (COD), spurdog (DGS), haddock (HAD), hake (HAK), megrim spp. (LEZ), plaice (PLE), skates and rays (RAJ), sole (SOL), lesser-spotted dogfish (SYC), whiting (WHG) and Trisopterus spp. (XOD) in the Celtic Sea from 1997 to 2019.
Patterns in the seven explanatory variables varied across time (Figure 4). Mean fishing exploitation rate (FER) increased to its maximum value in 2003 and then gradually decreased until 2019. Cod fishing exploitation rate (FERcod) remained relatively stable until 2005, then decreased to its minimum in 2011 and rapidly increased thereafter. The abundance of the copepod C. finmarchicus (FIN) was relatively stable until 2011 but then showed a rapid increase in 2012 which was sustained until 2017. The NAO index displayed a cyclical pattern punctuated by a pronounced negative phase in 2010. Net primary production (NPP) remained relatively stable but showed a period of rapid decline from 2003 to 2006 but then increased to its maximum in 2008 and remained relatively stable thereafter. Sea bottom temperature (SBT) and the abundance of the copepod C. helgolandicus (HEL) experienced a rapid decline during the same period as NPP (2003-2006) and the pronounced negative phase of the NAO in 2010 coincided with the lowest SBT value (Figure 4).
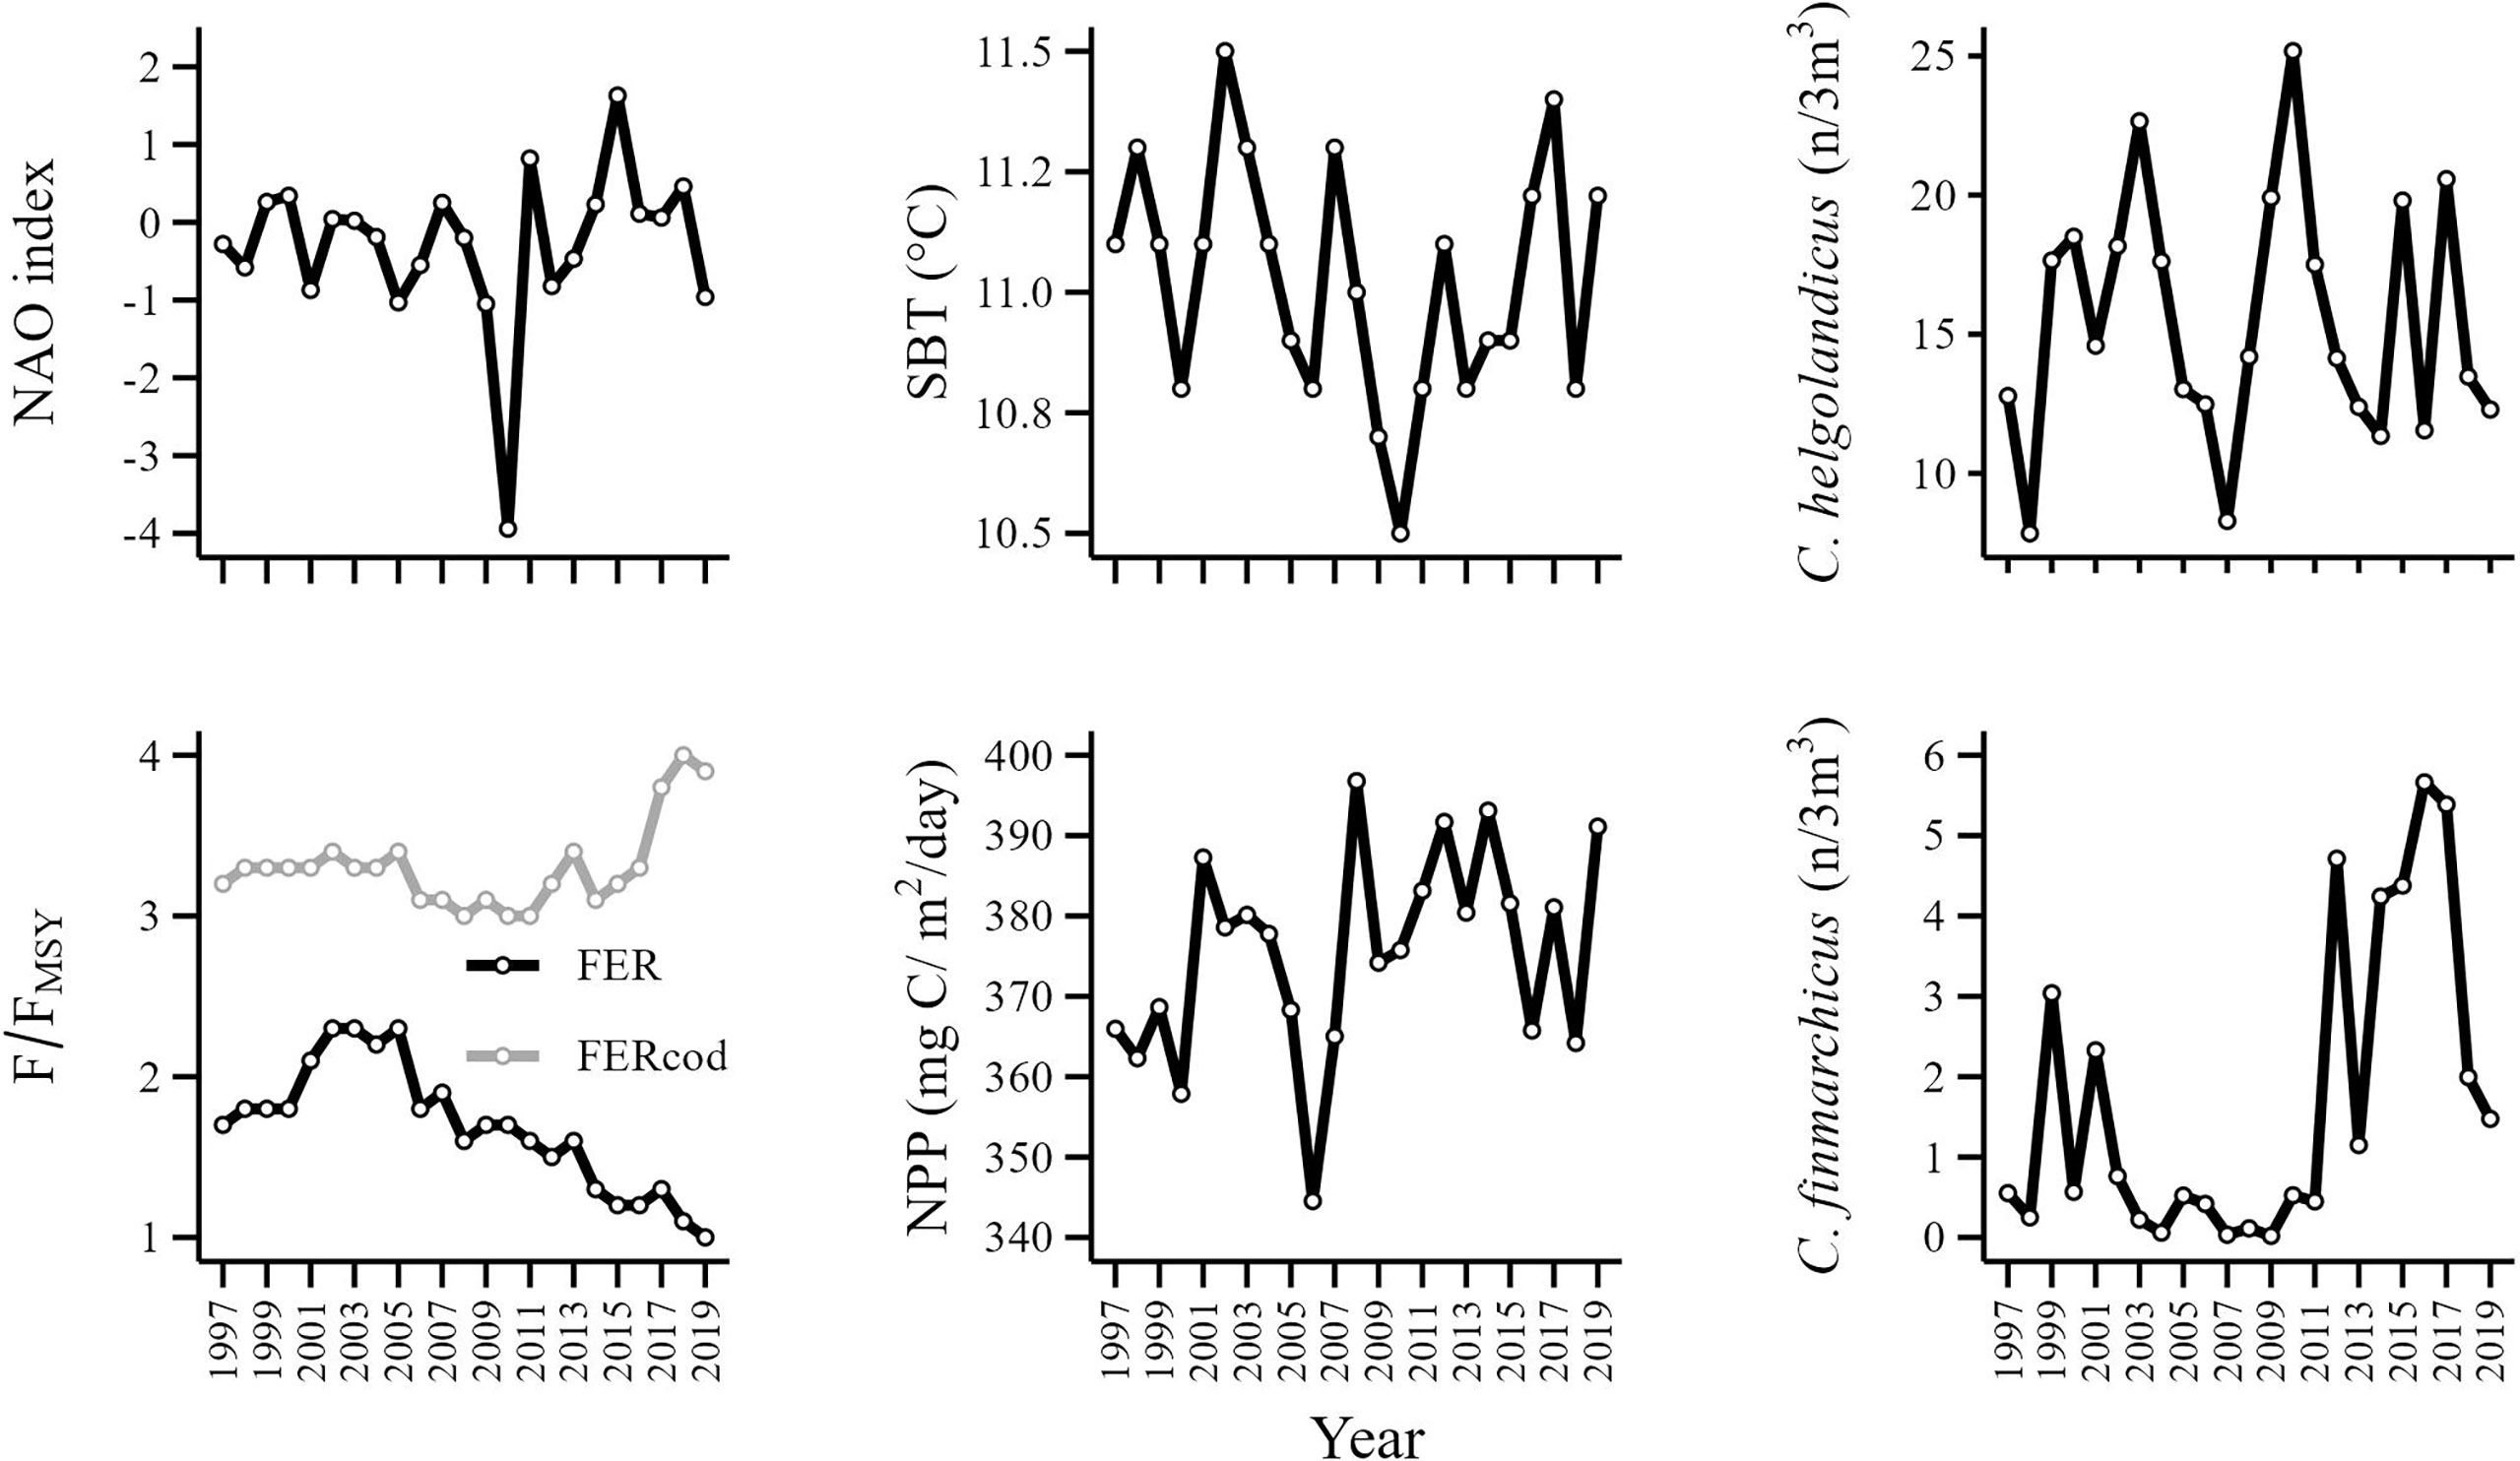
Figure 4 Time series of explanatory variables. Catch weighted mean fishing exploitation rate (FER), cod exploitation rate (FERcod), North Atlantic Oscillation index (NAO), net primary production (NPP), sea bottom temperature (SBT) and the relative abundance of C. finmarchicus (FIN) and C. helgolandicus (HEL).
3.2 Influential explanatory variables
The F-statistic of the RDA model was significantly greater (F=3.124, p = 0.043) than the F-statistics of the 22 restricted permutations (Supplementary Figure 4). The adjusted R2 value indicates that 40.3% of the temporal variation in the CPUE series can be explained using seven ordination axes, each axis consisting of a specific linear combination of the explanatory variables. The linear combination specific to the first ordination axis (RDA1) explained 23.9% of the explained variance and the second axis (RDA2) explained 8.4%. We are confident that the RDA captured the dominant trends because the first constrained eigenvalue (RDA1 = 4.22) was much greater than the first unconstrained eigenvalue (PC1 = 1.83). The ranking of the marginal effects indicated that FER, FERcod, FIN and NPP should be included as explanatory variables in the DFA (Table 2).
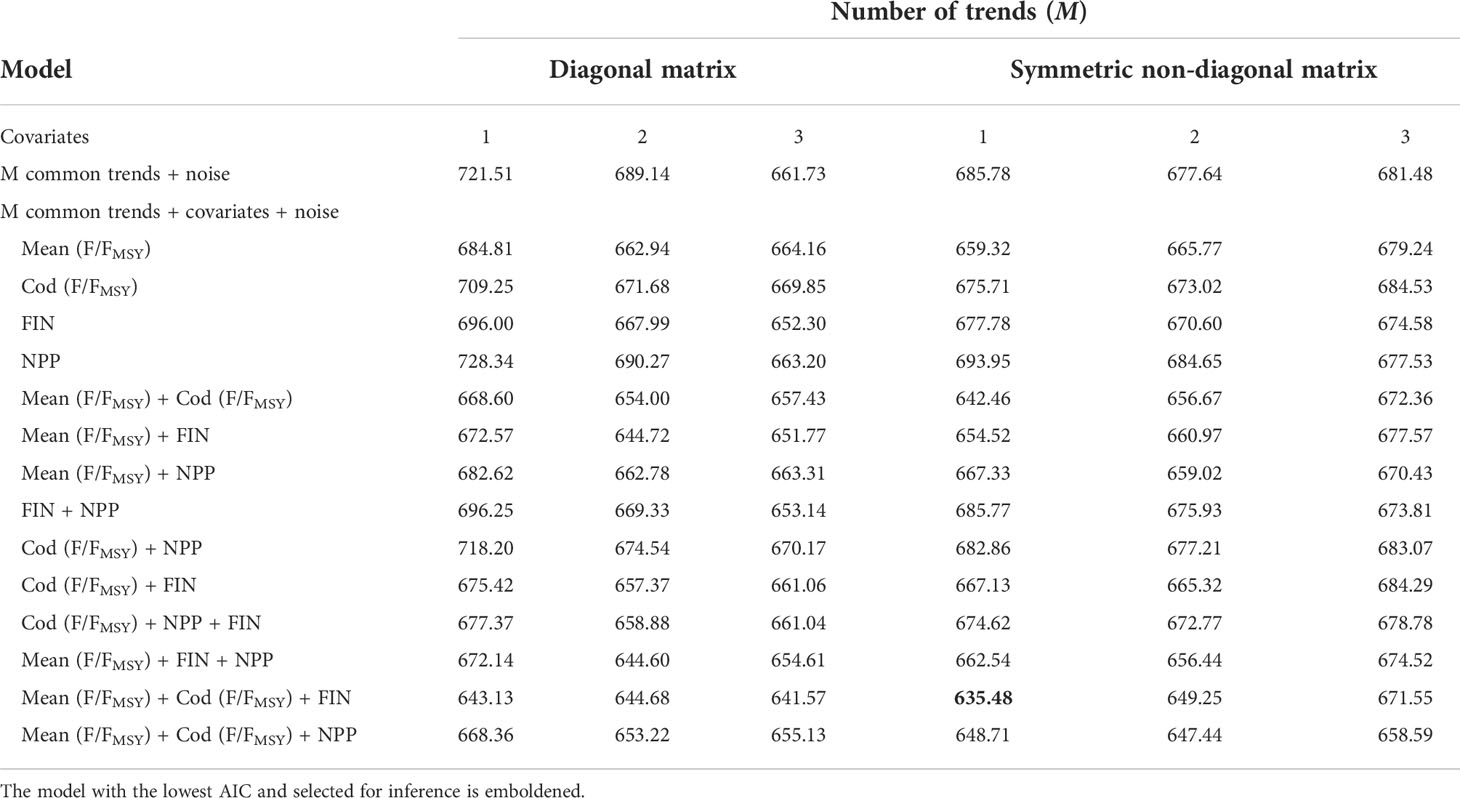
Table 2 Model structure and AIC values for DFA models with 1-3 common trends and 0-3 covariates.
In the RDA correlation triplot, the direction and orthogonality between vectors (i.e., CPUE series and explanatory variables) and ordination axes (i.e., RDA1, RDA2) represent their linear correlations (Figure 5). The explanatory variables associated with the first axis (RDA1) were mean fishing exploitation rate (FER) and, to a lesser extent, cod exploitation rate (FERcod) and net primary production (NPP). The abundance of C. finmarchicus (FIN) was the dominant explanatory variable for the second axis (RDA2). Overall, the marginal effects (Table 2) and the orthogonality and magnitude of vectors in the correlation triplot indicated that the least influential explanatory variables were sea bottom temperature (SBT), C. helgolandicus (HEL) and the North Atlantic Oscillation index (NAO) (Figure 5). The CPUE of megrim (LEZ), spurdog (DGS), lesser-spotted dogfish (SYC), the skates and rays (RAJ), sole (SOL), hake (HKE), haddock (HAD) and plaice (PLE) increased as mean fishing exploitation (FER) decreased. In addition, the CPUE of anglerfish (ANF) and the skates and rays (RAJ) increased with cod exploitation rate (FERcod) whereas the CPUE of cod (COD), whiting (WHG) and Trisopterus spp. (XOD) decreased. The CPUE of plaice, haddock and hake increased with C. finmarchicus abundance (FIN) and net primary production (NPP).
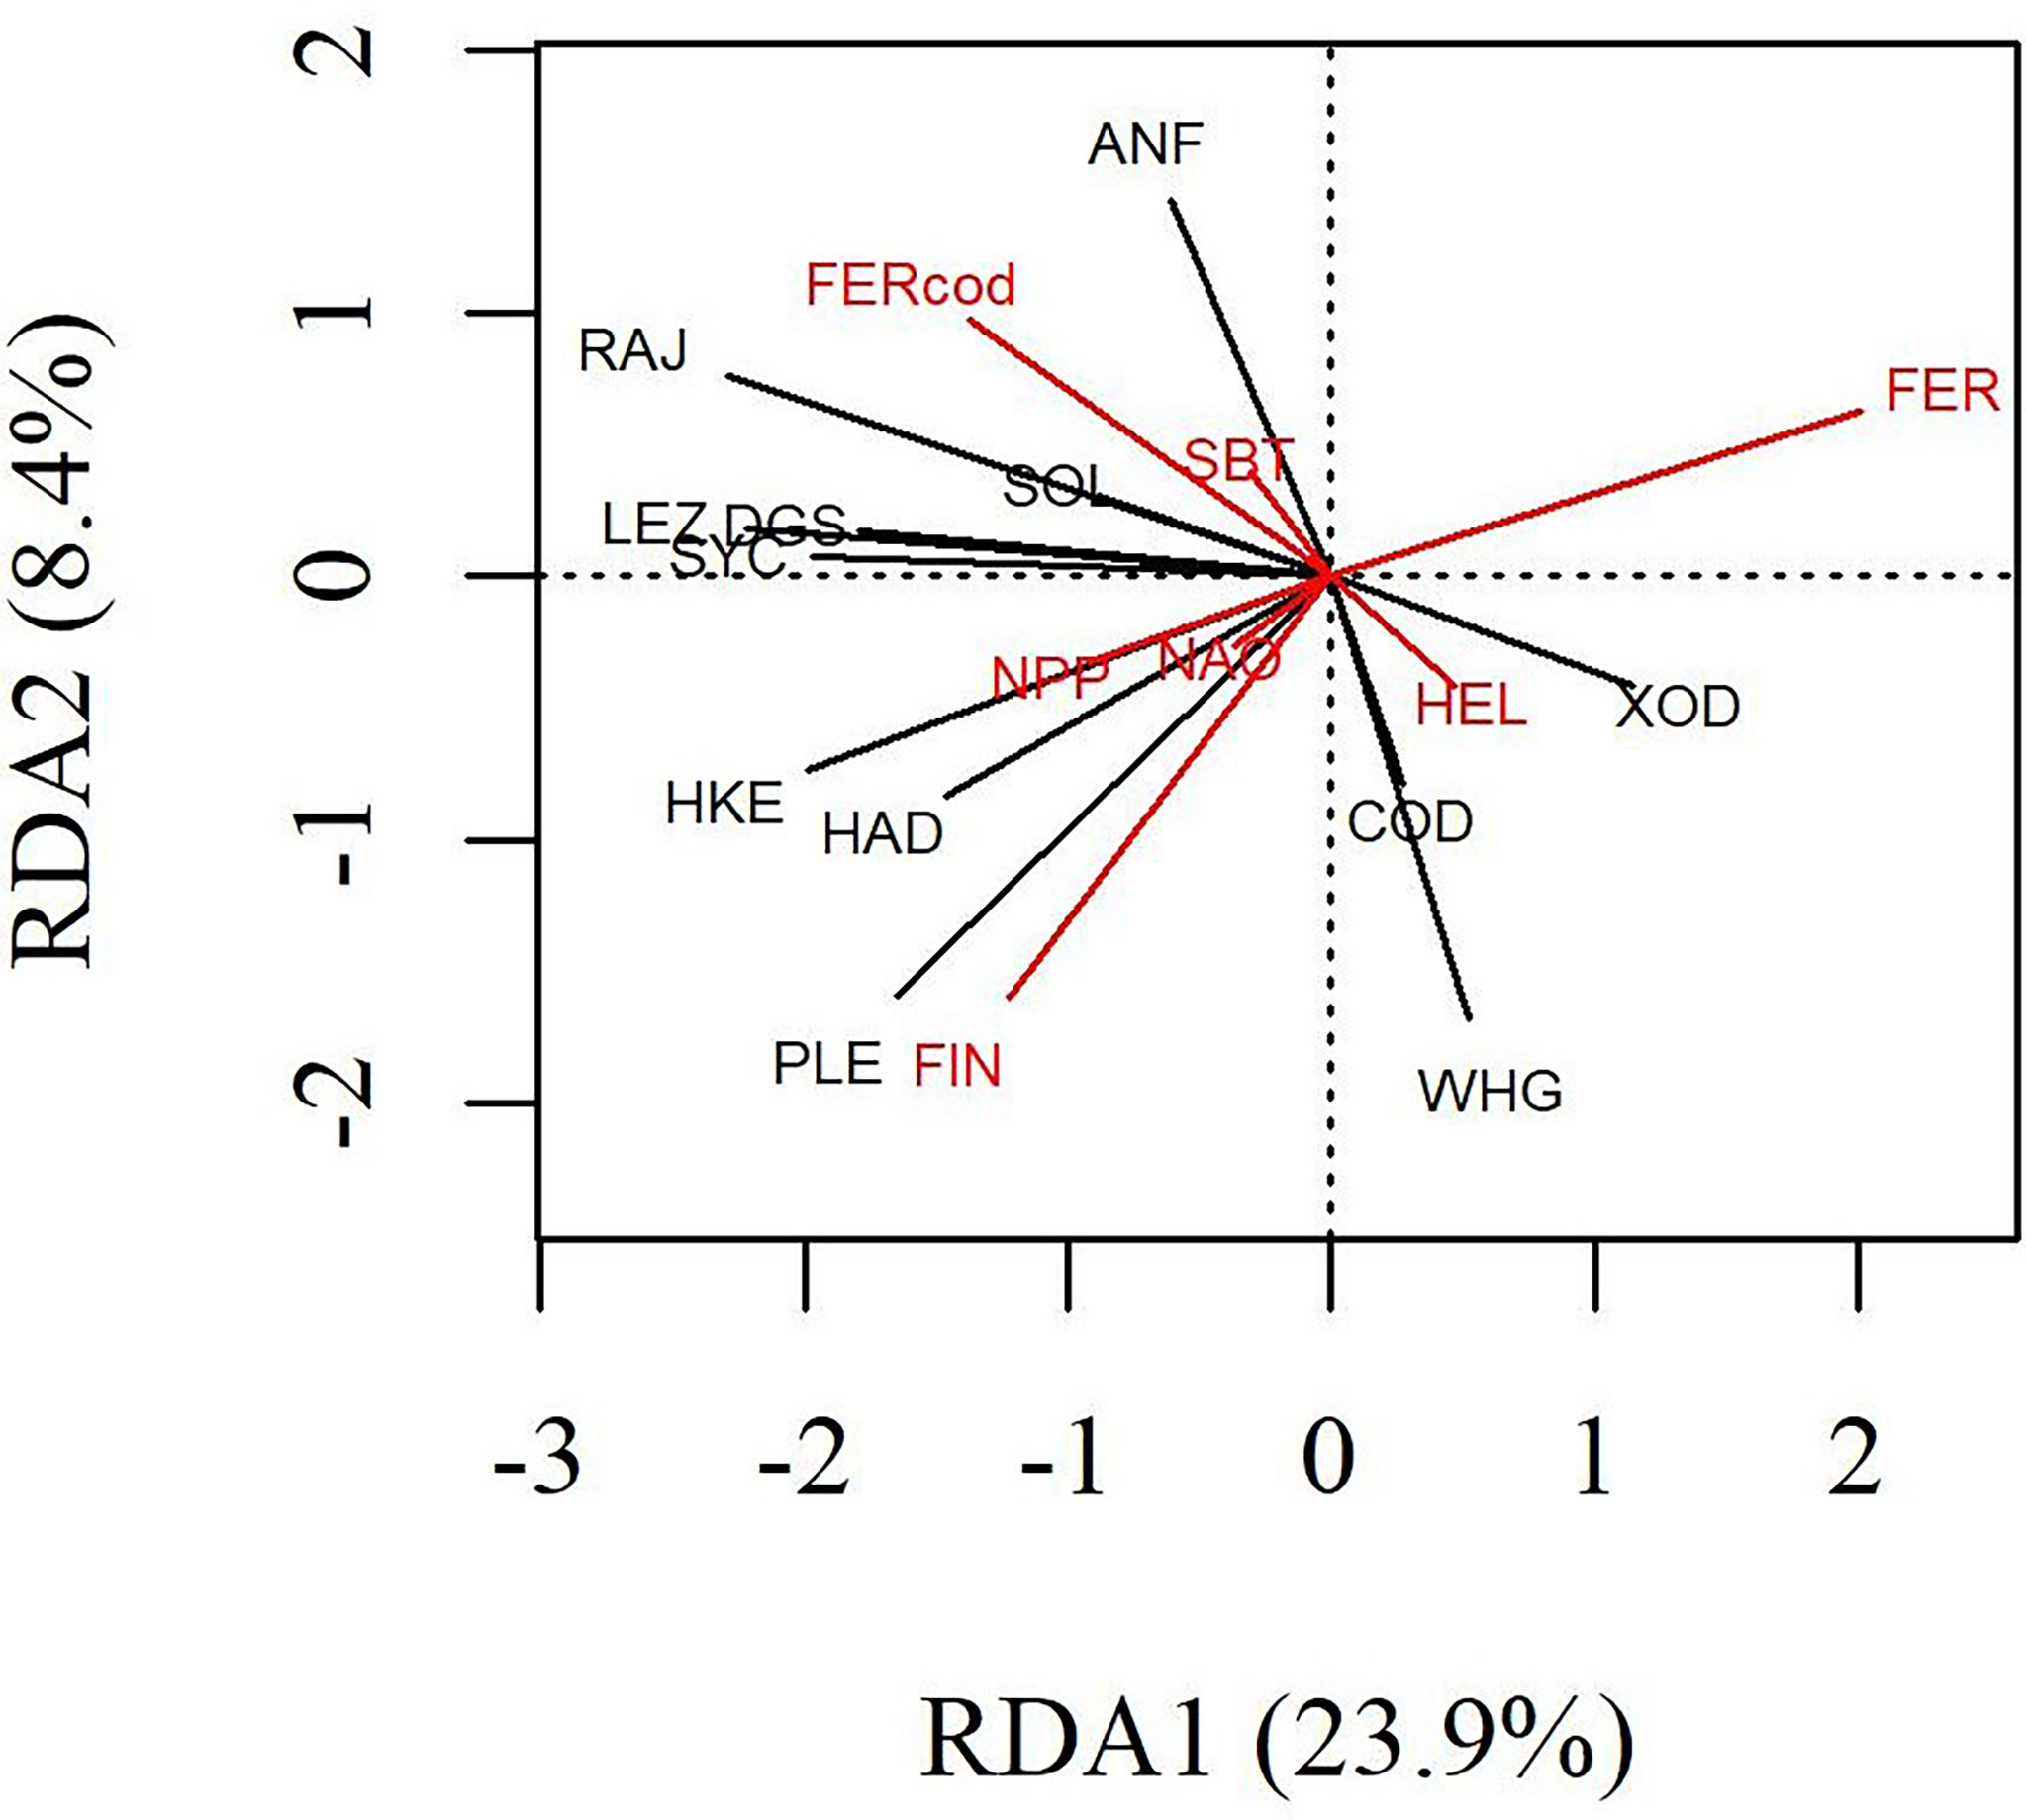
Figure 5 RDA correlation triplot of CPUE series (black) constrained by explanatory variables (red). The direction and orthogonality between vectors and ordination axes indicate the direction and strength of the linear correlations.
3.3 Relationships between CPUE and explanatory variables
The optimal DFA model had one common trend, with a symmetric non-diagonal matrix and with mean exploitation rate (FER), cod exploitation rate (FERcod) and C. finmarchicus (FIN) as covariates (Table 2). As DFA is a dimension reduction technique it is unlikely that every CPUE series is fitted well. The small fit ratios of lesser-spotted dogfish (0.16), plaice (0.21), skates and rays (0.21), megrim (0.24), hake (0.32), spurdog (0.35) and the moderate fit ratios of haddock (0.4), whiting (0.42) and anglerfish (0.48) indicate that the majority of the CPUE series were modelled reasonably well. However, the large fit ratios of Trisopterus spp. (0.69), sole (0.67) and cod (0.61) suggests that the covariates and the common trend included in the optimal model did not fully capture the temporal variation in their respective CPUE series. Overall, the mean of the twelve CPUE series fit ratios (0.40) indicated that the DFA model fit was adequate and captured most of the temporal variation in the CPUE series (Figure 6).
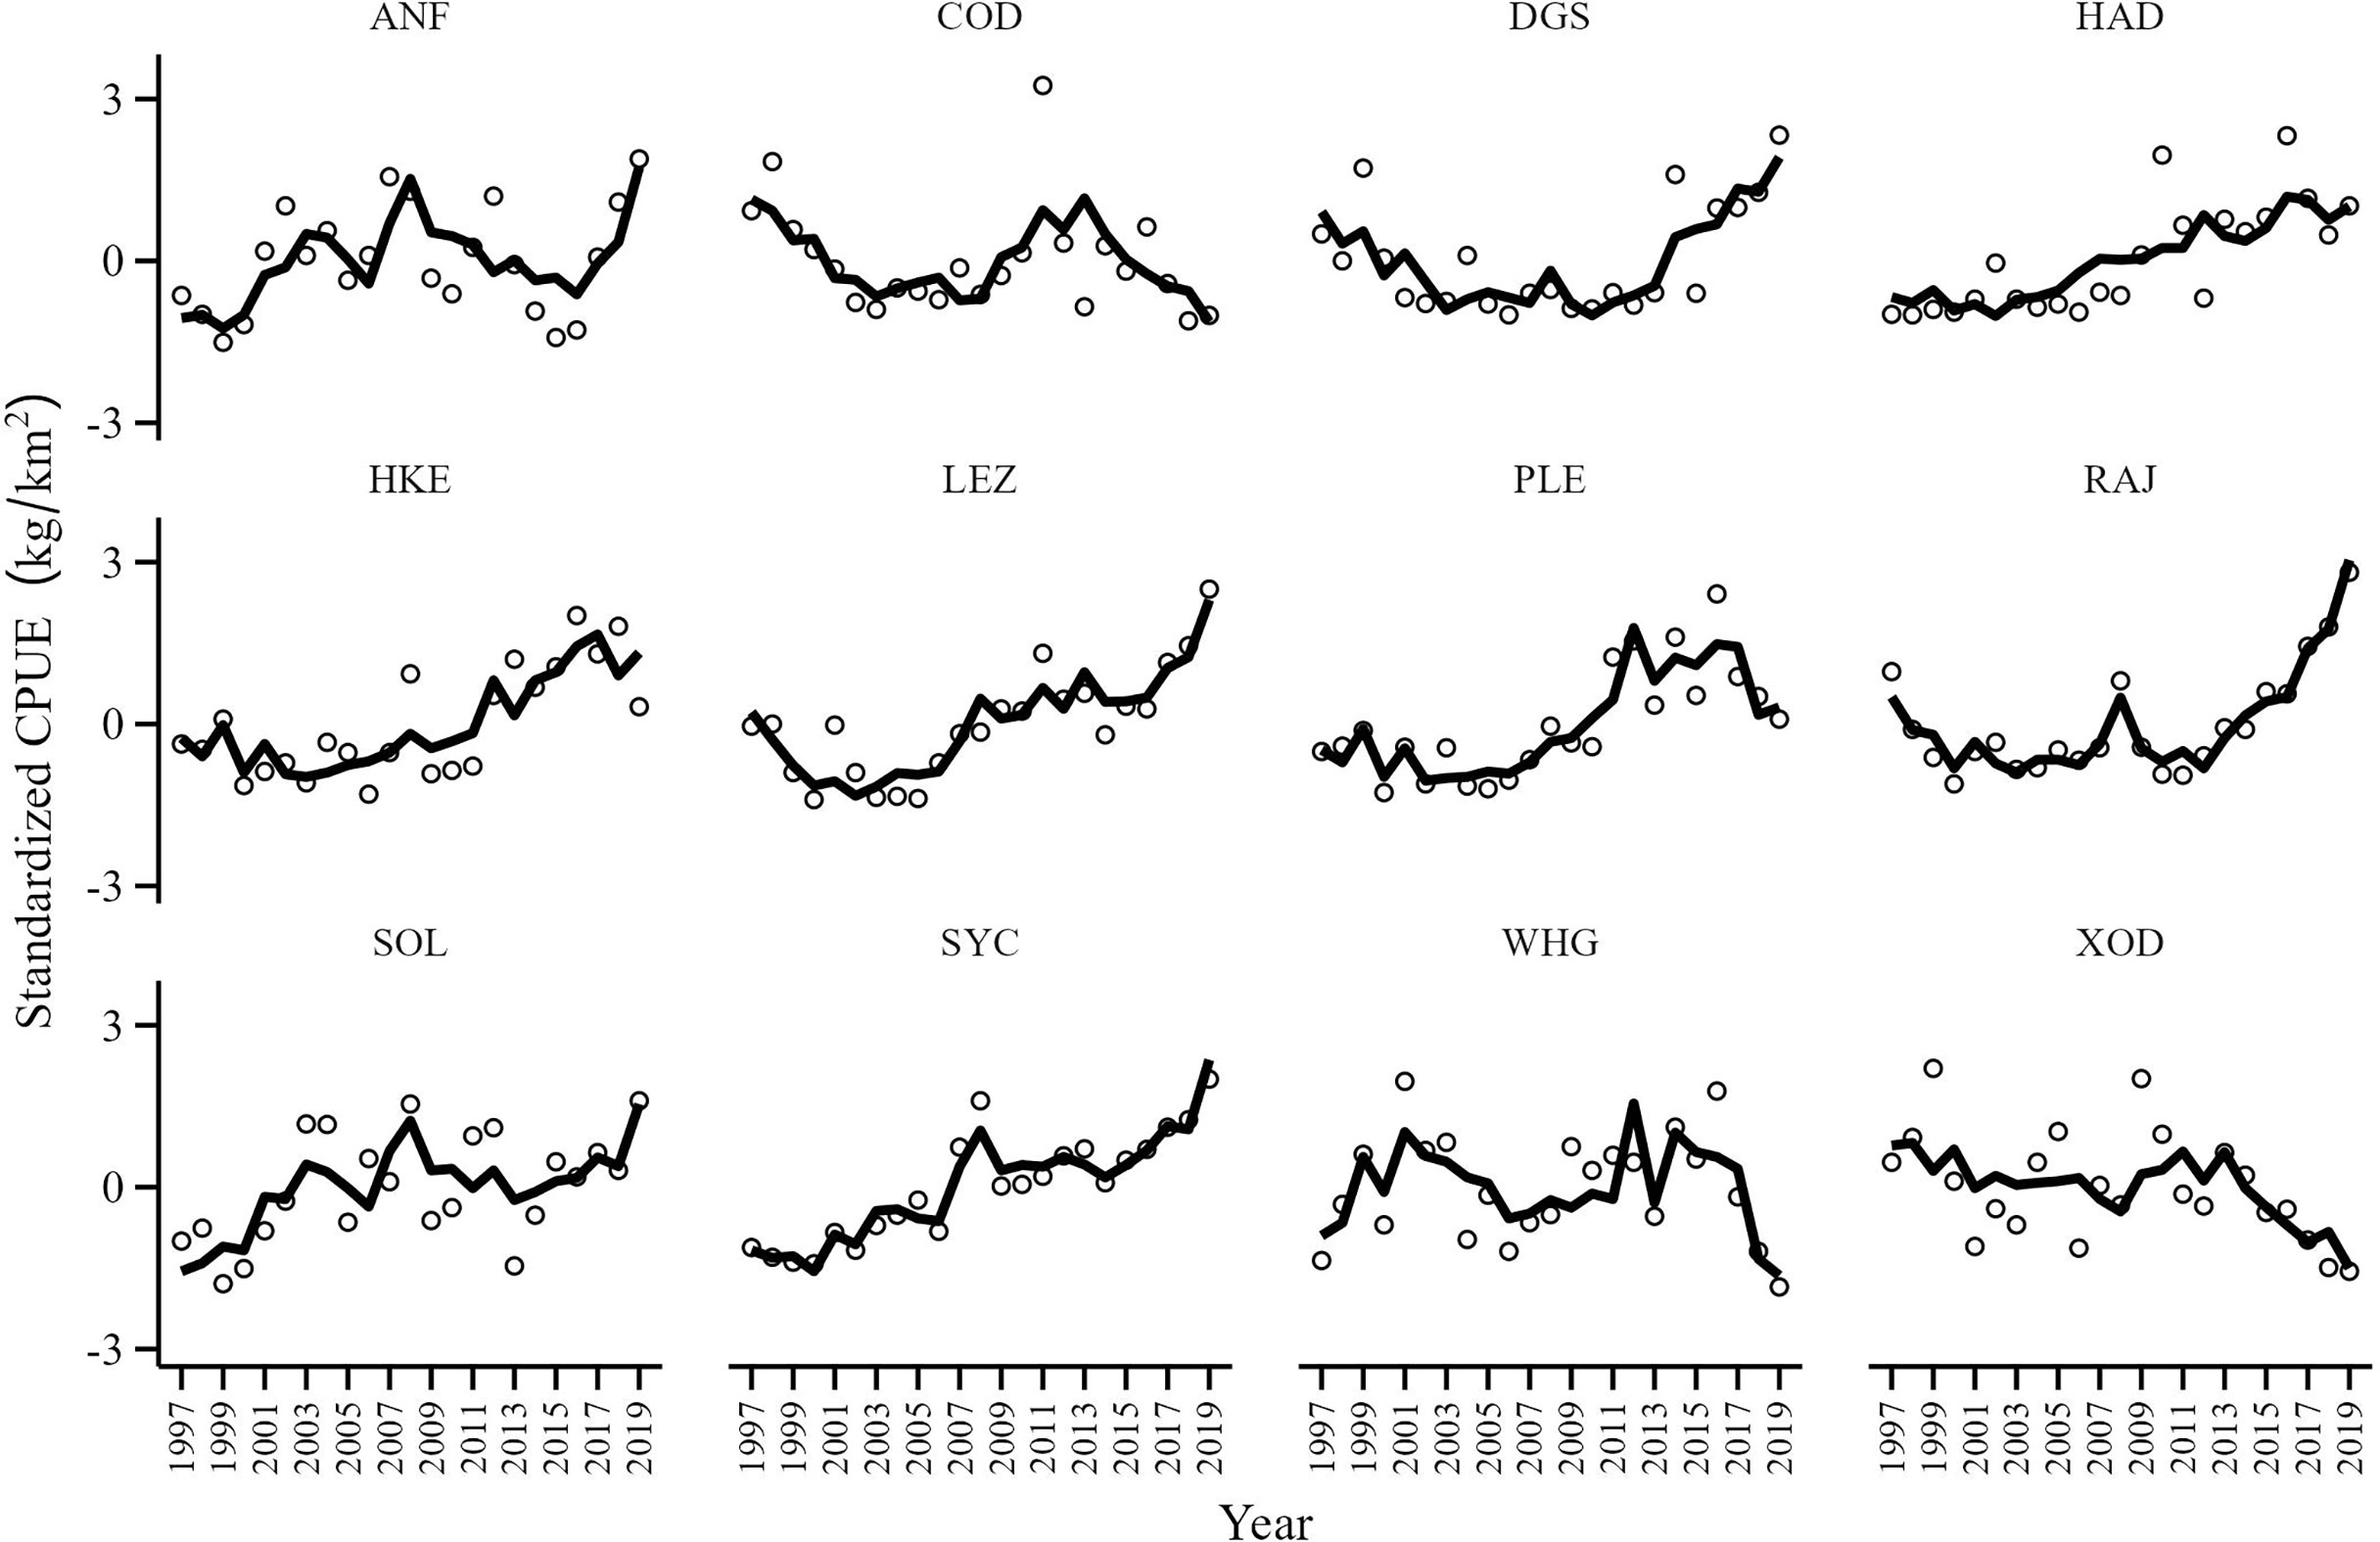
Figure 6 Observed values (open circles) and the model fit (black line) obtained by the DFA model with one common trend, symmetrical non-diagonal matrix with mean exploitation rate (FER), cod exploitation rate (FERcod) and C. finmarchicus abundance (FIN) as covariates. Units are expressed as standard deviations from the mean.
Many of the CPUE series had a significant relationship with at least one covariate, particularly the mean fishing exploitation rate (Table 3). The CPUE of the skates and rays, cod, spurdog, hake, megrim and plaice increased when the mean fishing exploitation rate decreased whereas the CPUE of whiting decreased. The regression coefficients indicate that the negative relationship was strongest for two of the three elasmobranch CPUE series (i.e., spurdog, skates and rays). As expected, the CPUE series of cod, whiting, plaice and Trisopterus spp. increased when cod fishing exploitation decreased. However, the CPUE of anglerfish, spurdog, and particularly the skates and rays increased when cod exploitation rate increased. The CPUE of hake, plaice and particularly whiting increased when the abundance of C. finmarchicus increased in the plankton. Most of the significant relationships identified by the regression component of the DFA model (Table 3) can also be inferred upon visual inspection of the RDA correlation triplot (Figure 5) although there were some notable discrepancies. The DFA model identified significant relationships between cod, whiting and FER whereas the cod, whiting and FER vectors in the RDA correlation triplot were approximately orthogonal indicating no association. The same discrepancy between the two methods was also observed between the FERcod and plaice. DFA is better suited to analyzing relationships between non-stationary time series (Zuur et al., 2003a; Zuur et al., 2003b) so our inferences are based on the results of the optimal DFA model (Table 2).
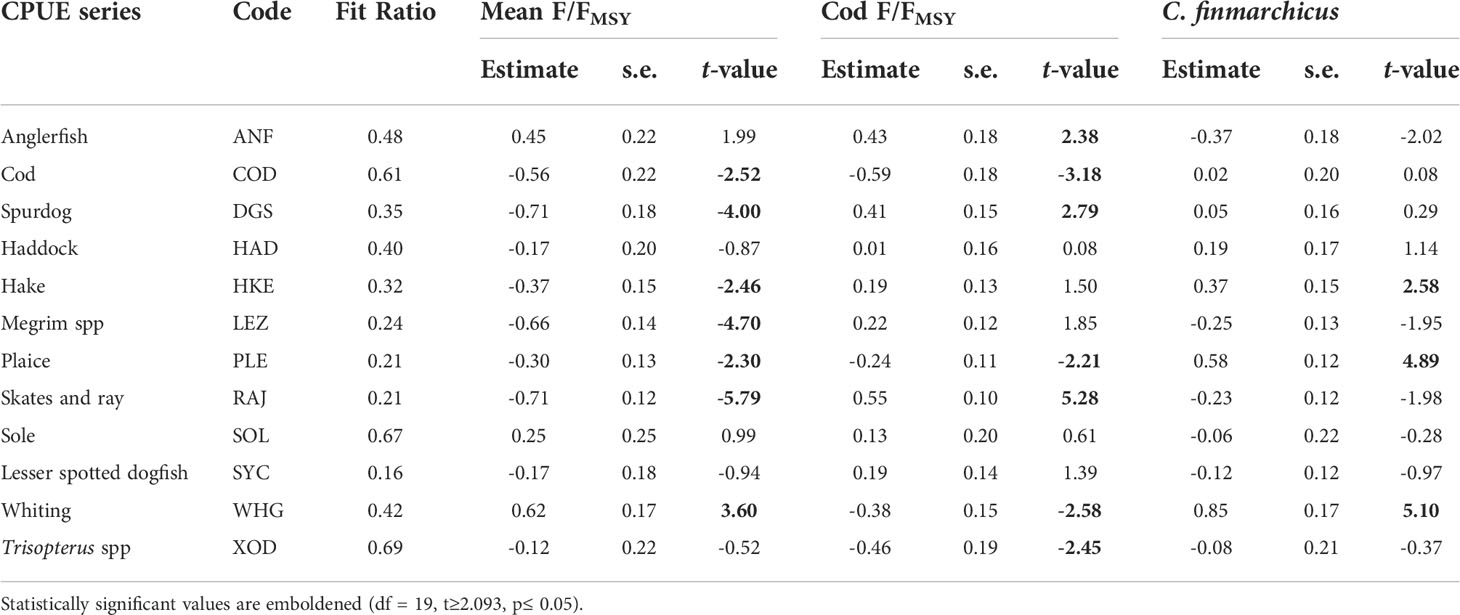
Table 3 FAO Code, fit ratio, estimated regression coefficients, standard errors (s.e.) and t-values for each CPUE series in the optimal DFA model.
The common trend captured a single underlying pattern in the unexplained temporal variation of the CPUE series. The trend increased steadily from 1997 until 2010, remained relatively stable until 2012, then decreased to 2014 and subsequently increased to 2019 (Figure 7A). The significant canonical correlations between the CPUE series and the common trend show that haddock (HAD), hake (HKE), megrim (LEZ), plaice (PLE), sole (SOL) and particularly lesser-spotted dogfish (SYC) were positively associated with the common trend (Figure 7B). The common trend is informative because its pattern may resemble the trend of a latent variable that is influencing the canonically correlated CPUE series.
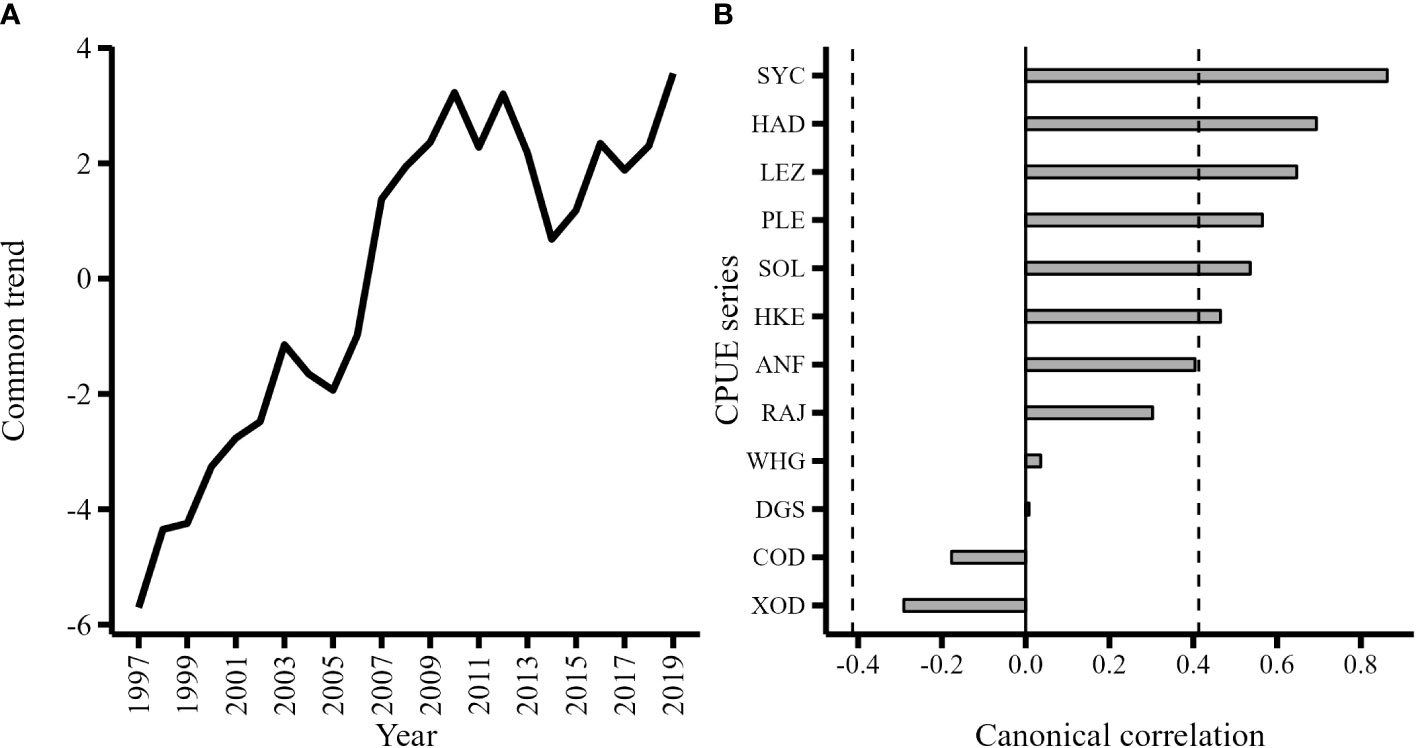
Figure 7 (A) Common trend estimated from optimal DFA model; (B) Canonical correlations between each CPUE series and the common trend. Canonical correlations greater or less than 0.413 (vertical dashed line) indicate CPUE series were significantly correlated (α = 0.05) with the common trend.
The Spearman’s rank correlation test used to identify monotonic associations between the common trend and explanatory variables not included in the optimal DFA model indicated that the exploitation rate (F/FMSY) of white angler (FP White Angler), whiting (FP Whiting), and the northern hake (FP N. Hake) ICES stocks had significant negative monotonic associations with the common trend (Table 4). This suggests that the CPUE of haddock, hake, megrim, plaice, sole and lesser-spotted dogfish increased as the exploitation rate of whiting, white angler, and the northern hake stocks decreased.
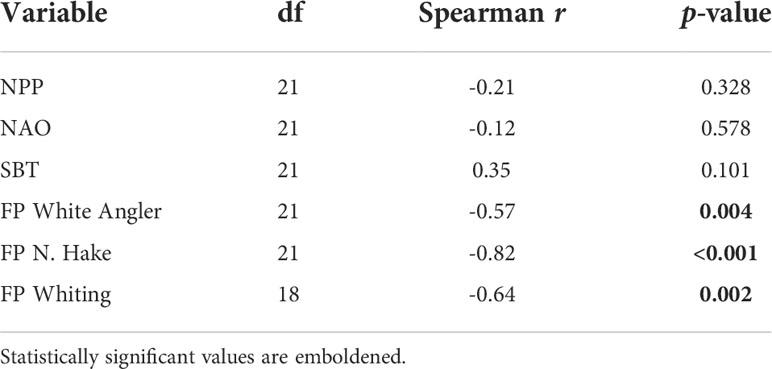
Table 4 Spearman’s correlation between the common trend and explanatory variables not included in the optimal model.
4 Discussion
Our results show that fishing was the dominant driver of CPUE from 1997 to 2019 and that the gradual reduction in exploitation rates (F/FMSY) probably led to the partial recovery of managed (i.e., cod, hake, megrim, plaice, and whiting) and unmanaged populations (i.e., Trisopterus spp., spurdog, and skates and rays). We also detected a positive relationship between the abundance of C. finmarchicus in the plankton and the CPUE of hake, plaice, and whiting. Net primary production (NPP), sea bottom temperature (SBT) and the abundance of the copepod C. helgolandicus (HEL) appear to have cyclical patterns but remained relatively stable from 1997 to 2019. Our results agree with findings from the Celtic Sea Ecopath with Ecosim model which identified fishing as the primary driver of observed ecosystem change from 1985 to 2016 (Hernvann et al., 2020).
4.1 Trends
A steady decrease in the exploitation rates (F/FMSY) of several commercially important ICES stocks (i.e., haddock, megrim, plaice and sole) was observed during the study period 1997-2019. The fishing mortality (F) of plaice achieved FMSY in 2010 whereas the fishing mortality of megrim, haddock and sole were closest to their respective FMSY reference values in 2019. The fishing mortality rate of cod was double the rate required to achieve FMSY for most of the study period and rapidly increased after 2016. Unfortunately, cod is often caught as bycatch and despite zero catch advice in 2019 (ICES, 2021) fishing mortality was three times greater than FMSY. The copepod C. helgolandicus was the dominant copepod in the Celtic Sea, indicative of changes in mesozooplankton biomass, but we did not identify any significant relationships with the CPUE series. The abundance of C. helgolandicus was relatively stable compared to C. finmarchicus for the study period. The C. finmarchicus time series showed a marked increase in 2011 where it remained at high levels until 2017. Sea bottom temperature and the abundance of C. helgolandicus experienced a rapid decline during the same period as net primary production (2003-2007). C. helgolandicus is a warm-water copepod and therefore reduced abundances are likely due to decreasing water temperatures and reduced basal productivity (Montero et al., 2021).
4.2 Effects of fishing
Our ecological time series begins in 1997 so inferences are in the context of an already depleted ecosystem subject to intensive fishing (Guénette and Gascuel, 2012; Gascuel et al., 2016). Relationships inferred from the regression component of the DFA model show that the CPUE of cod, spurdog, hake, megrim, plaice and particularly the skates and rays increased when mean exploitation rate (FER) decreased. Furthermore, the CPUE of stocks whose reference points were excluded from the mean exploitation rate metric (i.e., cod, spurdog, hake and the skates and rays) also increased when the mean exploitation rate decreased. The Celtic Sea demersal fishery is considered highly mixed (Moore et al., 2019; ICES, 2022b) so it is possible that management measures, or any other change in exploitation patterns, imposed on one species influences other members of the demersal community that are often caught together (Ulrich et al., 2017). This result is important for informing EBFM because it demonstrates that exploitation patterns imposed on one species or stock has the potential to have effects on all species caught together with commercial bottom trawling gear (e.g., hake, spurdog and the skates and rays). Modifying fishing behavior (Reid et al., 2019; Calderwood et al., 2020), improving gear selectivity (Fonseca et al., 2005; Kynoch et al., 2015) and possibly including spurdog, hake and the skates and rays into Celtic Sea mixed fisheries advice may achieve the desired outcome of balanced harvesting (i.e., targeting strong stocks and avoiding weak stocks).
Interestingly, the CPUE of whiting increased with mean exploitation rate. This positive relationship was unexpected, it is possible that whiting benefit from the removal of competitors (Temming et al., 2004; Rowlands et al., 2008) and predators (ICES, 1997) at various life stages. Further studies using additional time points are required to verify this possible interspecific relationship. The positive relationship between cod exploitation rate and the CPUE of anglerfish, spurdog and the skates and rays were contrary to our expectation that reducing fishing pressure on a ‘choke’ species would increase the CPUE of other demersal fish. Cod have a broad diet that shifts ontogenetically (Pinnegar et al., 2003; Link et al., 2009) and their diet consists of several species (e.g., whiting, haddock, megrim, Trisopterus spp.) included in this study (ICES, 1997). We did not find evidence in the literature that cod actively predate on spurdog, anglerfish, skates, and rays but we speculate that these species may be released from competition pressure by the removal of cod from the community.
It is important to highlight that, despite being the longest consistent fisheries independent time series available for the Celtic Sea, the CPUE series are relatively short and therefore the analyses and conclusions may be sensitive to influential observations. For example, the cod exploitation and the CPUE of anglerfish, spurdog and the skates and rays showed a rapid increase at the end of their respective time series which may have led to detection of a positive relationship. However, the negative relationship between cod exploitation rate and the CPUE of cod and other demersal species often caught together (e.g., whiting, plaice and Trisopterus spp.) suggests that these relationships are biologically meaningful. Longer time series of data would be needed to confirm these findings, but this should not prevent this type of analysis being explored.
4.3 Effects of zooplankton
We observed that the CPUE of plaice, hake and whiting increased when the abundance of C. finmarchicus increased in the plankton. We assume that the positive relationship is linked to recruitment success because the Celtic Sea is an important nursery area for these species (Dransfeld et al., 2004; Ellis et al., 2012) and the larvae and juveniles of plaice, hake and whiting are known to feed on several stages of calanoid copepods (Ryland, 1964; Fjøsne, 1996; Rowlands et al., 2008; Morote et al., 2011). The calanoid copepods C. finmarchicus and C. helgolandicus co-occur in the Celtic Sea but the cold-water C. finmarchicus reaches maximum abundance earlier in the year (Planque and Fromentin, 1996). Recruitment success has been linked to the synchronous timings of fish larvae and prey availability (Cushing, 1990; Beaugrand et al., 2003) and declines in the abundance of C. finmarchicus have been linked to the low survival of fish larvae in the North Sea (Beaugrand et al., 2003; van Deurs et al., 2009).
The underlying mechanism remains unclear but we speculate that years with relatively high abundances of C. finmarchicus in the zooplankton (e.g., 2011-2017) improved fish recruitment success because the timing of C. finmarchicus spring bloom (i.e., period of high biomass) and the spawning of whiting, hake and plaice (Coombs and Mitchell, 1982; Heessen et al., 2015) may have been better matched. It is also possible that C. finmarchicus is an energetically favorable food which has been shown in the North Sea to influence the probability of occurrence of cod (Beaugrand and Kirby, 2010). We recommend future studies include the seasonal timings of zooplankton abundance into an ecological time series to verify this suggestion.
4.4 Patterns in the unexplained
The common trend represents an underlying pattern in the temporal variation of the CPUE time series that was not explained by fishing or the abundance of C. finmarchicus. Haddock, hake, megrim, plaice, sole and lesser-spotted dogfish CPUE series were positively correlated with the common trend which implies that their CPUE series were affected by a common latent variable. Spearman’s rank correlations between the common trend and omitted variables identified the exploitation rates of white angler, whiting and the northern hake stocks as potential drivers of haddock, hake, megrim, plaice, sole and lesser-spotted dogfish CPUE series. This further substantiates our finding that exploitation patterns on single-species stocks influence other members of the Celtic Sea demersal community, and that hake, megrim, plaice, lesser-spotted dogfish, and sole should be considered in Celtic Sea mixed fisheries advice.
In conclusion, our ecosystem assessment of the fisheries ecology of the Celtic Sea has shown that the abundance, inferred from CPUE, of cod, hake, megrim, plaice, whiting, Trisopterus spp., anglerfish, spurdog and the skates and rays were mainly driven by exploitation patterns (i.e., fishing mortality in relation to FMSY) from 1997 to 2019. We also observed that potentially important ecosystem drivers (e.g., net primary production, sea bottom temperature and the NAO) did not influence CPUE as much as fishing, although the abundance of C. finmarchicus did appear to affect plaice, hake, and whiting. Even though NPP did not influence CPUE as much as fishing or C. finmarchicus its relevance to the stocks should not be overlooked because it could have direct and indirect effects (e.g., through zooplankton) on larval survival and fish recruitment. In part, the general lack of influence of external ecosystem variables is likely due to the environmental variables (i.e., NPP, SBT, NAO) not exhibiting any obvious trends across the study period. We infer from our findings that in the Celtic Sea the recovery of cod, spurdog, hake, megrim, plaice, whiting, Trisopterus spp. and the skates and rays remains dependent on controlling fishing mortality, and this would not, at least for now, be confounded by environmental conditions.
Data availability statement
Publicly available datasets were analyzed in this study. This data can be found here: Atlantic-European Iberian-Biscay-Ireland Ocean Physics Reanalysis, Copernicus Marine Environment Monitoring Services, https://resources.marine.copernicus.eu/product-detail/IBI_MULTIYEAR_PHY_005_002/DATA-ACCESS; Atlantic-European Iberian-Biscay-Ireland Ocean Biogeochemistry Reanalysis, Copernicus Marine Environment Monitoring Services, https://resources.marine.copernicus.eu/product-detail/IBI_MULTIYEAR_BGC_005_003/DATA-ACCESS; National Center for Atmospheric Research. https://climatedataguide.ucar.edu/climate-data/hurrell-north-atlantic-oscillation-nao-index-pc-based; Continuous Plankton Recorder Survey. https://doi.org/10.17031/1812; Stock Assessment outputs: Working Group for the Bay of Biscay and the Iberian Waters Ecoregion - http://www.ices.dk/sites/pub/Publication Reports/Forms/DispForm.aspx?ID=36841, Working Group for the Celtic Seas Ecoregion -https://doi.org/10.17895/ICES.PUB.5978. Celtic Sea Groundfish Survey Monitoring and Assessment Data Products. http://doi.org/10.7489/1958-1.
Author contributions
JK, PB, ER, and DR contributed to conception and design of study. JK organized the data, performed the analysis and wrote the original draft of the manuscript. All authors contributed to manuscript revision, read, and approved the submitted version.
Funding
Funding was received from the Department of Agriculture, Food and the Marine (DAFM) 2015 Competitive Call for Research (15/S/744). This research was carried out with the support of the Marine Institute under the Marine Research Programme with the support of the Irish Government (NET/22/56).
Conflict of interest
The authors declare that the research was conducted in the absence of any commercial or financial relationships that could be construed as a potential conflict of interest.
Publisher’s note
All claims expressed in this article are solely those of the authors and do not necessarily represent those of their affiliated organizations, or those of the publisher, the editors and the reviewers. Any product that may be evaluated in this article, or claim that may be made by its manufacturer, is not guaranteed or endorsed by the publisher.
Supplementary material
The Supplementary Material for this article can be found online at: https://www.frontiersin.org/articles/10.3389/fmars.2022.978654/full#supplementary-material
Supplementary Figure 1 | Pair plot of megrim (meg.27.7b-k,8abd), haddock (had.27.7b-k), sole (sol.27.7fg), plaice (ple.27.7fg) and cod (cod.27.7e-k) fishing exploitation rates (F/FMSY). Lower diagonal contains correlation plots; diagonal contains density plot and histogram, and the upper triangle contains the spearman correlation coefficients (r). Statistical significance is denoted by: *** p =0.001, ** p=0.01, *p=0.05.
Supplementary Figure 2 | Cross correlations between CPUE series and lagged series (0-3 years) of NPP (black), Calanus helgolandicus (grey) and Calanus finmarchicus (white). Dashed lines denote upper and lower threshold of statistical significance (α = 0.05).
Supplementary Figure 3 | Relationship between CPUE series and lagged values (lag 0-3). Dashed lines denote upper and lower threshold of statistical significance (α = 0.05).
Supplementary Figure 4 | Reference distribution of permuted F-statistics and the F-statistic of the observed series (black vertical line). The calculated p-value (1/22) was 0.043.
References
Babyak M. A. (2004). What you see may not be what you get: A brief, nontechnical introduction to overfitting in regression-type models. Psychosom. Med. 113, 411–421.
Baudron A. R., Brunel T., Blanchet M. A., Hidalgo M., Chust G., Brown E. J., et al. (2020). Changing fish distributions challenge the effective management of European fisheries. Ecography 434, 494–505. doi: 10.1111/ecog.04864
Beaugrand G. (2004). The north Sea regime shift: Evidence, causes, mechanisms and consequences. Prog. Oceanogr. 602-4, 245–262. doi: 10.1016/j.pocean.2004.02.018
Beaugrand G., Brander K. M., Alistair Lindley J., Souissi S., Reid P. C. (2003). Plankton effect on cod recruitment in the north Sea. Nature 426, 661–664. doi: 10.1038/nature02164
Beaugrand G., Kirby R. R. (2010). Climate, plankton and cod. Glob. Change Biol. 164, 1268–1280. doi: 10.1111/j.1365-2486.2009.02063.x
Bentley J. W., Serpetti N., Fox C. J., Heymans J. J., Reid D. G. (2020). Retrospective analysis of the influence of environmental drivers on commercial stocks and fishing opportunities in the Irish Sea. Fish. Oceanogr. 295, 415–435. doi: 10.1111/fog.12486
Bindoff N. L., Cheung W. W., Kairo J. G., Arístegui J., Guinder V. A., Hallberg R., et al. (2019). “Changing ocean, marine ecosystems, and dependent communities,” in IPCC special report on the ocean and cryosphere in a changing climate, (Geneva, Switzerland:IPCC)477–587.
Blanchard F., LeLoc’h F., Hily C., Boucher J. (2004). Fishing effects on diversity, size and community structure of the benthic invertebrate and fish megafauna on the bay of Biscay coast of France. Mar. Ecol. Prog. Ser. 280, 249–260. doi: 10.3354/meps280249
Borcard D., Gillet F., Legendre P. (2018). “Canonical ordination,” in Numerical ecology with r. 2nd edn (Cham: Springer), 203–297. doi: 10.1007/978-3-319-71404-2_6
Calderwood J., Robert M., Pawlowski L., Vermard Y., Radford Z., Catchpole T. L., et al. (2020). Hotspot mapping in the celtic Sea: An interactive tool using multinational data to optimise fishing practices. Mar. Policy 116, 103511. doi: 10.1016/j.marpol.2019.103511
Campbell R. A. (2015). Constructing stock abundance indices from catch and effort data: Some nuts and bolts. Fish. Res. 161, 109–130. doi: 10.1016/j.fishres.2014.07.004
Chen C. S. (2010). Abundance trends of two neon flying squid (Ommastrephes bartramii) stocks in the north pacific. ICES J. Mar. Sci. 677, 1336–1345. doi: 10.1093/icesjms/fsq063
Coombs S. H., Mitchell C. E. (1982). The development rate of eggs and larvae of the hake, merluccius merluccius (L.) and their distribution to the west of the British isles. ICES J. Mar. Sci. 402, 119–126. doi: 10.1093/icesjms/40.2.119
Core Team R. (2021). R: A language and environment for statistical computing (Vienna, Austria: R Foundation for Statistical Computing).
Crozier W. W. (1985). Observations on the food and feeding of the angler-fish, lophim piscatorius l., in the northern Irish Sea. J. Fish Biol. 275, 655–665. doi: 10.1111/j.1095-8649.1985.tb03210.x
Cushing D. H. (1990). Plankton production and year-class strength in fish populations: an update of the Match/Mismatch hypothesis. Adv. Mar. Biol. 26, 249–293. doi: 10.1016/S0065-2881(08)60202-3
Dransfeld L., Dwane O., McCarney C., Kelly C. J., Danilowicz B. S., Fives J. M. (2004). “Larval distribution of commercial fish species in waters around Ireland,” in Irish Fisheries investigations no. 13 (Ireland: Marine Institute).
Ellis J. R., Milligan S. P., Readdy L., Taylor N., Brown M. J. (2012). Spawning and nursery grounds of selected fish species in UK waters. Sci. Ser. Tech. Rep. (CEFAS, Lowestoft) 147, 19–46.
Eme D., Rufino M. M., Trenkel V. M., Vermard Y., Laffargue P., Petitgas P., et al. (2022). Contrasted spatio-temporal changes in the demersal fish assemblages and the dominance of the environment vs fishing pressure, in the bay of Biscay and celtic Sea. Prog. Oceanogr. 204, 102788. doi: 10.1016/j.pocean.2022.102788
Eriksen E., Skjoldal H. R., Gjøsæter H., Primicerio R. (2017). Spatial and temporal changes in the barents Sea pelagic compartment during the recent warming. Prog. Oceanog. 151, 206–226. doi: 10.1016/j.pocean.2016.12.009
Erzini K. (2005). Trends in NE Atlantic landings (southern portugal): Identifying the relative importance of fisheries and environmental variables. Fish Oceanogr. 143, 195–209. doi: 10.1111/j.1365-2419.2005.00332.x
European Commission (2002). Council regulation (EC) no 2371/2002 of 20 December 2002 on the conservation and sustainable exploitation of fisheries resources under the common fisheries policy ((EC) no 2371/2002). Off. J. Eur. Communities. (Brussels:Official Journal of the European Union) 45, 59–80.
European Parliament and European Council (2013). Regulation on the common fisheries policy, amending council regulations (EC) no 1954/2003 and (EC) no 1224/2009 and repealing council regulations (EC) no 2371/2002 and (EC) no 639/2004 and council decision 2004/585/EC ((EU) no 1380/2013)). Off. J. Eur. Union. (Brussels:Official Journal of the European Union) 56, 22–61). doi: 10.3000/19770677.L_2013.354.eng
Fernandes P. G., Cook R. M. (2013). Reversal of fish stock decline in the northeast Atlantic. Curr. Biol. 2315, 1432–1437. doi: 10.1016/j.cub.2013.06.016
Fjøsne K. (1996). Dietary composition and the potential of food competition between 0-group cod (Gadus morhua l.) and some other fish species in the littoral zone. ICES J. Mar. Sci. 535, 757–770. doi: 10.1006/jmsc.1996.0097
Fonseca P., Campos A., Mendes B., Larsen R. B. (2005). Potential use of a nordmøre grid for by-catch reduction in a Portuguese bottom-trawl multispecies fishery. Fish. Res. 731-2, 49–66. doi: 10.1016/j.fishres.2005.01.005
Fraser H. M., Greenstreet S. P., Piet G. J. (2007). Taking account of catchability in groundfish survey trawls: Implications for estimating demersal fish biomass. ICES J. Mar. Sci. 649, 1800–1819. doi: 10.1093/icesjms/fsm145
Gascuel D., Coll M., Fox C., Guénette S., Guitton J., Kenny A., et al. (2016). Fishing impact and environmental status in European seas: A diagnosis from stock assessments and ecosystem indicators. Fish Fish. 171, 31–55. doi: 10.1111/faf.12090
Goikoetxea N., Irigoien X. (2013). Links between the recruitment success of northern European hake (Merluccius merluccius l.) and a regime shift on the NE Atlantic continental shelf. Fish Oceanogr. 226, 459–476. doi: 10.1111/fog.12033
Gosch M., Hernandez-Milian G., Rogan E., Jessopp M., Cronin M. (2014). Grey seal diet analysis in Ireland highlights the importance of using multiple diagnostic features. Aquat. Biol. 202, 155–167. doi: 10.3354/ab00553
Guénette S., Gascuel D. (2012). Shifting baselines in European fisheries: The case of the celtic Sea and bay of Biscay. Ocean Coast. Manag. 70, 10–21. doi: 10.1016/j.ocecoaman.2012.06.010
Heessen H. J. L., Daan N., Ellis J. R. (2015). Fish atlas of the celtic Sea, north Sea, and Baltic Sea: Based on international research-vessel surveys (Wageningen: Wageningen Academic Publishers). doi: 10.3920/978-90-8686-878-0
Heinze G., Dunkler D. (2017). Five myths about variable selection. Transpl. Int. 301, 6–10. doi: 10.1111/tri.12895
Hernvann P. Y., Gascuel D. (2020). Exploring the impacts of fishing and environment on the celtic Sea ecosystem since 1950. Fish. Res. 225, 105472. doi: 10.1016/j.fishres.2019.105472
Hernvann P. Y., Gascuel D., Grüss A., Druon J. N., Kopp D., Perez I., et al. (2020). The celtic Sea through time and space: Ecosystem modeling to unravel fishing and climate change impacts on food-web structure and dynamics. Front. Mar. Sci. 7. doi: 10.3389/fmars.2020.578717
Hickman A., Moore C., Sharples J., Lucas M., Tilstone G., Krivtsov V., et al. (2012). Primary production and nitrate uptake within the seasonal thermocline of a stratified shelf sea. Mar. Ecol. Prog. Ser. 463, 39–57. doi: 10.3354/meps09836
Hurrell J. W. (1995). Decadal trends in the north Atlantic oscillation: Regional temperatures and precipitation. Science 2695224, 676–679. doi: 10.1126/science.269.5224.676
Hurrell J. W., Deser C. (2010). North Atlantic climate variability: The role of the north Atlantic oscillation. J. Mar. Syst. 793-4, 231–244. doi: 10.1016/j.jmarsys.2009.11.002
Hutchinson G. E. (1957). Concluding remarks. Cold Spring Harbor Symp. Quant. Biol. 22, 415–427. doi: 10.1101/SQB.1957.022.01.039
ICES (1997). “Database report of the stomach sampling project 1991,” in ICES cooperative research report. 219, 422 (Copenhagen:ICES). doi: 10.17895/ices.pub.4626
ICES (2017). “Manual of the IBTS north Eastern Atlantic surveys,” in Series of ICES survey protocols SISP 15(v4) (Copenhagen:ICES). doi: 10.17895/ices.pub.3519
ICES (2020). Working group for the bay of Biscay and the Iberian waters ecoregion (WGBIE). ICES Sci. Rep. 2, 49. doi: 10.17895/ices.pub.6033
ICES (2021). Report of the working group for the celtic seas ecoregion (WGCSE). ICES Sci. Rep. 2, 40. doi: 10.17895/ICES.PUB.5978
ICES (2022a). Third workshop on integrated trend analysis to support integrated ecosystem assessment (WKINTRA-3). ICES Sci. Rep. 4, 32. doi: 10.17895/ICES.PUB.19398317
ICES (2022b). Working group on mixed fisheries advice (WGMIXFISH-ADVICE). ICES Sci. Rep. 4, 4. doi: 10.17895/ices.pub.9379
Johns D. (2022). Selected CPR data for European shelf seas standard areas 1980-2019 as recorded by the continuous plankton recorder survey (Plymouth, MA: CPR survey. The Archive for Marine Species and Habitats Data (DASSH). doi: 10.17031/1812
Kynoch R. J., Fryer R. J., Neat F. C. (2015). A simple technical measure to reduce bycatch and discard of skates and sharks in mixed-species bottom-trawl fisheries. ICES J. Mar. Sci. 726, 1861–1868. doi: 10.1093/icesjms/fsv037
Link J. S., Bogstad B., Sparholt H., Lilly G. R. (2009). Trophic role of Atlantic cod in the ecosystem. Fish Fish. 101, 58–87. doi: 10.1111/j.1467-2979.2008.00295.x
Link J. S., Huse G., Gaichas S., Marshak A. R. (2020). Changing how we approach fisheries: A first attempt at an operational framework for ecosystem approaches to fisheries management. Fish Fish. 212, 393–434. doi: 10.1111/faf.12438
Mérillet L., Kopp D., Robert M., Mouchet M., Pavoine S. (2020). Environment outweighs the effects of fishing in regulating demersal community structure in an exploited marine ecosystem. Glob. Change Biol. 264, 2106–2119. doi: 10.1111/gcb.14969
Möllmann C., Diekmann R., Müller-Karulis B., Kornilovs G., Plikshs M., Axe P. (2009). Reorganization of a large marine ecosystem due to atmospheric and anthropogenic pressure: a discontinuous regime shift in the central Baltic Sea. Glob. Change Biol. 156, 1377–1393. doi: 10.1111/j.1365-2486.2008.01814.x
Möllmann C., Lindegren M., Blenckner T., Bergström L., Casini M., Diekmann R., et al. (2014). Implementing ecosystem-based fisheries management: from single-species to integrated ecosystem assessment and advice for Baltic Sea fish stocks. ICES J. Mar. Sci. 715, 1187–1197. doi: 10.1093/icesjms/fst123
Montero J. T., Lima M., Estay S. A., Rezende E. L. (2021). Spatial and temporal shift in the factors affecting the population dynamics of calanus copepods in the north Sea. Glob. Change Biol. 273, 576–586. doi: 10.1111/gcb.15394
Moore C., Davie S., Robert M., Pawlowski L., Dolder P., Lordan C. (2019). Defining métier for the celtic Sea mixed fisheries: A multiannual international study of typology. Fish. Res. 219, 105310. doi: 10.1016/j.fishres.2019.105310
Moriarty M., Greenstreet S. (2017). Celtic Sea/Bay of Biscay French quarter 4 otter trawl groundfish survey monitoring and assessment data products. doi: 10.7489/1958-1
Moriarty M., Greenstreet S., Rasmussen J. (2017). Derivation of groundfish survey monitoring and assessment data product for the northeast Atlantic area. Scottish Mar. Freshw. Sci. 816, 240. doi: 10.7489/1984-1
Morote E., Olivar M. P., Bozzano A., Villate F., Uriarte I. (2011). Feeding selectivity in larvae of the European hake (Merluccius merluccius) in relation to ontogeny and visual capabilities. Mar. Biol. 1586, 1349–1361. doi: 10.1007/s00227-011-1654-2
Moullec F., Gascuel D., Bentorcha K., Guénette S., Robert M. (2017). Trophic models: What do we learn about celtic Sea and bay of Biscay ecosystems? J. Mar. Sys. 172, 104–117. doi: 10.1016/j.jmarsys.2017.03.008
Oksanen J., Simpson G. L., Blanchet F. G., Kindt R., Legendre P., Minchin R. R., et al. (2022). Vegan: Community ecology package (R package version 2), 6–2. Available at: https://cran.r-project.org/web/packages/vegan/index.html.
Pedreschi D., Bouch P., Moriarty M., Nixon E., Knights A. M., Reid D. G. (2019). Integrated ecosystem analysis in Irish waters; providing the context for ecosystem-based fisheries management. Fish. Res. 209, 218–229. doi: 10.1016/j.fishres.2018.09.023
Pinnegar J. K., Trenkel V. M., Tidd A. N., Dawson W. A., Du buit M. H. (2003). Does diet in celtic Sea fishes reflect prey availability? J. Fish Biol. 63, 197–212. doi: 10.1111/j.1095-8649.2003.00204.x
Planque B., Arneberg P. (2018). Principal component analyses for integrated ecosystem assessments may primarily reflect methodological artefacts. ICES J. Mar. Sci. 753, 1021–1028. doi: 10.1093/icesjms/fsx223
Planque B., Fromentin J. (1996). Calanus and environment in the eastern north atlantic. i. spatial and temporal patterns of c. finmarchicus and c. helgolandicus. Mar. Ecol. Prog. Ser. 134, 101–109. doi: 10.3354/meps134101
Reid D. G., Calderwood J., Afonso P., Bourdaud P., Fauconnet L., González-Irusta J. M., et al. (2019). “The best way to reduce discards is by not catching them!” in The European landing obligation. Eds. Uhlmann S. S., Ulrich C., Kennelly. S. J. (Cham: Springer), 257–278. doi: 10.1007/978-3-030-03308-8_13
Rowlands W. L., Dickey-Collas M., Geffen A. J., Nash R. D. M. (2008). Diet overlap and prey selection through metamorphosis in Irish Sea cod (Gadus morhua), haddock (Melanogrammus aeglefinus), and whiting (Merlangius merlangus). Can. J. Fish. Aquat. Sci. 657, 1297–1306. doi: 10.1139/F08-041
Ryland J. S. (1964). The feeding of plaice and sand-eel larvae in the southern north Sea. J. Mar. Biolog. Assoc. U.K. 442, 343–364. doi: 10.1017/S0025315400024875
Sala A. (2018). Influence of tow duration on catch performance of trawl survey in the Mediterranean Sea. PLoS One 13, e0191662. doi: 10.1371/journal.pone.0191662
Simpson G. L. (2012). Restricted permutations; using the permute package (University of Regina, Regina, Canada: Environmental Change Research Centre-UCL).
Simpson S. D., Jennings S., Johnson M. P., Blanchard J. L., Schön P. J., Sims D. W., et al. (2011). Continental shelf-wide response of a fish assemblage to rapid warming of the Sea. Curr. Biol. 2118, 1565–1570. doi: 10.1016/j.cub.2011.08.016
Sissenwine M. P. (1984). “Why do fish populations vary?” in Exploitation of marine communities (Heidelberg: Springer), 59–94. doi: 10.1007/978-3-642-70157-3_3
Szuwalski C. S., Vert-Pre K. A., Punt A. E., Branch T. A., Hilborn R. (2015). Examining common assumptions about recruitment: A meta-analysis of recruitment dynamics for worldwide marine fisheries. Fish Fish. 164, 633–648. doi: 10.1111/faf.12083
Temming A., Gotz S., Mergardt N., Ehrich S. (2004). Predation of whiting and haddock on sandeel: aggregative response, competition and diel periodicity. J.Fish Biol. 645, 1351–1372. doi: 10.1111/j.0022-1112.2004.00400.x
ter Braak C. J. (1994). Canonical community ordination. part I: Basic theory and linear methods. Ecoscience 12, 127–140. doi: 10.1080/11956860.1994.11682237
ter Hofstede R., Hiddink J., Rijnsdorp A. (2010). Regional warming changes fish species richness in the eastern north Atlantic ocean. Mar. Ecol. Prog. Ser. 414, 1–9. doi: 10.3354/meps08753
Trenkel V., Pinnegar J., Dawson W., du Buit M., Tidd A. (2005). Spatial and temporal structure of predator-prey relationships in the celtic Sea fish community. Mar. Ecol. Prog. Ser. 299, 257–268. doi: 10.3354/meps299257
Ulrich C., Vermard Y., Dolder P. J., Brunel T., Jardim E., Holmes S. J., et al. (2017). Achieving maximum sustainable yield in mixed fisheries: a management approach for the north Sea demersal fisheries. ICES J. Mar. Sci. 742, 566–575. doi: 10.1093/icesjms/fsw126
van Deurs M., van Hal R., Tomczak M., Jónasdóttir S., Dolmer P. (2009). Recruitment of lesser sandeel ammodytes marinus in relation to density dependence and zooplankton composition. Mar. Ecol. Prog. Ser. 381, 249–258. doi: 10.3354/meps07960
Vanhatalo E., Kulahci M. (2016). Impact of autocorrelation on principal components and their use in statistical process control. Qual. Reliab. Eng. Int. 324, 1483–1500. doi: 10.1002/qre.1858
Zimmermann F., Claireaux M., Enberg K. (2019). Common trends in recruitment dynamics of north-east Atlantic fish stocks and their links to environment, ecology and management. Fish Fish. 203, 518–536. doi: 10.1111/faf.12360
Zuur A. F., Fryer R. J., Jolliffe I. T., Dekker R., Beukema J. J. (2003a). Estimating common trends in multivariate time series using dynamic factor analysis. Environmetrics 147, 665–685. doi: 10.1002/env.611
Keywords: ecosystem assessment, ecosystem based fisheries management, Calanus finmarchicus, dynamic factor analysis, International Bottom Trawl Survey
Citation: Kempf J, Breen P, Rogan E and Reid DG (2022) Trends in the abundance of Celtic Sea demersal fish: Identifying the relative importance of fishing and environmental drivers. Front. Mar. Sci. 9:978654. doi: 10.3389/fmars.2022.978654
Received: 26 June 2022; Accepted: 22 August 2022;
Published: 13 September 2022.
Edited by:
Marta Coll, Institute of Marine Sciences (CSIC), SpainReviewed by:
Lohengrin Fernandes, Instituto de Estudos do Mar Almirante Paulo Moreira, BrazilFabio Fiorentino, Institute for Biological Resources and Marine Biotechnology (CNR), Italy
Copyright © 2022 Kempf, Breen, Rogan and Reid. This is an open-access article distributed under the terms of the Creative Commons Attribution License (CC BY). The use, distribution or reproduction in other forums is permitted, provided the original author(s) and the copyright owner(s) are credited and that the original publication in this journal is cited, in accordance with accepted academic practice. No use, distribution or reproduction is permitted which does not comply with these terms.
*Correspondence: Jed Kempf, amVkLmtlbXBmQG1hcmluZS5pZQ==