 Zachary A. Siders
 Andrew J. Westgate2,3
 Kathryn R. Bell
 Heather N. Koopman
94% of researchers rate our articles as excellent or good
Learn more about the work of our research integrity team to safeguard the quality of each article we publish.
Find out more
ORIGINAL RESEARCH article
Front. Mar. Sci., 03 October 2022
Sec. Marine Megafauna
Volume 9 - 2022 | https://doi.org/10.3389/fmars.2022.976857
Diving behavior in basking sharks, the largest obligate ram filter feeding planktivore, is highly dependent on their location. In the Bay of Fundy, where basking sharks congregate in the boreal summer and autumn, the sharks’ copepod prey are located deep in the water column, below 100 m, in dense but scattered patches. We used time-depth recorders to examine how the vertical movements of basking sharks adapt to such a prey field and captured 4,138 hours of diving behavior from 42 sharks in the boreal summer from 2008 to 2020. Using finite mixture models, we split the time series into surface and subsurface movement blocks and used dynamic time-warping to cluster subsurface movements into seven modes based on their shapes and lengths, with mostly V-shaped subsurface movements (85%) and a minority that were U-shaped (14%). Across sharks, five overall strategies of vertical movement behavior were identified. The strategies split broadly by the ratio of V-shaped movements to U-shaped movements in a deployment and whether the majority of subsurface movements were above or below 100 m. A majority of basking sharks (64%) were reverse diel vertical migrators but none altered their time-allocation across tidal periods. During more thermal stratification, sharks dove deeper, longer, and less frequently while during less thermal stratification sharks dove shallower, shorter, and more frequently. Overall, we show that basking sharks exhibit considerable inter- and intra-individual variability in their diving behavior, and therefore presumably also in foraging modes. Some of this variability relates to time of year and tidal phase, unsurprising in this highly tidally-driven system; however, the majority of the variability remains unexplained without more information on the distribution, composition, and abundance of the copepod prey field. The technique presented is extendable to other species and, unlike many dive classification techniques, requires few subjective delineations of diving behavior.
Marine megafauna utilize dynamic and variable movement patterns to obtain resources (Goldbogen, 2006; Laidre et al., 2007), mates (Bonfil et al., 2005), and evade predators in the three-dimensional ocean environment where encounter rates are highly spatially and temporally dependent (Sims et al., 2008). Numerous studies have demonstrated that many species drastically alter their movement strategies from location to location (Hays et al., 2006; Bonfil et al., 2010; Campana et al., 2011) and on temporal scales from minutes to years (Baumgartner et al., 2003; Johnston et al., 2005; Dewar et al., 2008; Andrzejaczek et al., 2019a). Movement pattern diversity is exhibited in many ways from altering swimming depth (Wilson et al., 2006; Weng et al., 2007), diel vertical migrations (Sims et al., 2005), diving geometry (Gleiss et al., 2011a), or foraging behavior (Bruce et al., 2006; Graham et al., 2006). This behavioral diversity governs many of the larger scale phenomena observed in these species, such as migrations across oceanic basins (Gore et al., 2008; Brunnschweiler et al., 2009), vertical distributions (Wilson and Block, 2009), and the utilization of diversified environments (Block et al., 2011).
Basking sharks (Cetorhinus maximus, Gunnerus 1765) are unique among marine megafauna species as the only obligate ram filter feeding planktivore. Basking sharks feed by swimming through prey fields with their mouths fully agape, collecting zooplankton as they pass over the densely packed gill rakers. This form of planktivory has been hypothesized to have considerable metabolic costs from a significant increase in drag when feeding (Sims, 1999). Feeding on energy-rich calanoid copepods likely helps to offset these costs, such that the species is capable of making routine >5000 km migrations and possibly fasting for over 6 months out of the year (Sims et al., 2003; Gore et al., 2008; Skomal et al., 2009; Bell, 2017; Braun et al., 2018). However, dense patches of these calanoid copepods typically only form over a short time periods and are hyper-localized resulting in the need for foraging strategies that can take advantage of this transient resource. How these foraging strategies are expressed behaviorally is well understood in the eastern North Atlantic, a small area in the shark’s circumglobal range. Previous studies in the eastern North Atlantic have demonstrated that basking sharks can alter their foraging strategies to match the vertical distribution of the prey base as well as the prey’s diel vertical migration (Sims and Quayle, 1998; Sims et al., 2003; Sims et al., 2005).
The Bay of Fundy (Figure 1), in the western North Atlantic, draws an estimated 500-600 basking sharks (Westgate et al., 2014) from May to October (Siders et al., 2013), and occasionally later into the boreal autumn. Tidal amplitudes greater than seven meters drive a cyclonic gyre that aggregates diapausing stage V Calanus finmarchicus at depths greater than 100 m into dense patches (Murison and Gaskin, 1989; Baumgartner and Mate, 2003) in the Grand Manan Basin to the east of Grand Manan Island (Figure 1). The stratification of stage V C. finmarchicus at depth and the high density of basking sharks suggest sharks congregate to utilize this resource in the late boreal summer (Siders et al., 2013). Many pelagic sharks undertake oscillating vertical movements through the water column, which can vary systematically in depth over a diel cycle referred to as a diel vertical migration (DVM) and assumed to be following the DVM of their prey (Speed et al., 2010; Andrzejaczek et al., 2019b). These diel vertical migration patterns can be “normal” DVM, higher in the water column at night than during the day, or reverse DVM, higher in the water column in the day than at night (Sims et al., 2005). In the Bay of Fundy, the prey field has been observed to exhibit a weak normal DVM (Baumgartner et al., 2003). In the southern Gulf of Maine, basking sharks utilize the upper part of the water column typically in areas less than 50 m deep and do not exhibit any strong diel vertical migration patterns (Curtis et al., 2014). Both of these regions contrast with the eastern North Atlantic where both the prey and basking sharks exhibit a strong DVM habitat-specific signal (Sims et al., 2005). In deep, continental slope waters, the C. helgolandicus prey and basking sharks exhibit normal DVM while, in shallow, coastal shelf waters, both exhibit reverse DVM (Sims et al., 2005). Each region also has different tidal amplitudes, six meters in the lower Bay of Fundy, four meters in western English Channel, and one to three meters around Cape Cod in the southern Gulf of Maine. Given these differences in oceanography and resulting prey behavior, it is likely that basking sharks in the Bay of Fundy are utilizing different foraging strategies to access the deep diapaused layer of stage V C. finmarchicus compared to other areas where basking shark congregate.
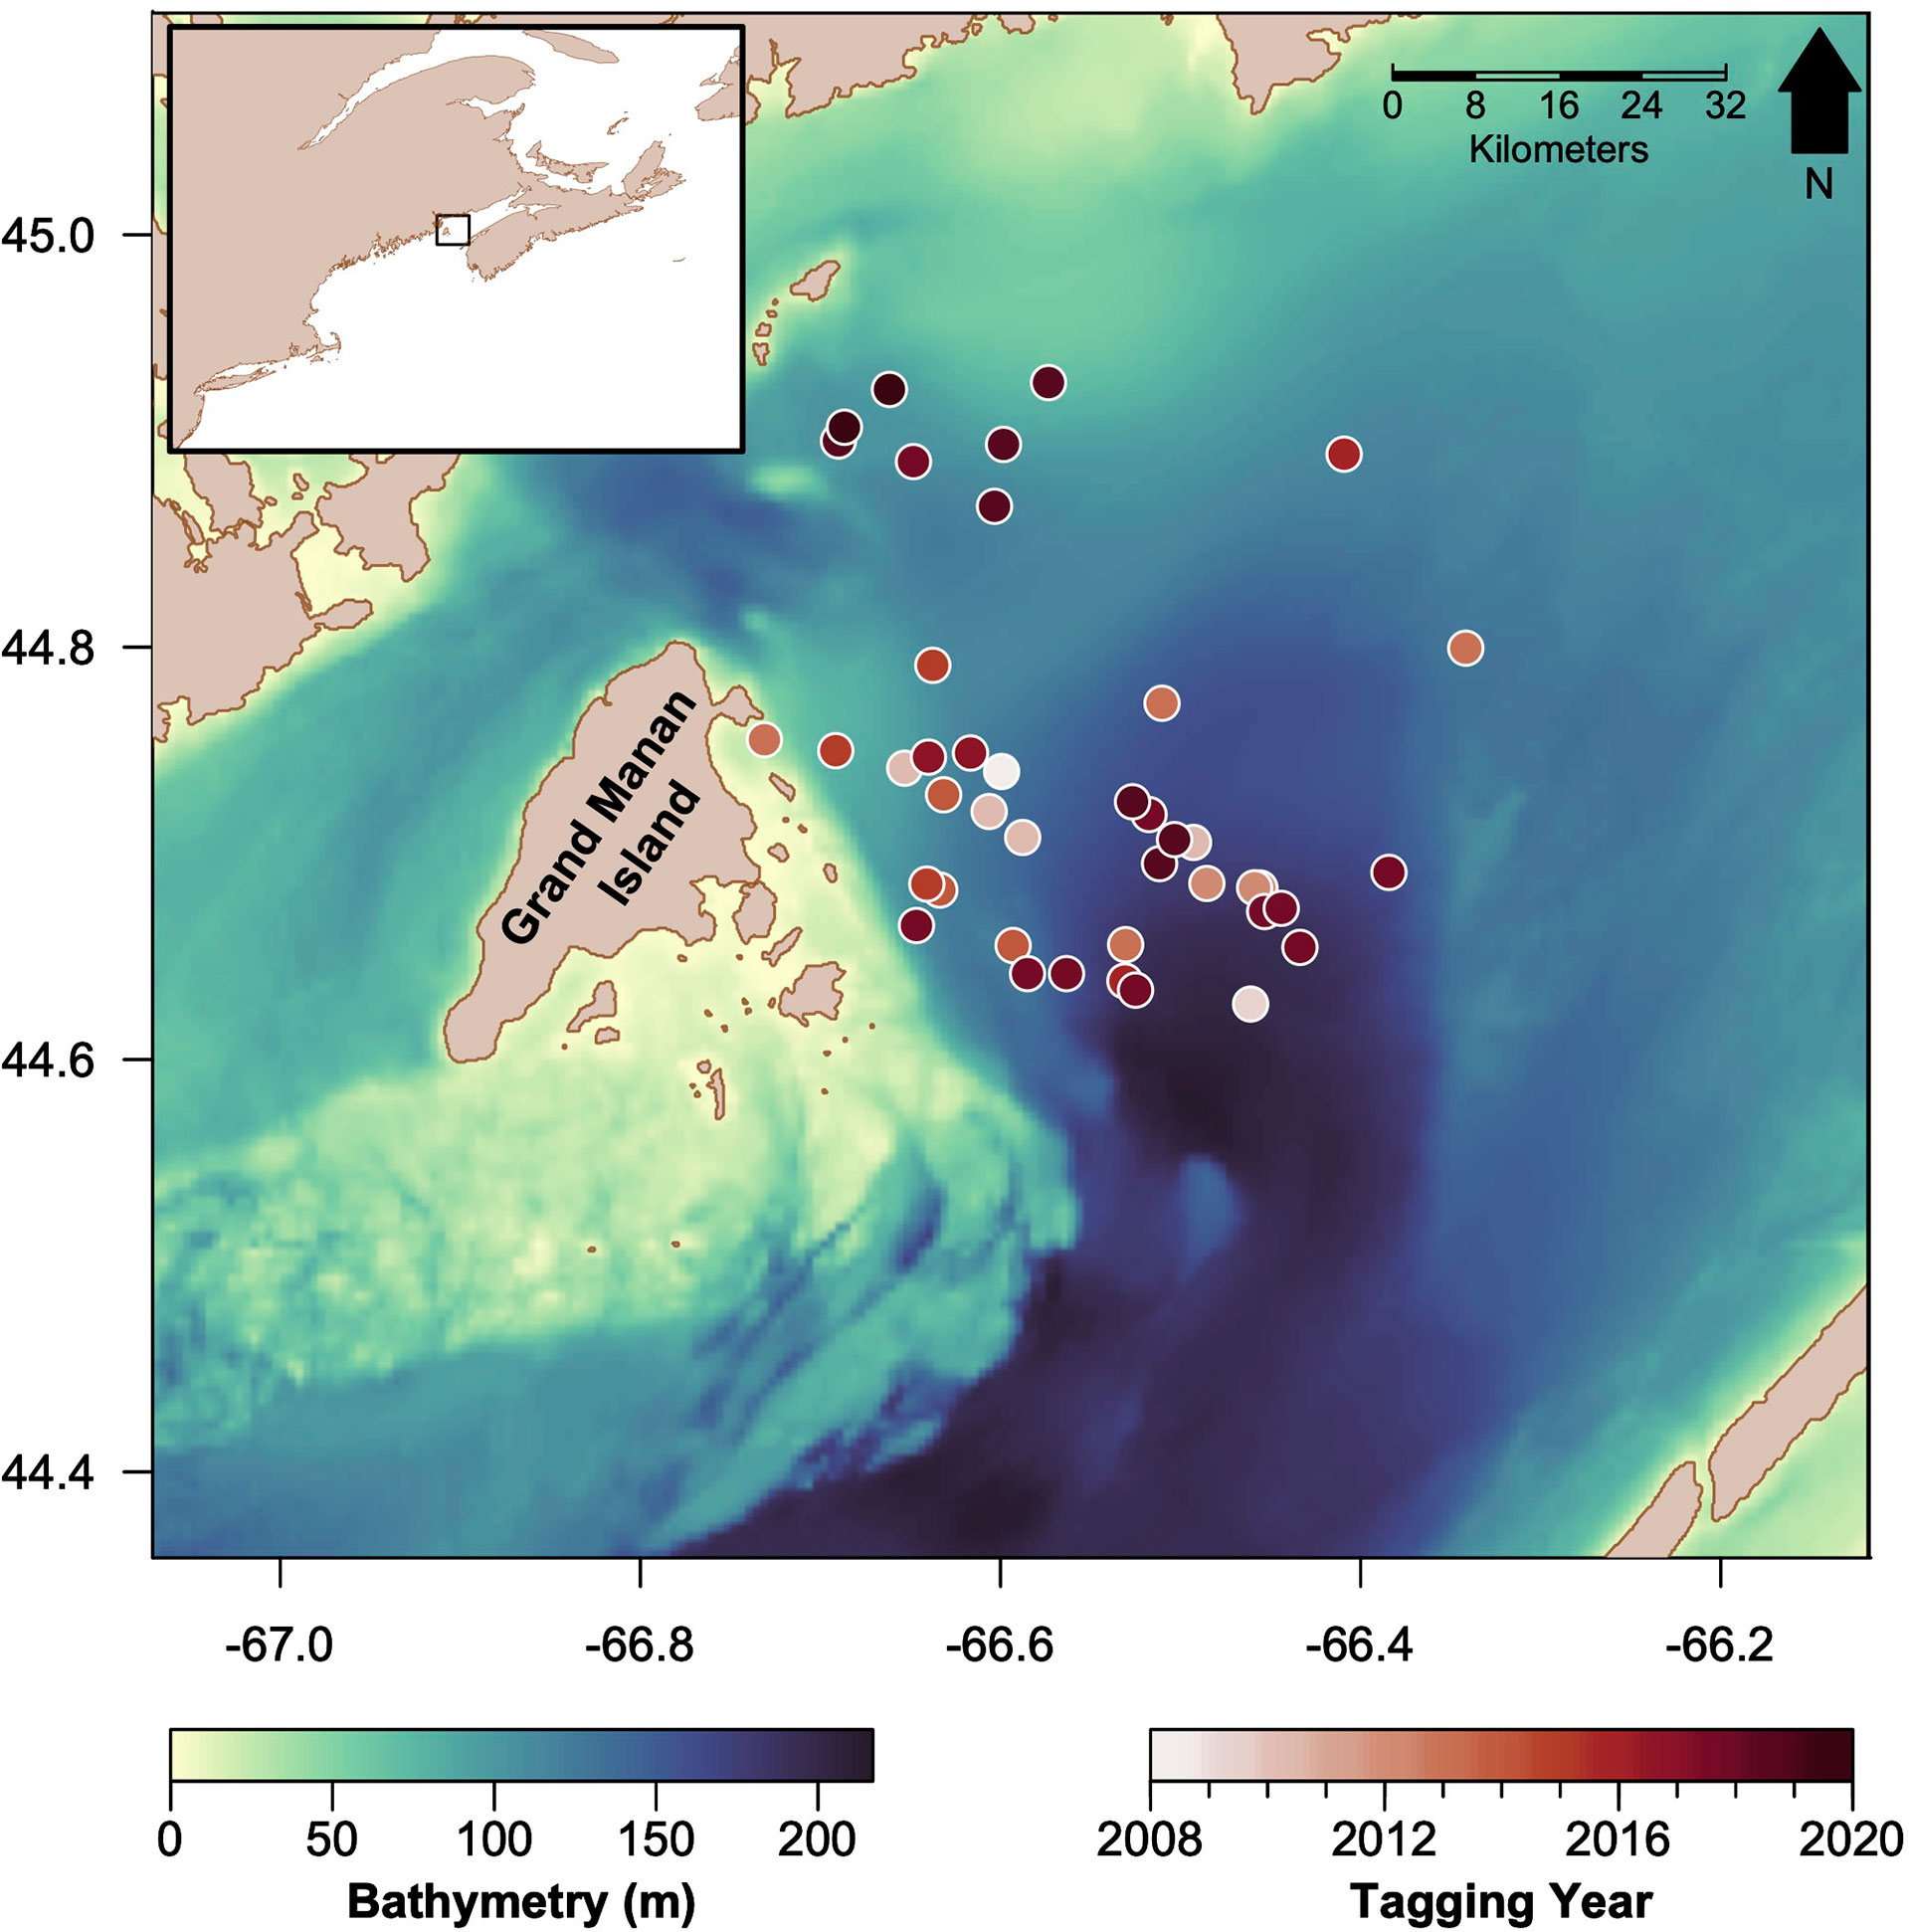
Figure 1 Map of the Bay of Fundy study area, the bathymetry of the basin (darker colors indicate deeper waters), and tagging locations of basking sharks in circles (darker colors indicate more recent years). The inset map (top left) shows the study region (black rectangle) relative to the western North Atlantic coastline.
In this study, we characterized the vertical movement behavior of basking sharks in the Bay of Fundy using time-depth recorders (TDRs), which record fine-scale depth data ( ± 0.1m), and water temperature ( ± 0.1°C) (Westgate et al., 1995), over the period of 2008-2020. Our objectives were to: 1) compare the time-depth allocation between the tagged sharks; 2) classify the shapes of subsurface movements across all sharks and examine the frequency of these shapes between sharks; 3) characterize the dominant vertical movement strategies across sharks based on their subsurface movement patterns, and 4) model the change in the sharks’ vertical movement behavior as a function of the time of year, diel period, and tidal phase. As basking sharks frequently occur in heavily impacted coastal waters (Southall et al., 2006) as well as incur mortality through bycatch, finning, and potentially vessel collisions while at the surface (Vanderlaan et al., 2008; Womersley et al., 2022), understanding basking shark foraging ecology is important if we seek to conserve the populations of this globally Endangered megafauna species (IUCN, 2021).
Our approach (Supplemental Figure 1) was to tag basking sharks in the Bay of Fundy with time-depth recorders and to apply a new approach for separating depth recordings into sections of time at the surface and time at depth, called movement blocks hereafter, from depth-only records and for classifying movement shapes. Our goal was to remove the necessity for analyst-defined thresholds for splitting the time series into blocks as well as the subjective classification of movement shapes. To accomplish the former goal, we determined and assigned membership of a given depth observation to surface or subsurface components based on finite mixture models. Given the assigned membership, we then summarized the gross time allocation of each shark and partitioned the time series into separate subsurface movements. We then tackled the second analytical goal by using dynamic time warping to compare all subsurface movements, conduct hierarchical clustering to determine movement similarity, and assign each subsurface movement to a particular shape cluster. We calculated summary metrics of the depth time-series and mean subsurface movement profile for each cluster. Using these metrics, we modeled the change in vertical movement behavior over the deployment season across all years and characterized the dominant vertical movement strategies. Lastly, we divided the time-series into diel and tidal periods and tested whether sharks changed the proportion of time at the surface or their subsurface movement geometry across these periods.
Tagging took place July through September 2008–2020, excluding 2011, in the Bay of Fundy, Canada (44° 40’ N; 66° 30’ W) (Figure 1). Basking sharks were approached during boat-based surveys when the visibility was > 0.5 km and sea state ≤ 3 (Beaufort wind force scale) and tagged with multi-sensor time-depth recorders (TDR; see details below). The dorsal fin of each shark was photographed for later identification and confirmation of unique individuals for each tag deployment. Each tag body was comprised of a Mk8–10 TDR (Wildlife Computers; Redmond, WA, USA), a SPOT ARGOS satellite transmitter (Wildlife Computers; Redmond, WA, USA) and a VHF radio transmitter (Holohil Systems; Carp, ON, CAN), embedded in a tag body made of buoyant syntactic foam. TDRs simultaneously logged time, depth, and temperature at 1Hz. Tags were attached to sharks via a 1-1.5m monofilament tether (200 lbs test), which was anchored in the dorsal fin by a small slip-tip (JBL 880 Oceanside CA USA) that was pushed through the dorsal fin close to the trailing edge using a tagging pole. The tether allowed the tag to float at the surface to intermittently transmit surface positions to the ARGOS satellite network. A magnesium/steel linkage between the tag and the tether was designed to corrode in seawater over time (typically 100 hours) depending on the linkage mass and water temperature. Following complete linkage corrosion, each tag detached and floated to the surface while the tether slipped through the dorsal fin and off the shark. Tags were recovered using both UHF and VHF telemetry. Upon retrieval, tags were downloaded via a host program (Wildlife Computers, Redmond, WA). Downloaded files were converted to text files using HexDecode 2.02 (Wildlife Computers, Redmond, WA). Each tag time-series was parsed into individual signals of time, depth, and temperature. All analysis occurred in R (R Core Team, 2020).
There are a variety of methods to segment or split behavioral time series but, typically, time series of depth recordings are split into dives using a threshold where observations with depths below the threshold are considered dives and are interrupted by observations with depths above the threshold (Westgate et al., 1995; Heide-Jørgensen et al., 2013). We opted for a probabilistic approach using finite mixture models (FMMs) to approximate the multimodality common to depth time series using a mixture of probability distribution functions, called components. As a simple example, consider a shark that spends 20% of its time between 0–5 m, 10% between 5–25m, and 70% of its time between 25–75 m. This would result in a strongly bimodal distribution with one mode around 2.5 m and another around 50 m. A finite mixture model could approximate this bimodality by estimating two normal probability distributions, with separate location and scale (μ, σ) parameters, that overlap, or mix, across some portion of the range of depths. In the simple example, values between 0–5 m have a probability of one for belonging to the first normal distribution, values between 25–75 m have a probability of one for belonging to the second normal distribution, and values between 5–25 m have some probability between zero and one of belonging to one or the other normal distributions, i.e. the mixture components. This probability of belonging to either mixture component can then be used to split the time series into sections of time at the surface and subsurface, or movement blocks. In comparison to the broad suite of techniques for segmenting behavioral time series (Edelhoff et al., 2016; Bennison et al., 2018), this FMM approach is a slightly simplified version of the expectation-maximization binary clustering method (Garriga et al., 2016) in order to apply it to our univariate depth time series. An advantage of this approach is that each shark’s time-at-depth distribution informs the split between these components, allowing for inter-shark differences rather than applying a single threshold across deployments.
We first identified the number of components by analyzing histograms of the individual and aggregate depth data across deployments and identified two components, surface and subsurface, from the strong bimodality in these histograms. We then used the FMMs to model the probability of membership of a depth observation, xi, from a particular shark, k, to a particular component distribution, j, described by Equation 1 and the shape of that distribution given xi by Equation 2:
where zij is a Bernoulli random variable indicating whether observation i comes from component j with probability λj(Equation 1), and xi conditional on zij is described by a Normal distribution with μj and variance (Equation 2). We fit a FMM to each shark, k, allowing for separate mixing probabilities (λj), means (μj), and variances using the mixtools package (Benaglia et al., 2009) to account for the individual variability. To estimate the parameters of interest, an EM algorithm is employed to iteratively calculate approximate posterior probabilities conditional on the observations and the parameters (the E step) and then calculate mixing probabilities (the M step) seeking to maximize the log-likelihood of the data given the model (Benaglia et al., 2009). Starting values were determined through visually inspection of the aggregate distribution of depths across sharks. For each shark, we calculated the total deployment length, the total time of the deployment in the surface component (e.g. the first mixture), and the total time in the subsurface component (e.g., the second mixture) based on the full time series.
We compared the probabilities of being in either the surface or subsurface component λk,1 (e.g., mixing probabilities) between sharks by multiplying the probabilities by the effective sample size (neff,k) and then comparing the proportions using Fisher’s exact probability test with Yate’s continuity correction. The effective sample size was calculated using the coda package (Plummer et al., 2006) to adjust the sample size for autocorrelation. Testing differences between λk,2 was not necessary as the quantity is 1−λk,1. We also compared the component distributions between sharks using Welch’s two-sample t-test (Supplemental Information 1). Taken together, these two tests allow the comparison between distributions of the shark depth time-series. Unless stated otherwise, all significance tests were conducted using an a=0.05.
Using the posterior probabilities of the depth observations, we assigned membership to either the surface or subsurface component for each observation when the posterior probability was greater than 0.5. We then smoothed each time-series using a five second rolling average and subsampled to every five seconds using the xts package in R (Ryan and Ulrich, 2020); we refer to this version of the time-series as the smoothed time-series, hereafter. The smoothed time-series for each shark was then split into the two membership groups. For the more populous membership, we split the smoothed depth time-series into subsurface movements; where a movement was a section of the time series assigned to the subsurface component separated by section of the time-series assigned to the surface component. We also calculated the total number of subsurface movements for each shark and the maximum time spent on any given subsurface movement based on the smoothed time series.
We sought to compare the shape of subsurface movements, ranging from the shortest to the longest, and cluster similarly shaped movements. We used dynamic time warping (DTW), a common time-series comparison technique (Senin, 2008; Aghabozorgi et al., 2015), that determines a metric of distance between two time series of unequal length. Dynamic time warping accomplishes this by trying to align the indices of one time series to the indices of another, called a warping path, and then determines the optimal warping path by minimizing the costs associated with alignment (see Senin, 2008 for a review). This distance metric can be used as a measure of dissimilarity in clustering analyses (Giorgino, 2009). We calculated the DTW-based Euclidean distance between all movements (derived from the smoothed time-series) using the parallelDist (Eckert, 2018) and dtw (Giorgino, 2009) packages in R. We used the default symmetric1 step pattern normalized to the length of the warping path (Tormene et al., 2008; Giorgino, 2009). Using the resultant dissimilarity matrix, we used agglomerative hierarchical clustering to cluster the subsurface movements using Ward’s D clustering algorithm. The optimal number of clusters was chosen by calculating the gap statistic (Tibshirani et al., 2001) with 100 bootstraps using the cluster package (Maechler et al., 2021). From the gap statistic, we calculated the optimal number of clusters, using the default algorithm, by finding the smallest number of clusters with gap statistic value that is greater than or equal to the gap statistic value of the number of clusters plus one minus the standard error in the gap statistic determined from bootstrapping (Tibshirani et al., 2001; Maechler et al., 2021).
For each subsurface movement, we calculated the total time and the maximum depth and, for each shape cluster, we calculated the mean subsurface movement length and the mean maximum subsurface movement. We also computed a mean subsurface movement profile for each cluster by transforming all the subsurface movements within a cluster to the mean length of subsurface movements within the cluster then taking a weighted average, using the inverse DTW-based Euclidean distances as weights. We also conducted a Principal Components Analysis (PCA) on the proportion of total subsurface movements per shark in each shape cluster, controlling for the variable length of the subsurface movement time series across sharks. To do so, we centered log-ratio transformed the simplex data using the compositions package and conducted the PCA using the covariance matrix (van den Boogaart et al., 2021).
While the shape clusters capture the overall clustering of the unique subsurface movements, we also wished to characterize the dominant modes of the overall vertical movement strategies employed by basking sharks in the Bay of Fundy. To do such, we used agglomerative hierarchical clustering as implemented on the subsurface movements’ DTW-based distance but instead used the movements metrics of maximum depth in the deployment, the percent time spent subsurface (λ2), the mean depth of the subsurface component (μ2), the subsurface movement rate, and proportion subsurface movements for each shark in each subsurface movement shape cluster. This allowed us to determine groupings of similar sharks based on their vertical movements and to characterize the dominant shark vertical behavior strategies. Each vertical behavior metric was first rescaled; the maximum deployment depth and mean depth of the subsurface movements were Z-standardized, the subsurface movement rate was also Z-standardized but log-transformed first, the percent time subsurface was logit transformed, and the proportion of each subsurface movement shape which was centered log-ratio transformed (Aitchison, 1986). These various transformations were applied to facilitate an equal weighting of each metric in the cluster analysis by transforming each metric to an approximately standard normal distribution. The Euclidean distance was taken of these rescaled values and used in hierarchical clustering. The optimal clusters was determined using the gap statistic and the Tibshirani et al. (2001) criterion as before. With the optimal number of clusters determined, the dendrogram resulting from the hierarchical clustering was sliced and cluster memberships were assigned. The mean of each dive behavior metric was calculated for each cluster as well as the mean and standard deviation of Julian day.
We sought to understand whether the vertical movements of basking sharks were influenced by environmental factors and, in conjunction, determine the diel vertical migration pattern of each individual shark.
We collated time points that matched the deployment time period to split the time series of surface or subsurface membership into time blocks. The suncalc package (Thieurmel and Elmarhraoui, 2019) was used to calculate sunrise and sunset for each day across each tag time series and used to split the time series into a day period (sunrise to sunset) and into a night period (sunset to sunrise). We then calculated for each of the diel periods the proportion of the time series in the surface and sub-surface components. We then assigned a shark’s vertical migration pattern based on the which diel period had more time at the surface: a diel vertical migrator had more time at the surface in the night time period than the day time period and a reverse diel vertical migrator (RDVM) had the opposite pattern. We then used a test of equal proportions on the tabulation of time at the surface in the diel or tidal time periods. We corrected the total time by the effective sample size for each shark (neff,k) described above in the mixture analysis and assumed a failure was time spent subsurface. If the χ2 test statistic was significant for the diel assignment, we assumed those sharks were strong vertical migrators. We then visualized the proportion of DVM and RDVM as well as strong vertical migrators by year.
We also performed a similar comparison to understand if tidal period influenced time at the surface or subsurface. To generate the tidal period information, we split the time series of surface and subsurface membership into time blocks belonging to different tidal phases. The times for the high/low tide were extracted using XTide https://flaterco.com/xtide/ for the tidal station at Gannet Rock (44.5167° N, 66.7833° W) south of Grand Manan Island. The tide time points were used to split the time series into high slack ( ± 30 minutes of the high tide), ebb (tide falling), low slack ( ± 30 minutes of the low tide), and flood (tide rising) periods. We then repeated the test of equal proportions but using the tidal periods and still correcting for the effective sample size.
We also wanted to understand how the proportion of time spent each shark expressed a given subsurface movement shape was influenced by diel and tidal periods. We then fit a Dirichlet regression using the DirichletReg package (Maier, 2021) to describe the proportions of each shape for each shark (Equation 3-5):
where is the transformed proportion of time in subsurface movement shape cluster c for shark k from the observed proportion (yc,k) using the total number of observations (N) and the total number of subsurface movement shapes (C). This transformed proportion is described by a Dirichlet distribution with a set of shape parameters, ac, which, using a logarithmic link function, are described by a linear model with covariates, X[c] , of the time period identity and their effects, β[c]
To explore seasonal differences in the subsurface movement behavior, we fit a series of models to summary metrics from each shark as a function of the Julian day of deployment and thermocline depth. Those metrics were the maximum depth in the deployment, the percent time subsurface (λ2), the mean depth of the subsurface component (μ2), the subsurface movement rate in terms of movements per hour, as well as the score from the first and second principal components (PCs) of the PCA on the proportion of total subsurface movements in each shape cluster (see Subsurface movement summary statistics). To calculate thermocline depth, we first used the temperature recorded by the TDR tags to construct water column temperature profiles by determining the mode of the recorded temperature across all unique depths a given shark sampled (a variation of the method in Koopman et al., 2014). We then used the rLakeAnalyzer package to calculate the thermocline depth corrected for the average salinity in the Bay of Fundy (33 ppm). Before fitting our models, we compare the correlations between the various vertical movement metrics, thermocline depth, and Julian day.
For each metric, we fit nine different models and used BIC model selection to choose the most parsimonious model. The nine different models were combinations of three covariate structures, Julian Day only, thermocline depth, and both Julian Day and thermocline depth as covariates, and three dispersion structures, constant variance, covariance with Julian Day, and covariance with thermocline depth. The deployment duration of each individual was used as a weighting factor in each model, T/max(T), using the glmmTMB package to fit the models (Brooks et al., 2017). Before each model was fit, we used the bestNormalize package to normalize each metric with the exception of λ2 which was logistic-transformed first before doing the normalization (Peterson, 2021). We also Z-standardized Julian day and thermocline depth. For the most parsimonious model, the one with the lowest BIC, we performed a Wald χ2 test to assess the overall significance of this model relative to an intercept-only model, the null hypothesis. From the most parsimonious model, predictions were made for the minimum to the maximum Julian day of deployment or thermocline depth depending on whether the most parsimonious model included these covariates or which had the largest absolute effect size. The mean and 95% confidence interval of the model predictions were calculated and the results visualized.
Over 4,138 hours of basking shark vertical movement behavior were recorded from 42 individual deployments in the Grand Manan Basin from 2008-2020 (Figure 1; Table 1) resulting in over 14.9 million depth measurements. The mean deployment duration was 98.5 h, the minimum was 20.5 h, and the maximum was 274 h (Table 1). The maximum depth recorded was 270.5 m while the average maximum depth was 198.3 m (Table 1). However, eight of the deployments ended in locations outside the Bay of Fundy (Table 1), where the maximum depth is greater than 223m. Thus, the vertical movement behavior of the sharks in this study does not reflect the maximum depths that this species can achieve in the western North Atlantic (Skomal et al., 2009; Bell, 2017).
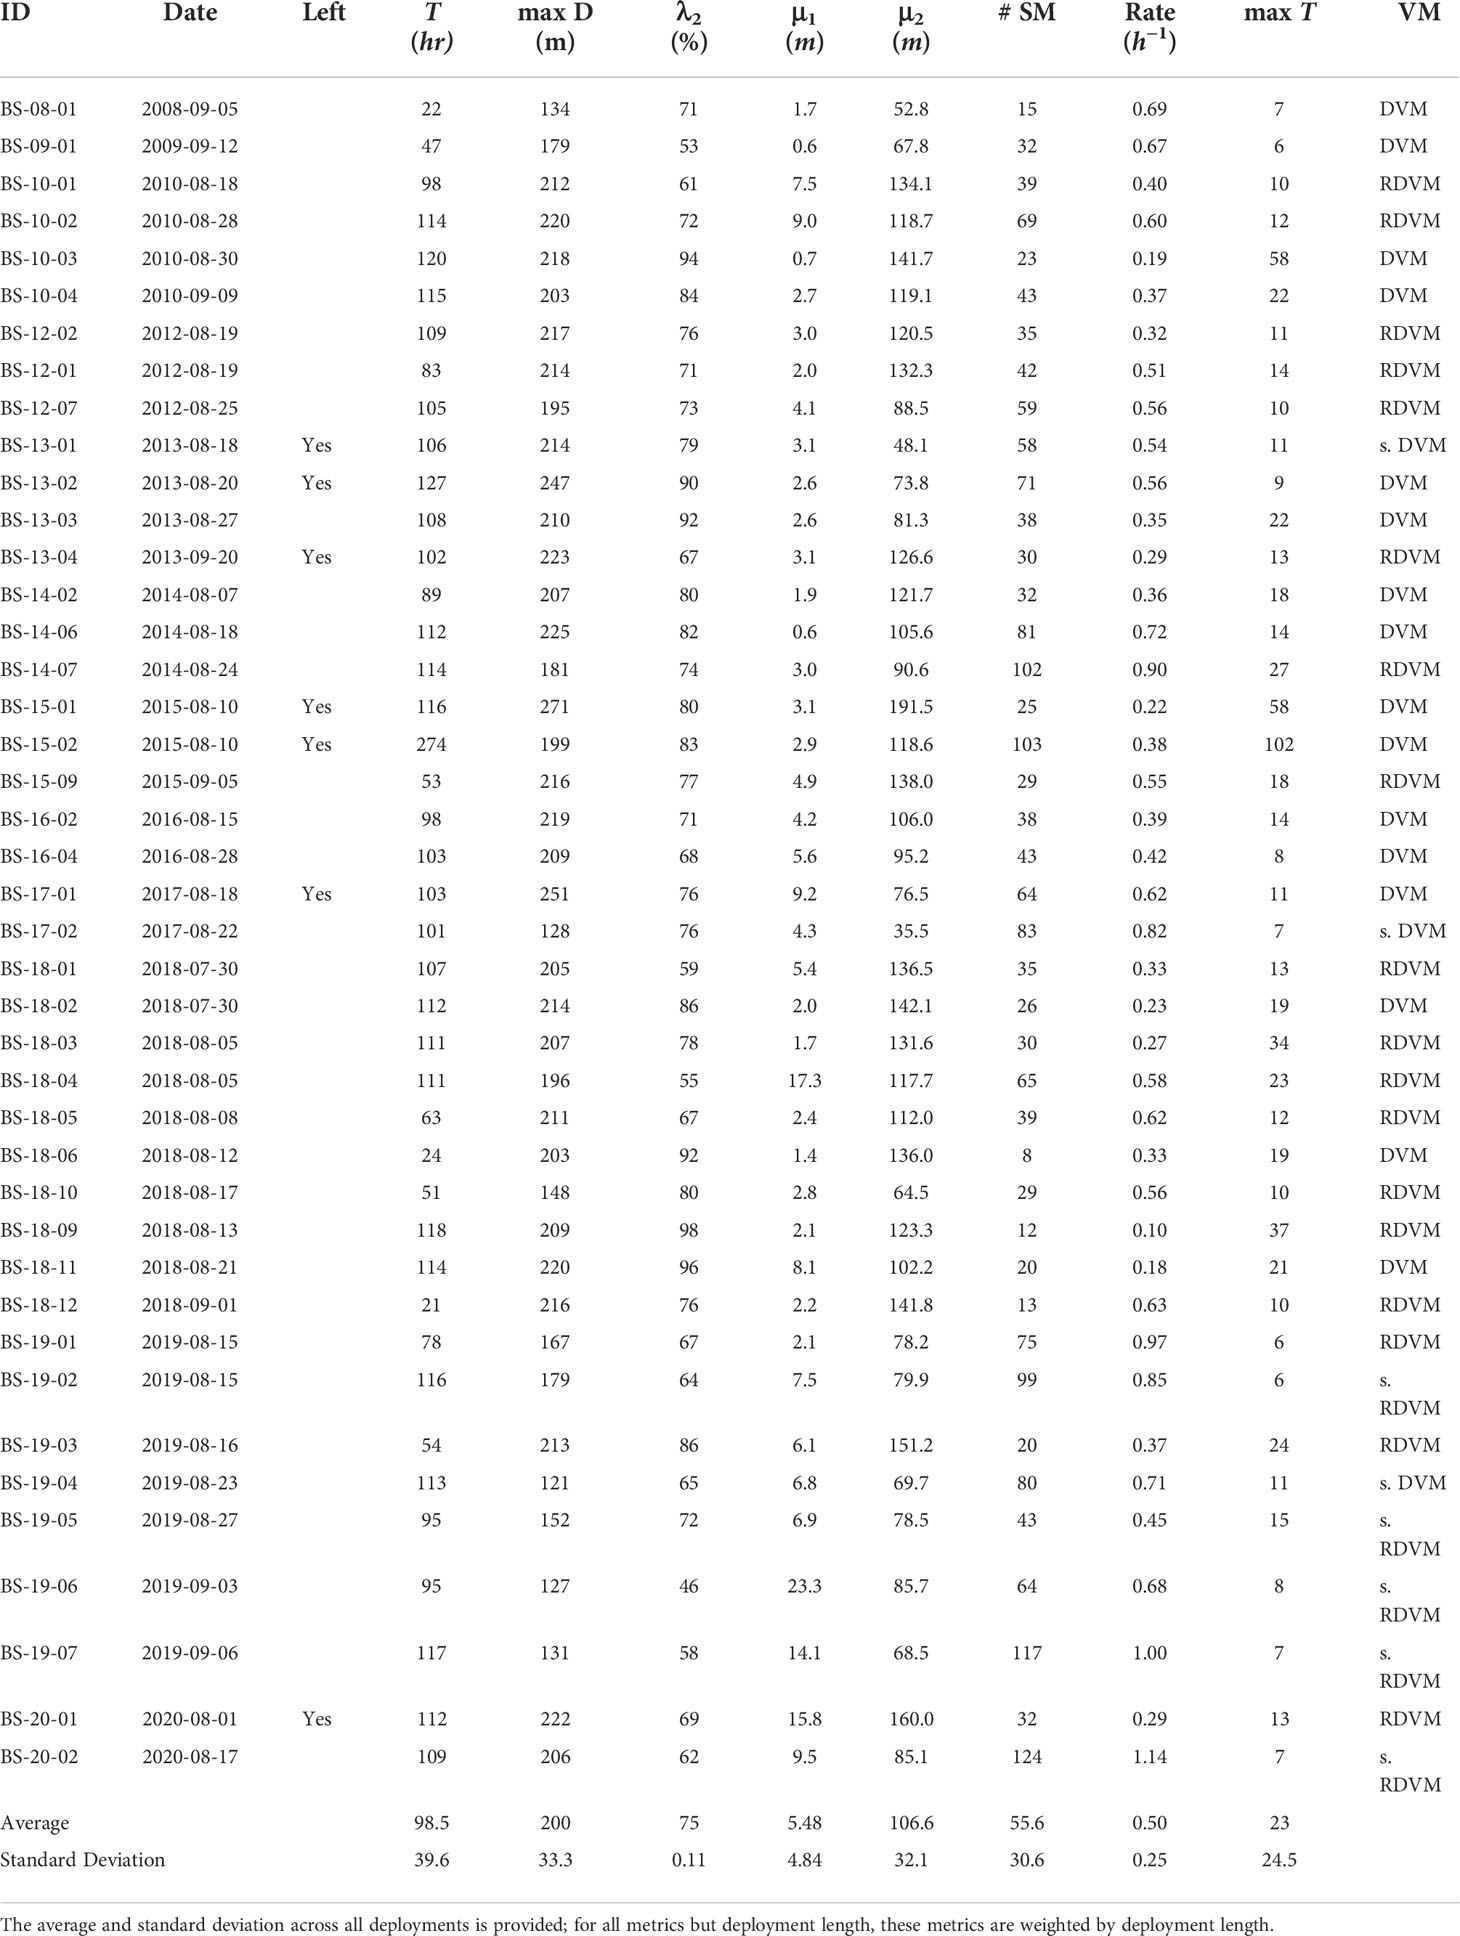
Table 1 Summary of the 42 basking sharks tagged with time-depth recorders in the Bay of Fundy, their identification code (ID), their deployment date, whether a deployment left the Bay of Fundy (Left), the length of the deployment in hours (T), the maximum depth recorded (maxD), the proportion of time spent in the subsurface component (λ2), the mean of the surface component (μ1), and the mean of the subsurface component (μ2), the number of subsurface movements (# SM), the rate of subsurface movements per hour, the maximum length of the subsurface movements in hours (max T) and the vertical migration pattern (VM) with categories: DVM for diel vertical migrator, RDVM for reverse diel vertical migrator, as well as a strong qualifier (s.) (see Materials and Methods–DVM Assignment for classification scheme).
The FMMs converged quickly for all sharks, usually within 3-5 iterations, and resulted in the probability of a depth observation belonging to the surface or subsurface movement block. On average, approximately 25.5% (2.3–46%, range) of the recorded depths were in the surface movement blocks with a weighted average mean of 5.48 ± 4.84 m (± standard deviation) and, conversely, 74.5% (54–97.6%, range) in the subsurface movement blocks with a weighted average mean depth of 106.6 ± 32.1 m (Table 1). The amount of time spent in each movement block was weakly correlated with the year of tagging (R = 0.12), using Pearson’s correlation statistic. The mean of the surface movement blocks was moderately positively correlated with the year of tagging (R = 0.42) while the mean of the subsurface movement blocks was not correlated (R = 0.03). This shows that across years the mean of the surface movement blocks shifted deeper while the mean of the subsurface movement blocks did not. After adjusting the sample size for autocorrelation, 27% of Fisher’s exact probability tests were significant (Supplemental Figure 2) and were concentrated between all other sharks and those tagged in 2019 and 2020, the latter which split their time between the surface and subsurface more evenly (Table 1).
The majority of differences within the surface and subsurface distributions were significant for the surface movement blocks (86%) but only a minority were significant for the subsurface movement blocks (30%); the latter due to higher variances associated with the distributions of the subsurface movement blocks (Supplemental Figure 2). On average, sharks made 49.6 subsurface movements per deployment (8–124, range)(Table 1). As the deployment periods varied, it is more informative to compare the rate of subsurface movements which had a mean of 0.52 movements per hour, (0.1–1.14 h-1, range)(Table 1). This movement rate was weakly positively correlated as a function of the year of tagging (R = 0.16). The maximum time spent on a movement per shark had a mean of 18.5 h (5.6–102 h, range)(Table 1) (Supplemental Figure 3).
The optimal number of subsurface movement shape clusters from the gap analysis was 7 (Supplemental Figure 4). Of the 2,085 subsurface movements, 20% were in cluster A, 25% in B, 41% in C, 7% in D, 6% in E, 1% in F, and<1% in G (Figure 2A). Cluster B had the shortest times (22.2 min) and the shallowest maximum depths (-36 m), followed by cluster C (29.67 min, -90.8 m), cluster A (112.2 min, -131.1 m), cluster D (135.9 min, -168.5 m), cluster E (309.3 min, -168.5 m), cluster F (1302 min, -196.1), and cluster G with the longest times (2090.7 min) and the deepest depths (-261.5 m) (Figure 2B). Visually, subsurface movement clusters A–C resemble “V” dives found in other marine megafauna (Gleiss et al., 2011a; Nakamura et al., 2011) with their overall short dive time and little bottom time (Figures 2C–N). Cluster D visually matched yo-yo dives, oscillating up and down in the mid-water column (Gleiss et al., 2011a; Andrzejaczek et al., 2019b), as well as aborted or shorter “U” dives (Figures 2O–R). Clusters E and F visually matched the “U” dive shape found in other diving megafauna species (Nowacek et al., 2001; Klimley et al., 2002; Wilson et al., 2006; Andrzejaczek et al., 2019b) with long dive times, long bottom time, and deeper dives (Figures 2S–Z). Cluster G was the least abundant (n=2) with exceptionally long and deep subsurface movement. Across dives, prolonged bottom time typically only occurred below 100 m (Figures 2C–V) with the exception of the two cluster G dives. Relationally, cluster A and D were sister, E and G were sister, F was successfully sister to G and E, the group of A and D were sister to the group of E, F, and G, the group B and C were sister to each other and, together, all other clusters (Figure 2A).
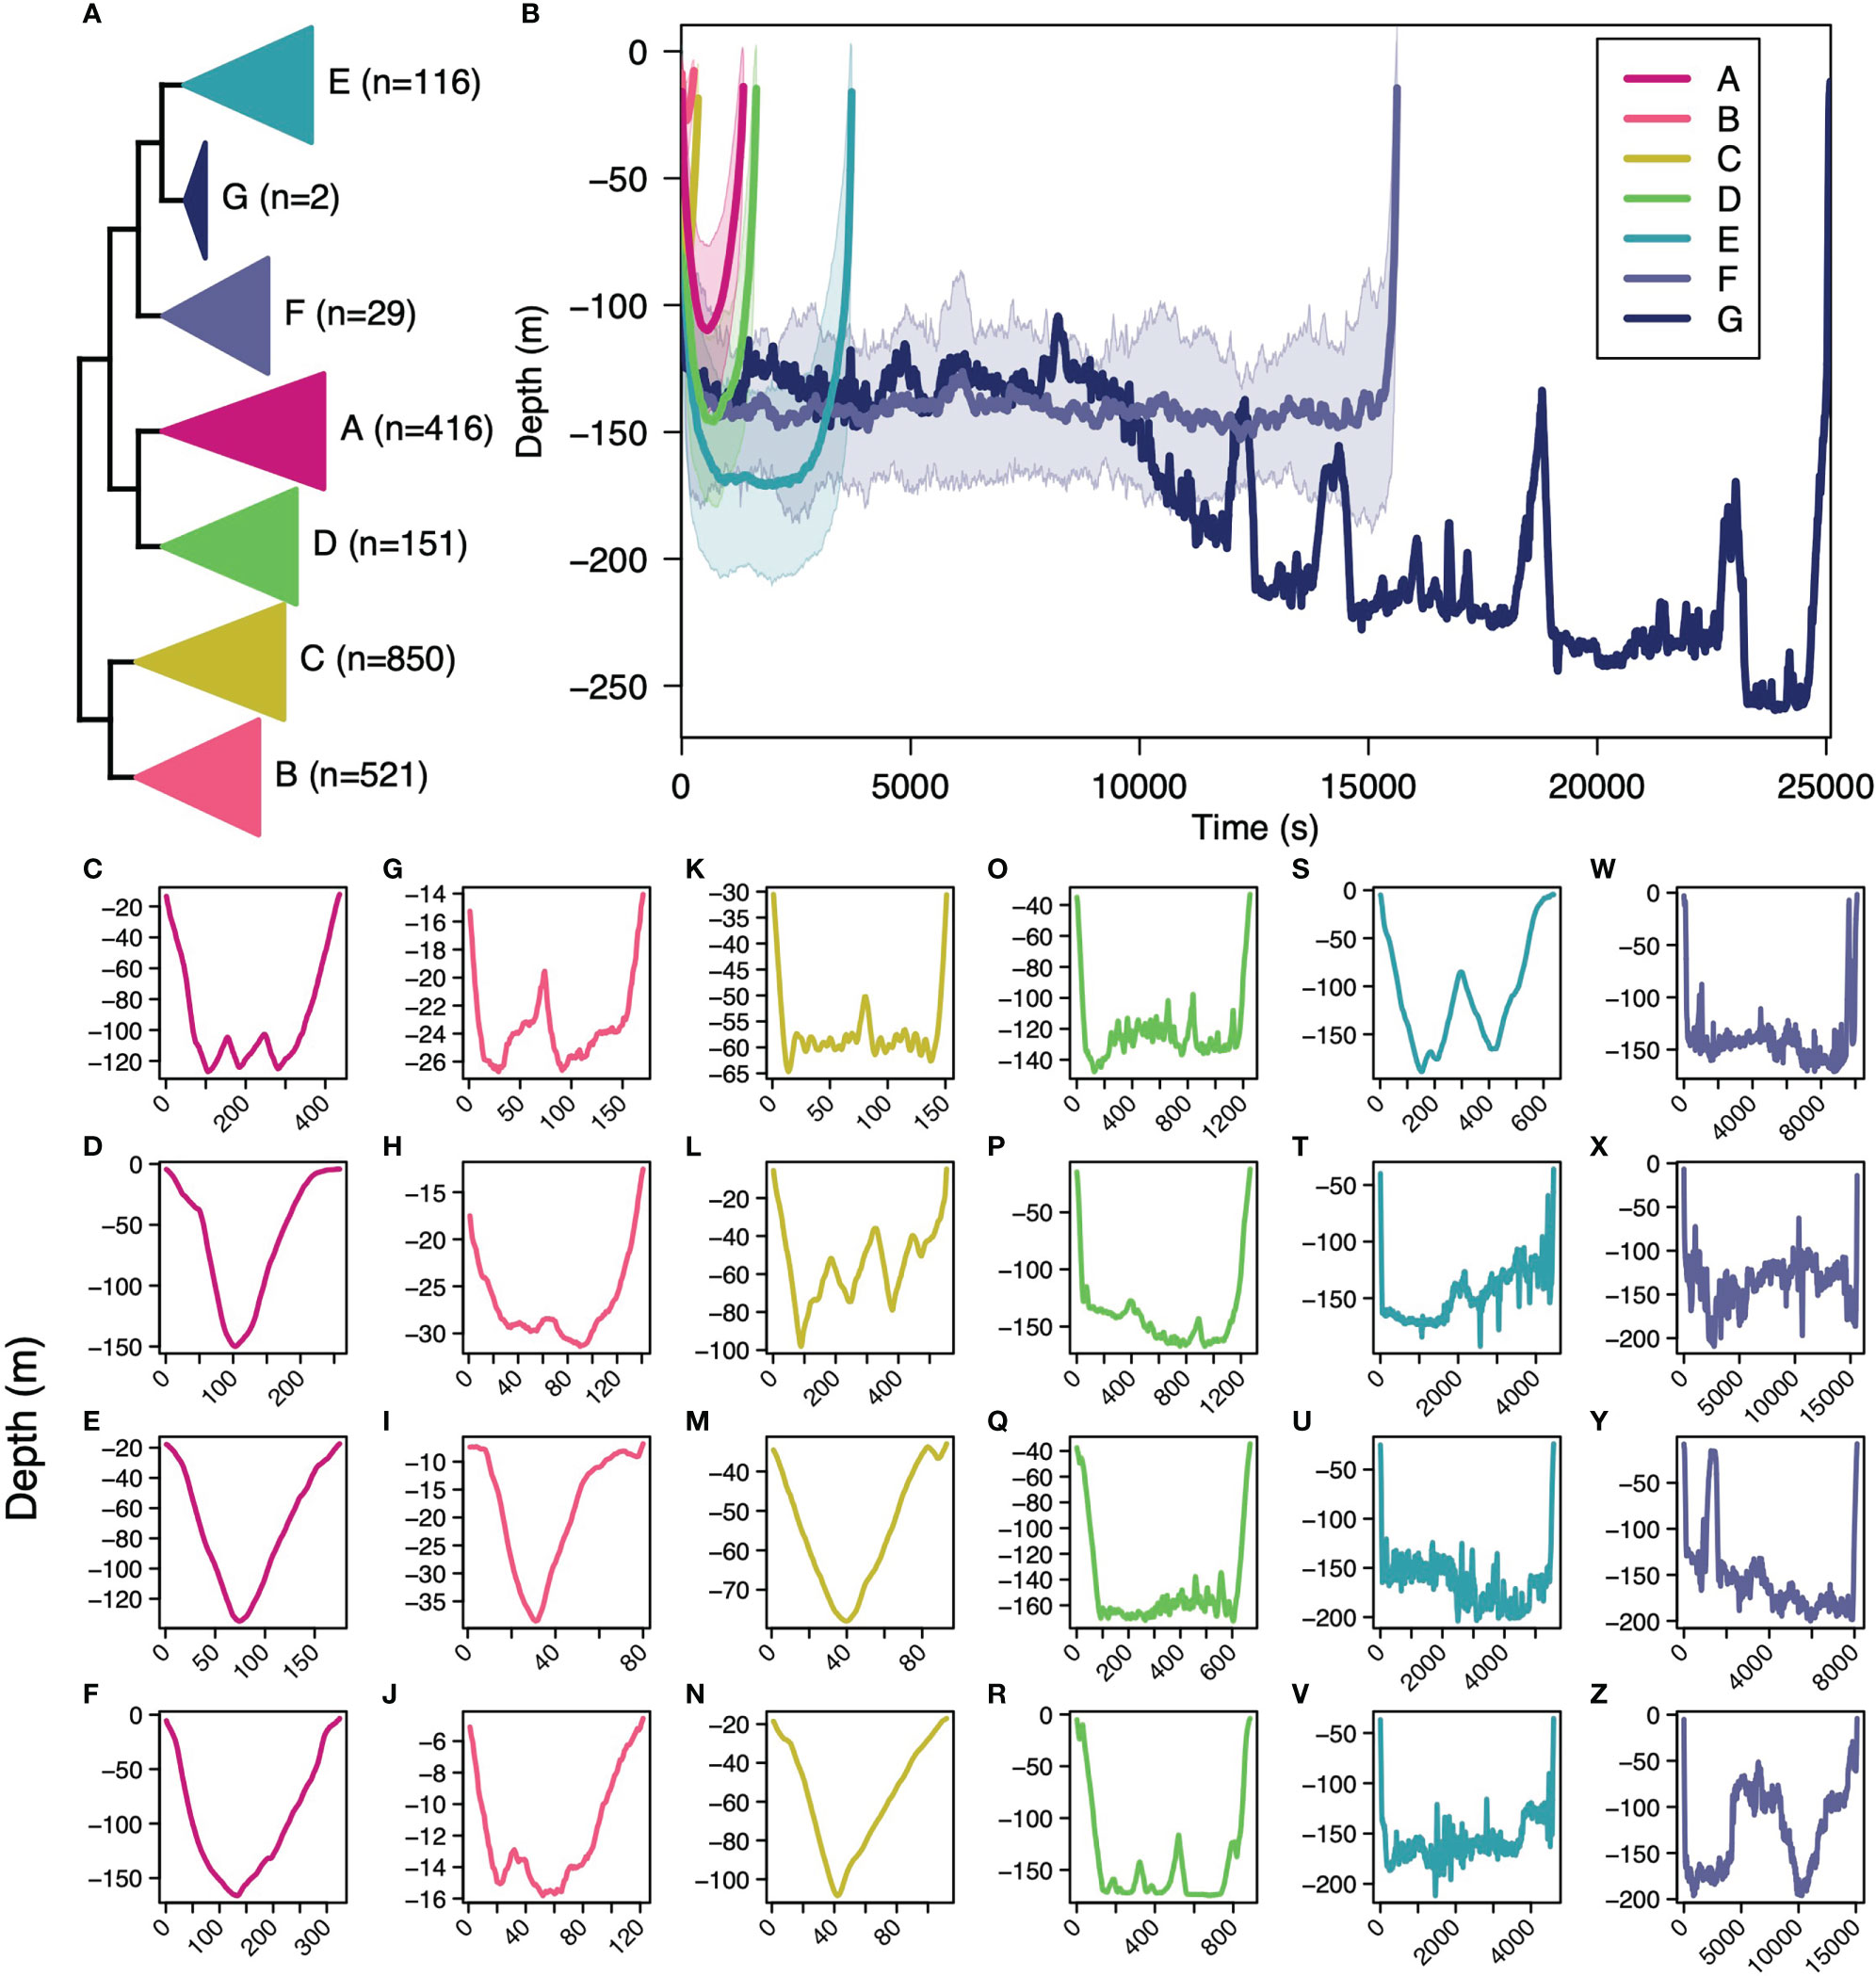
Figure 2 The hierarchical clustering between basking shark subsurface movements and number of subsurface movements per cluster (A), the dissimilarity-weighted mean shape for each cluster (B), and a random subsample of movements for cluster A (C–F), for cluster B (G–J), for cluster C (K–N), for cluster D (O–R), for cluster E (S–V), and for cluster F (W–Z). The shaded region around the weighted mean shape for each cluster (B) represents one standard deviation around the mean.
The first two PCs of the PCA of the proportion of total subsurface movements per shark in each shape cluster (Supplemental Table 1) explained 50% of the total variance (Figure 3). Integrating information about the mean dive shape from each dive shape cluster and the first and second PC scores lends some interpretability to the overall subsurface movement shapes dominating a given deployment. Negative PC1 and PC2 scores (lower left, Figure 3) align with clusters C and F with short, relatively shallow V-shaped and long, deep U-shaped movements. Negative PC1 and positive PC2 scores (upper left, Figure 3) align with clusters D and E indicating a mix of shallow, short and deep, moderate U movements. Positive PC1 and PC2 scores (upper right, Figure 3) align with clusters A and D with long, deep V-shaped movements and shallow, short U-shaped movements. Positive PC1 and negative PC2 (lower right, Figure 3) scores align with clusters A and C indicating a mixture of short, shallow and long, deep V-shaped movements. Years were fairly well mixed together indicating no particular subsurface movement shape dominated in any given year (Figure 3).
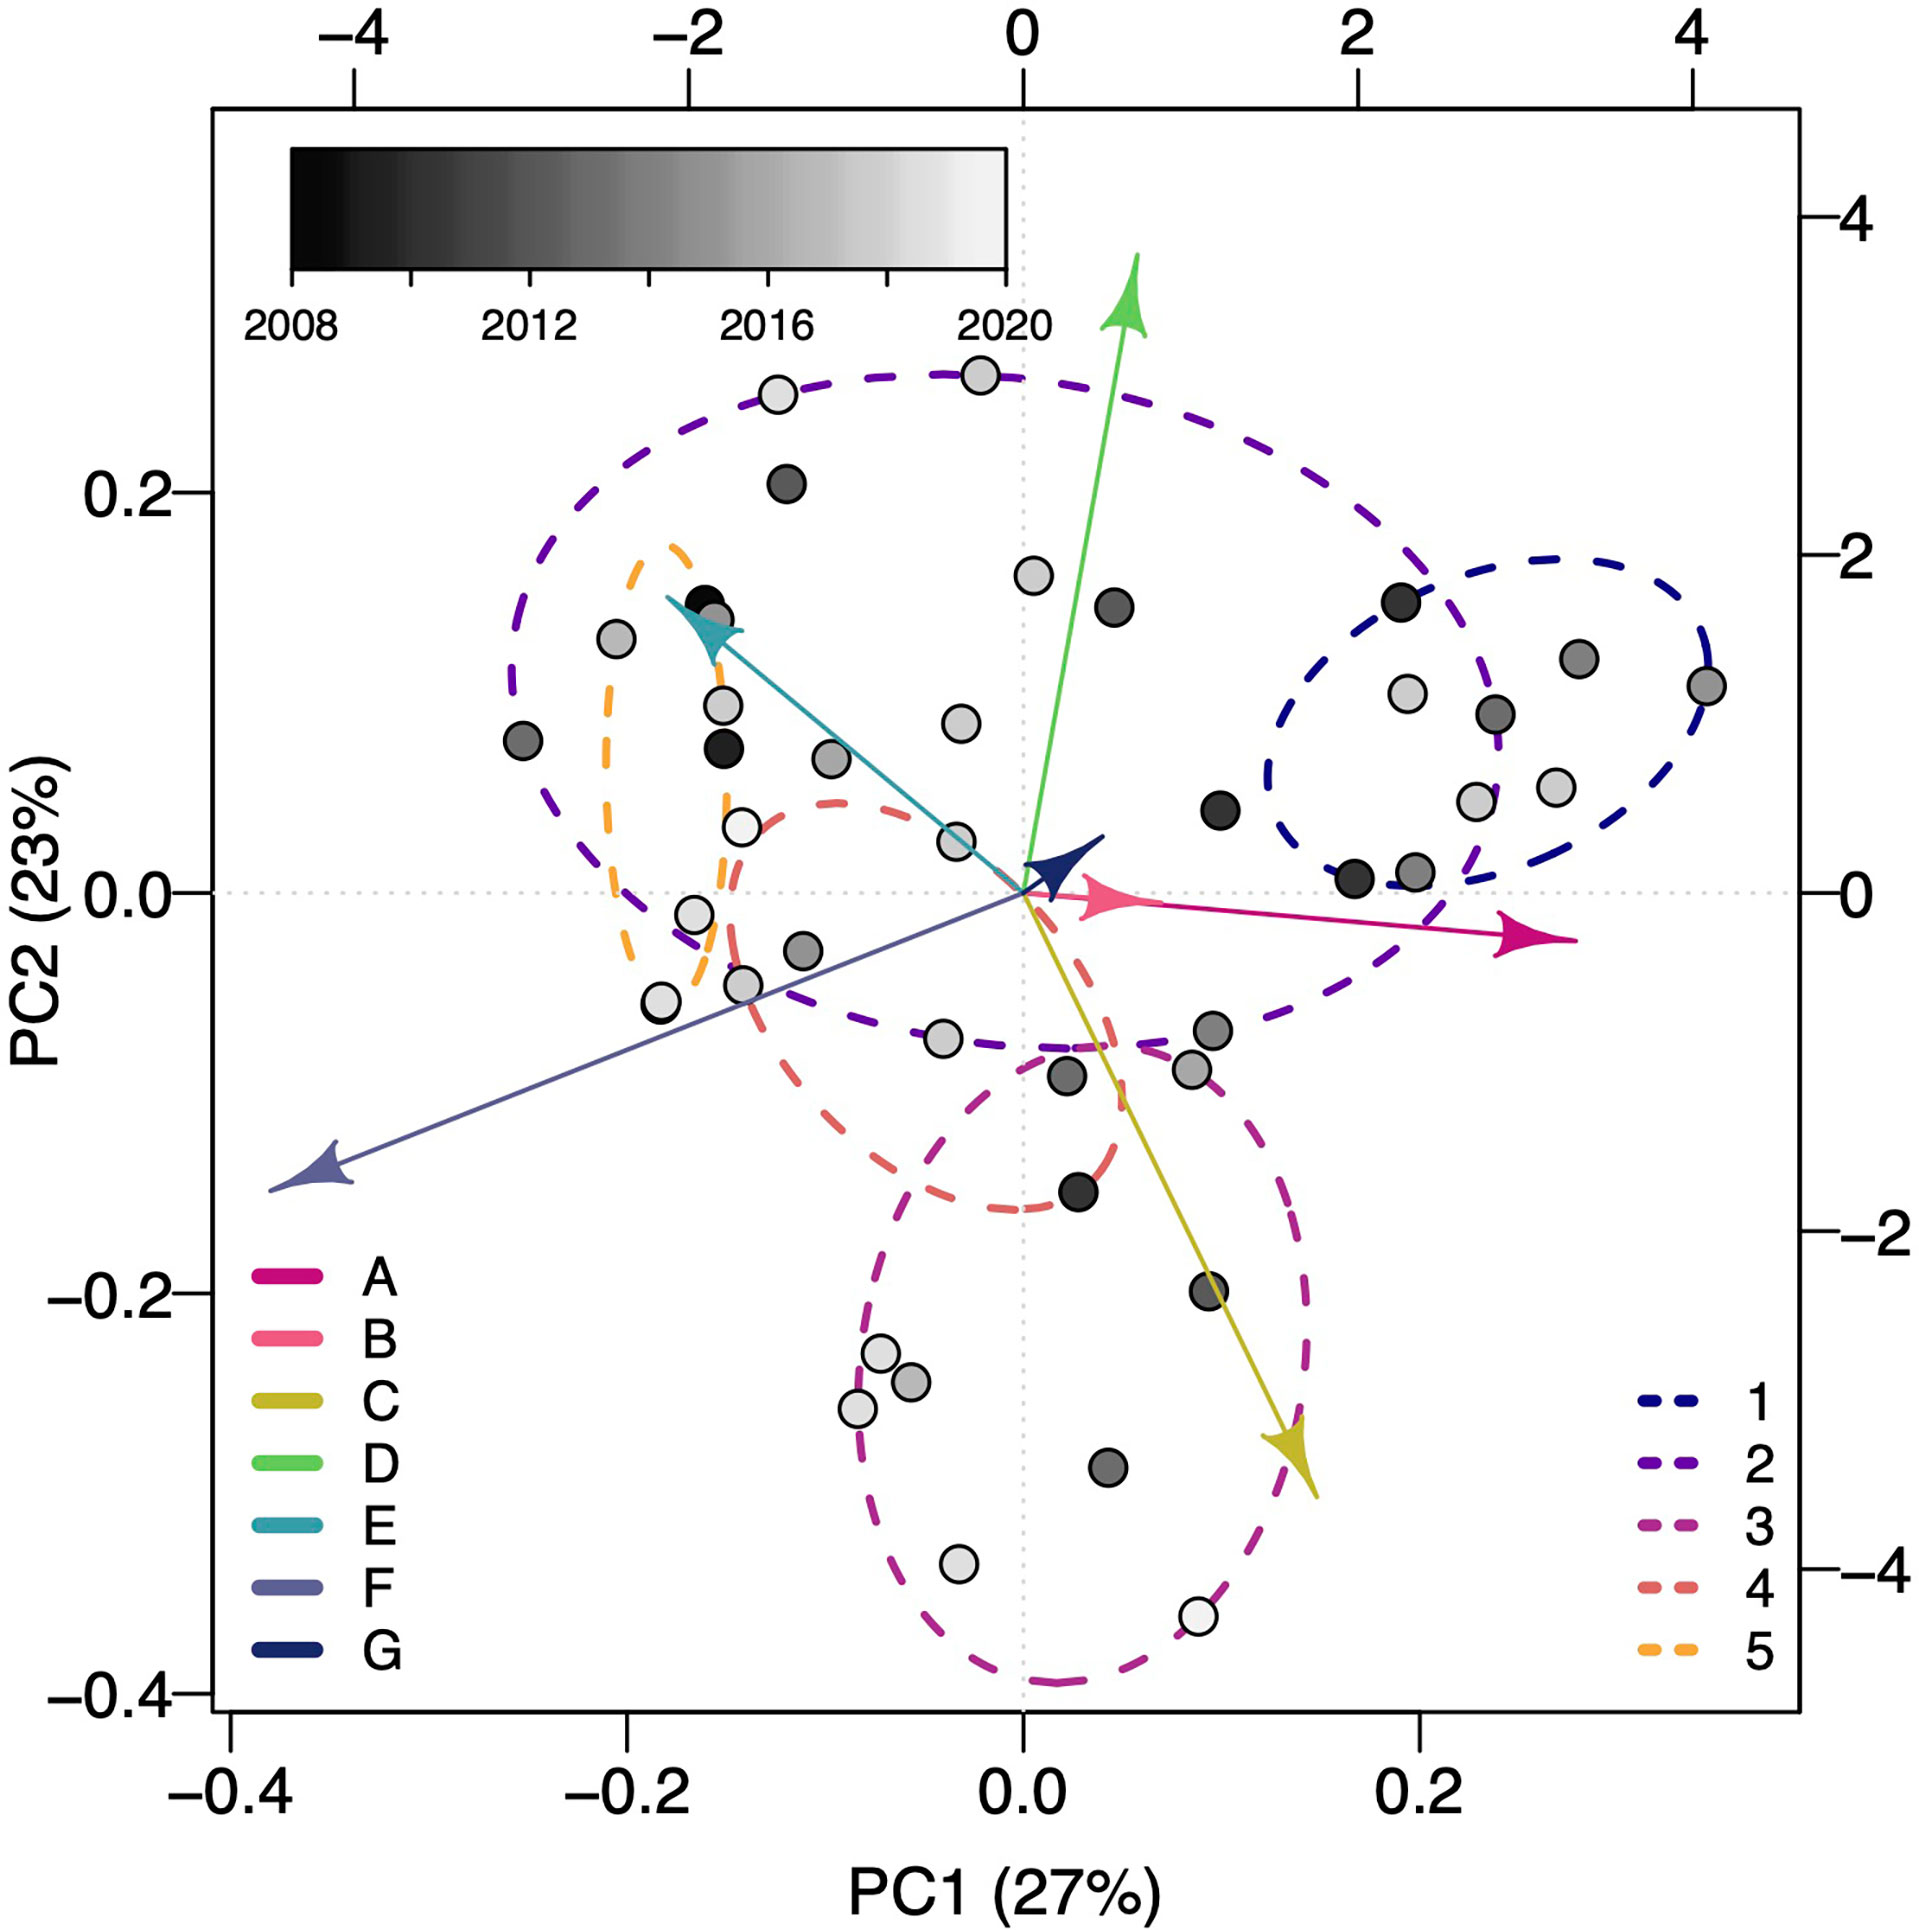
Figure 3 The first and second principal components from a Principal Components Analysis of the proportion of subsurface movements per basking shark in each shape cluster. Each point represents an individual’s first and second principal components score and is color-coded by the deployment year (lighter colors for more recent years). Arrows indicate the loadings of each of the seven subsurface movement shape clusters on the first and second principal components. Dashed ellipsoids indicate the five identified vertical movement behavioral strategies determined from a hierarchical clustering of movement summary metrics across all sharks (see Comparing subsurface movements across sharks for the metrics).
When comparing across all sharks, five vertical movement strategies were determined from subsurface movement metrics based on the gap statistic and criterion application (Figure 3)(Supplemental Figure 5). The number of sharks exhibiting a given vertical movement strategy ranged from 3 to 15 (Figure 3)(Table 2). As these strategies were identified with hierarchical clustering, the relationship between the strategies were: strategy five sister to all other strategies, strategies one and three sister to each other and strategies two and four sister to each other (Supplemental Figure 6). Strategy one roughly corresponded to early season sharks (226 ± 10, μ ± σ Julian day) and strategy five to late season sharks (242 ± 10) (Table 2). With the exception of the strategy five, all strategies had a mean maximum deployment depth greater than 200 m. Strategies two, three, and four were roughly mid-season sharks and separated along sharks having a moderate subsurface movement rate, a high rate, and very low rate (Supplemental Table 2). Strategy two was characterized by the proportion of A–E subsurface movement shapes being 13% or greater, while strategy three and five were dominated by B and C shapes, and strategy four was characterized by a high proportion of A movement shapes, few D movements, and three times more F movements than any other strategy (Table 2).
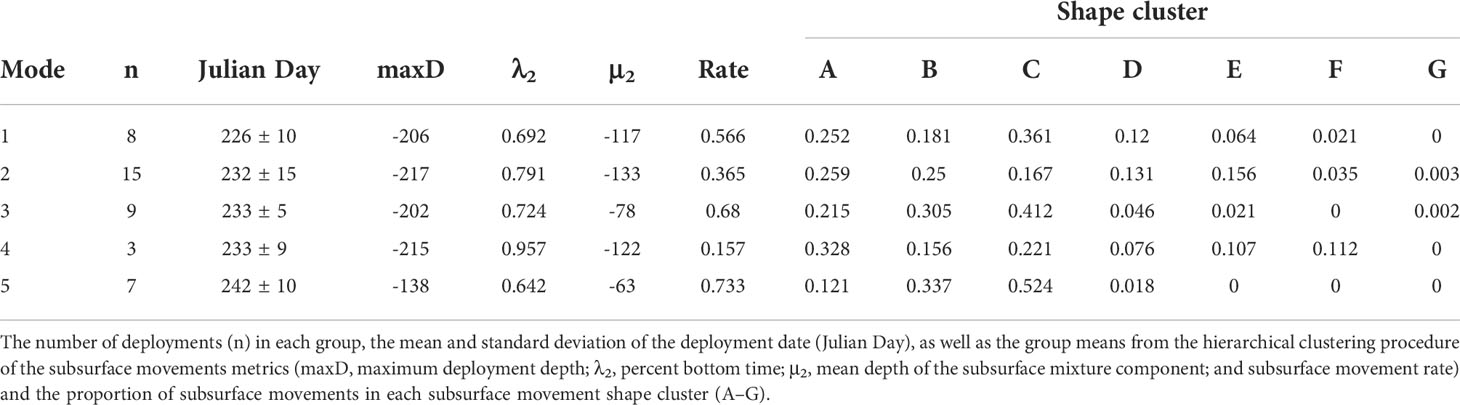
Table 2 The five vertical movement strategies identified for basking sharks tagged in the Bay of Fundy.
Of the 42 tagged sharks, 15 were classified as DVM, 27 were classified as RDVM, and only three were classified as strong vertical migrators (2 DVM, 1 RDVM) based on the test of equal proportions (Figure 4) (Supplemental Table 2). Generally, most sharks were classified as RDVM but, with the exception of 2014 and 2017, an increasing proportion were classified as DVM in more recent years (Figure 4). Across sharks, the median proportion of time at the surface was highest in the day (27%) and lowest at night (21.5%) while the standard deviation was highest at night (17.4%) and lowest in the day (11.5%) (Supplemental Table 2). None of the proportions of time at the surface differed significantly across tidal periods. Across sharks, the median proportion of time at the surface was highest in ebb tide (28%), then low slack (27%), then flood (24.5%), then high slack (23.5%) while slack tides were had the highest variability with similar, but less variability for the flood and ebb tide periods. (Supplemental Table 2).
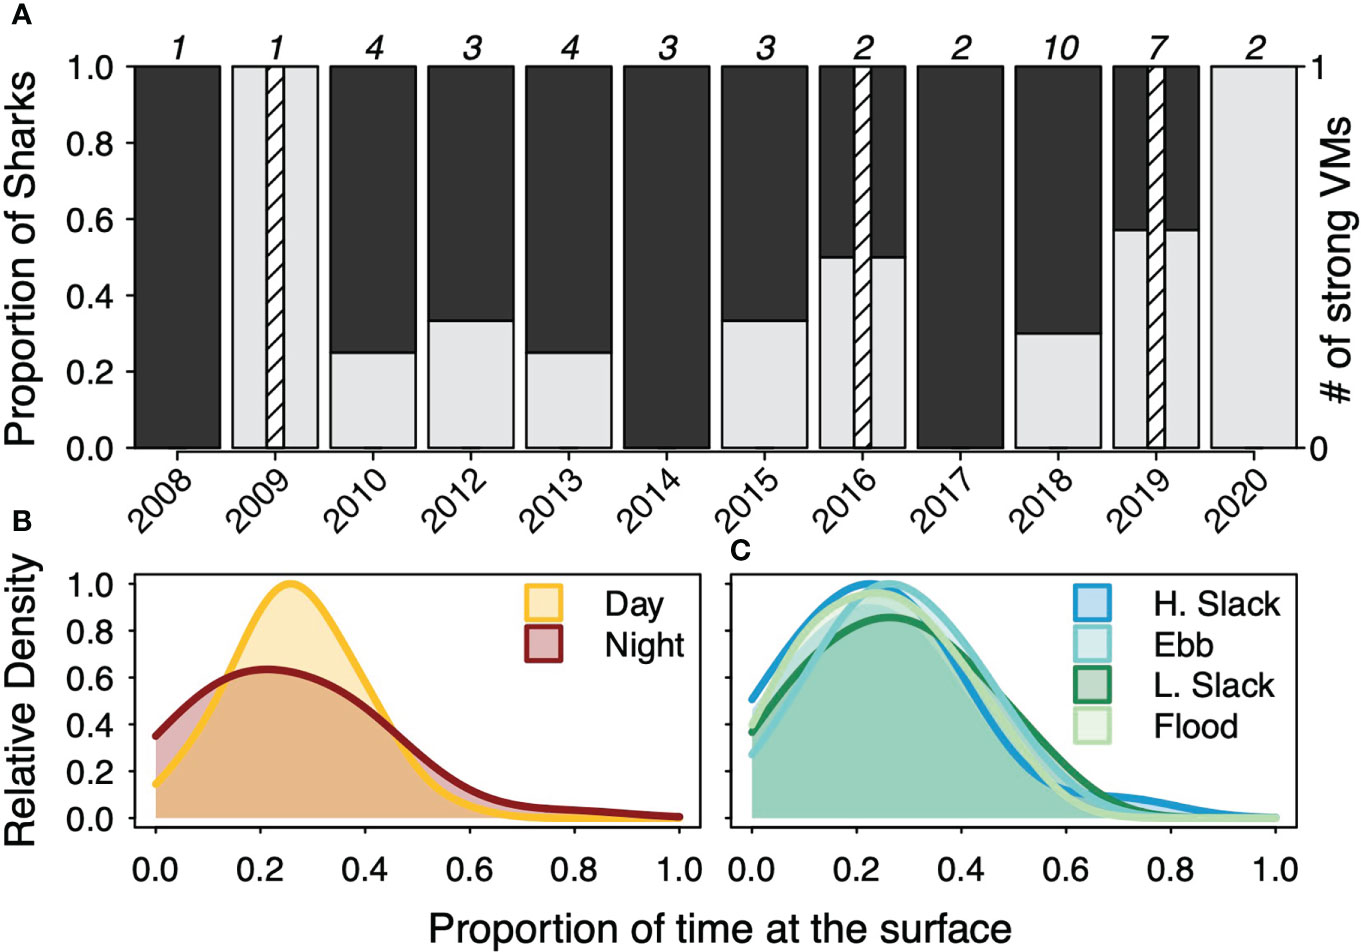
Figure 4 (A) The proportion of basking sharks in each tagging year that were classified as diel vertical migrators (DVM) or reverse DVM as well as the number of strong vertical migrators. The total number of tagged sharks in each year are noted at the top of each year. The relative density of proportion of time at the surface in the day or night diel periods (B) or high slack (H. slack), ebb, low slack (L. slack), or flood tidal periods (C) across all deployments.
Diel period correlated with the frequency of cluster A and C subsurface movement shapes, long and short V-shaped movements respectively, expressed by sharks across years with fewer of these shapes occurring at night than during the day (Table 3). These subsurface movement shapes, A and C, were also expressed significantly more on ebb and flood tides than on a high slack tide (Table 3). For subsurface movements in cluster A and C, this effect was more pronounced on the ebb tide than the flood tide (Table 3). These differences did not necessarily correspond to the subsurface movement shape occurrence as shape B, the second most abundant, did not significantly differ from the high slack tide on the other tidal periods. Generally, diel or tidal period only captured a limited amount of the variability in the subsurface movement shapes sharks expressed (Supplemental Figure 7).
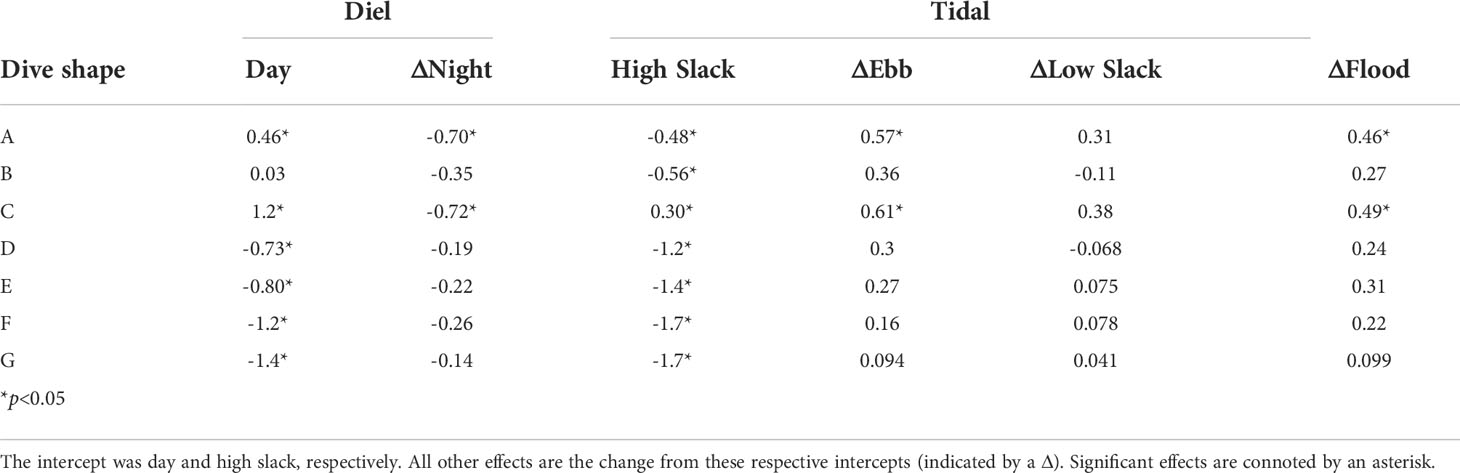
Table 3 Effect sizes for the Dirichlet regression of proportion of time basking sharks exhibited each subsurface movement shape (A-H) as a function of diel and tide time periods.
In the correlations between movement metrics, maximum deployment depth was moderately negatively correlated with percent time subsurface (λ2) but strongly positively correlated with mean depth of the subsurface component (μ2) and subsurface movement rate (Figure 5A). Percent time subsurface λ2 was moderately and strongly negatively correlated with μ2 and subsurface movement rate, respectively, while μ2 was strongly positively correlated with subsurface movement rate. Only μ2 and subsurface movement rate had moderate correlations with the principal component scores from the PCA of the proportion of time in each subsurface movement cluster while the other metrics had weak correlations (Figure 5A). Taken together, a tradeoff surface forms with sharks vertically moving to deeper depths (↓ maxD) have greater time spent subsurface (↑ λ2), have deeper average subsurface movement depths (↓ μ2), and lower subsurface movement rates. For the inverse, sharks making shallower vertical movements (↑ maxD), spend less time subsurface (↓ λ2), have shallower average subsurface movement depths (↑ μ2), and higher subsurface movement rates. Only maximum deployment depth was strongly correlated to thermocline depth while all metrics were moderately or weakly correlated with Julian day. A moderate negative correlation between thermocline depth and Julian day indicates that Julian day is not a suitable proxy for thermocline depth and the breakdown of water column stratification (Figure 5B), which occurred as early as the second week of August or had yet to occur by mid-September.
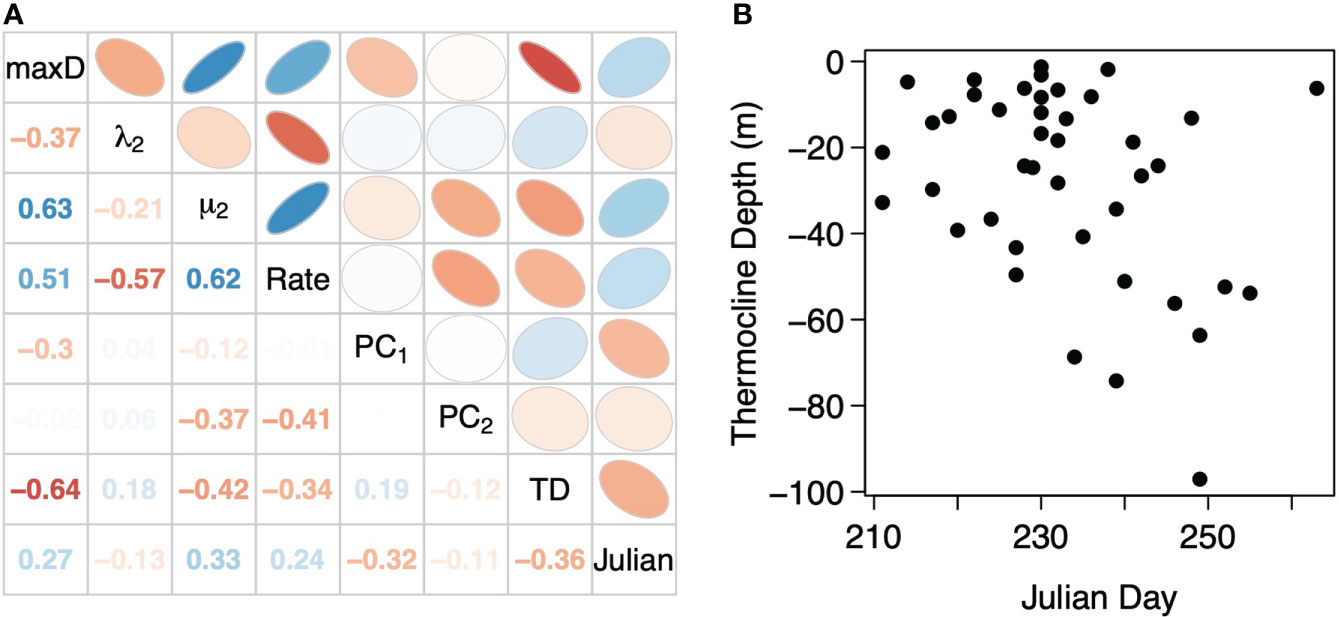
Figure 5 (A) Correlations between thermocline depth (TD), Julian day, and the vertical movement metrics: maximum depth in the deployment (max D), the percent time subsurface (λ2), the mean depth of the subsurface component (μ2), the subsurface movement rate in terms of movements per hour (Rate), as well as the score from the first and second principal components (PC1 and PC2) of the PCA on the proportion of total subsurface movements in each shape cluster. (B) Thermocline depth derived from temperature profiles developed from the temperature logging on the basking shark deployed TDR tags as a function of Julian Day of the deployment.
Across the movement metrics, the most parsimonious model included only thermocline depth for maximum deployment depth (Figure 6A), percent time subsurface (λ2)(Figure 6B), mean depth of the subsurface component (μ2)(Figure 6C), and subsurface movement rate (Figure 6D) (Supplemental Table 3). Julian day was the only covariate in the most parsimonious models for the first and second principal component scores from the PCA of the proportion of time in each subsurface movement cluster (Figures 6E, F) (Supplemental Table 3). Only one model was significant, the model for maximum deployment depth as a function of thermocline depth which predicted increasing maximum depth with more thermal stratification, shallower thermocline depths (Figure 6A). Though insignificant, mean subsurface movement depth (μ2) (Figure 6C) and subsurface movement rate (Figure 6D) had a similar trend as the maximum deployment depth. Percent bottom time (λ2) was the only metric where the most parsimonious model included a significant dispersion parameter that covaried with thermocline depth with greater variance at deeper thermocline depths (Figure 6B). With an exception of a few deployments, percent time subsurface increased with shallower thermocline depth depths. Neither model of the first and second PC scores from the PCA of the proportion of movements in each shape cluster had a significant slope or significant model (Figures 6E, F). This is largely due to a wide range of PC scores occurring on any given Julian Day. The relationship between Julian day and the PC1 scores appears to have a negative slope, more negative PC scores with latter Julian days, but, with the limited sampling of sharks late in the season, it is difficult to attribute anything to this relationship.
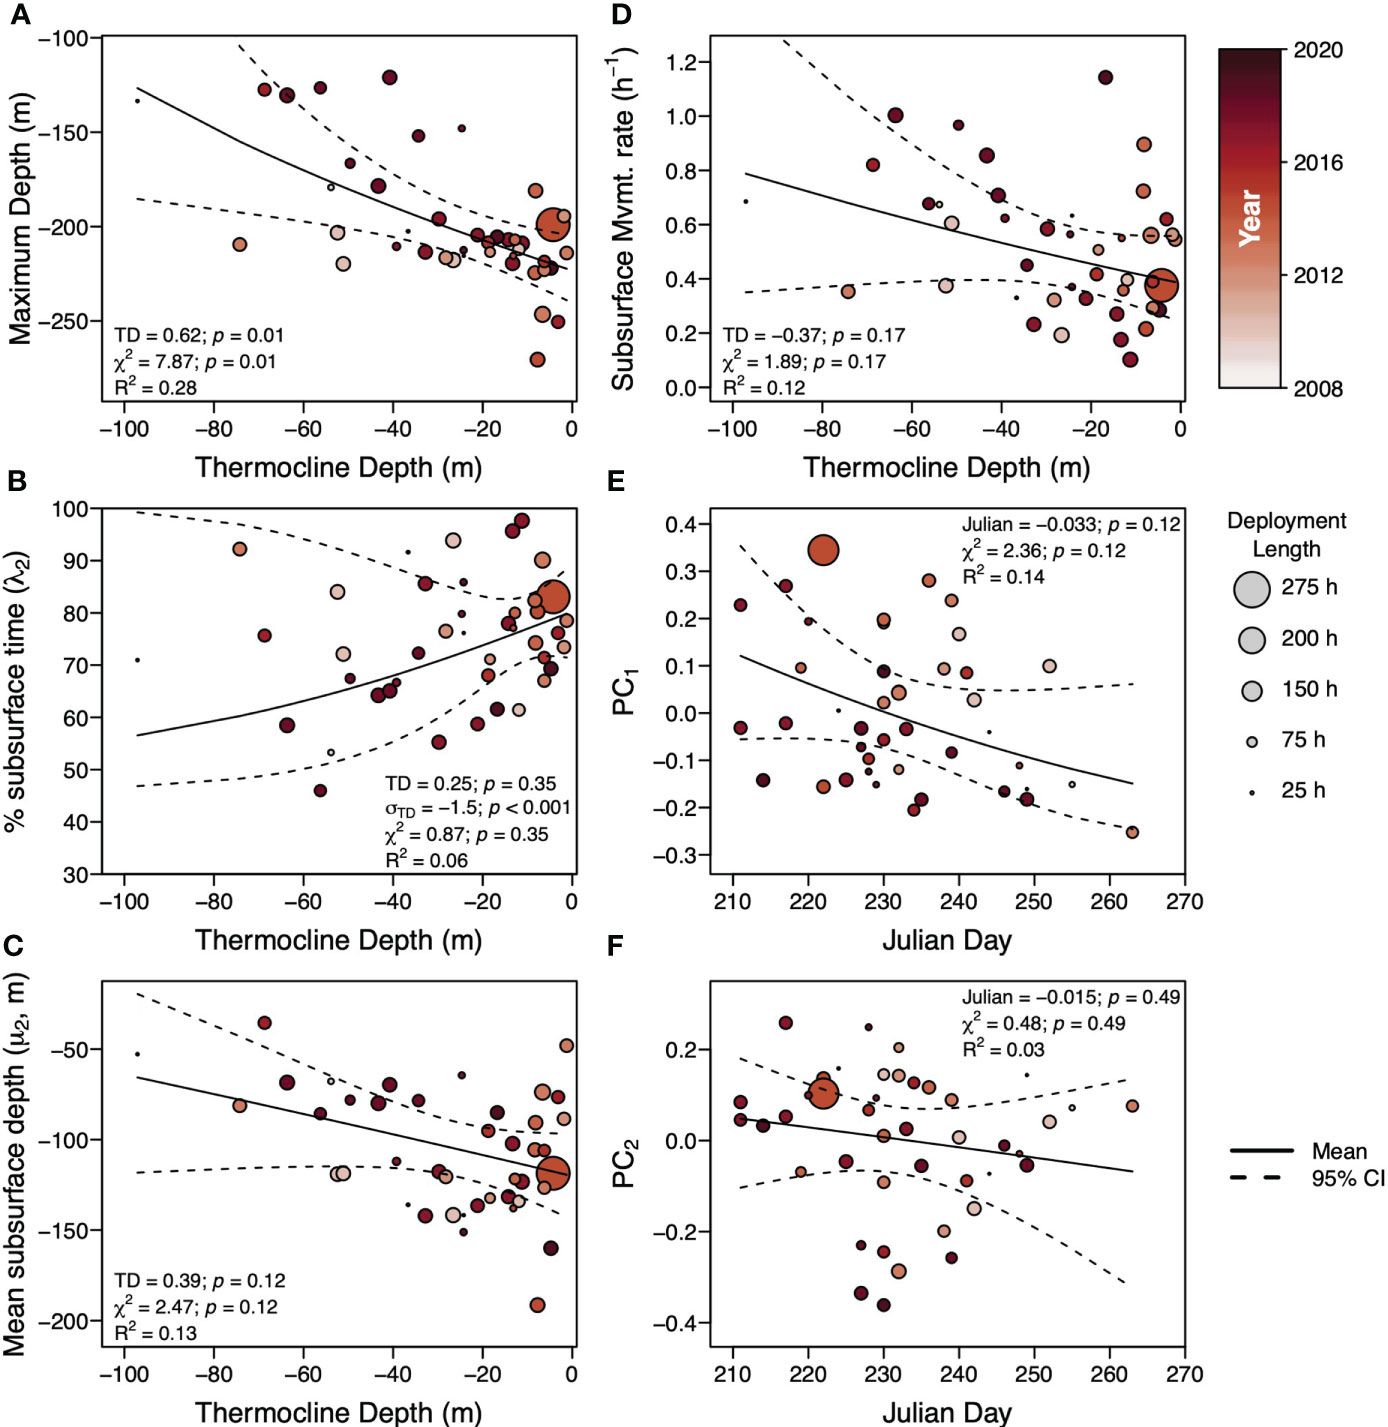
Figure 6 Summary of basking shark vertical movement metrics as a function of the top covariate in the most parsimonious linear model. For maximum depth over the deployment (A), percent bottom time (λ2)(B), depth mean of the second mixture (μ2)(C), and subsurface movement rate (D), the top covariate was thermocline depth while for the first principal component from the PCA of the proportion of subsurface movements in each shape cluster (E) and the second principal component from the PCA of the proportion of subsurface movements in each shape cluster (F), the top covariate was Julian Day. Circles indicate the metric for each individual shark and its radius indicates the length of individual deployment used to weight deployments in the linear models. The color of the circle indicates the year of the deployment (darker colors indicate more recent years). The solid black line indicates the mean and the dashed black line indicates the 95% confidence interval of the linear model predictions. Confidence intervals may be asymmetric due to normalization of the movement metrics. For each metric, the slope (TD for thermocline depth or Julian for Julian day) and its p-value, the slope of the dispersion parameter (σTD for thermocline depth or σJulian for Julian day) and its p-value (if included in the most parsimonious model), the χ2 statistic and its p-value, and the R2 are provided.
We conducted the first fine-scale recordings of basking shark vertical movements in the Bay of Fundy. Through this biologging, considerable variability in vertical movement behavior was documented within and between years. This variability expressed itself in a variety of ways. Sharks used different depths within the water column, occasionally displaying weakly bimodal behavior spending most of their time at mid-water depths but, more often, strongly bimodal behavior, spending little time at the surface and regularly below 100 m. Individuals made subsurface movements at different rates, sometimes frequently or spending almost the whole deployment subsurface. They also made these subsurface movements in different ways: often shallow, short movements, sometimes long multi-hour bouts, and, in the case of two subsurface movements, for multiple days. The frequency of these movements varied considerably between sharks and this vertical movement behavior culminated in different responses to environmental covariates and, ultimately, different diel vertical migrating patterns between sharks and over years.
The subsurface movement shapes observed in this study are reflective of similar diving patterns seen in other pelagic sharks (Nelson et al., 1997; Block et al., 2011; Gleiss et al., 2011a; Nakamura et al., 2011; reviewed by Andrzejaczek et al., 2019b). V-shaped movements (clusters A–C) (Figure 2) are hypothesized to have several functions, including maximizing vertical searching efficiency, minimizing horizontal movement near resources, navigation, thermoregulation (Klimley et al., 2002; Thums et al., 2013), and using negative buoyancy to reduce energy expenditures (Gleiss et al., 2011a). We hypothesize that the V-shaped movements in this study, making up 85.7% of all dives, are searching behavior to locate the stage V Calanus finmarchicus copepods that stratify as a discrete layer below 100m in the water column (Murison and Gaskin, 1989; Baumgartner et al., 2003). Searching is likely necessary in the Bay of Fundy as individual prey patches are driven by strong tidal currents, which advect prey in concordance with current velocity and interactions with the underlying bathymetry (Michaud and Taggart, 2011).
Another type of characteristic dive shape is U-shaped, that typically corresponds to a switch from searching to foraging as the U-shape extends bottom time (Baumgartner and Mate, 2003). U-shaped movements in this study (cluster D-F) (Figure 2) accounted for 14.2% of all subsurface movements and constituted 16% of the time in our entire record of observations (approximately 483 h). While we cannot confirm that all of these U-shaped subsurface movements were spent foraging, or how successful a given movement was, it is likely that the large difference in bottom time between a V-shaped and a U-shaped movement is a result of foraging. This subsurface movement pattern is also similar to that of North Atlantic right whales (Eubalaena glacialis) in the Bay of Fundy, which also consume stage V C. finmarchius copepods (Baumgartner et al., 2003). Many of the subsurface component means, on average 105 ± 33 m (μ2, Table 1), corresponded with Bay of Fundy basking shark distribution models that predict the core habitat to be in areas between 100 and 150m deep (Siders et al., 2013). For the North Atlantic right whale, the depth of this prey layer has been shown to strongly positively correlate with the mean dive depth (Baumgartner and Mate, 2003). Most sharks also had a maximum depth that would indicate sharks likely stayed in the Bay of Fundy.
Eight of the deployments ended in locations outside the Bay of Fundy (Table 1). Of these, two sharks, BS-15-01 and BS-17-01, moved the furthest away from the Bay of Fundy to depths greater than the maximum depth found within the bay and were the only sharks to exhibit subsurface movements belonging to cluster G (Figure 2), characterized by deeper maximum depths and much longer total times. We hypothesize these cluster G movements, while superficially resembling very long U-shaped movements, could be associated with longer range movements. Bell (2017) showed basking sharks in the Bay of Fundy migrate southward into the Caribbean in the boreal autumn complementing Skomal et al.’s (2009) similar findings for basking sharks tagged south of the Bay of Fundy off of Cape Cod, MA. The sharks with cluster G movements were tagged in early and mid-August, by no means the latest deployment within a year, but there is not a strict migratory date that has been established. Though, data from pop-up satellite tags indicate sharks can stay in the Bay as late as November (Bell, 2017). Siders et al. (2013) also showed that the distribution of basking sharks in the Bay of Fundy shifts southward in September and October likely a reflection of declining ocean temperatures (Owen, 1984), a breakdown of the Bay of Fundy gyre (Aretxabaleta et al., 2008), a declining prey field in the Bay (Michaud and Taggart, 2007), or all three. In the Pacific, Dewar et al. (2018) have similarly suggested that changes in shark behavior and distribution are linked to oceanographic conditions and changes in the prey field.
Considering the variability in the vertical movement behavior observed within our study and across other basking shark vertical movement studies (Sims et al., 2003; Gore et al., 2008; Curtis et al., 2014; Braun et al., 2018), there is a case to be made that the species is considerably diverse when it comes to foraging strategies. Previous studies in the eastern North Atlantic and around Cape Cod in the western North Atlantic have reported a wide variety of surface times for basking sharks, with a high proportion of time spent at the surface in inner-shelf waters, up to 71% (Sims et al., 2003; Sims et al., 2005; Curtis et al., 2014). In contrast, we observed less time in the surface component, ranging from 2 to 54% with a mean of 25 ± 12% (Table 1). We hypothesize that this difference is due to prey field compositional differences between the Bay of Fundy and the inner-shelf of the eastern North Atlantic and around Cape Cod (Plourde et al., 2019). The prey field of the inner-shelf in the eastern North Atlantic is comprised of Calanus helgolandicus stratified in the upper 10 m of the water column during the day (Sims and Quayle, 1998). Around Cape Cod, early stages of C. finmarchicus stay predominantly near the surface (Durbin et al., 1995) and, unlike in the Bay of Fundy, North Atlantic right whales also skim feed at the surface there (Mayo and Marx, 1990). Along the shelf edge in the eastern North Atlantic, C. helgolandicus and C. finmarchicus diapause at or below 100 m and, concordantly, basking sharks spent considerably less time at the surface than in inner-shelf waters (Sims et al., 2003). Similarly, the diapausing stage V C. finmarchicus copepods in the Bay of Fundy are likely driving basking sharks to stay at depth in the Bay of Fundy. The within and between year variability in the DVM pattern (Figure 4) suggests that sharks are capable of altering their diving behavior in response to fine scale temporal and spatial phenomena (Sims et al., 2005). Intuitively, this most likely aids in searching and consuming a patchy prey base (Sims et al., 2006) that is largely governed by climatic phenomena such as temperature regimes and ocean current circulation (Greene and Pershing, 2000; Pershing and Stamieszkin, 2020) in addition to a host of within-ecosystem phenomena such as local-scale fronts, eddies, or predation (Baumgartner et al., 2003; Johnston et al., 2005).
Over the late boreal summer and early autumn, the vertical movement of basking sharks tagged in the Bay of Fundy, in terms of maximum depth, percent time subsurface, mean subsurface depth, and subsurface movement rate, is more correlated with the thermocline depth than Julian Day (Figure 5). This is perhaps not unexpected as Julian day is a weak proxy for thermocline depth (R = -0.35, Figure 5) and, between years, the oceanography of the Bay of Fundy can vary depending on local and regional current dynamics (Koopman et al., 2014; Meyer-Gutbrod et al., 2021a) (Supplemental Figure 7). In the late boreal spring through summer, thermal stratification interacts with tidal rectification to generate increased downwelling and flow convergence between the Bay of Fundy outflow, the Scotian Shelf Coastal Current, and the Eastern Maine Coastal Current (Aretxabaleta et al., 2008). This advects considerable numbers of stage IV and V C. finmarchicus into the Bay of Fundy and, in turn, increases the retention of diapausing stage V C. finmarchicus in the deep-reaches of the Bay of Fundy basin into dense, but patchy prey fields (Michaud and Taggart, 2011; Baumgartner et al., 2017). Generally by mid-summer, the thermocline is between 20-30 m resulting in a present but weak thermal stratification of the water column (Figure 5B). During this period of some thermal stratification, we observe basking sharks with maximum depths at or just above the deepest parts of the basin and mean depths around 150 m with most of their time spent subsurface and with low subsurface movement rates (Figure 6).
As thermal stratification continues to break down over the course of the season, sharks begin to adopt shallower subsurface movement depths, higher movement rates, and less time subsurface (Figure 6). This weakening of the thermal stratification also serves to homogenize the temperatures across the water column with surface temperatures declining and bottom temperatures increasing (Supplemental Figure 7). It is possible that water temperature may play a role in the allocation between surface vs. non surface time, as a form of behavioral thermoregulation, as has been suggested for the whale shark (Rhincodon typus) (Thums et al., 2013). However, recent work by Nakamura et al. (2020) demonstrates gigantothermy from the very large body size of the whale shark serves to buffer changes in internal muscle temperature, even during vertical movements to far colder water temperatures. In basking sharks, Johnston et al. (2022) found that temperature was not a factor affecting timing of long-term movement patterns in the NE Atlantic, although these authors state that their findings might only apply locally. We hypothesize that without some metric of foraging behavior on a given subsurface movement, perhaps derived from accelerometers (Gleiss et al., 2011b), it will be difficult to connect time at a given water temperature to the vertical movements of basking shark movements in the Bay of Fundy. This is largely from the ram-filter feeding strategy employed by basking sharks that causes massive volumes of water to pass over the gills and would, in theory, dramatically lower their body temperature when foraging.
In “typical” years, vertical mixing eventually homogenizes the water column temperature (Pershing and Stamieszkin, 2020), diminishing gyre-induced downwelling and spreading out diapausing copepods across the Bay of Fundy basin around 100 m, roughly half-way in the water column. Basking sharks exploiting this less dense resource have to search more but for shorter periods and increase foraging time to achieve satiation (Figure 6). By mid- to late autumn, the Bay of Fundy gyre weakens, causing the stage V C. finmarchicus density to reduce even further as copepods are ejected into the Gulf of Maine (Aretxabaleta et al., 2008; Record et al., 2019). However, the timing of the weakening of thermal stratification can also vary between years, sometimes occurring mid-summer or sometimes not until early autumn (Figure 5B). Additionally, this variability co-occurs with variability in the stage V copepod biomass development within the bay (Sorochan et al., 2019). The strength of the phytoplankton bloom both within and outside the bay dictates the growth and survival of stage V C. finmarchicus throughout the Gulf of Maine – Scotian Shelf ecosystem (Plourde et al., 2019; Sorochan et al., 2019) while current advection determines the physical accumulation of diapausing, energy-rich copepods in the Bay of Fundy (Sorochan et al., 2021)s.
In weak bloom years, years with continued strong downwelling, or prolonged thermal stratification, copepod densities can be substantially lower (Sorochan et al., 2019), localized (Michaud and Taggart, 2011), and deep during the late summer, early autumn. This between year variability in the prey field is difficult to capture with limited copepod sampling throughout the year in the Grand Manan Basin and the nearest year-round sampling occurring in Passamaquoddy Bay is outside the main basking shark distributions in the bay (Siders et al., 2013). Davies et al. (2019) document that the peak of depth-integrated stage V C. finmarchicus densities have shifted from early autumn to late summer from 1999 to 2015 resulting in a decline in the encounter rates with North Atlantic right whales. It is very likely this between year variability in thermal stratification and copepod growth, survival, and physical accumulation drives the variability we observed in the vertical movements of basking sharks. Though further research, particularly on the prey field, is certainly required to determine the exact mechanistic relationships.
While many of the basking sharks we tagged differed in their proportion of time at the surface across diel and tidal periods, few were significantly different across diel periods and none were significantly different across tidal periods. This is perhaps not unexpected as Baumgartner et al. (2003) and Baumgartner et al. (2017) document that stage V C. finmarchicus exhibit a weak vertical migration in the Bay of Fundy and it would be surprising if basking sharks there did otherwise. Similarly, the tidal current in the Bay of Fundy can differ throughout the water column but not drastically and the majority of differences in tidal current strength is driven by geography not vertical position (Li et al., 2015). Better geolocations between subsequent subsurface movements would be necessary to elucidate whether basking sharks behave differently in these local tidal fluctuations in the Bay of Fundy as rorqual whales do in Long Eddy at the northern tip of Grand Manan Island (Johnston and Read, 2007).
The gross differences in time-depth allocation between diel and tidal periods did not translate into drastic differences in the geometry of the subsurface movements across these time periods. We only observe a decrease in the proportion of subsurface movements for clusters A and C movement shapes from day to night (Table 3). These searching behavior-associated long and short V-shaped movements, respectively, also were the only subsurface movement shapes to vary significantly across tidal periods, occurring more frequently on the ebb and flood tide than on slack tides. This is likely due to the strong tidal dynamics of the Bay of Fundy. Tidal amplification in the Gulf of Maine and tidal resonance of the Bay’s funnel shape result in an average tidal range of 5 m in Grand Manan Basin, (Desplanque and Mossman, 2004), where most of the sharks in this study were tagged (Figure 1). Diurnal and semi-diurnal tides result in unequal high and low water tidal heights and variable magnitudes in tidally-driven currents during a single day. Together, these tidal forces exchange a volume of water, four times greater than all the world’s rivers discharge, in and out of the Bay of Fundy daily (Desplanque and Mossman, 2004). The proportion of longer searching movements, cluster A shapes, were more influenced by tidal period than any other subsurface movement shape. One possible explanation for this phenomenon is that diminished tidal currents on slack tides could reduce the area covered on these searching movements. Siders (2013) observed that basking sharks in the Bay of Fundy often glide on descents with reduced tail beating which would increase the reliance of currents for making long transverse movements. Additionally, the long length of U-shaped movements (two and five hours on average for cluster D and E movements), make these foraging movements more likely to occur across multiple tidal periods and, thus, would be less likely to be significantly different in the Dirichlet regression.
The vertical movement behavioral diversity we observed is likely to be important as the North Atlantic biome evolves in response to climate change (Pershing and Stamieszkin, 2020). During the North Atlantic marine heat wave in 2012, the Bay of Fundy underwent a dramatic 2-4°C shift in the thermal profile of the entire water column (Koopman et al., 2014). Sharks in 2012 stand out amongst the rest of the deployments in that no dive shape dominated. While we cannot speak to the survival of these sharks beyond the deployment period, this does provide empirical evidence of behavioral adjustment by basking sharks to localized climate change effects, as has been suggested in the NE Atlantic by Johnston et al. (2022). Additionally, the threshold density of stage V C. finmarchicus required to support a basking shark is likely significantly lower than that for a right whale mitigating some of the drastic changes in right whale distributions in the western North Atlantic (Davies et al., 2019; Record et al., 2019; Sorochan et al., 2019; Meyer-Gutbrod et al., 2021b). Sims (1999) reported an observed feeding threshold of 0.48–0.7 g m-3 when basking sharks were primarily consuming C. helgolandicus while van der Hoop et al. (2019) estimated >170 g m-3 were needed for North Atlantic right whales feeding on C. finmarchicus. This lower prey density threshold may partially explain the persistence of basking sharks in the Bay of Fundy, even though North Atlantic right whale sightings there have become rare (Davies et al., 2019; Record et al., 2019). Nonetheless, stage V C. finmarchicus abundance has declined in the eastern Gulf of Maine and Scotian Shelf (Sorochan et al., 2019), areas where most of the Bay of Fundy advection originates, and have resulted in declines in late season stage V C. finmarchicus in the Bay of Fundy (Record et al., 2019). It is reasonable to assume basking sharks may undergo a distributional shift as North Atlantic right whales have done, either to Cape Cod Bay where C. finmarchicus abundance remains high (Sorochan et al., 2019) or poleward to the Gulf of St. Lawrence (Sorochan et al., 2021), should the climatic changes in the western North Atlantic continue (Pershing et al., 2021). Given the intense historic climate changes that have occurred in the 100 million years since Cetorhinidae split from Lamnidae (Sorenson et al., 2014), it is perhaps reasonable to assume the species will weather coming changes. However, the extinction of Cetorhinus piersoni, C. huddlestoni, and Keasius parvus during the late Oligocene to middle Miocene during climatic cooling are evidence that climatic transitions have impacted Cetorhinidae before and may do so again (Hovestadt and Hovestadt-Euler, 2012; Welton, 2015).
The raw data supporting the conclusions of this article will be made available by the authors, without undue reservation.
The animal study was reviewed and approved by UNCW Institutional Animal Care and Use Committee.
AW and HK conceived the project. AW led the tagging while all authors contributed. All authors contributed to previous versions of the analysis, ZS led the latest implementation. ZS led the writing. All authors contributed to the article and approved the submitted version.
This project was funded by the PADI Foundation, Shell Fueling Change Grant, the Royal Caribbean Cruise Lines Ocean Fund, the Garfield-Weston Foundation, the New Brunswick Wildlife Trust Fund, the Canadian Wildlife Federation, and the UNCW Graduate School.
This project would not have been possible without the assistance of the Grand Manan Whale and Seabird Research Station, the University of North Carolina Wilmington, and funding by the PADI Foundation, Shell Fueling Change Grant, the Royal Caribbean Cruise Lines Ocean Fund, the Garfield-Weston Foundation, the New Brunswick Wildlife Trust Fund, the Canadian Wildlife Federation, and the UNCW Graduate School. We thank all the GMWSRS research assistants all of whom spent countless hours on the water surveying for basking sharks. Special thanks also to Catlin Mckinstry, Laurie Murison, Rob Ronconi, and Sarah Wong who all helped initiate this study. This research was carried out under protocols approved by the UNCW Institutional Animal Care and Use Committee (A2008-007, A1112-006, A1415-008, A1718-004, A2021-004) and scientific permits issued by the Canadian Department of Fisheries and Oceans. (2009: License# 322858; 2010-20: License# 325842).
The authors declare that the research was conducted in the absence of any commercial or financial relationships that could be construed as a potential conflict of interest.
All claims expressed in this article are solely those of the authors and do not necessarily represent those of their affiliated organizations, or those of the publisher, the editors and the reviewers. Any product that may be evaluated in this article, or claim that may be made by its manufacturer, is not guaranteed or endorsed by the publisher.
The Supplementary Material for this article can be found online at: https://www.frontiersin.org/articles/10.3389/fmars.2022.976857/full#supplementary-material
Aghabozorgi S., Seyed Shirkhorshidi A., Ying Wah T. (2015). Time-series clustering – a decade review. Inf. Syst. 53, 16–38. doi: 10.1016/j.is.2015.04.007
Aitchison J. (1986). The statistical analysis of compositional data (Netherlands: Springer). Available at: https://books.google.com/books?id=RHKmAAAAIAAJ.
Andrzejaczek S., Gleiss A. C., Lear K. O., Pattiaratchi C. B., Chapple T. K., Meekan M. G. (2019a). Biologging tags reveal links between fine-scale horizontal and vertical movement behaviors in tiger sharks (Galeocerdo cuvier). Front. Mar. Sci. 6. doi: 10.3389/fmars.2019.00229
Andrzejaczek S., Gleiss A. C., Pattiaratchi C. B., Meekan M. G. (2019b). Patterns and drivers of vertical movements of the large fishes of the epipelagic. Rev. Fish Biol. Fish. 29, 335–354. doi: 10.1007/s11160-019-09555-1
Aretxabaleta A. L., McGillicuddy D. J., Smith K. W., Lynch D. R. (2008). Model simulations of the bay of fundy gyre: 1. climatological results. J. Geophys. Res. 113, 1–16. doi: 10.1029/2007JC004480
Baumgartner M., Cole T., Campbell R., Teegarden G., Durbin E. (2003). Associations between north Atlantic right whales and their prey, calanus finmarchicus, over diel and tidal time scales. Mar. Ecol. Prog. Ser. 264, 155–166. doi: 10.3354/meps264155
Baumgartner M., Mate B. (2003). Summertime foraging ecology of north Atlantic right whales. Mar. Ecol. Prog. Ser. 264, 123–135. doi: 10.3354/meps264123
Baumgartner M., Wenzel F., Lysiak N., Patrician M. (2017). North Atlantic right whale foraging ecology and its role in human-caused mortality. Mar. Ecol. Prog. Ser. 581, 165–181. doi: 10.3354/meps12315
Bell K. R. (2017). Diving behaviour of Western North Atlantic basking sharks: insights from short- and long-term tagging. Wilmington, United States: University of North Carolina Wilmington.
Benaglia T., Chauveau D., Hunter D. R., Young D. (2009). Mixtools: An r package for analyzing finite mixture models. J. Stat. Software 32, 1–29. doi: 10.18637/jss.v032.i06
Bennison A., Bearhop S., Bodey T. W., Votier S. C., Grecian W. J., Wakefield E. D., et al. (2018). Search and foraging behaviors from movement data: A comparison of methods. Ecol. Evol. 8, 13–24. doi: 10.1002/ece3.3593
Block B. A., Jonsen I. D., Jorgensen S. J., Winship A. J., Shaffer S. A., Bograd S. J., et al. (2011). Tracking apex marine predator movements in a dynamic ocean. Nature 475, 86–90. doi: 10.1038/nature10082
Bonfil R., Francis M., Duffy C., Manning M., O’Brien S. (2010). Large-Scale tropical movements and diving behavior of white sharks carcharodon carcharias tagged off new Zealand. Aquat. Biol. 8, 115–123. doi: 10.3354/ab00217
Bonfil R., Meÿer M., Scholl M. C., Johnson R., O’Brien S., Oosthuizen H., et al. (2005). Transoceanic migration, spatial dynamics, and population linkages of white sharks. Science 310, 100–103. doi: 10.1126/science.1114898
Braun C. D., Skomal G. B., Thorrold S. R. (2018). Integrating archival tag data and a high-resolution oceanographic model to estimate basking shark (Cetorhinus maximus) movements in the Western Atlantic. Front. Mar. Sci. 5. doi: 10.3389/fmars.2018.00025
Brooks M. E., Kristensen K., Benthem K. J., van Magnusson A., Berg C. W., Nielsen A., et al. (2017). glmmTMB balances speed and flexibility among packages for zero-inflated generalized linear mixed modeling. R J. 9, 378–400. doi: 10.32614/RJ-2017-066
Bruce B. D., Stevens J. D., Malcolm H. (2006). Movements and swimming behaviour of white sharks (Carcharodon carcharias) in Australian waters. Mar. Biol. 150, 161–172. doi: 10.1007/s00227-006-0325-1
Brunnschweiler J. M., Baensch H., Pierce S. J., Sims D. W. (2009). Deep-diving behaviour of a whale shark Rhincodon typus during long-distance movement in the western Indian ocean. J. Fish Biol. 74, 706–714. doi: 10.1111/j.1095-8649.2008.02155.x
Campana S. E., Dorey A., Fowler M., Joyce W., Wang Z., Wright D., et al. (2011). Migration pathways, behavioural thermoregulation and overwintering grounds of blue sharks in the Northwest Atlantic. PloS One 6, e16854. doi: 10.1371/journal.pone.0016854
Curtis T. H., Zeeman S. I., Summers E. L., Cadrin S. X., Skomal G. B. (2014). Eyes in the sky: linking satellite oceanography and biotelemetry to explore habitat selection by basking sharks. Anim. Biotelemetry 2, 12. doi: 10.1186/2050-3385-2-12
Davies K., Brown M., Hamilton P., Knowlton A., Taggart C., Vanderlaan A. (2019). Variation in north Atlantic right whale eubalaena glacialis occurrence in the bay of fundy, Canada, over three decades. Endanger. Species Res. 39, 159–171. doi: 10.3354/esr00951
Desplanque C., Mossman D. J. (2004). Tides and their seminal impact on the geology, geography, history, and socio-economics of the bay of fundy, eastern Canada. Atl. Geol. 40, 1–130. doi: 10.4138/729
Dewar H., Mous P., Domeier M., Muljadi A., Pet J., Whitty J. (2008). Movements and site fidelity of the giant manta ray, manta birostris, in the komodo marine park, Indonesia. Mar. Biol. 155, 121–133. doi: 10.1007/s00227-008-0988-x
Dewar H., Wilson S. G., Hyde J. R., Snodgrass O. E., Leising A., Lam C. H., et al. (2018). Basking shark (Cetorhinus maximus) movements in the Eastern north pacific determined using satellite telemetry. Front. Mar. Sci. 5. doi: 10.3389/fmars.2018.00163
Durbin E. G., Campbell R. G., Gilman S. L., Durbin A. G. (1995). Diel feeding behavior and ingestion rate in the copepod calanus finmarchicus in the southern gulf of Maine during late spring. Cont. Shelf Res. 15, 539–570. doi: 10.1016/0278-4343(94)00059-V
Eckert A. (2018) parallelDist: Parallel distance matrix computation using multiple threads. Available at: https://CRAN.R-project.org/package=parallelDist.
Edelhoff H., Signer J., Balkenhol N. (2016). Path segmentation for beginners: an overview of current methods for detecting changes in animal movement patterns. Mov. Ecol. 4, 21. doi: 10.1186/s40462-016-0086-5
Garriga J., Palmer J. R. B., Oltra A., Bartumeus F. (2016). Expectation-maximization binary clustering for behavioural annotation. PloS One 11, e0151984. doi: 10.1371/journal.pone.0151984
Giorgino T. (2009). Computing and visualizing dynamic time warping alignments in r: The dtw package. J. Stat. Software 31, 1–24. doi: 10.18637/jss.v031.i07
Gleiss A. C., Norman B., Wilson R. P. (2011a). Moved by that sinking feeling: Variable diving geometry underlies movement strategies in whale sharks: Whale shark diving geometry. Funct. Ecol. 25, 595–607. doi: 10.1111/j.1365-2435.2010.01801.x
Gleiss A. C., Wilson R. P., Shepard E. L. C. (2011b). Making overall dynamic body acceleration work: on the theory of acceleration as a proxy for energy expenditure: Acceleration as a proxy for energy expenditure. Methods Ecol. Evol. 2, 23–33. doi: 10.1111/j.2041-210X.2010.00057.x
Goldbogen J. A. (2006). Kinematics of foraging dives and lunge-feeding in fin whales. J. Exp. Biol. 209, 1231–1244. doi: 10.1242/jeb.02135
Gore M. A., Rowat D., Hall J., Gell F. R., Ormond R. F. (2008). Transatlantic migration and deep mid-ocean diving by basking shark. Biol. Lett. 4, 395–398. doi: 10.1098/rsbl.2008.0147
Graham R. T., Roberts C. M., Smart J. C. (2006). Diving behaviour of whale sharks in relation to a predictable food pulse. J. R. Soc Interface 3, 109–116. doi: 10.1098/rsif.2005.0082
Greene C., Pershing A. J. (2000). The response of calanus finmarchicus populations to climate variability in the Northwest Atlantic: basin-scale forcing associated with the north Atlantic oscillation. ICES J. Mar. Sci. 57, 1536–1544. doi: 10.1006/jmsc.2000.0966
Hays G. C., Hobson V. J., Metcalfe J. D., Righton D., Sims D. W. (2006). Flexible foraging movements of leatherback turtles across the north Atlantic ocean. Ecology 87, 2647–2656. doi: 10.1890/0012-9658(2006)87[2647:FFMOLT]2.0.CO;2
Heide-Jørgensen M. P., Laidre K. L., Nielsen N. H., Hansen R. G., Røstad A. (2013). Winter and spring diving behavior of bowhead whales relative to prey. Anim. Biotelemetry 1, 15. doi: 10.1186/2050-3385-1-15
Hovestadt D. C., Hovestadt-Euler M. (2012). A partial skeleton of cetorhinus parvus leriche 1910 (Chondrichthyes, cetorhinidae) from the oligocene of Germany. Paläontol. Z. 86, 71–83. doi: 10.1007/s12542-011-0118-9
IUCN (2021) The IUCN red list of threatened species. Available at: http://www.iucnredlist.org.
Johnston E. M., Houghton J. D. R., Mayo P. A., Hatten G. K. F., Klimley A. P., Mensink P. J. (2022). Cool runnings: behavioural plasticity and the realised thermal niche of basking sharks. Environ. Biol. Fishes. doi: 10.1007/s10641-021-01202-8
Johnston D. W., Read A. J. (2007). Flow-field observations of a tidally driven island wake used by marine mammals in the bay of fundy, Canada. Fish. Oceanogr. 16, 422–435. doi: 10.1111/j.1365-2419.2007.00444.x
Johnston D., Westgate A., Read A. (2005). Effects of fine-scale oceanographic features on the distribution and movements of harbour porpoises phocoena phocoena in the bay of fundy. Mar. Ecol. Prog. Ser. 295, 279–293. doi: 10.3354/meps295279
Klimley A. P., Beavers S. C., Curtis T. H., Jorgensen S. J. (2002). Movements and swimming behavior of three species of sharks in la Jolla canyon, California. Environ. Biol. Fishes 63, 117–135. doi: 10.1023/A:1014200301213
Koopman H., Westgate A., Siders Z., Cahoon L. (2014). Rapid subsurface ocean warming in the bay of fundy as measured by free-swimming basking sharks. Oceanography 27, 14–17. doi: 10.5670/oceanog.2014.32
Laidre K., Heide-Jørgensen M., Nielsen T. (2007). Role of the bowhead whale as a predator in West Greenland. Mar. Ecol. Prog. Ser. 346, 285–297. doi: 10.3354/meps06995
Li M. Z., Hannah C. G., Perrie W. A., Tang C. C. L., Prescott R. H., Greenberg D. A. (2015). Modelling seabed shear stress, sediment mobility, and sediment transport in the bay of fundy. Can. J. Earth Sci. 52, 757–775. doi: 10.1139/cjes-2014-0211
Maechler M., Rousseeuw P., Struyf A., Hubert M., Hornik K. (2021). Cluster: Cluster Analysis basics and extensions R package version 2.1.2. Available at: https://CRAN.R-project.org/package=cluster.
Maier M. J. (2021) DirichletReg: Dirichlet regression. Available at: https://github.com/maiermarco/DirichletReg.
Mayo C. A., Marx M. K. (1990). Surface foraging behaviour of the north Atlantic right whale, Eubalaena glacialis, and associated zooplankton characteristics. Can. J. Zool. 68, 2214–2220. doi: 10.1139/z90-308
Meyer-Gutbrod E., Greene C., Davies K., Johns D. (2021a). Ocean regime shift is driving collapse of the north Atlantic right whale population. Oceanography 34, 22–31. doi: 10.5670/oceanog.2021.308
Meyer-Gutbrod E., Greene C., Davies K., Johns D. (2021b). Ocean regime shift is driving collapse of the north Atlantic right whale population. Oceanography 34, 22–31. doi: 10.5670/oceanog.2021.308
Michaud J., Taggart C. (2007). Lipid and gross energy content of north Atlantic right whale food,Calanus finmarchicus, in the bay of fundy. Endanger. Species Res. 3, 77–94. doi: 10.3354/esr003077
Michaud J., Taggart C. (2011). Spatial variation in right whale food, calanus finmarchicus, in the bay of fundy. Endanger. Species Res. 15, 179–194. doi: 10.3354/esr00370
Murison L. D., Gaskin D. E. (1989). The distribution of right whales and zooplankton in the bay of fundy, Canada. Can. J. Zool. 67, 1411–1420. doi: 10.1139/z89-200
Nakamura I., Matsumoto R., Sato K. (2020). Body temperature stability observed in the whale sharks, the world’s largest fish. J. Exp. Biol. 223, 1–10. doi: 10.1242/jeb.210286
Nakamura I., Watanabe Y., Papastamatiou Y., Sato K., Meye C. (2011). Yo-yo vertical movements suggest a foraging strategy for tiger sharks galeocerdo cuvier. Mar. Ecol. Prog. Ser. 424, 237–246. doi: 10.3354/meps08980
Nelson D. R., McKibben J. N., Strong W. R., Lowe C. G., Sisneros J. A., Schroeder D. M., et al. (1997). An acoustic tracking of a megamouth shark, megachasma pelagios: a crepuscular vertical migrator. Environ. Biol. Fishes 49, 389–399. doi: 10.1023/A:1007369619576
Nowacek D. P., Johnson M. P., Tyack P. L., Shorter K. A., McLellan W. A. (2001). Buoyant balaenids: the ups and downs of buoyancy in right whales. Proc. R. Soc Lond. B Biol. Sci. 268, 1811–1816. doi: 10.1098/rspb.2001.1730
Owen R. E. (1984). Distribution and ecology of the basking shark Cetorhinus maximus (Gunnerus 1765). Kingston, United States: University of Rhode Island.
Pershing A. J., Alexander M. A., Brady D. C., Brickman D., Curchitser E. N., Diamond A. W., et al. (2021). Climate impacts on the gulf of Maine ecosystem. Elem. Sci. Anthr. 9, 76. doi: 10.1525/elementa.2020.00076
Pershing A. J., Stamieszkin K. (2020). The north Atlantic ecosystem, from plankton to whales. Annu. Rev. Mar. Sci. 12, 339–359. doi: 10.1146/annurev-marine-010419-010752
Peterson R. A. (2021). Finding optimal normalizing transformations via bestNormalize. R J. 13, 310–329. doi: 10.32614/RJ-2021-041
Plourde S., Lehoux C., Johnson C. L., Perrin G., Lesage V. (2019). North Atlantic right whale (Eubalaena glacialis) and its food: (I) a spatial climatology of calanus biomass and potential foraging habitats in Canadian waters. J. Plankton Res. 41, 667–685. doi: 10.1093/plankt/fbz024
Plummer M., Best N., Cowles K., Vines K. (2006). CODA: Convergence diagnosis and output analysis for MCMC. R News 6, 7–11.
R Core Team (2020). R: A language and environment for statistical computing. Vienna, Austria: R Foundation for Statistical Computing. Available at: https://www.R-project.org/.
Record N., Runge J., Pendleton D., Balch W., Davies K., Pershing A., et al. (2019). Rapid climate-driven circulation changes threaten conservation of endangered north Atlantic right whales. Oceanography 32, 162–169. doi: 10.5670/oceanog.2019.201
Ryan J. A., Ulrich J. M. (2020) Xts: eXtensible time series. Available at: https://CRAN.R-project.org/package=xts.
Senin P. (2008). Dynamic time warping algorithm review (Honolulu, USA: University of Hawaii at Manoa). Available at: https://seninp.github.io/assets/pubs/senin_dtw_litreview_2008.pdf.
Siders Z. A. (2013). Spatial distribution and vertical movement of basking sharks in the bay of Fundy, Canada. Wilmington, United States: University of North Carolina Wilmington.
Siders Z. A., Westgate A. J., Johnston D. W., Murison L. D., Koopman H. N. (2013). Seasonal variation in the spatial distribution of basking sharks (Cetorhinus maximus) in the lower bay of fundy, Canada. PloS One 8, e82074. doi: 10.1371/journal.pone.0082074
Sims D. W. (1999). Threshold foraging behaviour of basking sharks on zooplankton: life on an energetic knife-edge? Proc. R. Soc Lond. B Biol. Sci. 266, 1437–1443. doi: 10.1098/rspb.1999.0798
Sims D. W., Quayle V. A. (1998). Selective foraging behaviour of basking sharks on zooplankton in a small-scale front. Nature 393, 460–464. doi: 10.1038/30959
Sims D. W., Southall E. J., Humphries N. E., Hays G. C., Bradshaw C. J. A., Pitchford J. W., et al. (2008). Scaling laws of marine predator search behaviour. Nature 451, 1098–1102. doi: 10.1038/nature06518
Sims D. W., Southall E. J., Richardson A. J., Reid P. C., Metcalfe J. D. (2003). Seasonal movements and behaviour of basking sharks from archival tagging: no evidence of winter hibernation. Mar. Ecol. Prog. Ser. 248, 187–196. doi: 10.3354/meps248187
Sims D. W., Southall E. J., Tarling G. A., Metcalfe J. D. (2005). Habitat-specific normal and reverse diel vertical migration in the plankton-feeding basking shark. J. Anim. Ecol. 74, 755–761. doi: 10.1111/j.1365-2656.2005.00971.x
Sims D. W., Witt M. J., Richardson A. J., Southall E. J., Metcalfe J. D. (2006). Encounter success of free-ranging marine predator movements across a dynamic prey landscape. Proc. R. Soc B Biol. Sci. 273, 1195–1201. doi: 10.1098/rspb.2005.3444
Skomal G. B., Zeeman S. I., Chisholm J. H., Summers E. L., Walsh H. J., McMahon K. W., et al. (2009). Transequatorial migrations by basking sharks in the Western Atlantic ocean. Curr. Biol. 19, 1019–1022. doi: 10.1016/j.cub.2009.04.019
Sorenson L., Santini F., Alfaro M. E. (2014). The effect of habitat on modern shark diversification. J. Evol. Biol. 27, 1536–1548. doi: 10.1111/jeb.12405
Sorochan K. A., Plourde S., Baumgartner M. F., Johnson C. L. (2021). Availability, supply, and aggregation of prey (Calanus spp.) in foraging areas of the north Atlantic right whale (Eubalaena glacialis). ICES J. Mar. Sci. 78, 3498–3520. doi: 10.1093/icesjms/fsab200
Sorochan K. A., Plourde S., Morse R., Pepin P., Runge J., Thompson C., et al. (2019). North Atlantic right whale (Eubalaena glacialis) and its food: (II) interannual variations in biomass of calanus spp. on western north Atlantic shelves. J. Plankton Res. 41, 22. doi: 10.1093/plankt/fbz044
Southall E. J., Sims D. W., Witt M. J., Metcalfe J. D. (2006). Seasonal space-use estimates of basking sharks in relation to protection and political–economic zones in the north-east Atlantic. Biol. Conserv. 132, 33–39. doi: 10.1016/j.biocon.2006.03.011
Speed C., Field I., Meekan M., Bradshaw C. (2010). Complexities of coastal shark movements and their implications for management. Mar. Ecol. Prog. Ser. 408, 275–293. doi: 10.3354/meps08581
Thieurmel B., Elmarhraoui A. (2019) Suncalc: Compute sun position, sunlight phases, moon position and lunar phase. Available at: https://CRAN.R-project.org/package=suncalc.
Thums M., Meekan M., Stevens J., Wilson S., Polovina J. (2013). Evidence for behavioural thermoregulation by the world’s largest fish. J. R. Soc Interface 10, 20120477. doi: 10.1098/rsif.2012.0477
Tibshirani R., Walther G., Hastie T. (2001). Estimating the number of clusters in a data set via the gap statistic. J. R. Stat. Soc Ser. B Stat. Methodol. 63, 411–423. doi: 10.1111/1467-9868.00293
Tormene P., Giorgino T., Quaglini S., Stefanelli M. (2008). Matching incomplete time series with dynamic time warping: An algorithm and an application to post-stroke rehabilitation. Artif. Intell. Med. 45, 11–34. doi: 10.1016/j.artmed.2008.11.007
van den Boogaart K. G., Tolosana-Delgado R., Bren M. (2021) Compositions: Compositional data analysis. Available at: https://CRAN.R-project.org/package=compositions.
van der Hoop J. M., Nousek-McGregor A. E., Nowacek D. P., Parks S. E., Tyack P., Madsen P. T. (2019). Foraging rates of ram-filtering north Atlantic right whales. Funct. Ecol. 33, 1290–1306. doi: 10.1111/1365-2435.13357
Vanderlaan A., Taggart C., Serdynska A., Kenney R., Brown M. (2008). Reducing the risk of lethal encounters: vessels and right whales in the bay of fundy and on the scotian shelf. Endanger. Species Res. 4, 283–297. doi: 10.3354/esr00083
Welton B. J. (2015). A new species of late early Miocene cetorhinus (Lamniformes: Cetorhinidae) from the Astoria formation of Oregon, and coeval cetorhinus from Washington and California. Contrib. Sci. 23, 67–89.
Weng K. C., Boustany A. M., Pyle P., Anderson S. D., Brown A., Block B. A. (2007). Migration and habitat of white sharks (Carcharodon carcharias) in the eastern pacific ocean. Mar. Biol. 152, 877–894. doi: 10.1007/s00227-007-0739-4
Westgate A. J., Head A. J., Berggren P., Koopman H. N., Gaskin D. E. (1995). Diving behaviour of harbour porpoises, phocoena phocoena. Can. J. Fish. Aquat. Sci. 52, 1064–1073. doi: 10.1139/f95-104
Westgate A., Koopman H., Siders Z., Wong S., Ronconi R. (2014). Population density and abundance of basking sharks cetorhinus maximus in the lower bay of fundy, Canada. Endanger. Species Res. 23, 177–185. doi: 10.3354/esr00567
Wilson S., Block B. (2009). Habitat use in Atlantic bluefin tuna thunnus thynnus inferred from diving behavior. Endanger. Species Res. 10, 355–367. doi: 10.3354/esr00240
Wilson R. P., White C. R., Quintana F., Halsey L. G., Liebsch N., Martin G. R., et al. (2006). Moving towards acceleration for estimates of activity-specific metabolic rate in free-living animals: the case of the cormorant: Activity-specific metabolic rate in free-living animals. J. Anim. Ecol. 75, 1081–1090. doi: 10.1111/j.1365-2656.2006.01127.x
Keywords: biotelemetry, time-depth recorder (TDR), finite mixture model (FMM), dynamic time warp (DTW), filter feeder shark
Citation: Siders ZA, Westgate AJ, Bell KR and Koopman HN (2022) Highly variable basking shark (Cetorhinus maximus) diving behavior in the lower Bay of Fundy, Canada. Front. Mar. Sci. 9:976857. doi: 10.3389/fmars.2022.976857
Received: 23 June 2022; Accepted: 15 September 2022;
Published: 03 October 2022.
Edited by:
Nuno Queiroz, Centro de Investigacao em Biodiversidade e Recursos Geneticos (CIBIO-InBIO), PortugalReviewed by:
Aaron Carlisle, University of Delaware, United StatesCopyright © 2022 Siders, Westgate, Bell and Koopman. This is an open-access article distributed under the terms of the Creative Commons Attribution License (CC BY). The use, distribution or reproduction in other forums is permitted, provided the original author(s) and the copyright owner(s) are credited and that the original publication in this journal is cited, in accordance with accepted academic practice. No use, distribution or reproduction is permitted which does not comply with these terms.
*Correspondence: Zachary A. Siders, enNpZGVyc0B1ZmwuZWR1
Disclaimer: All claims expressed in this article are solely those of the authors and do not necessarily represent those of their affiliated organizations, or those of the publisher, the editors and the reviewers. Any product that may be evaluated in this article or claim that may be made by its manufacturer is not guaranteed or endorsed by the publisher.
Research integrity at Frontiers
Learn more about the work of our research integrity team to safeguard the quality of each article we publish.