- 1State Key Laboratory of Marine Environmental Science, College of Ocean and Earth Sciences, Xiamen University, Xiamen, China
- 2Southern Marine Science and Engineering Guangdong Laboratory (Zhuhai), Zhuhai, China
- 3Department of Atmospheric and Oceanic Science, University of Maryland, College Park, MD, United States
This paper overviews progress in the research of water mass classification in the China seas, consisting of the Bohai Sea, the Yellow Sea, the East China Sea, the Taiwan Strait and the South China Sea. So far, oceanographers have achieved systematic research results in terms of the concept and definition, theory and method, characteristics and variation of water masses in the China seas. Here 3-D visualized diagrams are developed to illustrate spatial distributions of classified water masses in the China seas. Meanwhile, core values or ranges of temperature and salinity for individual water mass are integrated. Seasonal variations and formation mechanisms of water masses are briefly analyzed.
Introduction
A water mass is a finite or infinite body of water with definite and conservative physicochemical characteristics (Defant, 1929). Being regarded as a basic property, the water mass is one of the earliest research topics of regional oceanography. Compared with water masses in the deep basin, the water masses in the coastal oceans and the marginal seas generally have more complex structure, smaller size, and stronger seasonal variation. Studies of water masses mainly focus on the division of water mass boundaries, especially the mixing zones between water masses, and the determination of their variations (Yu, 1989).
The China seas (Figure 1) consist of the Bohai Sea (BS), the Yellow Sea (YS), the East China Sea (ECS), the Taiwan Strait (TS) and the South China Sea (SCS). Due to different geographical environment and hydrologic characteristics, method for the water mass analysis varies in the case of individual sea. Since 1950s, many oceanographers, especially the Chinese investigators, have done a lot of research on water masses in the China seas and obtained abundant results (Wei et al., 2019). However, except for the overview (Yu, 1989) on the analysis methods of water mass, there is hardly a comprehensive review on the research progress of water mass analysis in the China seas.
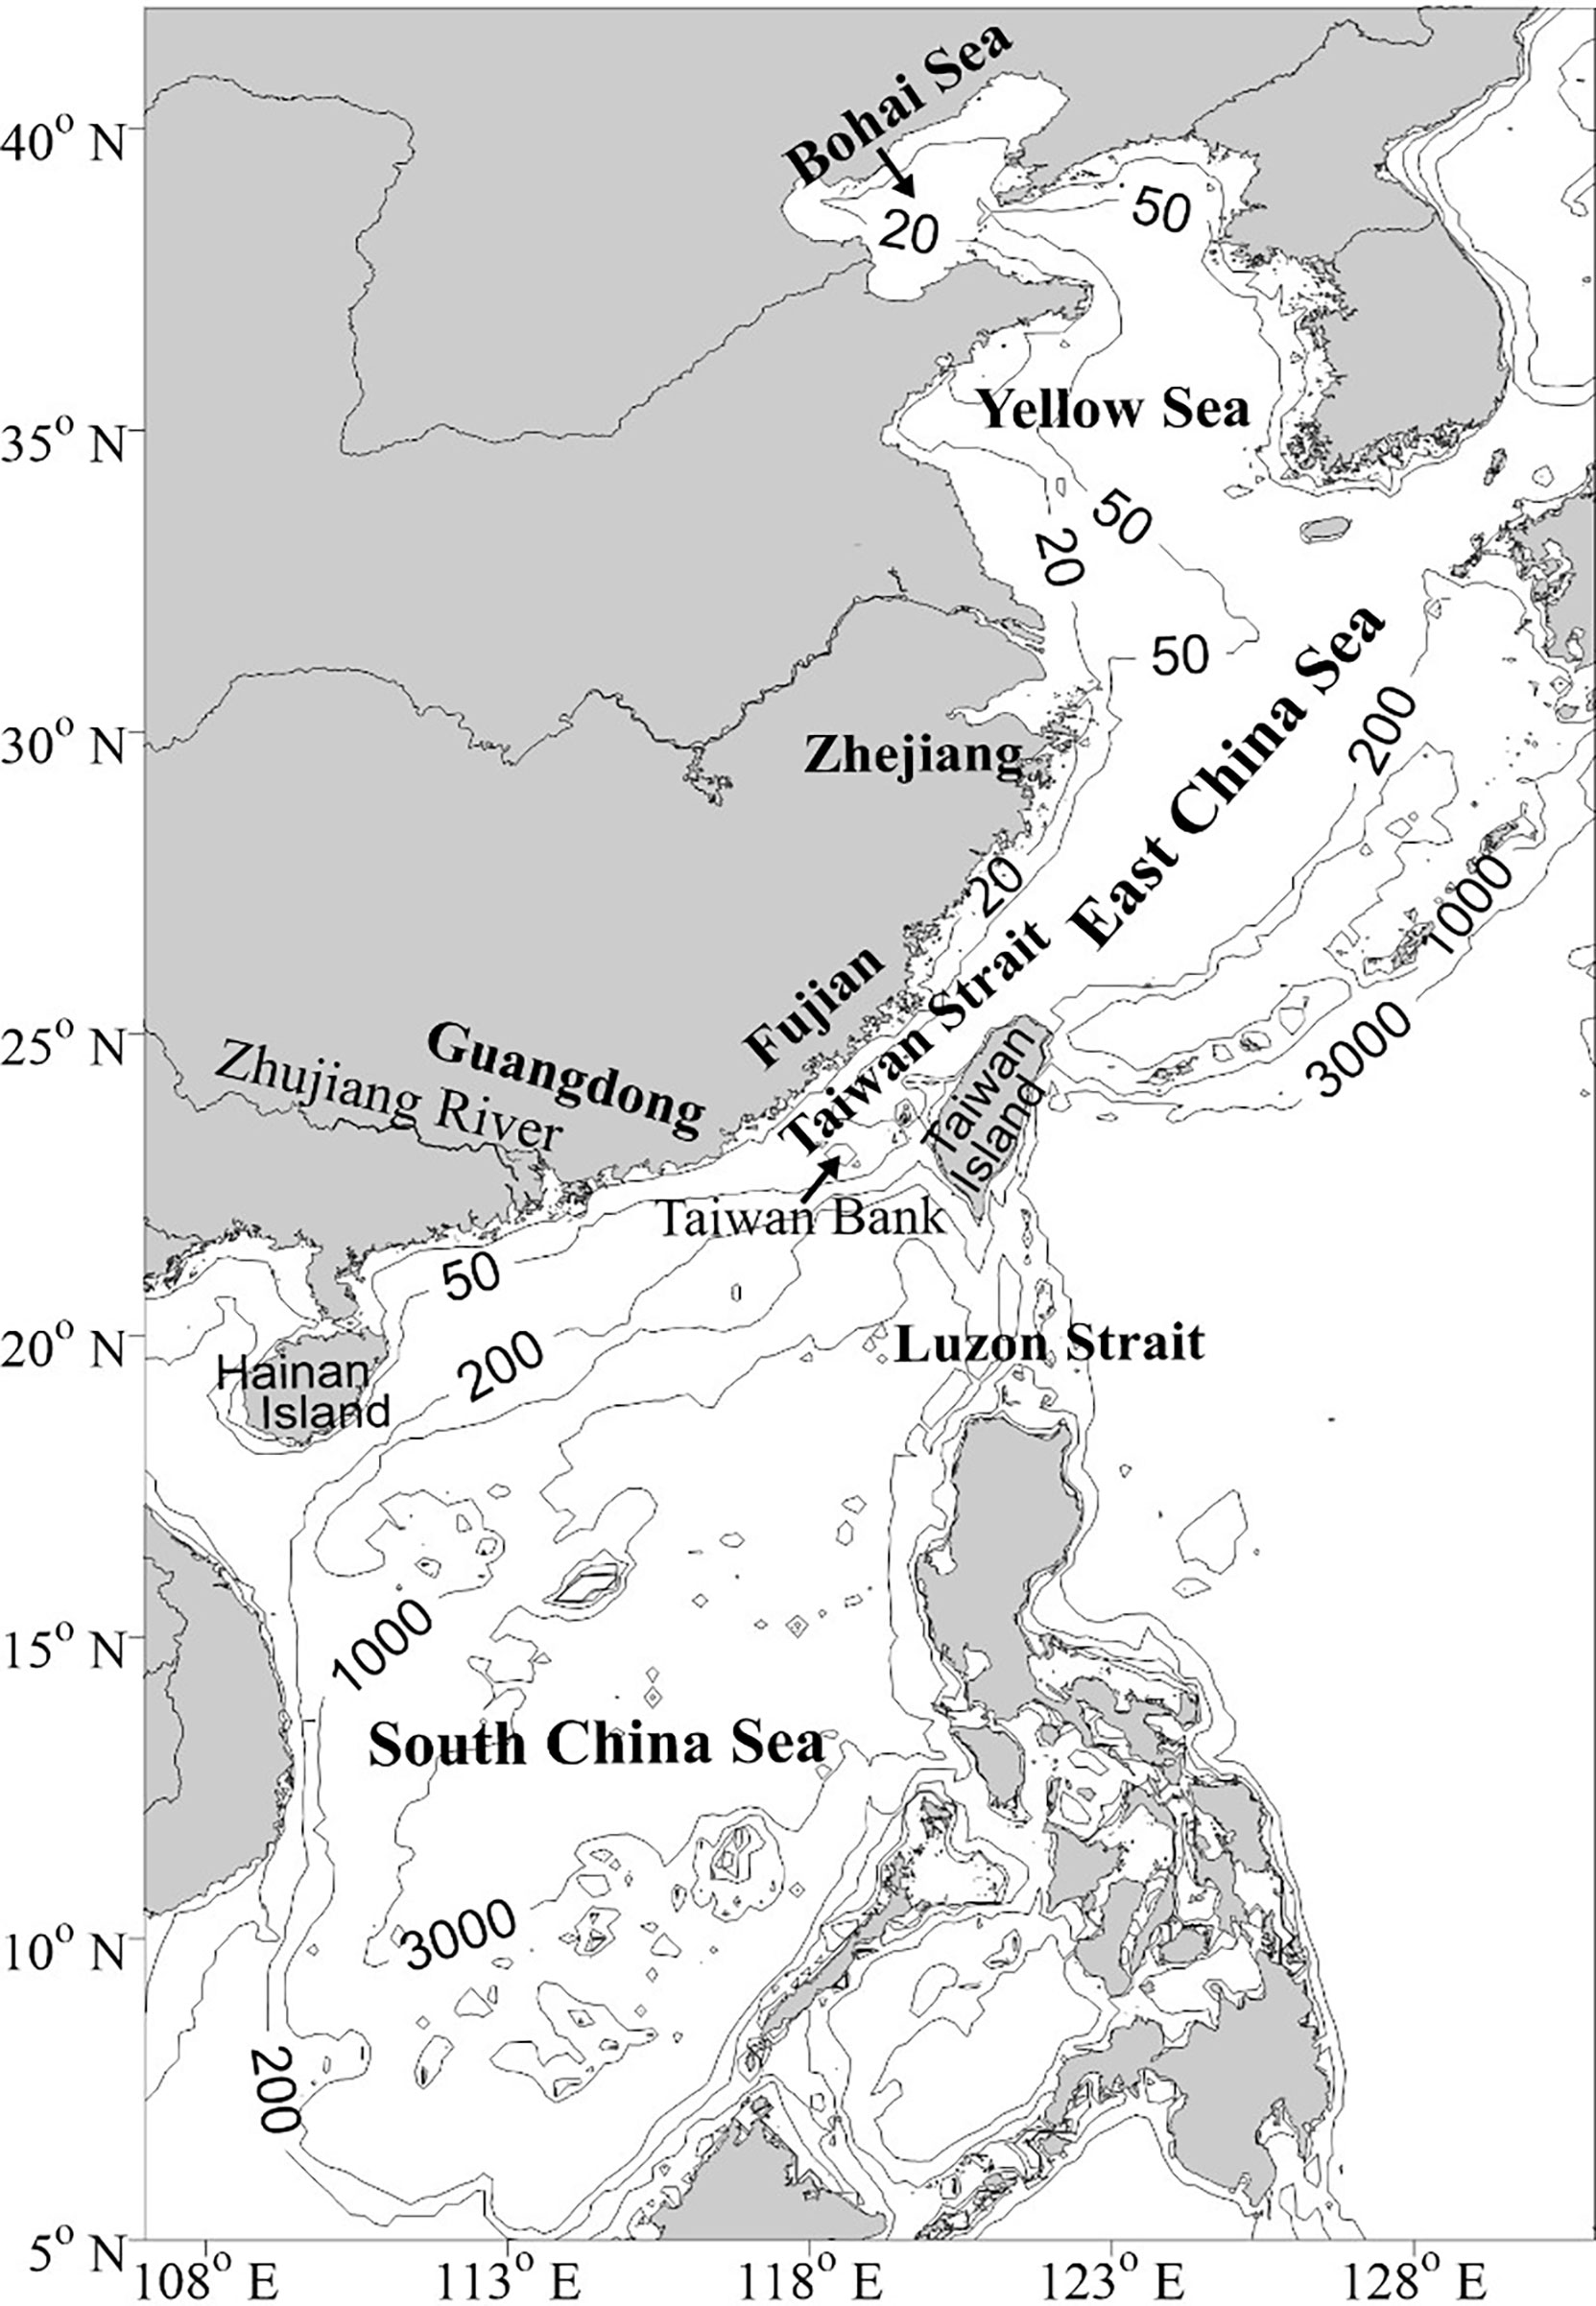
Figure 1 Research domain and bathymetry. The bathymetry data is from ETOPO2 (U.S. National Geophysical Data Center).
This paper aims to provide a comprehensive understanding of the updated results on water mass research in the China seas, by presenting the major results of water mass classification in the China seas, which includes 3-D visualized diagrams of spatial distributions of classified water masses and the core values or ranges of temperature and salinity of water masses in the individual sea. Finally, a summary is given.
Brief history of water mass research in China
As the Chinese oceanographers have been conducting the water mass analysis in the China seas for decades, here we firstly give a brief history of water mass research in China.
From 1958 to 1964, China carried out a key project “National Comprehensive Oceanographic Survey”. One of the important project results is a scientific report “Water system in the Chinese coastal seas”, which contains comprehensive and systematic analyses on distributions and variations of water masses in the China seas (Li and Su, 2000). During this period, He et al. (1959) systematically described the hydrological characteristics of the YS cold water mass using in situ data. Guan (1963) further analyzed the circulation characteristics of the water mass. Mao et al. (1963) determined the salinity distribution of the diluted water from the Changjiang River based on the cruise-measured data. Mao et al. (1964) quantitatively analyzed the water mass in the shallow sea areas of the southern YS and northern ECS using T-S relationship. Xu (1965) analyzed the mixing between water masses, and raised a concept of mixing endpoint using T-S diagrammatic method.
From 1980 to 2009, water mass research entered a prosperous period in China. The investigators conducted more in-depth research on water masses of the China seas with a variety of water mass analysis methods, and achieved many important results. As the water mass modifies strongly in shallow waters, Su (1980) proposed a concept of “modified water mass”. Su et al. (1983) applied the concept to the classification of the water mass in the shallow sea. Later, investigators developed some other classification and discrimination methods to analyze the water masses in the China seas. During this period, important academic achievements are included in the “S1 Special Issue” on water mass published in the Journal of Qingdao Ocean University in 1989, the monographs such as “Water Mass Analysis” (Li and Su, 2000), “China Offshore Hydrology” (Su and Yuan, 2005), and”Regional Oceanography in China Offshore Areas” (Sun, 2006).
From 2005 to 2011, the State Oceanic Administration of China supervised the project “Comprehensive Investigation and Evaluation of the China Seas”. Abundant and high precision cruise survey data were obtained by using advanced technology. In addition, a large number of cruise-measured data were obtained from major and key research projects during the past 20 years. These data provide an important baseline for the water mass analysis, and enhance the new understanding of the distribution and seasonal variation of water mass in the China seas (e.g., Qiao et al., 2012; Xiong et al., 2012; Hu et al., 2020). During this period, the water mass research obtained new insights on the seasonal variation of water masses in the eastern Beibu Gulf (Chen et al., 2011), interannual variation of summertime water masses in the southern TS (Hu et al., 2011), and the formation and evolution of the cold water mass in the YS (Bao et al., 2010; Yuan et al., 2013; Zhu et al., 2017). In addition, some progresses have been made on the water mass classification in the northern SCS (Cheng et al., 2014; Gao et al., 2020), the eddy structure and flow patterns of the intermediate layer in the Luzon Strait (Xie et al., 2011), and the influence and role of Pacific subsurface water on the water mass in the northern SCS (Zhu et al., 2019).
Table 1 lists a collection of papers on water mass analysis in the China seas from 1980 to 2020 according to the analysis methods and study areas.
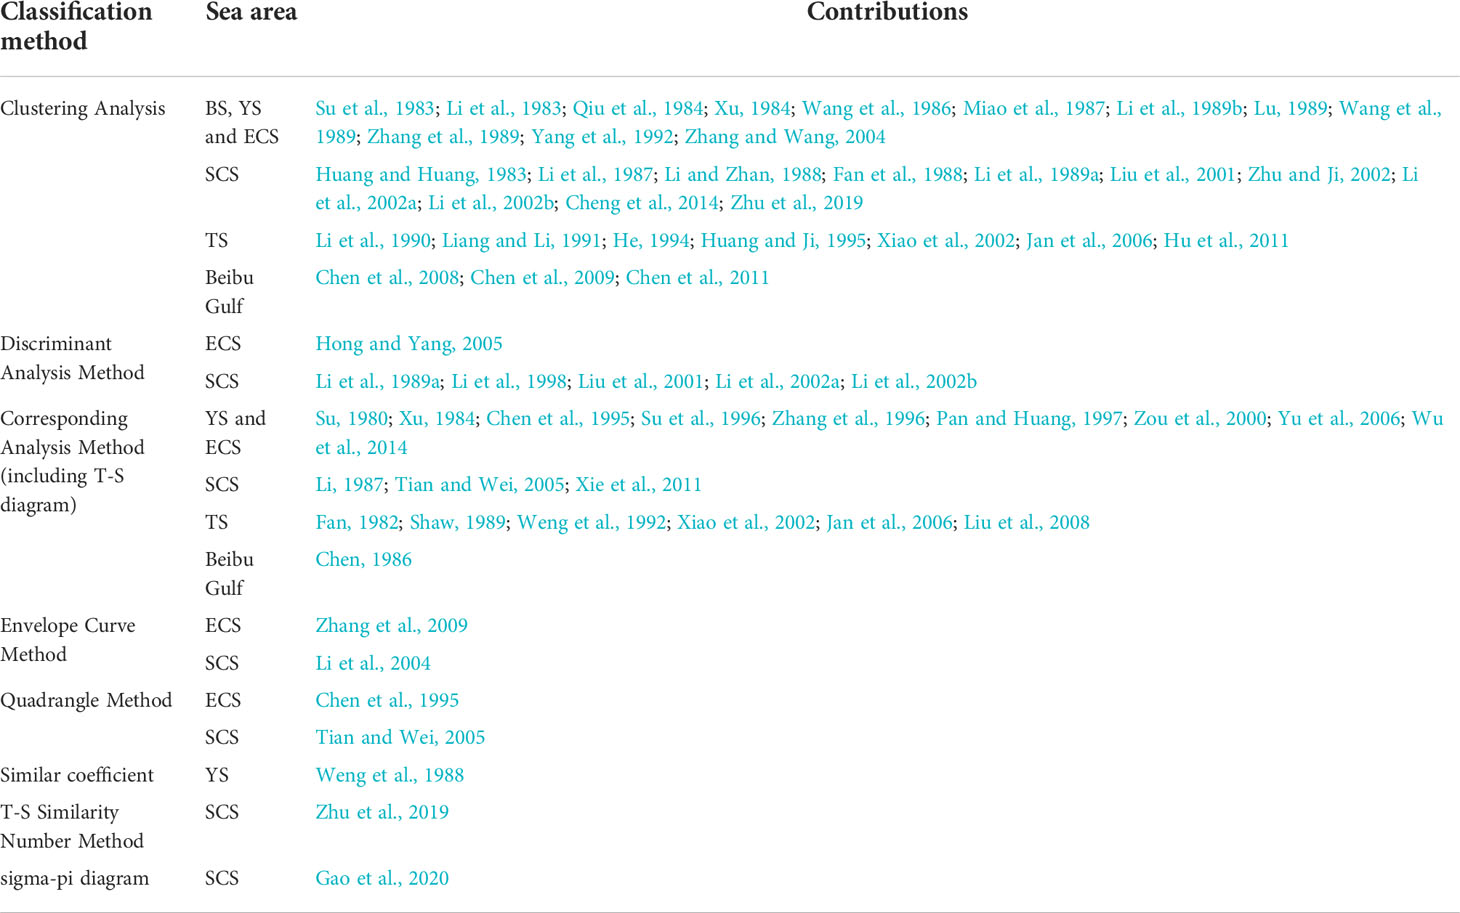
Table 1 A collection of papers on water mass analysis by classification method and sea areas in the China seas from 1980 to 2020.
Water masses in the Bohai Sea, the Yellow Sea, and the East China Sea
The BS, the YS and the ECS are geographically adjacent to each other, thus, they are often treated as a whole in the water mass analysis. Based on the previous results, we illustrate 3-D schematic diagrams of water masses in the surface and near-bottom layers of the BS, the YS and the ECS in winter (December to February of the following year) and summer (June to August) (Figure 2), and then list the temperature and salinity ranges of individual water mass in Table 2.
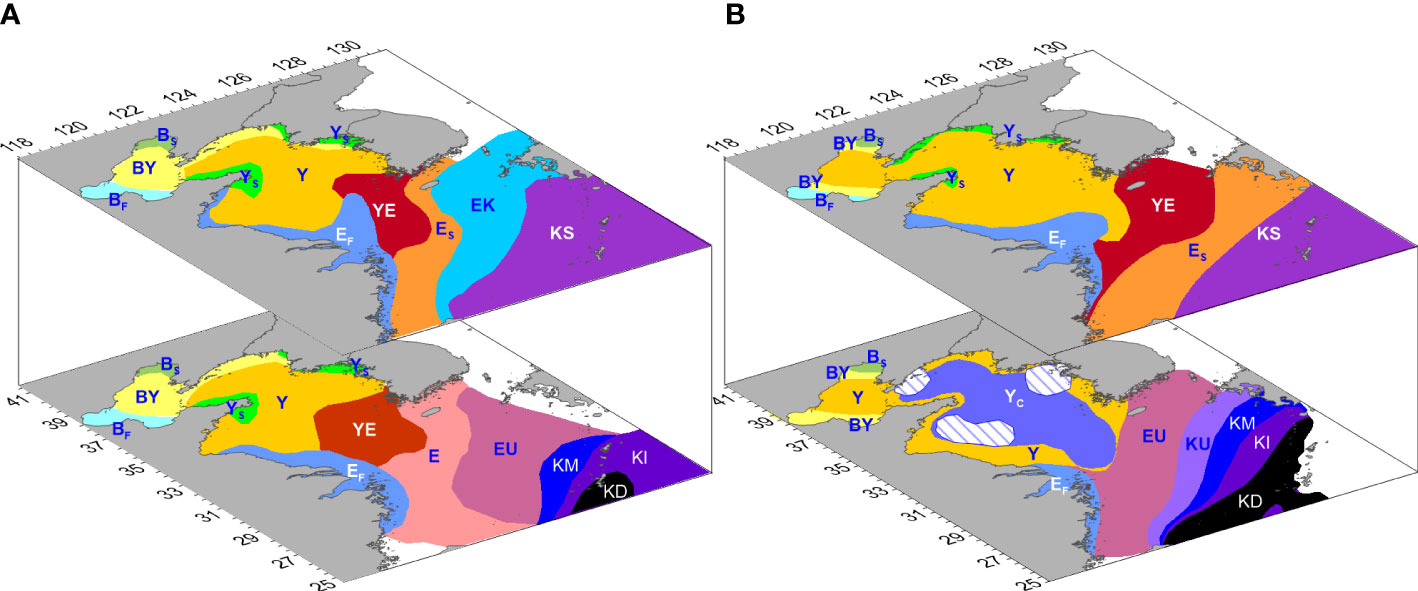
Figure 2 Water mass distribution in surface and bottom layers of the Bohai Sea, the Yellow Sea and the East China Sea in (A) winter and (B) summer. Yellow-BY, Dull green-BS, Ice blue-BF, Deep yellow-Y, Green-YS, Electric blue-YC, Baby blue-EF, Red-YE, Orange-ES, Bright blue-EK, Violet-KS, Pink-E, Dusty rose-EU, Light violet-KU, Blue-KM, Dark violet-KI, Black-KD. Shadow areas-YC cold centers. (Redrawn and integrated from: Su et al., 1983; Qiu et al., 1984; Miao et al., 1987; Li et al., 1989a; Lu, 1989; Zhang et al., 1996; Pan and Huang, 1997; Li and Su, 2000).
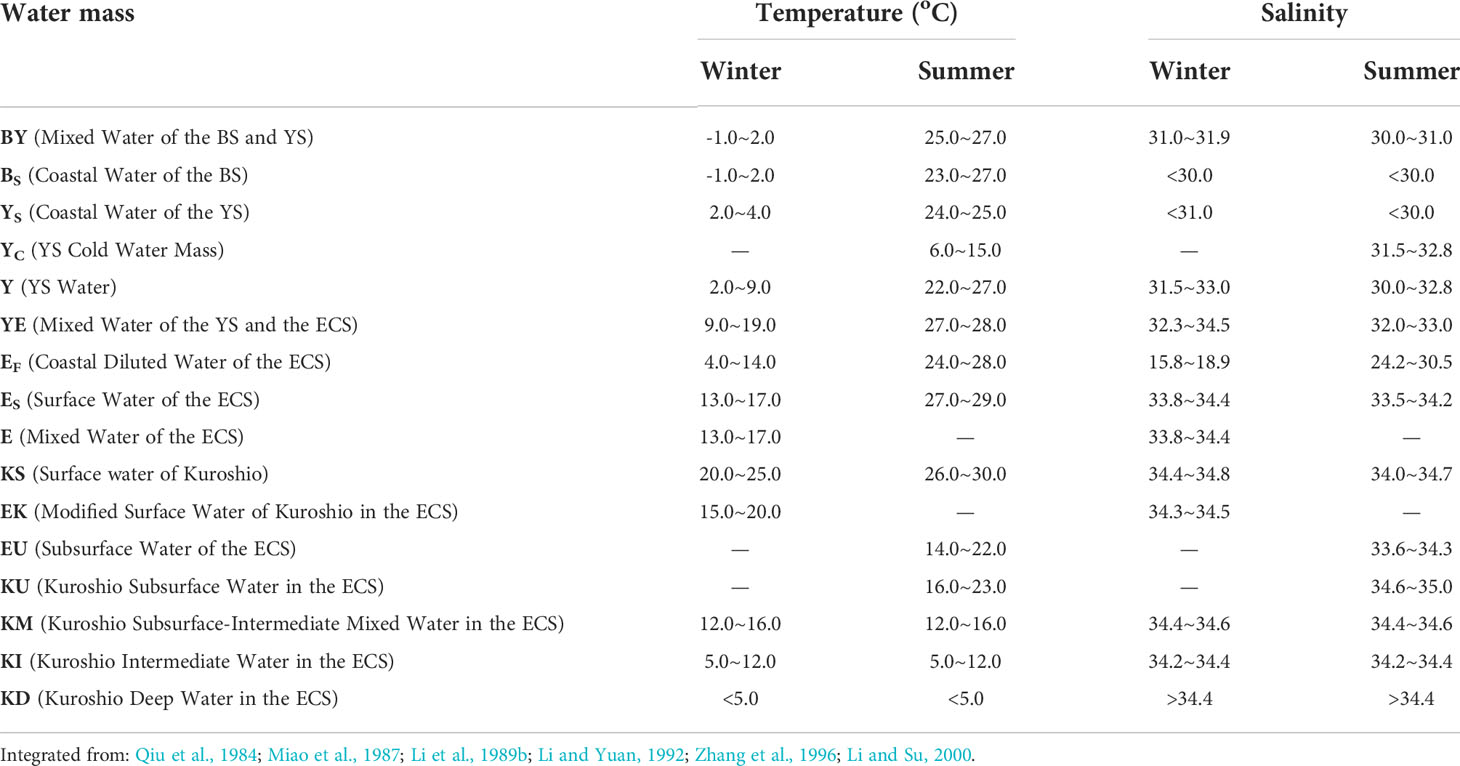
Table 2 Temperature and salinity ranges of water masses in the Bohai Sea, the Yellow Sea and the East China Sea.
From Figure 2A, one can see that in winter, the surface layer of the BS, YS and ECS is classified into 9 water masses: ① Mixed Water of the BS and YS (BY), ② Coastal Water of the BS (BS), ③ Coastal Water of the YS (YS), ④ YS Water (Y), ⑤ Mixed Water of the YS and the ECS (YE), also known as the YS Warm Current Water, ⑥ Coastal Diluted Water of the ECS (EF), ⑦ Surface Water of the ECS (ES), ⑧ Modified Surface Water of Kuroshio in the ECS (EK), and ⑨ Surface Water of Kuroshio (KS). There are 11 water masses in the bottom layer (or near-bottom layer): ① BY, ② BS, ③ YS, ④ Y, ⑤ YE, ⑥ EF, ⑦ Mixed Water of the ECS (E), which is included in the mixed water system (Li et al., 1989b) due to strong mixing in winter although its temperature and salinity characteristics are basically consistent with those of ES (Li and Su, 2000), ⑧ Subsurface Water of the ECS (EU), ⑨ Kuroshio Subsurface-Intermediate Mixed Water in the ECS (KM), ⑩ Kuroshio Intermediate Water in the ECS (KI), and ⑪ Kuroshio Deep Water in the ECS (KD).
As shown in Figure 2B, in summer, the surface layer of the BS, the YS and the ECS is classified into 8 water masses: ① BY, ② BS, ③ YS, ④ Y, ⑤ YE, ⑥ EF, ⑦ ES and ⑧ KS. There are 10 water masses in the bottom layer: ① BY, ② BS, ③ Y, ④ YS Cold Water Mass (YC), ⑤ EF, ⑥ EU, ⑦ Kuroshio Subsurface Water in the ECS (KU), ⑧ KM, ⑨ KI and ⑩ KD.
From Figure 2A, one can see that due to strong vertical mixing in winter, the surface and bottom water masses in the BS and the YS are basically the same. The water with low-temperature and low-salinity is distributed in the coastal area, while the mixed water is distributed in the central portion. EF occupies the coastal water west of the YS and the ECS. YE is distributed in the offshore water area between the YS and the ECS. ES, EK and KS are distributed in the surface layer of the ECS from near to far, with the temperature and salinity gradually increasing, i.e., the temperature ranges from 13.0~17.0°C to 15.0~20.0°C, and then to 20.0~25.0°C, while the salinity ranges from 33.8~34.4 to 34.3~34.5, then to 34.4~34.8. E, EU, KM, KI and KD are distributed in the bottom layer from near to far.
In summer (Figure 2B), the extent of BS or YS reduces, and the BY recedes to the two sides, presenting a narrow zonal distribution. Y almost covers the surface layer of the whole YS and even the BS. In the warm half year, the ocean temperature is gradually increased by solar radiation and the salinity is reduced by precipitation in the upper layer, which intensifies the thermocline and forms the vertical overlapping pattern of Y and YC water masses in most sea areas of the YS (Li and Su, 2000). YC is widely distributed below the thermocline in the bottom layer of the YS (Zhao, 1985), and characterized by low temperature within a range of 6.0~15.0°C (He et al., 1959; Guan, 1963; Li and Yuan, 1992). YE, ES and KS are distributed in the surface layer, and the temperature and the salinity increase from near to far with the salinity ranging from 32.0~33.0 to 33.5~34.2, then to 34.0~34.7. EU, KU, KM, KI and KD are distributed in the bottom layer from near to far.
It is worth mentioning that thermohaline properties of EK in winter look similar to those of KU in summer, but their formation mechanisms are different. KU belongs to the offshore water system, while EK belongs to the mixed water system influenced by the Taiwan Warm Current, the Tsushima Current and the mixed water on the ECS shelf. In summer, the upper EK water mass is completely modified and integrated into ES, while the lower part is integrated into EU (Li and Su, 2000).
As a typical water mass in the YS, YC forms and matures in spring, weakens in autumn and renews in winter year after year (Zhu et al., 2017). YC has three low temperature centers: the northern YS cold center, the eastern and western cold centers in the southern YS as shown as shaded areas in Figure 2B (Weng et al., 1988; Yu et al., 2006). The average location of the cold center in the northern YS is near 38°14′N, 122°12′E, where the temperature range is about 4.0~7.4°C, and the salinity range is about 31.9~32.8 (Weng et al., 1988). Previous studies have also shown that the boundary of YC is controlled by tidal mixing (Zhao, 1985). In addition, the sea-air heat flux in the previous winter has a decisive influence on the intensity of YC (Zhu et al., 2017).
Water masses in the Taiwan Strait
The observational data usually did not cover the whole TS, so the study of water mass in the TS was carried out relatively late compared with that in other areas of the China seas (Table 1). According to the seasonal variations of temperature, salinity and water mass structure by Li et al. (1990); Weng et al. (1992), (Hu et al., 1999a; Hu et al., 1999b; Hu et al., 2003; Hu et al., 2011; Hu et al., 2020), Xiao et al. (2002), and Jan et al. (2006), the TS can be classified into 9 main water masses: Min-Zhe Coastal Water (MZCW), Upwelling Water (UW), Mixed China Coastal Water (MCCW), Zhujiang River Diluted Water (ZJW), Northern Taiwan Mixed Water (NTMW), SCS Surface Water (SCSSW), SCS Water (SCSW), Kuroshio Branch Water (KBW), and Subsurface Kuroshio Branch Water (SB-KBW). According to previous research, the distribution of water masses in the TS is shown in Figure 3, and the temperature and the salinity ranges of individual water mass are summarized in Table 3. In the previous literatures, the water masses in winter (December to February of the following year) and summer (June to August) were relatively complete, while the distribution of water masses in spring or autumn was mainly described qualitatively. Therefore, Figure 3 only shows the distributions of the water masses in winter and summer.
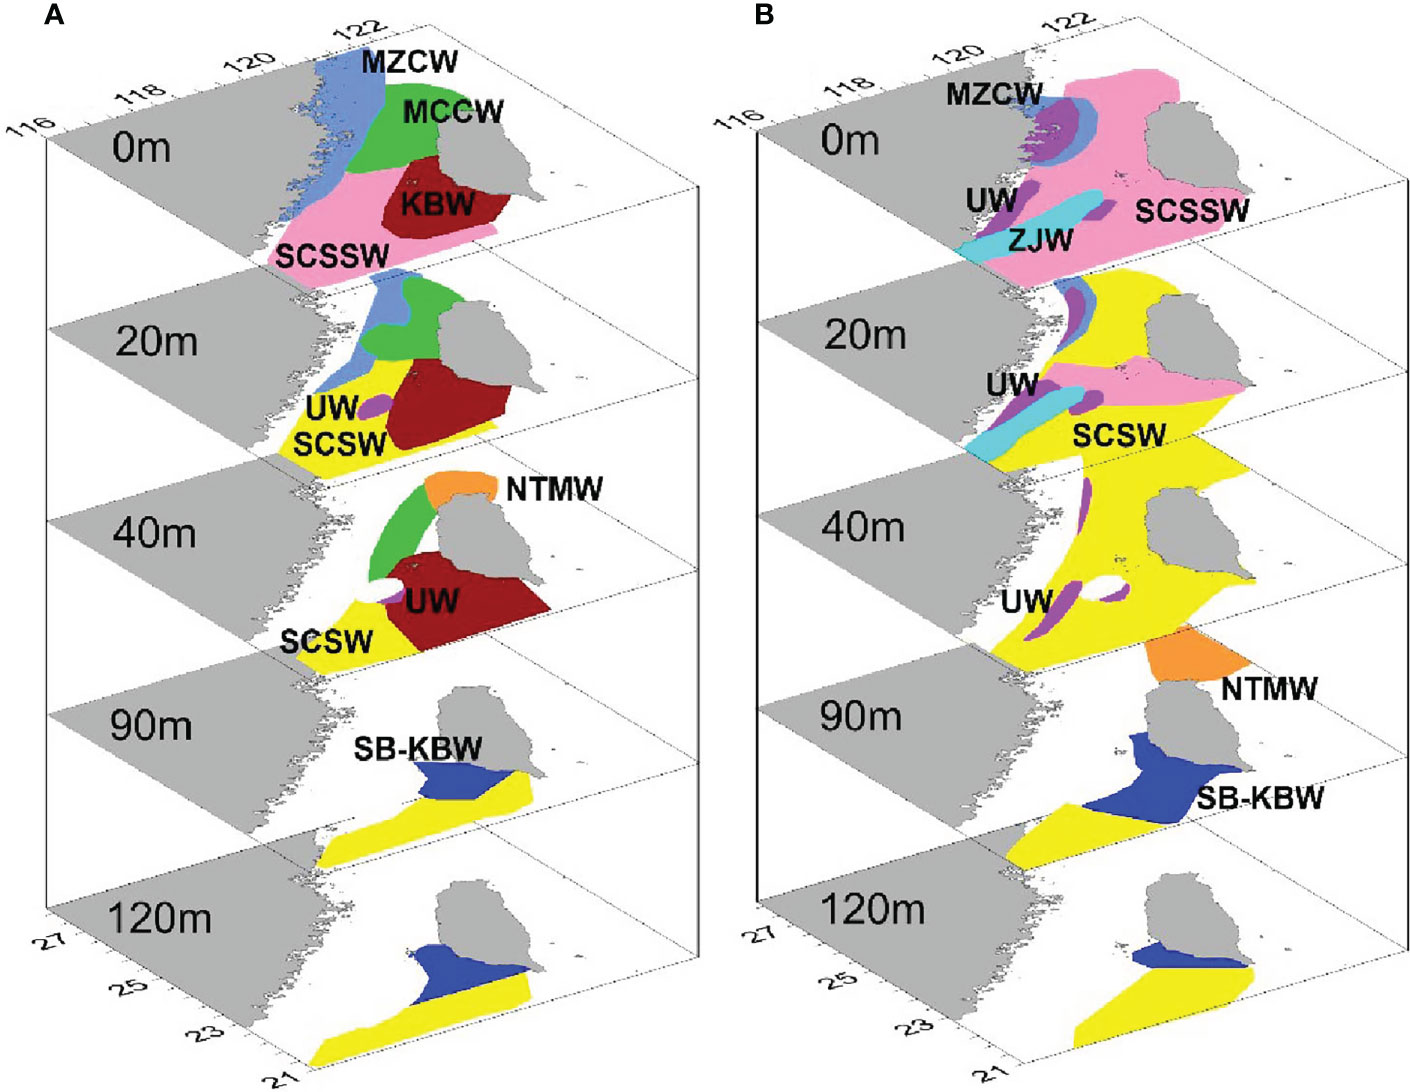
Figure 3 Water mass distribution in the Taiwan Strait in (A) winter and (B) summer. Light blue-MZCW, Green-MCCW, Violet-UW, Orange-NTMW, Pink-SCSSW, Yellow-SCSW, Dark Red-KBW, Blue-SB-KBW, Bright blue-ZJW. (Redrawn and integrated from: Weng et al., 1992; Xiao et al., 2002; Hu et al., 2003; Jan et al., 2006; Hu et al., 2011; Hu et al., 2020).
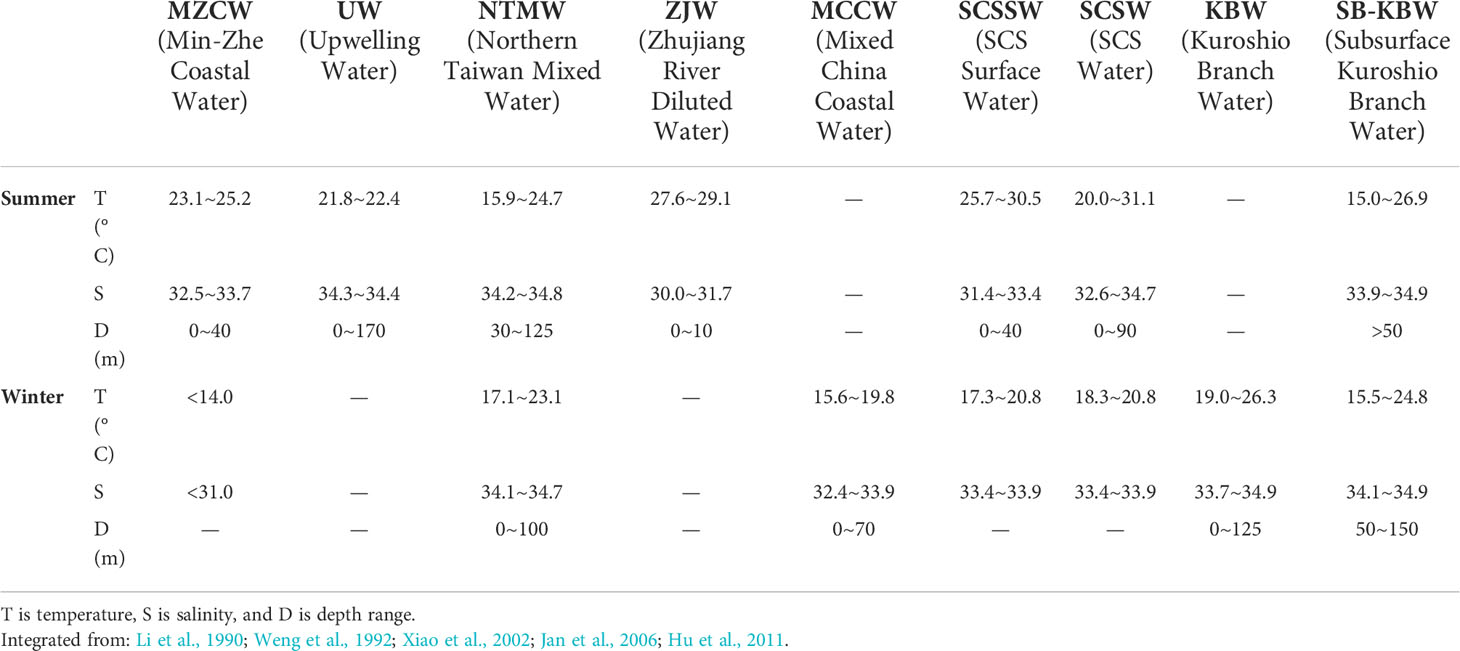
Table 3 Ranges of temperature, salinity, depth range of water masses in the Taiwan Strait in summer and winter.
According to Figure 3 and Table 3, MZCW, with low temperature and low salinity, is distributed above 20 m near the northwestern coast of the TS. Weng et al. (1992) and Xiao et al. (2002) pointed out that MZCW exists in autumn, winter and spring, but disappears in summer. However, Jan et al. (2006) found that sometimes MZCW still exists in June.
MCCW appears from autumn to the next spring (October-May), and is distributed between MZCW and KBW. Its temperature and salinity are also between the two, i.e., the MCCW distribution mainly depends on the extents of MZCW and KBW. In winter, the northbound KBW meets the southbound MCCW near the middle strait. The weakening of the northeasterly monsoon in March further causes the retreating of MCCW and the spreading of KBW. In May, KBW extends northward to its maximum extent, covering almost the entire strait. However, KBW disappears in summer and is replaced by SCSW and SCSSW. SCSSW and SCSW are predominant in the entire TS in summer, and are distributed 0~20 m and 20~120 m of the southern TS, respectively from summer to winter. The temperature and salinity ranges of SCSSW in summer are 25.7~30.5°C and 31.4~34.3, respectively.
UW is characterized by low temperature and high salinity. In summer, it is distributed in the upwelling zone along the coasts of eastern Guangdong and southern Fujian, northern Fujian and south of the Taiwan Bank. The mean core values of temperature and salinity in summer are 21.9°C and 34.4 (Xiao et al., 2002; Hu et al., 2003; Hu et al., 2011). In other seasons, UW may also appear around the Taiwan Bank (Hu et al., 2003).
Because of prevailing southwesterly monsoon in summer, the diluted water from the Zhujiang River Estuary extends eastward to the Taiwan Bank and forms ZJW with a thickness of more than 10 m. The temperature and salinity ranges are 27.6~29.1°C and 30.0~31.7, respectively.
NTMW and SB-KBW are two water masses in the lower layer of TS. NTMW is distributed near the northeastern corner of Taiwan Island all year round. As affected by the Kuroshio, it is characterized by high temperature and high salinity, and is located at the depths of 40~90 m with the depth varying greatly from season to season. SB-KBW appears throughout the year at the depth around 100 m in the southeastern TS.
Finally, it is worth mentioning that the KBW in spring, autumn and winter (Jan et al., 2006) is actually similar to the upper warm water in the southern TS (Weng et al., 1992; Xiao et al., 2002; Hu et al., 2011), while the upper warm water in the southern TS in summer is classified into two water masses, SCSW and SCSSW, by Jan et al. (2006). In addition, the SB-KBW described in Jan et al. (2006) is similar to the lower warm water of the southern TS (Weng et al., 1992; Xiao et al., 2002) or the subsurface water mass (Hu et al., 2011). The characteristic values of individual mass listed in Table 3 are derived from the combined statistics of the similar water masses mentioned above.
Water masses in the South China Sea
The SCS is a semi-enclosed marginal sea of the Northwest Pacific, connecting with the Pacific Ocean mainly through the Luzon Strait. As affected by the frequent Pacific water intrusion, abundant runoff, seasonal monsoon wind and complex basin topography, water masses in the SCS are characterized by complex structure and seasonal variation. Since most studies focused on the water masses of the whole SCS in winter (December to February of the following year) and summer (June to August), the 3-D distribution diagrams only show the classifications in winter and summer. As listed in Table 1, most of investigators classified the whole SCS into 10 main water masses by clustering analysis, corresponding analysis, discriminant analysis, T-S similarity and other methods. These water masses are: Diluted Water (F), SCS Surface Water (S), Surface-Subsurface Mixed Water (M), SCS Subsurface Water (US), Northwest Pacific Subsurface Water (UP), Kuroshio Surface Water (KS), Subsurface-Intermediate Mixed Water (UI), Intermediate Water (I), Deep Water (D) and Bottom Water (B). Figure 4 integrates distribution of the SCS water masses above 2000 m. Table 4 lists statistics of the temperature and salinity ranges (or core values) of individual water mass.
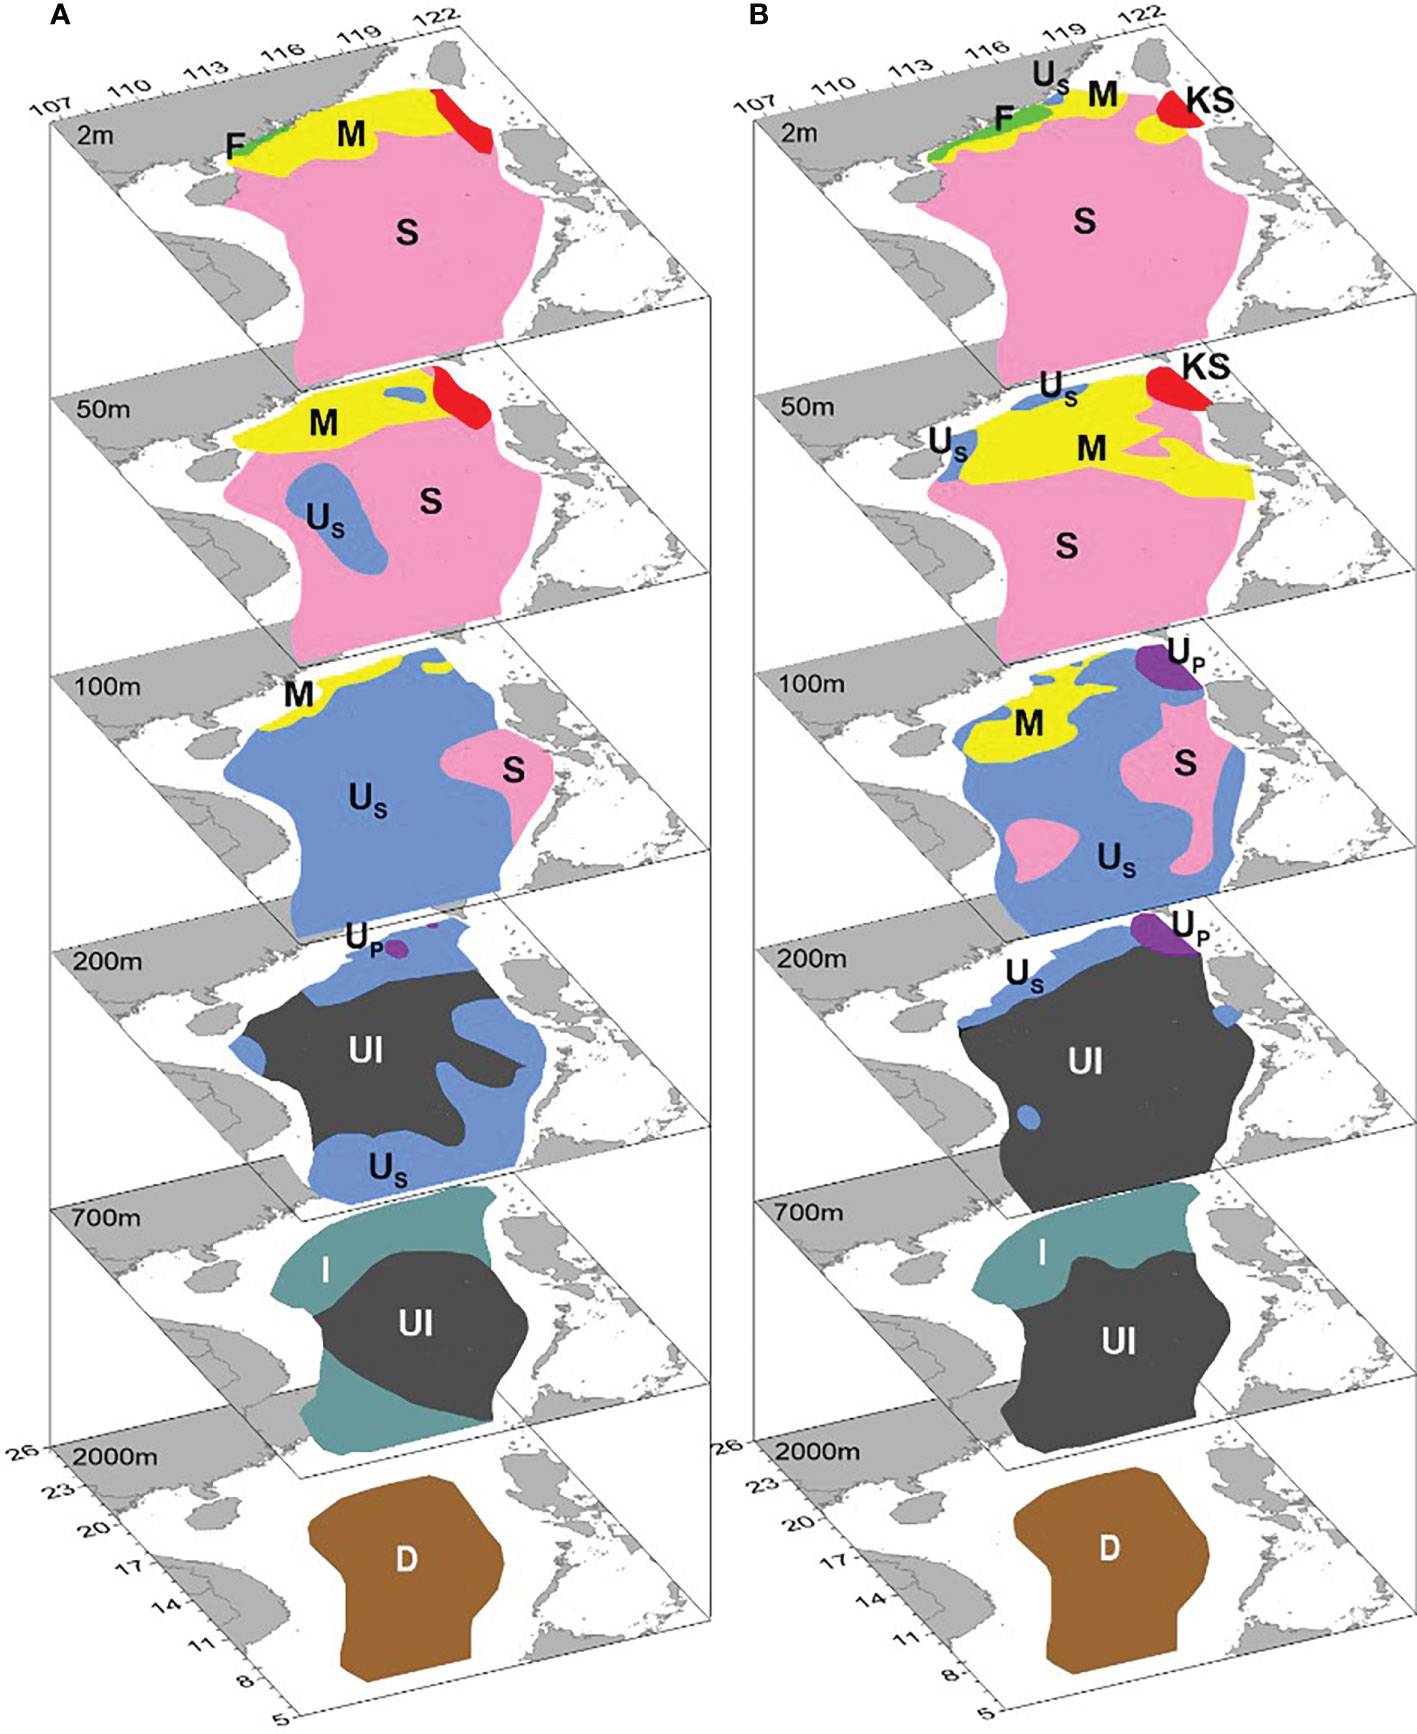
Figure 4 Water mass distribution in the South China Sea in (A) winter and (B) summer. Green: Diluted Water (F); Pink: SCS Surface Water (S); Yellow: Surface-Subsurface Mixed Water (M); Blue: SCS Subsurface Water (US); Violet: Northwest Pacific Subsurface Water (UP); Red: Kuroshio Surface Water (KS); Black: Subsurface-Intermediate Mixed Water (UI); Moss green: Intermediate Water (I); Brown: Deep Water (D). (Redrawn from Li et al., 2002a; Li et al., 2002b; Li et al., 2004; Jan et al., 2006; Zhu et al., 2019).
From Figure 4, in summer, with increased runoff and enhancement of the southwesterly monsoon, F extends eastward and westward from the Zhujiang River Estuary at the same time, forming a zonal distribution along the coast of Guangdong with the salinity lower than 31.7. The extent gradually shrinks to the coast west of the Zhujiang River Estuary in winter. S occupies most of the upper SCS from surface to about 50 m (or 100 m in some areas) in winter and summer. M is the mixed water mass between F and S, or between S and US/UP, so the temperature and salinity are between them with a depth to about 100 m. KS appears in the surface and 50 m layer west of the Luzon Strait, with the temperature and salinity ranging from 19.0-26.3°C, 33.7-34.9 in winter and ranging from 25.4-29.7°C, 34.5-34.8 in summer.
US and UP exist in both winter and summer. US is mostly distributed in the range of 100~300 m with a salinity of up to 34.7. Under the influence of upwelling along the coasts of the eastern Guangdong, southern Fujian and eastern Hainan Island (Hu and Wang, 2016), US can be found in the shallow water above 20 m in summer (Zhu et al., 2019). UP shows relatively high temperature and high salinity properties. In summer, UP is only distributed in the 100~200 m layer west of the Luzon Strait in the forms of “loop” or “extending” without further intrusion into the SCS (Hu et al., 2000). However, UP presents a distribution pattern with several continuously distributed eddies at 175 m in winter (Zhu et al., 2019), which would be the signature of the nonlinear Rossby waves originating from the Pacific and entering the northern SCS through the Luzon Strait (Zheng et al., 2011; Hu et al., 2012; Xie et al., 2016; Xie et al., 2017; Zheng et al., 2017; Zhu et al., 2019).
UI is mainly located at a depth range of 200~700 m. I is located at 500~800 m, which dominates the whole SCS at the 500 m layer, while gradually shrinks northward to the northern SCS at 600-700 m (Li et al., 2004). D appears between 1000~2500 m, and B is located below 2500 m (figure not shown).
Figure 5 is a T-S diagram based on the observational data of the winter cruise in the northern SCS in 2010 (Zhu et al., 2019), to partly illustrate the T-S distribution and separation of typical water masses in winter. It is only for the northern SCS, not representative of the whole SCS.
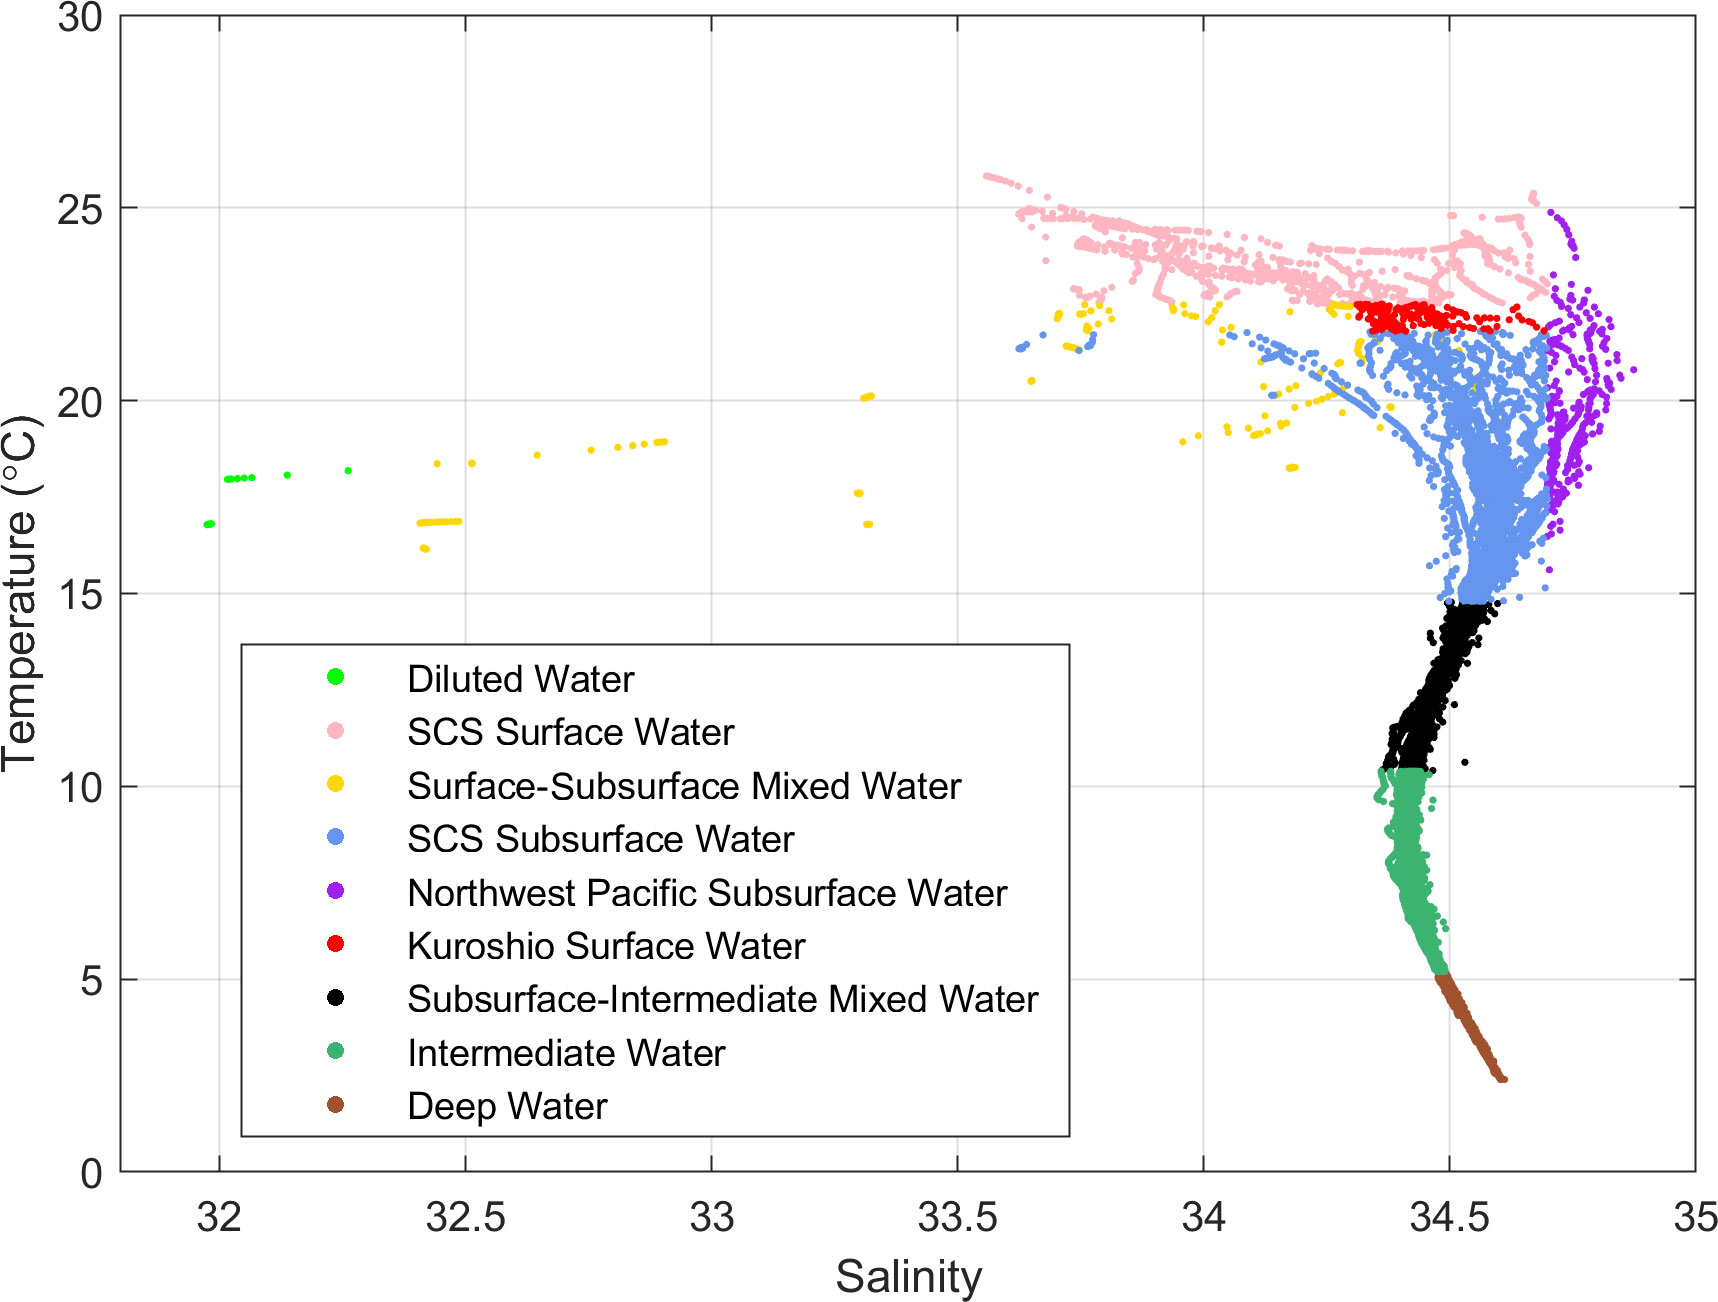
Figure 5 T-S diagram based on the observational data of the winter cruise in the Northern SCS in 2010. Data is from Zhu et al. (2019).
It’s worth noting that Xie et al. (2011) and Gao et al. (2020) classified the I into two water masses: the SCS Intermediate Water (called SCSIW in Xie et al. (2011) or SIW in Gao et al. (2020)), and the Northwest Pacific Intermediate Water (called NPIW in Xie et al. (2011) or WPIW in Gao et al. (2020)). However, the exact boundary of these two water masses is uncertain, so we can only temporarily classify them as one, the Intermediate Water (I).
Summary
In this paper, the previous results of water mass classification in the China seas are summarized according to the analytical method and the research area. 3-D visualization technologies are used to draw schematic diagrams, which show spatial distribution of water masses in individual seas. Meanwhile, core values or ranges of the temperature and the salinity of individual water mass are integrated. The major results are summarized as follows.
(1) In winter, there are 14 water masses in the surface and bottom layers of the Bohai (BS), the Yellow Sea (YS) and the East China Sea (ECS): BY, BS, YS, Y, YE, EF, ES, E, EK, EU, KS, KM, KI and KD. In summer, there are 14 water masses in the surface and bottom layers of the BS, YS and the ECS: BY, BS, YS, Y, YC, YE, EF, ES, EU, KS, KU, KM, KI and KD. Compared with that in winter, there is neither EK in the surface layer nor E in the bottom layer, while there are KU and YC in the bottom layer in summer.
(2) The Taiwan Strait (TS) is classified into 9 water masses: MZCW, UW, MCCW, ZJW, NTMW, SCSSW, SCSW, KBW and SB-KBW. MZCW exists in four seasons. KBW reaches its maximum range northward in spring, and disappears or is replaced by SCSW and SCSSW in summer. MCCW appears from autumn to the following spring, and NTMW is distributed at the northeast corner of Taiwan Island all year round, with its depth range varying seasonally. UW and ZJW are water masses frequently appearing in summer. SB-KBW is stable throughout the year at the southeastern TS below 100 m.
(3) The whole South China Sea (SCS) in winter and summer is classified into 10 water masses: F, S, M, US, UP, KS, UI, I, D and B. F and S are strong in summer and autumn. Among them, M has the widest range in spring. KS is distributed above 50 m at the exit of the water exchange channel between the SCS and the Pacific Ocean. US is distributed at 100~300 m and rises up to 20 m in summer. In winter and spring, UP intrudes the SCS at the form of pulsed nonlinear Rossby waves with the widest distribution in spring, and is distributed in the 100~200 m layer west of the Luzon Strait only in the form of “loop” or “extending” in summer.
After years of studying, systematic results have been obtained on the concept and definition, theory and method, law and characteristics of the water masses in the China seas. The development of new methods, such as T-S similarity method and density-spicity diagram, for water mass analysis is also one of the future research directions. We hope to attract more people to join in the study of water mass, by developing more new methods, expanding the multi-parameter classification of water mass and combining with numerical results. What is more, it is necessary to enhance studying the water mass in spring and autumn in the future, so as to obtain a more complete distribution of water mass in the China seas, and to further reveal the formation and variation of each water mass.
Author contributions
JZ collected the references and wrote the manuscript by integrating the comments and suggestions from JH and QZ. All authors contributed to the article and approved the submitted version.
Funding
This study is jointly supported by the National Natural Science Foundation of China (42106005 and 91958203), the National Key Research and Development Project (2018YFC1406302), and the National Basic Research Program of China (2015CB954004 and 2009CB421208).
Acknowledgments
We appreciate the valuable comments and the nice suggestions from the editor and reviewers that help improve the paper.
Conflict of interest
The authors declare that the research was conducted in the absence of any commercial or financial relationships that could be construed as a potential conflict of interest.
Publisher’s note
All claims expressed in this article are solely those of the authors and do not necessarily represent those of their affiliated organizations, or those of the publisher, the editors and the reviewers. Any product that may be evaluated in this article, or claim that may be made by its manufacturer, is not guaranteed or endorsed by the publisher.
References
Bao X. W., Li N., Wu D. X. (2010). Observed characteristics of the north Yellow Sea water masses in summer. Chin. J. Oceanol. Limn. 28 (1), 160–170. doi: 10.1007/s00343-010-9034-1
Chen B. (1986). Preliminary discussion on the formation and characteristics of Beibu Gulf water system. J. Guangxi. Acad. Sci. 2), 93–96.
Cheng G. S., Sun J. D., Zu T. T., Chen J, Wang DX.. (2014). Analysis of water masses in the northern South China Sea in summer 2011. J. Trop. Oceanogr. 33 (3), 10–16. doi: 10.3969/j.issn.1009-5470.2014.03.002
Chen S. L., Hu J. Y., Sun Z. Y., Chen Z. Z., Zhu J. (2009). “Water mass analysis in the eastern Beibu Gulf in winter 2006,” in A collection of research papers on marine science in the Beibu Gulf Beijing:China Ocean Press, vol. 2. , 88–97.
Chen S. L., Hu J. Y., Zhu J., Sun Z. Y., Chen Z. Z. (2008). “Water mass analysis in the Beibu Gulf in summer of 2006,” in A collection of research papers on marine science in the Beibu Gulf Beijing:China Ocean Press, vol. 1. , 120–126.
Chen S. L., Li Y., Hu J. Y., Zheng A. R., Huang L. F., Lin Y. S.. (2011). Multiparameter cluster analysis of seasonal variation of water masses in the eastern Beibu Gulf. J. Oceanogr. 67, 709–718. doi: 10.1007/s10872-011-0071-y
Chen Z. D., Ruo R., Pai S. C., Liu C. T, Wong G. T. F.. (1995). Exchange of water masses between the East China Sea and the Kuroshio off northeastern Taiwan. Cont. Shelf. Res. 15 (1), 19–39. doi: 10.1016/0278-4343(93)E0001-O
Defant A. (1929). Stabile lagerung ozeanischer Wasserkörper und dazugehörige Stromsysteme. Veröff. Inst. Meereskde, Berlin N. F. A, Heft. 19.
Fan L. Q., Su Y. S., Li F. Q. (1988). Analysis of water masses in the northern area of the South China Sea. Acta Oceanol. Sin. 10 (2), 136–45.
Gao Y., Huang R. X., Zhu J., Huang Y. X., Hu J. Y. (2020). Using the sigma-pi diagram to analyze water masses in the northern South China Sea in spring. J. Geophys. Res.: Oceans. 125, e2019JC015676. doi: 10.1029/2019JC015676
Guan B. X. (1963). A preliminary study of the temperature variations and the characteristics of the circulation of the cold water mass of the Yellow Sea. Oceanol et. Limnol. Sin. 5 (4), 255–284.
He F. X. (1994). A preliminary analysis of modified water masses in Minnan-Taiwan shoal fishing ground. Trans. Oceanol. Limnol. 3), 18–25.
He C. P., Wang Y. X., Lei Z. Y., Xu S. (1959). A preliminary study of the formation of Yellow Sea cold mass and its properties. Oceanol. Limnol. Sin. 11 (1), 11–15.
Hong B., Yang H. (2005). The application of fisher's stepwise discriminant analysis to the water masses in the East China Sea. Mar. Fish. 27 (2), 143–149.
Huang J. C., Huang Q. Z. (1983). An attempt to use “clustering analytic” method to differentiate water mass in the Bashi Channel region. Trans. Oceanol. Limnol. 3, 9–18.
Huang Z. Q., Ji W. D. (1995). Cluster analysis of chemical hydrology elements on water mass in western Taiwan Strait. Acta Oceanol. Sin. 17 (1), 40–51.
Hu J. Y., Hong H. S., Li Y., Jiang Y. W., Chen Z. Z., Zhu J.. (2011). Variable temperature, salinity and water mass structures in the southwestern Taiwan Strait in summer. Cont. Shelf. Res. 31 (6), S13–S23. doi: 10.1016/j.csr.2011.02.003
Hu J. Y., Ho C. R., Xie L. L., Zheng Q. A. (2020). Regional oceanography of the South China Sea (Singapore:World Scientific Company), 500pp.
Hu J. Y., Kawamura H., Hong H. S., Pan W. R. (2003). A review of research on the upwelling in the Taiwan Strait. B. Mar. Sci. 73 (3), 605–628. doi: 10.1590/S0100-879X2003001100017
Hu J. Y., Kawamura H., Hong H. S., Qi Y. Q. (2000). A review on the currents in the South China Sea: Seasonal circulation, South China Sea warm current and Kuroshio intrusion. J. Oceanogr. 56, 607–624. doi: 10.1023/A:1011117531252
Hu J. Y., Liang H. X., Zhang X. B. (1999a). Sectional distribution of salinity and its indication of Kuroshio's intrusion in the southern Taiwan Strait and northeastern South China Sea in late summer 1994. Acta Oceanol. Sin. 18 (2), 225–236.
Hu J. Y., Liang H. X., Zhang X. B. (1999b). Distributional features of temperature and salinity in the southern Taiwan Strait and its adjacent sea area in late summer 1994. Acta Oceanol. Sin. 18 (2), 237–246.
Hu J. Y., Wang X. H. (2016). Progress on upwelling studies in the China seas. Rev. Geophys. 54, 653–673. doi: 10.1002/2015RG000505
Hu J. Y., Zheng Q. A., Sun Z. Y., Tai C. K. (2012). Penetration of nonlinear Rossby eddies into South China Sea evidenced by cruise data. J. Geophys. Res. 117, C03010. doi: 10.1029/2011JC007525
Jan S., Sheu D. D., Kuo H. M. (2006). Water mass and throughflow transport variability in the Taiwan Strait. J. Geophys. Res. Oceans. 111, C12012. doi: 10.1029/2006JC003656
Li L. (1987). Scatter diagrams of Nanhai Sea T-S character and their brief description. J. Oceanogr. Taiwan. Strait. 5 (1), 93–95.
Liang H. X., Li H. (1991). “The fuzzy clustering of water masses in the southern Taiwan Strait,” in Study on the ecosystem of upwelling area in Minnan - Taiwan Bank fishing ground. (Beijing: Science Press) 85–93.
Li L., Li D., Hong Q. M. (1990). The multi-dimensional fuzzy clustering analysis of water mass around Taiwan Bank in summer 1984. Acta Oceanol. Sin. 12 (5), 562–570.
Li W., Li L., Liu Q. Y. (1998). Water mass analysis in Luzon Strait and northern South China Sea. J. Oceanogr. Taiwan. Strait. 17 (2), 207–213.
Li L., Li F. Q., Su J., Xu J. P. (2002b). Analysis on water masses in the South China Sea in summer and winter of 1998. Oceanol. Limnol. Sin. 33 (4), 393–401. doi: 10.3321/j.issn:0029-814X.2002.04.008
Li F. Q., Li L., Wang X. Q., Liu C. L.. (2002a). Water masses in the South China Sea and water exchange between the Pacific and the South China Sea. J. Ocean. Univ. China 32 (3), 329–336. doi: 10.3969/j.issn.1672-5174.2002.03.001
Li F. Q., Su Y. S., Fan L. Q. (1987). Application of fuzzy mathematical method to water mass analysis in the northern sea area of South China Sea. Acta Oceanol. Sin. 9 (6), 669–680. doi: 10.16441/j.cnki.hdxb.1989.s1.028
Li F. Q., Su Y. S., Fan L. Q. (1989a). Discrimination analysis of water masses in the north area of the South China Sea. J. Ocean. Univ. China 19 (1), 181–189. doi: 10.16441/j.cnki.hdxb.1989.s1.020
Li F. Q., Su Y. S., Yu Z. X. (1983). The experiment of cluster analysis in modified water mass analysis in shallow water. Acta Oceanol. Sin. 5 (6), 675–686.
Liu C. J., Du Y., Zhang Q. R., Wang D. X.. (2008). Seasonal variation of subsurface and intermediate water masses in the South China Sea. Oceanol. Limnol. Sin. 39 (1), 55–64. doi: 10.11693/hyhz200801009009
Liu Z. H., Li L., Xu J. P., Shi M. C.. (2001). Analysis of water masses in the South China Sea in the summer of 1998. Donghai. Mar. Sci. 19 (3), 1–10. doi: 10.3969/j.issn.1001-909X.2001.03.001
Li F. Q., Wang F. Q., Su Y. S., Ma H. L.. (1989b). A fuzzy-analysis of water masses in the Yellow Sea and East China Sea areas in spring. J. Ocean. Univ. China 19 (1), 35–46.
Li F. Q., Xie J., Zu T. T. (2004). Fitting method of membership function of the oceanic subsurface-intermediate mixing water mass and analysis of water masses in the South China Sea. Periodical. Ocean. Univ. China 34 (5), 861–866. doi: 10.3969/j.issn.1672-5174.2004.05.017
Li H. Q., Yuan Y. L. (1992). On the formation and maintenance mechanisms of the cold water mass of the Yellow Sea. Chin. J. Oceanol. Limn. 10 (2), 97–106. doi: 10.1007/BF02844741
Li X. L., Zhan J. Y. (1988). Determination of the modified surface water-masses in the central and northern areas of South China Sea using a fuzzy clustering analytical method. Trop. Oceanol. 7 (3), 60–68.
Lu Z. F. (1989). Fuzzy objective function clustering algorithm and its application in the analysis of Kuroshio water mass in the East China Sea. Acta Oceanol. Sin. 11 (3), 265–274. doi: 10.1007/BF02005959
Mao H. L., Gan Z. J., Lan S. F. (1963). A preliminary study of the Yangtze diluted water and its mixing processes. Oceanol. Limnol. Sin. 5 (3), 183–205.
Mao H. L., Ren Y. W., Wan G. M. (1964). A preliminary investigation on the application of using T-S diagrams for a quantitative analysis of the water masses in the shallow water area. Oceanol. Limnol. Sin. 6 (1), 1–22.
Miao Y. T., Yu H. H., Liu Q. Y. (1987). Cluster analysis of water masses in the East China Sea in summer. Oceanol. Limnol. Sin. 18 (4), 388–395.
Pan Y. Q., Huang S. S. (1997). Interaction between water masses and the evolution of the East China Sea dense water circulation. Donghai. Mar. Sci. 15 (2), 1–14.
Qiao F. L., Gan Z. J., Wang D. X., Sun X.P.. (2012). Regional oceanography of China seas–Physical oceanography (Beijing, China :Ocean Press), 481pp.
Qiu D. L., Zhou S. L., Li C. M. (1984). A preliminary study on the classification of water masses in the Yellow Sea by cluster analysis. Acta Oceanol. Sin. 6 (3), 281–292.
Shaw P. T. (1989). The intrusion of water masses into the sea southwest of Taiwan. J. Geophys. Res. 94 (C12), 18213–18226. doi: 10.1029/JC094iC12p18213
Su Y. S. (1980). The TS-comparison method for determining the boundary of modified water-masses and the analysis of modified water-masses in the western area of the East China Sea. Acta Oceanol. Sin. 2 (1), 1–16.
Su Y. S., Li F. Q., Wang F. Q. (1996). Water type distribution and water system division in Bohai Sea, Huanghai Sea and the East China Sea. Acta Oceanol. Sin. 18 (6), 1–7.
Sun X. P. (2006). Regional oceanography in China offshore areas (Beijing: China Ocean Press), 376pp.
Su Y. S., Yu Z. X., Li F. Q. (1983). Application of cluster analysis method for analyzing the water-masses in the shallow water area and the analysis of modified water-masses in the Huanghai Sea and the East China Sea. Oceanol. Limnol. Sin. 14 (1), 1–12.
Tian T., Wei H. (2005). Analysis of water masses in the northern South China Sea and Bashi Channel. Periodical. Ocean. Uni. China 35 (1), 9–12. doi: 10.1360/gs050302
Wang F. Q., Li F. Q., Su Y. S. (1986). Soft division of the modified water masses in the shallow water. Acta Oceanol. Sin. 8 (4), 408–415.
Wang F. Q., Li F. Q., Su Y. Q. (1989). Elastic classification of modified water mass in shallow sea. J. Ocean. Uni. China 19 (1), 233–42.
Wei Z. X., Zheng Q. A., Yang Y. Z., Liu K. X., Xu T. F., Wang F.. (2019). Physical oceanography research in China over past 70 years: Overview of development history and academic achievements. Haiyang. Xuebao. 41 (10), 23–64. doi: 10.3969/j.issn.0253-4193.2019.10.003
Weng X. C., Zhang Y. K., Wang C. M., Zhang Q. L.. (1988). The variational characteristics of the Huanghai Sea (Yellow Sea) cold water mass. Oceanol. Limnol. Sin. 19 (4), 368–379.
Weng X. C., Zhang Q. L., Yan T. Z., Wang C. M, Liang H. X.. (1992). Analysis of water masses in the middle and northern Taiwan Strait in spring and summer. Oceanol. Limnol. Sin. 23 (3), 235–244.
Wu X. D., Song J. M., Li X. G. (2014). Seasonal variation of water mass characteristics and influence area in the Yangtze estuary and its adjacent waters. Mar. Sci. 38 (12), 110–119. doi: 10.11759/hykx20140305001
Xiao H., Guo X. G., Wu R. S. (2002). Summarization of studies on hydrographic characteristics in Taiwan Strait. J. Oceanogr. Taiwan. Strait. 21 (1), 126–138.
Xie L. L., Tian J. W., Zhang S. W., Zhang Y. W., Yang Q. X.. (2011). An anticyclonic eddy in the intermediate layer of the Luzon Strait in autumn 2005. J. Oceanogr. 67, 37–46. doi: 10.1007/s10872-011-0004-9
Xie L. L., Zheng Q. A., Tian J. W., Zhang S.W., Feng Y., Yi X. F.. (2016). Cruise observation of Rossby waves with finite wavelengths propagating from the Pacific to the South China Sea. J. Oceanogr. 46 (10), 2897–2913. doi: 10.1175/JPO-D-16-0071.1
Xie L. L., Zheng Q. A., Zhang S. W., Hu J. Y., Li M. M., Li J. Y.. (2017). The Rossby normal modes in the South China Sea deep basin evidenced by satellite altimetry. Int. J. Remote Sens. 39 (2), 399–417. doi: 10.1080/01431161.2017.1384591
Xiong X. J., Guo X. G., Sheng L. F.. (2012). China Offshore marine physical oceanography and marine meteorology (Beijing: China Ocean Press), 442pp.
Xu S. (1965). A discussion on the mixing of bounded water masses. Oceanol. Limnol. Sin. 7 (3), 278–294.
Xu J. P. (1984). Analysis of the water masses in the coastal upwelling area off Zhejiang. Donghai. Mar. Sci. 2 (4), 11–16.
Yang D. M., Li F. Q., Su Y. S., Yu Y.. (1992). Fuzzy sets methods in analysis of water masses. Oceanol. Limnol. Sin. 23 (3), 227–234.
Yu Z. X. (1989). The present status of water mass analysis. J. Ocean. Univ. Qingao. 19 (1), 377–382.
Yuan D. L., Li Y., Qiao F. L., Zhao W.. (2013). Temperature inversion in the Huanghai Sea bottom cold water in summer. Acta Oceanol. Sin. 32 (3), 42–47. doi: 10.1007/s13131-013-0287-3
Yu F., Zhang Z. X., Diao X. Y., Gou J. S., Tang Y. X.. (2006). Analysis of evolution of the Huanghai Sea cold water mass and its relationship with adjacent water masses. Acta Oceanol. Sin. 28 (5), 26–34. doi: 10.1016/S1001-8042(06)60021-3
Zhang Y. K., He X. M., Gao Y. F. (1989). Preliminary analysis on the modified water masses in the north Yellow Sea and the Bohai Sea. J. Ocean. Uni. China 5 (S1), 99–108. doi: 10.16441/j.cnki.hdxb.1989.s1.013
Zhang Q. L., Wang F. (2004). Climatological analysis of water masses in Zhoushan fishing ground and adjacent region. Oceanol. Limnol. Sin. 35 (1), 48–54.
Zhang Q. L., Weng X. C., Yang Y. L. (1996). Analysis of water masses in the south Yellow Sea in spring. Oceanol. Limnol. Sin. 27 (4), 421–428.
Zhang Y., Wu D. X., Lin X. P. (2009). Seasonal variation of the water mass distribution along the PN section in the East China Sea. Periodical. Ocean. Uni. China 39 (3), 369–374. doi: 10.3969/j.issn.1672-5174.2009.03.002
Zhao B. R. (1985). The fronts of the huanghai Sea cold water mass induced by tidal mixing. Oceanol. Limnol. Sin. 16 (6), 451–460.
Zheng Q. A., Tai C. K., Hu J. Y., Lin H.Y, Zhang R. H., Su F.C. (2011). Satellite altimeter observations of nonlinear Rossby eddy–Kuroshio interaction at the Luzon Strait. J. Oceanogr. 67, 365–376. doi: 10.1007/s10872–011-0035–2
Zheng Q. A., Xie L. L., Zheng Z. W., Hu J. Y.. (2017). Progress in research of mesoscale eddies in the South China Sea. Adv. Mar. Sci. 35 (20), 131158. doi: 10.3969/j.issn.1671-6647.2017.02.001
Zhu L. M., Ji W. D. (2002). Clustering analysis of the vertical distribution of water masses in the South China Sea. Trans. Oceanol. Limnol. 4), 1–6. doi: 10.3969/j.issn.1003-6482.2002.04.001
Zhu J. Y., Shi J., Guo X. Y., Gao H. W., Yao X. H.. (2017). Air-sea heat flux control on the Yellow Sea cold water mass intensity and implications for its prediction. Cont. Shelf. Res. 152, 14–26. doi: 10.1016/j.csr.2017.10.006
Zhu J., Zheng Q. A., Hu J. Y., Lin H. Y., Chen D. W., Chen Z. Z., et al. (2019). Classification and 3-d distribution of upper layer water masses in the northern South China Sea. Acta Oceanol. Sin. 38 (4), 126–135. doi: 10.1007/s13131-019-1418-2
Keywords: water mass, China seas, overview, clustering analysis method, 3-D visualized diagram
Citation: Zhu J, Hu J and Zheng Q (2022) An overview on water masses in the China seas. Front. Mar. Sci. 9:972921. doi: 10.3389/fmars.2022.972921
Received: 19 June 2022; Accepted: 01 August 2022;
Published: 22 August 2022.
Edited by:
Chunyan Li, Louisiana State University, United StatesCopyright © 2022 Zhu, Hu and Zheng. This is an open-access article distributed under the terms of the Creative Commons Attribution License (CC BY). The use, distribution or reproduction in other forums is permitted, provided the original author(s) and the copyright owner(s) are credited and that the original publication in this journal is cited, in accordance with accepted academic practice. No use, distribution or reproduction is permitted which does not comply with these terms.
*Correspondence: Jianyu Hu, aHVqeUB4bXUuZWR1LmNu
 Jia Zhu
 Jianyu Hu
 Quanan Zheng3