 Jeonghyun Kim
 Byung-Chan Song1,2
 Tae-Hoon Kim
- 1Department of Earth and Marine Sciences, College of Ocean Sciences, Jeju National University, Jeju, South Korea
- 2Jeju Groundwater Research Center, Jeju Research Institute, Jeju, South Korea
- 3Department of Oceanography, Faculty of Earth Systems and Environmental Sciences, Chonnam National University, Gwangju, South Korea
To determine the origins of dissolved organic carbon (DOC) in a bay of volcanic Jeju Island, where the discharge of fresh groundwater (FGW) is dominant, we measured fluorescent dissolved organic matter (FDOM) and implemented a parallel factor analysis (PARAFAC). The PARAFAC model identified three humic-like components (FDOMH) and one protein-like component (FDOMP). DOC was extremely deficient in the FGW (35 ± 13 μM) and positively correlated with salinity in the coastal environment, indicating oceanic DOC contribution. The FDOMP pattern was similar to that of DOC, suggesting that marine biological production is a primary DOC source in this region. Particularly, significant FDOMP correlations in the coastal waters with the fluxes of dissolved inorganic phosphorus (DIP; R2 = 0.31) and dissolved silicon (R2 = 0.46) from the FGW demonstrated that in situ biological production is facilitated by FGW-borne nutrient addition. However, the absence of a correlation between the fluxes of dissolved inorganic nitrogen (DIN) and FDOMP (R2 <0.01) indicated that anthropogenic DIN is not essential for DOC production under the P-limited nutrient conditions and diatom-dominant conditions prevailing on the coastal Jeju Island. Here, we calculated the potential capacity of carbon fixation by marine biological activity based on the Redfield ratio of carbon and phosphorus with DIP fluxes. The flux accounts for approximately 2% of the terrestrial carbon uptake in South Korea. Therefore, optical properties of FDOM may be good indicators of coastal DOC origin, and nutrient speciation may be linked to the carbon cycle.
Introduction
Dissolved organic carbon (DOC) is one of the largest oceanic carbon pools (Hansell and Carlson, 2001). The marine DOC contains 660 Pg of carbon, comparable to the carbon dioxide in the atmosphere (Hansell, 2013). Biologically mediated DOC production sequestrates the atmospheric carbon into the ocean, followed by a long-term storage of carbon in refractory DOC driven by the microbial carbon pump (Jiao et al., 2010). DOC production has an important role in global warming. In the open ocean, the DOC source is mainly the autochthonous production of carbon by phytoplankton. Coastal and marginal oceans have a complex and dynamic organic carbon system. Coastal and marginal oceans directly receive terrestrial organic carbon through riverine runoff (Cauwet, 2002) and submarine groundwater discharge [SGD; Webb et al. (2019)]. As the terrestrial DOC pool is generally recalcitrant to biological degradation (Clercq et al., 1997; Stubbins et al., 2010), coastal DOC behaves conservatively and may be transferred to the open ocean. In addition, large fluxes of nutrients and iron from land stimulate primary production and subsequent DOC production in the water column (Kim et al., 2020). Understanding the organic carbon cycle in the coastal and marginal oceans is crucial.
Fluorescent dissolved organic matter (FDOM) is a fraction of the chromophoric dissolved organic matter (CDOM), that instantly fluoresces by absorbing incoming photons. These optically active fractions account for 20–70% of marine DOC and thus contribute significantly to global carbon cycles (Coble, 2007). However, photochemical reactions and microbial degradation of both chromophoric and non-colored substances occasionally result in the decoupling of FDOM and DOC (Skoog et al., 2011). The FDOM optical properties, manifested in the form of unique spectral patterns and peak locations, enable the study of biogeochemical mechanisms in marine environments. FDOM is generally divided into two groups based on the location of fluorescence peak: protein-like (FDOMP) and humic-like (FDOMH) components (Coble, 2007). FDOMP is freshly produced through primary production and subsequent biological activity (Lønborg et al., 2010). FDOMH is known to be derived from microbial degradation of organic debris in the sediment, soil (Laane and Kramer, 1990), and water columns (Yamashita and Tanoue, 2008).
SGD is a hidden groundwater outflow from the seabed to the overlying ocean regardless of its composition or momentum (Burnett et al., 2003). The discharge of groundwater across the land–ocean interface has been reported to be as equal to or sometimes significantly greater than the river runoff at extensive spatial scales. Using an inverse model with 228Ra, Kwon et al. (2014) reported that the SGD flux in the global ocean is greater than riverine freshwater discharge by a factor of three to four. Furthermore, because various biogeochemical reactions modify the chemical properties of the groundwater within an underground water-mixing zone, termed the subterranean estuary (STE) (Moore, 1999), coastal groundwater has significantly enriched concentrations of terrestrial materials (e.g., nutrients, organic matter, trace elements, and radionuclides) compared to the adjacent seawater (Beck et al., 2007; Kroeger and Charette, 2008; Anschutz et al., 2009). Generally, the flux of SGD-driven materials to the ocean has been estimated by multiplying the endmember concentration in coastal groundwater and the water discharge rate of SGD. Thus, the SGD contribution to the cycle of chemical materials has been recognized to be significant in coastal regions.
Jeju Island is surrounded by the oligotrophic surface water of the Kuroshio Current (Kim and Kim, 2017). Various chemical materials are delivered solely from the groundwater into the coastal region. The SGD-driven chemical fluxes directly contribute to the material budgets and promote biological productivity in marine ecosystems. This includes severe macroalgal blooms (green tides) in coastal Jeju Island (Kwon et al., 2017). However, surprisingly, the DOC concentration in Jeju Island’s fresh groundwater was reported to be very low [26 ± 11 μM in Kim and Kim (2017), 21–56 μM in Kim et al. (2013)], being lower even than that reported for the deep Pacific Ocean (33.8 ± 0.4 μM in Hansell and Carlson (1998)), which is the oldest water mass. This low level was probably due to the degradation of labile DOC and particulate organic carbon (POC) in aquifers (Kim and Kim, 2017). In this study, we demonstrate that the DOC origin is linked to SGD-driven nutrient fluxes and nutrient speciation. In particular, the optical properties of FDOM were used as indicators to understand the DOC origin in this region.
Materials and methods
Study region
Jeju Island is a dormant volcanic island in the South Sea of the Korean Peninsula (Figure 1). As a result of the East Asian monsoon climatic influence, considerable precipitation is concentrated from June to September (mean annual precipitation of approximately 1900 mm). Because island bedrock is principally composed of permeable basalt rocks, rainwater recharges groundwater immediately and is transferred to the coastal region through aquifer transport. As a result, approximately 1000 artesian springs and wells are distributed along the coast. Because Jeju Island is located on a branch of the oligotrophic Kuroshio Current and SGD is a dominant source of terrestrial substances, it is an excellent location to determine the influence of SGD-driven terrestrial materials in the coastal ocean. Sampling campaigns were conducted in Hwasun Bay, which is located in the southwestern quadrant of the island (Figure 1). Submarine fresh groundwater discharge (SFGD) is a significant process, and a simple water-mixing pattern has been observed in artesian springs, coastal groundwater, and bay water (Lee and Kim, 2015).
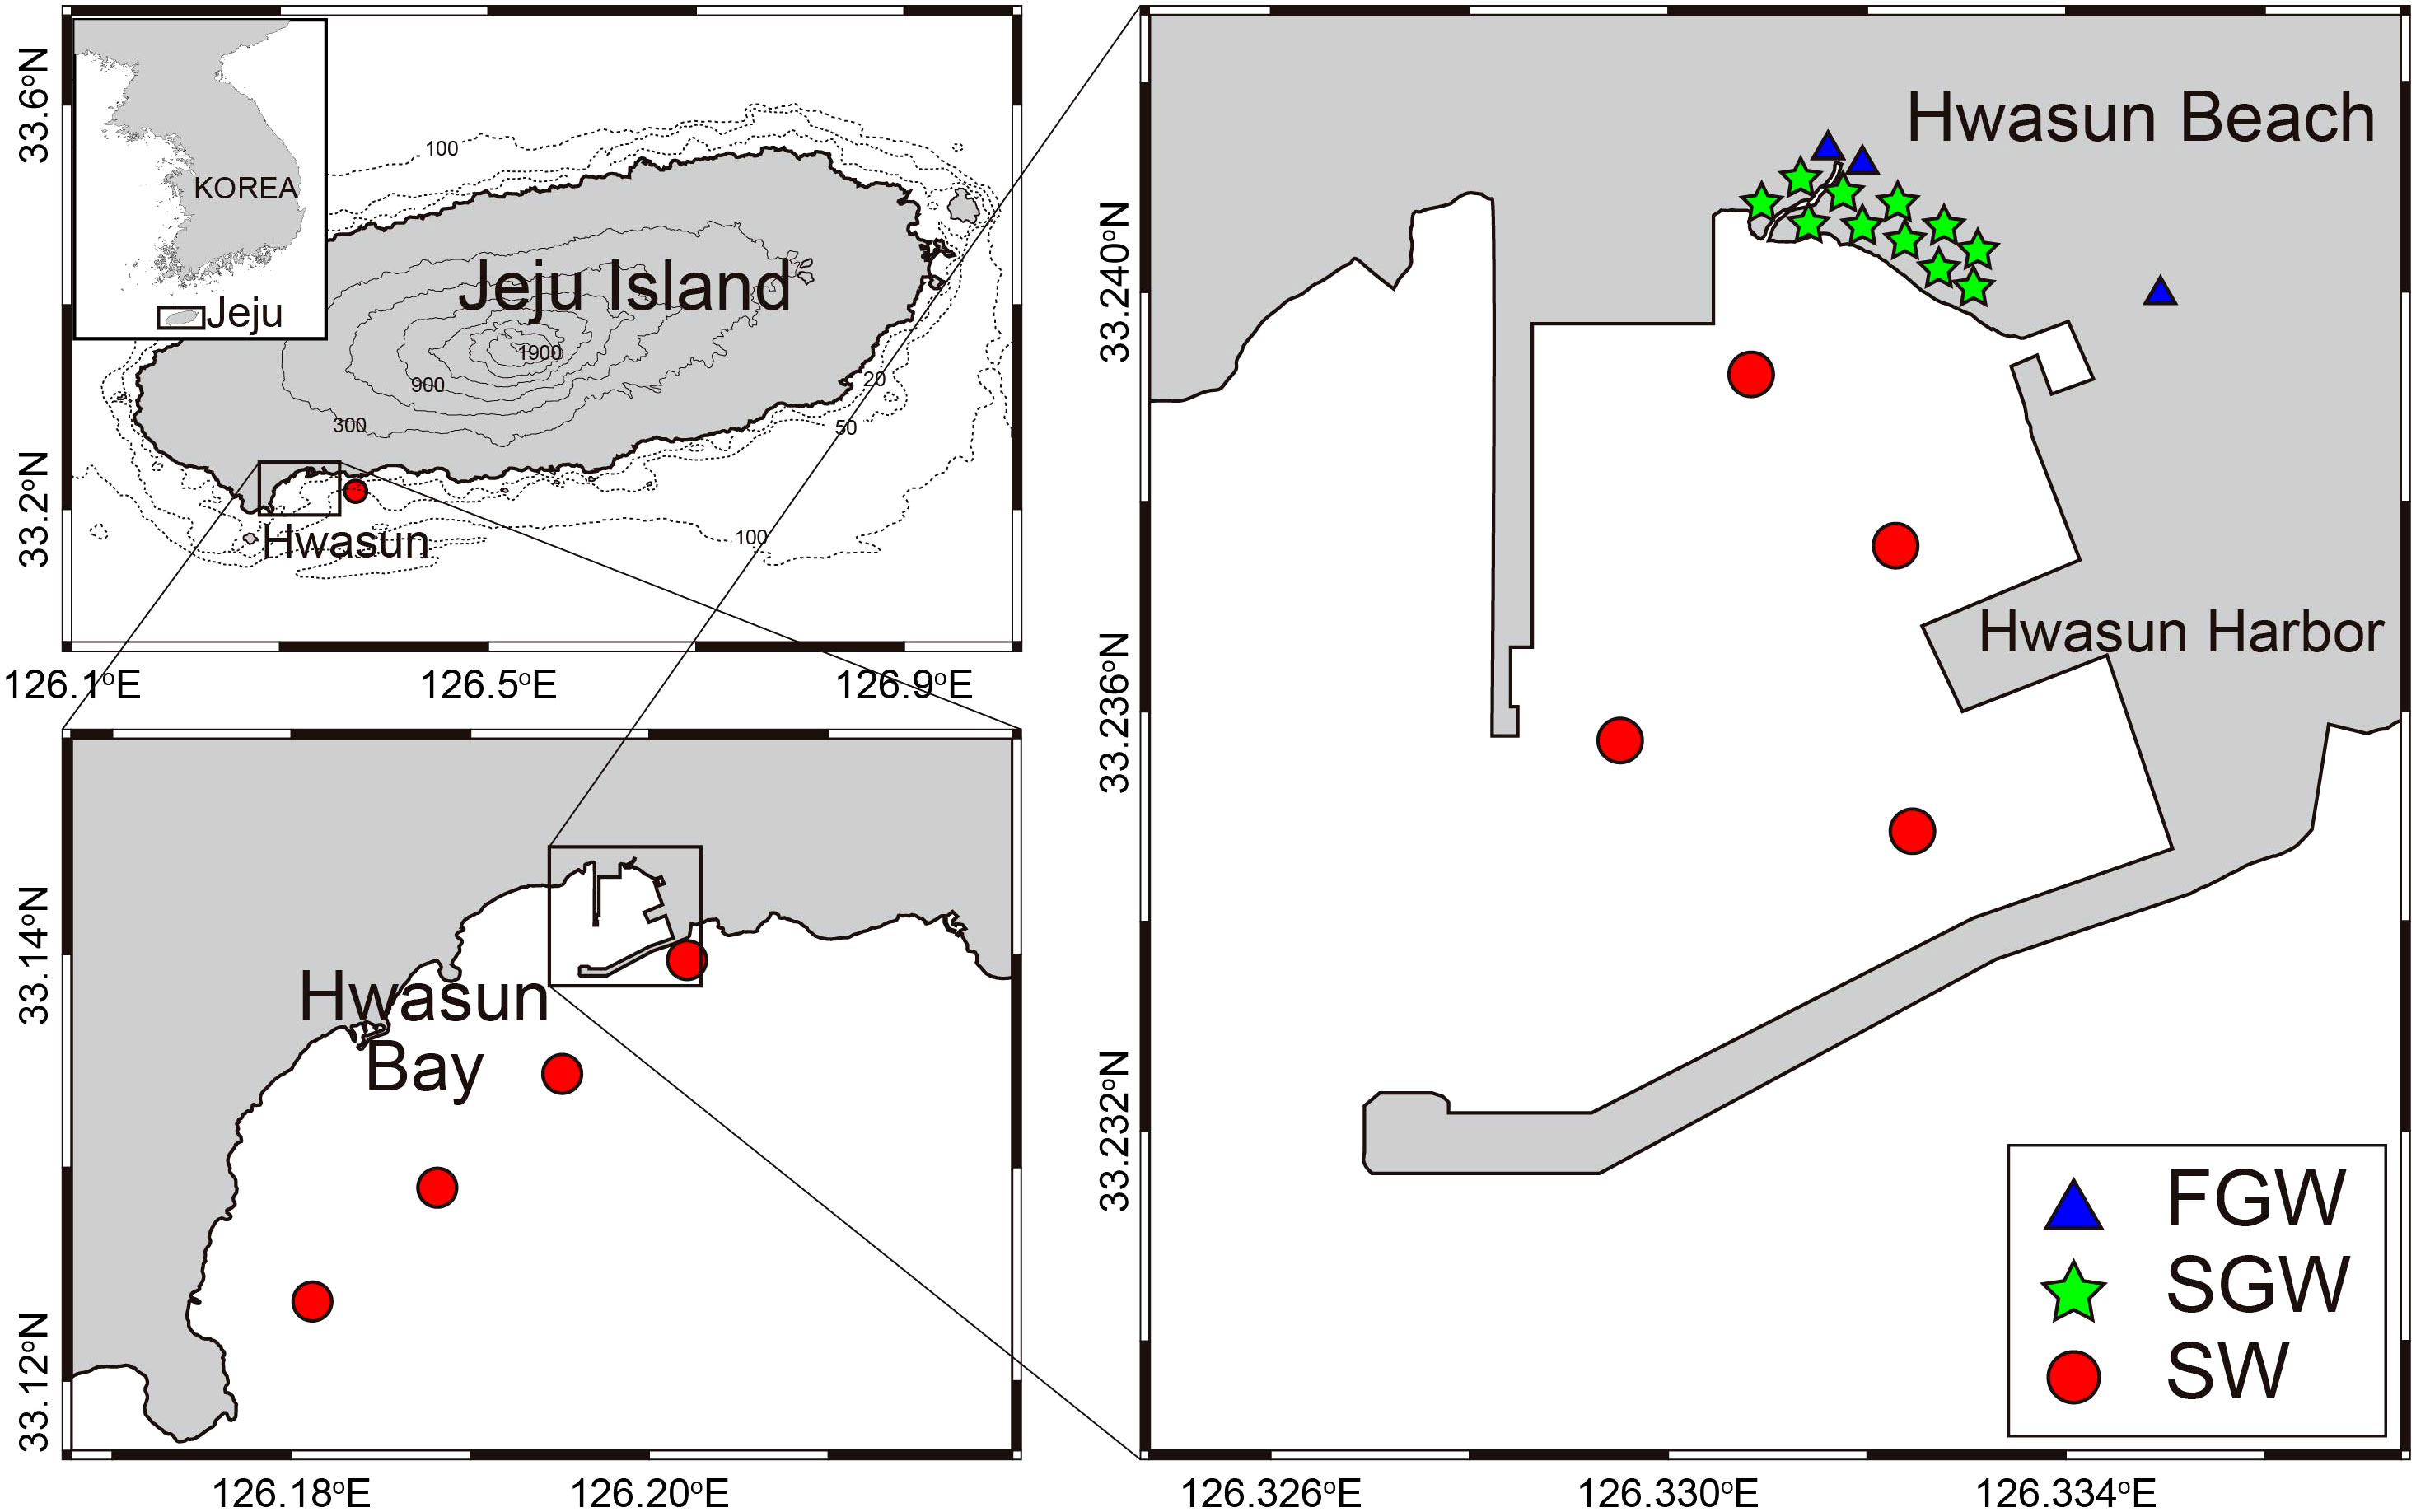
Figure 1 Maps showing study area and sampling stations for fresh groundwater (FGW), saline groundwater (SGW), and coastal seawater (SW). Modified from Kim et al. (2022).
Sampling
Sampling campaigns were conducted monthly from the artesian wells, pit dugs, and coastal seawater (SW) in 2019 (Kim et al., 2022). Fresh and saline groundwater samples were collected from Hwasun Beach during the ebb tide (Figure 1). Fresh groundwater (FGW) samples were collected near artesian wells using a plastic beaker. Saline groundwater (SGW) was sampled from shallow pits (depth: ~50 cm) dug into beach sediments, representing samples from the STE. The first two pit volumes of seeping groundwater were discarded, and freshly recharged water was collected to obtain the SGW samples. Salinity was measured at the sampling site using a portable sensor (CyberScan PCD650; Thermo Fisher Scientific, MA, USA). The sensor was calibrated using a conductivity standard solution (Thermo Fisher Scientific) before each sampling campaign. The SW samples of bay water and offshore water were collected aboard the R/V Je-Ra of Jeju National University, Korea. The SW temperature and salinity were measured using a Sea-Bird SBE 9 plus with an SBE Carousel water sampler (Sea-Bird Scientific, WA, USA).
DOC analysis
DOC samples were vacuum filtered using pre-combusted (500°C for 5 h) Whatman GF/F filters (pore size: 0.7 μm; Whatman Inc., NJ, USA). To avoid microbial degradation, the filtrate was acidified using 6 M HCl and stored in pre-combusted EPA amber vials (Fisher Scientific, PA, USA). The DOC concentration was measured by high-temperature (680°C) catalytic oxidation (HTCO) using a total organic carbon (TOC) analyzer (TOC-L, Shimadzu, Japan) equipped with an ASI-L auto-sampler. Before starting the measurement of the samples, the system baseline was reduced until the signal from carbon-free distilled water was stable below the limit of detection (< 5 μM C). The accuracy of the DOC concentration measurement was confirmed for each sample batch using deep-sea reference samples (DSR; 41–44 μM, University of Miami). The results of our DSR measurements were in good agreement with consensus values (within 2%).
FDOM analysis
FDOM samples were filtered simultaneously using GF/F filters and DOC samples. The filtrate was stored in pre-combusted dark EPA vials (Fisher Scientific, PA, USA) and maintained in a refrigerator at a temperature below 4°C until analysis. Three-dimensional fluorescence spectroscopy was performed using a spectrofluorometer (FS-2; SCINCO, Republic of Korea) on the day of filtration. The excitation–emission matrix (EEM) fluorescence was measured using scanning emission fluorescence over a wavelength range of 250–600 nm at 2-nm intervals with an excitation wavelength of 250–500 nm at 5-nm intervals. The fluorescence intensities were normalized to the area under the spectrum of a quinine sulfate dihydrate standard. All data are reported in quinine sulfate units (QSU; 1 QSU = 1 ppb quinine sulfate). Rayleigh and Raman scattering peaks were removed and replaced with three-dimensional Delaunay interpolation of the remaining data (Zepp et al., 2004). The FDOM measurement was conducted within one day of each sampling campaign. Parallel factor analysis (PARAFAC) modeling for the compilation of 402 EEM data from the 13 sampling campaigns was conducted using MATLAB R2020b with the DOMFluor toolbox (Stedmon and Bro, 2008). The precision of the FDOM measurement was ± 0.01 QSU, and the detection limit was 0.14 QSU (Kim and Kim, 2016). The inner filter effect was not corrected because the influence of this artifact was negligible when using this spectrofluorometer (Kim and Kim, 2017).
Statistical analysis
For the comparison between variables, one-way analysis of variance (ANOVA) was conducted using Excel Microsoft Office 365 (Microsoft, WA, USA). The reported values of the measurements were expressed as the average and standard deviation using Excel Microsoft Office 365. To explore the relationships between the variables, Pearson correlation analysis was conducted using SigmaPlot Version 12.0 (Systat Software, Inc., CA).
Data compilation
To substantiate our arguments, we also compiled data regarding the Redfield ratio for inorganic nutrients (N, P, and Si), seepage rate of SGD, and nutrient fluxes in Hwasun Bay. These have been documented by Kim et al. (2022).
Results
Salinity
The salinity in the FGW varied from 0.01 to 0.12 (avg. 0.10 ± 0.02), and it was consistent with 2019 observations (Table 1). The salinity in the SGW varied from 0.48 to 33.73 (avg. 15.55 ± 7.71). The salinity in the SW varied from 21.48 to 34.21 (avg. 29.93 ± 2.57). In the SW samples, the salinity was greatest during the winter season (December–February; 32.76 ± 1.02), followed by that in spring (March–May; 31.31 ± 1.51), autumn (September–November; 29.69 ± 2.27), and summer (June–August; 28.79 ± 2.64) (Figure 2).
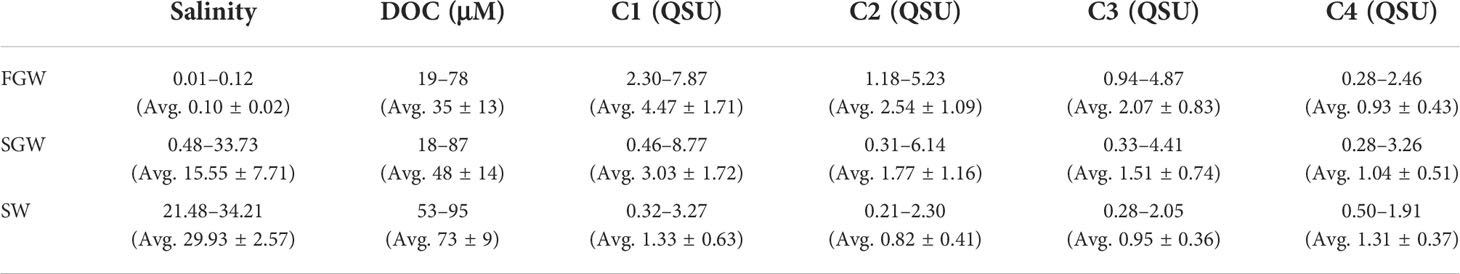
Table 1 Salinity, DOC concentration, and fluorescent intensities of FDOM components (C1–C4) in the FGW, SGW, and SW samples.
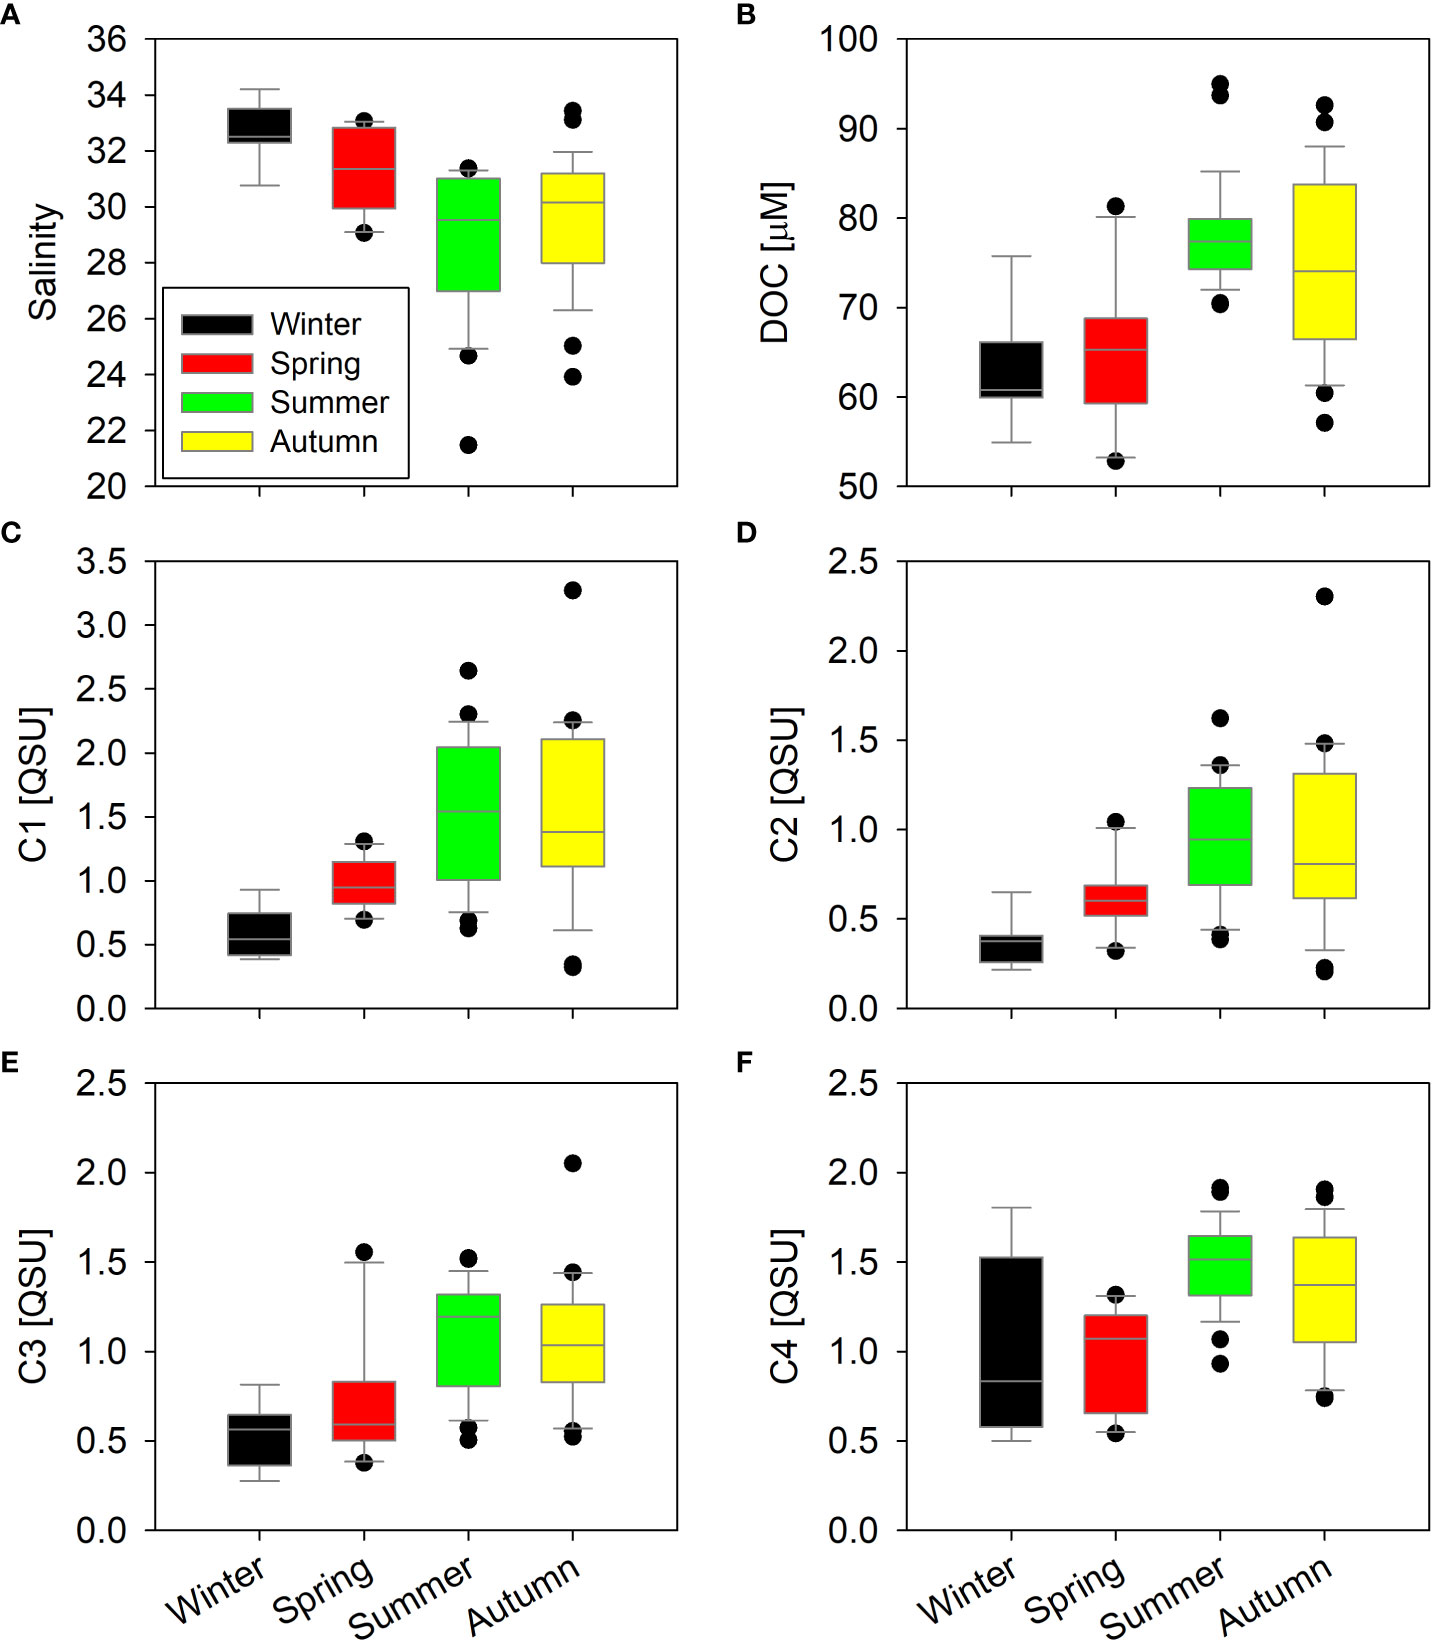
Figure 2 Comparison of salinity (A), DOC (B), and FDOM components (C–F) in the coastal seawater during different seasons.
DOC concentration
DOC concentrations in the FGW varied from 19 to 78 μM (avg. 35 ± 13 μM) (Table 1), and DOC levels were similar to those reported in previous studies [26 ± 11 μM in Kim and Kim (2017) and 21–56 μM in Kim et al. (2013)]. The DOC concentrations varied from 18 to 87 μM (avg. 48 ± 14 μM) in the SGW and from 53 to 95 μM (avg. 73 ± 9 μM) in the SW. However, the DOC level in the FGW was found to be comparable to that of the deep Pacific Ocean [33.8 ± 0.4 μM in Hansell and Carlson (1998)]. In the SW samples, the DOC concentrations were higher during the wet season (76 ± 8 μM) than during dry season (64 ± 7 μM) (Figure 2).
Characteristics of FDOM using the PARAFAC model
Four components (C1–C4) were identified by correlation with the fluorescence spectra of components in previous studies from the OpenFluor database which had Tucker congruence coefficients exceeding 0.95 [Figure 3; Table 2; Murphy et al. (2014)]. The FDOM components were distinguished by three humic-like components (C1, C2, and C3) and one protein-like (C4) component. This characterization was based on each peak location and literature characterizations (Table 2). C1 (Maxex/em = 335/414 nm) and C2 (Maxex/em = 365/464 nm) resemble humic-like organic matter from terrestrial sources (Coble, 2007). Based on the spectral characteristics of the FDOMH components defined by Coble (2007), both C1 and C2 were recognized as the C peaks. In addition, the coefficient of determination between C1 and C2 was 0.98, indicating there is a similar production mechanism for two components. C3 (Maxex/em = 305/364 nm) corresponded to FDOMH, which has traditionally been documented to originate from marine organic matter. C4 (Maxex/em = 280/340 nm) matched the components from nine models in the OpenFluor database, and the location of the maximum peak was similar to that of the tryptophan amino acid-like component of the recognized T peak (Coble, 2007).
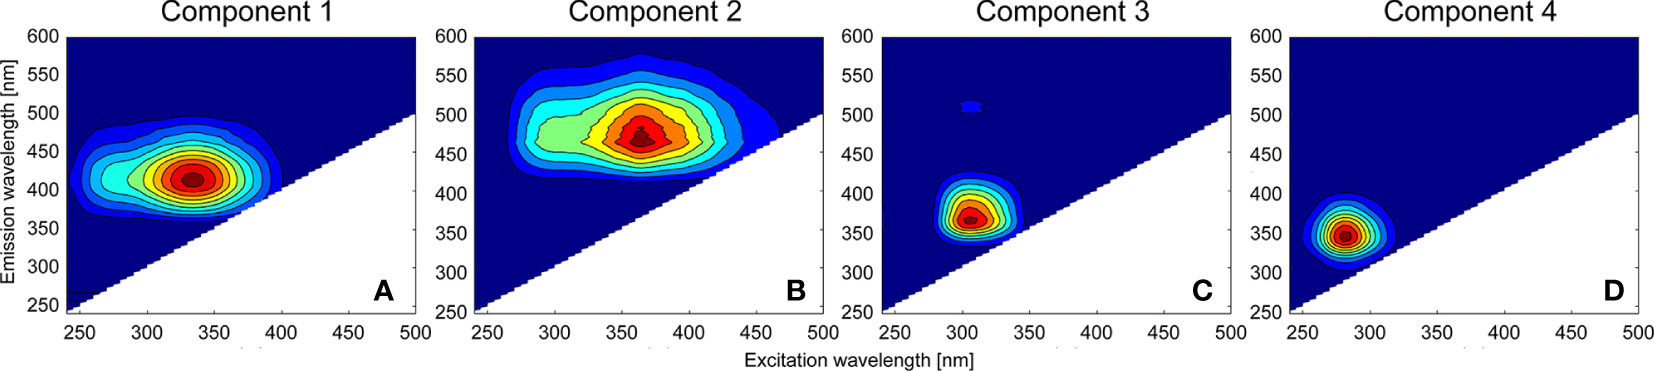
Figure 3 Excitation–emission matrix spectroscopy contour plots of four components [C1 (A), C2 (B), C3 (C), and C4 (D)] determined by the parallel factor analysis model.
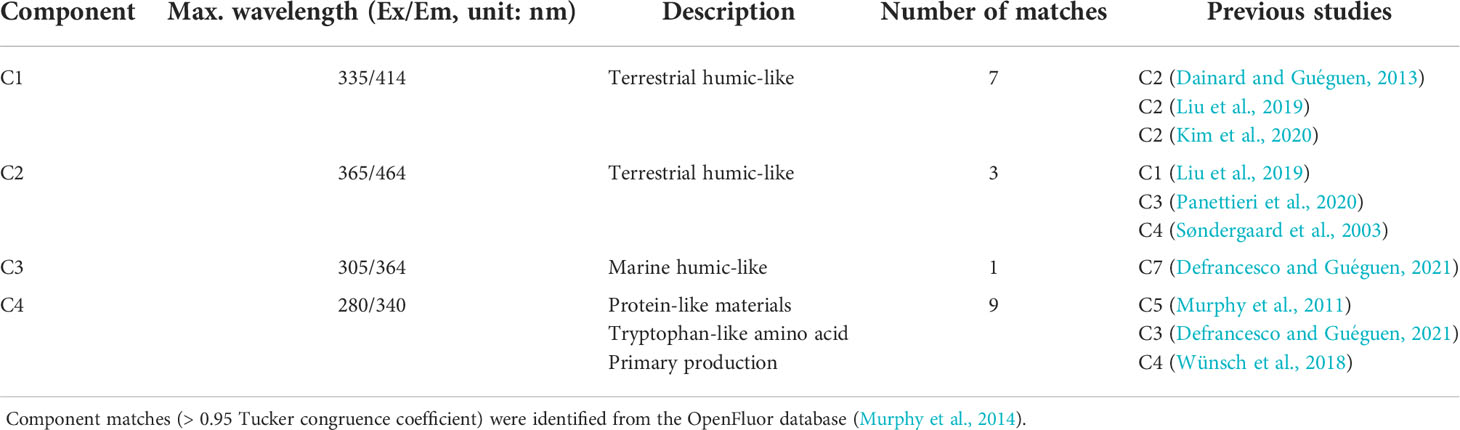
Table 2 Optical properties of FDOM components identified by the PARAFAC model from Hwasun Bay, Jeju Island.
In the SW samples, the C1 concentrations were greatest during summer (1.53 ± 0.56 QSU), followed by those in autumn (1.52 ± 0.67 QSU), spring (0.97 ± 0.19 QSU), and winter (0.58 ± 0.19 QSU) (Figure 2). In the SW samples, the C2 concentrations were greatest during summer (0.93 ± 0.34 QSU) and autumn (0.93 ± 0.48 QSU); in spring and winter, these were 0.62 ± 0.18 and 0.36 ± 0.13 QSU, respectively (Figure 2). In the SW samples, the C3 concentrations were greatest during summer (1.07 ± 0.30 QSU), followed by those in autumn (1.05 ± 0.34 QSU), spring (0.71 ± 0.34 QSU), and winter (0.52 ± 0.17 QSU) (Figure 2). In the SW samples, the C4 concentrations were greatest during summer (1.49 ± 0.24 QSU), followed by those in autumn (1.33 ± 0.35 QSU), winter (1.04 ± 0.49 QSU), and spring (0.96 ± 0.29 QSU) (Figure 2).
Discussion
Origins of DOC and FDOM components
DOC in the FGW, SGW, and SW samples was positively correlated with salinity (R2 = 0.45, p <0.01; Figure 4). Thus, the DOC content in Hwasun Bay was deduced to be of oceanic origin. Subsequently, the enriched marine DOC mixes with the depleted DOC of the GW in the STE. The fluorescence intensities of FDOMH were negatively correlated with salinity (R2 = 0.35, p <0.01 for C1; R2 = 0.26, p <0.01 for C2; R2 = 0.24, p <0.01 for C3; Figure 4), indicating that FDOMH originated from the FGW. The FDOMH showed a large variation in the FGW and SGW but was quite consistent in the SW. Because of its bio-refractory behavior, FDOMH is likely to be conservatively mixed in the STE and coastal regions. Thus, large scatterings appear to be associated with variations in the FDOMH content in the FGW. However, the fluorescence intensities of FDOMH were found to be constant in the sample from the offshore station. This is possibly a result of the simple FDOMH origin and photodegradation offshore (Chen and Bada, 1992; Helms et al., 2013). Although the relationship between FDOMP and salinity was insignificant (R2 = 0.05, p <0.01), it was marginally positively correlated with salinity, similar to those of DOC in this region (Figure 4). Because FDOMP is recognized to be primarily produced by biological production (Coble, 2007), the FDOMP production occurred in the coastal SW and mixed into the STE.
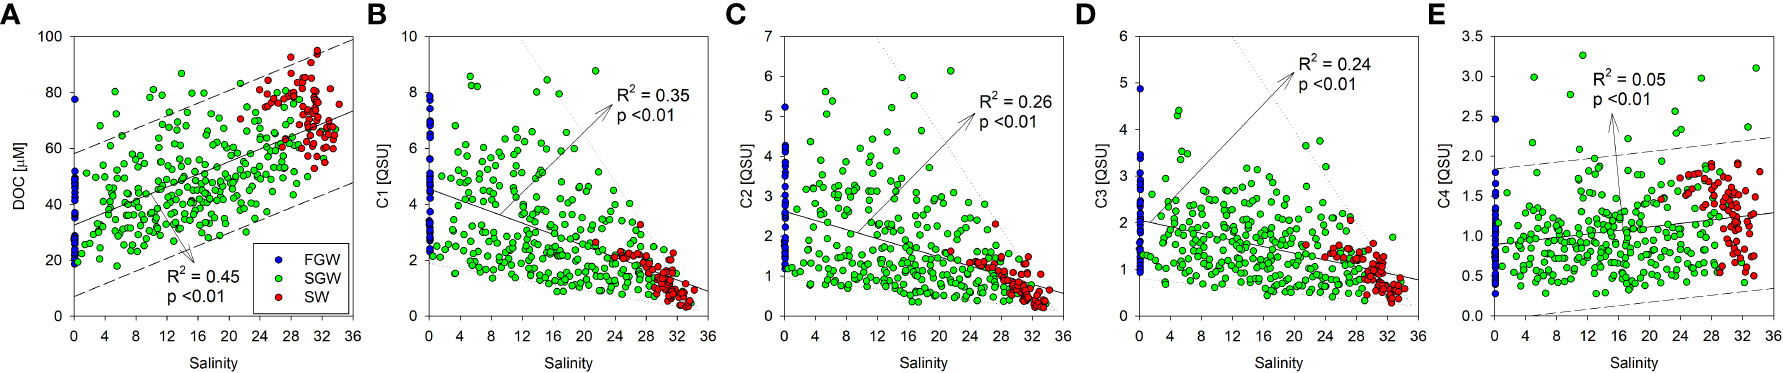
Figure 4 Scatterplots of the DOC and the FDOM components (C1–C4) against salinity in the FGW, SGW, and SW. The solid lines (A–E) and the dashed lines (A, E) indicate the regression lines and the prediction intervals of the scatterplots, respectively. The dotted lines indicate the upper and lower limit of the relationship between FDOMH and salinity (B–D).
The DOC concentration showed no correlation with the fluorescent intensities of FDOMH (R2 <0.01 for C1, C2, and C3; Figures 5A–C) in the whole samples, indicating that the DOC content seems to be unrelated to humic-like organic matter. However, the relationship in each sample group (FGW, SGW, and SW) showed relatively significant positive correlations separately (Table S1). The relationships demonstrate that DOC is composed partially of humic substances, but the ratio of DOC and substances varies in independent systems. Based on the relatively high FDOMH to DOC ratio in the FGW compared to that in the SW, the humification process appeared to be considerably intensified, or FDOMH accumulated in the coastal aquifer and sediments. In addition, the coefficient of determination was increased from the SW (R2 = 0.19 for C1, 0.23 for C2, and 0.13 for C3), SGW (R2 = 0.20 for C1, 0.26 for C2, and 0.16 for C3), and FGW (R2 = 0.34 for C1, 0.35 for C2, and 0.13 for C3) (Table S1), suggesting that the DOC is likely to be humified during the transport from coastal water to groundwater.
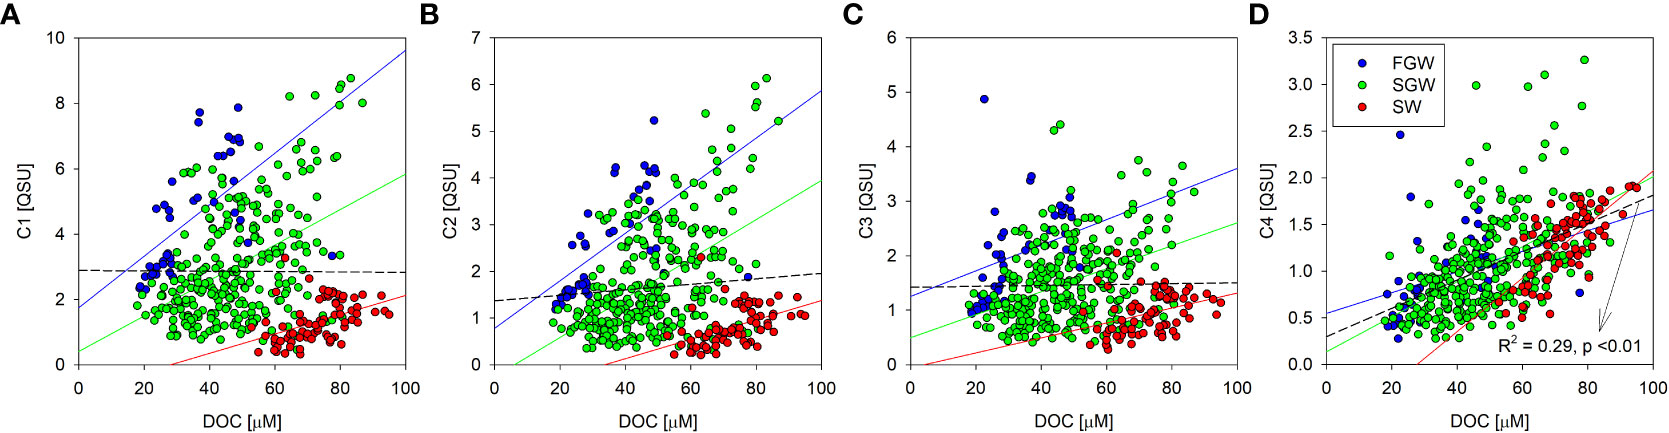
Figure 5 Scatterplots between the DOC concentration and the fluorescent intensities for the FDOM components (C1 (A), C2 (B), C3 (C), and C4 (D)) in the FGW, SGW, and SW. The blue, green, and red colored lines indicate the regression lines of the FGW, SGW, and SW, respectively. The dashed lines in black indicate the regression lines of the entire data.
Another potential prospective is that the photodegradation of organic matter induces relatively low FDOMH contents compared with the DOC level. Sunlight irradiation induces efficient degradation of FDOMH components and a blue shift of the fluorescence maximum (Moran et al., 2000; Kowalczuk et al., 2009). This was demonstrated by the relatively high ratio of the two humic components with long and short wavelengths (C2/C3) in the FGW [0.33–1.70 (Avg. 1.25 ± 0.25)] compared to that in the SW [0.39–2.01 (Avg. 0.86 ± 0.26)]. The DOC concentration was significantly correlated with the fluorescence intensity of FDOMP (R2 = 0.29, p < 0.01; Figure 5D); in particular, the SW samples showed a strong positive correlation between these parameters (R2 = 0.53; Table S1). This indicates that the DOC production is associated with biological activity in the coastal SW. Because the DOC enrichment was found in the coastal SW (Figure 4E), the marine DOC is considered to be freshly produced and transported into the coastal aquifer.
Relationships between production of organic substances and SGD in the coastal region
Property of organic matter in the costal sea is closely connected with land. In the Jeju volcanic island, there is no permanent streams and rivers, and freshwater is mostly transported via SGD into the coastal region. Recently, a seasonal variation of seepage rate was found to be a similar trend of East Asian summer monsoon: wet summer and dry winter seasons (Kim et al., 2022). The DOC and FDOM components in the coastal Jeju Island may be significantly dependent on the seepage rate and associated terrestrial material fluxes. The seepage rate and fluxes of inorganic nutrients from the FGW were reported previously (Kim et al., 2022). In this study, we found that the seepage rate of the FGW was related to the DOC and FDOM components in the coastal SW. Based on the relationship between the DOC concentration in the SW and the seepage rate of SGD (R2 = 0.34, p = 0.08; Figure 6A), SGD is considered to contribute to the DOC increase in the coastal Jeju Island. This may be a result of the direct addition of terrestrial DOC derived from the FGW and an increase in the coastal DOC level by autochthonous biological activity. As mentioned above, because DOC appears to be derived from the coastal SW, the direct addition of DOC can be excluded, or a minor contribution can be made. The relationships between the FDOMH components and seepage rate were significant. Moreover, the relationships between C1 and C2 and the seepage rate (R2 = 0.73, p <0.01 for C1; R2 = 0.72, p <0.01 for C2; Figures 6B, C) were more significant than those between C3 and the seepage rate (R2 = 0.54, p <0.01). This may be because the FGW mainly delivers terrestrial organic matter. C4 also showed a positive correlation with seepage rate (R2 = 0.51, p = 0.01), suggesting that biological production can be stimulated by the discharge of SGD (Rodellas et al., 2015). The strong relationship between dissolved organic substances and SGD was also characterized by seasonal variations. In this region, owing to the East Asian monsoon climate, precipitation is concentrated in the summer and autumn. Therefore, salinity of the SW was comparatively less during the summer and autumn than that during the winter and spring (Figure 2). It appears symmetrical to the concentrations of DOC and FDOM components and is higher in summer and autumn (Figure 2). Therefore, we conclude that the DOC and FDOM components are intricately connected within the coastal SW.
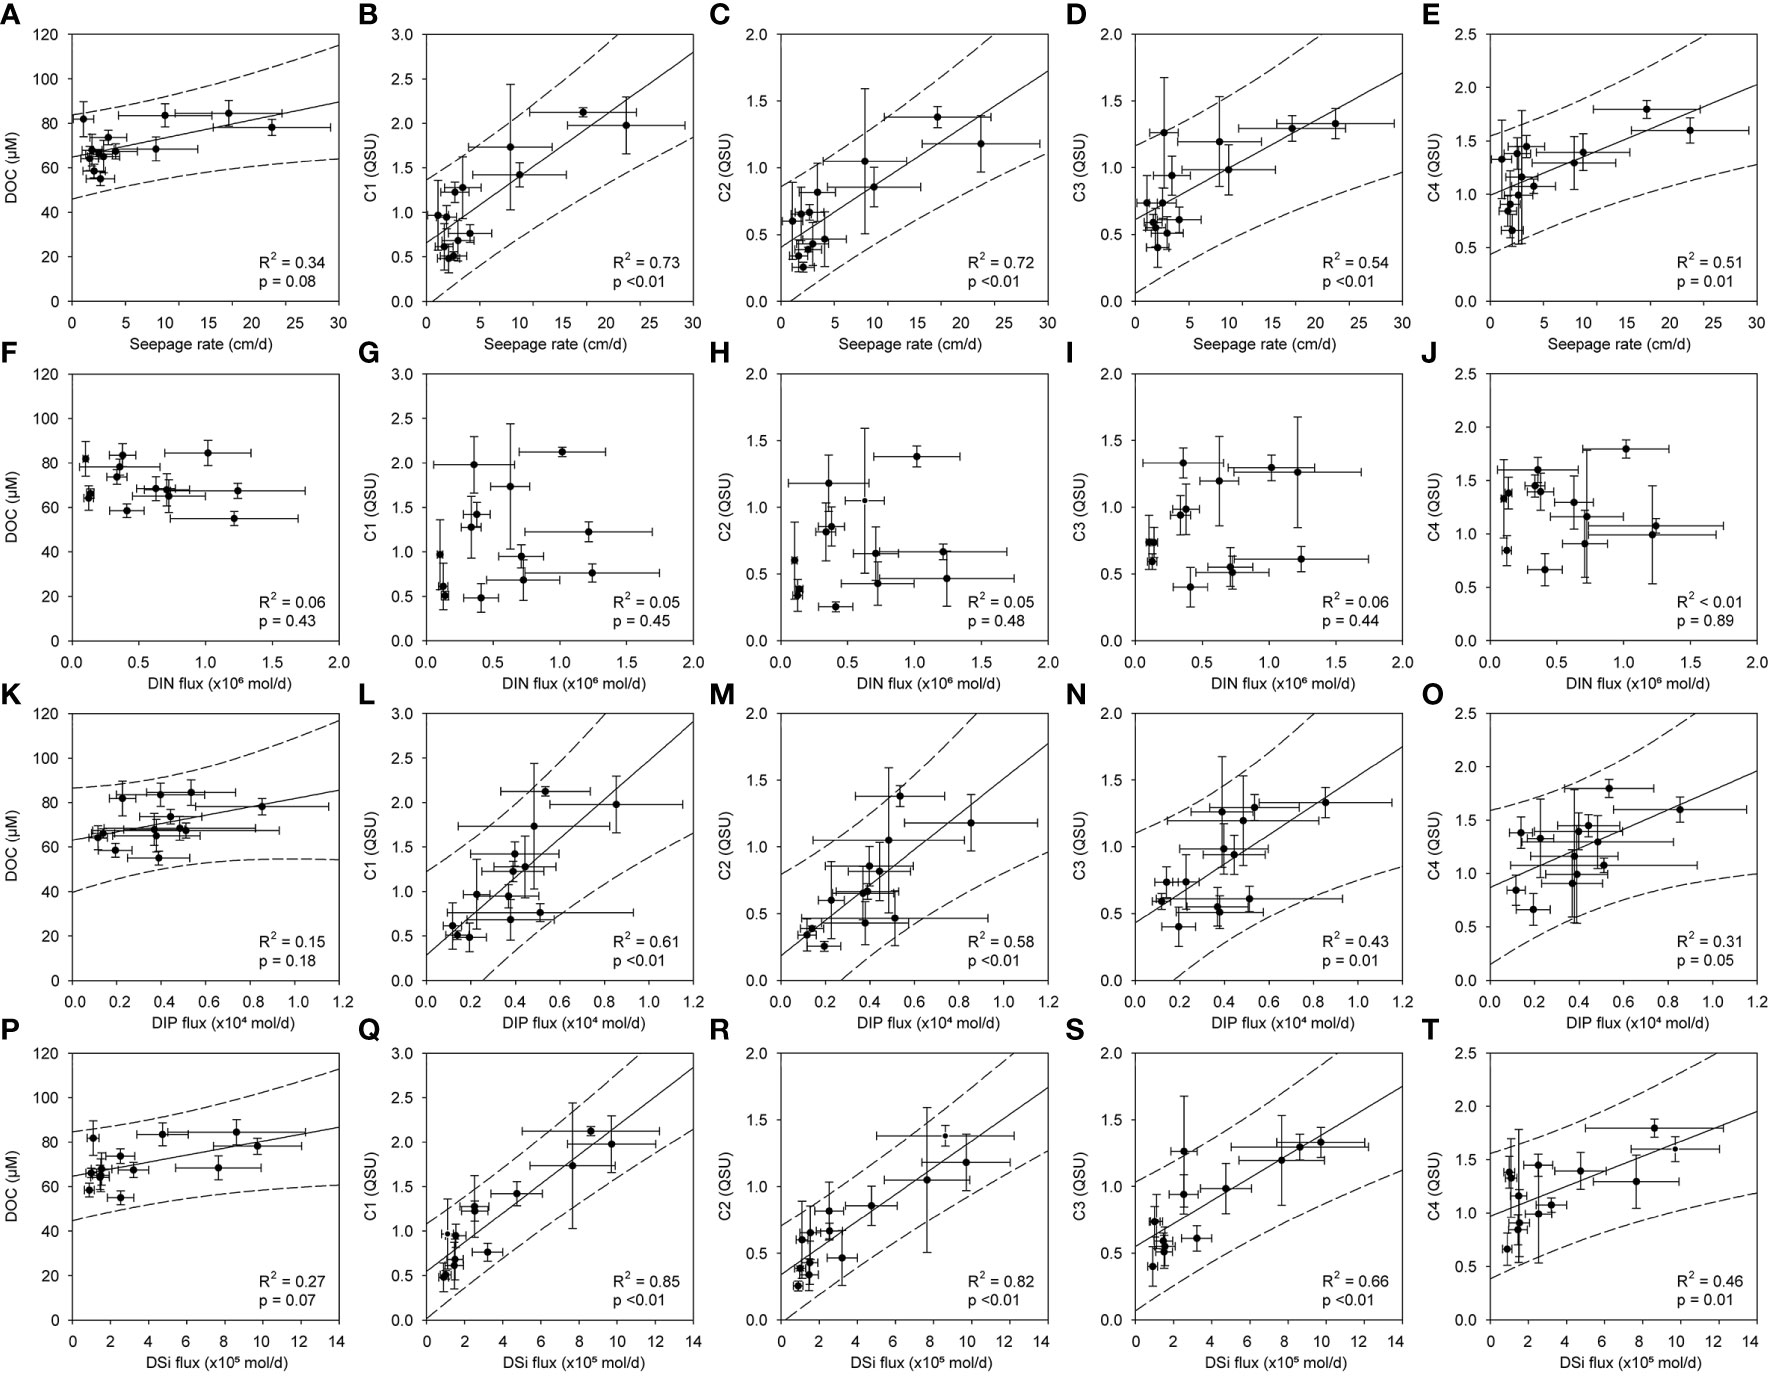
Figure 6 Scatterplots of the DOC concentration and the fluorescent intensities of the FDOM components (C1–C4) against the seepage rate (A–E) and the flux of inorganic nutrients (nitrate (F–J), phosphate (K–O), and silicate (P–T)). The solid and dashed lines indicate the regression lines and the prediction intervals of the scatterplots, respectively.
Based on the above results, we hypothesized that the biological production of DOC and FDOM was stimulated by SGD-driven nutrient fluxes, and that both organic substances mixed with the coastal groundwater. Addition of nutrients can be consumed and subsequently convert inorganic carbon to organic matter through primary production in the euphotic zone. Although primary producers are constrained by various chemical and physical conditions, the availability of macro nutrients (N, P, and Si) is a key limiting factor for biological production. However, the dissolved inorganic nitrogen (DIN) fluxes derived from the FGW were not correlated with the DOC concentrations (R2 = 0.06, p = 0.43), C1 (R2 = 0.05, p = 0.45), C2 (R2 = 0.05, p = 0.48), C3 (R2 = 0.06, p = 0.44), or C4 (R2 < 0.01, p = 0.89) in the coastal SW. Recently, Kim et al. (2022) reported that FGW-driven DIN fluxes in Hwasun Bay were significantly greater than those in other volcanic islands, such as Hawaii. In addition, DIN enrichment in the FGW was found in the western part of Jeju Island and was associated with anthropogenic pollution, such as the use of liquid fertilizer.
However, the fluxes of dissolved inorganic phosphorus (DIP) and DSi were significantly correlated with the concentrations for DOC and FDOMH components (Figure 6). DIP is primarily delivered to the coastal ocean via weathering of rocks and soil, specifically apatite and P adsorbed to iron-manganese oxide/oxyhydroxide particles (Paytan and Mclaughlin, 2007). Although DIP can originate from anthropogenic activities (e.g., sewage and fertilizer runoff), the anthropogenic DIP input is negligible in this region (Kim et al., 2022). Because DSi is naturally produced by chemical weathering of siliceous rock and sediment or dissolution of biogenic opal, enrichment of DSi is generally observed in groundwater (Oehler et al., 2019). In Hwasun Bay, the concentration of DSi showed a significantly negative relationship with salinity in each sampling campaign (r2 = 0.66–0.87), indicating a conservative mixing without any addition or removal processes within the STE (Kim et al., 2022). Because Hwasun Bay showed very fast flow rate of the groundwater, the biogeochemical reaction seems to be insignificant within STE. These properties may allow the use of DSi as a chemical tracer to find evidence of coastal groundwater and to estimate the flux of the FGW and associated nutrients in the Hwasun region. As the origin of the DIP and DSi is only linked to natural processes in this region, DOC and FDOMH are believed to be attributed to natural sources, and not anthropogenic input. In general, the sources of natural organic matter in the coastal region include terrestrial soils, coastal marine sediments, and autochthonous production. Based on the distribution patterns in Figure 4, the FDOMH may be associated with terrestrial humic and fulvic acids from organic debris in land soil.
Furthermore, C4 was significantly correlated with the DIP flux (R2 = 0.31, p = 0.05) and DSi (R2 = 0.46, p = 0.01) derived from SGD. This suggested that the active biological production of FDOMP is related to the addition of DIP and DSi. Based on the Redfield ratio of inorganic nutrients in this region (Figure S1), DIP was the most deficient nutrient, which was the primary limiting factor for productivity, as per the Liebig’s Law of the Minimum. Since DIP deficiency was observed throughout the year, DIP is thought to be the ultimate limiting nutrient. The addition of DIP to DIP-limited regions can fuel marine primary productivity (Mackey et al., 2007). In addition, diatoms constituted the dominant phytoplankton taxa on coastal Jeju Island. The species composition of diatoms varied from 55% to 81% of the total phytoplankton species (Kim et al., 2019). Here, the relative abundance of diatoms was highest in the summer season (81% for August) compared to that in the others [56% for March, 55% for October, 61% for December; Kim et al. (2019)]. This trend corresponds to the relatively high DSi flux derived from coastal SGD in summer (Kim et al., 2022). As SGD accounted for 80% of total DSi flux in this region (Kim et al., 2022), it was a major DSi source for diatoms. SGD-driven DSi appears to be biologically incorporated into biogenic silica in diatom species. Thus, the addition of DIP and DSi from SGD, particularly SFGD in the Hwasun region, increased the biological production of DOC and C4. The relationships between DOC concentration and nutrient fluxes showed not that significant compared to those of FDOMH (Figure 6). The enriched FDOMH components in the FGW seem to be conservatively mixed within the STE and directly transported to the coastal region. However, the production of DOC may be ultimately attributed by the nutrient addition via SGD followed by biological activities (e.g., primary production, extracellular release, excretion, and cell lysis) (Carlson and Hansell, 2015). This multi-step mechanism can require more time to associate the DOC concentration with the SGD-driven nutrient fluxes. The relatively low correlation between DOC and FDOMP is likely to be derived from the similar reason.
The availability of bio-limiting macronutrients can support the fixation of atmospheric carbon dioxide in the organic carbon pool (Harrison, 2017). The discharge of DIP-rich coastal groundwater allows active biological production, followed by the fixation of atmospheric carbon dioxide into an organic carbon pool in the ocean. For the growth of marine organisms involved in the carbon cycle, nutrient speciation is important for stoichiometric relationships (Tyrrell, 1999). Although the Redfield ratio for elemental composition exhibits large spatial variations, the overall stoichiometry of nutrients in most marine environments is close to the canonical Redfield ratio (C:N:P:Si = 106:16:1:16). Since DIP was the limiting macronutrient in this region, we calculated the potential capacity of carbon fixation by biological activity due to SGD-driven DIP addition. The quantity of incorporated organic carbon was calculated to be 1.5 ( ± 0.7) × 108 mol C/year [=1.8 ( ± 0.8) × 103 ton C/year] based on the DIP flux reported by Kim et al. (2022). Assuming the length of the coastline of Hwasun Bay to be 9 km and that of Jeju Island to be 258 km and the same DIP fluxes along the coastline, the biological fixation of the organic carbon accounted approximately for 4.3 ( ± 2.0) × 109 mol C/year [=5.2 ( ± 2.4) × 104 ton C/year] on Jeju Island. This corresponds to approximately 2% of terrestrial carbon uptake from South Korea (Yun and Jeong, 2021). Our results highlight that SGD-driven nutrients fuel biological carbon production and facilitate oceanic carbon storage in the coastal bay near the Jeju Island.
Conclusions
The DOC concentration in the FGW was low in the Jeju Island-adjacent bay and was comparable to that in the deep Pacific Ocean, which is the oldest water mass in the global ocean. Based on the significant correlation between DOC and FDOMP and an inverse relationship between DOC and FDOMP and salinity, DOC originates mainly from biological production in the coastal environment and mixes the depleted DOC of the GW in the STE. The FDOMH components were negatively correlated with salinity, and those in the SW were positively correlated with the fluxes of DIP and DSi from the SGD, indicating that the FDOMH originates from a natural source of terrestrial organic matter. Intriguingly, DOC, FDOMH, and FDOMP were not correlated with anthropogenic DIN fluxes. However, these organic substances were significantly correlated with the fluxes of natural-origin DIP and DSi. Because DIP is the primary limiting macronutrient, the addition of DIP can enhance biological production, followed by carbon fixation. SGD-driven DSi is incorporated into biogenic silica in the diatom species because of the dominant diatom taxa in the coastal sea. Thus, the addition of DIP and DSi from SGD increased biological production of DOC. Using the SGD-driven DIP fluxes and Redfield ratio, the quantity of incorporated organic carbon was calculated to be 1.8 × 10³ ton C/year, which accounts for 2% of the terrestrial carbon uptake from South Korea. Extensive investigations are necessary to evaluate the potential capacity of atmospheric carbon fixation by the biological activity of SGD, including saline SGD. Also, the contribution of carbon sink by refractory and labile DOC needs to be assessed to understand the marine carbon cycle and to predict global warming.
Data availability statement
The original contributions presented in the study are included in the article/Supplementary Material. Further inquiries can be directed to the corresponding author.
Author contributions
JK and T-HK conceived and designed this study. B-CS contributed to the sample collection and the chemical measurement of DOC and FDOM. JK performed the statistical data analysis and the PARAFAC model. JK and T-HK wrote the manuscript. All authors contributed to the article and approved the submitted version.
Funding
This work was supported by the National Research Foundation (NRF) funded by the Korean government (NRF-2021R1C1C1004733, NRF-2021R1A4A3029447, NRF-2019R1C1C1002197).
Acknowledgments
We would like to thank all crew members of R/V Je-Ra of Jeju National University for helping water sampling onboard.
Conflict of interest
The authors declare that the research was conducted in the absence of any commercial or financial relationships that could be construed as a potential conflict of interest.
Publisher’s note
All claims expressed in this article are solely those of the authors and do not necessarily represent those of their affiliated organizations, or those of the publisher, the editors and the reviewers. Any product that may be evaluated in this article, or claim that may be made by its manufacturer, is not guaranteed or endorsed by the publisher.
Supplementary material
The Supplementary Material for this article can be found online at: https://www.frontiersin.org/articles/10.3389/fmars.2022.971550/full#supplementary-material
References
Anschutz P., Smith T., Mouret A., Deborde J., Bujan S., Poirier D., et al. (2009). Tidal sands as biogeochemical reactors. Estuar. Coast. Shelf Sci. 84, 84–90. doi: 10.1016/j.ecss.2009.06.015
Beck A. J., Tsukamoto Y., Tovar-Sanchez A., Huerta-Diaz M., Bokuniewicz H. J., Sañudo-Wilhelmy S. A. (2007). Importance of geochemical transformations in determining submarine groundwater discharge-derived trace metal and nutrient fluxes. Appl. Geochem. 22, 477–490. doi: 10.1016/j.apgeochem.2006.10.005
Burnett W. C., Bokuniewicz H., Huettel M., Moore W. S., Taniguchi M. (2003). Groundwater and pore water inputs to the coastal zone. Biogeochemistry 66, 3–33. doi: 10.1023/B:BIOG.0000006066.21240.53
Cauwet G. (2002). “DOM in the coastal zone,” in Biogeochemistry of marine dissolved organic matter, vol. 579-602 . Eds. Hansell D. A., Carlson C. A. (San Diego, CA: ACADEMIC PRESS).
Carlson C. A., Hansell D. A. (2015). "DOM sources, sinks, reactivity, and budgets," in Biogeochemistry of marine dissolved organic matter (Second Edition), Eds. Ý. A. Hansell and C. A. Carlson (San Diego, CA: Academic Press), 65–126. doi: 10.1016/B978-0-12-405940-5.00003-0
Chen R. F., Bada J. L. (1992). The fluorescence of dissolved organic matter in seawater. Mar. Chem. 37 (3-4), 191–221. doi: 10.1016/0304-4203(92)90078-O
Clercq M. L., van der Plicht J., Gröning M. (1997). New 14C reference materials with activities of 15 and 50 pMC. Radiocarbon 40, 295–297. doi: 10.1017/S0033822200018178
Coble P. G. (2007). Marine optical biogeochemistry: the chemistry of ocean color. Chem. Rev. 107, 402–418. doi: 10.1021/cr050350+
Dainard P. G., Guéguen C. (2013). Distribution of PARAFAC modeled CDOM components in the north pacific ocean, Bering, chukchi and Beaufort seas. Mar. Chem. 157, 216–223. doi: 10.1016/j.marchem.2013.10.007
Defrancesco C., Guéguen C. (2021). Long-term trends in dissolved organic matter composition and its relation to Sea ice in the Canada basin, Arctic ocean, (2007–2017) Journal of Geophysical Research: Oceans 126, e2020JC016578. doi: 10.1029/2020JC016578
Hansell D. A., Carlson C. A. (1998). Deep-ocean gradients in the concentration of dissolved organic carbon. Nature 395, 263–266. doi: 10.1038/26200
Hansell D. A., Carlson C. A. (2001). Marine dissolved organic matter and the carbon cycle. Oceanography 14, 41–49. doi: 10.5670/oceanog.2001.05
Hansell D. A. (2013). Recalcitrant dissolved organic carbon fractions. Annual review of marine science. 5, 421–445.
Harrison D. P. (2017). Global negative emissions capacity of ocean macronutrient fertilization. Environ. Res. Lett. 12, 035001. doi: 10.1088/1748-9326/aa5ef5
Helms J. R., Stubbins A., Perdue E. M., Green N. W., Chen H., Mopper K. (2013). Photochemical bleaching of oceanic dissolved organic matter and its effect on absorption spectral slope and fluorescence. Mar. Chem. 155, 81–91. doi: 10.1016/j.marchem.2013.05.015
Jiao N., et al. (2010). Microbial production of recalcitrant dissolved organic matter: long-term carbon storage in the global ocean. Nature Reviews Microbiology. 8 (8), 593–599.
Kim G.-B., Kang S.-M., Lee J.-B. (2019). Spatial and temporal variation of phytoplankton community in the coastal waters of jeju island. Sea: J. Korean Soc. Oceanogr. 24, 92–105. doi: 10.7850/jkso.2019.24.1.092
Kim J., Kim G. (2016). Significant anaerobic production of fluorescent dissolved organic matter in the deep East Sea (Sea of Japan). Geophys. Res. Lett. 43, 7609–7616. doi: 10.1002/2016GL069335
Kim J., Kim G. (2017). Inputs of humic fluorescent dissolved organic matter via submarine groundwater discharge to coastal waters off a volcanic island (Jeju, Korea). Sci. Rep. 7, 7921. doi: 10.1038/s41598-017-08518-5
Kim J., Kim T.-H., Park S. R., Lee H. J., Kim J. K. (2020). Factors controlling the distributions of dissolved organic matter in the East China Sea during summer. Sci. Rep. 10, 11854. doi: 10.1038/s41598-020-68863-w
Kim T.-H., Kwon E., Kim I., Lee S.-A., Kim G. (2013). Dissolved organic matter in the subterranean estuary of a volcanic island, jeju: Importance of dissolved organic nitrogen fluxes to the ocean. J. Sea Res. 78, 18–24. doi: 10.1016/j.seares.2012.12.009
Kim J., Song B.-C., Lee M.-Y., Kim T.-H. (2022). Monthly variation in flux of inorganic nutrients from submarine groundwater discharge in a volcanic island: Significant nitrogen contamination in groundwater. Front. Mar. Sci. 9. doi: 10.3389/fmars.2022.835207
Kowalczuk P., Durako M. J., Young H., Kahn A. E., Cooper W. J., Gonsior M. (2009). Characterization of dissolved organic matter fluorescence in the south Atlantic bight with use of PARAFAC model: Interannual variability. Mar. Chem. 113, 182–196. doi: 10.1016/j.marchem.2009.01.015
Kroeger K., Charette M. (2008). Nitrogen biogeochemistry of submarine groundwater discharge. Limnol. Oceanogr. 53, 1025–1039. doi: 10.4319/lo.2008.53.3.1025
Kwon H. K., Kang H., Oh Y. H., Park S. R., Kim G. (2017). Green tide development associated with submarine groundwater discharge in a coastal harbor, jeju, Korea. Sci. Rep. 7, 6325. doi: 10.1038/s41598-017-06711-0
Kwon E. Y., Kim G., Primeau F., Moore W. S., Cho H. M., Devries T., et al (2014). Global estimate of submarine groundwater discharge based on an observationally constrained radium isotope model. Geophys. Res. Letters. 41 (23), 8438–8444. doi: 10.1002/2014GL061574
Lønborg C., Ãlvarez-Salgado X. A., Davidson K., Martínez-García S., Teira E. (2010). Assessing the microbial bioavailability and degradation rate constants of dissolved organic matter by fluorescence spectroscopy in the coastal upwelling system of the ría de vigo. Mar. Chem. 119, 121–129. doi: 10.1016/j.marchem.2010.02.001
Laane R. W. P. M., Kramer K. J. M. (1990). Natural fluorescence in the north Sea and its major estuaries. Netherlands J. Sea Res. 26, 1–9. doi: 10.1016/0077-7579(90)90052-I
Lee J., Kim G. (2015). Dependence of pH in coastal waters on the adsorption of protons onto sediment minerals. Limnol. Oceanogr. 60, 831–839. doi: 10.1002/lno.10057
Liu C., Du Y., Yin H., Fan C., Chen K., Zhong J., et al. (2019). Exchanges of nitrogen and phosphorus across the sediment-water interface influenced by the external suspended particulate matter and the residual matter after dredging. Environ. pollut. 246, 207–216. doi: 10.1016/j.envpol.2018.11.092
Mackey K. R. M., Labiosa R. G., Calhoun M., Street J. H., Post A. F., Paytan A. (2007). Phosphorus availability, phytoplankton community dynamics, and taxon-specific phosphorus status in the gulf of aqaba, red Sea. Limnol. Oceanogr. 52, 873–885. doi: 10.4319/lo.2007.52.2.0873
Moore W. S. (1999). The subterranean estuary: A reaction zone of ground water and sea water. Mar. Chem. 65, 111–125. doi: 10.1016/S0304-4203(99)00014-6
Moran M. A., Sheldon W. M., Zepp R. G. (2000). Carbon loss and optical property changes during long-term photochemical and biological degradation of estuarine dissolved organic matter. Limnol. Oceanogr. 45, 1254–1264. doi: 10.4319/lo.2000.45.6.1254
Murphy K. R., Hambly A., Singh S., Henderson R. K., Baker A., Stuetz R., et al. (2011). Organic matter fluorescence in municipal water recycling schemes: Toward a unified PARAFAC model. Environ. Sci. Technol. 45, 2909–2916. doi: 10.1021/es103015e
Murphy K. R., Stedmon C. A., Wenig P., Bro R. (2014). OpenFluor- an online spectral library of auto-fluorescence by organic compounds in the environment. Anal. Methods 6, 658–661. doi: 10.1039/C3AY41935E
Oehler T., Tamborski J., Rahman S., Moosdorf N., Ahrens J., Mori C., et al. (2019). DSi as a tracer for submarine groundwater discharge. Front. Mar. Sci. 6. doi: 10.3389/fmars.2019.00563
Panettieri M., Guigue J., Chemidlin Prevost-Bouré N., Thévenot M., Lévêque J., Le Guillou C., et al. (2020). Grassland-cropland rotation cycles in crop-livestock farming systems regulate priming effect potential in soils through modulation of microbial communities, composition of soil organic matter and abiotic soil properties. Agric. Ecosyst. Environ. 299, 106973. doi: 10.1016/j.agee.2020.106973
Paytan A., Mclaughlin K. (2007). The oceanic phosphorus cycle. Chem. Rev. 107, 563–576. doi: 10.1021/cr0503613
Rodellas V., Garcia-Orellana J., Masqué P., Feldman M., Weinstein Y. (2015). Submarine groundwater discharge as a major source of nutrients to the Mediterranean Sea. Proc. Natl. Acad. Sci. 112, 3926–3930. doi: 10.1073/pnas.1419049112
Søndergaard M., Stedmon C. A., Borch N. H. (2003). Fate of terrigenous dissolved organic matter (DOM) in estuaries: Aggregation and bioavailability. Ophelia 57, 161–176. doi: 10.1080/00785236.2003.10409512
Skoog A., Wedborg M., Fogelqvist E. (2011). Decoupling of total organic carbon concentrations and humic substance fluorescence in a an extended temperate estuary. Mar. Chem. 124, 68–77. doi: 10.1016/j.marchem.2010.12.003
Stedmon C. A., Bro R. (2008). Characterizing dissolved organic matter fluorescence with parallel factor analysis: A tutorial. Limnol. Oceanogr.: Methods 6, 572–579. doi: 10.4319/lom.2008.6.572
Stubbins A., Spencer R. G. M., Chen H., Hatcher P. G., Mopper K., Hernes P. J., et al. (2010). Illuminated darkness: Molecular signatures of Congo river dissolved organic matter and its photochemical alteration as revealed by ultrahigh precision mass spectrometry. Limnol. Oceanogr. 55, 1467–1477. doi: 10.4319/lo.2010.55.4.1467
Tyrrell T. (1999). The relative influences of nitrogen and phosphorus on oceanic primary production. Nature 400, 525–531. doi: 10.1038/22941
Webb J. R., Santos I. R., Maher D. T., Tait D. R., Cyronak T., Sadat-Noori M., et al. (2019). Groundwater as a source of dissolved organic matter to coastal waters: Insights from radon and CDOM observations in 12 shallow coastal systems. Limnol. Oceanogr. 64, 182–196. doi: 10.1002/lno.11028
Wünsch U. J., Geuer J. K., Lechtenfeld O. J., Koch B. P., Murphy K. R., Stedmon C. A. (2018). Quantifying the impact of solid-phase extraction on chromophoric dissolved organic matter composition. Mar. Chem. 207, 33–41. doi: 10.1016/j.marchem.2018.08.010
Yamashita Y., Tanoue E. (2008). Production of bio-refractory fluorescent dissolved organic matter in the ocean interior. Nat. Geosci. 1, 579–582. doi: 10.1038/ngeo279
Yun J., Jeong S. (2021). Contributions of economic growth, terrestrial sinks, and atmospheric transport to the increasing atmospheric CO2 concentrations over the Korean peninsula. Carbon Balance Manage. 16, 22. doi: 10.1186/s13021-021-00186-3
Keywords: dissolved organic carbon, submarine groundwater discharge, fluorescent dissolved organic matter, Parallel factor analysis, nutrient, carbon fixation, carbon cycle, Redfield ratio
Citation: Kim J, Song B-C and Kim T-H (2022) Origin of dissolved organic carbon under phosphorus-limited coastal-bay conditions revealed by fluorescent dissolved organic matter. Front. Mar. Sci. 9:971550. doi: 10.3389/fmars.2022.971550
Received: 17 June 2022; Accepted: 12 September 2022;
Published: 29 September 2022.
Edited by:
Jun Sun, China University of Geosciences Wuhan, ChinaReviewed by:
Zhuo-Yi Zhu, Shanghai Jiao Tong University, ChinaFajin Chen, Guangdong Ocean University, China
Copyright © 2022 Kim, Song and Kim. This is an open-access article distributed under the terms of the Creative Commons Attribution License (CC BY). The use, distribution or reproduction in other forums is permitted, provided the original author(s) and the copyright owner(s) are credited and that the original publication in this journal is cited, in accordance with accepted academic practice. No use, distribution or reproduction is permitted which does not comply with these terms.
*Correspondence: Tae-Hoon Kim, dGhraW04MEBqbnUuYWMua3I=