 Calvin N. Quigley
 Moninya Roughan
 Romain Chaput
 Andrew G. Jeffs
 Jonathan P. A. Gardner
- 1School of Biological Sciences, Victoria University of Wellington, Wellington, New Zealand
- 2Coastal and Regional Oceanography Lab, School of Biological Earth and Environmental Sciences, University of New South Wales (UNSW) Sydney, Sydney, NSW, Australia
- 3School of Biological Sciences, University of Auckland, Auckland, New Zealand
Understanding how ocean currents affect larval transport is crucial for understanding population connectivity in sessile marine invertebrates whose primary dispersal opportunity occurs during the pelagic larval stage. This study used Lagrangian particle tracking experiments to examine population connectivity in New Zealand green-lipped mussels (Perna canaliculus) at the national scale. Predicted patterns of larval dispersal were compared to published multi-locus microsatellite data of observed population genetic structure. Estimates of oceanographic circulation correlated significantly with FST, and we conclude that hydrodynamic processes are important in driving genetic connectivity. However, no evidence was found for an oceanographic barrier to gene flow south of Cook Strait, an important feature of genetic structure observed across several marine invertebrate species. Discrepancies between genetic and biophysical data may be explained by several factors including the different timescales of connectivity described by the two methods and the impact of localised ecological conditions and corresponding adaptations in genetic structure not captured by the bipohysical model. Population genetic analyses provide empirical data on realised connectivity and Lagrangian particle tracking experiments reveal information about directionality and asymmetry of connections that often cannot be determined by molecular analyses alone, thus a multidisciplinary approach is recommended.
1 Introduction
Population connectivity may be defined as the degree of gene flow among demographic groups within a population, and is a major driver of population dynamics at both ecological and evolutionary time scales. At the ecological level, the impact of immigration and emigration on demography is immediately relevant to ecosystem management and conservation challenges, such as the spatial planning of marine protected areas to ensure habitat connectivity and protection of source populations (Crowder et al., 2000; Hansen, 2011; Berglund et al., 2012; Coleman et al., 2017), calculation of total allowable catch in contiguous quota management areas (Hannesson, 2013), and predicting dispersal rates and patterns of invasive species (Roughan et al., 2011; Delaney et al., 2012). At the evolutionary scale, patterns of gene flow (and absence of gene flow) determine the rate of genetic divergence between populations and can ultimately lead to allopatric speciation (i.e., speciation by geographic isolation) (Slatkin, 1987). When gene flow between populations is limited, selective pressure and localised adaptation, genetic drift, and the accumulation of local random mutations can result in variations in allele frequencies among populations within a species. In species that are managed as part of fisheries or aquaculture industries, this genetic structure is important to consider when delineating stock boundaries so that evolutionarily significant units (ESUs) are protected from excess harvest pressure (Pita et al., 2016; Papa et al., 2021). Management at the level of ESUs can help preserve genetic diversity within the species and maximise adaptive potential to new threats such as climate change (Jump et al., 2009; Mable, 2019). Thus, an understanding of connectivity at both ecological and evolutionary timescales is vital for successful management of a target species.
For many broadcast spawning marine species, the primary dispersal opportunity, and therefore the driver of connectivity between populations, occurs during the pelagic larval stage (Cowen and Sponaugle, 2009). Such species may undergo external fertilization via broadcast spawning (Lotterhos and Levitan, 2010), after which larvae spend a period in the water column, known as the pelagic larval duration (PLD) (Selkoe et al., 2016). Despite historical assumptions that species with extended PLDs will approach genetic panmixia due to large-scale dispersal of larvae by ocean currents, genetic analyses have often reported higher than anticipated levels of genetic structure for species with PLDs on the order of weeks to months s (Weersing and Toonen, 2009; Kelly and Palumbi, 2010; Selkoe et al., 2016). One explanation for this phenomenon is that ocean currents often do not result in maximum dispersal of larvae: regional circulation may result in directional gene flow or form barriers between populations and persistent directional currents may prevent panmixia, even among species with extended PLDs (e.g., Liggins et al., 2016). Additionally, selective pressure and local adaptation to environmental variables may produce patterns of genetic structure that cannot be explained by PLD or ocean circulation (Loveless and Hamrick, 1984; Dionne et al., 2008).
To investigate potential pathways for larval transport and to test hypotheses about patterns of genetic structure, biophysical Lagrangian particle tracking experiments coupled with hydrodynamic models for a region of interest are increasingly employed (Swearer et al., 2019), and their results can be compared to analyses of connectivity reported by population genetic data (reviewed by Jahnke and Jonsson, 2022). Several studies have reported correlations between modelled particle transport rates and measures of genetic distance (such as FST) (e.g., Coleman et al., 2011; Coleman et al., 2013; Munguia-Vega et al., 2014; Jahnke et al., 2018), while others have found no such relationship (e.g., Lourenço et al., 2017; Sefbom et al., 2018; Valencia et al., 2021). Detailed explanations for why these relationships exist in certain species and/or regions and not others are not yet well developed, and further information about how best to interpret these two types of data together would be a valuable contribution to this novel multidisciplinary field. The present study describes many of these challenges through the application of a biophysical Lagrangian particle tracking model, which is compared to a multi-locus population genetic analysis to examine connectivity among populations of the New Zealand endemic green-lipped mussel, Perna canaliculus, at the national scale.
Perna canaliculus is a benthic bivalve of great ecological, cultural and economic importance in New Zealand. Once present in large numbers in subtidal, soft-sediment beds where it played a role in forming biogenic reefs (Greenway, 1969), it is now most commonly found on intertidal and shallow subtidal rocky reefs, although it can also occur at depths of up to 50 m (Jeffs et al., 1999). Distribution of P. canaliculus is intermittent around the ~15,000 km of New Zealand’s coastline, which spans ~13 degrees of latitude (Paul, 2012). Bivalve reefs provide important ecosystem services, such as nutrient cycling, habitat construction, and water filtration (Grabowski and Peterson, 2007; McLeod et al., 2014). Green-lipped mussels are a taonga (treasure) species and a valuable food source for indigenous Māori, for whom they are known as kutai or kuku (Paul-Burke et al., 2018). Green-lipped mussels are also important to New Zealand’s aquaculture industry, where they are marketed as Greenshellript™ mussels. The Greenshell™ mussel is New Zealand’s most valuable seafood product by export value, with over NZ$300 million of mussels exported in 2019 (Seafood New Zealand, 2018). An understanding of population connectivity in P. canaliculus is especially important for the Greenshell™ aquaculture because of the industry’s reliance on wild caught mussel spat (juvenile mussel recruits)— 80% of cultured mussels are grown from spat collected at a single site, Ninety Mile Beach, on the northernmost peninsula of New Zealand (Alfaro et al., 2011). Information on population connectivity in the region is needed to ensure that adequate protection is provided to populations that may act as larval sources for this important natural resource.
Three previous studies have described genetic connectivity of population genetics in P. canaliculus at the national scale (Apte and Gardner, 2002; Star et al., 2003; Wei et al., 2013). These studies used three different types of genetic markers extracted from the same group of sampled individuals: single-strand conformation polymorphisms (SSCPs), random amplified polymorphic DNA (RAPD), and simple sequence repeats (SSRs or microsatellites). Each of these studies reported the existence of a northern and a southern cluster, with a genetic break located just south of Cook Strait, the body of water that separates the North Island from the South Island of New Zealand. Several other marine invertebrate taxa have shown similar genetic discontinuities in this region (e.g., Ayers and Waters, 2005; Veale and Lavery, 2011, reviewed in Gardner et al., 2010), leading to hypotheses about possible environmental drivers of this multi-taxon genetic discontinuity. The authors of several of these studies propose that contemporary oceanographic features, including upwelling near Cape Kahurangi on the north-western coast and/or Cape Campbell on the north-eastern coast of the South Island (Chiswell et al., 2017), may be responsible for this genetic break (Apte and Gardner, 2002; Wei et al., 2013).
This work contributes to an emerging multidisciplinary field of study that brings together traditional population genetics with biophysical modelling of larval transport (Jahnke and Jonsson, 2022), and further examines some of the challenges of combining these two different types of data. The aims of this study include evaluating the extent to which Lagrangian particle tracking can predict observed patterns of genetic connectivity in P. canaliculus, and identifying potential asymmetries in connectivity that may lead to source/sink dynamics. Additionally, the hypothesis that contemporary oceanography may be contributing to the ongoing maintenance of the genetic discontinuity observed south of Cook Strait is tested. This is the first time that this multidisciplinary approach to population connectivity has been applied to P. canaliculus, and is an example of how particle tracking and genetic data may be combined to better understand connectivity at a spatial scale that includes all of a species’ geographic range, rather than a subset of its distribution.
2. Materials and methods
2.1 Genetic data and analyses
This work builds upon genetic analyses reported in a previous national scale study that sampled 14 populations around the country using microsatellite markers (Figure 1, Wei et al., 2013). This data set was chosen because microsatellite markers are more likely to reflect contemporary structure due to their high mutation rate and because additional sample populations in the Cook Strait region provide enhanced resolution in this region (Selkoe and Toonen, 2006). Several results published in the Wei et al. (2013) study are used in the current study, i.e., the pairwise matrix of FST values between populations was used as a measure of genetic distance between populations, luster membership inferences predicted by STRUCTURE (Pritchard et al., 2000; Dunphy et al., 2015), and assignment tests of individuals to likely source populations (performed using Geneclass2) that were used to estimate first generation migration between populations (Piry et al., 2004). In the present work, an additional genetic clustering analysis of the microsatellite data set was performed using Geneland’s spatial model (version 4.0.5) (Guillot et al., 2005), with a minimum of 1 population (panmixia), 2 initial populations (the structure reported by previous analyses), and a maximum of 14 populations (the number of sites sampled, complete genetic isolation amongst all 14 demes). In total, 25 independent runs were calculated with 100,000 iterations, thinned to every 100th iteration, and discarding the first 200 iterations. The uncorrelated allele and null allele models were used. Of the 25 independent runs, the most commonly calculated solutions are presented. Global FST across all loci was calculated in Genepop (Version 4.7) (Rousset, 2017).
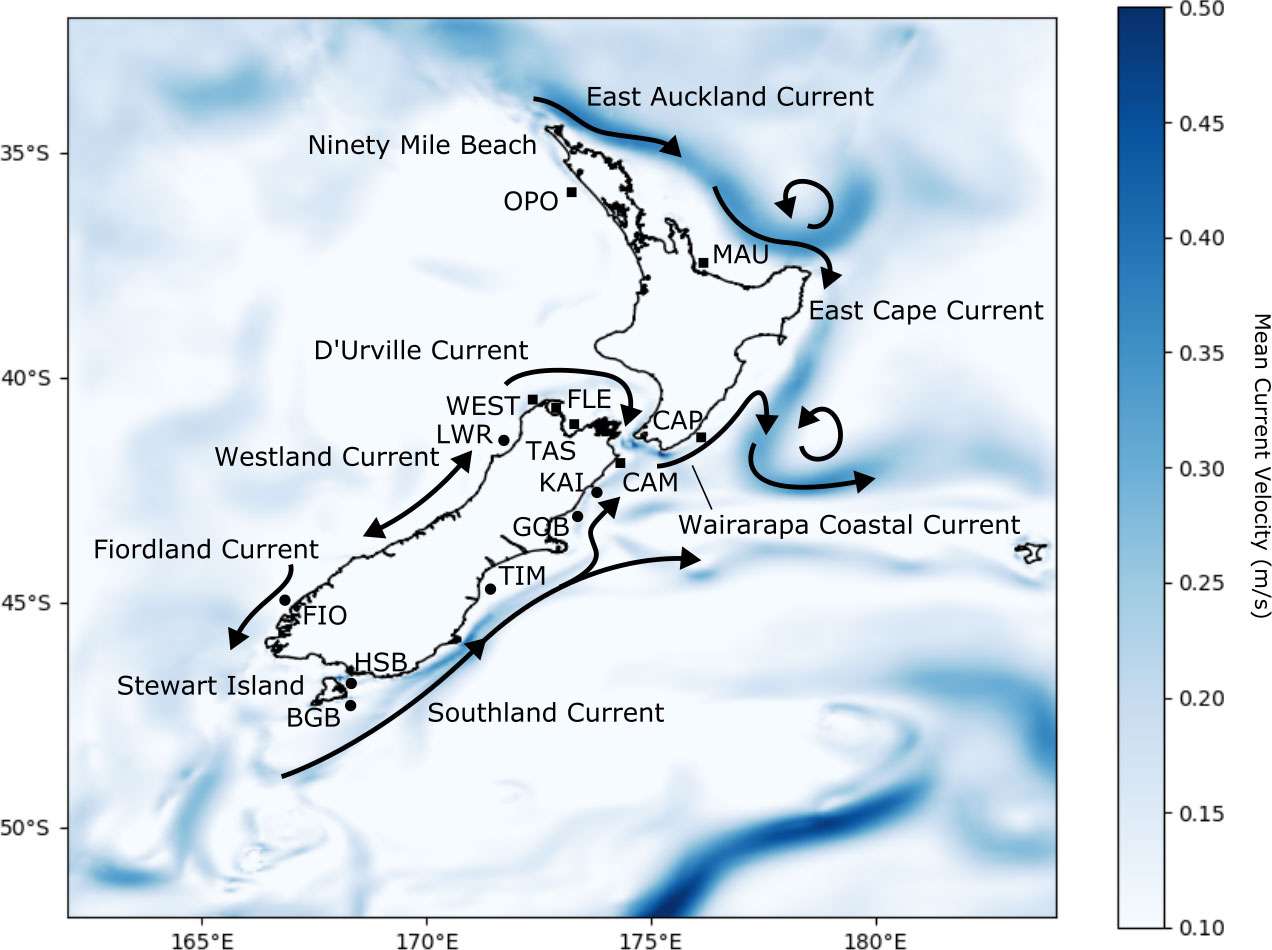
Figure 1 Map of sites sampled by Apte and Gardner (2002) and Wei et al. (2013) used for this study: Opononi (OPO, n = 27), Maunganui (MAU, n = 29), Castlepoint (CAP, n = 30), Westhaven (WEST, n = 13), Fletchers Beach (FLE, n = 14), Tasman Bay (TAS, n = 20, one individual missing data at one locus), Cape Campbell (CAM, n = 30, one individual missing data at one locus), Little Wanganui River (LWR, n = 26), Kaikoura (KAI, n = 16), Gore Bay (GOB, n = 28), Timaru (TIM, n = 22, one individual missing data at one locus), Fiordland (FIO, n = 19), Horseshoe Bay (HSB, n = 22), and Big Glory Bay (BGB, n = 20). Populations are coded according to genetic clusters reported by Wei et al.: squares represent populations in the northern cluster and circles represent populations in the southern cluster. Landmarks referenced in the text and prevailing currents around New Zealand are shown. Mean current velocity magnitudes across the 23 years of the analysis are represented by the blue field.
2.2 Biophysical modelling
2.2.1 Hydrodynamic model
All oceanographic simulations were conducted using the Moana Ocean Hindcast model, a 25 year hindcast of ocean circulation around New Zealand developed using the Regional Ocean Modeling System (ROMS) version 3.9 (De Souza et al., 2022). The domain is defined by a curvilinear grid extending from 161°E to 176°W and from 52°S to 31°S. The horizontal resolution of the model ranges from 4.1 km in the south to 5.8 km in the north. The model includes 50 vertical layers and uses a vertical stretching function to provide increased resolution at the surface and the sea floor as described in De Souza et al. (2015). The model was run from 1993 to 2020 at a temporal resolution of one hour, with the first year being discarded as an initialization period. All analysis in this study was performed using hourly output fields of all ocean state variables and velocities. The model also takes into account atmospheric forcing, including winds, humidity, air temperature, and sea level pressure provided by the Climate Forecast System Reanalysis (CFSR), National Center for Atmospheric Research (NCAR). Tides were included using data provided by the TPXO global tidal solution (Egbert and Erofeeva, 2002), along with fresh water inputs from 42 rivers around New Zealand (climatological data available from data.govt.nz). The model has been shown to reliably reproduce the coastal circulation around New Zealand, making it suitable for this study. Full configuration and validation of the Moana Backbone model is described in De Souza et al. (2022).
2.2.2 Particle tracking
Larval dispersal events were simulated using OpenDrift, an open source Lagrangian particle tracking tool implemented in Python (Dagestad et al., 2018). All simulations were performed offline using a module specifically developed for bivalve larvae (a version of the module described in Norrie et al., 2020). The domain of the model was divided into a 0.1 x 0.1 degree grid (~10 x 10 km), and one grid cell was chosen to represent each of the mussel sampling sites. For each site, particles were randomly seeded within a uniform 2,500 m radius of the cell centroid. While mussel spawning occurs at the seafloor, because of the resolution of the model near the coast, it is only possible to represent particles once they have left the nearshore. Thus, particles were randomly seeded in the top 10 m of the water column, where larvae of comparable taxa are most often found (McQuaid and Phillips, 2000; Dobretsov and Miron, 2001). No study of larval swimming behaviour, vertical distribution, or cross-shelf distribution has been conducted for green-lipped mussel larvae in New Zealand, and studies of closely related taxa have shown conflicting patterns of larval behaviour, with some studies reporting signs of vertical migration (Dobretsov and Miron, 2001; Knights et al., 2006), while others have shown no evidence for vertical migration (McQuaid and Phillips, 2000).Thus, specific swimming behaviours were not included in the biophysical model and simulated larvae drifted as passive particles.
Eleven particles were released from each site each hour, averaging 8,000 particles released per site per month, for every month of the year from 1994-2016. Over the entire simulation period, this resulted in > 2 million particles released per site over the 23 years, with ~30 million particles in total for the entire study. Particles were released throughout the year because timing of mussel spawning is highly variable, and mussels with ripe gametes have been found at all latitudes throughout the year, leading to a continuous supply of larvae in the water column due to trickle spawning (Jenkins, 1979; Hickman and Illingworth, 1980; Alfaro et al., 2001). Settlement competency age for larvae (particles in the model) was set as a window from 3 to 6 weeks to reflect the pelagic larval duration of green-lipped mussels (Jeffs et al., 1999). Any particle that entered a grid cell representing a mussel sampling site during this competency window was considered to have settled successfully. Particles that had not settled within 6 weeks were retired (i.e., they represent larvae unable to settle and lost to the system). Particles were advected using a fourth order Runge-Kutta scheme. Horizontal diffusion of 0.1164 m2s-1 was included to account for variability not captured by the resolution of the hydrodynamic model as calculated using the equations in Okubo and Ebbesmeyer (1976), along with 0.01 m2s-1 of vertical diffusion (Table 1).
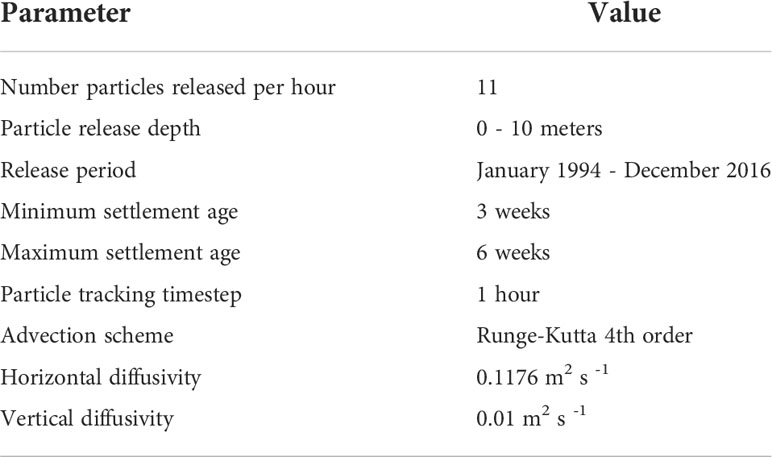
Table 1 Parameters for particle tracking.
2.2.3 Number of particles
To determine the number of particles to release per site that optimised computational efficiency while still being robust enough to capture all the variability of the model, the methodology of Simons et al. (2013) was applied. For two of the areas in the domain of the hydrodynamic model with the highest variability in ocean current velocities (Cape Reinga at the northern-most peninsula of the North Island and the Otago coast along the southeast of the South Island) one grid cell was fully saturated with particles every month (~36,000 particles per month) every other year from 1994 to 2016. From these fully saturated data sets, 100 subsamples of decreasing numbers of particles were taken. For each subsample, the fraction of unexplained variance (FUV) between the particle density distribution (PDD) of the subsample and that of the saturated data set was calculated as 1 subtracted by the linear correlation coefficient between the two PDDs. From the 100 repetitions for each size of subsample, the highest value of FUV was taken and plotted, resulting in a curve for each month whereas the size of the subsample increases, the FUV approaches zero. The mean of these curves was taken, and the point at which the mean FUV fell below 0.05 (a number chosen to be reminiscent of a 0.05 p-value) was determined to be a sufficient number of particles to accurately represent the PDD of the fully saturated data set. For this work, this number was approximately 8,000 particles per site per month.
2.3 Data analyses
A connectivity matrix C was constructed from the results of the particle tracking experiment, such that cell Cij shows the number of particles that were released from site i (along the y axis) and settled in site j (along the x axis). The diagonal of this matrix, e.g., Cii, showed local retention, or the proportion of particles released from site i that return to settle at site i. This connectivity matrix was then transformed to a migration matrix M by normalising each column such that cell Mij shows the proportion of total recruitment in site j that consists of particles that originated from site i.In this matrix the diagonal represents self-recruitment, or the proportion of recruits at site i that were released from site i, and each column sums to 1. Clusters in the oceanographic connectivity data were identified and compared to genetic structure by visual assessment.
The migration matrix was then compared to two matrices of genetic connectivity to assess the concordance of biophysical and genetic approaches to studying population connectivity: a pairwise FST matrix, and a pairwise matrix of the results of assignment testing of individuals performed in Geneclass2, where the rows show the likely source population for individuals sampled from each population. As FST does not provide for an estimate of self-recruitment rates, the diagonals of both matrices were dropped for analyses of the relationship between the particle tracking experiments and FST. Additionally, because FST is a symmetric measure of genetic distance (A→B = B→A), the migration matrix was transformed to represent a symmetric measure of öceanographic distance” by taking the mean of transport A→B and B→A and only one triangle of each matrix was used to maintain independence of data points in the correlation [as in De Wit et al. (2019)]. A variation of the Mantel test was performed between the migration matrix and the pairwise FST matrix and the results of assignment testing of individuals to their likely source population as reported by Geneclass2. First, Pearson’s correlation coefficient R was calculated between each pairwise value in the two matrices (n = 91 for comparisons between the migration matrix and the FST matrix, n = 196 for the matrix of assignment tests). Then 1,000,000 permutations of the data were performed and a distribution of correlation coefficients from scenarios with no discernible statistical signal were obtained. The relationship between the two matrices was reported as significant if the correlation coefficient fell within the bottom 5% of the R distribution of permuted data. To determine whether oceanographic connectivity was a more effective predictor of genetic structure than a pattern of isolation by distance (IBD), the correlation between the FST matrix and the migration matrix was compared to the correlation between the FST matrix and a matrix of pairwise overwater distances between populations. Despite potential challenges in identifying IBD in populations with geographically distinct genetic structure (Meirmans, 2012; Perez et al., 2018) this was done following the methods presented in Jahnke and Jonsson (2022) who use IBD as a null model against which to compare the correlation of the migration matrix produced by the biophysical model to a matrix of genetic distance, such as FST.
Probability density functions (PDFs) were produced for each release site by recording the position of each particle at each hourly time step between weeks 3 and 6, or the settlement competency period. At Little Wanganui River (LWR), a site of particular interest because of its position just south of the observed genetic break, one PDF was generated for particles released in summer (Jan-Mar), autumn (Apr-Jun), winter (Jul-Sep), and spring (Oct-Dec) across all 23 years of simulations in order to examine the possible existence of a seasonal barrier to geneflow in this important phylogeographic region.
3 Results
3.1 Genetic analyses
Global FST across all loci was 0.021. Pairwise values of FST between populations ranged from 0 (multiple pairs of populations— note that negative values were set to 0) and 0.081 (MAU and TIM) (Figure 2; Supplementary Table 1). Assignment tests performed in GeneClass2 by Wei et al. (2013) suggest high levels of self-recruitment, with individuals being assigned to their sampled populations at rates ranging from 48% (CAM) to 93.3% (CAP) (mean = 70.41, SD = ± 14.43). Of the 182 possible connections between pairs of populations, 53 pathways were taken by at least one migrant, for a total connectance rate (number of pathways taken by at least one particle/total number of possible pathways) of 29.1%. Of all the potential first generation migrants, a total of 72% were assigned to one of four source populations: HSB, GOB, TAS, and CAP (Figure 2) Wei et al. (2013).
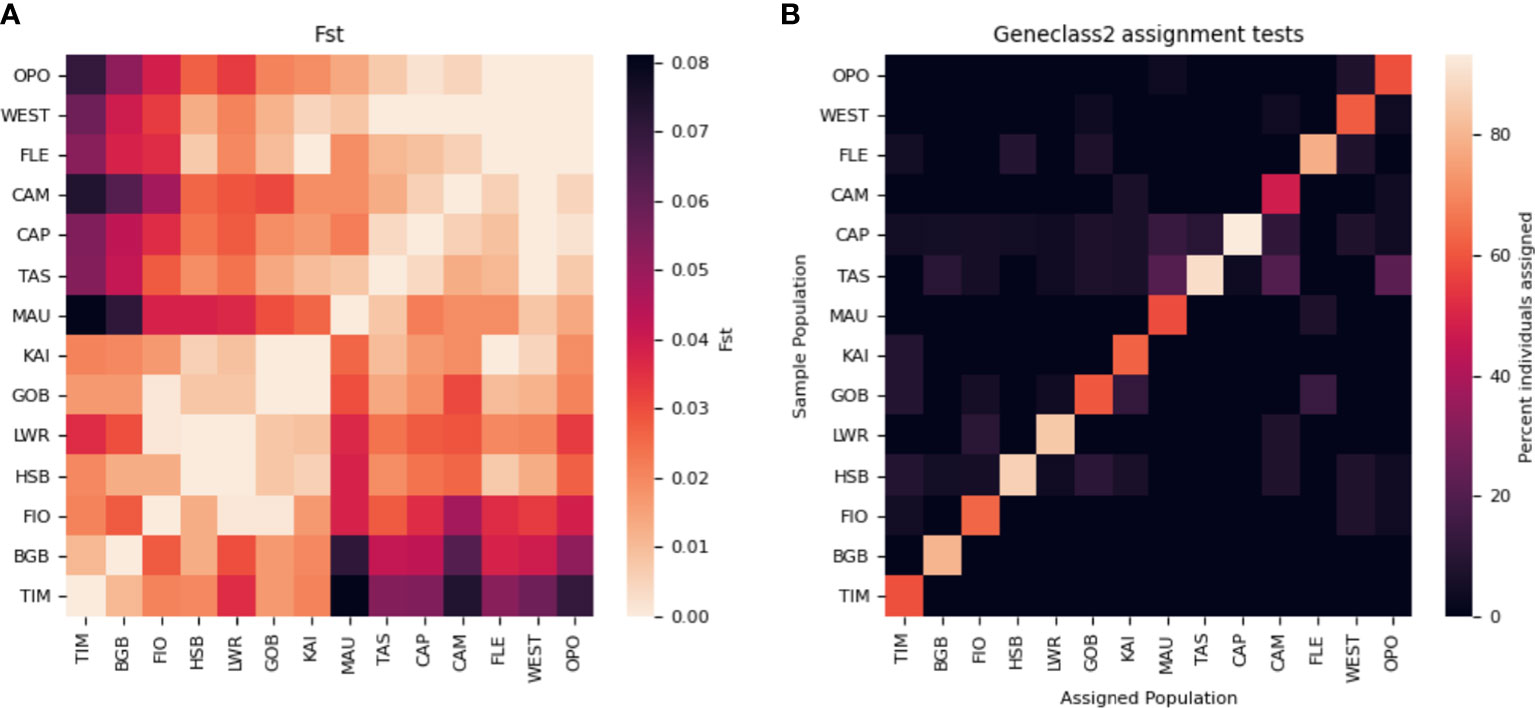
Figure 2 Matrices of genetic connectivity: (A) Pairwise FST and (B) assignment tests of individuals. Populations are ordered along the axes according to UPGMA tree analyses performed in Wei et al. (2013).
The identification of genetic clusters by Geneland returned three possible solutions from the 25 independent runs. In total, 13 runs found k = 4 clusters, with a northern cluster consisting of populations in the North Island and northern South Island (OPO, MAU, CAP, WEST, FLE, TAS, CAM), a cluster of western South Island populations (LWR, FIO), a cluster of eastern South Island populations (TIM, GOB, KAI), and a cluster consisting of the two Stewart Island populations (HSB, BGB). In total, 12 runs reported k = 3, following the above structure while including the Stewart Island populations in the eastern South Island cluster, and two runs reported k = 2, which did not differentiate between the east and west coasts of the southern South Island (Figure 3).
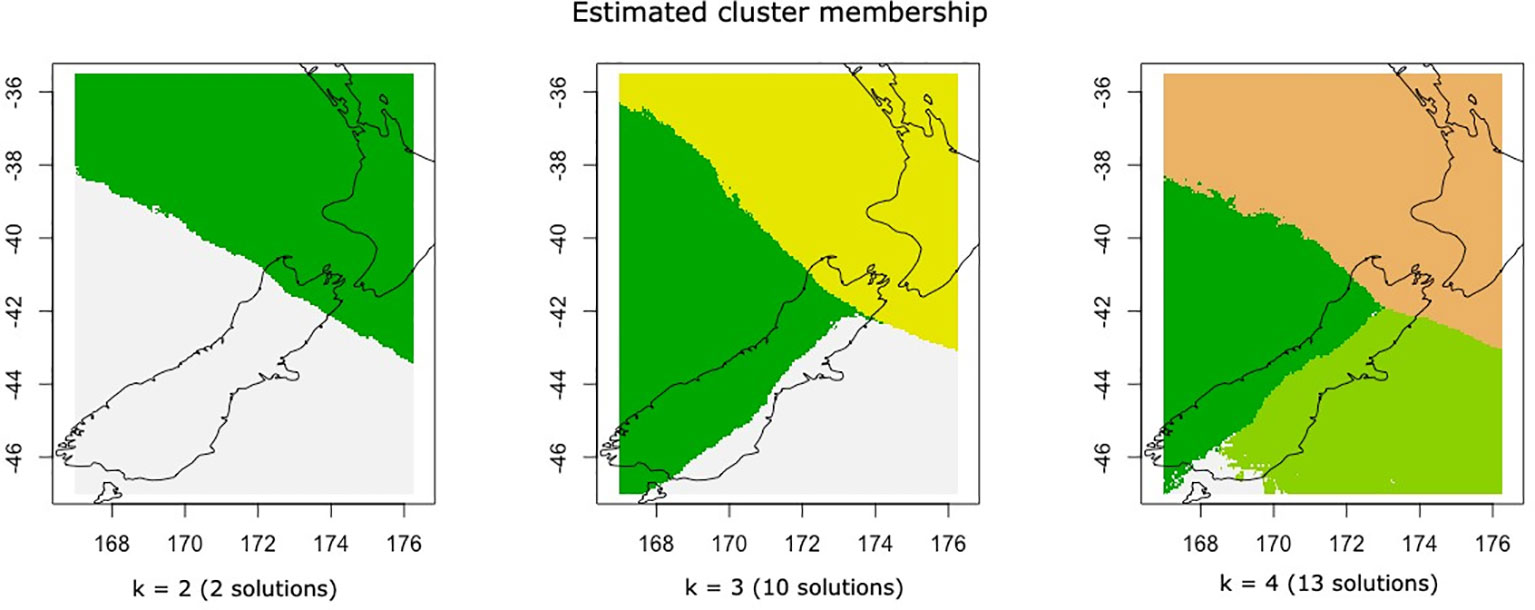
Figure 3 Model solutions of genetic structure (k = number of groups detected) as calculated by Geneland and the number of independent runs (out of 25) that arrived at each solution.
3.2 Particle tracking model
Of the ~30 million particles released over the 25-year period, 50.3% reached a coastal settlement grid cell during the competency period and were considered to have settled, with 5.0% settling in cells representing the 14 mussel sampling sites. Successful settlement rates ranged among sites, from 79.6% (TAS) to 25.2% (CAM) (mean = 50.3%, SD = ±14.9). Of the 182 possible connections between the 14 sites, 52 pathways were taken by at least one particle, giving a total connectance rate of 28.6%. Migration rates between connected sites ranged from 3% (65,084 particles from GOB to KAI) to < 0.001% (1 particle from TAS to CAM) (Figure 4).
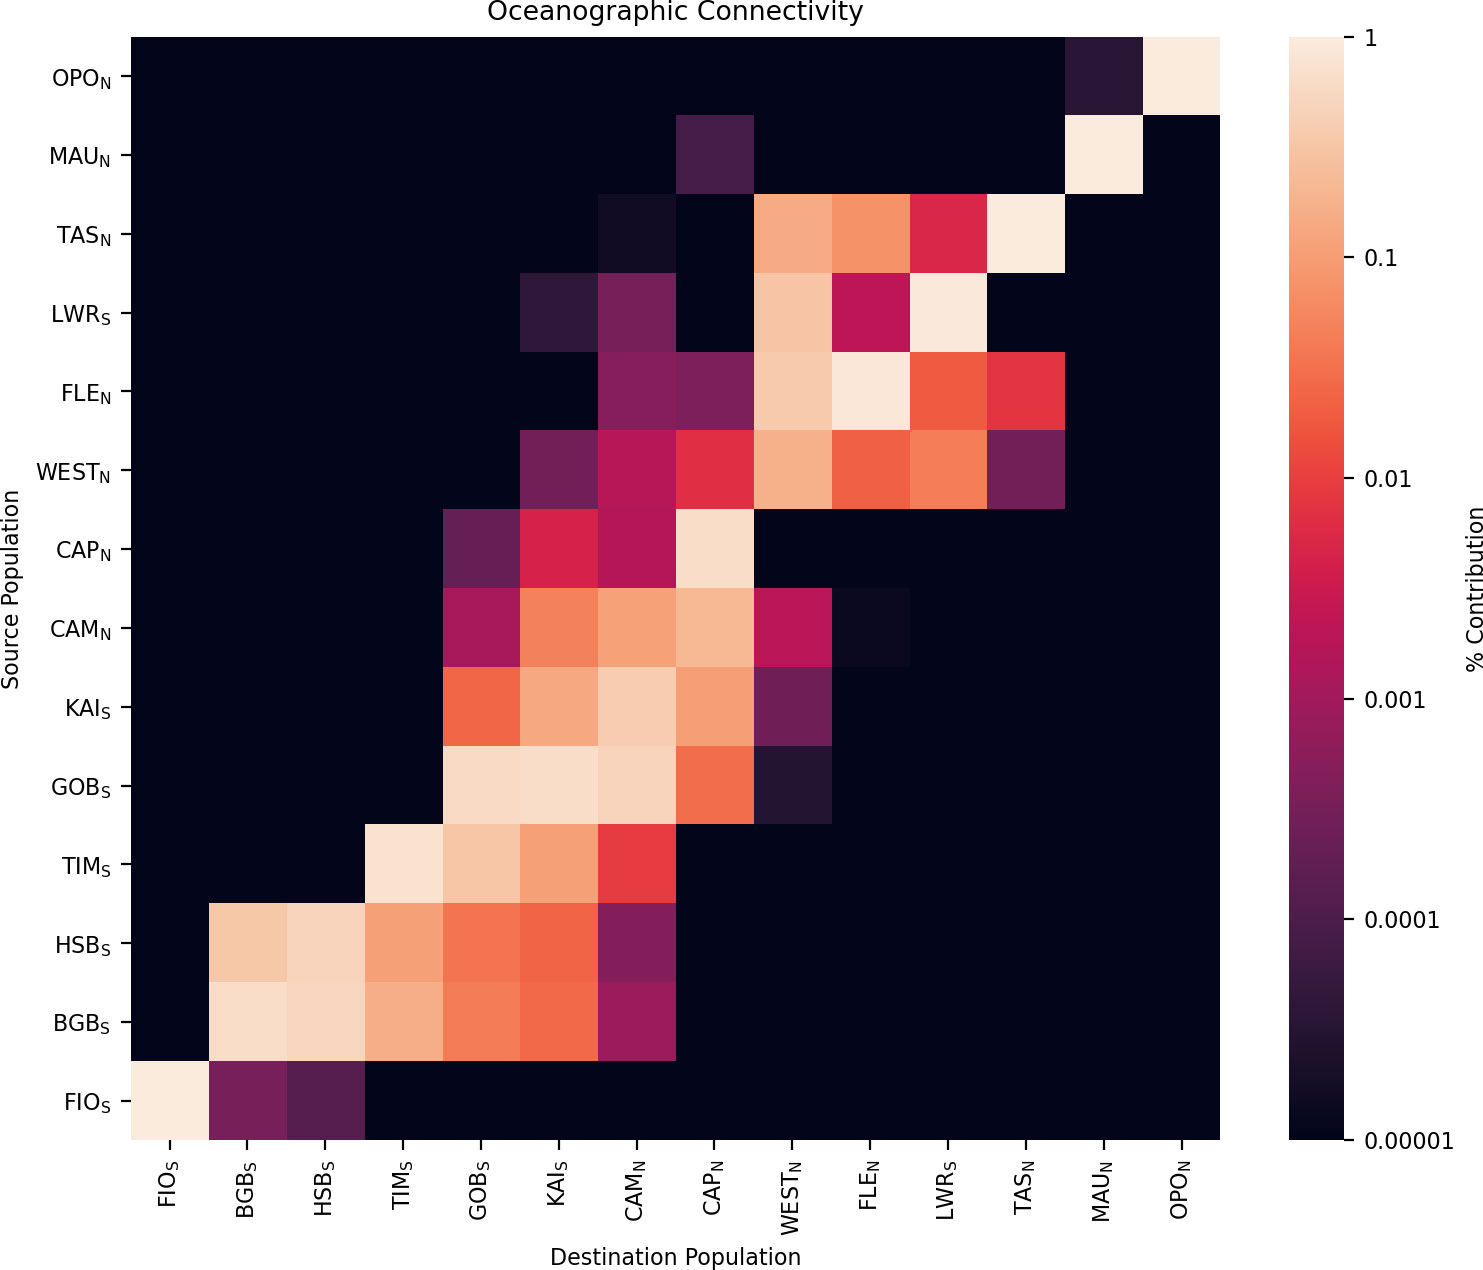
Figure 4 Connectivity matrix for 14 sites sampled for microsatellite loci. Data are presented as the proportion of total particles that settle in each destination populations (columns) that originate from each source population (rows). Populations are ordered to highlight clustering structure, and are shown roughly south to north. Self-recruitment can be seen along the diagonal. Subscripts to population names indicate clusters as assigned by STRUCTURE and Geneland analyses.
For all but four sites (WEST, CAM, KAI, and BGB), the most important source of larvae was self-recruitment. Within the 14 mussel sampling sites, self-recruitment rates (number of individuals sourced from site i recruited at site i/total recruitment at site i) varied from 100% (OPO, MAU, FIO) to 11.3% (CAM) with a mean of 67% (SD = ± 32). Local retention rates (number of individuals released from site i that return to site i/total number of individuals released from site i ranged from 16.8% (LWR) to 0.3% (CAM) with a mean of 3.8% (SD = ± 4.5) (Table 2).
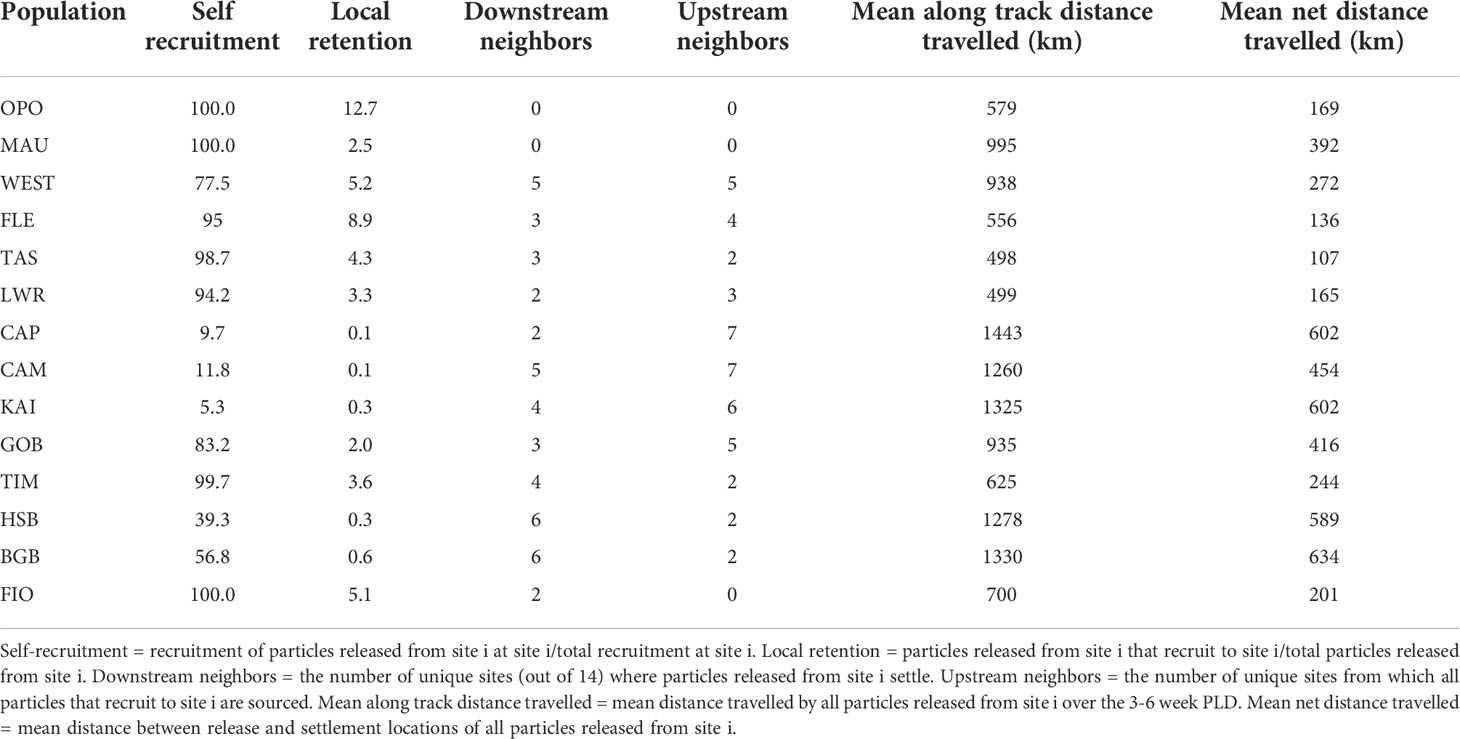
Table 2 Network and dispersal statistics for each population.
Two primary clusters were identified in the particle tracking matrix: a southern cluster consisting of the populations along the southern and western coasts of the South Island (FIO, BGB, HSB, TIM, GOB, KAI, and CAM) as well as the population at Castlepoint (CAP) located on the south-east coast of the North Island, and a central cluster that included the populations on the north-west coast of the South Island (LWR, TAS, FLE, and WEST) (Figure 5). In the southern cluster, connections occurred primarily to the right of the diagonal (from south to north), while connectivity within the central cluster was more symmetrical, with connections on both sides of the diagonal. Connections between the two clusters occurred primarily from the central cluster into the south through FLE and WEST, although there was some northward transport from the southern cluster through WEST. The two northernmost populations (OPO and MAU) were nearly completely isolated from all other populations in the migration matrix. The PDFs of the 14 sites grouped by cluster further demonstrate this structure, as there is limited overlap among the dispersal kernels of the two clusters (Figure 6).
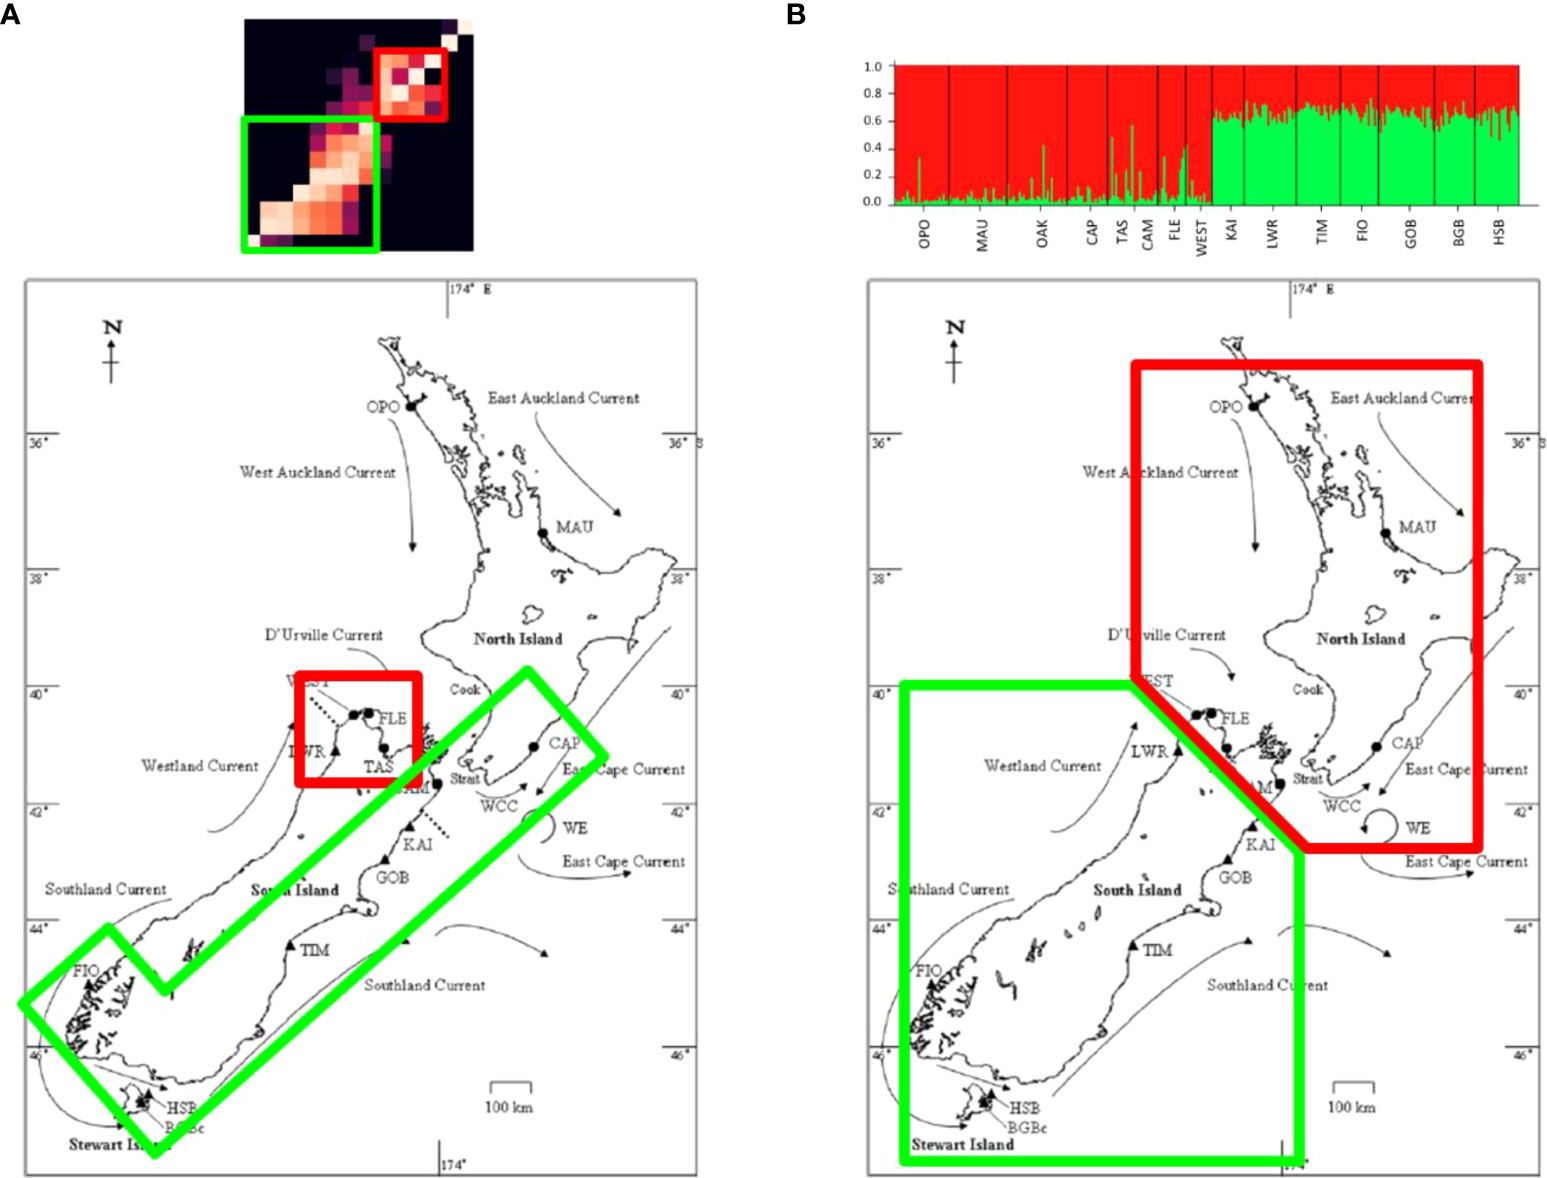
Figure 5 Clustering as predicted by (A) the particle tracking model and (B) molecular analyses (in this case, Structure) (right).
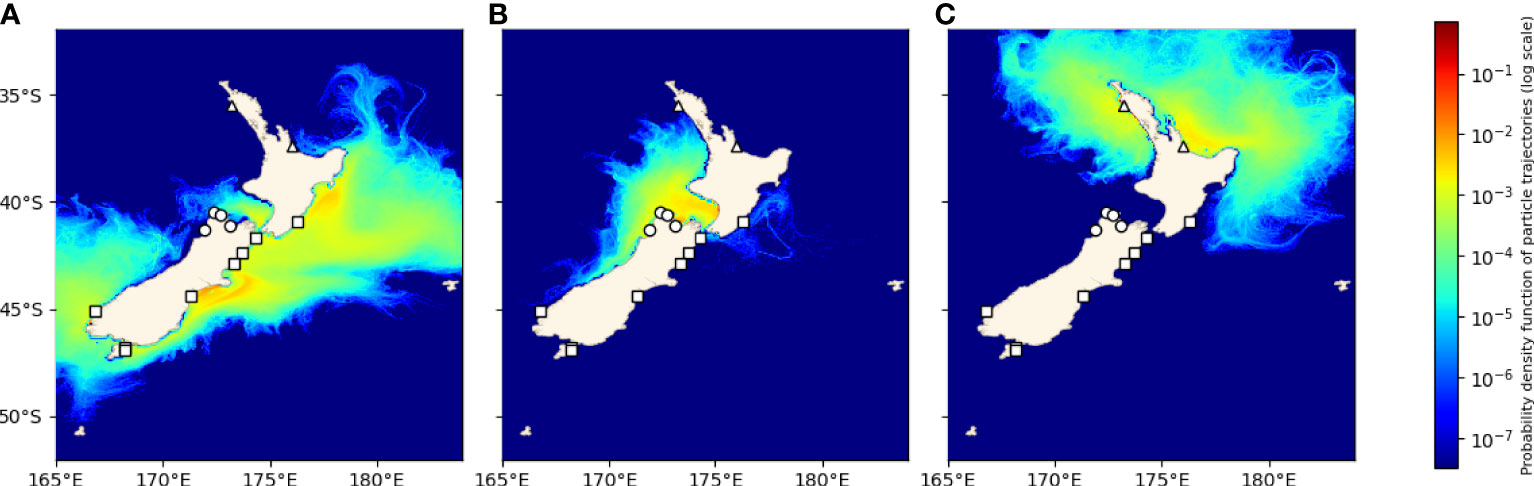
Figure 6 Probability densities of trajectories during the settlement competency period (3-6 weeks) for particles released from each cluster as predicted by particle tracking experiments. (A) Fiordlands, Horseshoe Bay, Big Glory Bay, Timarau, Gore Bay, Kaikoura, and Cape Campbell (squares), (B) Little Wanganui River, Westhaven, Fletchers Beach, and Tasman Bay (circles), (C) Opononi and Maunganui (triangles).
Results of the seasonal analysis of trajectories from Little Wanganui River showed that particles were advected north across the genetic barrier during all four seasons (Figure 7).
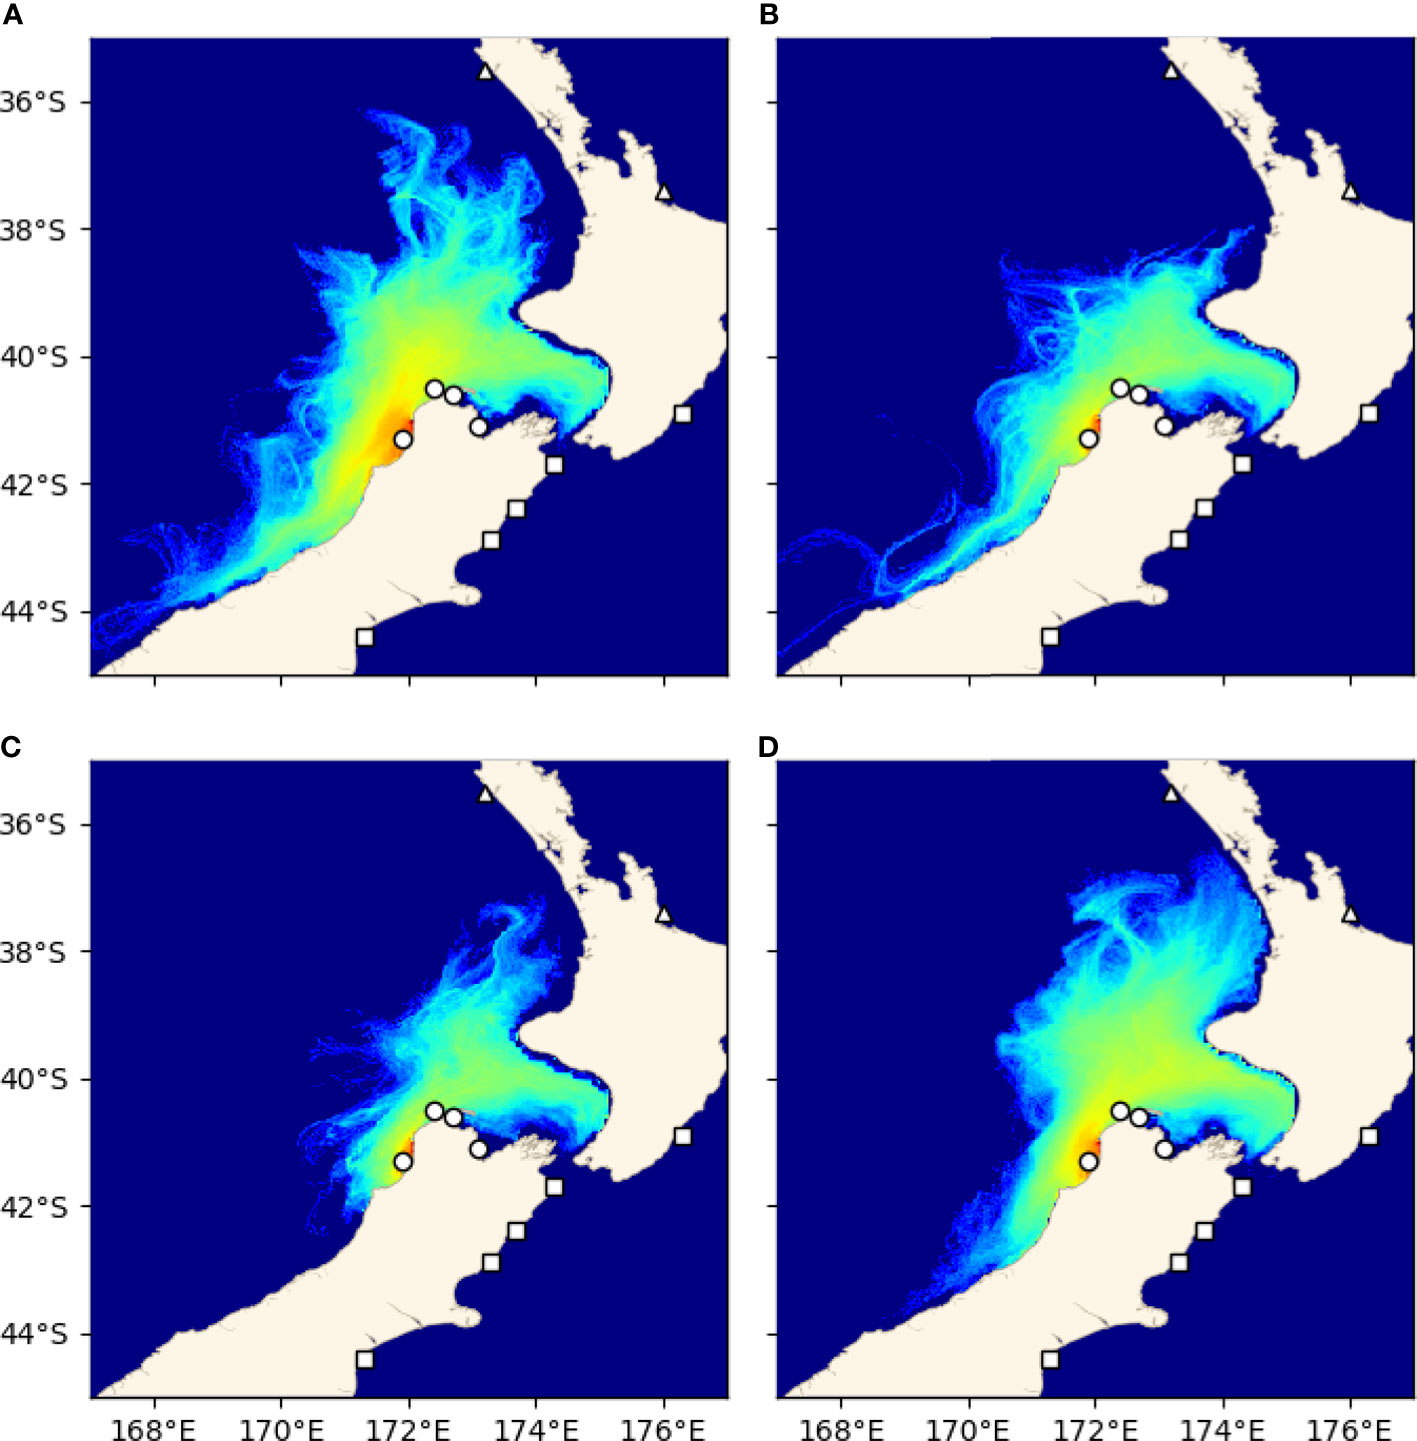
Figure 7 Seasonal variation of probability densities of trajectories from Little Wanganui River. (A) Summer (Jan-Mar), (B) autumn (Apr-Jun), (C) winter (Jul-Sep), (D) spring (Oct-Dec).
3.3 Relationship between genetic connectivity and particle tracking model
The variation of the Mantel test performed between the modelled migration matrix and the pairwise FST matrix showed a significant relationship. Analysis of the transformed migration matrix and FST values showed a correlation coefficient of -0.248 and a p-value of 0.0179 (Figures 8, 9). Analysis of the modeled migration matrix against the pairwise matrix of assignment tests of individuals also revealed a significant relationship, with a correlation coefficient of 0.579 and a p-value <0.0001 (Figure 10). Additionally, the presence of a northern and southern cluster in the migration matrix as well as in the genetic analyses performed in STRUCTURE and Geneland supports a relationship between the biophysical model and population genetic data, despite differences in the delineation of these clusters (Figure 5).
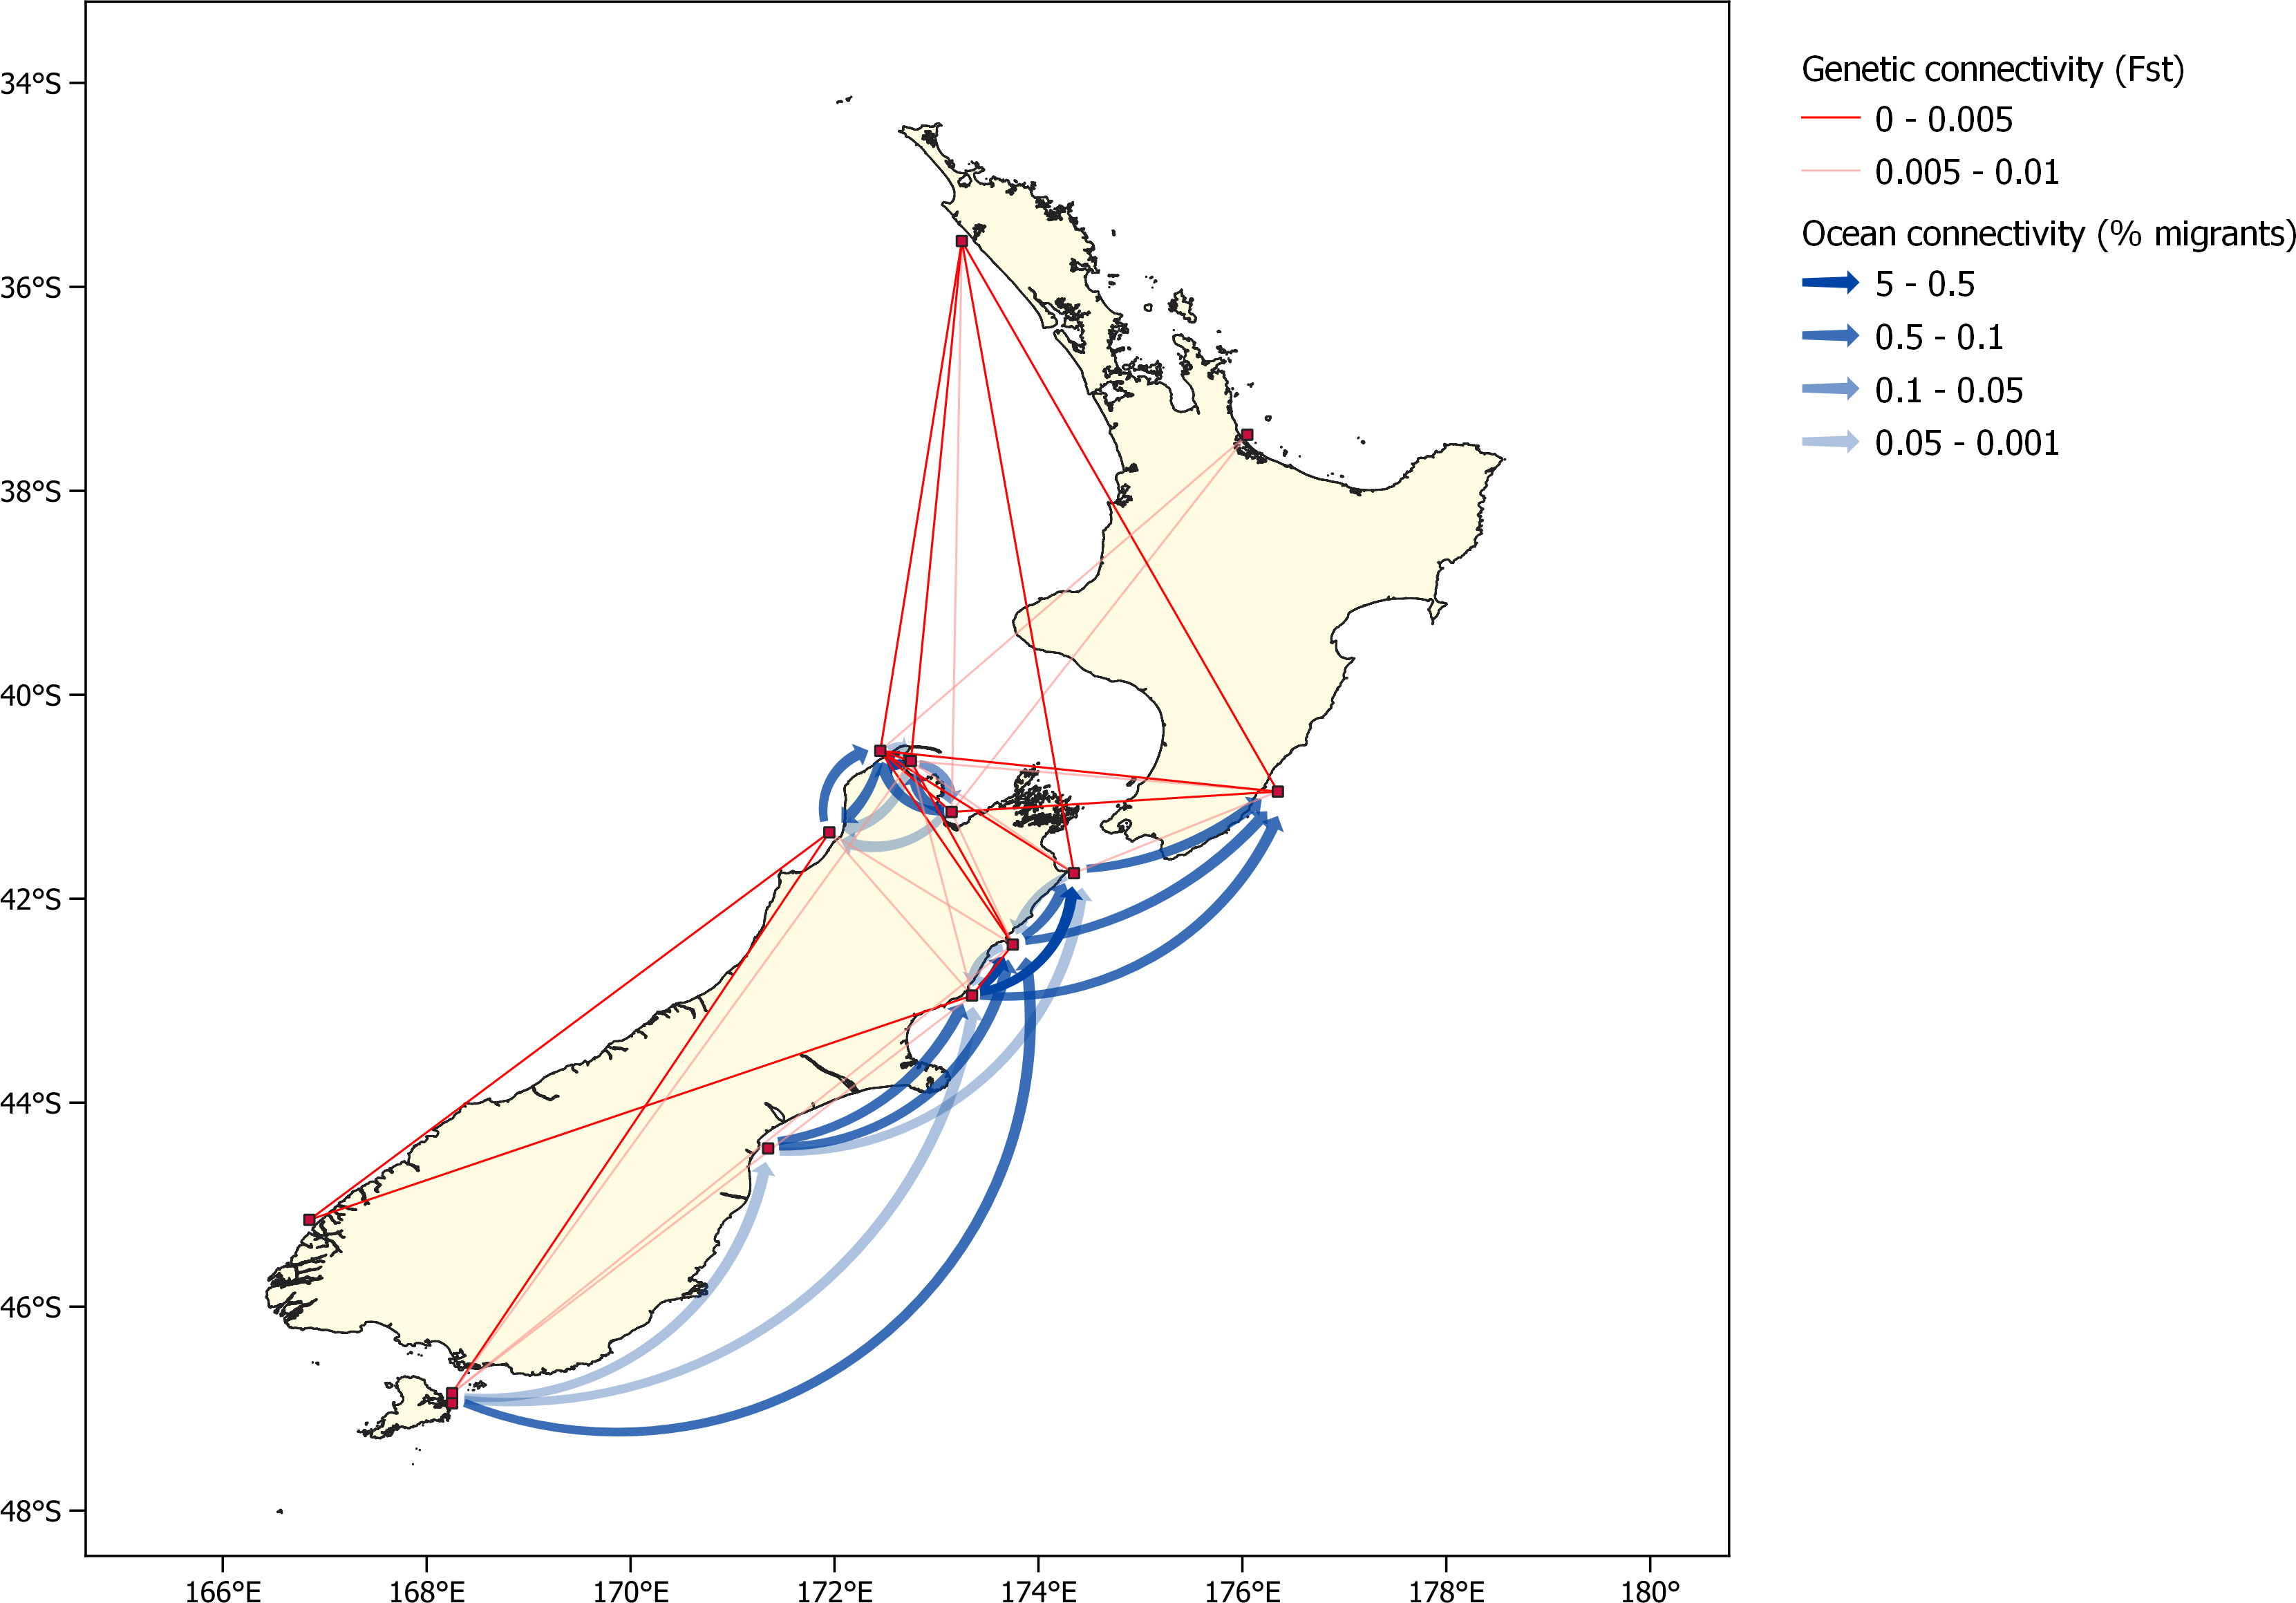
Figure 8 Oceanographic connectivity, presented as the proportion of particles released from each population that settle in each destination population, and pairwise FST between all populations. As oceanographic connectivity from the two Stewart Island populations is very similar, only Horseshoe Bay is shown for legibility.
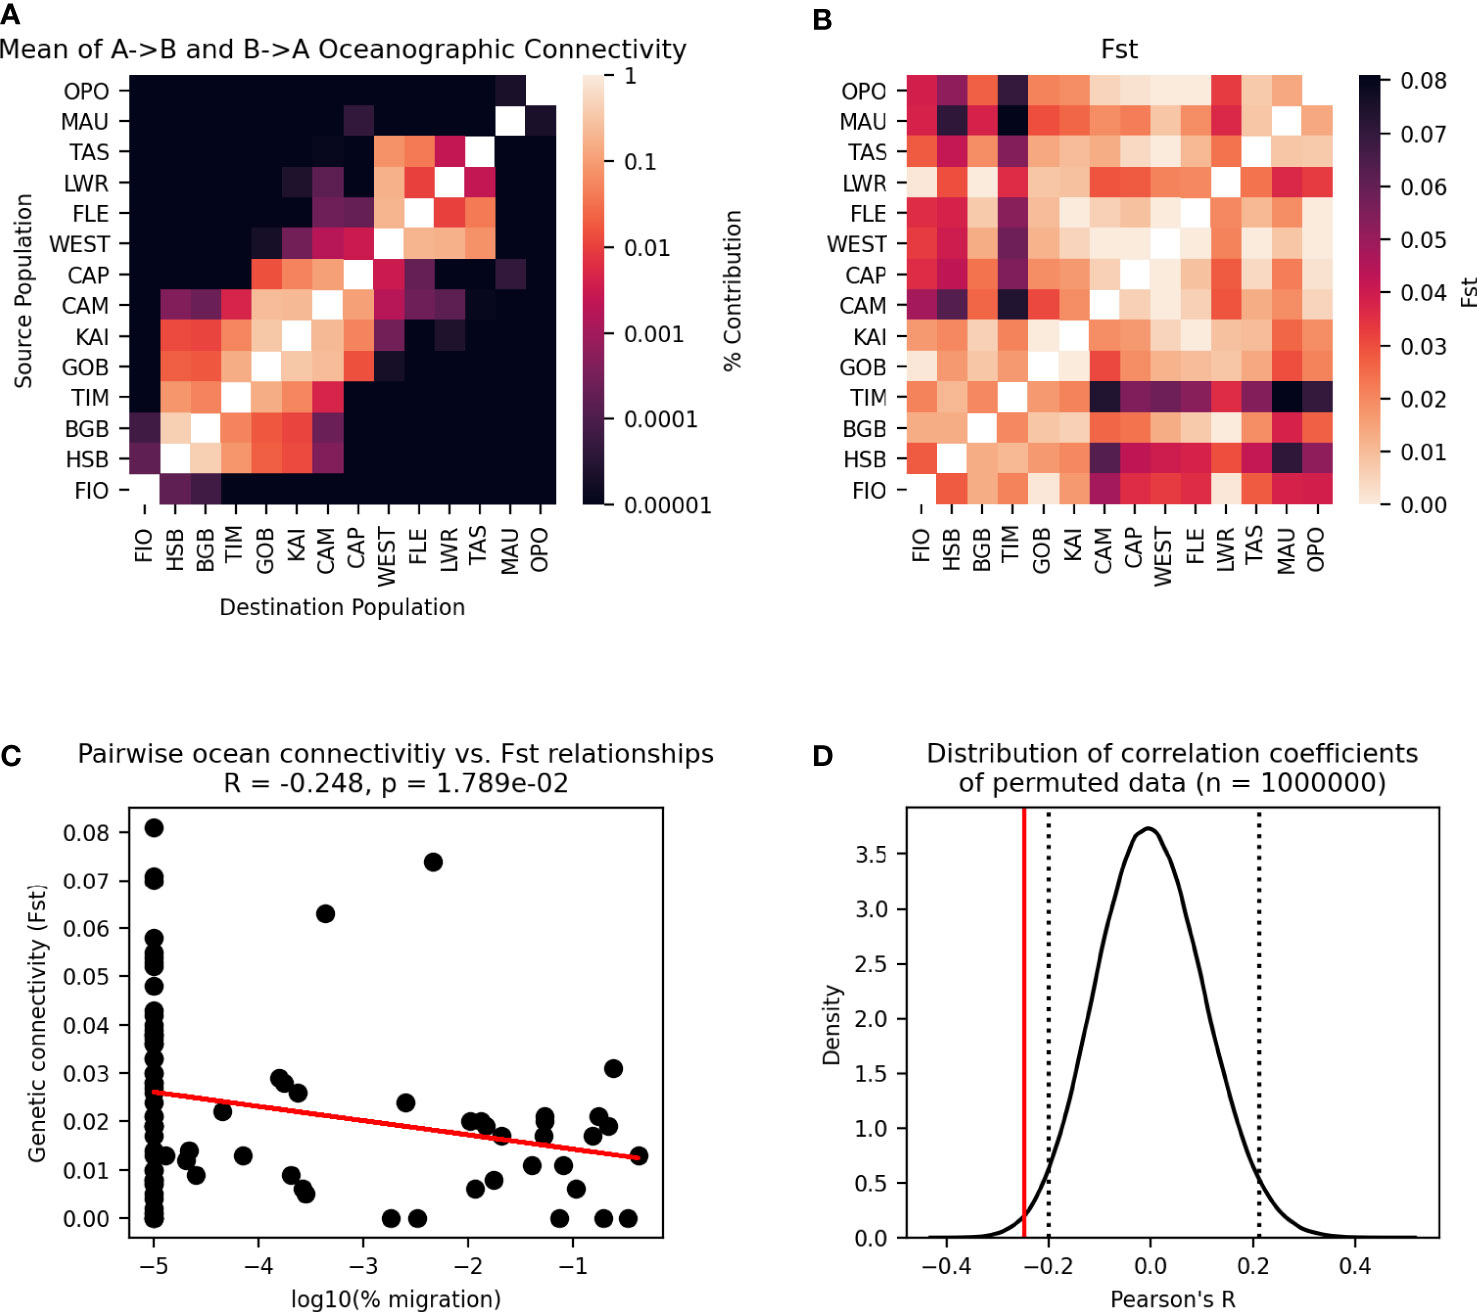
Figure 9 Permutational Mantel test between migration matrix generated by Lagrangian particle tracking model and pairwise FST. (A) Particle tracking migration matrix, transformed for comparison to the pairwise FST matrix— the mean of migration matrix values A→B and B→A is taken for each pair of populations, and the diagonal has been excluded. (B) Pairwise FST matrix. (C) Pairwise relationships between cells in one triangle of the two matrices are plotted as points, with a line showing the best fit of the data. Pearson’s correlation coefficient and p-value of the correlation are given. (D) The distribution of correlation coefficients between the migration matrix and 1,000,000 permutations of the pairwise FST matrix. Dotted lines enclose 95% of the distribution, and the solid line shows the correlation coefficient of the unpermuted data.
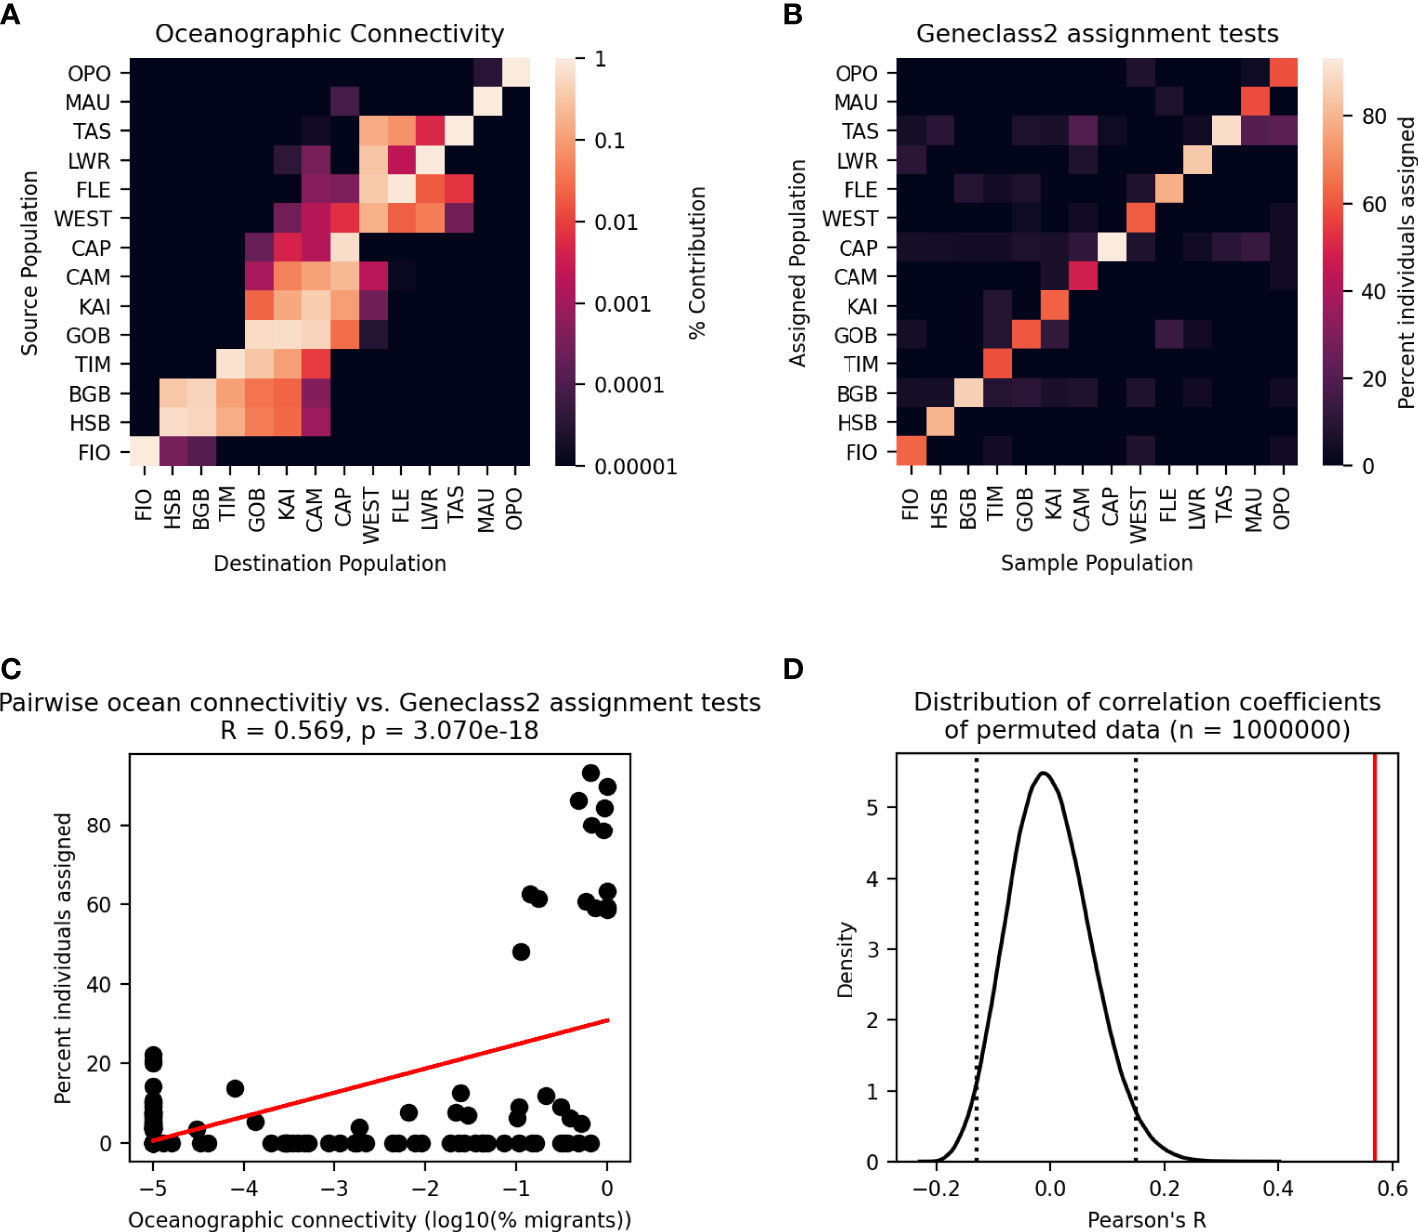
Figure 10 Modified Mantel test between migration matrix generated by Lagrangian particle tracking model and assignment tests performed in Geneclass2. (A) Particle tracking migration matrix. (B) Matrix of assignment tests of individuals. (C) Pairwise relationships between cells in the two matrices are plotted as points with a line showing the best fit of the data. Pearson’s correlation coefficient and p-value of the correlation are given. (D) Distribution of correlation coefficients between the migration matrix and 1,000,000 permutations of the assignment testing data. Dotted lines enclose 95% of the distribution, and the solid line shows the correlation coefficient of the unpermuted data.
The analysis of isolation by distance (IBD) revealed a stronger relationship between ocean distance and FST than between the modelled migration matrix and either of the measures of genetic connectivity (Figure 11).
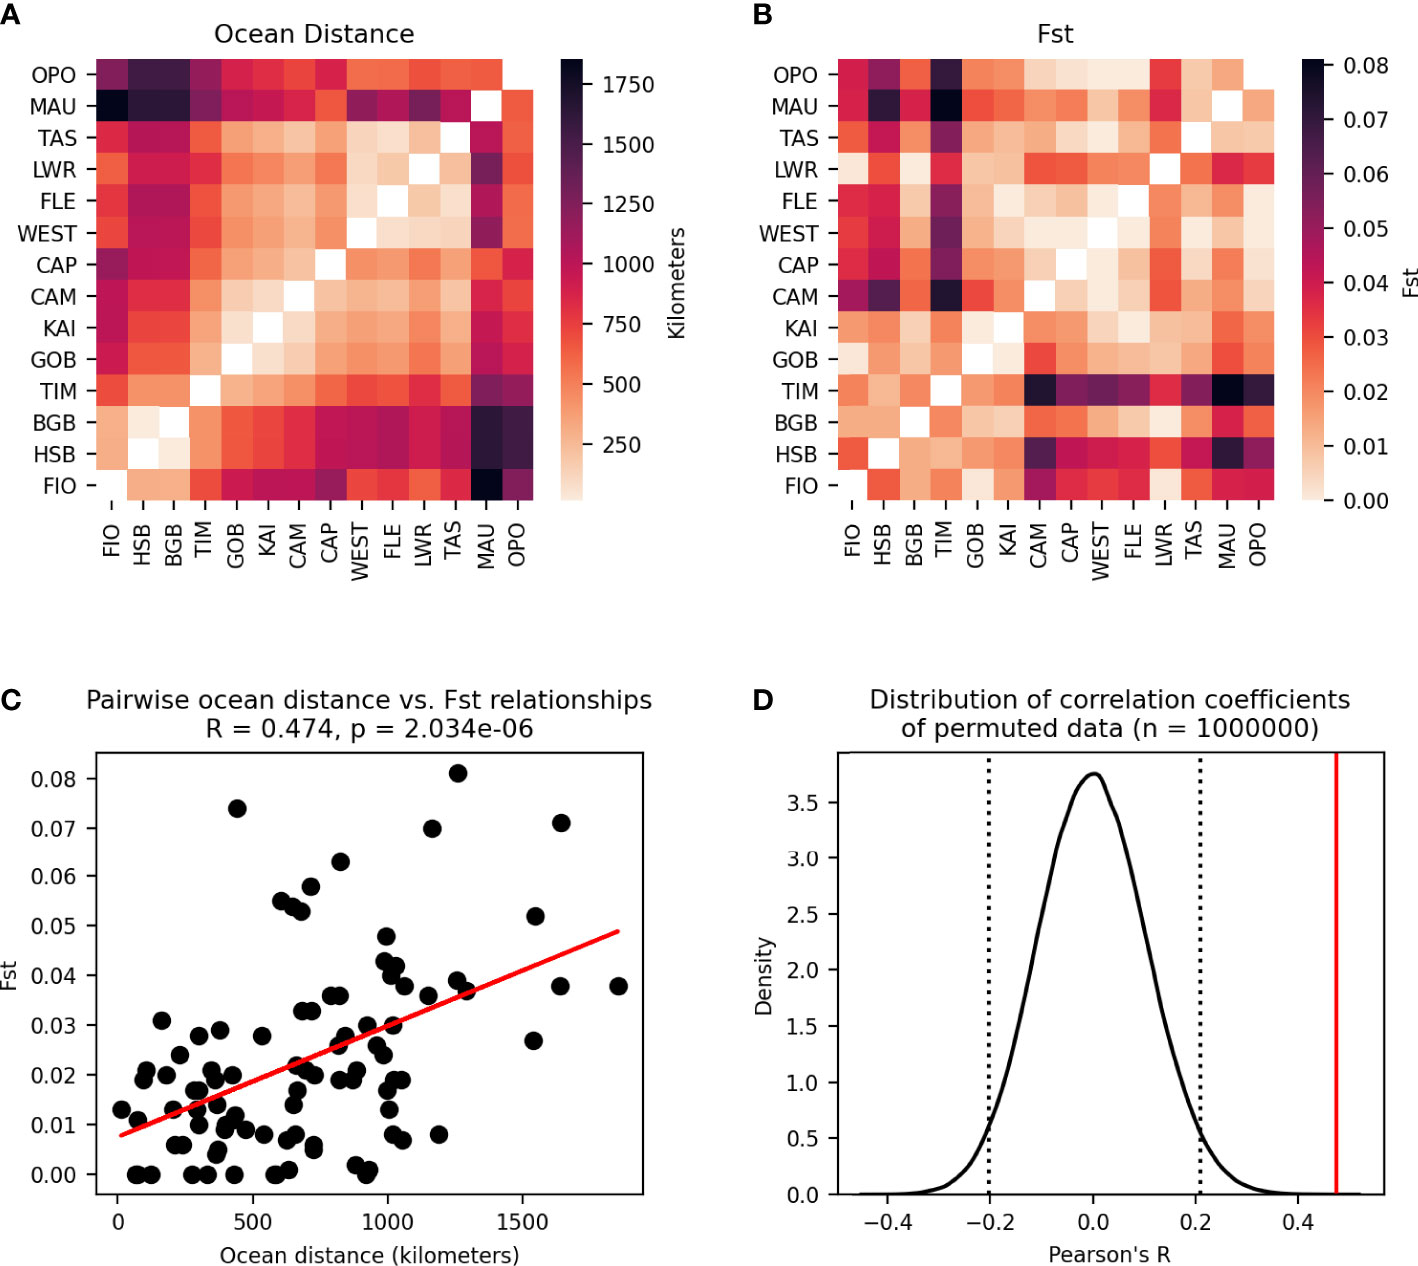
Figure 11 Modified Mantel test between pairwise ocean distances between populations and pairwise FST. (A) Pairwie ocean distance matrix. (B) Pairwise FST matrix. (C) Pairwise relationships between cells in the two matrices are plotted as points with a line showing the best fit of the data. Pearson’s correlation coefficient and p-value of the correlation are given. (D) Distribution of correlation coefficients between the ocean distance matrix and 1,000,000 permutations of the FST matrix. Dotted lines enclose 95% of the distribution, and the solid line shows the correlation coefficient of the unpermuted data.
4 Discussion
In this study, the extent to which a biophysical Lagrangian particle tracking model can predict genetic structure as reported by analysis of microsatellite loci for the endemic New Zealand green-lipped mussel was assessed. While the two methods corroborated the findings of each other in several aspects, there were also unique insights provided by each approach, and thus a multidisciplinary biophysical-genetic approach is recommended to best understand connectivity in sessile marine broadcast spawners.
The permutational Mantel test revealed a significant relationship between the migration matrix generated by the particle tracking experiment and the matrix of pairwise FST values (Figure 9). The negative correlation coefficient observed is consistent with the underlying hypothesis about oceanographic and genetic connectivity— as the number of particles migrating between populations increases so FST decreases. While isolation by distance (IBD) showed a stronger correlation to FST than the migration matrix (Figure 11, oceanographic circulation may provide a mechanistic explanation for the observed pattern of IBD [35]. Indeed, analysis of IBD among mussels sampled from sites within each genetic cluster showed no relationship, and IBD alone is likely not the primary driver of genetic structure in the species. There are several factors, however, that may result in a possible underestimation of the importance of ocean circulation in driving genetic structure. First, this study did not account for possible connections among populations that occur over multiple generations through stepping-stones. Because of the large spatial scale (maximum distance between populations = 1854 km), 70% of possible connections between populations had zero particle transport in one generation. Studies of other species at similarly large spatial scales have found that the inclusion of multi-generational connectivity through stepping stones can improve the fit of the biophysical model to genetic data (e.g., Jahnke et al., 2018), and this is an area of future study for studying national-scale connectivity in New Zealand green-lipped mussels.
There are several inherent drawbacks of using FST as a measure of genetic connectivity to compare to the simulated migration matrix. First, FST (like many measures of genetic distance) is a symmetric value, while simulated migration rates between populations are often asymmetric. Additionally, as FST does not provide for a measure of self-recruitment, information of self-recruitment rates provided by the simulated migration matrix cannot be included in comparisons to a pairwise FST matrix. To compensate for this, and to allow for comparisons between the asymmetric migration matrix and the symmetric pairwise FST matrix, the diagonals of both matrices were excluded and the migration matrix M was transformed such that Mij and Mji are both equal to the mean of Mij and Mji FST (as in )?. This is not ideal, however, because valuable information about directionality in the migration matrix is lost.
Secondly, genetic structure may be influenced by local adaptation to environmental variables not included in the biophysical models. These selective pressures may impact survivorship during the larval stage, during or after settlement, or as adults, and may help maintain spatial genetic structure even when ocean currents may facilitate larval transport among populations. This may help explain the maintenance of genetic structure in the Cook Strait region even in the face of substantial particle transport by ocean currents (discussed further below), as mussel communities have been observed to be absent or depauperate from seemingly suitable habitat in the region (Gardner, 2000; Helson et al., 2007).
Finally, many metrics of genetic connectivity, including FST, may represent signals of structure that are the accumulation of gene flow and barriers to gene flow over evolutionary timescales (Hewitt, 2000). In the case of New Zealand green-lipped mussels, the divergence time between the northern and southern lineage is estimated to be 1.3 million years ago (Apte and Gardner, 2002; Goldstien et al., 2006). However, other species that exhibit similar barriers to gene flow south of Cook Strait have divergence times between lineages of between 200,000 and 300,000 years ago (Goldstien et al., 2006). The Cook Strait region underwent major topographical and hydrological shifts during this long period, and it is difficult to identify a particular historical event that would have produced the observed genetic structure (Lewis et al., 1994). It is surprising that such a genetic discontinuity could be maintained over multiple generations after a historical barrier has broken down (Landguth et al., 2010), particularly in a data set of microsatellite markers, which are believed to represent a more contemporary scenario due to their high mutation rate (Selkoe and Toonen, 2006). However, it is critical to consider that biophysical models that represent contemporary ocean currents may not be able to describe structure among populations where the prevailing genetic signal is the result of processes at an evolutionary timescale.
One method of describing migration from genetic data that is not subject to many of these limitations is the assignment testing of individuals to likely source populations. Unlike measures of genetic distance, this method can describe directionality of gene flow by identifying first generation migrants. The permutational variation of the Mantel test identified a significant relationship among simulated probability of migration between populations in the biophysical model and assignment tests of individuals performed in Geneclass2 (Piry et al., 2004) (Figure 10). While this positive relationship is intuitive (higher number of simulated particles moving between populations correlate with higher rates of migration predicted by assignment testing), it is driven entirely by the high levels of self-recruitment predicted by both the particle tracking model and the assignment tests. These high levels of self-recruitment have been reported by studies of several marine species with pelagic larval durations ranging from multiple days to several weeks (McQuaid and Phillips, 2000; Swearer et al., 2002; Figueiredo et al., 2013), and the particle tracking experiments conducted here confirm these findings, with self-recruitment remaining the most important source of larvae for 10of the 14 sites. The identification of possible first generation migrants by assignment tests (individuals assigned to a different population than their sampled population) did not correlate to predicted migration rates between populations from the particle tracking experiment, and are unlikely to be a reliable estimate of true migration rates. This may be due to low levels of differentiation among populations. Assignment testing of individuals is most successful with levels of differentiation between populations above an FST value of 0.05 (Christie et al., 2017), however, in the present data set, only 10% of pairwise relationships are above that threshold. Additionally, the reliability of assignment testing may be impacted by the number of loci assayed and the limited sample size of mussels from each population. The data set used here sampled an average of 23 individuals per population which were assayed at 10 microsatellite loci (Wei et al., 2013). Of the 63 studies reviewed by Jahnke and Jonsson, (2022) that used microsatellite markers, the average number of loci used was 12, with an average of 50 individuals sampled per population. However, tests of error rates in Geneclass2 used simulated data sets with a minimum of 50 individuals per population and 50 loci (Paetkau et al., 2004). Another commonly used tool for estimating directional migration and asymmetries in gene flow from genetic data, divMigrate (Sundqvist et al., 2016), suggests the same minimum number of samples and loci for reliable usage, making both of these tools inappropriate for use with many publicly available data sets. Thus, even with genetic analyses designed for identifying directionality of connections between populations, obtaining reliable estimates of migration can be difficult, highlighting the value of a multidisciplinary approach to connectivity studies in marine organisms.
Comparing the clustering patterns reported by the two methods provides insight into population connectivity and its potential drivers. The population genetic analysis performed in Geneland confirmed results from previous analyses of the microsatellite loci in STRUCTURE (Wei et al., 2013), i.e., the primary feature of genetic structure is a discontinuity south of Cook Strait, resulting in a northern and a southern cluster. Additionally, the Geneland analyses performed here, which take into account the spatial distribution of the sample sites, distinguished between samples from the west and east coasts of the South Island (Figure 3), consistent with the findings of Apte and Gardner (2002) who identified such a difference using different analyses. The particle tracking experiments also revealed clustering among the sampled populations based on simulated larval dispersal probabilities, however, the population composition of the groups is slightly different from that found by the genetic analyses (Figure 5). One cluster in the migration matrix includes the populations along the southern and western coasts of the South Island (FIO, BGB, HSB, TIM, GOB, KAI, and CAM) as well as the population at Castlepoint (CAP) located on the south-east coast of the North Island. The other cluster consists of the populations on the north-west coast of the South Island (LWR, TAS, FLE, and WEST). The populations OPO and MAU (in the north of the North Island) were nearly completely isolated from all other populations in the particle tracking model, indicating that if connections between these populations and the rest of the country exist, they likely happen over multiple generations through stepping stone populations not included in the current sampling scheme.
The differences in the demarcations of the two clusters in the genetic and Lagrangian particle tracking data set are interesting, especially the presence of substantial particle transport across the reported genetic break on both the west and east coasts of the southern coastline of the Cook Strait region. This genetic discontinuity has been reported for several taxa (reviewed by Gardner et al., 2010), and several authors (e.g., Apte and Gardner, 2002; Waters and Roy, 2004; Ayers and Waters, 2005; Veale and Lavery, 2011) have proposed oceanographic circulation, including upwelling near Cape Kahurangi on the north-western coast and/or Cape Campbell on the north-eastern coast of the South Island (Chiswell et al., 2017), as the primary driver of this structure (e.g., Apte and Gardner, 2002; Veale and Lavery, 2011). One hypothesis proposes that the timing of spawning in some species may coincide with the period when coastal upwelling is strongest, and that this may result in a barrier to gene flow arising for some species (Veale and Lavery, 2011; Arranz Martinez, 2018). Because of the year round spawning window used in the present experiment, any signal of a seasonal barrier to gene flow would be lost in the initial analysis. However, to further examine this possibility, an investigation of larval dispersal from LWR (Little Wanganui River, located just south of the genetic break) during each season (Jan-Mar, Apr-Jun, Jul-Sep, Oct-Dec) was performed. This analysis revealed that particles are advected northward across the genetic break year-round (Figure 7) and that the concurrence of spawning events with seasonal oceanographic features is likely not the primary driver of the genetic break observed for green-lipped mussels near Cape Kahurangi. This is consistent with descriptions of upwelling in the area, which indicate that while upwelling does occur, the flow is not perpendicular to the shore, rather it is to the northeast (Chiswell et al., 2017), and larvae with a PLD of 3-6 weeks such as green-lipped mussels may well be able to reach the North Island or they may be returned to settle in the Cook Strait region. Thus, the Lagrangian particle tracking experiment performed here found no evidence that contemporary ocean circulation is the primary driver of the genetic break south of Cook Strait that is observed across multiple marine invertebrate taxa. The mechanism maintaining this phylogeographic boundary remains unknown, with alternative hypotheses including environmental selection (as discussed above), the existence of an ancient barrier to gene flow that led to a historical divergence that remains unidentified (Goldstien et al., 2006; Ross et al., 2012), or as yet undescribed larval behaviours or other processes that limit dispersal across the boundary or reduce survivorship of larvae that do cross the boundary (Mertens et al., 2018).
Despite some challenges in reconciling the data provided by these two methods of assessing connectivity, the application of a multidisciplinary oceanographic-genetic approach to studying connectivity reveals more than has been able to be determined by either method alone. While tools for population genetic analyses have been able to identify two or more likely subpopulations among New Zealand green-lipped mussels, without additional molecular sampling, they are unable to provide information about the directionality of connections within and between these clusters. In the migration matrix (Figure 4), the connections in the southern cluster are mostly asymmetrical (they occur primarily on one side of the diagonal), while in the central cluster (populations around the northwest coast of the South Island) connections are mostly symmetrical (they exist on both sides of the diagonal). Thus, connectivity in the southern cluster is primarily south to north, while connectivity within the central cluster is more symmetrical. Additionally, connectivity between the two clusters is primarily from the central cluster into the southern cluster. These patterns are consistent with the understanding of the prevailing ocean currents in these regions, which are well represented by the model (De Souza et al., 2022). The Southland Current is a strong boundary current that flows south to north (Sutton, 2003), making particle transport in the opposite direction extremely unlikely. Flow around the northwest coast of the South Island is driven by the Westland and D’Urville currents. While flow is generally from northwest to southeast through the Cook Strait, strong tidal currents due to the offset in tidal phase on either side of the Strait result in thorough mixing and bidirectionality of larval transport between pairs of sites in the region (Walters et al., 2010).
Understanding asymmetries in gene flow among populations is crucial for management of biotic marine resources due to the importance of identifying source/sink dynamics when making management decisions (Crowder et al., 2000; Hansen, 2011). The results of the Lagrangian particle tracking experiment suggest that larval transport pathways driven by ocean currents may not lead to strong source/sink dynamics in the Cook Strait region, however, a strong boundary current along the southwest coast of the South Island likely results in asymmetries in migration of larvae between populations in the region. While estimates of abundance or fecundity in these populations were not made in this study, larval transport from southern to northern populations driven by the Southland Current suggests that southern populations (e.g., BGB, HSB, and TIM in this study) likely act as larval sources for populations along the east coast of the South Island (e.g., GOB, KAI, and CAM, as well as CAP on the east coast of the North Island). This suggests that rocky reefs along the south-southwest coast of the South Island represent interesting areas for further research due to the role these populations may play as larval sources.
This work continues to explore a new multidisciplinary field of study at the interface of population genetics and biophysical oceanographic modelling. A recent review of studies that have applied both methods determined that a majority of studies reveal some degree of correlation between the biophysical model results and connectivity as assessed by genetic analyses (Jahnke and Jonsson, 2022). It is important, however, to understand why genetic and oceanographic measures of connectivity often return seemingly conflicting results for particular species and/or regions. Possible reasons for these mismatches are various, and may include life-history and behavioural traits not represented in the biophysical model (Lourenço et al., 2017), important oceanographic features not captured by the hydrodynamic model (e.g., surface waves), the possibility that genetic data represent historic patterns of gene flow that are not reflected by models of contemporary ocean circulation, and local adaptation to environmental pressures.
The wide range of methodologies used across these combined studies to compare genetic and oceanographic connectivity data makes it difficult for researchers to determine how best to evaluate these two different data sets together; the development of a standard approach for this type of analysis will represent a major advancement in the field. Despite these challenges, a multidisciplinary approach to studying connectivity within a species can provide additional and complementary information about patterns of gene flow than can be learned from population genetic analyses alone, and any future work should consider the value gained by including both methods.
4.1. Conclusions
The application of a biophysical Lagrangian particle tracking model provides complementary information about population connectivity to traditional population genetics analyses, including inferences about directionality and asymmetry of connections within genetic clusters. Challenges in evaluating these two data types together continue to exist in this new multidisciplinary field, and further study of these issues as well as standardisation of their analysis would be extremely valuable to future research. The area on the southeast coast of the South Island of New Zealand is identified as a region of interest for additional study due to its likely role as a larval source for marine species with pelagic larval dispersal.
Data availability statement
The datasets presented in this study can be found in online repositories. The names of the repository/repositories and accession number(s) can be found below: https://doi.org/10.5281/zenodo.7017665.
Author contributions
MR and JG conceived the study, MR led the funding proposal, CQ conducted the particle tracking experiments, ran genetic analyses, led the data analysis, and led the writing of the manuscript. All authors contributed to the article and approved the submitted version.
Funding
This work is a contribution to the Moana Project (www.moanaproject.org) funded by the New Zealand Ministry of Business Innovation and Employment, contract number METO1801.
Acknowledgments
We thank the Moana Project team and all who have been involved in developing and maintaining the Moana Hindcast model. We thank the OpenDrift team for their work on this open source Lagrangian particle tracking tool, available at https://opendrift.github.io/index.html. We acknowledge the use of New Zealand eScience Infrastructure (NeSI) high performance computing facilities, consulting support and/or training services as part of this research. New Zealand’s national facilities are provided by NeSI (https://www.nesi.org.nz) and funded jointly by NeSI’s collaborator institutions and through the Ministry of Business, Innovation and Employment’s Research Infrastructure programme.
Conflict of interest
The authors declare that the research was conducted in the absence of any commercial or financial relationships that could be construed as a potential conflict of interest.
Publisher’s note
All claims expressed in this article are solely those of the authors and do not necessarily represent those of their affiliated organizations, or those of the publisher, the editors and the reviewers. Any product that may be evaluated in this article, or claim that may be made by its manufacturer, is not guaranteed or endorsed by the publisher.
Supplementary material
The Supplementary Material for this article can be found online at: https://www.frontiersin.org/articles/10.3389/fmars.2022.971209/full#supplementary-material
References
Alfaro A., Jeffs A., Gardner J., Bollard Breen B., Wilkin J. (2011). Green-lipped mussels in GLM 9. New Z. Fish. Assess. Rep. 48, 80.
Alfaro A., Jeffs A., Hooker S. (2001). Reproductive behavior of the green-lipped mussel, Perna canaliculus, in northern new Zealand. Bull. Mar. Sci. 69, 1095–1108.
Apte S., Gardner J. (2002). Population genetic subdivision in the new Zealand greenshell mussel (Perna canaliculus) inferred from single-strand conformation polymorphism analysis of mitochondrial DNA. Mol. Ecol. 11, 1617–1628. doi: 10.1046/j.1365-294X.2002.01554.x
Arranz Martinez V. (2018). Connectivity among marine communities: a multi-species approach to determining the major drivers of larval connection between populations of coastal species in new zealand. University of Auckland, PhD thesis.
Ayers K., Waters J. (2005). Marine biogeographic disjunction in central new Zealand. Mar. Biol. 147, 1045–1052. doi: 10.1007/s00227-005-1632-7
Berglund M., Jacobi M. N., Jonsson P. R. (2012). Optimal selection of marine protected areas based on connectivity and habitat quality. Ecol. Model. 240, 105–112. doi: 10.1016/j.ecolmodel.2012.04.011
Chiswell S. M., Zeldis J. R., Hadfield M. G., Pinkerton M. H. (2017). Wind-driven upwelling and surface chlorophyll blooms in greater cook strait. New Z. J. Mar. Freshw. Res. 51, 465–489. doi: 10.1080/00288330.2016.1260606
Christie M. R., Meirmans P. G., Gaggiotti O. E., Toonen R. J., White C. (2017). Disentangling the relative merits and disadvantages of parentage analysis and assignment tests for inferring population connectivity. ICES. J. Mar. Sci. 74, 1749–1762. doi: 10.1093/icesjms/fsx044
Coleman M. A., Cetina-Heredia P., Roughan M., Feng M., van Sebille E., Kelaher B. P. (2017). Anticipating changes to future connectivity within a network of marine protected areas. Global Change Biol. 23, 3533–3542. doi: 10.1111/gcb.13634
Coleman M. A., Feng M., Roughan M., Cetina-Heredia P., Connell S. D. (2013). Temperate shelf water dispersal by Australian boundary currents: Implications for population connectivity. Limnol. Oceanogr.: Fluids. Environ. 3, 295–309. doi: 10.1215/21573689-2409306
Coleman M. A., Roughan M., Macdonald H. S., Connell S. D., Gillanders B. M., Kelaher B. P., et al. (2011). Variation in the strength of continental boundary currents determines continent-wide connectivity in kelp. J. Ecol. 99 (4), 1026–1032. doi: 10.1111/j.1365-2745.2011.01822
Cowen R. K., Sponaugle S. (2009). Larval dispersal and marine population connectivity. Annu. Rev. Mar. Sci. 1, 443–466. doi: 10.1146/annurev.marine.010908.163757
Crowder L. B., Lyman S., Figueira W., Priddy J. (2000). Source-sink population dynamics and the problem of siting marine reserves. Bull. Mar. Sci. 66, 799–820.
Dagestad K.-F., Röhrs J., Breivik Ø., Ådlandsvik B. (2018). Opendrift v1. 0: A generic framework for trajectory modelling. Geosci. Model. Dev. 11, 1405–1420. doi: 10.5194/gmd-11-1405-2018
Delaney D. G., Edwards P. K., Leung B. (2012). Predicting regional spread of non-native species using oceanographic models: Validation and identification of gaps. Mar. Biol. 159, 269–282. doi: 10.1007/s00227-011-1805-5
De Souza J. M. A. C., Powell B., Castillo-Trujillo A. C., Flament P. (2015). The vorticity balance of the ocean surface in Hawaii from a regional reanalysis. J. Phys. Oceanogr. 45, 424–440. doi: 10.1175/JPO-D-14-0074.1
De Souza J. M. A. C., Suanda S. H., Couto P. P., Smith R. O., Kerry C., Roughan M. (2022). Moana ocean hindcast – a 25+ years simulation for new Zealand waters using the ROMS v3.9 model. EGUsphere 2022, 1–34. doi: 10.5194/egusphere-2022-41
De Wit P., Jonsson P. R., Pereyra R. T., Panova M., André C., Johannesson K. (2019). Spatial genetic structure in a crustacean herbivore highlights the need for local considerations in Baltic Sea biodiversity management. Evolutionary applications 13 (3), 974–990. doi: 10.1101/595629
Dionne M., Caron F., Dodson J. J., Bernatchez L. (2008). Landscape genetics and hierarchical genetic structure in Atlantic salmon: The interaction of gene flow and local adaptation. Mol. Ecol. 17, 2382–2396. doi: 10.1111/j.1365-294X.2008.03771.x
Dobretsov S., Miron G. (2001). Larval and post-larval vertical distribution of the mussel Mytilus edulis in the white Sea. Mar. Ecol. Prog. Ser. 218, 179–187. doi: 10.3354/meps218179
Dunphy B. J., Silva C. N., Gardner J. (2015). Testing techniques for tracing the provenance of green-lipped mussel spat washed up on ninety mile beach (New Zealand ministry of primary industries). (New Zealand Ministry for Primary Indutries)
Egbert G. D., Erofeeva S. Y. (2002). Efficient inverse modeling of barotropic ocean tides. J. Atmospheric. Oceanic. Technol. 19, 183–204. doi: 10.1175/1520-0426(2002)019<0183:EIMOBO>2.0.CO;2
Figueiredo J., Baird A. H., Connolly S. R. (2013). Synthesizing larval competence dynamics and reef-scale retention reveals a high potential for self-recruitment in corals. Ecology 94, 650–659. doi: 10.1890/12-0767.1
Gardner J. P. (2000). Where are the mussels on cook strait (New Zealand) shores? low seston quality as a possible factor limiting multi-species distributions. Mar. Ecol. Prog. Ser. 194, 123–132. doi: 10.3354/meps194123
Gardner J., Bell J., Constable H., Hannan D., Ritchie P., Zuccarello G. (2010). Multi-species coastal marine connectivity: A literature review with recommendations for further research. New Z. Aquat. Environ. Biodivers. Rep. 58.
Goldstien S. J., Schiel D. R., Gemmell N. J. (2006). Comparative phylogeography of coastal limpets across a marine disjunction in new Zealand. Mol. Ecol. 15, 3259–3268. doi: 10.1111/j.1365-294X.2006.02977.x
Grabowski J. H., Peterson C. H. (2007). Restoring oyster reefs to recover ecosystem services. Ecosyst. Eng.: Plants to Protists. 4, 281–298. doi: 10.1016/S1875-306X(07)80017-7
Greenway J. P. C. (1969). Surveys of mussels (Mollusca: Lamellibranchia) in the firth of Thames 1961–67. New Z. J. Mar. Freshw. Res. 3, 304–317. doi: 10.1080/00288330.1969.9515299
Guillot G., Estoup A., Mortier F., Cosson J. F. (2005). A spatial statistical model for landscape genetics. Genetics 170, 1261–1280. doi: 10.1534/genetics.104.033803
Hannesson R. (2013). Sharing a migrating fish stock. Mar. Resource. Econ. 28, 1–17. doi: 10.5950/0738-1360-28.1.1
Hansen A. (2011). Contribution of source-sink theory to protected area science. in Liu J., Hull V., Morzillo A., Wiens J. (Eds), Sources. Sinks. Sustain., Cambridge Studies in Landscape Ecology pp. 339–360 Cambridge: Cambridge University Press. doi: 10.1017/CBO9780511842399.018
Helson J. G., Pledger S., Gardner J. P. (2007). Does differential particulate food supply explain the presence of mussels in Wellington harbour (New Zealand) and their absence on neighbouring cook strait shores? Estuarine. Coast. Shelf. Sci. 72, 223–234. doi: 10.1016/j.ecss.2006.10.015
Hewitt G. (2000). The genetic legacy of the quaternary ice ages. Nature 405, 907–913. doi: 10.1038/35016000
Hickman R., Illingworth J. (1980). Condition cycle of the green-lipped mussel Perna canaliculus in new Zealand. Mar. Biol. 60, 27–38. doi: 10.1007/BF00395603
Jahnke M., Jonsson P. R. (2022). Biophysical models of dispersal contribute to seascape genetic analyses. Philos. Trans. R. Soc. B. 377, 20210024. doi: 10.1098/rstb.2021.0024
Jahnke M., Jonsson P. R., Moksnes P.-O., Loo L.-O., Nilsson Jacobi M., Olsen J. L. (2018). Seascape genetics and biophysical connectivity modelling support conservation of the seagrass Zostera marina in the skagerrak–kattegat region of the eastern north Sea. Evol. Appl. 11, 645–661. doi: 10.1111/eva.12589
Jeffs A., Holland R., Hooker S., Hayden B. (1999). Overview and bibliography of research on the greenshell mussell, Perna canaliculus, from new Zealand waters. J. Shellfish. Res. 18, 347–360.
Jenkins R. J. (1979). Mussel cultivation in the Marlborough sounds (New zealand). tech. rep (Wellington (New Zealand: NZ Fishing Industry Board).
Jump A. S., Marchant R., Peñuelas J. (2009). Environmental change and the option value of genetic diversity. Trends Plant Sci. 14, 51–58. doi: 10.1016/j.tplants.2008.10.002
Kelly R. P., Palumbi S. R. (2010). Genetic structure among 50 species of the northeastern pacific rocky intertidal community. PloS One 5, e8594. doi: 10.1371/journal.pone.0008594
Knights A., Crowe T., Burnell G. (2006). Mechanisms of larval transport: Vertical distribution of bivalve larvae varies with tidal conditions. Mar. Ecol. Prog. Ser. 326, 167–174. doi: 10.3354/meps326167
Landguth E. L., Cushman S. A., Schwartz M. K., McKelvey K. S., Murphy M., Luikart G. (2010). Quantifying the lag time to detect barriers in landscape genetics. Mol. Ecol. 19, 4179–4191. doi: 10.1111/j.1365-294X.2010.04808.x
Lewis K. B., Carter L., Davey F. J. (1994). The opening of cook strait: Interglacial tidal scour and aligning basins at a subduction to transform plate edge. Mar. Geol. 116, 293–312. doi: 10.1016/0025-3227(94)90047-7
Liggins L., Treml E. A., Possingham H. P., Riginos C. (2016). Seascape features, rather than dispersal traits, predict spatial genetic patterns in co-distributed reef fishes. J. Biogeogr. 43, 256–267. doi: 10.1111/jbi.12647
Lotterhos K. E., Levitan D. R. (2010). Gamete release and spawning behavior in broadcast spawning marine invertebrates. Evol. Primary. Sexual. Characters. Anim. 99, 120.
Lourenço C. R., Nicastro K. R., McQuaid C. D., Chefaoui R. M., Assis J., Taleb M. Z., et al. (2017). Evidence for rangewide panmixia despite multiple barriers to dispersal in a marine mussel. Sci. Rep. 7, 1–16. doi: 10.1038/s41598-017-10753-9
Loveless M. D., Hamrick J. L. (1984). Ecological determinants of genetic structure in plant populations. Annu. Rev. Ecol. Syst. 15 (1), 65–95. doi: 10.1146/annurev.es.15.110184.000433
Mable B. K. (2019). Conservation of adaptive potential and functional diversity: Integrating old and new approaches. Conserv. Genet. 20, 89–100. doi: 10.1007/s10592-018-1129-9
McLeod I., Parsons D., Morrison M., Van Dijken S., Taylor R. (2014). Mussel reefs on soft sediments: A severely reduced but important habitat for macroinvertebrates and fishes in new Zealand. New Z. J. Mar. Freshw. Res. 48, 48–59. doi: 10.1080/00288330.2013.834831
McQuaid C. D., Phillips T. (2000). Limited wind-driven dispersal of intertidal mussel larvae: In situ evidence from the plankton and the spread of the invasive species Mytilus galloprovincialis in south Africa. Mar. Ecol. Prog. Ser. 201, 211–220. doi: 10.3354/meps201211
Meirmans P. G. (2012). The trouble with isolation by distance. Mol. Ecol. 21, 2839–2846. doi: 10.1111/j.1365-294X.2012.05578.x
Mertens L. E., Treml E. A., Von der Heyden S. (2018). Genetic and biophysical models help define marine conservation focus areas. Front. Mar. Sci. 268. doi: 10.3389/fmars.2018.00268
Munguia-Vega A., Jackson A., Marinone S. G., Erisman B., Moreno-Baez M., Giron-Nava A., et al. (2014). Asymmetric connectivity of spawning aggregations of a commercially important marine fish using a multidisciplinary approach. PeerJ 2, e511. doi: 10.7717/peerj.511
Norrie C., Dunphy B., Roughan M., Weppe S., Lundquist C. (2020). Spill-over from aquaculture may provide a larval subsidy for the restoration of mussel reefs. Aquacult. Environ. Interact. 12, 231–249. doi: 10.3354/aei00363
Okubo A., Ebbesmeyer C. C. (1976). Determination of vorticity, divergence, and deformation rates from analysis of drogue observations. Deep. Sea. Res. Oceanogr. Abstracts. 23, 349–352. doi: 10.1016/0011-7471(76)90875-5
Paetkau D., Slade R., Burden M., Estoup A. (2004). Genetic assignment methods for the direct, real-time estimation of migration rate: a simulation-based exploration of accuracy and power. Mol. Ecol. 13, 55–65. doi: 10.1046/j.1365-294X.2004.02008.x
Papa Y., Oosting T., Valenza-Troubat N., Wellenreuther M., Ritchie P. A. (2021). Genetic stock structure of new Zealand fish and the use of genomics in fisheries management: an overview and outlook. New Z. J. Zool. 48, 1–31. doi: 10.1080/03014223.2020.1788612
Paul L. (2012). A history of the firth of Thames dredge fishery for mussels: use and abuse of a coastal resource (New Zealand: Ministry of Agriculture and Forestry Wellington).
Paul-Burke K., Burke J., Team T.Ū.R.M., Bluett C., Senior T. (2018). Using māori knowledge to assist understandings and management of shellfish populations in Ōhiwa harbour, aotearoa new Zealand. New Z. J. Mar. Freshw. Res. 52, 542–556. doi: 10.1080/00288330.2018.1506487
Perez M. F., Franco F. F., Bombonato J. R., Bonatelli I. A., Khan G., Romeiro-Brito M., et al. (2018). Assessing population structure in the face of isolation by distance: are we neglecting the problem? Diversity Distrib. 24, 1883–1889. doi: 10.1111/ddi.12816
Piry S., Alapetite A., Cornuet J.-M., Paetkau D., Baudouin L., Estoup A. (2004). Geneclass2: A software for genetic assignment and first-generation migrant detection. J. Heredity. 95, 536–539. doi: 10.1093/jhered/esh074
Pita A., Casey J., Hawkins S. J., Villarreal M. R., Gutiérrez M.-J., Cabral H., et al. (2016). Conceptual and practical advances in fish stock delineation. (Fisheries Research, Elsevier)
Pritchard J. K., Stephens M., Donnelly P. (2000). Inference of population structure using multilocus genotype data. Genetics 155, 945–959. doi: 10.1093/genetics/155.2.945
Ross P. M., Hogg I. D., Pilditch C. A., Lundquist C. J., Wilkins R. J. (2012). Population genetic structure of the new Zealand estuarine clam Austrovenus stutchburyi (Bivalvia: Veneridae) reveals population subdivision and partial congruence with biogeographic boundaries. Estuaries. Coasts. 35, 143–154. doi: 10.1007/s12237-011-9429-z
Roughan M., Macdonald H. S., Baird M. E., Glasby T. M. (2011). Modelling coastal connectivity in a Western boundary current: Seasonal and inter-annual variability. Deep. Sea. Res. Part II.: Topical. Stud. Oceanogr. 58, 628–644. doi: 10.1016/j.dsr2.2010.06.004
Rousset F. (2008). genepop’007: A complete re‐implementation of the genepop software for Windows and Linux. Molecular ecology resources, 8 (1), 103–106.
Sefbom J., Kremp A., Rengefors K., Jonsson P. R., Sjöqvist C., Godhe A. (2018). A planktonic diatom displays genetic structure over small spatial scales. Environ. Microbiol. 20, 2783–2795. doi: 10.1111/1462-2920.14117
Selkoe K. A., Aloia C. C., Crandall E. D., Iacchei M., Liggins L., Puritz J. B., et al. (2016). A decade of seascape genetics: contributions to basic and applied marine connectivity. Mar. Ecol. Prog. Ser. 554, 1–19. doi: 10.3354/meps11792
Selkoe K. A., Toonen R. J. (2006). Microsatellites for ecologists: a practical guide to using and evaluating microsatellite markers. Ecol. Lett. 9, 615–629. doi: 10.1111/j.1461-0248.2006.00889.x
Simons R. D., Siegel D. A., Brown K. S. (2013). Model sensitivity and robustness in the estimation of larval transport: A study of particle tracking parameters. J. Mar. Syst. 119, 19–29. doi: 10.1016/j.jmarsys.2013.03.004
Slatkin M. (1987). Gene flow and the geographic structure of natural populations. Science 236 (4803), 787–792. doi: 10.1126/science.3576198
Star B., Apte S., Gardner J. P. (2003). Genetic structuring among populations of the greenshell mussel Perna canaliculus revealed by analysis of randomly amplified polymorphic DNA. Mar. Ecol. Prog. Ser. 249, 171–182. doi: 10.3354/meps249171
Sundqvist L., Keenan K., Zackrisson M., Prodöhl P., Kleinhans D. (2016). Directional genetic differentiation and relative migration. Ecol. Evol. 6, 3461–3475. doi: 10.1002/ece3.2096
Sutton P. J. (2003). The southland current: a subantarctic current. New Z. J. Mar. Freshw. Res. 37, 645–652. doi: 10.1080/00288330.2003.9517195
Swearer S. E., Shima J. S., Hellberg M. E., Thorrold S. R., Jones G. P., Robertson D. R., et al. (2002). Evidence of self-recruitment in demersal marine populations. Bull. Mar. Sci. 70, 251–271.
Swearer S. E., Treml E. A., Shima J. S. (2019). A review of biophysical models of marine larval dispersal. Oceanography and Marine Biology (CRC Press), 325–356. doi: 10.1201/9780429026379-7
Valencia E., Meerhoff E., Díaz-Cabrera E., Guerrero F., Roja-Hernández N., Vega-Retter C., et al. (2021). Weak connectivity and population cohesiveness in rudderfish Kyphosus sandwicensis (Teleostei: Kyphosidae) inhabiting remote oceanic islands. Aquat. Conserv.: Mar. Freshw. Ecosyst. 31, 356–366. doi: 10.1002/aqc.3438
Veale A. J., Lavery S. D. (2011). Phylogeography of the snakeskin chiton Sypharochiton pelliserpentis (Mollusca: Polyplacophora) around new Zealand: are seasonal near-shore upwelling events a dynamic barrier to gene flow? Biol. J. Linn. Soc. 104, 552–563. doi: 10.1111/j.1095-8312.2011.01743.x
Walters R. A., Gillibrand P. A., Bell R. G., Lane E. M. (2010). A study of tides and currents in cook strait, new Zealand. Ocean. Dyn. 60, 1559–1580. doi: 10.1007/s10236-010-0353-8
Waters J., Roy M. (2004). Phylogeography of a high-dispersal new Zealand sea-star: does upwelling block gene-flow? Mol. Ecol. 13, 2797–2806. doi: 10.1111/j.1365-294X.2004.02282.x
Weersing K., Toonen R. J. (2009). Population genetics, larval dispersal, and connectivity in marine systems. Mar. Ecol. Prog. Ser. 393, 1–12. doi: 10.3354/meps08287
Wei K., Wood A. R., Gardner J. P. (2013). Population genetic variation in the new Zealand greenshell mussel: Locus-dependent conflicting signals of weak structure and high gene flow balanced against pronounced structure and high self-recruitment. Mar. Biol. 160, 931–949. doi: 10.1007/s00227-012-2145-9
Keywords: population connectivity, Lagrangian particle tracking, FST, gene flow, biophysical modelling
Citation: Quigley CN, Roughan M, Chaput R, Jeffs AG and Gardner JPA (2022) Combined biophysical and genetic modelling approaches reveal new insights into population connectivity of New Zealand green-lipped mussels. Front. Mar. Sci. 9:971209. doi: 10.3389/fmars.2022.971209
Received: 16 June 2022; Accepted: 07 September 2022;
Published: 29 September 2022.
Edited by:
Satoshi Mitarai, Okinawa Institute of Science and Technology Graduate University, JapanReviewed by:
Corinna Breusing, University of Rhode Island, United StatesNina Yasuda, The University of Tokyo, Japan
Copyright © 2022 Quigley, Roughan, Chaput, Jeffs and Gardner. This is an open-access article distributed under the terms of the Creative Commons Attribution License (CC BY). The use, distribution or reproduction in other forums is permitted, provided the original author(s) and the copyright owner(s) are credited and that the original publication in this journal is cited, in accordance with accepted academic practice. No use, distribution or reproduction is permitted which does not comply with these terms.
*Correspondence: Calvin N. Quigley, Y2FsdmluLnF1aWdsZXlAdnV3LmFjLm56