 Ji-Eun Park
 Hyun-Cheol Kim
 Kyoung-Ho Cho
- 1Center of Remote Sensing and Geographic Information System, Korea Polar Research Institute, Incheon, South Korea
- 2Division of Ocean Sciences, Korea Polar Research Institute, Incheon, South Korea
The Nordic Seas have been widely implicated by deep water formation as a part of Atlantic Meridional Overturning Circulation. This study explores the spatiotemporal variations in the near-surface salinity over the Nordic Seas associated with surface freshening factors by using monthly TOPAZ4 reanalysis data from 1991 to 2019. We first show that reliability of TOPAZ4 data compared to the salinity products of other reanalysis data, satellite data, and in-situ measurements in the Nordic Seas. The salinity variability was larger in the Greenland Sea (GS) than in the Norwegian Sea (NS) on both time scales of seasonal and interannual. The seasonal change of GS salinity was coincident with the seasonality of sea ice extent. The longer-time variations are decomposed by empirical orthogonal function (EOF) analysis. The GS salinity is mainly affected by current advection (29%) and sea ice extent (11%). The interannual response of salinity to the sea ice extent over the GS differs by season. NS salinity variability responds to the strength of the Subpolar Gyre associated with a large-scale atmospheric system that caused the freshening event in the mid-1990s. The propagation of the northward Atlantic Water core is observed over the period of about 3 years from the Faroe Shetland Channel to the Fram Strait at a speed of 2.6-6.5° year-1. Other freshening factors such as sea ice export from the Arctic, freshwater flux at the Fram Strait, and net precipitation are also discussed. For the past three decades, the continuous trend appeared only in the sea ice extent, which might be a signal of climate changes over high latitude. However, there was no significant trend other than the periodic change in a few years to the decadal time scale in the salinity of GS and NS. As preconditioning for deep convection, near-surface salinity within Greenland Sea Gyre was influenced by salinity fluctuation in both GS and NS.
1 Introduction
The high latitude ocean is facing rapid change by warming twice as fast as the global mean (Intergovernmental Panel on Climate Change, 2013). Land ice sheet mass losses and the meltdown of ice in the Arctic Ocean have accelerated during recent decades (e.g. Shepherd et al., 2012). The increase of ice melts may dilute the surface water and change the density structure of the upper ocean layer. Such dilution could suppress deep ocean convection, thus weakening or shutting down the formation of Atlantic Meridional Overturning Circulation (AMOC) in the Nordic Seas. Near-surface salinity of the Nordic Seas is a key indicator of surface freshening to understand changes in the AMOC.
The Nordic Seas comprising the Greenland Sea (GS) and Norwegian Sea (NS), which are divided into deep basins by ridge systems, have distinct oceanic frontal characteristics (Figure 1). Export from the Arctic through the Fram Strait and meltwater from the Greenland ice sheet together form coastal currents, the East Greenland Current (EGC) and the East Greenland Coastal Current (EGCC), along the East Greenland shelf. These southward-flowing currents convey relatively cold, fresh Polar Water (PW) into the Subpolar Gyre (SPG) in the North Atlantic via the Denmark Strait. On its route along the eastern margin of Greenland, the EGC encounters the northward-flowing branch of the Irminger Current (IC) and strong mixing occurs (Holliday et al., 2007; de Steur et al., 2009). The AMOC’s poleward flow extends to the Norwegian Atlantic Current (NwAC) crossing Faroe Shetland Channel (FSC) advecting heat and saline Atlantic Water (AW) toward the Nordic Seas (Aagaard et al., 1987; Clark et al., 2002; Orvik and Niiler, 2002; Muilwijk et al., 2018). The NwAC flows northward along the Norwegian continental slope, with the western branch turning to the eastern side of the Greenland Sea Gyre (GSG) forming Arctic front, and continues poleward as the West Spitsbergen Current (WSC) (Orvik et al., 2001; Hansen et al., 2011; Beszczynska-Möller et al., 2012; Wekerle et al., 2017; Pérez-Hernández et al., 2019; Raj et al., 2019; Huang et al., 2020). The Norwegian Coastal Current (NCC) formed in southern Norway flows northward along the Norwegian coastline to the Barents Sea. The surface layer of the coastal area is heavily impacted by local inflow and advection of land-derived freshwater (Kristiansen and Aas, 2015; Frigstad et al., 2020).
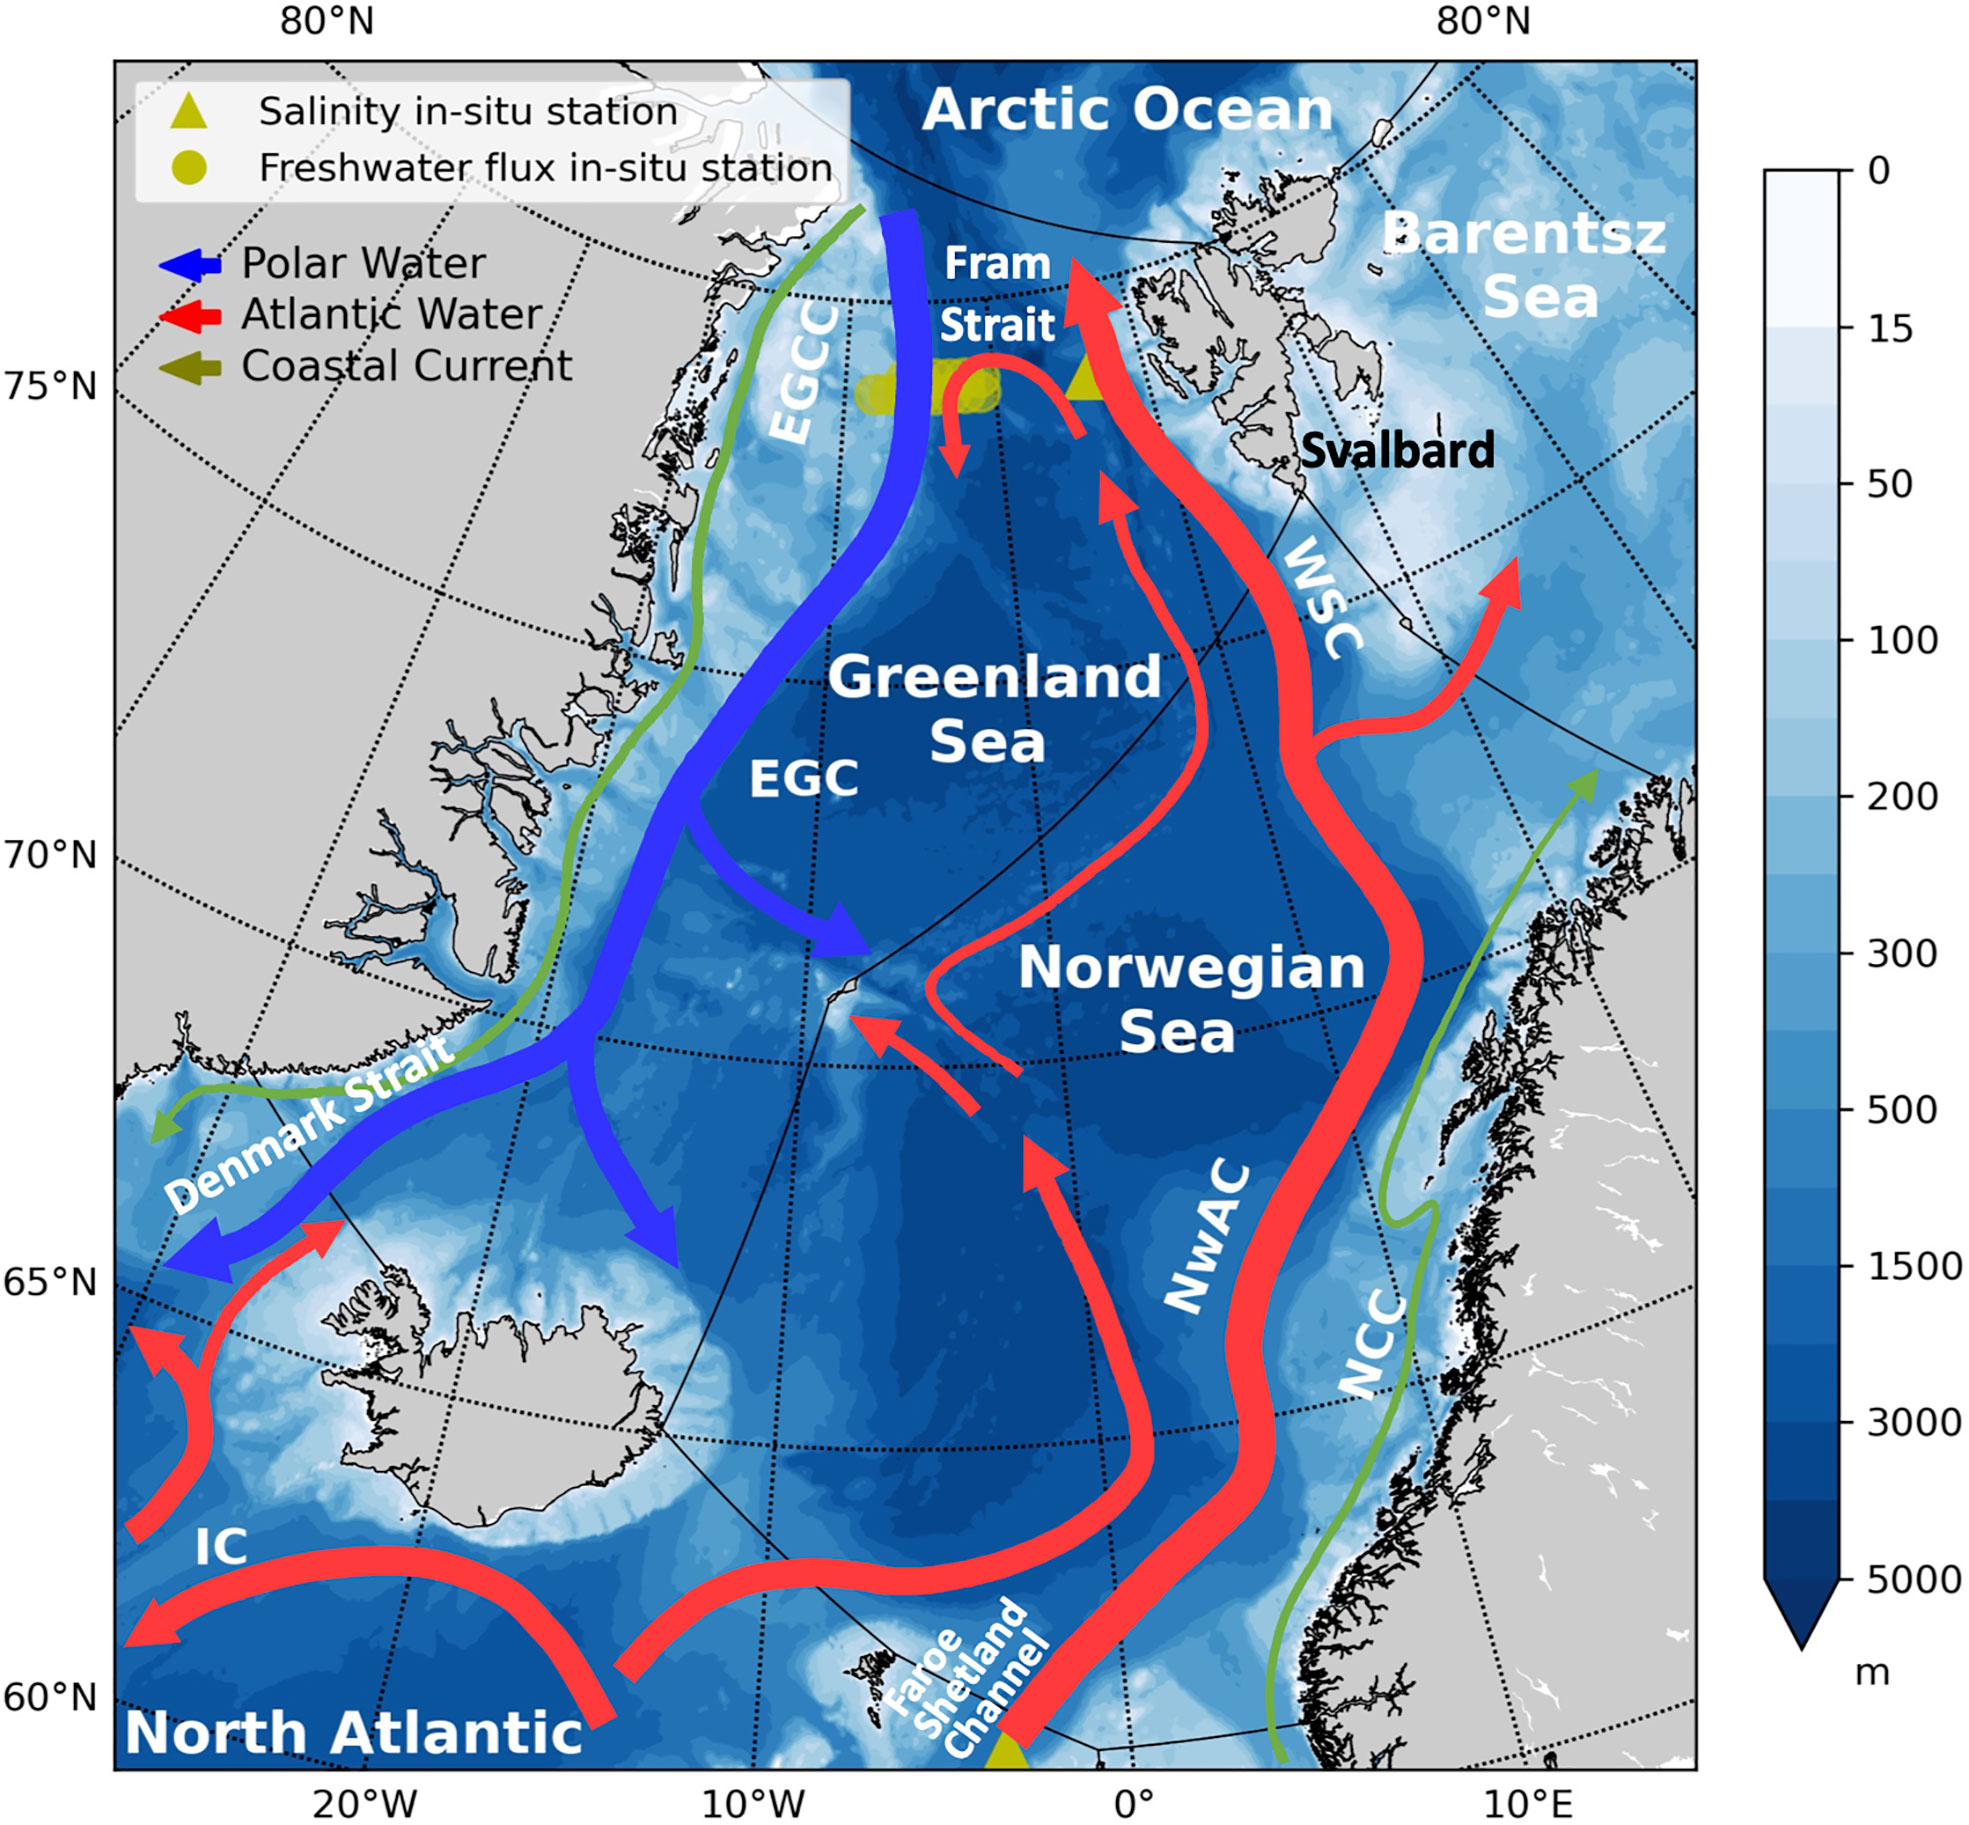
Figure 1 Surface current system over bathymetry (m) of the Nordic Seas, where red (blue) lines represent the Atlantic (Polar) Water and the green line expresses the coastal currents. The acronyms are the following; EGC, East Greenland Current; EGCC, East Greenland Coastal Current; IC, Irminger Current; NCC, Norwegian Coastal Current; WSC, West Spitsbergen Current; NwAC, Norwegian Atlantic Current. The black lines on the topography are the ocean boundaries defined by International Hydrographic Organization.
The GSG is a cyclonic circulation over a deep basin mainly driven by the overlying large-scale cyclonic wind field (Aagaard, 1970; Legutke, 1991; Langehaug and Falck, 2012; Jeansson et al., 2017). As one of the sources of the densest portion of AMOC, the convection depth in the GSG often exceeds 1500 m during winter (Wadhams et al., 2004; Latarius and Quadfasel, 2016). The deep convection intensity in the GSG is primarily associated with upper-ocean salinity related to the variability in the advection of re-circulating branches of the EGC and WSC, and local sea ice melt (Bashmachnikov et al., 2021). The thermohaline characteristics of re-circulation in the central GS interact with a mechanism that may govern the thermohaline system between the AMOC and the deep convection on interdecadal time scales (Stommel, 1958; Levermann and Born, 2007).
Salinity in the Nordic Seas is influenced by many components such as the hydrographic property of current inflow, melting and formation of sea ice, riverine discharge, and net precipitation. The Arctic Ocean as the global oceanic freshwater reservoir is believed to be the main attribution to the freshwater anomaly in the Nordic Seas through the sea ice and freshwater export at the Fram Strait, which is governed by the Arctic Ocean circulation (Dukhovskoy et al., 2004; Peterson et al., 2006: Serreze et al., 2006; Selyuzhenok et al., 2020). The Atlantic inflow also plays important role in determining salinity variability in the Nordic Seas (Glessmer et al., 2014). To elucidate the complicated hydrography of the Nordic Seas, Proshutinsky et al. (2015) and Kenigson and Timmermans (2021) proposed a conceptual model, in which Arctic exports and North Atlantic Ocean dynamics interact. However, responses of salinity in the Nordic Seas on the short- and long-term scale to accelerating changes in Arctic sea ice extent remain largely unknown. In addition, considerations about the spatiotemporal changes of upper layer salinity in the overall Nordic Seas influenced by several surface freshening factors and how this change will affect the preconditioning the GSG for deep convection in this area are still insufficient.
Earlier studies revealed the spatial distribution of sea surface salinity (SSS) in the high-latitude seas suggesting the possibility of using L-band radiometry satellites (e.g. Nichols and Subrahmanyam, 2019; Fournier et al., 2020; Hall et al., 2021). However, satellite-observed salinity data has accuracy issues, especially near land and sea ice in the high-latitude seas, due to the arctic region environments such as cold sea temperature, sea ice, and strong winds and waves that affect the sensitivity of L-band instruments and the surface roughness information (Klein and Swift, 1977; Brucker et al., 2014; Lang et al., 2016; Nichols and Subrahmanyam, 2019; Xie et al., 2019). The lack of in-situ measurements for validation of satellite measurements also induces low quality ocean salinity data. The Arctic region including the Nordic Seas is well known for its severe winter conditions, which makes it difficult to get accurate and consistent in-situ measurements. Although oceanographic observations are still insufficient to evaluate the salinity data set covering long-term time scales and large areas at the same time, ocean reanalysis data has been proven to be useful for the high-latitude seas (Zuo et al., 2019). TOPAZ is a coupled ocean and sea ice data assimilation system, which has been used as operational prediction system in Arctic and provides the forecast and reanalysis products through the portal of Copernicus Marine Environment Monitoring Service (CMEMS). The near-surface ocean variables such as sea temperature, salinity, and currents from the TOPAZ4 system revealed well oceanic environments in the Nordic Seas (Xie et al., 2017).
Therefore, it would be meaningful to analyze the near-surface salinity for comprehensive spatiotemporal variabilities and changes associated with the high-latitude environments. Here in this study, we first assess the TOPAZ4 data to determine whether it is suitable for the Nordic Seas research, show the spatiotemporal variability of near-surface salinity on the seasonal and inter-annual time scale in the Nordic Seas for the period of 1991-2019, explore the environmental factors that freshen the ocean surface layer and their influence on the near-surface salinity, and discuss salinity change in the GSG associated potential density and deep convection.
2 Materials and methods
2.1 Ocean salinity products
TOPAZ is based on the Hybrid Coordinate Ocean Model (HYCOM) and the ensemble Kalman filter data assimilation. This coupled ocean-sea-ice model is forced by the European Centre for Medium-Range Weather Forecasts (ECMWF) reanalysis data and assimilates available observations of remotely sensed data such as along-track altimetry, sea surface temperatures, sea ice concentrations, and sea ice drift along with in-situ temperature and salinity profiles (Sakov et al., 2012; Xie et al., 2017). Its fourth version (TOPAZ4) data have been extensively validated (e.g. Lien et al., 2016; Xie et al., 2017; Chatterjee et al., 2018). The monthly TOPAZ4 (product ID: ARCTIC_MULTIYEAR_PHY_002_003, Accessed November 8, 2021) used in this study are gridded at a resolution of 12.5 km from 1991 to 2019. Among the multiple vertical layers of the data set, near-surface depth of 5-m salinity data was used to identify the thin top layer affected by surface freshening factors. The layer sitting directly below the sea ice, consisting of low-salinity water as a result of summer snow and sea-ice meltwater and freshwater from the land runoff, is up to about 5 m (Bendtsen et al., 2017; Dmitrenko et al., 2017). And then, it is known that sea ice thickness is less than 5-m depth across much of the GS during the study period. Therefore, it can be assumed that the 5-m depth salinity represents near-surface freshening.
To evaluate the TOPAZ4 salinity data and account for its suitability over the Nordic Seas, two multi-year salinity products were compared to the global ocean array for the real-time geostrophic oceanography (Argo) salinity for overlapping periods (2015-2017) and regions. As reanalysis data, Estimating the Circulation and Climate of the Ocean (ECCO) Version 4 revision 4 (V4r4) monthly salinity data of Lat-Lon-Cap 90 resolution was used. ECCO synthesize observations with an ocean circulation model to estimate ocean and sea-ice state (ECCO Consortium, 2021). As L-band radiometry satellite data, Soil Moisture Active-Passive (SMAP) product of monthly 0.25° grid through Remote Sensing Systems (RSS) was also used. National Aeronautics and Space Administration (NASA) produces both ECCOV4r4 and SMAP-RSS. As an in-situ observation, the monthly gridded Argo salinity data set with a 1° resolution, produced by the Barnes method (BOA-Argo; Li et al., 2017), was utilized. There is a slight difference in the depth of the top layer between each product. L-band radiometry observes the first few centimeters of the sea surface, while SSS for Argo is defined as the shallower measurements reported below the depth of 10 m. BOA-Argo system interpolates salinity profiles from 0 to 10 m depth obtained from Argo at intervals of 5 m.
In addition to the Argo data, in-situ salinity time series data were also used, which are obtained from the core of WSC between 20 and 200 m at around 79°N collected by the Norwegian Polar Institute (https://www.mosj.no/en/climate/ocean/temperature-salinity-fram-strait.html) and upper-layer high salinity core in the depth of 0-200 m in FSC at around 3°W, 61°N distributed by International Council for the Exploration of the Sea (ICES) (https://ocean.ices.dk/core/iroc) during the period 1991-2019 (Figure 1). Empty observations in the time series were interpolated.
2.2 Environmental variables
For analyzing the association between near-surface salinity and physical environmental changes over the Nordic Seas, we used several environmental variables. The monthly oceanic surface current and barotropic stream function are from TOPAZ4 data set. The sea surface height (SSH) anomaly of monthly 0.25° grid considered in this study was produced and distributed by the CMEMS. The atmospheric variables (precipitation and evaporation) are obtained from the fifth-generation ECMWF reanalysis (ERA5) monthly mean at a spatial resolution of 0.25°. Sea ice concentration product generated from passive microwave instruments was distributed by National Snow and Ice Data Center (NSIDC). The data are provided at a grid size of 0.25°. Monthly ice extent was defined as the sum of surface areas of the grid cell with a sea ice concentration value of at least 0.15. The both atmospheric data and sea ice data are over the time period 1991-2019.
The SPG index considered in this study is following the method of Häkkinen and Rhines (2004), which has been defined as the first Principal Component (PC) of an Empirical Orthogonal Function (EOF) of the sea level anomaly field in the North Atlantic (Berx and Payne, 2017). The SPG index has a yearly resolution from 1993 to 2016 (https://data.marine.gov.scot/dataset/sub-polar-gyre-index). Ice export data at the Fram Strait during 1991-2012 was obtained by Wei et al. (2019), which use the global ocean-sea ice model. In-situ measurement data at a fixed station were also used. The time series of southward freshwater flux (relative to a reference salinity of 34.9) was collected from 1997 to 2015 by the Fram Strait Arctic Outflow Observatory (Norwegian Polar Institute) and Alfred Wegener Institute by moorings which were located between 0°W and 8°W for two latitudes (78°50’N and 79°N). The freshwater data are monthly averaged from 1997 to 2015.
2.3 Empirical orthogonal function analysis
For the spatiotemporal variation analyses, the monthly TOPAZ4 5-m depth salinity fields were decomposed into their dominant components using EOF analysis. This method decomposes a data set into orthogonal modes in terms of principal EOF patterns and associated PC time series (Kelly, 1988; Lagerloef and Bernstein, 1988; Thomson and Emery, 2014). The EOF analysis was performed on the anomaly of the salinity data obtained by subtracting the monthly climatology from the original salinity values to remove seasonality. This EOF based approach has been widely used in the arctic oceanography and climate field (e.g., Raj et al., 2019; Wei et al., 2019).
3 Results
3.1 Comparison of salinity products to Argo data
Although a lot of validation works have been conducted for each salinity product, characteristics and differences in the Nordic Seas between the data sets have not been studied. In order to investigate the spatial characteristics of each monthly salinity product, the temporal mean and standard deviation of salinity from TOPAZ4, ECCOV4r4, SMAP-RSS, and BOA-Argo data during the overlapping period of 2015-2017 were derived (Figure 2). All salinity products showed a relatively low salinity spatial distribution of less than 34 psu in the GS, whereas it was over 35 psu in the NS. In the near coastal areas above 75°N, TOPAZ showed lower salinity distribution than offshore (Figure 2A), while the spatial distribution of ECCO in the GS was relatively constant (Figure 2B). Near the Norwegian coast, the TOPAZ data also showed lower salinity than that of ECCO, which means that the effect of low salinity on the coastal area is expressed in more detail in TOPAZ than in ECCO. The SMAP data have a particularly low salinity less than 30 psu in the GS along the Greenland coast (Figure 2C). On the other hand, Argo data are not available along the coastal area due to its observational limitations like the sea ice cover (Figure 2D). Overall, the standard deviation distributions of salinity products were higher than 0.5 psu in the sea ice area or coastal region and decreased toward the open sea (Figures 2E-H). SMAP data had larger standard deviations than the two reanalysis fields over the entire region with very high values of more than 1 psu in the sea ice area and showed spatially discontinuity around the Fram Strait.
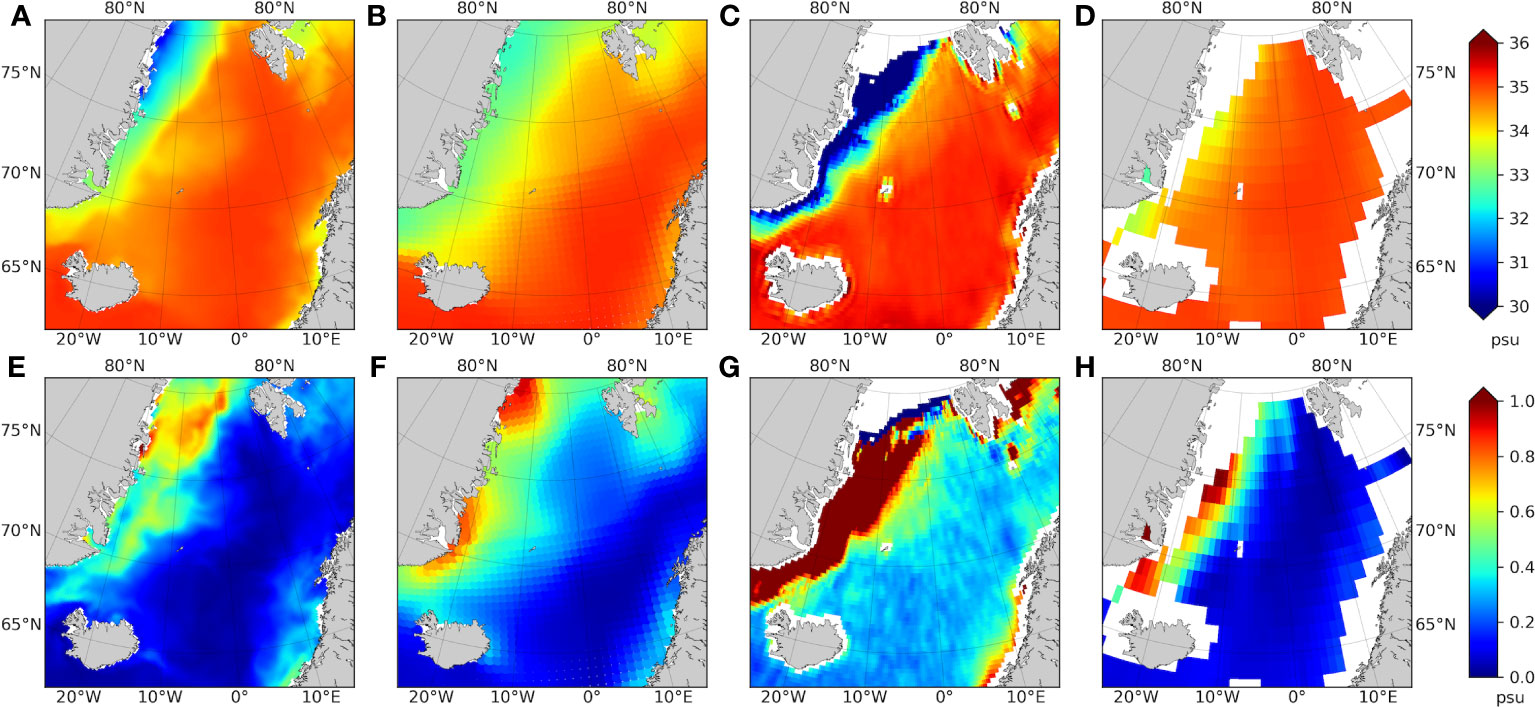
Figure 2 Temporal mean (top) and standard deviation (bottom) map of ocean salinity products from (A), (E) TOPAZ4, (B), (F) ECCOV4r4, (C), (G) SMAP-RSS and (D), (H) BOA-Argo data in the Nordic Seas for the period of 2015-2017.
In order to quantitatively evaluate each data, a comparative analysis was performed for each period over the Nordic Seas with Argo data (Figure 3). The matchups were obtained as the average of the salinity values corresponding to each grid of Argo data. TOPAZ and ECCO showed similar performance with R2 of 0.63 and 0.59, respectively (Figures 3A, B), while SMAP data had a lower R2 of 0.38 (Figure 3C). SMAP retrieved a wide range of salinity values between 29 and 38 psu for narrower Argo values around 32-35 psu. It also showed fresh bias for the salinity less than 34 compared with Argo, and which is clearly different with other two models. The fresh bias in SMAP salinity at high latitudes has been reported (Meissner et al., 2019). This distinction of the satellite SSS data in the Nordic Seas is related to the limitation of L-band radiometers in the cold waters at high latitudes as mentioned above. Compared with Argo data, the difference in accuracy between the two reanalysis data sets was not large, but the spatial resolution of TOPAZ (1/8°) is 4 times higher than that of ECCO (1/2°), and the temporal coverage of TOPAZ is also a little bit longer than that of ECCO. Based on these results, among the various surface salinity products currently available, TOPAZ salinity data appear to be suitable for spatiotemporal variability analysis over the entire Nordic Seas during a multi-decadal period. Because of the sparseness of Argo observations, the fine comparison of salinity data might be poor over the coastal areas. Detail quality assessment of the TOPAZ4 reanalysis in the Arctic region was discussed by Xie et al. (2017) with salinity in-situ profiles including coastal areas.
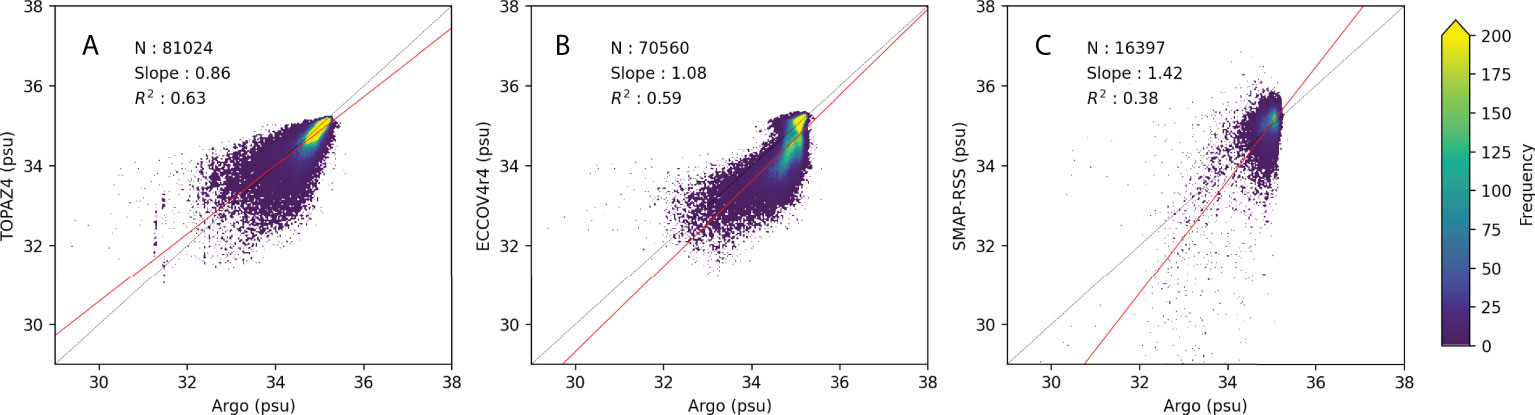
Figure 3 Comparison of salinity data from (A) TOPAZ4, (B) ECCOV4r4, and (C) SMAP-RSS with Argo data, where the color represents the number density of the matchups.
3.2 Spatiotemporal changes of near-surface salinity
3.2.1 Spatial characteristics
The spatial distribution of near-surface salinity over the Nordic Seas shows a similar pattern in both March and September, which can be interpreted simply as the GS is dominated by low salinity water of PW and sea ice while the NS is affected by advection of saline AW (Figure 4). The lowest salinity area below 32 psu appears off the coast of Greenland at around 79°N, and the highest over 35 psu appeared along the northward axis of AW in the central region of the NS. However, there was also a seasonal difference in the spatial distribution. In March, when winter characteristics are strong in the Arctic Circle at over 66°N, the overall salinity value is higher than in September (Figures 4A, B). The low-value salinity region along the coastal area of Greenland retreats in March and expands in September. In most of the September GS, the salinity distribution is below 34 psu. Conversely, the high salinity area in the NS over 35 psu extends to around Svalbard in March and contracts southward in September. In NS, a salinity distribution of below 34 psu is also prominent along the Norwegian coast in September. The salinity gradient magnitude varies spatially from 0 to over 0.7 psu deg-1 (Figures 4C, D). The GS shows a significantly strong gradient along the coastal area in both March and September, which marks the location of polar front separating southward EGC from the mixing of PW and AW and the IC (Perner et al., 2019). The boundaries of salinity gradients in the GS are clearer in March when the approximate maximum extent of sea ice is prominent. In September, there are the local strongest gradient areas near the Greenland coast and the Norwegian coast, which are thought to be a riverine input and advection of land ice sheet melt. At this time, the southern boundary of the GSG diverging from the EGC is also observed in the salinity gradient map (Figure 4D). In the middle of NS, the gradient value is very low and there is little change between March and September.
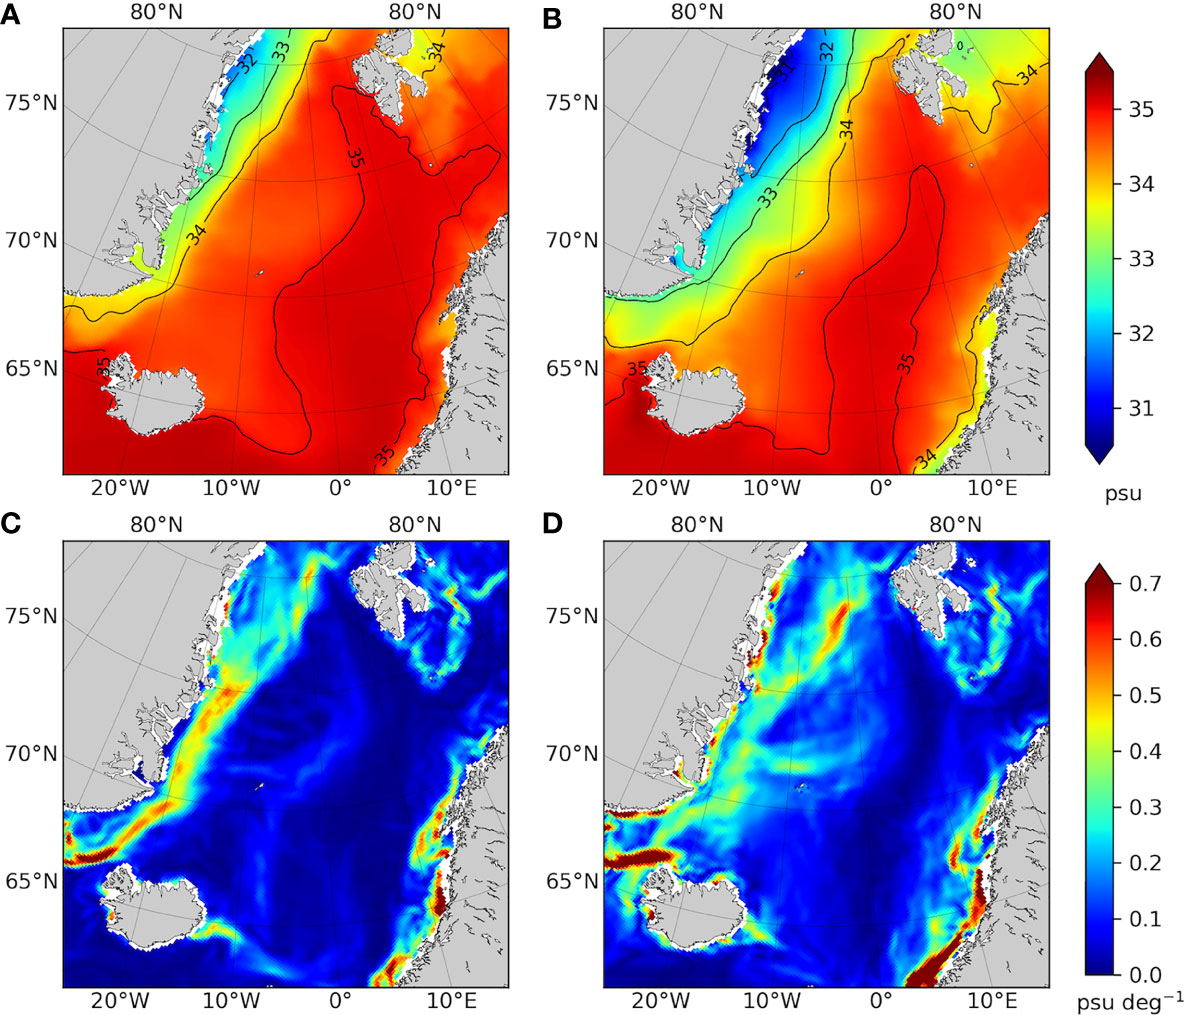
Figure 4 Spatial distribution of climatological near-surface salinity and its gradient magnitude of TOPAZ4 data in (A), (C) March and (B), (D) September.
3.2.2 Seasonal and interannual analysis
On the interannual time scale, the total range in near-surface salinity of the GS divided by ocean boundaries shown in Figure 1 fluctuated about 1 psu (33.4-34.4 psu), which was approximately ten times greater than that of NS varying within the range of 0.1 psu (35-35.1 psu) (Figures 5A, B). In the GS, monthly salinity reached 34.4 psu in April 1994, 2009, and 2015, which is the highest for the whole period, but there is no significant difference from other years. For the last two years in a row (2018-2019), August had the lowest mean salinity under 33.4 psu. The seasonal pattern with a large gradient between June and August was observed every year. The monthly climatology of the near-surface salinity of the GS also demonstrated strong seasonality (Figure 5C). From January to June, it maintained a relatively high salinity, and then sharply decreases until August. After the sharp decrease, it reached the minimum in September and gradually increased again. The yearly variabilities of each monthly salinity during 1991-2019 were smaller than the range of monthly climatology suggesting a possibility of smaller year-to-year variations of salinity than the seasonal variations over a longer time scale. In the NS, the salinity in the first half of 1995 to 1998 was particularly much lower than the other years. Compared to the 1990s, NS maintained high salinity from 2000 to 2016 and after that, it decreased again in recent years. Although the seasonal fluctuations are not prominent compared to GS, it is commonly shown that the salinity pattern from December to June is higher than that of other months over the data period. The monthly climatology in the NS was similar to the in-situ measurement presented by Taylor and Stephens (1980) (Figure 5D). The high and low salinity periods at NS correspond to the periods of high and low evaporation at NS, respectively, which means seasonal evaporation change appears to contribute to the seasonal cycle of salinity in this area (Taylor and Stephens, 1980). As the standard deviation of each month shows in Figure 5D, the variability of the month with high salinity was relatively larger than that of the month with low salinity.
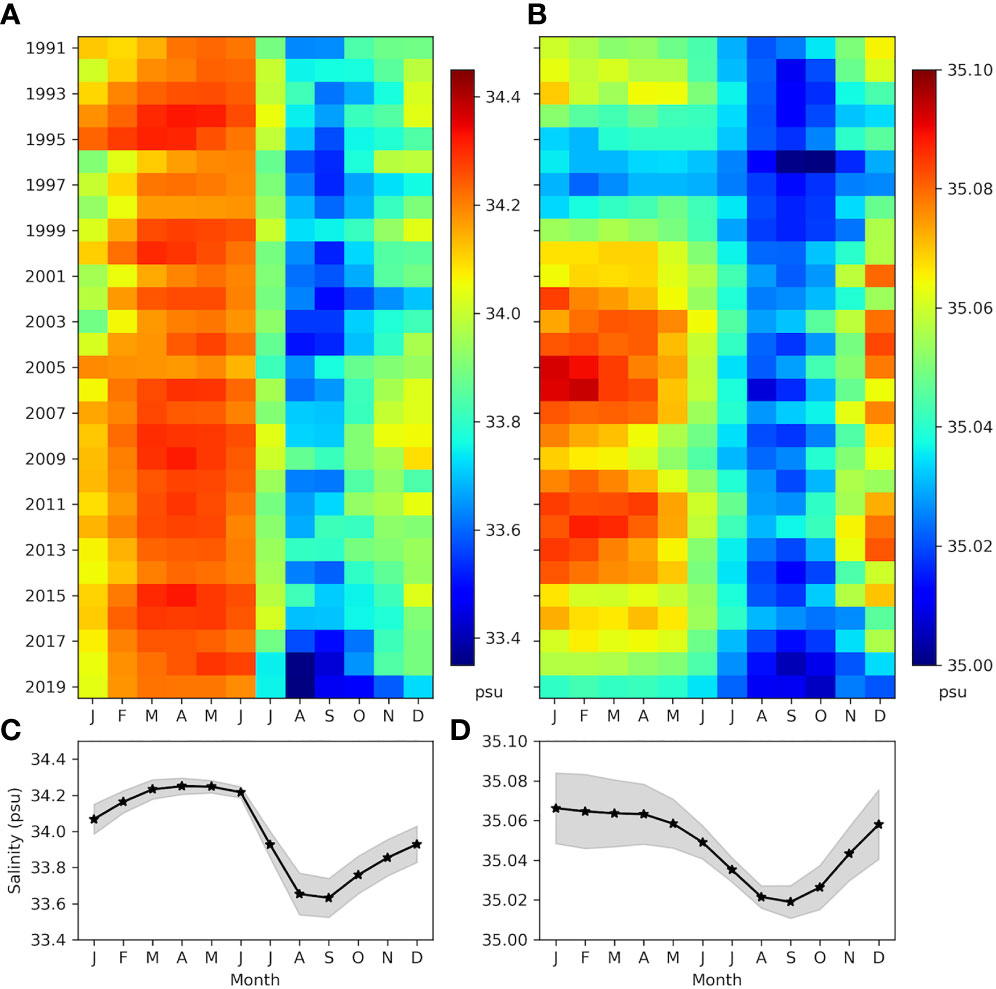
Figure 5 Year-month plot of near-surface salinity and its monthly climatology in (A), (C) the Greenland Sea and (B), (D) the Norwegian Sea for the period of 1991-2019. Shaded region expresses the standard deviation.
The strong seasonality of the GS mainly cooperated with seasonal variation of sea ice extent over the GS (Figure 6). The sea ice area gradually decreased after the maximum in March and then experienced a sharp decrease from June to August. From August to September, ice extent was at the lowest period of the year and increased again. The salinity in the GS was preceded by ice extent by one month, with a high correlation coefficient of 0.89. When sea ice is formed, the salinity around sea ice increases by brine rejection, and when sea ice melts, meltwater is supplied and freshens the surface layer. Other freshening factors such as ice export/freshwater flux at the Fram Strait, supplying freshwater to the surface layer in the GS (de Steur et al., 2015), also have each strong seasonal variation. Climatological sea ice export and freshwater flux at the Fram Strait had the lowest values during the year with a time interval of two months in May and July, respectively, while maximums appeared in October and November respectively. Exported sea ice after being formed in the Arctic Ocean would not have a brine rejection effect on the winter GS and supply freshwater when it melts in the summer GS, but it does not seem to have a significant effect on the variation of GS during the summer season. Freshwater flux had a negative correlation of -0.92 with the salinity climatology of GS. However, in this case, since the salinity variation precedes the freshwater flux by one month, it is more reasonable to imply that both freshwater flux and salinity of the GS are respectively affected by distinct seasonal environmental factors rather than suggesting that the seasonal salinity of GS is influenced by freshwater through the Fram Strait.
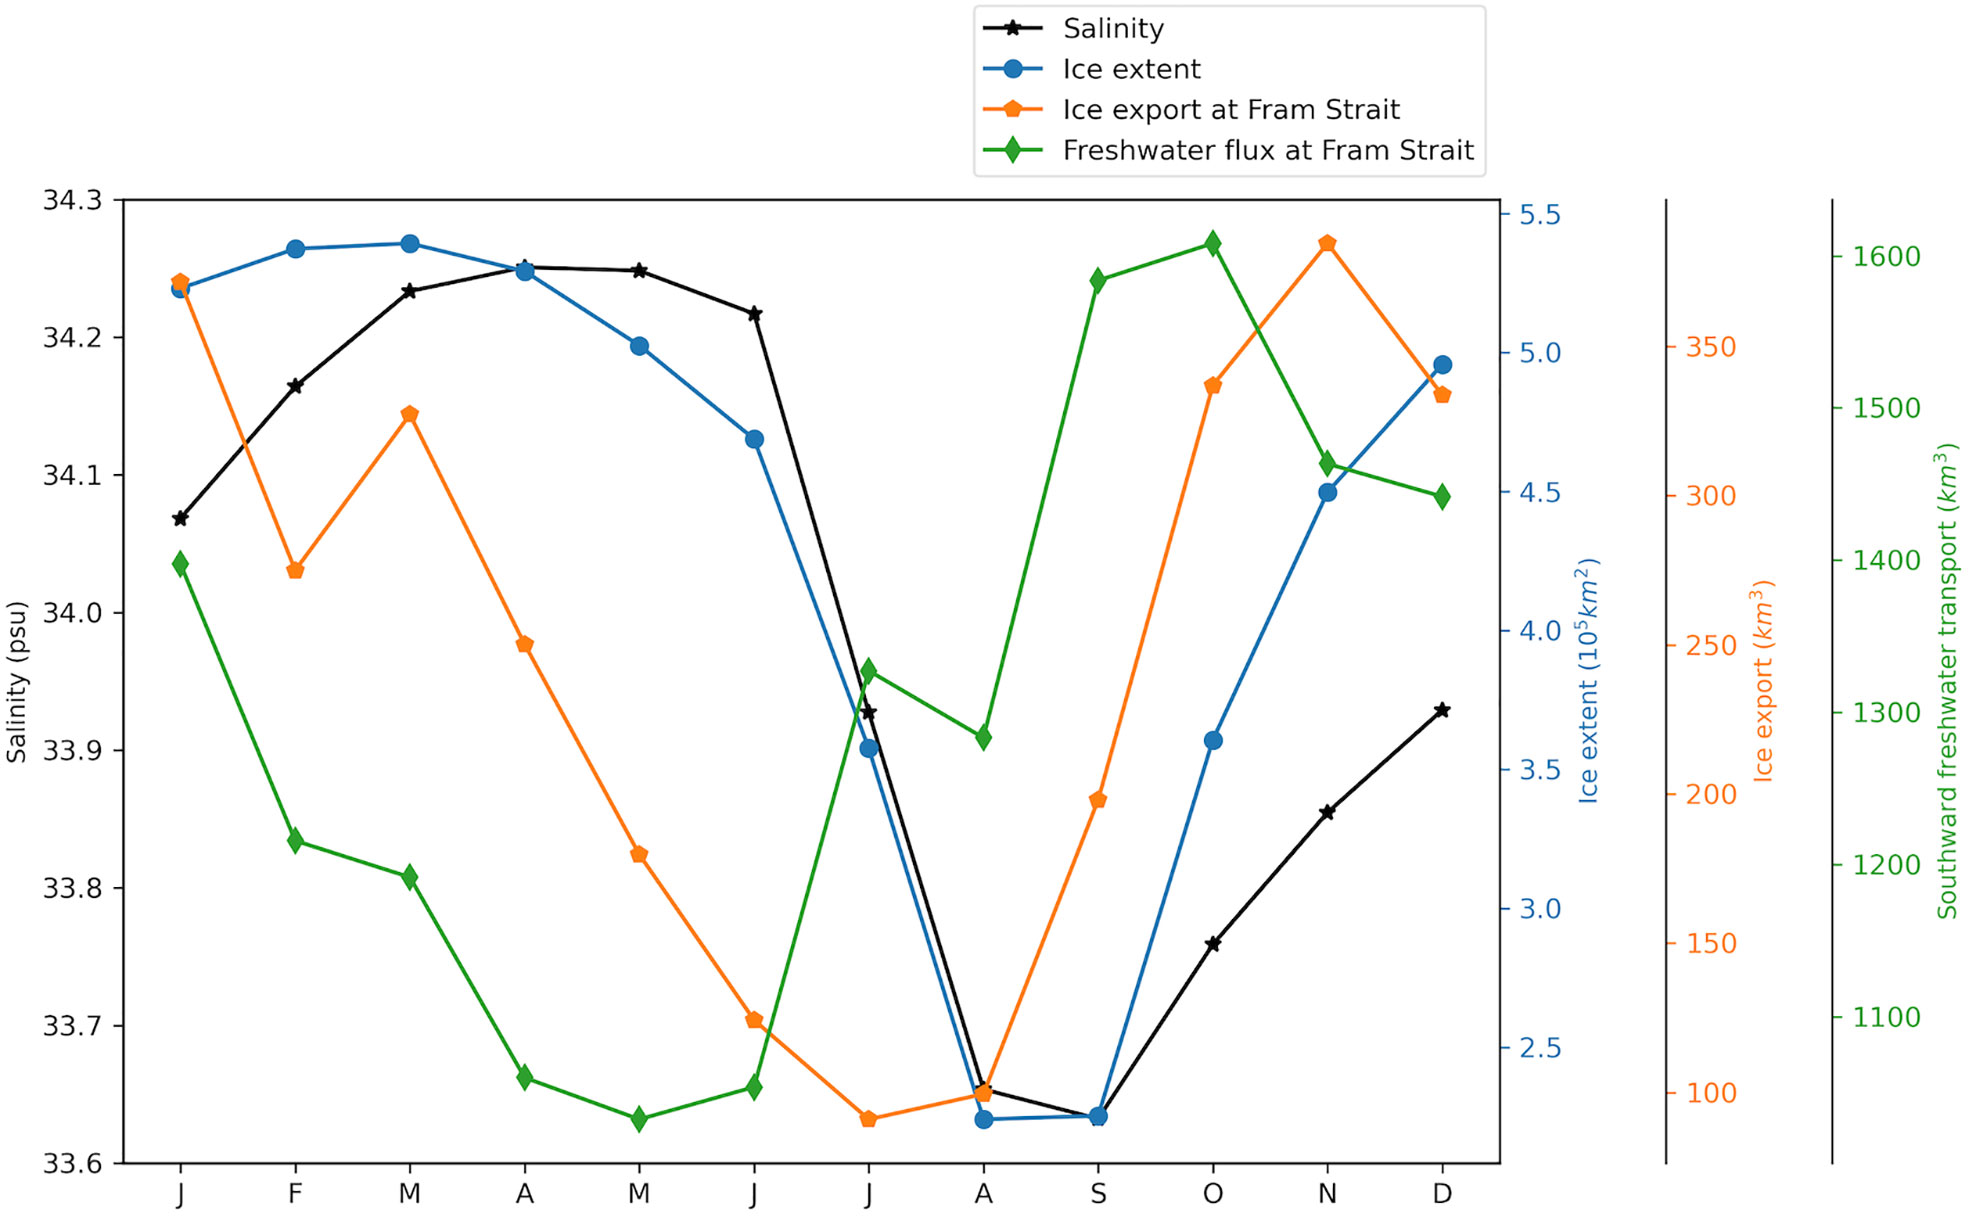
Figure 6 Climatology plots of near-surface salinity and sea ice extent in the Greenland Sea, and sea ice export and Freshwater at the Fram Strait.
The seasonality removed anomaly of the near-surface salinity in the Nordic Seas was decomposed to the eigenvector and the time-varying amplitude (Figure 7). The most dominant two EOFs account for 26 and 11% of the total variance respectively. The first mode of EOF is dominated by a region of negative distribution extending in the north-south direction at GS, while the variability in most NS is close to 0 (Figure 7A). The spatial distribution of the second EOF mode is separated by a strong east-west contrast signal in the northern GS (Figure 7B). The negative distribution in the coastal side of Greenland was opposite to that in the open sea. In both modes, the variability in the NS was much smaller than in the GS. Since it does not include seasonal variations, each mode can be inferred to be related to long-term variations affected by individual physical environmental variables.
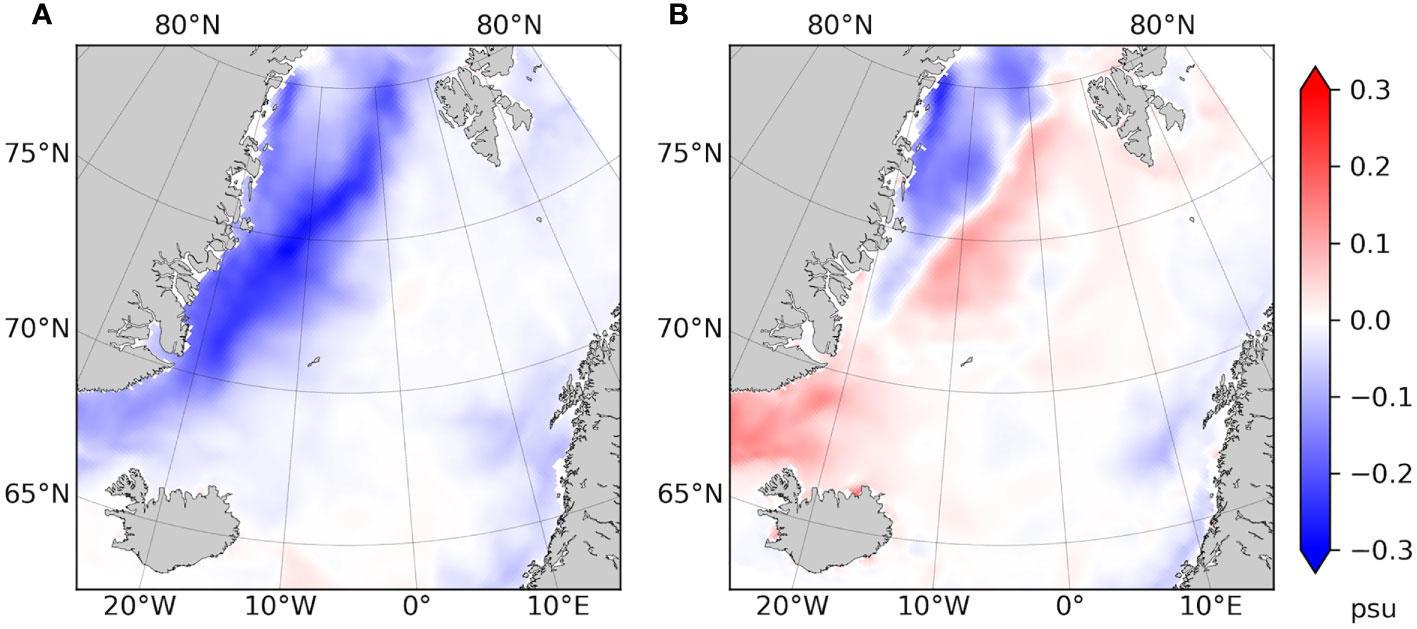
Figure 7 Spatial pattern of the (A) first and (B) second mode Empirical Orthogonal Function of near-surface salinity anomaly for the period of 1991-2019.
3.3 Impacts of environmental parameters on salinity variability
3.3.1 Sea surface current
In the first EOF mode (Figure 7A), high variability was mainly observed where the surface current speed was high with a speed of about 0.1 m/s along the path of the EGC (Figure 8A). This means that the near-surface salinity is basically determined by the hydrographical properties of the upper layer current. The correlation between the current speed anomaly and the PC time series of the first EOF mode in the Nordic Seas was obtained after applying a 25-month running mean. The distribution of correlation ranged between ± 0.8, showing a large difference depending on the region (Figure 8A). Notably, the location of a strong negative correlation coincides with the path of the AW carried by WSC and the modified AW after meeting the PW around the Fram Strait following the cyclonic circulation around the GSG. The GSG is intensified by anomalous cyclonic wind stress pattern over the central Nordic Seas which induces anomalous Ekman divergence leading to SSH anomalies (Furevik and Nilsen, 2005). Figure 8B showed the composite map of SSH anomalies during strong GSG. The intensity of GSG (GSG index) was inferred from the average of barotropic stream function multiplied by -1 over the GSG region (72.5°N–77.5°N, 12°W–9°E). When GSG index is over 8 Sv (106 m3s-1) between 1993 and 2019, negative SSH anomalies appeared mainly on the GS, and the anomalies were particularly strong in the GSG region. Since the anomalous SSH induces a circulation along the slope of the SSH, the negative SSH anomalies generate a stronger flow of AW and modified AW on either side of the gyre boundary (Lien et al., 2013; Chatterjee et al., 2018). Also, the time series of the gyre index showed a negative correlation phase with the first PC time series of salinity anomalies (r=-0.49) (Figure 8C). This means that the stronger surface current fields induced by the strong gyre promote the northward movement of the AW and induce the appearance of high salinity along the Gyre boundary. The relationship between GSG strength and transport of AW has previously been revealed through seawater temperature fluctuations by Chatterjee et al. (2018). In the vertical aspect, as the GSG becomes stronger, the stratification is weakened, and the vertically mixed AW occupies the subsurface instead of the cold and fresh water inside the GSG (Chatterjee et al., 2021).
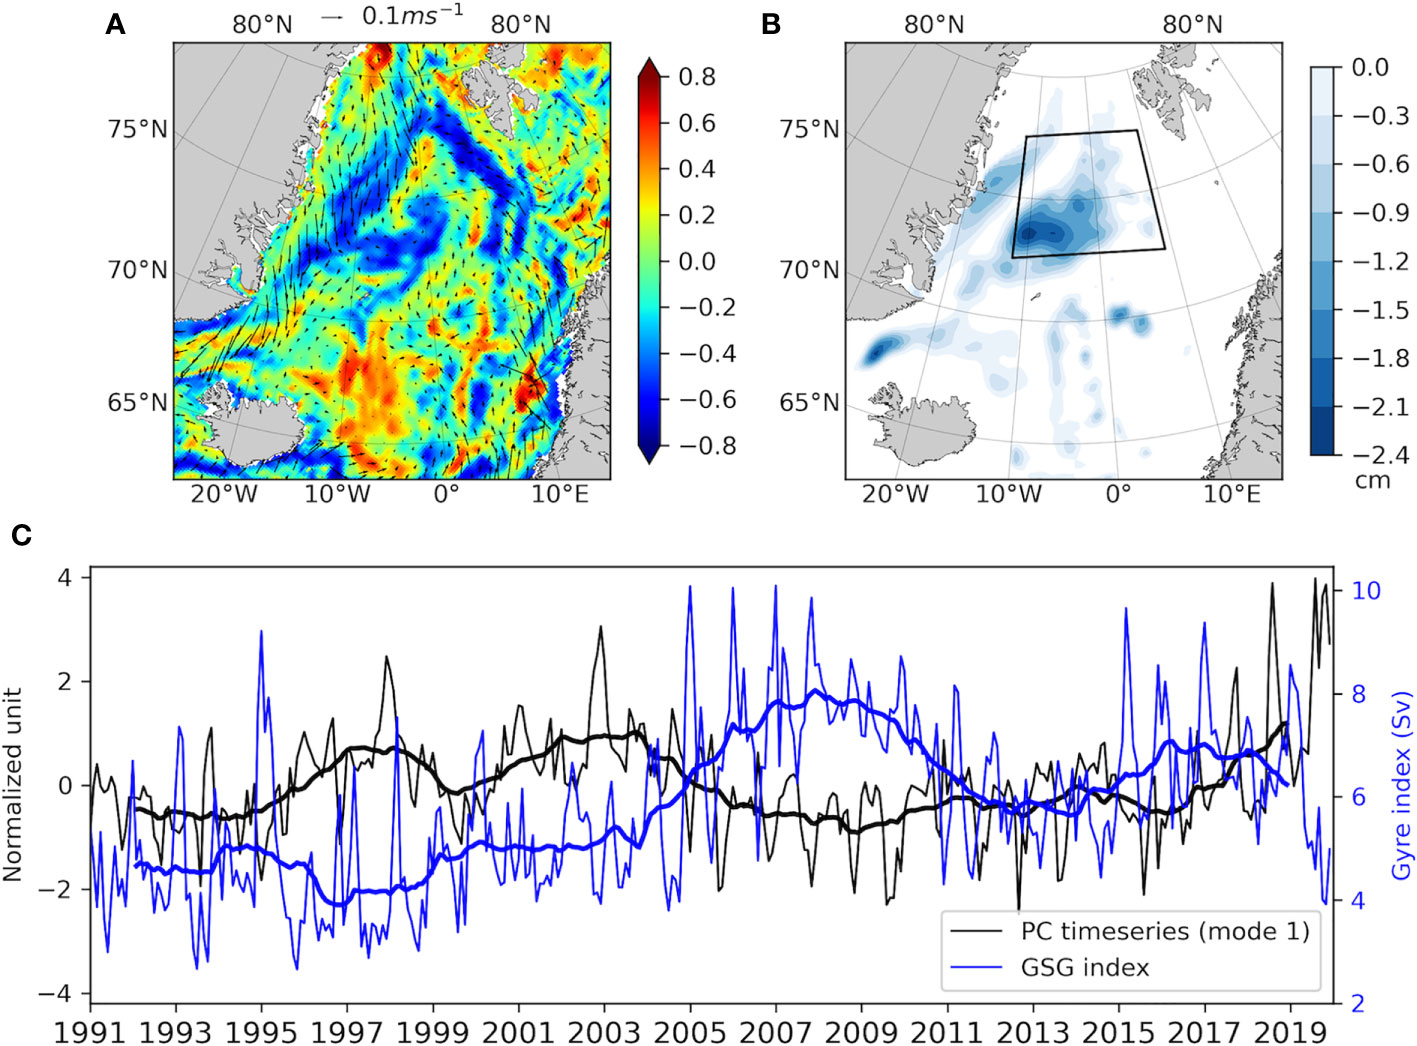
Figure 8 (A) Correlation map of the first PC time series of salinity anomaly with surface current speed, where the vectors represent the average surface current speed over 1991-2019. (B) Composite map of sea surface height anomaly when Greenland Sea Gyre (GSG) index is above 8Sv (Sv = 106 m3s-1) over the region inside the box (72.5°N–77.5°N, 12°W–9°E). The colorbar only denotes anomalies in the negative range. (C) The first PC time series of salinity anomaly and GSG index. The bolder lines represent a 25-month running average of the corresponding time series.
The surface current-wind forcing system over the Nordic Seas is derived from the large-scale atmospheric low-pressure that resembles the North Atlantic Oscillation (NAO) variability (Muilwijk et al., 2019). Not only NAO, large-scale atmospheric circulations associated with the Arctic Oscillation (AO) and Arctic Dipole (AD) also have a distinct influence on the wind fields in the Nordic Seas (Liu et al., 2016). Stronger GS wind forcing results in intensification of GSG by SSH anomalies, and the northward transport of AW along the WSC (Chatterjee et al., 2018; Muilwijk et al., 2019). NAO also drives changes in the strength of the SPG, which is linked to salinity changes in the eastern subpolar North Atlantic (Curry and McCartney, 2001; Bersch, 2002; Hátún et al., 2005; Sarafanov, 2009; Frankignoul et al., 2009). Freshening in the eastern subpolar North Atlantic is concomitant with a strong SPG and generates property anomalies of AW in the Nordic Seas (Hátún et al., 2005; Holliday et al., 2008; Koul et al., 2020). This implies that the first EOF mode demonstrates that the complicated interactions between atmospheric variability associated with AO, AD, and NAO and the Nordic Seas circulation contribute to the near-surface salinity by modifying the transport of seawater.
3.3.2 Sea ice extent
As previously known, during winter, the sea ice extent in the GS increases due to local formation and the inflow of the Arctic sea ice through the Fram Strait. Conversely, during summer, the sea ice extent decreases by local melting, and less sea ice export from the Arctic Sea. Despite the certain seasonal variation in sea ice conditions, the northern GS and coastal area of Greenland are covered by sea ice most of the year. The frequency of days with the sea ice concentration above 0.15 reaches almost 100% in the Fram Strait region and the northeast coast of Greenland (Figure 9A). In the open sea and southward, the frequency decreases. The annual average sea ice thickness at the edges of areas where sea ice frequency is above 70% is 0.4 m. The isolines distribution of 0.4 m sea ice thickness is similar to the zero isolines of the spatial distribution of the second EOF mode of the salinity anomalies as shown in Figure 7B. In the sea area with positive variation in GS (Figure 7B), the sea ice frequency is less than 70%, indicating larger sea ice fluctuation. The distinct difference in spatial variability in the second EOF mode according to the presence of sea ice shows how important the presence of sea ice is in salinity fluctuations in GS. The positive amplitude value of the second EOF mode in the southwestern area of GS is thought to be caused by the mixing of IC and EGC near Iceland with large year-round variability of sea ice. The relationship between sea ice and salinity fluctuations is also well revealed in the second PC time series and the time series of sea ice extent (Figure 9B). The two time series of 25-month running mean are highly correlated (r=-0.76), which means that changes in sea ice extent and salinity occur in opposite directions.
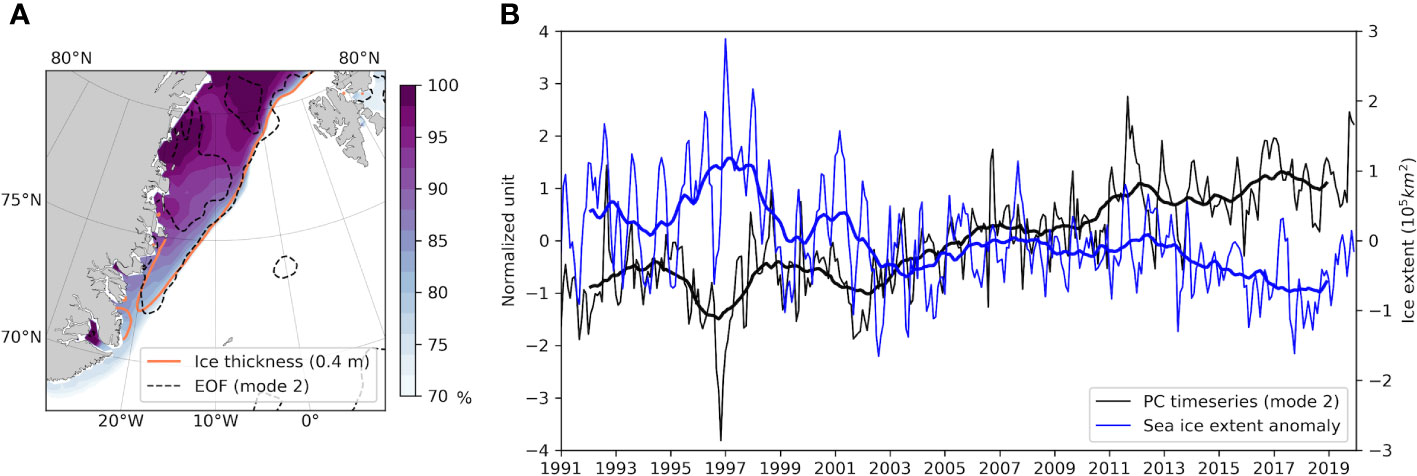
Figure 9 (A) Frequency of sea ice concentration over 0.15. The solid and dashed line represents the contour of mean ice thickness of 0.4 m and the second EOF mode of 0.1 intervals from -0.3 to 0 psu respectively. (B) Time series plot of principal component (PC) of the second mode and sea ice extent anomaly during the period of 1991-2019. The thick line represents the 25-month running mean of each time series.
The upper layer of the Nordic Seas is strongly stratified into water masses with contrasting properties that are tightly coupled to that of the sea ice edge. The low-salinity layer under the sea ice is too fresh to mix convectively with around waters, forming halocline waters below (Rudels, 2012). The winter sea ice edge, therefore, marks the region where AW subducts below the halocline waters and, seaward of which, convective mixing occurs (Halloran et al., 2020). In order to figure out the effect of the sea ice edge location on the AW intrusion into the GS, the season with a large ice extent (February to March) and the season with a small ice extent (August to September) were analyzed respectively. The composite fields of the 5-m depth water temperature anomaly were derived when the ice extent is over 90% in the season with large ice extent, and when the ice extent was below the 10% percentile in the season when the ice extent is small (Figure 10). The composite map of sea temperature anomaly when the sea ice extent was above 90% in February-March for the study period showed negative values between the sea ice edges of 10% and 90% (Figure 10A). Conversely, when the sea ice extent was under 10% in August-September, the anomaly map showed positive values between the ice edges of 10% and 90% (Figure 10B). When the sea ice extent is larger than the previous year, the sea temperature under the sea ice decreases in place that was previously open water, and when the sea ice retreats, the sea temperature is higher than the previous year in the place that was covered with sea ice. It can be implied that the region bounded by the sea ice edge prevents the expansion of the modified AW area. In addition, the continuous retreat tendency in ice extent leads to an increase in salinity in this area from 1991 to 2019 (Figure 9B).
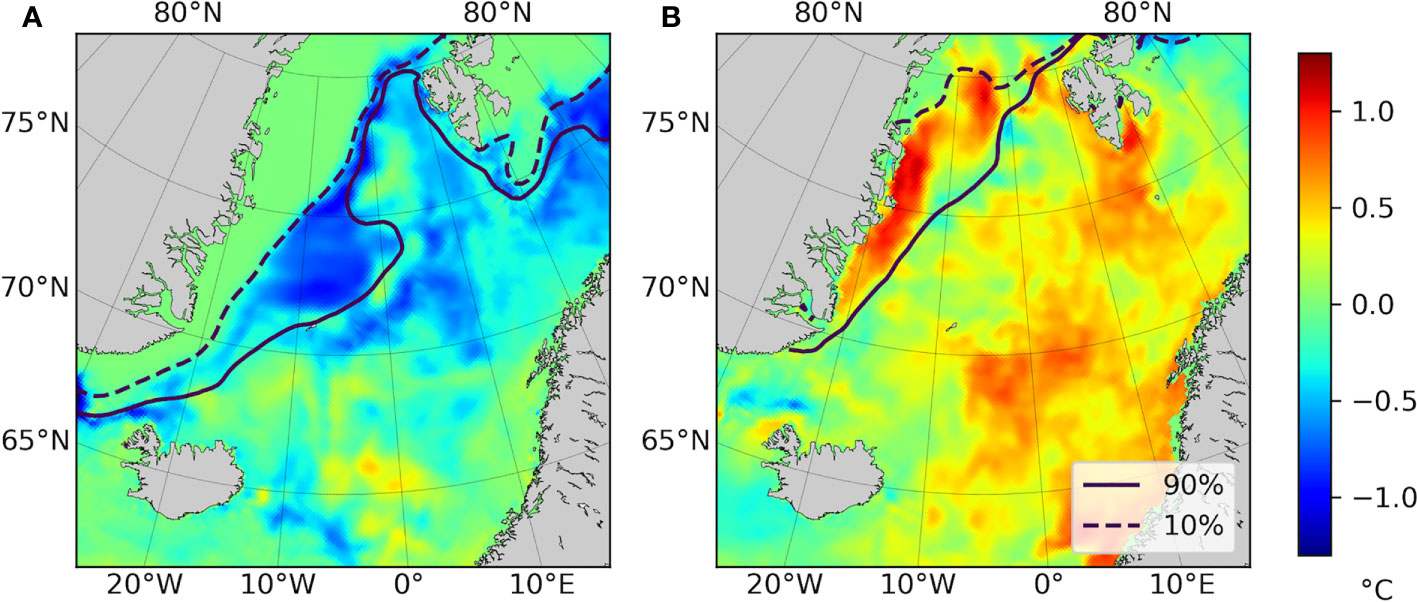
Figure 10 Composite map of sea temperature anomaly when percentile of the sea ice extent in (A) February-March is above 90% and (B) August-September is under 10%. The solid (dashed) contour lines represent the sea ice edge when the percentile of ice extent is 90% (10%) for each period.
However, from the perspective of the opposite seasonal effect, it requires a different interpretation. From January to June, when GS salinity was relatively high, there was a negative correlation with the time series data of average ice extent for the same period (r=-0.70) as in Figure 9B (Figure 11A). On the other hand, the mean salinity from July to December, when salinity is relatively low, has a low but positive correlation with the time series of sea ice extent (r=0.32) (Figure 11B). As shown in Figure 10B, when the ice extent is reduced during the ice melting season, AW intrusion occurs at the ice cover area. Nevertheless, the positive correlation between ice extent and salinity may be attributed to the supply of freshwater by ice melting. As the sea ice forms, the ice releases its salt into the underlying water and the salt diffuses into the depths. But, as the sea ice melts, the freshwater is supplied to the surface layer. Therefore, the more (less) the sea ice melts, the more (less) the seawater around sea ice is freshened, during the sea ice melting season. Since the sea ice extent in the GS shows clearly seasonal change (Figure 5), the interannual change of sea salinity differs depending on the period of ice formation and melt. Although precipitation is also one of the possible sources of freshwater to the GS during the summer season, many researchers found that atmospheric input accounts for only a small fraction of the total freshwater supply in this area (e.g. Aagaard and Carmack, 1989; Latarius and Quadfasel, 2016).
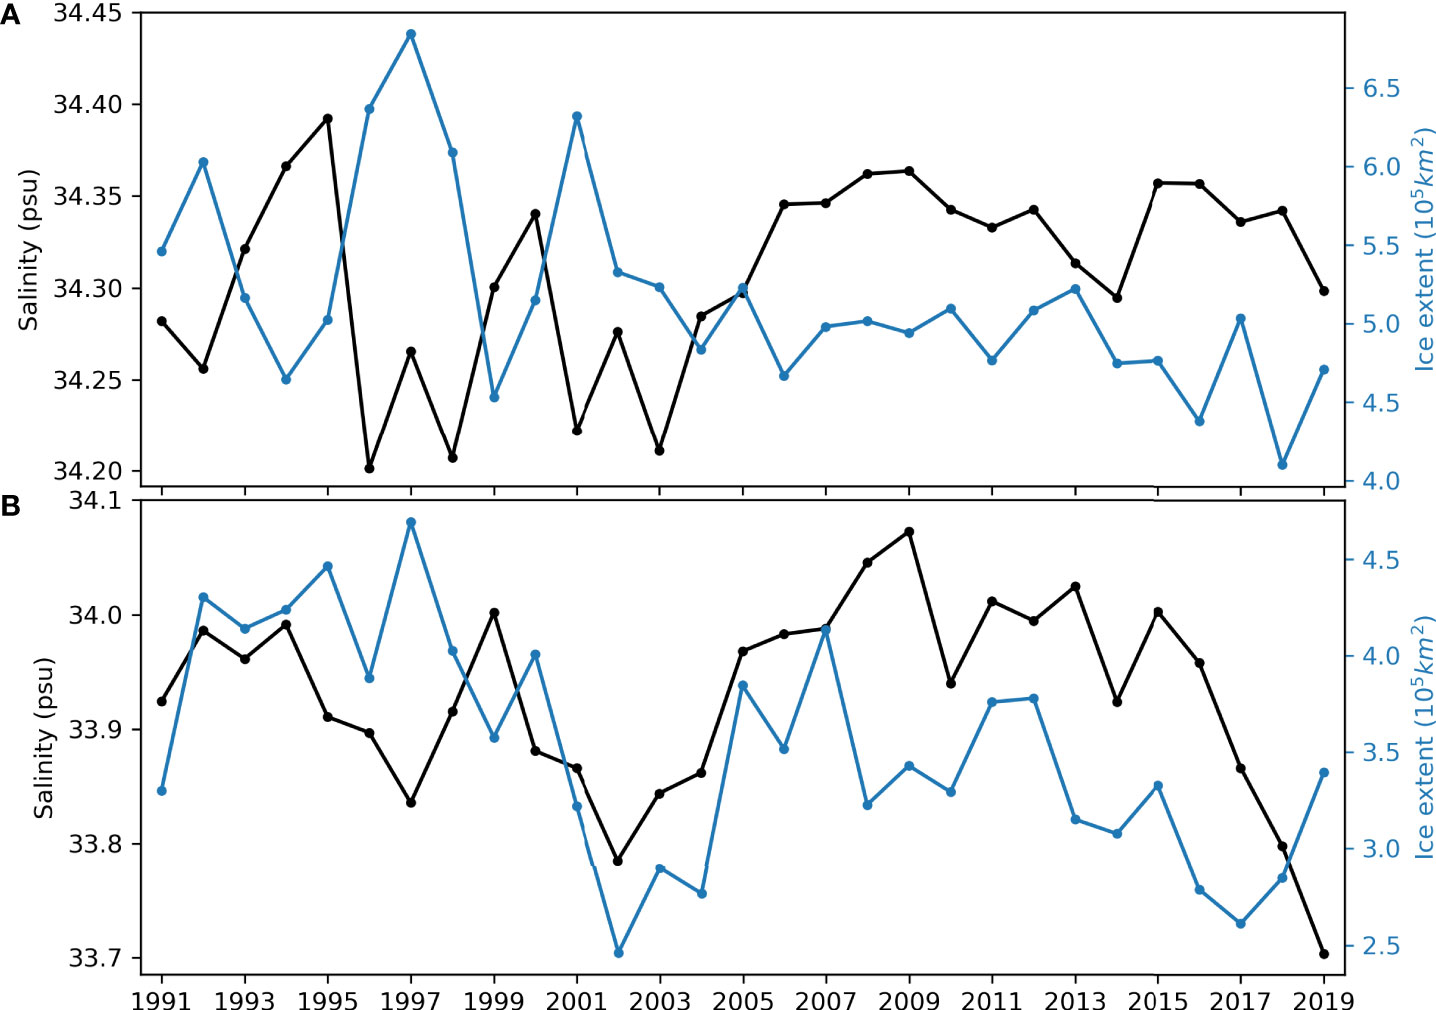
Figure 11 Time series plot of mean near-surface salinity in the Greenland Sea (black line) and sea ice extent (light blue line) during (A) January to June and (B) July to December.
3.3.3 Land runoff and coastal current
The effect of the climatology of surface runoff from Greenland on near-surface salinity can be found in the distribution of the lowest salinity over the study period (Figure 12A). Salinity under 31 psu is very localized near the GS coast, and this distribution seems to be formed by local sources rather than by advecting of low-salinity water. The freshwater formed by the land runoff may affect the surroundings by mixing, which can be confirmed by the distribution of the year with the lowest salinity from 1991 to 2019 along the large coastal area (Figure 12B). This spatial distinct emphasizes the contrasts between the effect of land discharge on the coast and the open sea and extends to polar front separating PW and mixed AW. The distribution standard deviation of TOPAZ4 and ECCO data also revealed the effect of land discharge with locally higher values near the Greenland coastal area (Figures 2E, F). The reason that the effect of land freshwater discharge is limited to the coastal area is thought to be related to the EGCC. Unlike the flow in EGC where freshwater is entrained into the close gyres, this continuous and narrow jet on the inner shelf serves as a direct route from the Arctic into the North Atlantic (Rudels et al., 2002; Pickart et al., 2005; Rudels et al., 2005; Jones et al., 2008; Foukal et al., 2020). Therefore, glacial water that melt from Greenland directly into the coastal current advect southward (Lin et al., 2018).
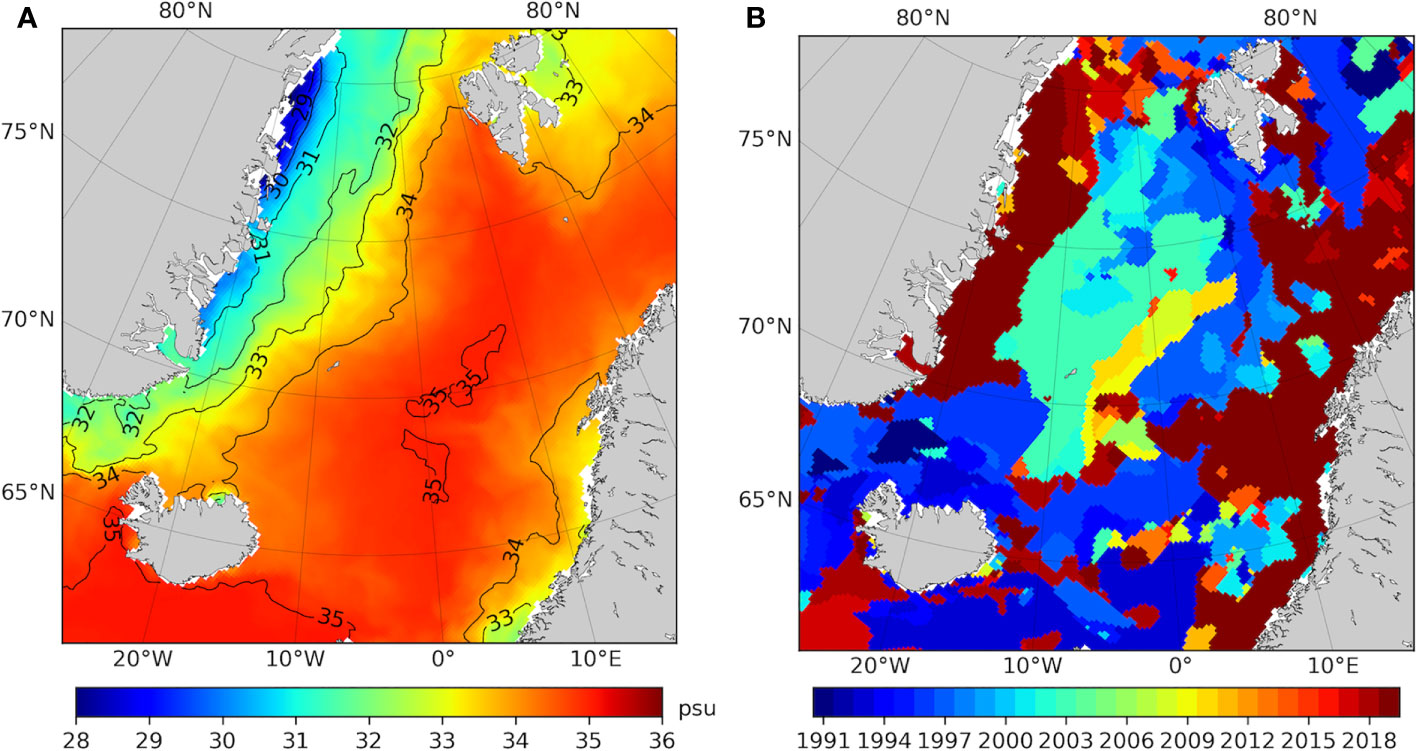
Figure 12 Spatial distribution of (A) minimum near-surface salinity for the period 1991-2019 and (B) the years in which the minimum salinity appeared.
The Norwegian coastal areas also show a similar low-salinity pattern, but the western and northern regions seemed to be more influenced by AW (Figure 12). Considering the lowest salinity values and distribution patterns off the Norwegian coast, it is possible that low-salinity waters were transmitted along NCC originating from the Baltic Sea as well as local land riverine inputs. Although the extent of freshwater influence in the western and northern Norway regions was limited (Frigstad et al., 2020), low-salinity water mass related to the northward flow of the NCC over the shallow shelf, extending outwards to about 60 km from the coast also observed (Gascard et al., 2004; Drivdal et al., 2016). Off the coast, the coastal currents appear to interact with AW.
3.3.4 The inflow of North Atlantic water
The annual near-surface salinity in NS of TOPAZ4 reanalysis data was compared with the salinity of the AW entering the NS from the eastern subpolar North Atlantic through FSC (61°N) and WSC core around the Fram Strait (79°N) (Figure 13A). The time series of AW salinity in the FSC leads the annual salinity over the NS by 2 years and has a correlation coefficient of 0.73. A maximum correlation coefficient between the annual NS salinity and the in-situ salinity data from the Fram Strait (r=0.67) is observed at the 1-year lead time. The three salinity time series showed similar change patterns, notwithstanding the method and depth at which they were obtained. There was a total time lag of about 3 years from the FSC to the Fram Strait for the propagation of AW over the NS. This result is consistent with the northward surface hydrographic anomalies of AW as presented by Holliday et al. (2008) and Lauvset et al. (2018) that indicated 3–4 years lag-time between FSC and the Fram Strait. The transfer of AW salinity property does not occur at a constant rate. The near-surface salinity anomaly along the AW pathway in the NS propagates northward at a speed that varies between 2.6-6.5° year-1 (average 0.016ms-1) (Figure 13B). The slowest propagating water mass during 1991-2019 was a positive anomaly that existed near 65°N between 2001-2003 and moved northward to 78°N over about 5 years. These propagation variations are thought to be due to interactions with irregular large atmospheric systems.
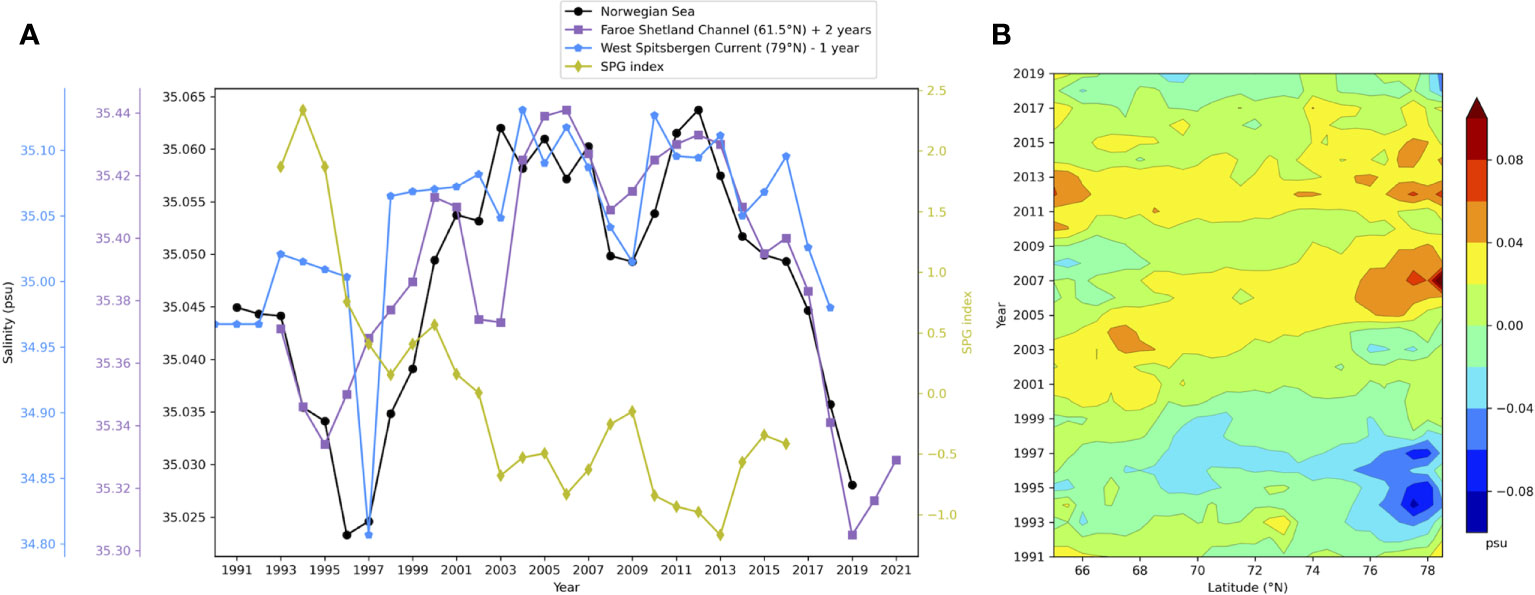
Figure 13 (A) Time series of an annual mean of near-surface salinity over the Norwegian Sea, in-situ measurements from Faroe Shetland Channel (61°N) and the core of West Spitsbergen Current at 79°N for the period 1991-2019, and the Subpolar Gyre (SPG) Index from 1993 to 2016 inferred from Berx and Payne (2017). (B) Time-latitude plot of near-surface salinity anomaly along the Atlantic Water pathway.
As shown from both the in-situ measurements and reanalysis salinity data of the AW, the salinity in the NS became relatively low in the mid-1990s, maintaining high salinity from the 2000s to the mid-2010s. This is also partially consistent with previous research for the overlapping period (Furevik et al., 2002; Skagseth and Mork, 2012; Korablev et al., 2014; Mork et al., 2014). The SPG index maintained low values after a sharp decline in the mid-1990s. Meanwhile, salinity, on the other hand, maintained high values after a sharp increase at the same time (Figure 13A). This result also supports the fact that the AW salinity in the NS originating from the Atlantic Ocean is associated with the changes in the dynamics of the SPG in the North Atlantic (Häkkinen and Rhines, 2004; Hátún et al., 2005; Holliday et al., 2008). A stronger SPG is associated with enhanced influence from the fresher western SPG region and impedes the subtropical salinity over the eastern subpolar North Atlantic (Koul et al., 2020). As mentioned previous, several studies have also addressed the influence of NAO on the AW inflow into the NS and the intensity of SPG (Dickson et al., 2000; Furevik, 2001; Berx and Payne, 2017). Although variability in the intensity of the SPG may not always be attributable to the NAO, it has repeatedly been linked to salinity changes in the eastern subpolar North Atlantic (Hátún et al., 2005; Frankignoul et al., 2009; Häkkinen et al., 2011). Salinity increases (decreases) coherently in the eastern subpolar North Atlantic during a negative (positive) NAO period (Koul et al., 2020). This response of salinity of AW inflow to cases of positive NAO (1991-1995, 2013-2018) is revealed through the propagation of water mass of negative anomalies over the NS with a time lag (Figure 13B). The negative anomalies are detected in the year-month plot of NS salinity during 1995-1998 and 2018-2019 (Figure 6B). The annual salinity in FSC decreased since 2015 to a lower level than the low salinity period in the mid-1990s (Figure 13A). This allows us to predict large negative salinity anomalies in the NS a few years ahead that were not observed during the study period. The appearance of very low salinity in the FSC is supported by Holliday et al. (2020) reporting that the eastern subpolar North Atlantic underwent extreme freshening from 2012 to 2016 caused by ocean circulation driven by unusual winter wind patterns.
3.3.5 Other factors related to the variability of near-surface salinity
Except for the factors that have been shown to be related to near-surface salinity of the Nordic Seas in the above sections, other freshening parameters (the freshwater flux and sea ice export at the Fram Strait and net precipitation), were also compared (Figure 14). The continuous in-situ time series data of transport of freshwater through the Fram Strait during the study period are very limited. The three different time series of southward freshwater flux under salinity of 34.9 for different measurement locations and lateral extents showed a major positive anomaly for 2010-2013 with a large fluctuation in the middle (Figure 14A). Another noteworthy point is the negative anomaly of 2004. Ice export data at the Fram Strait derived by Wei et al. (2019) from the numerical model was also limited from 1991 to 2012. The ice export showed a positive index between 1991 and 1996 and then after showed a near-zero or relatively low negative strength (Figure 14B). Since the mid-1990s, regime shift related to atmospheric circulation affecting the sea ice export from the Arctic was reported (Wei et al., 2019). Net precipitation anomaly does not show significant interannual variability (Figure 14C). The fluctuation of net precipitation in the short period is much larger than that in the long-term period, and there is no prominent tendency in the long-term scale. For all three variables, the tendency and magnitude of variabilities are not thought to affect the salinity anomaly of GS or NS (Figures 14D, E). GS and NS have periodic fluctuations from a few years to decadal changes, with no continuous trend signal in one direction, however, a sharp decrease was observed since 2017.
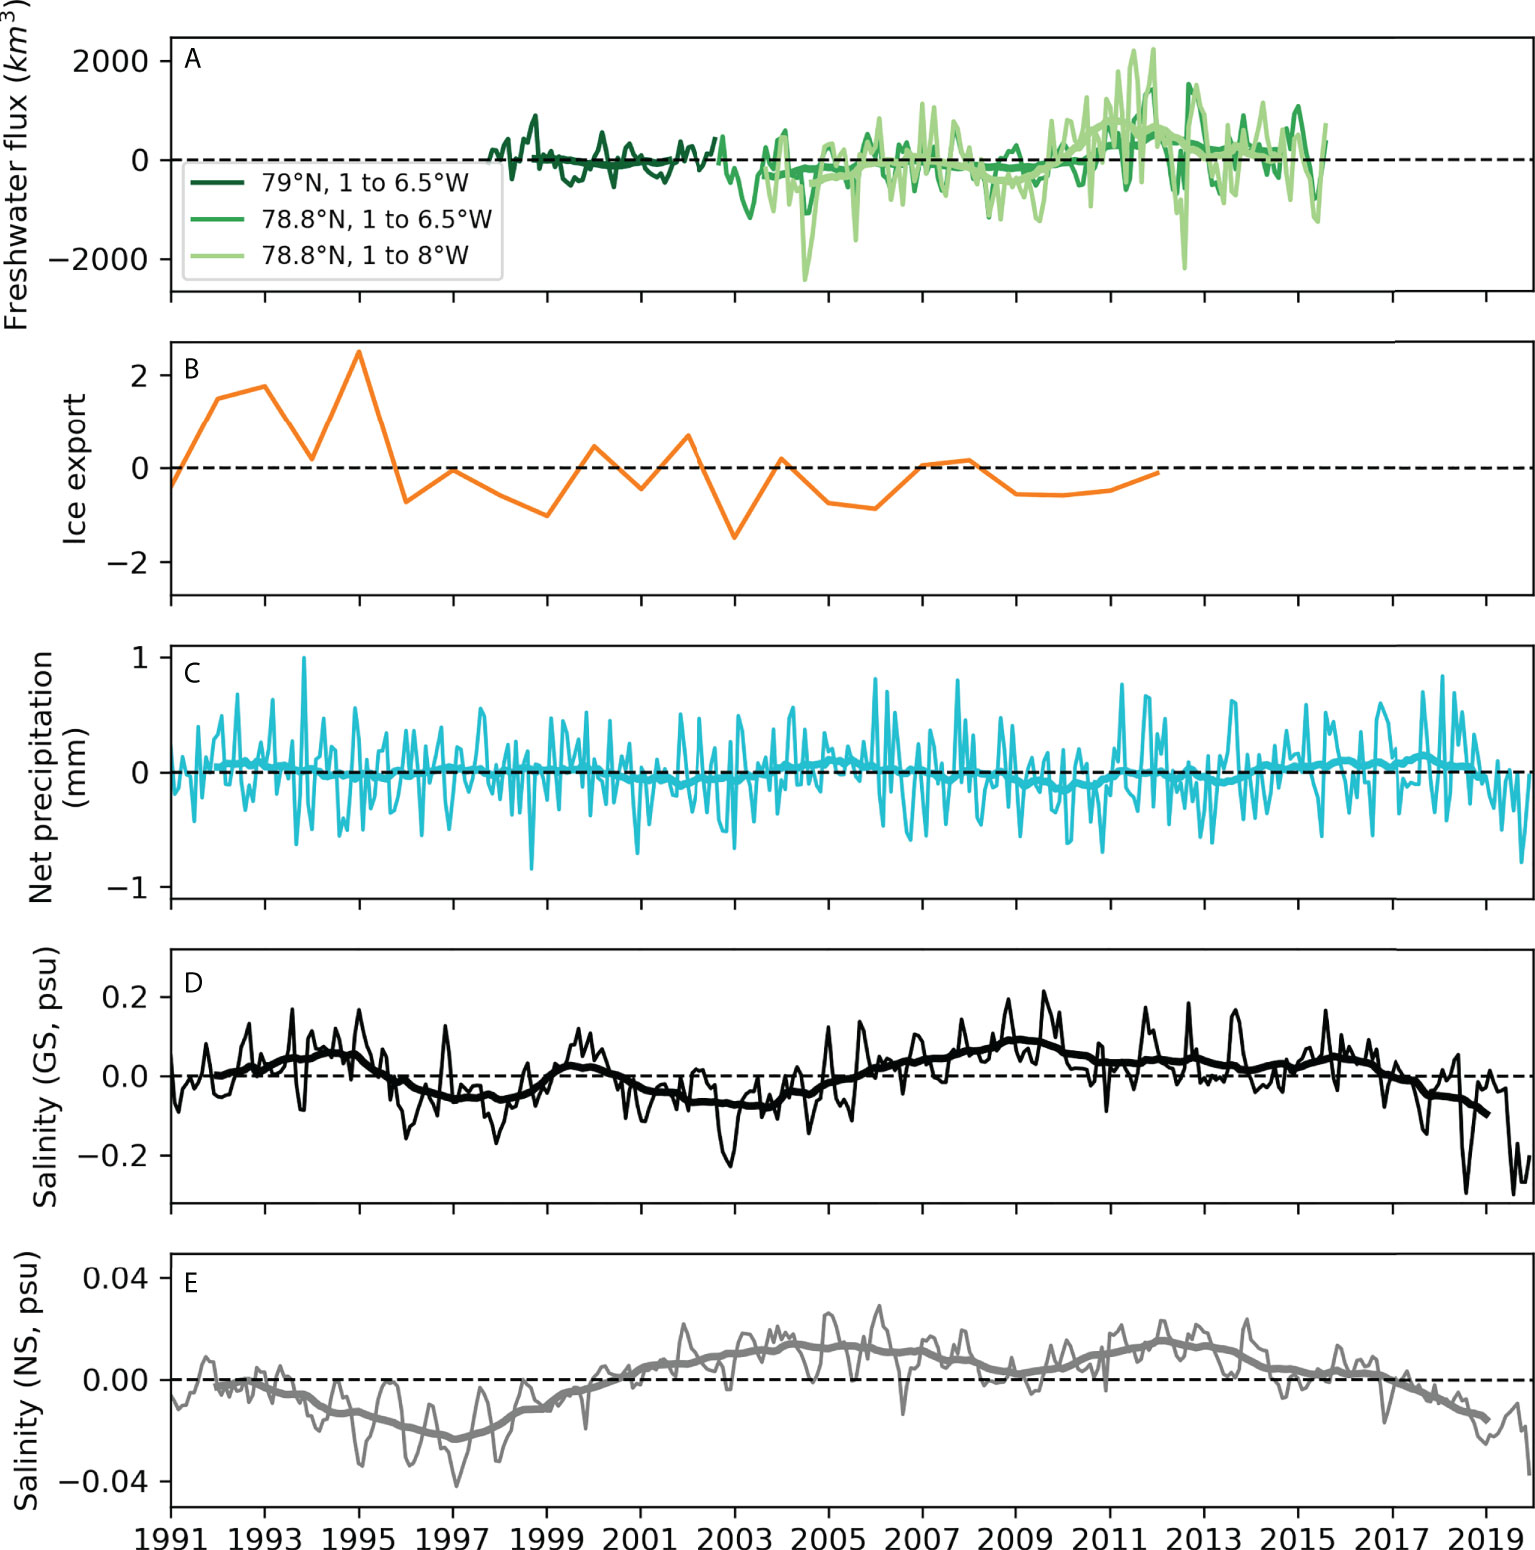
Figure 14 Time series of (A) southward flow of freshwater anomaly at the Fram Strait, (B) annual ice export index at the Fram Strait (78.9°N) during 1991-2012 inferred from Wei et al. (2019), (C) net precipitation anomaly over the Nordic Seas, and near-surface salinity anomalies in (D) the Greenland Sea and (E) the Norwegian Sea during the period of 1991-2019. The bolder lines represent the 25-running mean of each time series.
It is known that the salinity anomaly in the Nordic Seas is largely due to freshwater flux from the Arctic, which is formed by sea ice melt in the Arctic Ocean (Serreze et al., 2006; Peterson et al., 2006; Glessmer et al., 2014). However, in this study, salinity variability in the GS was more related to the intensity of EGC than to the freshness of southward flux from the Arctic. The influence of southward freshwater flux seems to be weakened by mixing with AW around the Fram Strait or may have transported and contributed to the freshening of the North Atlantic by EGC. Meanwhile, despite previous studies reporting that Arctic freshwater content has increased significantly over the last two decades, the increasing trend of freshwater exports in the Fram Strait was not remarkable (Figure 14A). This is because the formation of freshwater in the Arctic Ocean is related to changes in ocean surface stress (e.g., Giles et al., 2012), which is intensified the downwelling of freshwater (Proshutinsky et al., 2009). In other words, the newly formed freshwater in the Arctic Ocean does not directly lead to the southward outflow of freshwater. In addition, recently, it is pointed out that a definition of freshwater is arbitrary and there is no definite physical constraint for a unique reference salinity, so freshwater is not useful for assessment of ocean state and the associated changes (Schauer and Losch, 2019). The reduction in sea ice export through Fram Strait induced by Arctic sea ice decline, which further increases the salinity in the GS, was simulated by Wang et al. (2020). However, there is no significant increase in GS salinity after the ice export decrease in 1996. Sea ice exports are thought to contribute to sea ice extent in GS partially rather than directly affecting salinity. The precipitation can affect seasonally, but it is not considered to be a major source of the interannual variability of the freshwater of the upper GS for the 30-year time scale. This is consistent with previous studies that the local net precipitation accounts for only a fraction of the freshwater balance in the Nordic Seas (Peterson et al., 2006; Selyuzhenok et al., 2020).
4 Discussion
The deep convection occurs within GSG where the deepest and densest mixed layers in the Nordic Seas are found due to strong cyclonic circulation that weakens the stratification (Marshall and Schott, 1999; Brakstad et al., 2019; Huang et al., 2020). Previous studies have shown that mixed layer density and depth were generally dominated by changes in mixed layer salinity (Ronski and Budéus, 2005; Latarius and Quadfasel, 2010). Brakstad et al. (2019) noted that there is a threshold beneath which the fresh surface layer will inhibit convection, regardless of the magnitude of the surface heat loss. The temporal evolution of near-surface salinity in the GSG for summer time (August-October) before convection is shown in Figure 15A. Near-surface salinity within the GSG is formed by several lateral inputs of northward AW, recirculating modified AW, entrained PW from EGC, and vertical response on the upper layer. Therefore, the time series of GSG near-surface salinity did not correspond to any salinity variability in certain surrounding areas. There were two noticeable periods of enhanced near-surface low salinity content. The first one was 1996-1997 when salinity of the AW in the NS was markedly low (Figures 5B, 13). The second one was 2002-2004 when ice extent was lower than other years during the low salinity season (Figure 11B). These fresh surface layer stratifying the upper part of the water column induced the shallow convection in late winter (February–April) of the following years estimated by Brakstad et al. (2019). In 1994-1995, the most saline period, deep mixed layer exceeded 500 m appeared in the following years. The vertical structure of potential density for the fresh year (2003) to the saline surface layer year (1994) is shown Figure 15B. In the central GSG (74-76°N, 5°E-3°W), the potential density was much lower when the surface salinity was lower at less than 100 m depth. The closer to the surface, the difference in salinity between the two periods was larger. Less dense water in the upper layer makes vertical mixing difficult. It should be noted that obtaining a deliciated indicator of deep convection involves more complex processes such as stability between vertical layers, wind stress, and heat flux at the surface layer.
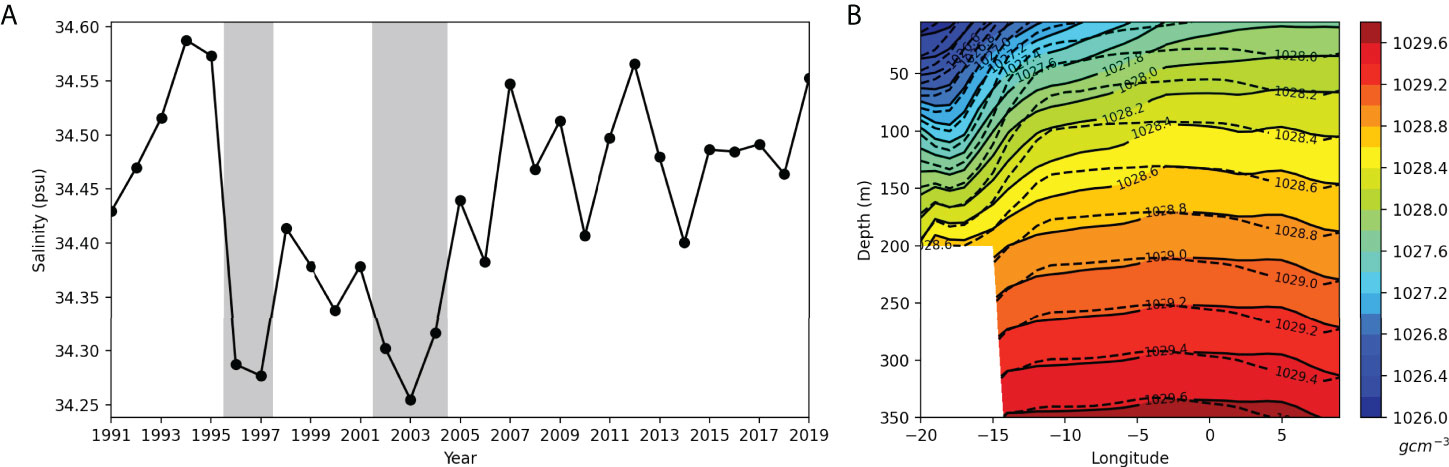
Figure 15 (A) Near-surface salinity within Greenland Sea Gyre (GSG) and (B) cross section of potential density structure between 74-76°N of 1994 (dashed line) and 2003 (solid line). The grey backgrounds denote the two low salinity periods in the GSG.
5 Conclusion remarks
In this study, we investigated the near-surface salinity variability in the Nordic Seas using reanalysis salinity by considering seasonal and interannual time scales associated with environmental parameters. The Nordic Seas are viewed as one of the regions where dense waters sink from the sea surface, forming the AMOC. At the same time, the Nordic Seas are affected by surface freshening factors such as southward freshwater flux and local melting sea ice at higher latitudes, which are potential to affect AMOC. Variability of GS salinity shows distinct seasonal characteristics related to sea ice extent seasonal change. GS is also mainly affected by current advection and change in sea ice extent on a longer time scale. In the NS, the interannual variability is smaller than that of GS and related to the large-atmospheric system of NAO and SPG. Freshwater from land discharge is limited around the coastal area by narrow coastal currents. All analysis so far indicates that there is no long-term trend in the Nordic Seas upper-layer salinity over the last three decades. The salinity within the GSG is affected by significant changes in GS and NS respectively, which is related to the formation of a mixed layer and leads to the condition for deep convection to occur. Changes in surface salinity on the GSG also do not imply a specific tendency in deep convection over the past 30 years.
Many scientists also insist such a shutdown scenario is not likely because the freshwater formed in the Arctic tends to remain within the Arctic Basin rather than outflow to the GS diluting the AW (Aagaard and Carmack, 1989; Intergovernmental Panel on Climate Change, 2019). Nonetheless, there is always the possibility that certain balances in the Arctic environment suddenly change. If there are rapid changes in atmospheric forcing over the high latitude region or the Arctic’s freshwater capacity reaches its limit, much of the freshwater in the Arctic Ocean can suddenly outflow. In conclusion, near-surface salinity in the Nordic Seas has not changed dramatically compared to the concerns of sea ice melt. Rather, various freshening factors related to climate change affect near-surface salinity in the GS and NS respectively, and the appearance of low near-salinity over the GSG by effects from both areas may cause unfavorable conditions for deep convection. This study also emphasized the possibility of using reanalysis data for spatiotemporal analysis as a proxy for near-surface salinity over the Nordic Seas. Further studies should be conducted to understand the linkage processes in detail by adopting other environmental changes including thermohaline structures and air-sea interaction associated with deep convection. The effect of massive land ice discharge on surface salinity relaxation is also worth due consideration. Although the reanalysis salinity data presented reliable ocean state and analysis results, the sparse observational record over the high latitude ocean is still rather short to fully investigate the causes of inter-decal variability in the properties of the Nordic Seas. It is essential to continue monitoring the salinity to assess its role in ongoing and future climate change.
Data availability statement
The original contributions presented in the study are included in the article/supplementary material. Further inquiries can be directed to the corresponding author.
Author contributions
J-EP organized the research, analyzed the datasets, prepared figures, and wrote the manuscript. H-CK contributed project development, ideas, and manuscript reviewing. K-HC develop ideas and revised the manuscript. All authors contributed to the final version of the manuscript.
Funding
This work was supported by the Korea Polar Research Institute (KOPRI) grant funded by the Ministry of Oceans and Fisheries (KOPRI PE22040).
Conflict of interest
The authors declare that the research was conducted in the absence of any commercial or financial relationships that could be construed as a potential conflict of interest.
Publisher’s note
All claims expressed in this article are solely those of the authors and do not necessarily represent those of their affiliated organizations, or those of the publisher, the editors and the reviewers. Any product that may be evaluated in this article, or claim that may be made by its manufacturer, is not guaranteed or endorsed by the publisher.
References
Aagaard K. (1970). Wind-driven transports in the Greenland and Norwegian seas. Deep-Sea Res. 17, 281–291. doi: 10.1016/0011-7471(70)90021-5
Aagaard K., Carmack E. C. (1989). The role of sea ice and other fresh water in the Arctic circulation. J. Geophys. Res. 94, 14485–14498. doi: 10.1029/JC094iC10p14485
Aagaard K., Foldvik A., Hillman R. S. (1987). The West spitsbergen current: Disposition and water mass transformation. J. Geophys. Res. 92 (C4), 3778–3784. doi: 10.1029/JC092iC04p03778
Bashmachnikov I. L., Fedorov A. M., Golubkin P. A., Vesman A. V., Selyuzhenok V. V., Gnatiuk N. V., et al. (2021). Mechanisms of interannual variability of deep convection in the Greenland sea. Deep-Sea Res. Pt. I 174, 103557. doi: 10.1016/j.dsr.2021.103557
Bendtsen J., Mortensen J., Lennert K., Ehn J. K., Boone W., Galindo V., et al. (2017). Sea Ice breakup and marine melt of a retreating tidewater outlet glacier in northeast Greenland (81 n). Sci. Rep. 7 (1), 4941. doi: 10.1038/s41598-017-05089-3
Bersch M. (2002). North Atlantic oscillation-induced changes of the upper layer circulation in the northern north Atlantic ocean. J. Geophys. Res. 107, 3156. doi: 10.1029/2001JC000901
Berx B., Payne M. R. (2017). The Sub-polar gyre index–a community data set for application in fisheries and environment research. Earth Syst. Sci. Data 9 (1), 259–266. doi: 10.5194/essd-9-259-2017
Beszczynska-Möller A., Fahrbach E., Schauer U., Hansen E. (2012). Variability in Atlantic water temperature and transport at the entrance to the Arctic ocean 1997-2010. ICES J. Mar. Sci. 69, 852–863. doi: 10.1093/icesjms/fss056
Brakstad A., Våge K., Håvik L., Moore G. W. K. (2019). Water mass transformation in the Greenland Sea during the period 1986-2016. J. Phys. Oceanogr. 49, 121–140. doi: 10.1175/JPO-D-17-0273.1
Brucker L., Dinnat E. P., Koenig L. S. (2014). Weekly gridded aquarius l-band radiometer/scatterometer observations and salinity retrievals over the polar regions–part 2: Initial product analysis. Cryosphere 8 (3), 915–930. doi: 10.5194/tc-8-915-2014
Chatterjee S., Raj R. P., Bertino L., Mernild S. H., Subeesh M. P., Murukesh N., et al. (2021). Combined influence of oceanic and atmospheric circulations on Greenland sea ice concentration. Cryosphere 15 (3), 1307–1319. doi: 10.5194/tc-15-1307-2021
Chatterjee S., Raj R. P., Bertino L., Skagseth Ø., Ravichandran M., Johannessen O. M. (2018). Role of Greenland Sea gyre circulation on Atlantic water temperature variability in the fram strait. Geophys. Res. Lett. 45 (16), 8399–8406. doi: 10.1029/2018GL079174
Clark P. U., Pisias N. G., Stocker T. F., Weaver A. J. (2002). The role of the thermohaline circulation in abrupt climate change. Nature 415 (6874), 863–869. doi: 10.1038/415863a
Curry R. G., McCartney M. S. (2001). Ocean gyre circulation changes associated with the north Atlantic oscillation. J. Phys. Oceanogr. 31, 3374–3400. doi: 10.1175/1520-0485(2001)031<3374:OGCCAW>2.0.CO;2
de Steur L., Hansen E., Gerdes R., Karcher M., Fahrbach E., Holfort J. (2009). Freshwater fluxes in the East Greenland current: A decade of observations. Geophys. Res. Lett. 36, L23611. doi: 10.1029/2009GL041278
de Steur L., Pickart R. S., Torres D. J., Valdimarsson H. (2015). Recent changes in the freshwater composition east of Greenland. Geophys. Res. Lett. 42 (7), 2326–2332. doi: 10.1002/2014GL062759
Dickson R. R., Osborn T. J., Hurrell J. W., Meincke J., Blindheim J., Aadlandsvik B., et al. (2000). The Arctic ocean response to the north Atlantic oscillation. J. Clim. 13, 2671–2696. doi: 10.1175/1520-0442(2000)013<2671:TAORTT>2.0.CO;2
Dmitrenko I. A., Kirillov S. A., Rudels B., Babb D. G., Pedersen L. T., Rysgaard S., et al. (2017). Arctic Ocean outflow and glacier-ocean interaction modify water over the wandel Sea shelf, northeast Greenland. Ocean Sci. 13, 1045–1060. doi: 10.5194/os-13-1045-2017
Drivdal M., Weber J. E. H., Debernard J. B. (2016). Dispersion relation for continental shelf waves when the shallow shelf part has an arbitrary width: Application to the shelf west of Norway. J. Oceanogr. 46 (2), 537–549. doi: 10.1175/JPO-D-15-0023.1
Dukhovskoy D. S., Johnson M. A., Proshutinsky A. (2004). Arctic Decadal variability: An auto-oscillatory system of heat and fresh water exchange. Geophys. Res. Lett. 31, L03302. doi: 10.1029/2003GL019023
ECCO Consortium, Fukumori I., Wang O., Font I., Forget G., Heimbach P (2021). Synopsis of the ECCO Central Production Global Ocean and Sea-Ice State Estimate (Version 4 Release 4).. doi: 10.5281/zenodo.4533349
Foukal N. P., Gelderloos R., Pickart R. S. (2020). A continuous pathway for fresh water along the East Greenland shelf. Sci. Adv. 6 (43), eabc4254. doi: 10.1126/sciadv.abc4254
Fournier S., Lee T., Wang X., Armitage T. W. K., Wang O., Fukumori I., et al. (2020). Sea Surface salinity as a proxy for Arctic ocean freshwater changes. J. Geophys. Res. Ocean 125 (7), e2020JC016110. doi: 10.1029/2020JC016110
Frankignoul C., Deshayes J., Curry R. (2009). The role of salinity in the decadal variability of the north Atlantic meridional overturning circulation. Clim. Dyn. 33 (6), 777–793. doi: 10.1007/s00382-008-0523-2
Frigstad H., Kaste Ø., Deininger A., Kvalsund K., Christensen G., Bellerby R. G., et al. (2020). Influence of riverine input on Norwegian coastal systems. Front. Mar. Sci. 7, 332. doi: 10.3389/fmars.2020.00332
Furevik T. (2001). Annual and interannual variability of Atlantic water temperatures in the Norwegian and barents seas: 1980–1996. Deep-Sea Res. Pt. I 48, 383–404. doi: 10.1016/S0967-0637(00)00050-9
Furevik T., Nilsen J. E. O (2005). Large-scale atmospheric circulation variability and its impacts on the Nordic Seas ocean climate-a review. Geophys Monog-Am Geophys Union 158, 105–404
Furevik T., Bentsen M., Drange H., Johannessen J. A., Korablev A. (2002). Temporal and spatial variability of the sea surface salinity in the Nordic seas. J. Geophys. Res. Oceans 107 (C12), SRF–S10. doi: 10.1029/2001JC001118
Gascard J.-C., Raisbeck G., Sequeira S., Yiou F., Mork K. A. (2004). The Norwegian Atlantic current in the lofoten basin inferred from hydrological and tracer data (129I) and its interaction with the Norwegian coastal current. Geophys. Res. Lett. 31, L01308. doi: 10.1029/2003GL018303
Giles K. A., Laxon S. W., Ridout A. L., Wingham D. J., Bacon S. (2012). Western Arctic Ocean freshwater storage increased by wind-driven spin-up of the Beaufort gyre. Nat. Geosci. 5 (3), 194–197. doi: 10.1038/ngeo1379
Glessmer M. S., Eldevik T., Våge K., Nilsen J.E.Ø., Behrens E. (2014). Atlantic Origin of observed and modelled freshwater anomalies in the Nordic seas. Nat. Geosci. 7, 801–805. doi: 10.1038/ngeo2259
Häkkinen S., Rhines P. B. (2004). Decline of subpolar north Atlantic circulation during the 1990s. Sci. 304 (5670), 555–559. doi: 10.1029/2008jc004883
Häkkinen S., Rhines P. B., Worthen D. L. (2011). Atmospheric blocking and Atlantic multidecadal ocean variability. Sci 334, 655–659. doi: 10.1126/science.1205683
Halloran P. R., Hall I. R., Menary M., Reynolds D. J., Scourse J. D., Screen J. A., et al. (2020). Natural drivers of multidecadal Arctic sea ice variability over the last millennium. Sci. Rep. 10, 688. doi: 10.1038/s41598-020-57472-2
Hall S. B., Subrahmanyam B., Nyadjro E. S., Samuelsen A. (2021). Surface freshwater fluxes in the Arctic and subarctic seas during contrasting years of high and low summer Sea ice extent. Remote Sens. 13, 1570. doi: 10.3390/rs13081570
Hansen M. W., Johannessen J. A., Dagestad K. F., Collard F., Chapron B. (2011). Monitoring the surface inflow of Atlantic water to the Norwegian Sea using envisat ASAR. J. Geophys. Res. 116, C12008. doi: 10.1029/2011JC007375
Hátún H., Sandø A. B., Drange H., Hansen B., Valdimarsson H. (2005). Influence of the Atlantic subpolar gyre on the thermohaline circulation. Sci 309, 1841–1844. doi: 10.1126/science.1114777
Holliday N. P., Bersch M., Berx B., Chafik L., Cunningham S., Florindo-López C., et al. (2020). Ocean circulation causes the largest freshening event for 120 years in eastern subpolar north Atlantic. Nat. Commun. 11 (1), 1–15. doi: 10.1038/s41467-020-14474-y
Holliday N. P., Hughes S. L., Bacon S., Beszczynska-Möller A., Hansen B., Lavín A., et al. (2008). Reversal of the 1960s to 1990s freshening trend in the northeast north Atlantic and Nordic seas. Geophys. Res. Lett. 35, L03614. doi: 10.1029/2007GL032675
Holliday N. P., Meyer A., Bacon S., Alderson S. G., de Cuevas B. (2007). Retroflection of part of the East Greenland current at cape farewell. Geophys. Res. Lett. 34, L07609. doi: 10.1029/2006GL029085
Huang J., Pickart R. S., Huang R. X., Lin P., Brakstad A., Xu F.. (2020). Sources and upstream pathways of the densest overflow water in the Nordic seas. Nat. Commun. 11, 5389. doi: 10.1038/s41467-020-19050-y
IPCC (2013). Climate change 2013 - the physical science basis. contribution of working group I to the fourth assessment report of the intergovernmental panel on climate change (Cambridge, United Kingdom and New York: Cambridge University Press), 1250.
IPCC (2019). Summary for policymakers. climate change and land: an IPCC special report on climate change, desertification, land degradation, sustainable land management, food security, and greenhouse gas fluxes in terrestrial ecosystems (Geneva, Switzerland: The Intergovernmental Panel on Climate Change (IPCC).
Jeansson E., Olsen A., Jutterström S. (2017). Arctic Intermediate water in the Nordic seas 1991–2009. Deep-Sea Res. Pt. I 128, 82–97. doi: 10.1016/j.dsr.2017.08.013
Jones E. P., Anderson L. G., Jutterström S., Swift J. H. (2008). Sources and distribution of fresh water in the East Greenland current. Prog. Oceanogr. 78, 37–44. doi: 10.1016/j.pocean.2007.06.003
Kelly K. (1988). Comments on “Empirical orthogonal function analysis of advanced very high resolution radiometer surface temperature patterns in Santa Barbara channel” by G.S.E. lagerloef and R.L. Bernstein. J. Geophys. Res. 93, 15753–15754. doi: 10.1029/JC093iC12p15753
Kenigson J. S., Timmermans M. L. (2021). Nordic Seas hydrography in the context of Arctic and north Atlantic ocean dynamics. J. Phys. Oceanogr. 51 (1), 101–114. doi: 10.1175/JPO-D-20-0071.1
Klein L., Swift C. (1977). An improved model for the dielectric constant of sea water at microwave frequencies. IEEE Trans. Antennas. Propag. 25 (1), 104–111. doi: 10.1109/TAP.1977.1141539
Korablev A., Smirnov A., Baranova O. K. (2014). Climatological atlas of the Nordic seas and northern north Atlantic. Eds. Seidov D., Parsons A. R. (NOAA Atlas NESDIS) 77, 122. doi: 10.7289/V54B2Z78
Koul V., Tesdal J.-E., Bersch M., Hátún H., Brune S., Borchert L., et al. (2020). Unraveling the choice of the north Atlantic subpolar gyre index. Sci. Rep. 10, 1005. doi: 10.1038/s41598-020-57790-5
Kristiansen T., Aas E. (2015). Water type quantification in the skagerrak, the kattegat and off the Jutland west coast. Oceanologia 57 (2), 177–195. doi: 10.1016/j.oceano.2014.11.002
Lagerloef G. S., Bernstein R. L. (1988). Empirical orthogonal function analysis of advanced very high resolution radiometer surface temperature patterns in Santa Barbara channel. J. Geophys. Res. Oceans 93 (C6), 6863–6873. doi: 10.1029/JC093iC06p06863
Langehaug H. R., Falck E. (2012). Changes in the properties and distribution of the intermediate and deep waters in the fram strait. Prog. Oceanogr. 96, 57–76. doi: 10.1016/j.pocean.2011.10.002
Lang R., Zhou Y., Utku C., Le Vine D. (2016). Accurate measurements of the dielectric constant of seawater at l band. Radio Sci. 51 (1), 2–24. doi: 10.1002/2015RS005776
Latarius K., Quadfasel D. (2010). Seasonal to inter-annual variability of temperature and salinity in the Greenland Sea gyre: Heat and freshwater budgets. Tellus 62A, 497–515. doi: 10.1111/j.1600-0870.2009.00453.x
Latarius K., Quadfasel D. (2016). Water mass transformation in the deep basins of the Nordic seas: Analyses of heat and freshwater budgets. Deep-Sea Res. Pt. I 114, 23–42. doi: 10.1016/j.dsr.2016.04.012
Lauvset S. K., Brakstad A., Våge K., Olsen A., Jeansson E., and Mork K. A, et al (2018). Continued warming, salinification and oxygenation of the Greenland Sea gyre. Tellus A: Dyn. Meteorol. and Oceanogr 70 (1), 1–9. doi: 10.1080/16000870.2018.1476434
Legutke S. (1991). A numerical investigation of the circulation in the Greenland and Norwegian seas. J. Phys. Oceanogr. 21 (1), 118–148. doi: 10.1175/1520-0485(1991)021<0118:ANIOTC>2.0.CO;2
Levermann A., Born A. (2007). Bistability of the Atlantic subpolar gyre in a coarse-resolution climate model. Geophys. Res. Lett. 34 (24), L24605. doi: 10.1029/2007GL031732
Lien V. S., Hjøllo S. S., Skogen M. D., Svendsen E., Wehde H., Bertino L., et al. (2016). An assessment of the added value from data assimilation on modelled Nordic seas hydrography and ocean transports. Ocean Model. 99, 43–59. doi: 10.1016/j.ocemod.2015.12.010
Lien V. S., Vikebø F. B., Skagseth Ø. (2013). One mechanism contributing to co-variability of the Atlantic inflow branches to the Arctic. Nat. Commun. 4, 1488. doi: 10.1038/ncomms2505
Lin P., Pickart R. S., Torres D. J., Pacini A. (2018). Evolution of the freshwater coastal current at the southern tip of Greenland. J. Phys. Oceanogr. 48 (9), 2127–2140. doi: 10.1175/JPO-D-18-0035.1
Liu Q., Babanin A. V., Zieger S., Young I. R., Guan C. (2016). Wind and wave climate in the Arctic ocean as observed by altimeters. J. Clim. 29 (22), 7957–7975. doi: 10.1175/JCLI-D-16-0219.1
Li H., Xu F., Zhou W., Wang D., Wright J. S., Liu Z., et al. (2017). Development of a global gridded argo data set with Barnes successive corrections. J. Geophys. Res. Oceans 122 (2), 866–889. doi: 10.1002/2016JC012285
Marshall J., Schott F. (1999). Open-ocean convection: Observations, theory, and models. Rev. Geophys. 37, 1–64. doi: 10.1029/98RG02739
Meissner T., Wentz F. J., Manaster A., Lindsley R. (2019). Remote sensing systems SMAP ocean surface salinities level 3 monthly, version 4.0 validated release. (Santa Rosa, CA, USA: Remote Sensing System). Available at: www.remss.com/missions/smap. doi: 10.5067/SMP40-3SMCS
Mork K. A., Skagseth Ø., Ivshin V., Ozhigin V., Hughes S. L., Valdimarsson H.. (2014). Advective and atmospheric forced changes in heat and fresh water content in the Norwegian Sea 1951-2010. Geophys. Res. Lett. 41, 6221–6228. doi: 10.1002/2014gl061038
Muilwijk M., Ilicak M., Cornish S. B., Danilov S., Gelderloos R., Gerdes R., et al. (2019). Arctic Ocean response to Greenland Sea wind anomalies in a suite of model simulations. J. Geophys. Res. Oceans 124 (8), 6286–6322. doi: 10.1029/2019JC015101
Muilwijk M., Smedsrud L. H., Ilicak M., Drange H. (2018). Atlantic Water heat transport variability in the 20th century Arctic ocean from a global ocean model and observations. J. Geophys. Res. Oceans 123, 8159–8179. doi: 10.1029/2018JC014327
Nichols R. E., Subrahmanyam B. (2019). Estimation of surface freshwater fluxes in the Arctic ocean using satellite-derived salinity. Remote Sens. Earth. Syst. Sci. 2, 2. doi: 10.1007/s41976-019-00027-5
Orvik K. A., Niiler P. (2002). Major pathways of Atlantic water in the northern north Atlantic and Nordic seas toward Arctic. Geophys. Res. Lett. 29 (19), 1896. doi: 10.1029/2002GL015002
Orvik K. A., Skagseth O., Mork M. (2001). Atlantic Inflow to the Nordic seas: Current structure and volume fluxes from moored current meters, VM-ADCP and SeaSoar-CTD observations 1995-1999. Deep-Sea Res. Pt. I 48 (4), 937–957. doi: 10.1016/S0967-0637(00)00038-8
Pérez-Hernández M. D., Pickart R. S., Torres D. J., Bahr F., Sundfjord A., Ingvaldsen R., et al. (2019). Structure, transport, and seasonality of the Atlantic water boundary current north of Svalbard: Results from a yearlong mooring array. J. Geophys. Res. Oceans 124, 1679–1698. doi: 10.1029/2018JC014759
Perner K., Moros M., Otterå O. H., Blanz T., Schneider R.R., Jansen E, et al. (2019). An oceanic perspective on Greenland’s recent freshwater discharge since 1850. Sci. Rep. 9 (1), 17680. doi: 10.1038/s41598-019-53723-z
Peterson B. J., McClelland J., Curry R., Holmes R. M., Walsh J. E., Aagaard K. (2006). Trajectory shifts in the Arctic and subarctic freshwater cycle. Sci. 313, 1061–1066. doi: 10.1126/science.1122593
Pickart R. S., Torres D. J., Fratantoni P. S. (2005). The East Greenland spill jet. J. Phys. Oceanogr. 35, 1037–1053. doi: 10.1175/JPO2734.1
Proshutinsky A., Dukhovskoy D., Timmermans M.-L., Krishfield R., Bamber J. L. (2015). Arctic Circulation regimes. Philos. Trans. R. Soc 373A, 20140160. doi: 10.1098/rsta.2014.0160
Proshutinsky A., Krishfield R., Timmermans M.-L., Toole J., Carmack E., McLaughlin F., et al. (2009). Beaufort Gyre freshwater reservoir: State and variability from observations. J. Geophys. Res. 114, C00A10. doi: 10.1029/2008JC005104
Raj R. P., Chatterjee S., Bertino L., Turiel A., Portabella M. (2019). The Arctic front and its variability in the Norwegian Sea. Ocean Sci. 15, 1729–1744. doi: 10.5194/os-15-1729-2019
Ronski S., Budéus G. (2005). Time series of winter convection in the Greenland Sea. J. Geophys. Res. 110, C04015. doi: 10.1029/2004JC002318
Rudels B. (2012). Arctic Ocean circulation and variability - advection and external forcing encounter constraints and local processes. Ocean Sci. 8 (2), 261–286. doi: 10.5194/os-8-261-2012
Rudels B., Björk G., Nilsson J., Winsor P., Lake I., Nohr C. (2005). The interaction between waters from the Arctic ocean and the Nordic seas north of fram strait and along the East Greenland current: Results from the Arctic ocean-02 oden expedition. J. Mar. Syst. 55, 1–30. doi: 10.1016/j.jmarsys.2004.06.008
Rudels B., Fahrbach E., Meincke J., Budéus G., Eriksson P. (2002). The East Greenland current and its contribution to the Denmark strait overflow. ICES J. Mar. Sci. 59, 1133–1154. doi: 10.1006/jmsc.2002.1284
Sakov P., Counillon F., Bertino L., Lisæter K. A., Oke P. R., Korablev A. (2012). TOPAZ4: An ocean-sea ice data assimilation system for the north Atlantic and Arctic. Ocean Sci. 8 (4), 633–656. doi: 10.5194/os-8-633-2012
Sarafanov A. (2009). On the effect of the north Atlantic oscillation on temperature and salinity of the subpolar north Atlantic intermediate and deep waters. ICES J. Mar. Sci. 66 (7), 1448–1454. doi: 10.1093/icesjms/fsp094
Schauer U., Losch M. (2019). “Freshwater” in the ocean is not a useful parameter in climate research. J. Phys. Oceanogr. 49 (9), 2309–2321. doi: 10.1175/JPO-D-19-0102.1
Selyuzhenok V., Bashmachnikov I., Ricker R., Vesman A., Bobylev L. (2020). Sea Ice volume variability and water temperature in the Greenland Sea. Cryosphere 14, 477–495. doi: 10.5194/tc-14-477-2020
Serreze M. C., Barrett A. P., Slater A. G., Woodgate R. A., Aagaard K., Lammers R. B., et al. (2006). The large-scale freshwater cycle of the Arctic. Geophys. Res.-Ocean. 111, C11010. doi: 10.1029/2005JC003424
Shepherd A., Ivins E. R., Geruo A., Barletta V. R., Bentley M. J., Bettadpur S., et al. (2012). A reconciled estimate of ice-sheet mass balance. Sci 338 (6111), 1183–1189. doi: 10.1126/science.1228102
Skagseth O., Mork K. A. (2012). Heat content in the Norwegian Sea 1995-2010. ICES J. Mar. Sci. 69, 826–832. doi: 10.1093/icesjms/fss026
Stommel H. (1958). The abyssal circulation. Deep-Sea Res. 5, 80–82. doi: 10.1016/S0146-6291(58)80014-4
Taylor A. H., Stephens J. A (1980). Seasonal and year-to-year variations in surface salinity at the 9 north-atlantic ocean weather stations. Oceanologica Acta. 3 (4), 421–30
Thomson R. E., Emery W. J. (2014). Data analysis methods in physical oceanography. Newnes. doi: 10.1016/C2010-0-66362-0
Wadhams P., Budéus G., Wilkinson J., Løyning T., Pavlov V. (2004). The multi-year development of long-lived convective chimneys in the Greenland Sea. Geophys. Res. Lett. 31, L06306. doi: 10.1029/2003GL019017
Wang Q., Wekerle C., Wang X., Danilov S., Koldunov N., Sein D., et al. (2020). Intensification of the Atlantic water supply to the Arctic ocean through fram strait induced by Arctic sea ice decline (e2019GL086682: Geophys. Res. Lett. 47(3).
Wei J., Zhang X., Wang Z. (2019). Reexamination of fram strait sea ice export and its role in recently accelerated Arctic sea ice retreat. Clim. Dyn. 53 (3), 1823–1841. doi: 10.1007/s00382-019-04741-0
Wekerle C., Wang Q., Danilov S., Schourup-Kristensen V., von Appen W.-J., Jung T. (2017). Atlantic Water in the Nordic seas: Locally eddy-permitting ocean simulation in a global setup. J. Geophys. Res. Oceans 122, 914–940. doi: 10.1002/2016JC012121
Xie J., Bertino L., Counillon F., Lisæter K. A., Sakov P. (2017). Quality assessment of the TOPAZ4 reanalysis in the Arctic over the period 1991–2013. Ocean Sci. 13 (1), 123–144. doi: 10.5194/os-13-123-2017
Xie J., Raj R. P., Bertino L., Samuelsen A., Wakamatsu T. (2019). Evaluation of Arctic ocean surface salinities from the soil moisture and ocean salinity (SMOS) mission against a regional reanalysis and in situ data. Ocean Sci. 15, 1191–1206. doi: 10.5194/os-15-1191-2019
Keywords: near-surface salinity, the Nordic Seas, surface freshening, reanalysis data, deep convection, climate change
Citation: Park J-E, Kim H-C and Cho K-H (2022) Variability of Near-Surface Salinity in the Nordic Seas Over the Past Three Decades (1991-2019). Front. Mar. Sci. 9:969159. doi: 10.3389/fmars.2022.969159
Received: 14 June 2022; Accepted: 09 August 2022;
Published: 14 September 2022.
Edited by:
Laurent Bertino, Nansen Environmental and Remote Sensing Center, NorwayReviewed by:
Awnesh Singh, University of the South Pacific, FijiJiping Xie, Nansen Environmental and Remote Sensing Center, Norway
Copyright © 2022 Park, Kim and Cho. This is an open-access article distributed under the terms of the Creative Commons Attribution License (CC BY). The use, distribution or reproduction in other forums is permitted, provided the original author(s) and the copyright owner(s) are credited and that the original publication in this journal is cited, in accordance with accepted academic practice. No use, distribution or reproduction is permitted which does not comply with these terms.
*Correspondence: Hyun-Cheol Kim, a2ltaGNAa29wcmkucmUua3I=