- DataSc/ense TechnoCoRe, Technological Institute of the Philippines, Quezon City, Philippines
Mangrove restoration in the coastal zones is a concept proposed by environmental conservationists. Among the cited advantages of mangrove restoration are providing socio-economic services and coastal protection. Aware of these advantages, countries in Southeast Asia, such as the Philippines, have been implementing government- or civilian-backed restoration efforts. However, will current practices of restoration lead to the intended results? Also, are claims of coastal protection effects realistic? These two questions underscore the challenges posed by the long gap between the present intervention and future impact. Field evidence of protection may emerge from existing sites, the circumstances of which may not be easily portable onto other sites. This study examines the mangrove restoration practices in the Philippines and proposes the restoration index as a short-term prospective estimate of the future success of the restoration effort. This study also assesses the coastal protection potential of mangroves by examining the “bio-shielding” effect against storm surges driven by category-5 winds. Two coastal sites—Tacloban, Leyte, and Pan de Azucar, Iloilo—in the Philippines along the track of a category-5 storm, were considered. The restoration index was calculated based on the characteristics of Rhizophora mangroves commonly used in restoration programs. The coastal inundation model examined the extent of inland flooding due to storm surges by comparing an actual and hypothetical mangrove scenario for each site. A reasonable value of tree density obtained from the restoration simulations was estimated to determine if and to what degree, do mangroves in both sites offer coastal protection. For Tacloban, the actual mangroves are limited in scope, while the hypothetical scenario assumed a mangrove greenbelt fringing the city’s eastern periphery. For Pan de Azucar, the existing mangroves are dense at the southwestern tip of the island, whereas in the hypothetical scenario, these mangroves are absent. The results, reinforced with a household survey, indicated a positive economic value of mangrove restoration for coastal protection. The restoration index and coastal inundation simulations are prospective tools that will guide the Philippines and Southeast Asia, in general, in formulating impactful mangrove restoration programs.
Introduction
Mangroves provide several socio-ecological and ecosystem goods and services such as timber and fisheries production, nutrient regulation, and shoreline protection [see a review by Lee et al. (2014)]. Unfortunately, mangroves are being lost worldwide at an alarming rate of 1% per year due to various natural and anthropogenic causes (FAO, 2007). In the Philippines, the total mangrove forest cover decreased by 51.8% between 1918 and 2010. Notably, an annual loss rate of 0.52% between 1990 and 2010 was mainly attributed to aquaculture development (Long et al., 2014). The depletion of mangroves may result in the reduction of ecosystem functionality and may increase the vulnerability of inhabited coastal plains to natural disasters such as storm surges (Duke et al., 2007).
In November 2013, Super Typhoon Haiyan ravaged the Eastern Visayas region in Central Philippines. At category 5 on the Saffir-Simpson hurricane scale, it is easily one if not the strongest in historical records that ever made landfall (Zhang, 2013; Holden and Marshall, 2018). In the quest for solutions to mitigate future coastal disasters, the protective capacity of mangroves along coastal fringes is being considered (Schmitt et al., 2013; Temmerman et al., 2013). Mangroves are known to attenuate waves such as storm surges by as much as 75% through its vast underground root networks and high structural complexity. However, this protective capacity is only viable if mangroves are dense across a vast area relative to the shoreline (McIvor et al., 2012). Coastal communities may thus benefit from mangrove restoration by enhanced protection against storm surge. Indeed, mangrove restoration provides many potential advantages to coastal communities, but assessing its long-term success, especially for coastal protection, has remained an open question.
The term “restoration” here is taken to denote an active, human-led effort to put a system back to a pre-existing condition claimed through historical evidence. But the efforts are done nevertheless whether or not the claimed past conditions were pristine (Lewis III, 2005). Stretches of Philippine coast were evidently populated by mangroves before urbanization accelerated, and before vast land conversions for profitable aquaculture ventures were made (Primavera and Esteban, 2008). However, quantitative evidence of mangrove restoration success is currently lacking because of weak support for the proposed rehabilitation programs, leading to only a few samples to consider. The dearth in support stems mainly from two sources of uncertainty. First, mangrove restoration has been characteristically open-ended, implying unpredictable outcomes (Kamali and Hashim, 2011). Second, success has not been measurable in the short term. Support, especially from the government, has required concrete assurance for returns on investment. Thus, a simulation study can be the only scientifically backed option to evaluate the prospective success of mangrove restoration. The state of ecological modeling of mangroves has improved quite substantially in the last two decades. Various models describing the biophysical characteristics of mangroves and their abiotic interactions have been proposed and validated. However, a focused study to assess restoration scenarios through a synthesis of mangrove simulation tools and link its results to coastal protection is yet to take root.
Real-time environment forecasting models have become possible because of enhancements in computational technology and improvements in numerical models. For example, the substantial increase in the accuracy of weather forecasting draws from the improvement in weather models supplemented by advanced satellite sensing equipment. With a mangrove-growth model (Salmo and Juanico, 2015), the current study assessed the mechanistic feasibility of mangroves for coastal protection, particularly against storm surge. The extent of damage by Haiyan in November 2013 heightened the scientific interest in coastal protection (Zhang, 2013).
Linking the efforts of mangrove restoration and coastal protection is uncommon in the literature to date. Either studies deal exclusively with evidence of the benefits of mangrove restoration (Temmerman et al., 2013; Su et al., 2021), or analyze directly the bio-shielding effect of mangroves using simulations (Zhang et al., 2012; Kamil et al., 2021) and field-based extrapolations (Delfino et al., 2015). A study that makes a more definite connection between the two has yet to be reported. The present study attempts to fill this gap with prospective simulations.
The study’s first objective is to assess whether existing restoration practices can achieve dense mangroves, which are expected to maximize the degree of coastal protection. The study’s second objective is to evaluate if the presence of reasonably dense coastal mangroves indeed provides bio-shield protection benefits. Addressing both objectives will clarify if mangrove restoration offers coastal protection, justifying public and private support for restoration efforts. The issue is especially relevant for the Philippines and Southeast Asia, where mangrove biodiversity is experiencing the most prominent loss rate and where vulnerability to extreme weather disturbances, such as storm surges, is significant.
Methodology
The prospective simulation study consists of two parts, namely, the mangrove restoration process and coastal bio-shield effect of mangroves. The first part is focused on projecting realistically the development of a restored Rhizophora plantation. The uncertainty of the model is accounted for by injecting stochastic population dynamics in the forward projections. The second part is focused on addressing whether or not a fully developed coastal Rhizophora plantation (dominated by mature trees) can exert protection against the inundation damage of a storm surge driven by category-5 winds.
Numerical growth model
The mathematical growth model elaborated by Salmo and Juanico (2015) considered the following species-specific factors: α for the biological growth parameter, β for the biological leaf area index, the Malthusian growth rate Ω , and maximum diameter at breast height (DBH) Dmax . This model is implemented numerically with Equation (1) by setting Δt equal to one day with the factors: Dt∈ℝ for the plant’s DBH at time t with Dt∈[0.5,15) cm and Ω,α,β,Dmax∈ℝ with α≠−2 . The functions σ(x,y) , η(x,y) , and Kt(x,y) represent the stressor responses to salinity, inundation, and time-dependent competition, respectively. The input (x,y) is the location of the plant within an area of size L×L . The types of landscapes and stressors associated with this area are described in the next section.
The equation is based on the Malthusian (exponential) growth model and modulated by the stressor responses. The landscape for the σ , η , and the K competition field was changed.
Geometry
Figure 1A illustrates the landscape being modeled with slope parameter sl=0.52 , while Figure 1B displays the corresponding inundation stress field of this landscape patch. The landscape was a L×L patch with the diagonal representing the coastline. By default, this diagonal is the mean sea level (MSL). Both the functions σ(x,y) and η(x,y) have the input parameter sl for the slope of the terrain. The slope describes the reach of the mean high tide (MHT). For this setup, the MHT can reach approximately halfway inland as shown by the orange dashes in Figure 1A. Since none of the trees present are within reach of the MHT, the corresponding inundation stress at their location is effectively zero, as indicated in Figure 1B. Consider a landscape with sl=0 as illustrated in Figure 1C where the MHT reaches the left corner of the patch at (0,0) , while Figure 1D shows the inundation stress field as an increasing linear function starting with a value of 0 from the origin (0,0) to 0.5 at the MSL line (diagonal). For this case, the whole patch is submerged during high tide.
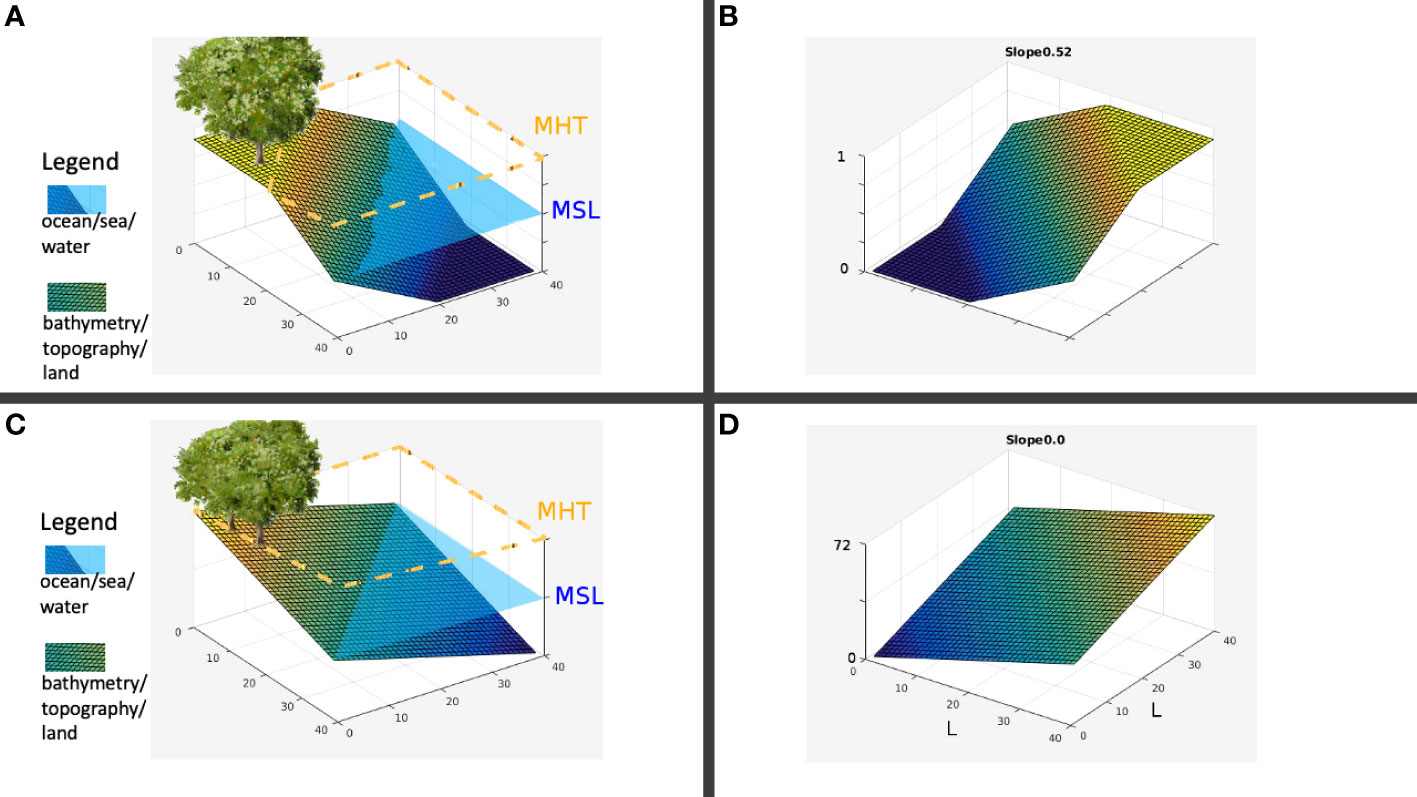
Figure 1 (A) Sample actual landscape; (B) Spatial value for inundation; (C) Slope, sl=0.01 landscape; (D) Inundation values.
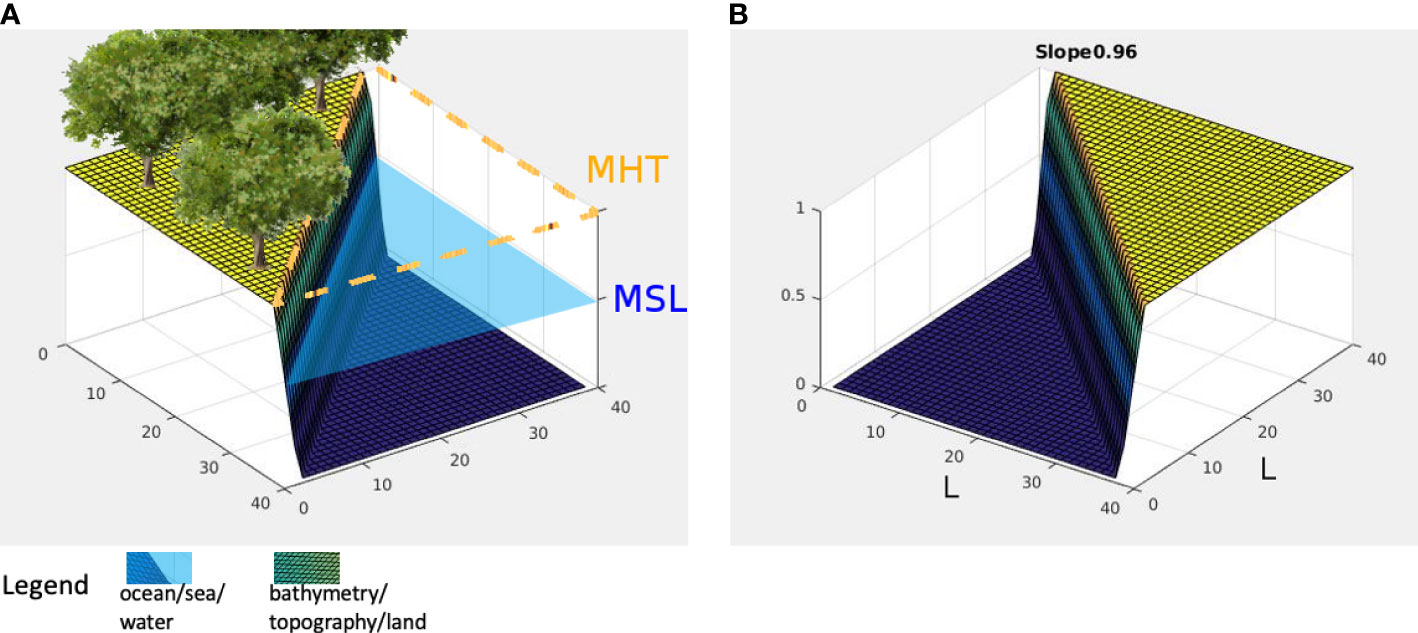
Figures 2A, B elaborate further what sl=0 means in terms of inclination. Let L=40.0 meters, then side b=28.3 meters. If the difference between the MSL and MHT is 1 meter, then the inclination of the landscape, which is the angle between c and b in Figure 2B is about 2.05 degrees. Hence, the landscape modeled by sl=0 has the terrain underwater by a depth of 1 meter at the coordinate (40,40) . Consider the case represented by Figures 2C, D. If d=14.1 such that the MHT reaches halfway inland, then the inclination is 4.05 degrees. A case where the MHT fails to penetrate inland is instantiated by Figure 3, resembling a coastal cliff with slope value sl≈1 .
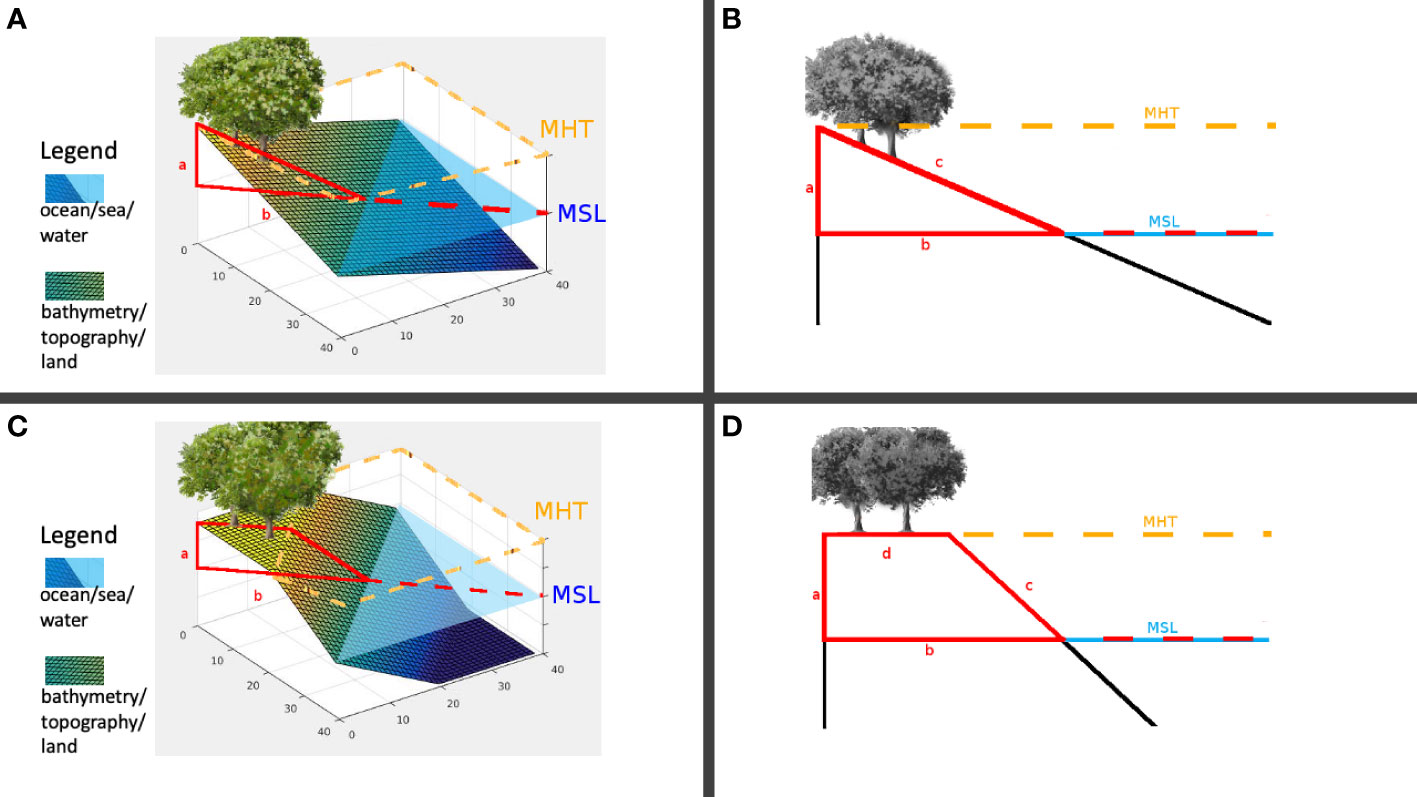
Figure 2 (A) Landscape patch, sl=0 ; (B) Inclination, sl=0 ; (C) Landscape patch, sl=0.5 ; (D) Inclination, sl=0.5 .
Stressors
The models of the salinity field S(x,y) and inundation field I(x,y) are embedded on the landscape. Stressor fields (Supplementary Material) are treated as piecewise functions of the slope parameter sl . The salinity field consists of values between 0 and 72. This field then influences the salinity response according to the following:
For a given slope, a plant located at (x,y) will encounter inundation stress according to another piecewise model. The inundation response is determined by the following:
For the individual plant competition (Supplementary Material), the model used was the FON approach, which sums up the single field intensities of neighboring trees into an aggregate field strength F(x,y) (Berger and Hildenbrandt, 2000). In FON, it is assumed that individual growth is impossible if the quantity referred as “strength of neighborhood” FA exceeds 0.5. Therefore, the growth of the plant is stopped when FA>0.5 , i.e., when the function C(FA)=1−2FA is less than zero.
Stochastic population dynamics
The change in the number of individual plants at different life stages is described by a stochastic compartmental model (Supplementary Material). The demographic events consist of recruitment, mortality (Schaal and Leverich, 1982) and growth (Fulton, 1993), which may be expressed as state-transition equations.
• Recruitment:
• Seedling death:
• Sapling death:
• Tree death:
• Seedling to sapling growth:
• Sapling to tree growth:
The growth rates gseed and gsap of seedling and sapling, respectively, can be estimated by the DBH growth rate across the defined size at the transition: 2.5 cm and 5.0 cm. In this manner, the practical measurement of the growth rates can be made from field surveys.
The state-transition equations are implemented with a stochastic simulation algorithm formulated by Gillespie (1976). Recruitment was established as seeds take root outside the crown of any existing tree. The dispersal rate multiplied by the time for the next event gives the maximum distance a seed can travel from the parent tree (given that seeds float in seawater).
Restoration index
With linear stability analysis (Supplementary Material), the average, long-term dynamical behavior of the stochastic model can be described with the expansion method by Van Kampen (1992). From this average (sometimes referred as “mean-field”) dynamics, a system of ordinary differential equations can be examined further for its bifurcation properties. A dimensionless parameter ξ , reminiscent of the basic reproduction number in epidemic models, can be derived from the transition rates of the stochastic model. The result is the following index:
By determining the value of the transition rates over one or two years from a trial plantation in a particular site, then ξ could be estimated. The restoration index (Equation 4) has a critical value equal to one, which is the value that separates the average, long-term behavior of the model into two: (1) endemic equilibrium if ξ>1; and (2) extinction equilibrium if ξ<1. The endemic equilibrium is the state described by the survival of the plant population long after it was established. The extinction equilibrium is the opposite state in which the population died out eventually. The endemic equilibrium is the preferred outcome of restoration.
Sensitivity analysis
The sensitivity analysis aims to get a good measure of how a time series diverges given an elementary effect. Particularly, the sensitivity of the following outcomes were analyzed:
● Population after 25 years
● Maximum population achieved
● Time when the maximum population was achieved
● Time of first tree appearance
The behavior of the stochastic model can be affected by the numerical value of the factors given in Equation 1 (namely, α, β, Ω ) and the slope sl , which are implicit in Equation 2 and 3. Although considered as constants, Ui and ds in Equation 3 are likewise included in the sensitivity analysis. The ranges of the parameter values are:
● α ∈ [0.80,1.20] for the species-specific growth parameter
● β ∈ [1.50,2.50] for the leaf area index
● Ω ∈ [0.01,0.25] for the Malthusian growth rate
● Sl ∈ [0.1] for the slope parameter (hereinafter, designated as “slope”)
● Ui ∈ [0,100] for the trigger of the salinity stressor
● ds [-0.75,0.25] for the effects on the salinity gradient (hereinafter, designated as “dsalt”)
The above sample ranges were restricted to values within reasonable exploration. For example, Ω>0.25 would model mangroves capable of maturing to tree status in less than three months. Using the framework of elementary effects analysis (Supplementary Material), the partial difference with respect to a single factor of the model must be averaged (Morris, 1991). This averaging yields an effect with mean μ (taken as an absolute value) and standard deviation σ . A high μ suggests that the concerned factor generally shifts the outcome of the model by a large degree. A low σ implies that the concerned factor indeed affects the outcome of the model.
Bio-shield simulations
The effect of coastal mangroves to the inland propagation of storm surge was simulated in quasi-3D, which builds on earlier quasi-2D simulation results for wave-vegetation dynamics (Zhang et al., 2012). The simulations involved a combination of several models of the relevant physics and biology of the coastal vegetation system (Figure 4). The physical part accounted for the water flow and the spatial profile of the sea floor (bathymetry) and land (topography). The biological aspect accounted for the fully developed mangrove along the coastline, representing its interaction with incoming sea waves by the tree density, average height, and average DBH (Suzuki et al., 2012). This parametrization effectively interfaced the result of the mangrove restoration simulation with the coastal wave model using XBeach version 1.22.4714:4905M (Roelvink et al., 2015). The model considered a simplified three-section vertical structure for the individual Rhizophora tree with a crown, trunk, and prop roots (Supplementary Figure 1). The tree density (per ha) from the restoration simulations were taken as vegetation input for the coastal wave model. For Tacloban, Leyte, due to the thin existing mangroves, the assumed tree density was 125/ha. For another site in Iloilo, the assumed tree density was 1,250/ha based on field observations. Both assumed tree densities were lower than the values projected from the restoration simulations. This underestimate was intended to buffer for any overestimation arising from the restoration model.
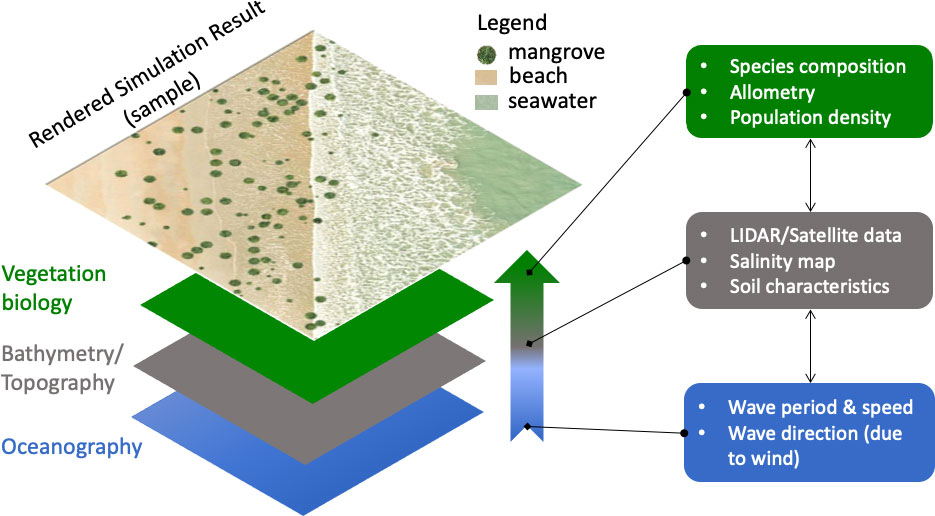
Figure 4 Framework of the bio-shield simulation. Bottom to top are the data layers essential for building the model. Oceanography and bathymetry/topography make up the physical part, while vegetation biology makes up the biological part of the model. Each layer offers to the model the relevant fundamental variables (as shown on the right). The upward pointing arrow represents the bottom-top combination of these variables in the simulations, rendering a result such as the one shown at the topmost frame.
To describe the storm surge development, propagation and impact, three factors of the wave dynamics of Haiyan (Supplementary Material) were considered: wave conditions, including wind direction; bathymetry and topography, including the coastline orientation; and demographic landscape. The conditions of Haiyan were simulated from the available wind data. The bathymetry and topography were reconstructed from available NASA SRTM dataset (jpl.nasa.gov). The model bathymetry was generated using the following steps with Delft3D. First, a grid was defined using spherical coordinates spanning the area of interest. Second, with RGFGRID the grid was orthogonalized and refined to obtain a median pixel size of about 40m×40m . Then, with QUICKIN, a triangular interpolation was used to generate the model bathymetry from SRTM15+ data with an intrinsic resolution of 500m×500m at the equator (Tozer et al., 2019). The SRTM15+ dataset has also been utilized for inundation models with reasonably satisfactory results in tsunami simulations (Serra et al., 2021; Qiu et al., 2022) and sea-level rise (Wang and Marsooli, 2021). Lastly, the population census statistics during the period of the Haiyan disaster in Tacloban, Leyte were used to estimate the spatial density of human settlements in the urban area.
Field mangrove observations
Due to the dearth of mangroves in Tacloban, Leyte (Carlos et al., 2015), a different location with a dense coastal mangrove and along Haiyan’s path was sought. A site in the northeastern Iloilo, Pan de Azucar Island (also known locally as Tambaliza) that belonged to a town called Concepcion, fits the description (Figure 5). The mangrove of the island was mapped and encoded in the bio-shield simulations. Particularly, the estimate of the tree density, estimated at around 1,250/ha, was a crucial input to the simulations. The simulation results for Pan de Azucar was used as a baseline to verify if endemic mangroves exerted any appreciable coastal protection effect against the category-5 disturbance brought by Haiyan.
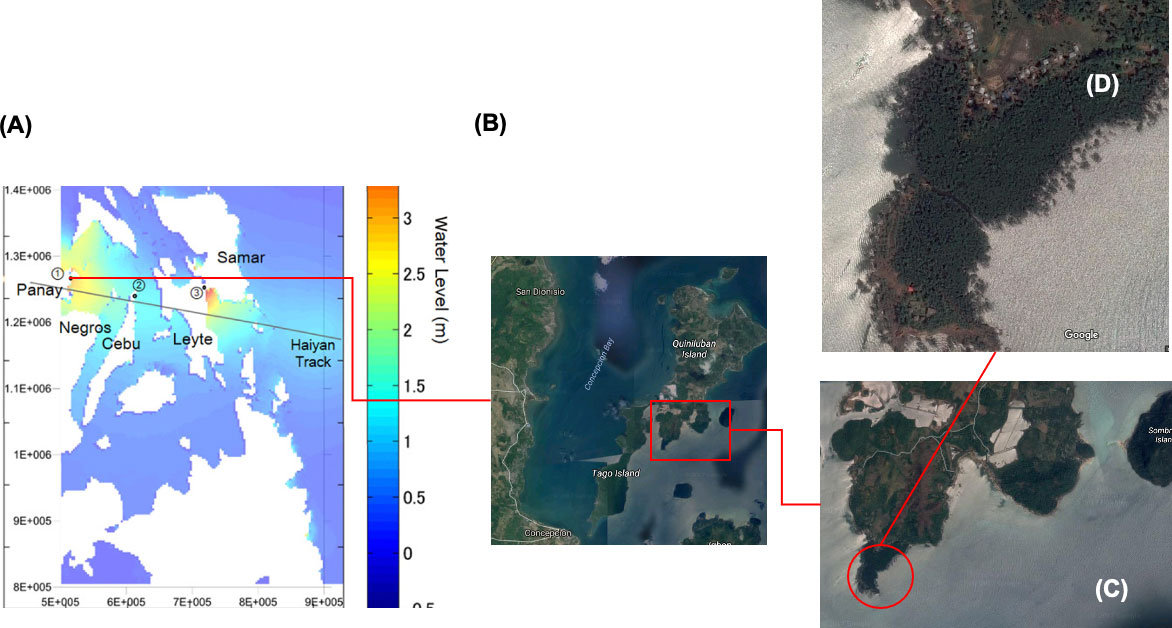
Figure 5 The site of Concepcion, lloilo within the path of Haiyan on November 8, 2013. (A) Map showing part of the Philippines along the storm track and the relative location of Concepcion. (B) Satellite image of the Pan de Azucar island with the area of interest marked by the rectangle. (C) Larger view of the area of interest with the dense mangrove marked by the circle. (D) Larger view of the dense mangrove.
Household surveys
An effective bio-shield must offer protection to a populated town from storm surge damage, while minimizing the cost of establishing this bio-shield. Tacloban was the town in the Philippines that suffered the most damage by Haiyan in 2013. The economic viability of establishing the bio-shield needed an estimate of the value at risk for Tacloban. A household survey was deployed across the city between December 2016 and February 2017, which gathered data from a convenience sample of 5,000 households scattered across Tacloban’s metropolitan area of which 55.7% responded (Supplementary Table). The survey sought to estimate how much economic value was at risk of inundation damage by the Haiyan storm surge with the following index:
Equation 5 tags a value of every member as equivalent to the GDP per capita in Tacloban. This value represented the average income or potential income that the household member would contribute to Tacloban’s economy. The tangible assets included the detachable possessions such as household appliances and other valuable items. HV , thus, estimated the casualty value that Tacloban would lose due to a sudden catastrophic disturbance. The same estimate was applied to Pan de Azucar.
Delimitations
The HV index in Equation 5 did not attempt to place a value on the real property for data privacy reasons. The economic valuation of the bio-shield also did not consider the carbon storage benefits of mangroves. The spatial resolution of the SRTM15+ bathymetry is not the highest available. However, due to computational limitations, this dataset was chosen. For further simplicity, the bio-shield simulations did not include sea level rise due to the melting of the polar ice caps. Studies have shown that a reasonable rate of sea level rise in Philippine coasts is about 15 mm/y, which is about nine times the global average (Holden and Marshall, 2018). At this rate, MSL would recede by about 38 cm in 25 years, which the present study considers small enough to assume a quasi-steady coastline over the course of the simulations. Lastly, the mangrove restoration and bio-shield simulations only assumed Rhizophora mangroves to simplify the estimates of growth rates and drag coefficients. The simulated patch is large enough (L=40 m) to generate an extended mangrove, but sufficiently small to manage the computational memory requirements.
Results
Sensitivity analysis
Based on multiple runs of the stochastic simulations, the Malthusian parameter Ω , and salinity response parameters dsalt and Ui exerted the most influence on the long-term tree population sizes (Figures 6A, B). Figure 6C also shows that Ω exerted substantial influence on the plant’s time to maturity, which is essential for establishment and survivability. A separate analysis for the time derivative of Equation 1 was made for the factors Ω , α , β , and D∈[0.5,15] cm. The increments for Ω , α , and β were maintained including their respective ranges with the exception of D , where it was scaled by a factor of 1.45. The domain of the random samples from the functions σ , η , and K was [0,1] . With the factors dsalt and Ui omitted, the curvature of σ did not play a role in analyzing the elementary effects of the factors in consideration. Figure 6D shows the result of a million samples taken from the factor space, with Ω also exerting the strongest influence among the factors even though the scale was 10−3 . The slope relatively exerted a moderate effect on the long-term outcomes, while the model was least sensitive to α and β suggesting its robustness to species-specific variations (e.g., among different Rhizophora species) and foliage cover.
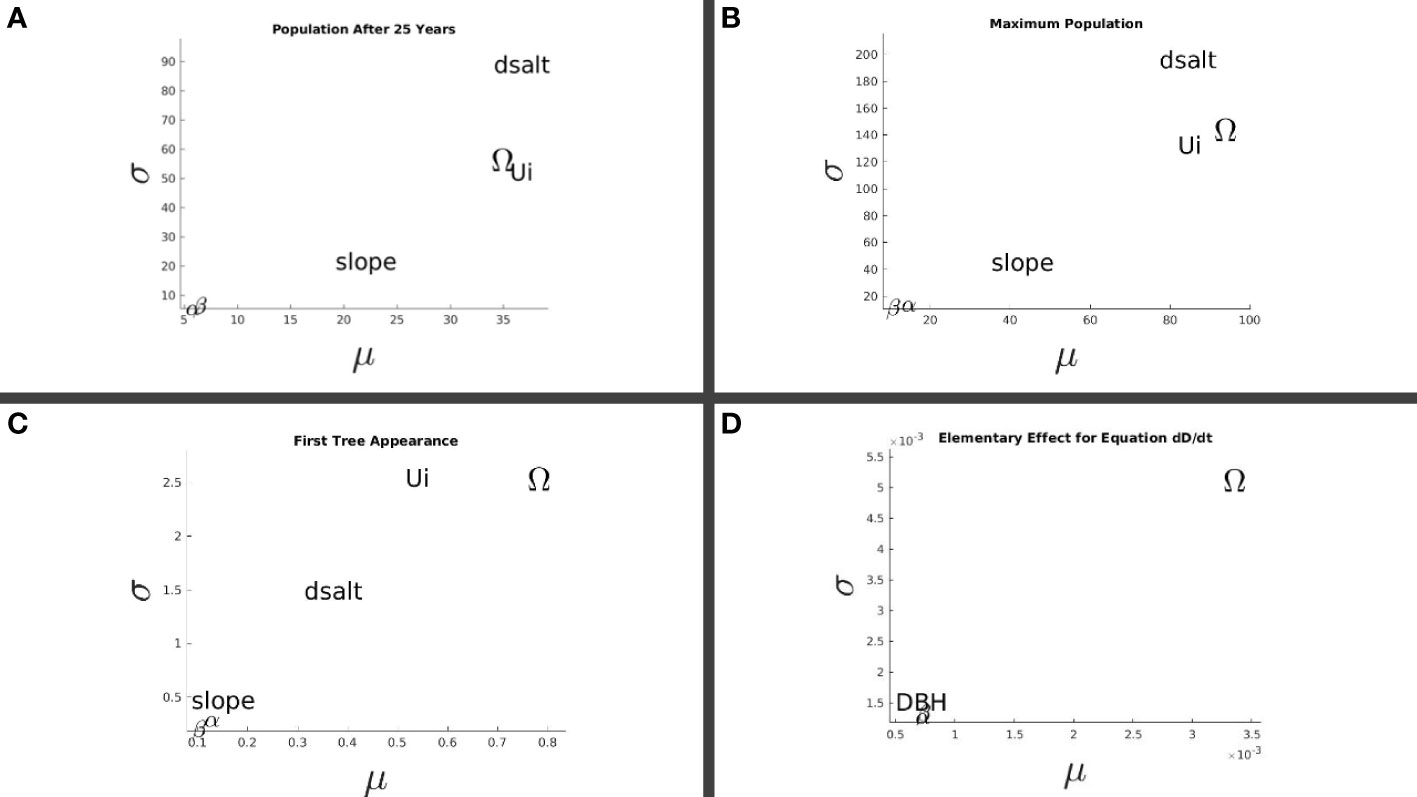
Figure 6 Sensitivity analysis on the long-term restoration outcomes. Sensitivity to selected parameters (see Section 2.6) of: (A) the average tree population 25 years post-planting; (B) the highest tree population achieved; (C) the time post-planting when the first instance of a plant maturing as a tree occurred; and (D) the elementary effect on the rate of DBH increase.
Mangrove restoration
Due to stochastic dynamics, the result of each simulation is a time series of tree, sapling, and seedling population taken as the average of ten runs. A typical outcome of a restored mangrove after a run time of 25 years consists of a distributed population across a flat coastal landscape (Figure 7). The initial seedling plantation (Figure 7A) generates the distribution of mangroves 25 years post-planting (Figure 7B). The landscape-rendered distribution is shown in Figure 7C. The youngest plants are mostly situated at the frontline along the MSL, while a few can be found in spaces between mature trees.
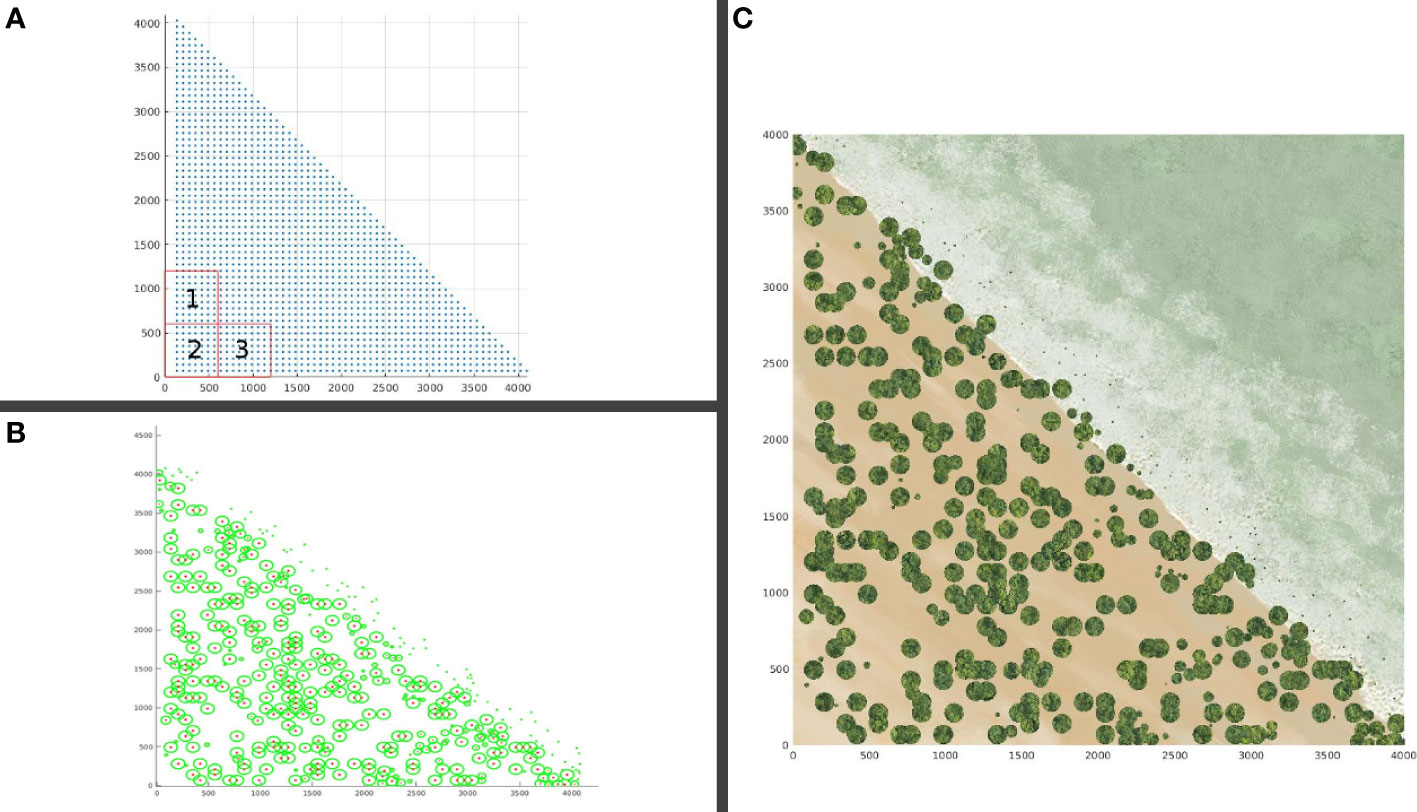
Figure 7 Typical result showing crowns of individual mangroves as viewed from the top for a landscape patch with slope parameter, sl = 0. (A) Patch plot at time zero; (B) 25 years post-planting, showing crown and trunk overhead; (C) Rendered result showing the beach landscape.
The time evolution of the population size based on tree, sapling, and seedling compartments are shown in Figure 8 for the two extreme slope cases, sl=0 (tidal flat) and sl=1 (coastal cliff). Stressor gradient effects are apparent on for sl=0 , in which the maturity is delayed on some batches because of the seaward increase of stress due to inundation and salinity. For the case sl=1 , the majority of initial seedlings reach their sapling and tree stages at the same time in the absence of salinity and inundation stressor gradients. The seedling population dropped quickly but not to zero, as seedlings planted in sites where stressors are high go through stunted growth. This gap is consistent with the gap between the number of seedlings before the drop and sapling population immediately after. The spike in the tree population near year 5 corresponds to a batch situated near the edge of the cliff. The peak tree density (considering the area approximately 0.08 ha) are 9,500/ha and 11,900/ha on the tidal flat and coastal cliff, respectively. At 25 years post-planting, the tree densities are about the same, at around 3,500/ha. The consistent decline in tree density after an initial peak indicates population thinning due to competition. It involves the DBH growth facilitated by the opening of space due to the death of some trees.
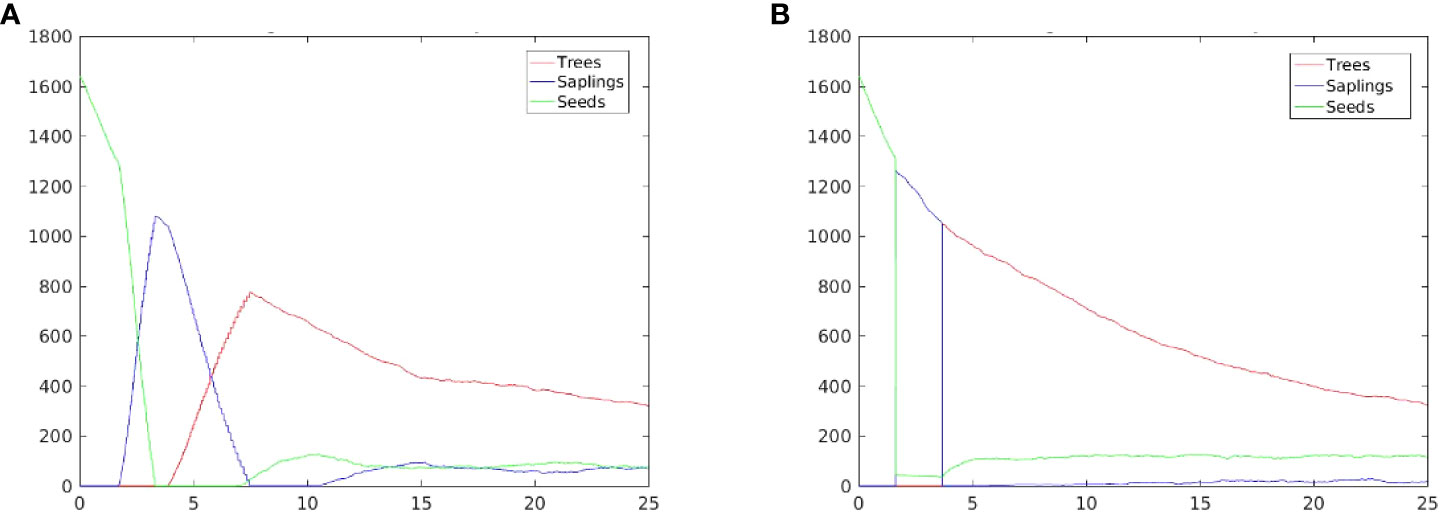
Figure 8 Prospective mangrove population curves resulting from beaches with different slopes. (A) slope parameter, sl=0 ; and (B) sl=1 .
An extended simulation of a particular restoration effort (Figure 9A) reveals that the average tree density (Figure 9B) tends to increase in the long term after it peaks then declines in the medium term (Figure 9C). This average result appears to be guaranteed if ξ>1 in the first few years post-planting (Figure 9D). Furthermore, moving the restoration zone inland can improve long-term outcomes as can be illustrated with a time series (Supplementary Figure 2) or a phase portrait (Supplementary Figure 3). The restoration index, like the basic reproduction number in epidemic models, provides a short-term gauge of the effort’s long-term success in obtaining dense mangroves. Considering coastal protection, it is necessary that the coastal mangroves have a high tree density over the long term to serve as bio-shield against storm surges with high, but less common, intensity.
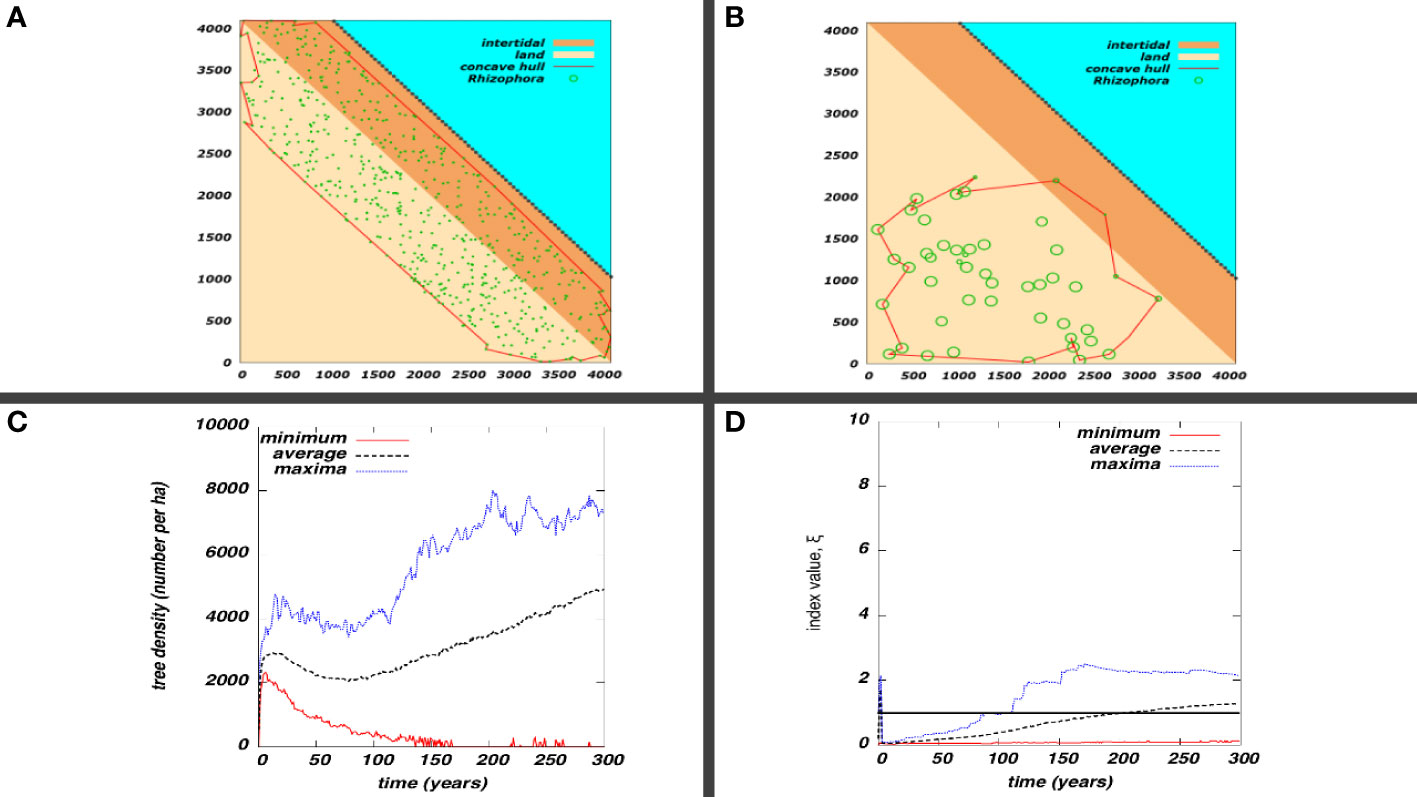
Figure 9 Restoration effort performance. (A) Initial seedlings distributed across a designated area (red polygon as convex hull); (B) the spatial distribution of plants 300 years post-planting; (C) Maximum, average, and minimum tree density versus time post-planting; and (D) Maximum, average, and minimum of the restoration index versus time post-planting. For (C, D), the data were obtained from 100 stochastic realizations of the model.
Bio-shield simulations
The coastal inundation results for Tacloban corroborated with field measurements conducted about two weeks after the storm (Lagmay et al., 2015). The water level results from the simulations of the actual scenario for Tacloban in the San Jose peninsula and downtown area (Figure 10) agreed with field data. The water level due to the surge was between 4-5 m in San Jose, whereas it ranged from 5 to 6 m in the downtown area (Lagmay et al., 2015). The simulation results at the peak of the surge (Figure 11A) indicated water levels within similar ranges in San Jose and downtown. This corroboration was sufficient to assume that the model represented coastal inundation to an appreciable degree.
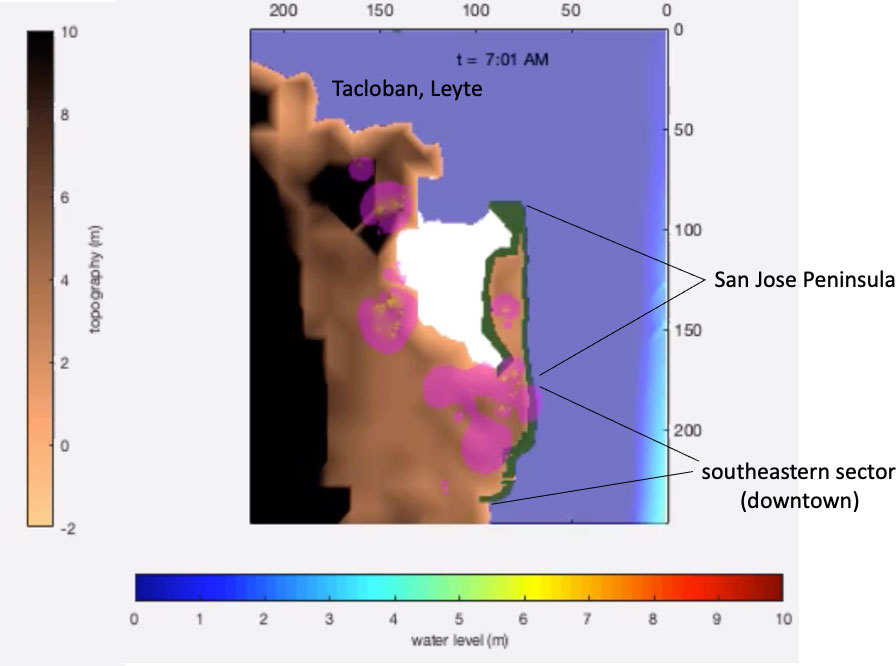
Figure 10 Site of mangrove restoration in Tacloban. The pink areas are density estimates of the concentration of households based on a household survey. The area occupied by households is widest in the southeastern sector of Tacloban, which is consistent with the latest population census from the Philippine Statistics Authority.
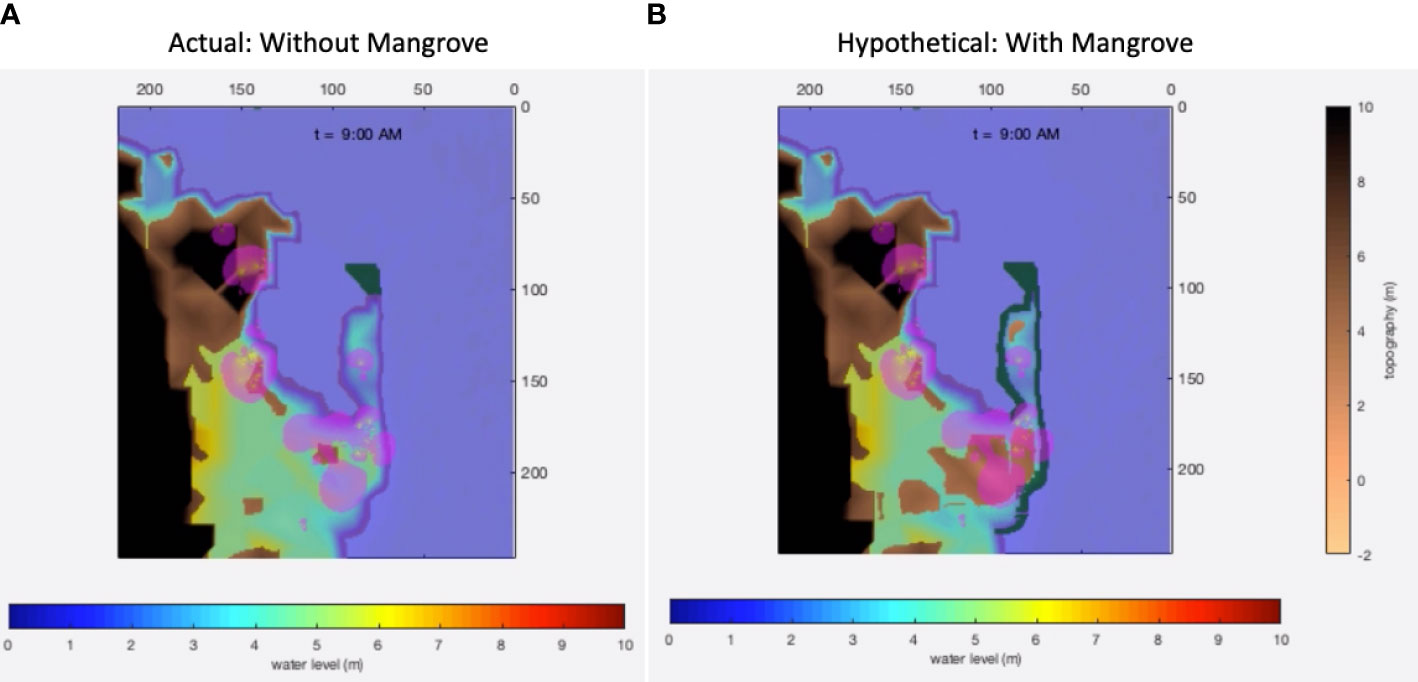
Figure 11 Bio-shield simulations in Pan de Azucar Island of the town of Concepcion, Iloilo. (A) Existing conditions with mangroves; (B) Hypothetical conditions without mangroves. The blobs (pink) represent the household population density estimated from the location data collected during the household survey.
The primary purpose of the study was to determine if mangroves could have protected Tacloban, Leyte when Haiyan generated intense storm surges. For this purpose, it is important to consider that the dissipative effect of vegetation assumed in XBeach has been validated from extensive laboratory and field tests (Roelvink et al., 2015). Tacloban, by default, did not have mangroves that Pan de Azucar had during Haiyan. The test scenario for Tacloban, thus, considered hypothetical mangroves. The second question was in which parts of the coast would restoration efforts be situated. Given the complexity of interaction between the wind profile and Tacloban’s bathymetry and topography, this question was not trivial to address. The solution was to provide an optimal and economically viable reason for coastal mangrove restoration. The restoration strategy was to minimize the total area occupied by the mangroves, which should minimize the relocation of existing households. The intended outcome was to maximize the area that the storm surge could not inundate, which translated to maximizing the coastal protection capacity.
The hypothetical mangroves, which directly face Haiyan’s wind direction, are located around the San Jose Peninsula toward the southeastern coast (Figure 10). A thin mangrove exists on the northern tip of the San Jose Peninsula. Simulating the Haiyan storm surges over Tacloban in November 2013 (Figure 11A), the hypothetical mangroves do not completely shield Tacloban totally from the inundation (Figure 11B). The incoming storm surge could still wash over San Jose peninsula, although the mangroves slowed down the transmitted water flow moving toward the southwestern portion of Tacloban (Supplementary Movie 1). Consequently, areas in the southeastern sector of Tacloban are notably drier. This southeastern sector coincides with the location of the San Jose, Caibaan, and Marasbaras villages, which is home to about 5,500 households.
The presence of mangroves in the Pan de Azucar Island of Concepcion, Iloilo enabled testing the protective bio-shield effect (Figure 12A) in comparison to a hypothetical absence of mangroves (Figure 12B). This comparison is the exact opposite to the one applied to Tacloban—a converse hypothesis test. The existing mangroves were facing an oblique direction to Haiyan’s wind velocity. Simulating Haiyan conditions revealed that the inland inundation would have been wider and deeper in the absence of mangroves, possibly penetrating into Sitio Proper (See and Wilmsen, 2022). The 1,250/ha mangroves in the surveyed area lessened the momentum of the reflected waves that penetrated inland, acting like shock absorbers that limited the energy of water flow (Supplementary Movie 2). This physical effect may also be a consequence of the oblique “angle of attack” of the winds relative to the mangrove orientation, although this aspect may require further confirmation. However, this result would suggest that the bio-shielding impact of mangroves may be site specific. Thus, the protection capacity of mangroves, which ground-truth reports in the area corroborated, were a factor in the relatively lower degree of damage and per-capita casualty rates in Pan de Azucar relative to Tacloban during the Haiyan storm surges in November 2013.
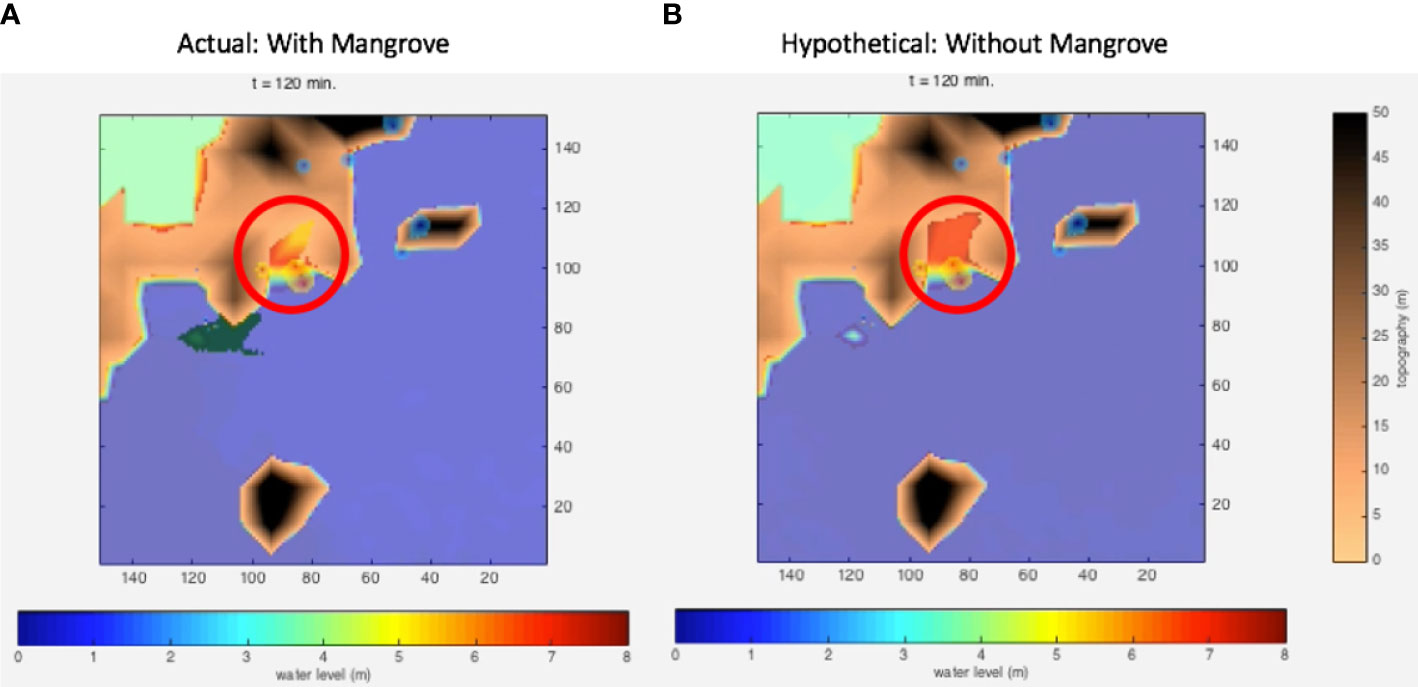
Figure 12 Bio-shield simulations in Pan de Azucar Island of the town of Concepcion, Iloilo. (A) Existing conditions with mangroves; (B) Hypothetical conditions without mangroves. The encircled inland area shows the effect of the absence of mangroves that currently exist to the southwest.
Economic analysis of the bio-shielding effect
The comparative simulations indicate that mangroves along selected coasts of Tacloban (Figure 10) could lead to patches of dry sites when Haiyan occurred (Figure 11B). The dry patches correspond to some of the most populous villages of the city. Based on the 2010 population census, the dry patches would have been the sight of 5,500 households. With the data from the household survey, the estimated value attributable to those dry patches is HV= Php 2.9 billion (5,500 households x 5 members/household x $2,600 GDP per capita multiplied by Php 40.00/US$1.00 (based on the foreign exchange rate for 2013). The total area of the new mangroves (Figure 10) is about 158 ha, determined through the following considerations. Each cell on the simulated patch is approximately a square with about 36-m length on all sides. The total number of planted cells is 1,216, whereas the total area is 158 ha.
Considering Php100,000 as the minimal spend of fully vegetating a cell, which includes the possible average cost of displacing an existing household, then the total cost of planting is only around Php120 million. The tradeoff between the potential benefit of saved value (Php2.90B) and cost of bio-shielding efforts is staggering—a factor of 24x favoring the benefit. Thus, the rational economic decision would be to situate the restoration efforts along selected areas of the Tacloban coastline.
Discussion
The simulations reveal that mangrove restoration, if done in suitable sites with supportive conditions, can achieve an average tree density of more than 3,000/ha in the medium- (25 years) and long-term (> 50 years). Although different stochastic realizations of the model yield different outcomes, the average results can serve as estimate of the expected long-term outcome. A restoration index is proposed to determine site suitability using data in the first few years of a pilot plantation. Measuring the growth rate, especially the seedling-to-sapling transition, and the sapling and seedling mortality rates may be sufficient to make ξ>1 at least in the first few years post-planting. The initial population pressure suggested by ξ>1 increases the likelihood of seedling establishment toward maturity, enhancing survival. Thus, the value of this index can guide restoration programs in planning for higher chances of success and maximizing the efficient use of resources.
The tree density is an important bio-shield parameter that determines the vegetation-induced water resistance (Carlos et al., 2015). The drag coefficient was the parameter that quantified the resistance of an individual tree to incoming water flow. The tree density accounted for the overall average effect of all mangroves in the area. Even by underestimating the tree density (relative to the average possible from the simulations) in the two sites simulated, Tacloban (4%) and Pan de Azucar (40%), the bio-shield effect is apparent. For Pan de Azucar, the bio-shield effect is substantial even though the mangroves are in an oblique position relative to the Haiyan winds. Due to this orientation, the mangroves did not take the full force of the incoming storm surge. Yet, because of the high tree density, the mangroves sufficiently slowed down the momentum of the reflected water flow. This attenuation of reflected flow is sufficient to reduce the extent of the inundated area inland. For Tacloban, the thinner hypothetical mangroves, which are orientated directly facing the incoming storm surge, still provided a viable level of coastal protection. Drier areas resulting from this protection imply that casualties and costs could have been minimized. The economic analysis based on data from household surveys shows that Tacloban could have saved about US$12 million worth of lost lives and property damage.
Although the study considered only a single genus, the system and methods used may also work for other genera, e.g., Avicennia and Sonneratia (Carlos et al., 2015). Given that the growth model is found to be robust against species-specific variations, while the vegetation-induced hydrodynamic effects only rely on the physical characteristics of mangroves, the present study should be adaptable to accommodate multi-specific restorations. Detailed field observations and mapping can provide precise information of the mangrove characteristics that are relevant to the hydrodynamics of storm surges. Surveys using LiDAR technology on low-flying unmanned drones (Alon et al., 2019; Marasigan et al., 2019) can provide the precise mapping for quantifying the hydrodynamically relevant vegetation parameters of mangroves.
Conclusion
This prospective simulation study showed an interesting connection between mangrove restoration and coastal protection. The link was obtained by modeling the long-term tree density obtained by applying common restoration practices for coastal mangroves in the Philippines. The tree density was a crucial factor in describing the hydrodynamic drag exerted by mangroves on an incoming water flow, e.g., storm surge, driven by category-5 winds, through short- and long-wave dissipation. While the results showed stable average tree densities of more than 3,000/ha, the stochastic simulations indicate that worse outcomes are possible. Thus, site suitability evaluation is a necessary step toward achieving a higher likelihood of long-term success for the restoration effort. For this step, a restoration index was proposed to quantify the chances of success with field measurements of plant growth and mortality rates that can be performed over the immediate term. Bio-shield simulations showed that even underestimating the tree density of restored mangroves can lead to appreciable levels of coastal protection. A comparison of the actual (no mangrove) and hypothetical (restored mangrove) scenarios revealed that Tacloban could have saved $12 million worth of property damage and lives lost from Haiyan in 2013.
Data availability statement
The original contributions presented in the study are included in the article/Supplementary Material. Further inquiries can be directed to the corresponding author.
Author contributions
DJ formulated the model, performed the simulation experiments, deployed the field surveys, gathered data, interpreted and analyzed the results, and wrote the manuscript.
Funding
Financial support was provided by the Department of Science and Technology with Grant #2014-7373.
Acknowledgments
The author also acknowledges the technical support of the National Research Council of the Philippines; Mr. Joseph Elias Co, for the simulations; Ms. Darahlyn Romualdo, for the field measurements; and the Oscar M. Lopez Center for assistance in the initial draft of the manuscript.
Conflict of interest
The author declares that the research was conducted in the absence of any commercial or financial relationships that could be construed as a potential conflict of interest.
Publisher’s note
All claims expressed in this article are solely those of the authors and do not necessarily represent those of their affiliated organizations, or those of the publisher, the editors and the reviewers. Any product that may be evaluated in this article, or claim that may be made by its manufacturer, is not guaranteed or endorsed by the publisher.
Supplementary material
The Supplementary Material for this article can be found online at: https://www.frontiersin.org/articles/10.3389/fmars.2022.968420/full#supplementary-material
References
Alon A. S., Festijo E. D., Juanico D. E. O. (2019). “Tree detection using genus-specific RetinaNet from orthophoto for segmentation access of airborne LiDAR data,” in 2019 IEEE 6th international conference on engineering technologies and applied sciences (ICETAS) (Kuala Lumpur, Malaysia: IEEE), 1–6.
Berger U., Hildenbrandt H. (2000). A new approach to spatially explicit modelling of forest dynamics: spacing, ageing and neighbourhood competition of mangrove trees. Ecol. Model. 132 (3), 287–302. doi: 10.1016/S0304-3800(00)00298-2
Carlos C., Delfino R. J., Juanico D. E., David L., Lasco R. (2015). Vegetation resistance and regeneration potential of Rhizophora, Sonneratia, and Avicennia in the typhoon haiyan-affected mangroves in the Philippines: Implications on rehabilitation practices. Climate Disaster Dev. J. 1 (1), 1–8. doi: 10.18783/cddj.v001.i01.a01
Delfino R. J., Carlos C. M., David L. T., Lasco R. D., Juanico D. E. O. (2015). Perceptions of typhoon haiyan-affected communities about the resilience and storm protection function of mangrove ecosystems in Leyte and Eastern samar, Philippines. Clim. Disaster Dev. J. 1, 15–24. doi: 10.18783/cddj.v001.i01.a03
Duke N. C., Meynecke J. O., Dittmann S., Ellison A. M., Anger K., Berger U., et al. (2007). A world without mangroves? Science 317 (5834), 41–42. doi: 10.1126/science.317.5834.41b
Fulton M. R. (1993). “Rapid simulations of vegetation stand dynamics with mixed life-forms,” in Vegetation dynamics & global change (Boston, MA: Springer), 251–271.
Gillespie D. T. (1976). A general method for numerically simulating the stochastic time evolution of coupled chemical reactions. J. Comput. Phys. 22 (4), 403–434. doi: 10.1016/0021-9991(76)90041-3
Holden W. N., Marshall S. J. (2018). “Climate change and typhoons in the Philippines: Extreme weather events in the anthropocene,” in Integrating disaster science and management (Amsterdam, Netherlands: Elsevier), 407–421.
Kamali B., Hashim R. (2011). Mangrove restoration without planting. Ecol. Eng. 37 (2), 387–391. doi: 10.1016/j.ecoleng.2010.11.025
Kamil E. A., Takaijudin H., Hashim A. M. (2021). Mangroves as coastal bio-shield: a review of mangroves performance in wave attenuation. Civil Eng. J. 7 (11), 1964–1981. doi: 10.28991/cej-2021-03091772
Lagmay A. M. F., Agaton R. P., Bahala M. A. C., Briones J. B. L. T., Cabacaba K. M. C., Caro C. V. C., et al. (2015). Devastating storm surges of typhoon haiyan. Int. J. Disaster Risk Reduction 11, 1–12. doi: 10.1016/j.ijdrr.2014.10.006
Lee S. Y., Primavera J. H., Dahdouh-Guebas F., McKee K., Bosire J. O., Cannicci S., et al. (2014). Ecological role and services of tropical mangrove ecosystems: a reassessment. Global Ecol. Biogeography 23 (7), 726–743. doi: 10.1111/geb.12155
Lewis R. R. III (2005). Ecological engineering for successful management and restoration of mangrove forests. Ecol. Eng. 24 (4), 403–418. doi: 10.1016/j.ecoleng.2004.10.003
Long J., Napton D., Giri C., Graesser J. (2014). A mapping and monitoring assessment of the philippines' mangrove forests from 1990 to 2010. J. Coast. Res. 30 (2), 260–271. doi: 10.2112/JCOASTRES-D-13-00057.1
Marasigan R., Festijo E., Juanico D. E. (2019). “Mangrove crown diameter measurement from airborne lidar data using marker-controlled watershed algorithm: Exploring performance,” in 2019 IEEE 6th international conference on engineering technologies and applied sciences (ICETAS) (Kuala Lumpur, Malaysia: IEEE), 1–7.
McIvor A. L., Spencer T., Möller I., Spalding M. (2012). Storm surge reduction by mangroves. Natural Coastal Protection Series: Report 2. Cambridge Coastal Research Unit Working Paper 41. Arlington, VA, USA: The Nature Conservancy and Wetlands International.
Morris M. D. (1991). Factorial sampling plans for preliminary computational experiments. Technometrics 33 (2), 161–174. doi: 10.1080/00401706.1991.10484804
Primavera J. H., Esteban J. M. A. (2008). A review of mangrove rehabilitation in the Philippines: successes, failures and future prospects. Wetlands Ecol. Manage. 16 (5), 345–358. doi: 10.1007/s11273-008-9101-y
Qiu Q., Zhou Z., Lin J., Zhang F., Chen Z., Yang X. (2022). Great earthquake and tsunami potential in the eastern makran subduction zone: New insights from geodetic and structural constraints. Tectonophysics 837, 229462. doi: 10.1016/j.tecto.2022.229462
Roelvink D., Van Dongeren A., McCall R., Hoonhout B. M., Van Rooijen A., Van Geer P., et al. (2015). XBeach manual. Deltares Delft Univ. Technology: Delft Netherlands 1.12: 24–7.
Salmo S., Juanico D. E. (2015). An individual-based model of long-term forest growth and carbon sequestration in planted mangroves under salinity and inundation stresses. Int. J. Philippine Sci. Technol. 8 (2), 31–35.
Schaal B. A., Leverich W. J. (1982). Survivorship patterns in an annual plant community. Oecologia 54 (2), 149–151. doi: 10.1007/BF00378386
Schmitt K., Albers T., Pham T. T., Dinh S. C. (2013). Site-specific and integrated adaptation to climate change in the coastal mangrove zone of soc trang province, Viet nam. J. Coast. Conserv. 17 (3), 545–558. doi: 10.1007/s11852-013-0253-4
See J., Wilmsen B. (2022). A multidimensional framework for assessing adaptative justice: a case study of a small island community in the Philippines. Climatic Change 170 (1), 1–21. doi: 10.1007/s10584-021-03266-y
Serra C. S., Martínez-Loriente S., Gracia E., Urgeles R., Gómez de la Peña L., Maesano F. E., et al. (2021). Sensitivity of tsunami scenarios to complex fault geometry and heterogeneous slip distribution: Case-studies for SW Iberia and NW Morocco. J. Geophysical Research: Solid Earth 126 (10), e2021JB022127. doi: 10.1029/2021JB022127
Su J., Friess D. A., Gasparatos A. (2021). A meta-analysis of the ecological and economic outcomes of mangrove restoration. Nat. Commun. 12 (1), 1–13. doi: 10.1038/s41467-021-25349-1
Suzuki T., Zijlema M., Burger B., meijer M.C., Narayan S. (2012). Wave dissipation by vegetation with layer schematization in SWAN. Coastal Engineering 59 (1), 64–71. doi: 10.1016/j.coastaleng.2011.07.006
Temmerman S., Meire P., Bouma T. J., Herman P. M., Ysebaert T., De Vriend H. J. (2013). Ecosystem-based coastal defence in the face of global change. Nature 504 (7478), 79–83. doi: 10.1038/nature12859
Tozer B., Sandwell D. T., Smith W. H., Olson C., Beale J. R., Wessel P. (2019). Global bathymetry and topography at 15 arc sec: SRTM15+. Earth Space Sci. 6 (10), 1847–1864.
Van Kampen N. G. (1992). Stochastic processes in physics and chemistry Vol. Vol. 1 (Amsterdam, Netherlands: Elsevier).
Wang Y., Marsooli R. (2021). Dynamic modeling of sea-level rise impact on coastal flood hazard and vulnerability in New York city's built environment. Coast. Eng. 169, 103980. doi: 10.1016/j.coastaleng.2021.103980
Keywords: bio-shield, Rhizophora, mangrove restoration, coastal protection, storm surge
Citation: Juanico DEO (2022) Does mangrove restoration imply coastal protection? A prospective simulation study. Front. Mar. Sci. 9:968420. doi: 10.3389/fmars.2022.968420
Received: 14 June 2022; Accepted: 30 August 2022;
Published: 23 September 2022.
Edited by:
Kangkuso Analuddin, Halu Oleo University, IndonesiaReviewed by:
Ali Masria, Mansoura University, EgyptAriel Blanco, University of the Philippines Diliman, Philippines
Dixon Gevaña, University of the Philippines Los Baños, Philippines
Copyright © 2022 Juanico. This is an open-access article distributed under the terms of the Creative Commons Attribution License (CC BY). The use, distribution or reproduction in other forums is permitted, provided the original author(s) and the copyright owner(s) are credited and that the original publication in this journal is cited, in accordance with accepted academic practice. No use, distribution or reproduction is permitted which does not comply with these terms.
*Correspondence: Drandreb Earl O. Juanico, cmViLmp1YW5pY29AdGlwLmVkdS5waA==
 Drandreb Earl O. Juanico