 Vassilis P. Papadopoulos
 George Krokos1,2
 Hari Prasad Dasari
 Yasser Abualnaja
 Ibrahim Hoteit
- 1Institute of Oceanography, Hellenic Centre for Marine Research, Anavyssos, Greece
- 2Earth Sciences and Engineering Department, King Abdullah University for Science and Technology, Thuwal, Saudi Arabia
- 3Red Sea Research Center, King Abdullah University for Science and Technology, Thuwal, Saudi Arabia
A regional, high-resolution reanalysis was analyzed to explore extreme heat loss events in the Northern Red Sea (NRS) and their links to specific regional atmospheric circulation patterns. Such events are determinant for the overturning circulation of the Red Sea and occur frequently between November and March, with maximum frequency during December and January. During these events, the most intense heat loss, often with daily-averaged values lower than -1000 W/m2, is found over the southern half of the Gulf of Aqaba and along the western coastline of the open NRS. Analyses of the spatial modes of variability of these events suggest that the majority of them extend over the entire NRS in an almost uniform way; however, secondary, nonuniform patterns related to regional adjustment in the wind field are also identified. The uniform cold outbursts are associated with distinct atmospheric circulation patterns, which favor the transfer of cold air masses from higher latitudes over the eastern Mediterranean Sea via a strong northwest wind field. Nonuniform events affect considerable parts of the NRS and occur when cold and dry air masses reach the NRS through the Middle East and the northern part of the Arabian Peninsula. The regional sea level pressure drives a clockwise rotation of the wind field that ultimately blows from the northeast/east direction. This rotation of the wind field favors local intensification and lee areas defined by the complex topography and characteristic gaps in the mountain chain along the eastern coastline of the NRS, reflecting the differentiations in the spatial distribution of the heat flux minima.
1 Introduction
The Red Sea, a geologically young marginal oceanic basin, hosts a precious marine ecosystem fringed by an impressive chain of coral reefs. Unique in the global ocean, as the only marginal sea that spans 19° in the latitudinal direction, the Red Sea extends from tropical to subtropical climatic zones and is surrounded by arid and semiarid areas. In terms of climate, its southern part is affected by the Arabian Sea monsoon system, whereas a seasonal cycle with warm and cold periods, typical of subtropical areas worldwide, prevails over its northern region (Viswanadhapalli et al., 2017). The Northern Red Sea (NRS), including the two gulfs of Aqaba and Suez (Figure 1), is a pivotal area for the overturning circulation of the entire basin. Winter atmospheric forcing is an imperative driving factor that frequently leads to dense water formation, sustaining the thermohaline conveyor belt of the entire basin. Intermediate and deep-water masses formed in the NRS renew the subsurface water and ventilate the deep layers (Cember, 1988; Sofianos and Johns, 2003; Yao et al., 2014a; Yao et al., 2014b; Sofianos and Johns, 2015; Papadopoulos et al., 2015; Yao and Hoteit, 2018). In particular, the intermediate water formed in the NRS travels to the far south and exits the basin as the Red Sea Outflow Water (Sofianos and Johns, 2003; Yao et al., 2014a; Yao et al., 2014b; Sofianos and Johns, 2015; Zhai et al., 2015) to the Gulf of Aden and the Indian Ocean. This outflow carries hypersaline water thousands of miles from its source and plays a notable role in the salt balance of the Western Indian Ocean (Beal et al., 2000; Bower et al., 2005; Roman and Lutjeharms, 2007; Roman and Lutjeharms, 2009).
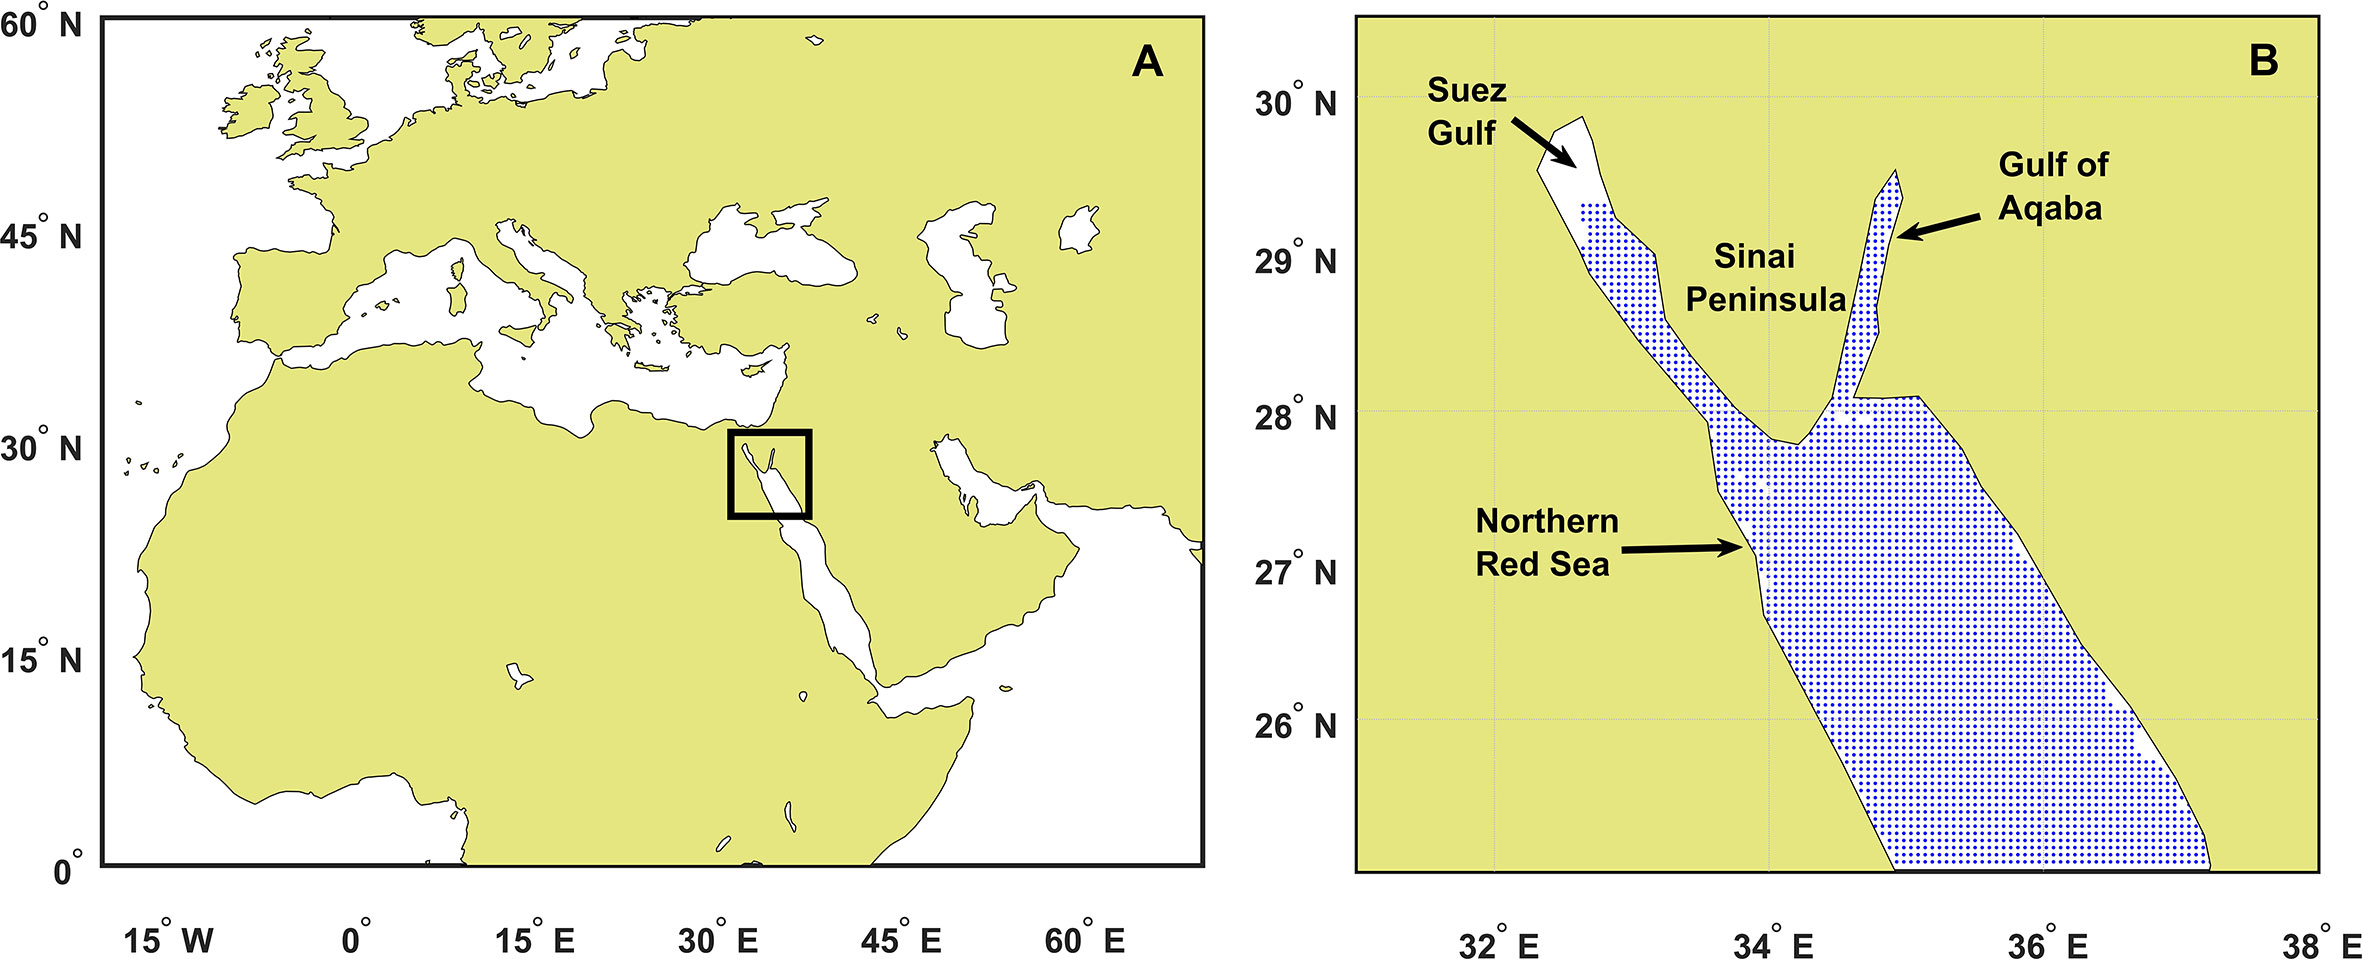
Figure 1 Map of the Northern Red Sea (NRS) (left) and the 2933 grid points of the high-resolution reanalysis product (right).
In the northern part of the open Red Sea and in its two northward extensions, the gulfs of Aqaba and Suez, heat loss via the sea surface during winter cools the already hypersaline water and forces it to sink. This dense water according to its density can reach intermediate or deep layers and fuel the two loops of overturning circulation in the basin (Cember, 1988; Woelk and Quadfasel, 1996; Sofianos and Johns, 2003; Manasrah et al., 2004; Biton and Gildor, 2011; Papadopoulos et al., 2013; Abualnaja et al., 2015; Yao and Hoteit, 2018; Asfahani et al., 2020). Extreme surface cooling, which leads to dense water formation events, is directly related to the energy transferred from the sea to the atmosphere. Therefore, the characteristics of the heat exchange at the air–sea interface and its link to distinct atmospheric circulation patterns are of great interest. In particular, attention needs to be paid to the characterization of extreme heat loss, which is a decisive driving factor in the formation of dense water in the NRS (Sofianos and Johns, 2003; Yao et al., 2014a; Yao et al., 2014b; Papadopoulos et al., 2015; Yao and Hoteit, 2018; Asfahani et al., 2020).
The net air-sea heat flux is the sum of four components and is given by the following equation:
where Qnet is the sum of the energy exchange between the sea surface and overlying air (W/m2), Qs is the solar shortwave radiation, Qb is the longwave radiation, Qe is the latent (evaporative) heat, and Qh is the sensible heat. Qs and Qb are radiative terms, and their sum is the radiative component Qrad; whereas, Qe and Qh are turbulent terms, and their sum is the turbulent component Qturb:
By their definition, the air-sea heat flux components are directly linked to atmospheric properties as cloudiness, near-surface temperature and humidity, and wind speed and direction. The atmospheric conditions affecting Qnet are closely associated with the general atmospheric circulation (Cayan, 1992; Bond and Cronin, 2008; Konda et al., 2010). The link between air-sea heat flux and the atmospheric circulation has been widely investigated in the neighboring Mediterranean Sea, especially in terms of the extreme cooling conditions that lead to dense water formation (Ruiz et al., 2008; Schroeder et al., 2010; Josey et al., 2011; Mariotti and Dell’Aquila, 2012; Papadopoulos et al., 2012a; Papadopoulos et al., 2012b). However, only few studies examined the characteristics of the air–sea heat flux in the Red Sea, especially its coupling with the large-scale and regional atmospheric circulation patterns. Papadopoulos et al. (2013; hereinafter, PEA13) ascribed the air–sea heat flux variability in the NRS mainly to the turbulent components. Using 11 grid points from the Woods Hole Oceanographic Institution OAFlux reanalysis product, they linked the occurrence of the minima and maxima of the turbulent components to general patterns in the atmospheric circulation over Eurasia and North Africa. Abualnaja et al. (2015) investigated the influence of several atmospheric circulation patterns on the air–sea heat flux in the Red Sea in terms of climatic indices without examining the extremes of cooling or heating in the NRS. The study by Jiang et al. (2009) reported a potential contribution of dry, westward wind during winter to dense water formation in the NRS. In addition, two studies by Menezes et al. (2018; 2019) further investigated the occurrence of strong westward winds during winter and linked these to extreme heat loss events of similar magnitude to those associated with cold outbreaks in the NRS. They associated the strong westward winds with specific atmospheric circulation patterns over the Arabian Peninsula and northeast Africa.
The forementioned five studies reveal the existence of distinct modes of atmospheric forcing that can trigger different spatial modes of variability in the net heat loss during extreme cooling. The present study analyzes a novel 5-km-resolution regional reanalysis that has been generated especially for the Red Sea region to present for the first time a detailed winter climatology of the Qnetand the spatial and temporal characteristics of the heat loss extremes. It further provided high resolution information to fully investigate the modes of variability of the Qnet during the extremes, which was not previously possible due to the coarse character of the available global-scale reanalysis products. We quantify the contribution of each mode to the total variability of the extremes, and provide a detailed description of the link of each mode to specific regional atmospheric circulation identifying at the same time the origin of the air masses during extreme cooling events in the NRS. Finally, we delineate the distinct routes through which these air masses reach the NRS and the role of the regional topography in the modulation of the wind fields during the extremes.
The significance of extreme heat loss events in the NRS for the functioning of the entire basin makes the analysis of such events and their atmospheric triggering mechanisms of particular interest. The text is organized as follows. Section 2 provides details of the datasets and the adopted methodology. Section 3 presents the Qnet winter climatology and investigates the heat loss characteristics during extreme cooling events in the NRS. The links of the Qnet modes of variability during the extremes to specific regional atmospheric circulation patterns are presented in Section 4. Finally, Section 5 provides concluding remarks and proposes future research directions.
2 Data and methodology
2.1 The datasets
This study focuses on the net air–sea heat flux (Qnet) in the NRS. The four components of the air–sea heat exchange were determined through an Arabian Peninsula Regional Reanalysis (AP-RA) product generated using an assimilative configuration of the Advanced Research Weather Research Forecasting (ARW) model (Skamarock et al., 2019) at a spatial resolution of 5 km (Viswanadhapalli et al., 2017; Langodan et al., 2017; Dasari et al., 2019; Hoteit et al., 2020; Viswanadhapalli et al., 2020; Dasari et al., 2021). Surface zonal and meridional wind components (u and v, respectively, at 10 m) were obtained from the same reanalysis spanning a period of nearly 40 years (January 2, 1980–June 30, 2019). The ARW model was implemented using two domains with two-way interaction with horizontal resolutions of 15 km and 5 km and 51 vertical levels, with the inner domain covering the Red Sea region. The initial and boundary conditions are obtained from the European Centre for Medium-Range Weather Forecasts (ECMWF) reanalysis Interim reanalysis (ERA-I) data available at a 0.75° horizontal resolution (Dee et al., 2011). All available in-situ and satellite observations over the Arabian Peninsula were assimilated into ARW using the consecutive re-initialization method (e.g., Lucas-Picher et al., 2013; Viswanadhapalli et al., 2017) and three-dimensional variational data assimilation. This includes conventional observations from surface stations (synoptic stations, Metar, ship, and buoy), upper-air soundings (Rawinsonde and pilot balloon), and satellite observations, such as wind vectors from the Quick Scatterometer (QuikSCAT), Windsat, and advanced scatterometer (ASCAT), and the atmospheric motion vectors from geostationary satellites. The model is then integrated over 36-hour cycles, starting at 12:00 UTC on each day. The observations are assimilated during the first 12-hour starting at 12:00 UTC on each day and the resulting optimized downscaled initial conditions are then used to integrate WRF-ARW for the next 24 hours in free forecast mode. The model outputs of the last 24 hours are combined every day to generate the long-term high-resolution reanalysis for the AP during the period 1980-2020. The details of the AP-RA are well documented by several previous studies (e.g., Viswanadhapalli et al., 2017; Ellis et al., 2019; Dasari et al., 2019; Dwivedi et al., 2020; Langodan et al., 2020; Asfahani et al., 2020; Hoteit et al., 2020; Viswanadhapalli et al., 2020; Dasari et al., 2021; ). The Rapid Radiative Transfer Model for Global circulation model was used for both shortwave and longwave radiation (Iacono et al., 2008). The bulk parameterization scheme of Thompson et al. (2008) was used for the cloud microphysical process. The turbulent component (sum of the sensible and latent heat) of the air-sea heat flux was calculated using the Liu et al. (2013) parameterization scheme. The Mellor–Yamada–Nakanishi–Niino level 2.5 (Nakanishi and Niino, 2004) parameterization scheme was used to define the planetary boundary layer process and the Noah–MP scheme for the land-surface processes (Niu et al., 2011). As the wind field and the near-surface temperature are determinant factors for the air-sea heat exchange, a specific validation of the AP-RA for these parameters is provided in the Supplemental File.
SLP from the ERA-Interim reanalysis available at a horizontal resolution of 0.75° (Dee et al., 2011) is used to investigate the coupling between Qnet and the regional SLP. In addition, SLP and surface 10m wind from the ERA-5 global reanalysis dataset (Hersbach et al., 2020) are used to present the showcases corresponding to the detected SVD modes. Finally, we used the Global 30 Arc-Second Elevation (GTOPO30) provided by the United States Geological Survey Earth Resources Observation and Science Archive to describe the regional topographic relief. A synoptic picture of the datasets used in the study and their applicability is presented in Table 1.
Table 1 Details of the datasets used in this study. AP-RA is the high-resolution regional reanalysis.
2.2 Methodology
We adopted the oceanographic convention for the sign of the net heat exchange, with negative values representing heat loss by the sea surface. To explore the Qnet behavior and to define extreme heat loss events, spatially averaged daily values were derived using the 2933 grid points available from the high-resolution regional reanalysis in the NRS north of 25° (Figure 1B). As such, the averaged values convey only the broader impact on the NRS, excluding possible events of local minor-impact. The time series includes a total of 14,425 days (from January 2, 1980 to June 30, 2019). We isolated the tenth percentile of the lowest Qnet values, which corresponds to 1443 days of the time series. The modes of the spatial variability of these 1443 events were investigated via an empirical orthogonal function (EOF) analysis (Bjornsson and Venegas, 1997; Hannachi et al., 2006; Hannachi et al., 2007). The EOF patterns are presented as homogeneous correlation maps that show the spatial distribution of the correlation coefficients between the expansion coefficients of each mode and Qnet anomaly at each grid point. Daily Qnet anomalies were calculated for each grid point as the difference between the daily values and monthly mean values. Furthermore, we explored the potential coupling of these events with specific atmospheric circulation patterns using a singular value decomposition analysis (SVD, von Storch and Navarra, 1995; Bjornsson and Venegas, 1997). The SVD analysis captures the coupling of the daily Qnet fields during the extremes and their corresponding (simultaneous) SLP fields on regional scale. The suitability and robustness of SVD for capturing potential couplings between two fields have been well documented in several previous studies (e.g. Wallace et al., 1992; Bjornsson and Venegas, 1997; Venegas et al., 1997). Similar to the EOFs, the patterns for each field are presented as homogeneous correlation maps. The strength of the coupling between two fields for each mode is reflected by the coupling correlation coefficient r between the expansion coefficients of each field. Since the SVD analysis was applied on unevenly distributed episodic events with a high-frequency time scale (daily values), the coupling correlations are expected to be lower than those that may result when SVD analysis is applied to a continuous low-frequency (e.g., monthly) time series (see Venegas et al., 1997). EOF and SVD analyses are commonly applied to time series of scalar properties at multiple locations; therefore, their input is practically a set of maps obtained at given time intervals. However, EOF and SVD can identify the spatial patterns of scalar variables, even for a time series of snapshots available at irregular time intervals. This is the case for the extreme heat loss events in this study that are unevenly distributed in the time domain. More details concerning the mathematical background of the EOF and SVD analyses can be found in von Storch and Navarra (1995) and Hannachi et al. (2006; 2007). We present case studies for each SVD mode, emphasizing the effectiveness of the regional reanalysis product at capturing details of the spatial heat loss characteristics. We also use the high-resolution wind data to underscore the role of complex regional topography and interpret its influence on the structures of the extreme heat loss patterns in the NRS.
3 Extreme heat loss characteristics
3.1 Winter climatology and extreme event statistics
The Qnet climatology in the NRS during the winter months (December, January, and February (DJF)) based on the daily mean values for the period 1980–2019 is shown in Figure 2. As expected, during winter, heat loss occurs over the entire NRS. Its intensity is maximum in December, when the surface water is still warm and the difference between the air and sea temperatures is higher. Meanwhile, weaker heat losses are noticeable in February. Despite the differences in the heat loss intensity, similar spatial patterns are observed during the three months, distinguishing areas of higher and lower energy transfer to the atmosphere. The winter months show heat loss maxima over the central and southern parts of the Gulf of Aqaba and along the western coastline of the open NRS. Using the term “open NRS” throughout the text, we refer to the study area excluding the gulfs of Aqaba and Suez. Because the winter air–sea heat exchange in the region is primarily governed by Qturb (Genin et al., 1995; Ben-Sasson et al., 2009; PEA13; Abualnaja et al., 2015; Menezes et al., 2019), the wind speed is higher and/or the specific air humidity is lower at these spots of the most intense heat loss compared to the rest of the NRS. Likewise, weaker heat loss in the area south of the Sinai Peninsula and the eastern open NRS reflects lower wind speeds over these areas (see Section 4.2).
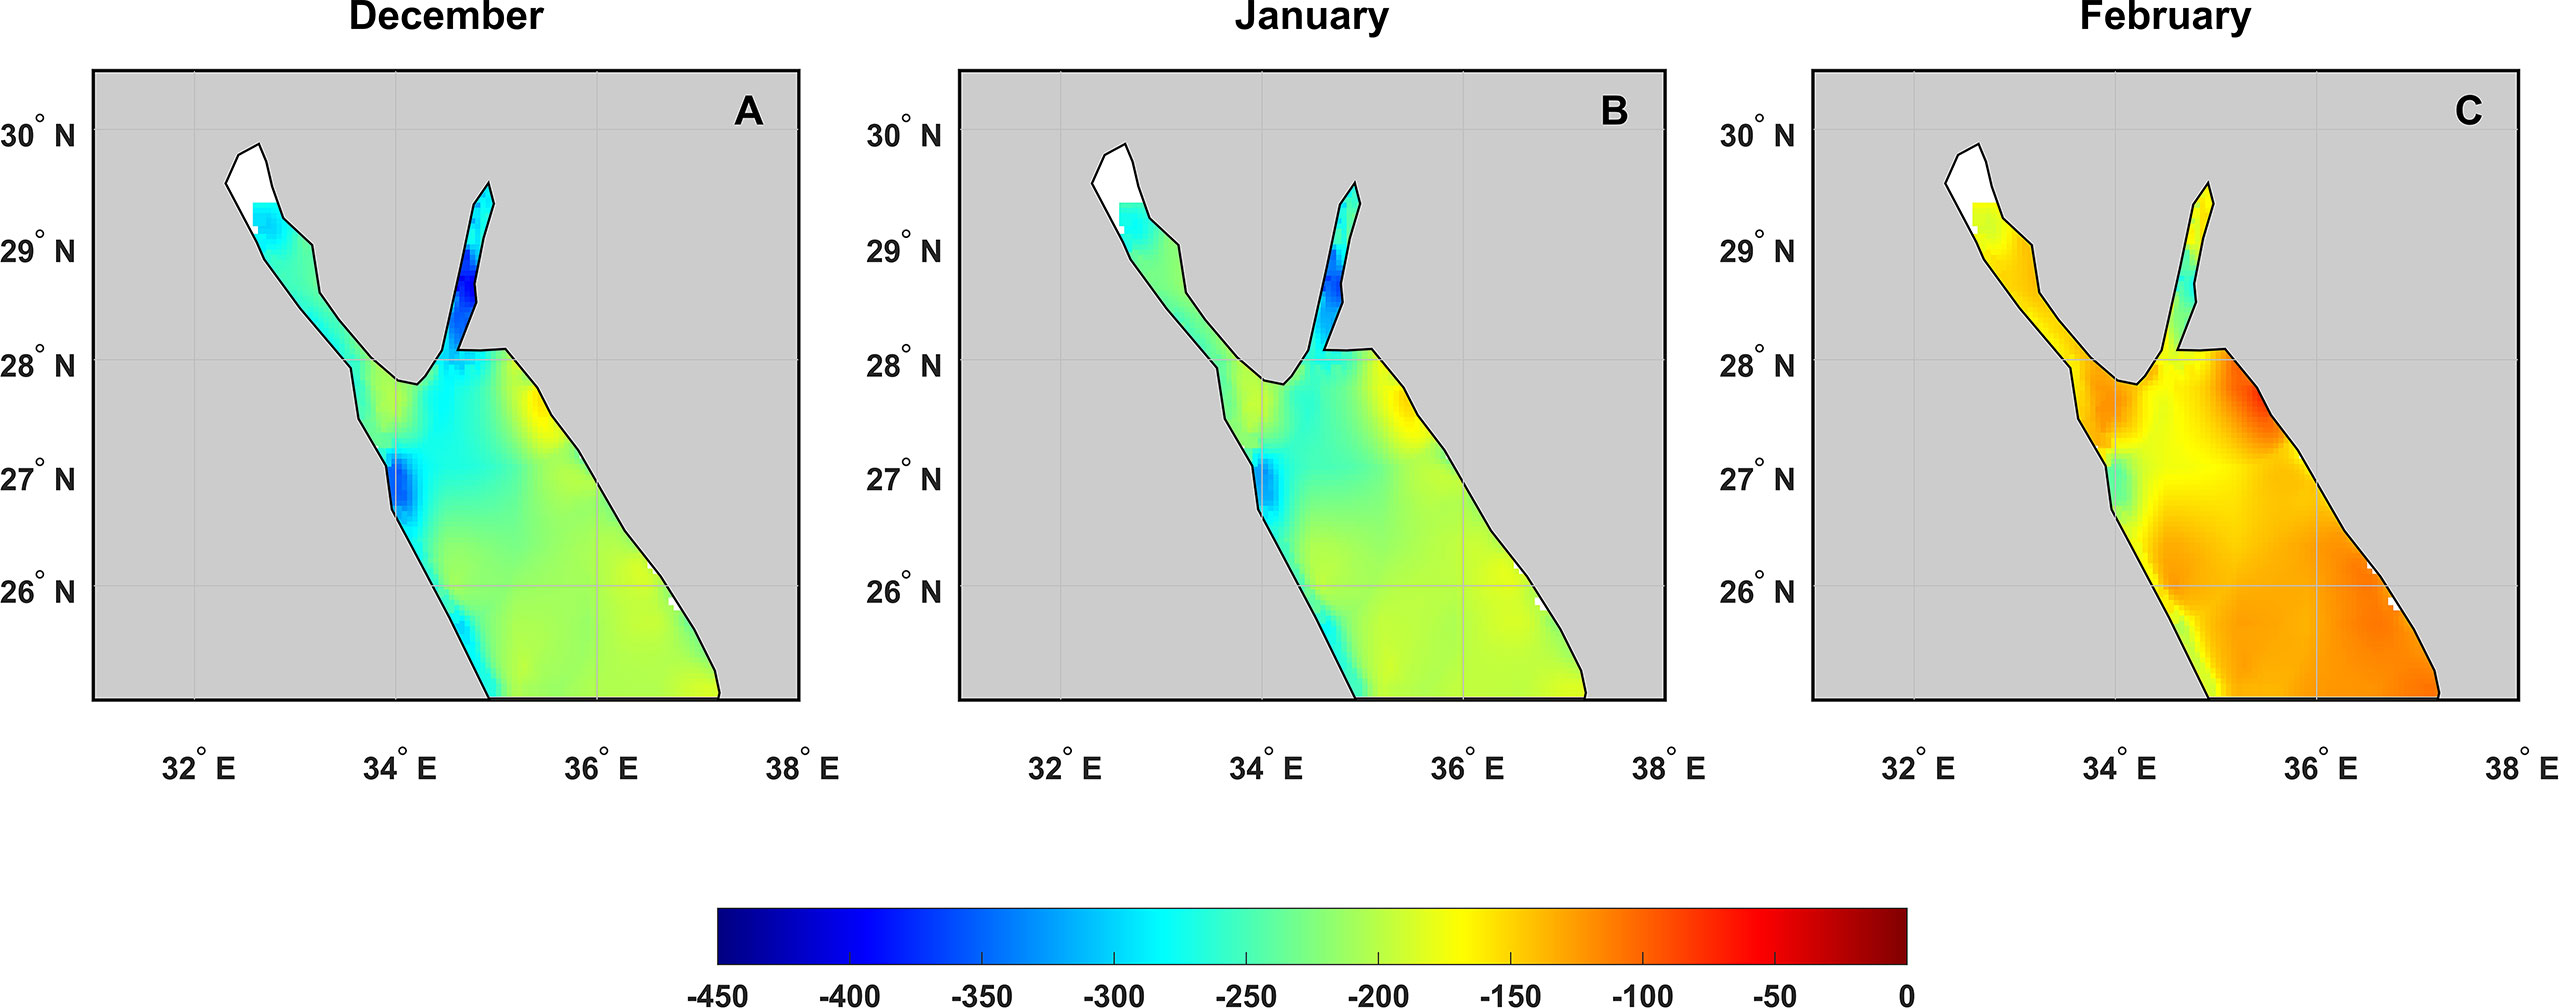
Figure 2 Net heat flux (W/m2) December (A), January (B), and February (C) in the NRS.
Composite Qnet daily values representative of the entire NRS show a consistent intra-annual, seasonal oscillation throughout the examined period (Figure 3A), with expected periodic positive and negative peaks every summer and winter, respectively. However, this seasonal oscillation, typical for the region, is asymmetric as positive and negative phases exhibit divergent shapes. It shows interannual consistency during the warm period of the annual cycle, peaking at values of approximately 200 W/m2 every year. In contrast, winters show much higher variability with frequent plunges to values lower than −400 W/m2. Known cold outbreaks in the region, such as those in 1983, 1992, 1993, and 2004 (PEA13, Yao and Hoteit, 2018), are well depicted by an increased number of plunges in the composite Qnet during these particular winters. The red line in the same diagram represents the value of −257.3 W/m2, which is the upper threshold of the tenth percentile of the lowest daily Qnet values. For 1443 days out of the total of 14,425 considered in this study, the mean Qnet over the NRS is below this threshold; these days are considered as days of extreme heat loss. The distribution of their occurrence within the annual cycle shows that they appear between October and April and most frequently during December and January (Figure 3B).
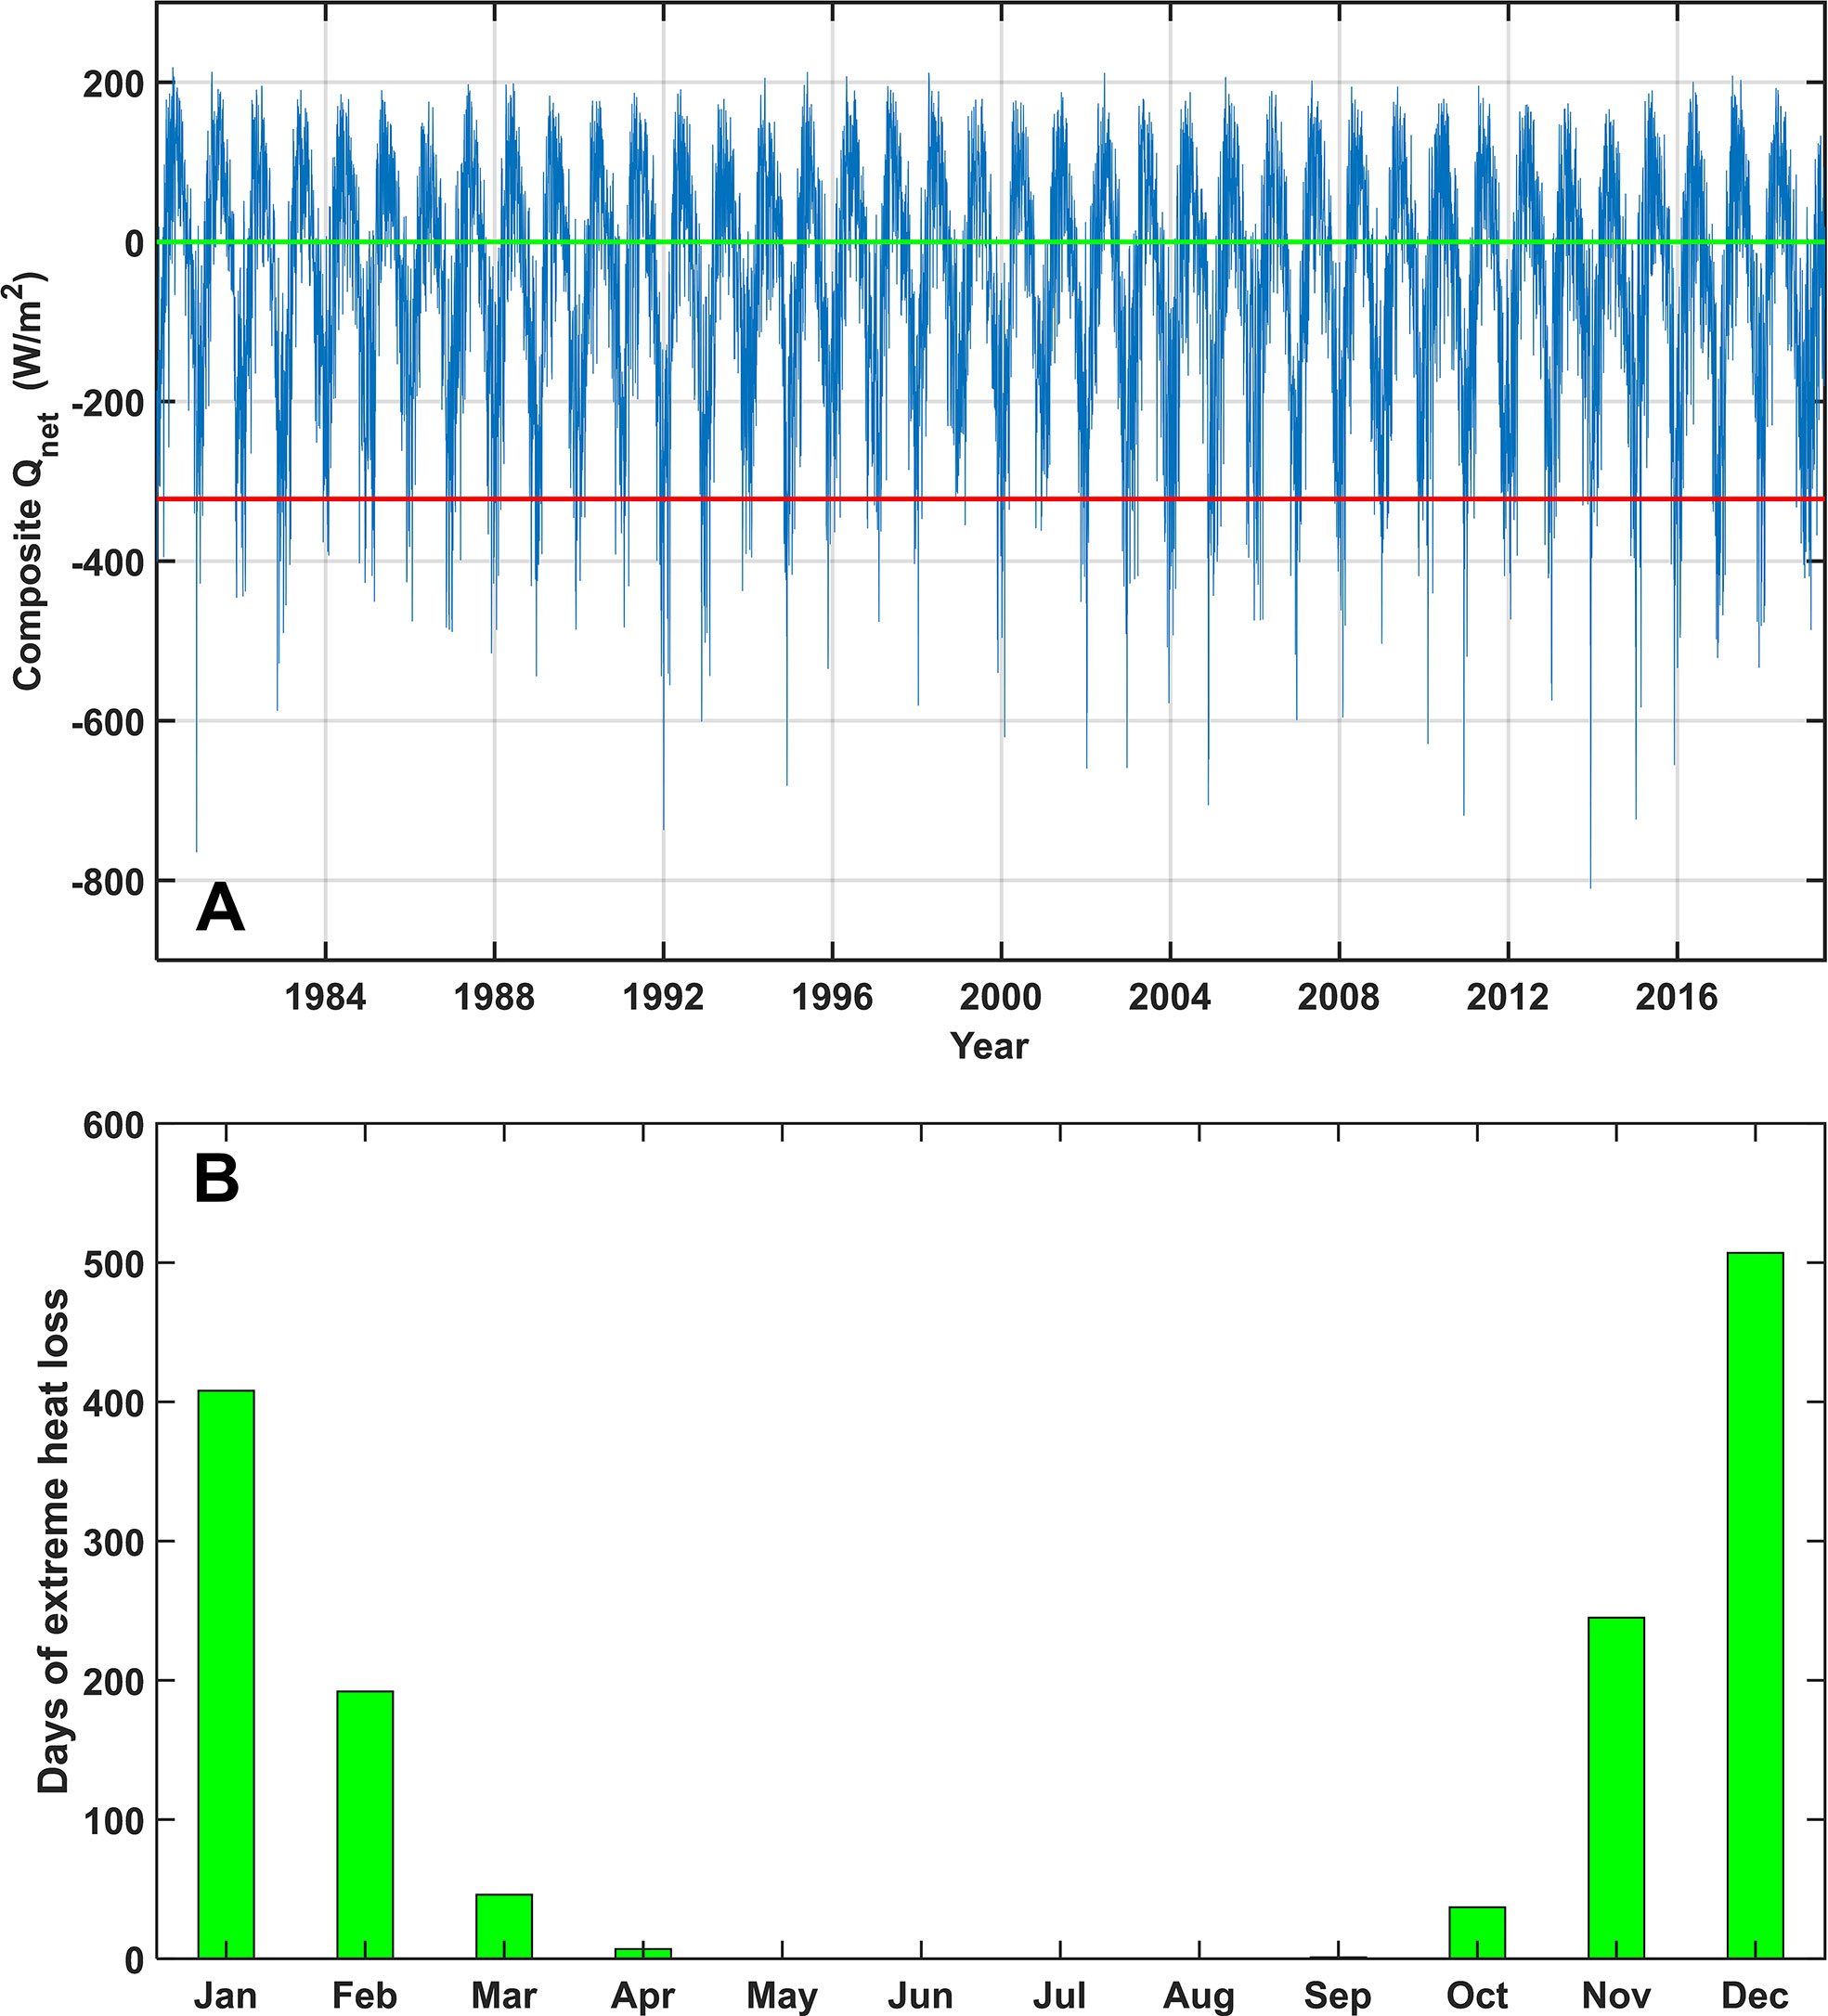
Figure 3 Composite NRS Qnet time plot (A) and number of days of extreme heat loss in the NRS in each month of the year (B). In the upper panel, the green line is the zero line and the red line corresponds to the lowest tenth percentile threshold value.
The spatial distribution of the mean Qnet values, averaged for the 1443 days falling within the tenth percentile of the most intense heat loss, shows a similar pattern to the DJF climatology (Figure 4A). Mean values lower than −500 W/m2 are found over the central and southern parts of the Gulf of Aqaba and along the western coastline of the open NRS. Again, the sea areas south of the Sinai Peninsula and along the eastern coastline exhibit less intense heat loss. Of particular interest is the spatial distribution of the standard deviation of the extreme events (Figure 4B). In general, the NRS presents a smooth field of low Qnet variability during the extreme events. However, small areas at the southern part of the Gulf of Aqaba, around the Sinai Peninsula, and at several spots along the eastern coastline of the open NRS, show much higher standard deviations, indicating higher variability in the heat loss. These are areas where the wind field also varies significantly, depending on the regional atmospheric circulation patterns (see Section 4.3).
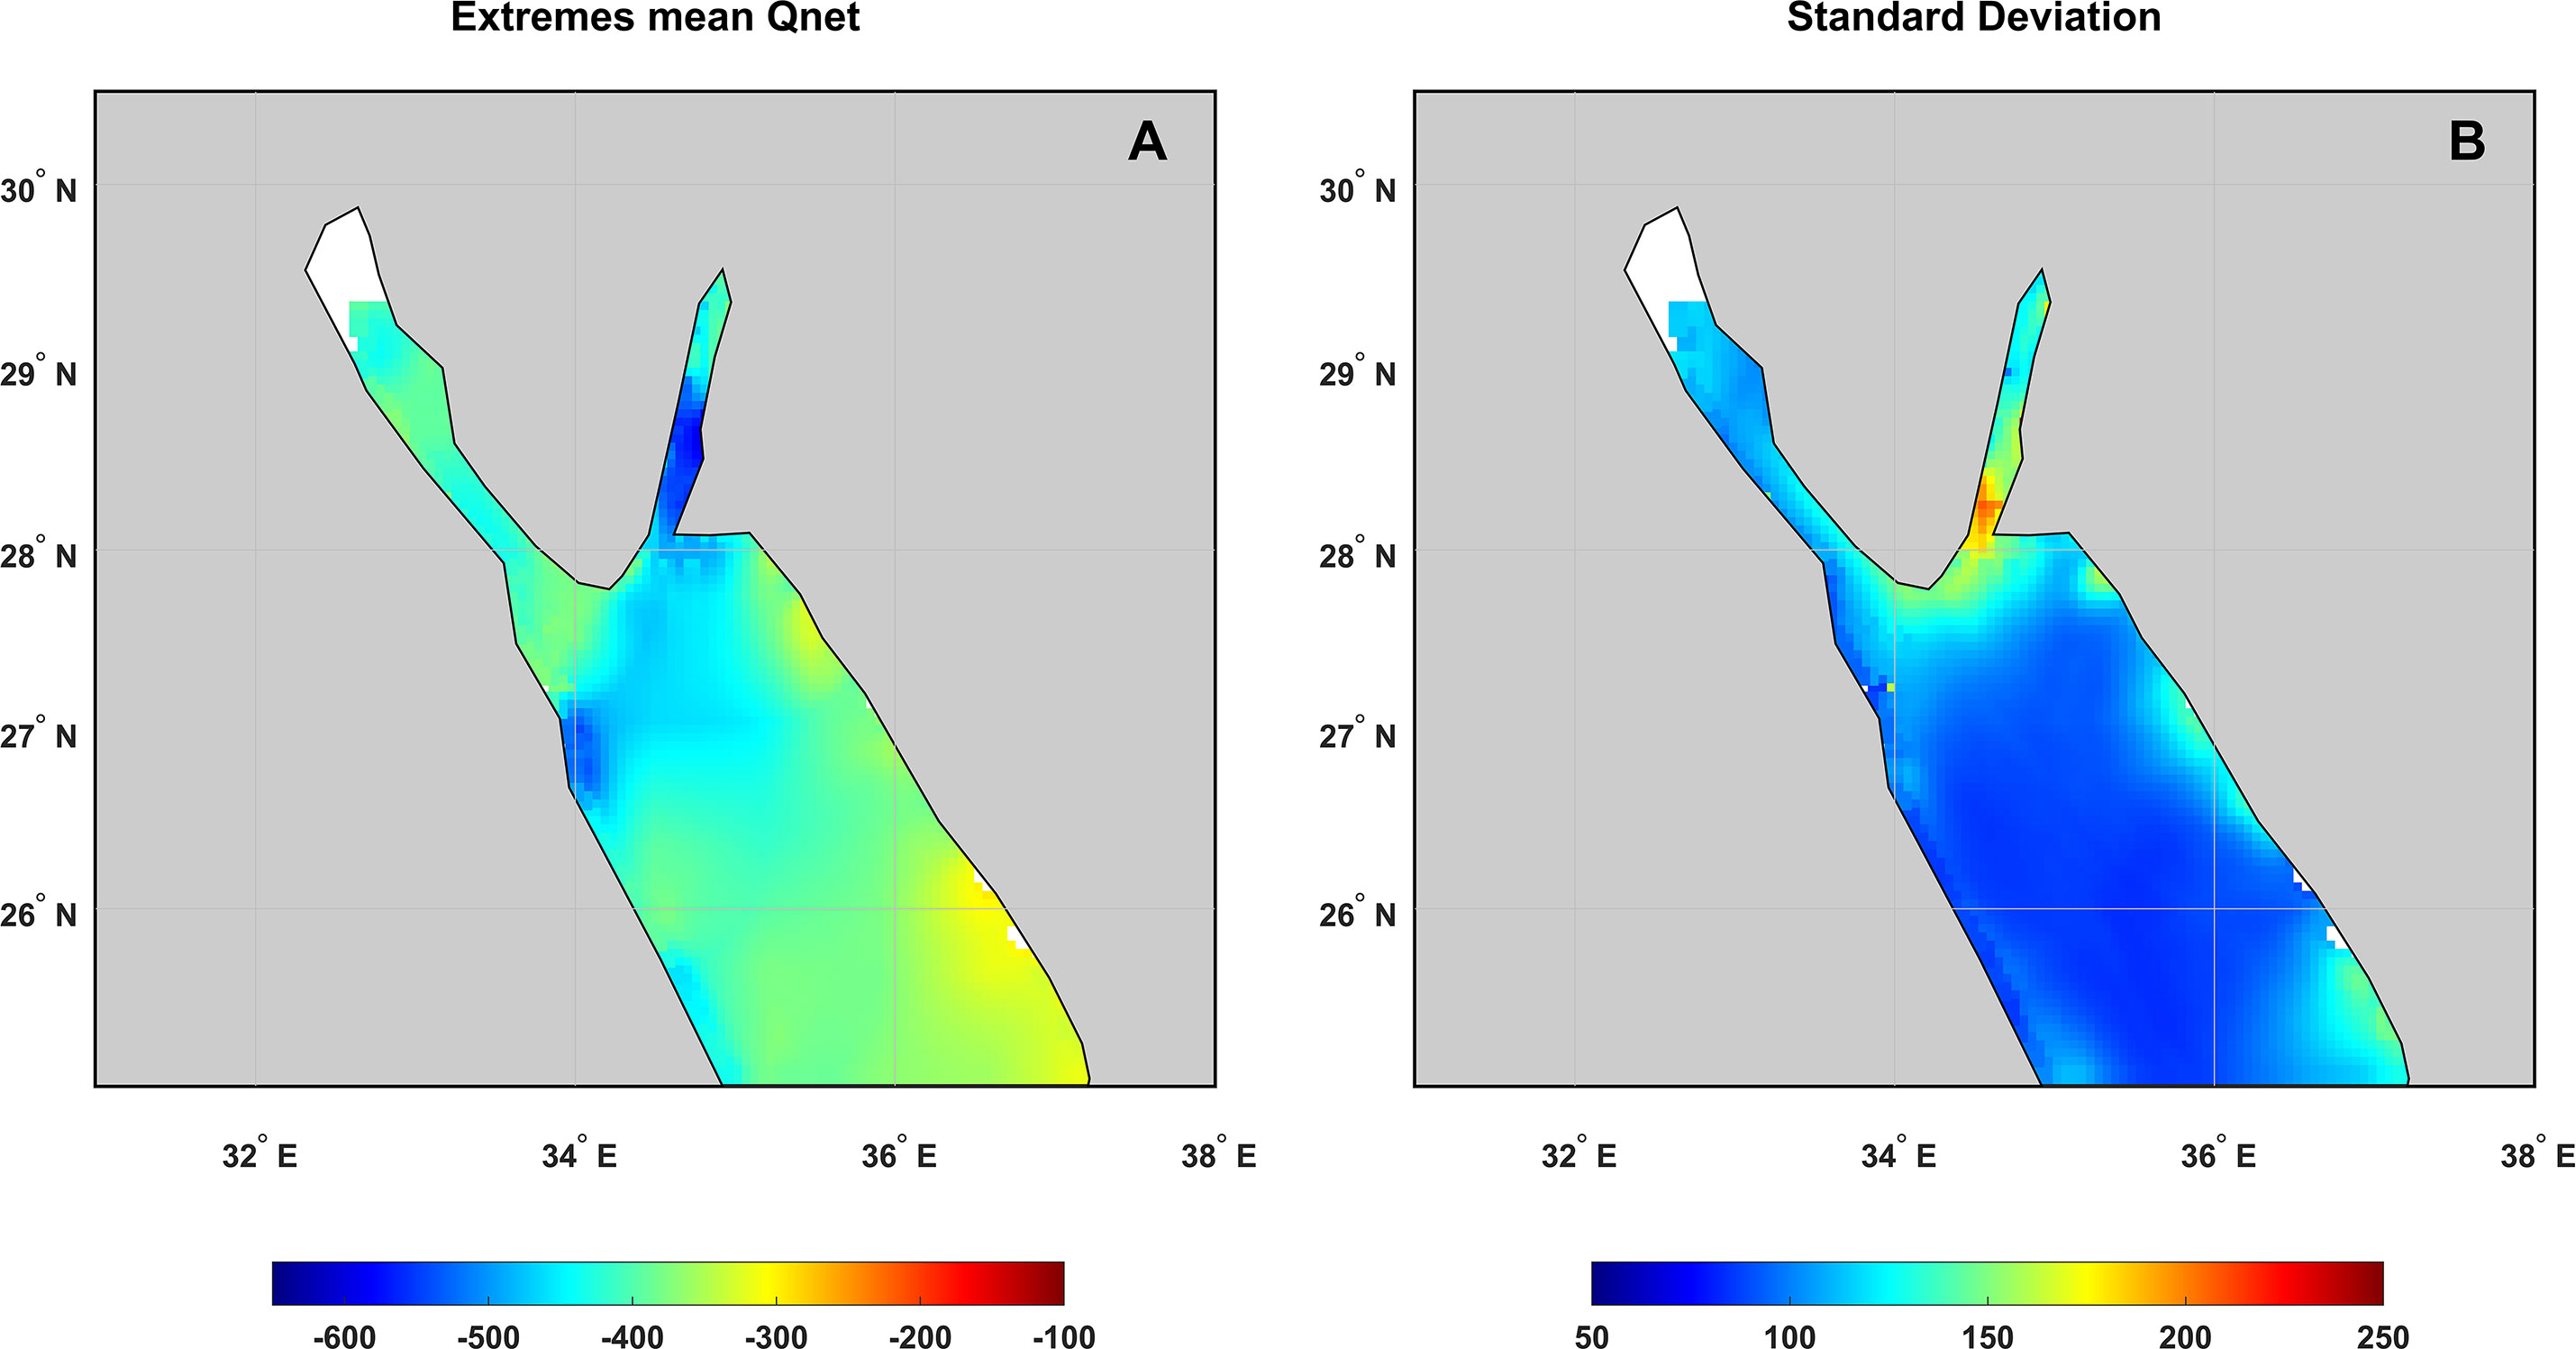
Figure 4 Mean Qnet (W/m2) spatial distribution during the extreme events (A) and their standard deviation (B).
3.2 Extremes seasonal evolution
Figure 5 shows the mean Qnet of the extremes for November (A), December (B), January (C), and February (D). Although the averaged values over the entire NRS for each month show a relatively narrow range between -337 W/m2 (February) and -348 W/m2 (December), the spatial distribution exhibits different characteristics for each month. The southern half of the Gulf of Aqaba and the northwest part of the open NRS present the strongest heat loss during all three months, yet the heat loss intensity decreases from November to February at both areas. Consistently, the western side of the NRS shows higher heat loss during the extremes compared to the eastern side and this contrast is more striking during November and December. Extreme heat loss in January and February exhibits a spreading of cooling towards the southern parts of the NRS. This reflects the ability of the cold outbreaks to reach further to the south during these months as the northern parts of the NRS have become colder and cannot reduce dramatically the temperature of the air masses moving southward. The shallow Gulf of Suez, due to its limited heat capacity, reacts rapidly to the atmospheric forcing and thus, lower temperatures are established much earlier than the rest of the NRS. Therefore, its interaction with the atmosphere due to the reduced air-sea temperature difference is limited and results in a gradual decrease of heat loss intensity from November to February.
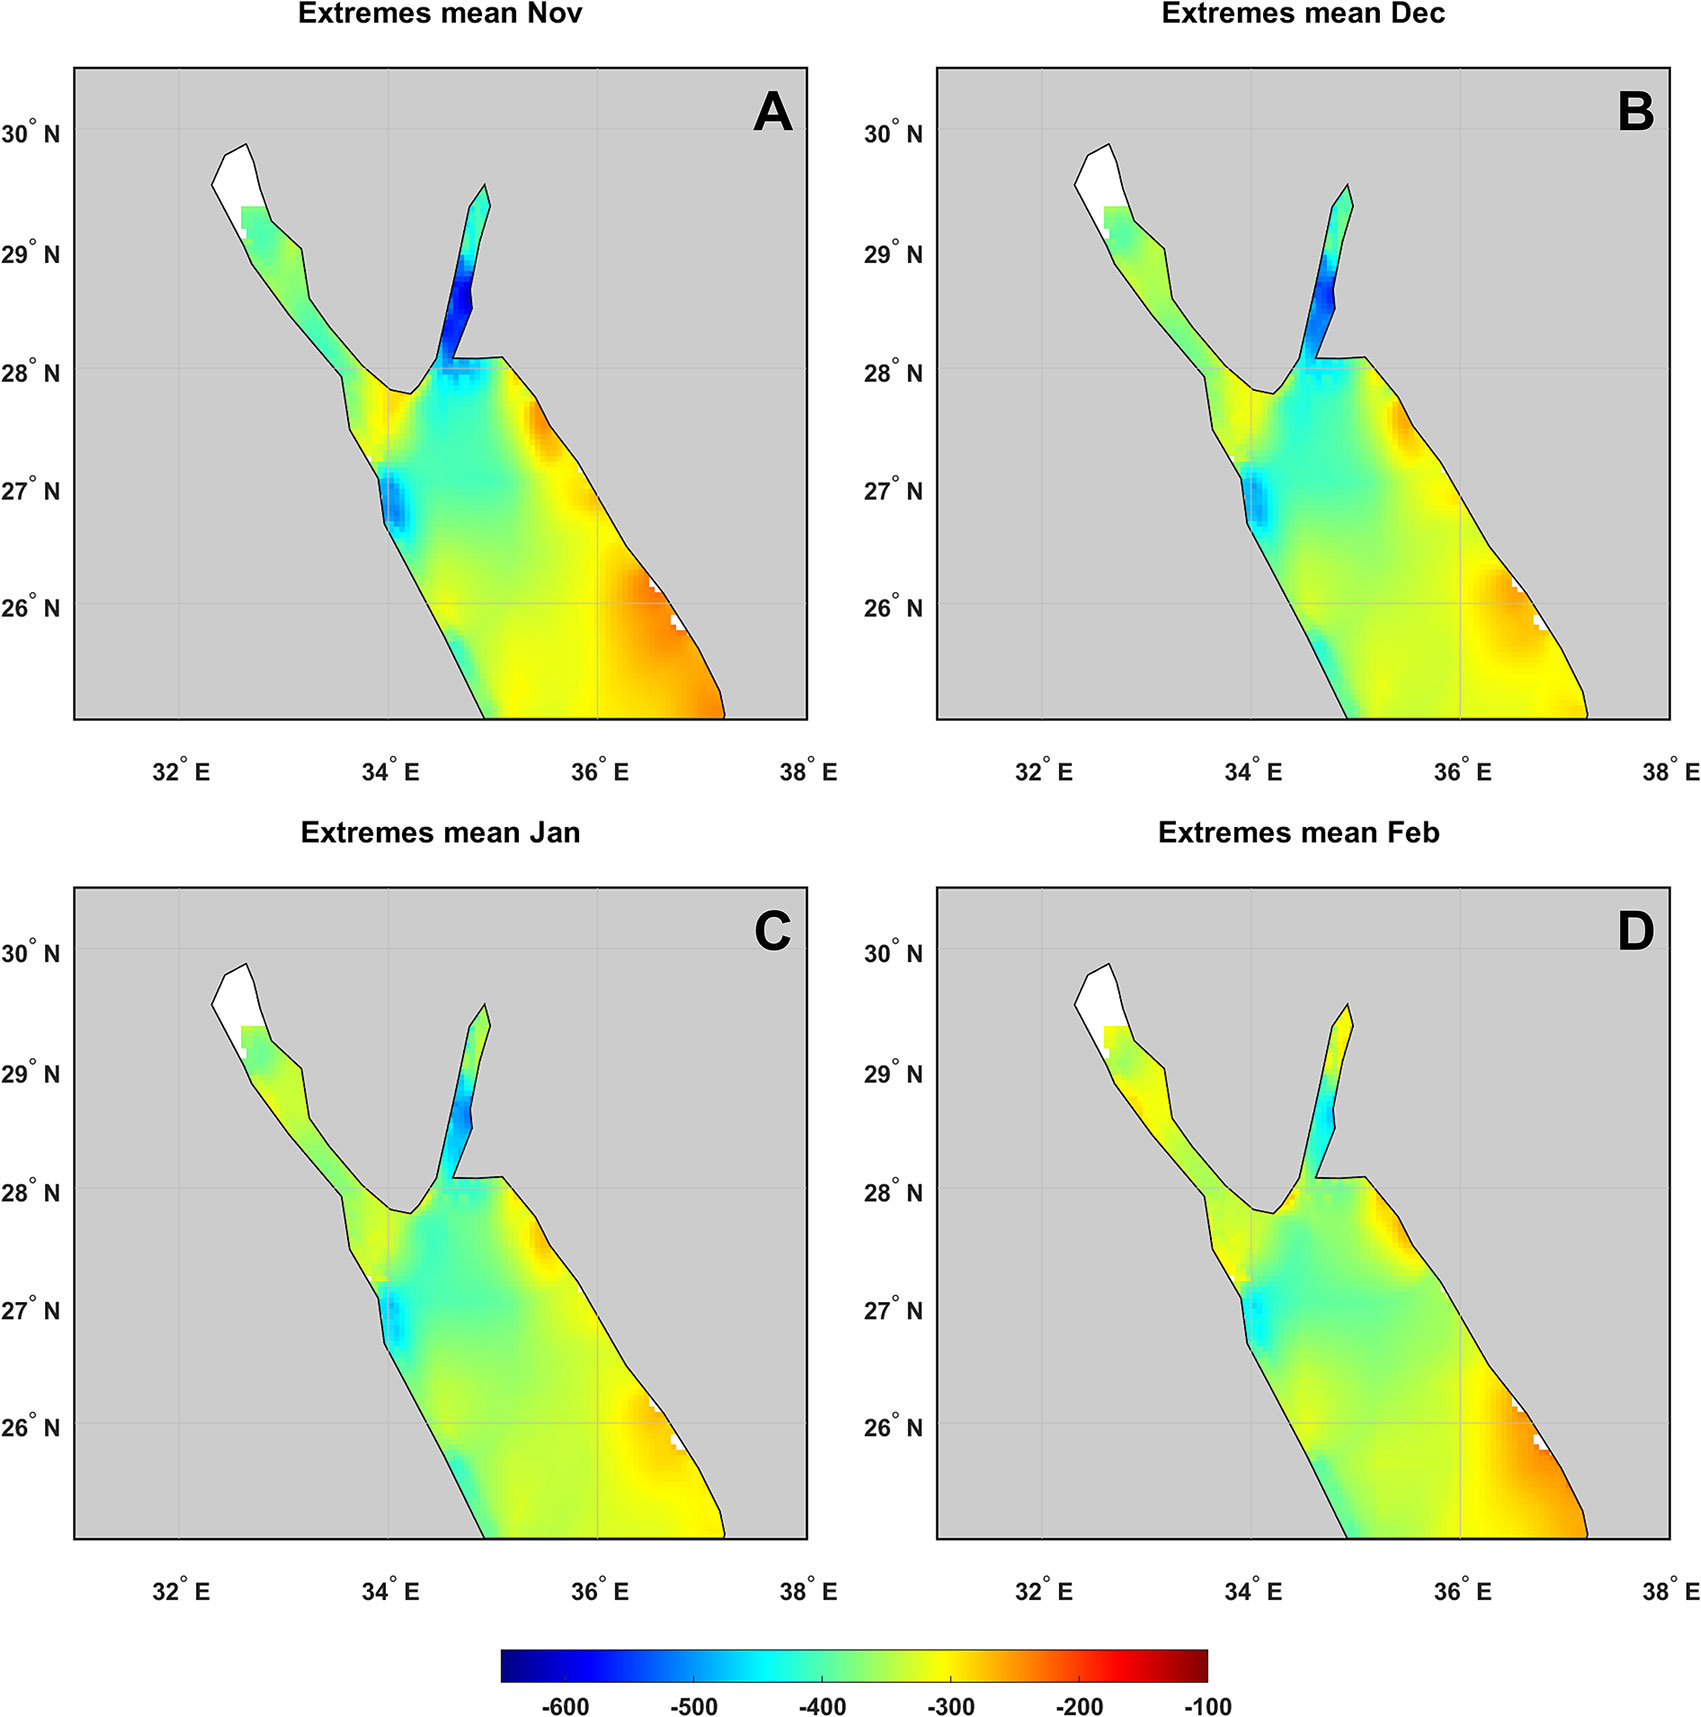
Figure 5 Mean Qnet (W/m2) spatial distribution of the extreme events for November (A), December (B), January (C), and February (D)
The spatial characteristics of the winter (NDJF) extremes reflect some important climatic features of the NRS during the winter cooling development. Onset of cold outbreaks affects mostly the two gulfs and the northwest part of the open NRS. This manifests that the majority of the events must be associated with southward advance of cold air masses from the neighboring Mediterranean Sea. As the winter advances, extreme heat loss spreads southward and occurs over a larger part of the open NRS. However, bands of extreme cooling are also evident, especially during January and February along the eastern part of the NRS, suggesting a different cooling pattern through a different route of cold and/or dry air masses that reach the broader area. The EOF analysis of the extremes will shed light on the patterns of the extreme heat loss over the NRS, as presented in the next section.
3.3 EOF analysis of the extremes
An EOF analysis of the 1443 days of intense heat loss over the NRS reveals three main patterns (Figures 6A–C), which together account for 82.5% of the total variance. The first predominant pattern accounts for 63.4% of the total variance. This monopole pattern extends nearly uniformly over the entire study area, but is more intense over the open NRS, suggesting that under this mode cold outbursts occur simultaneously everywhere in the region. The next two EOFs account for 11.6% and 7.5% of the total variance during the extreme events, respectively, and exhibit bipolar patterns of opposite phases. In these modes, extreme heat loss is nonuniform and affects parts of the NRS in accordance with the wind field while other parts are less affected. The spatial characteristics of these EOFs (especially the third one) suggest a cross-axis wind field transferring dry air from arid areas over the sea and intensifying the heat loss via the turbulent components (Jiang et al., 2009; Menezes et al., 2018; Menezes et al., 2019). It should be mentioned here that the analysis was applied on days of episodically high heat loss; therefore, seesaw modes refer to intense and mild heat loss rather than to heat fluxes of opposite signs.
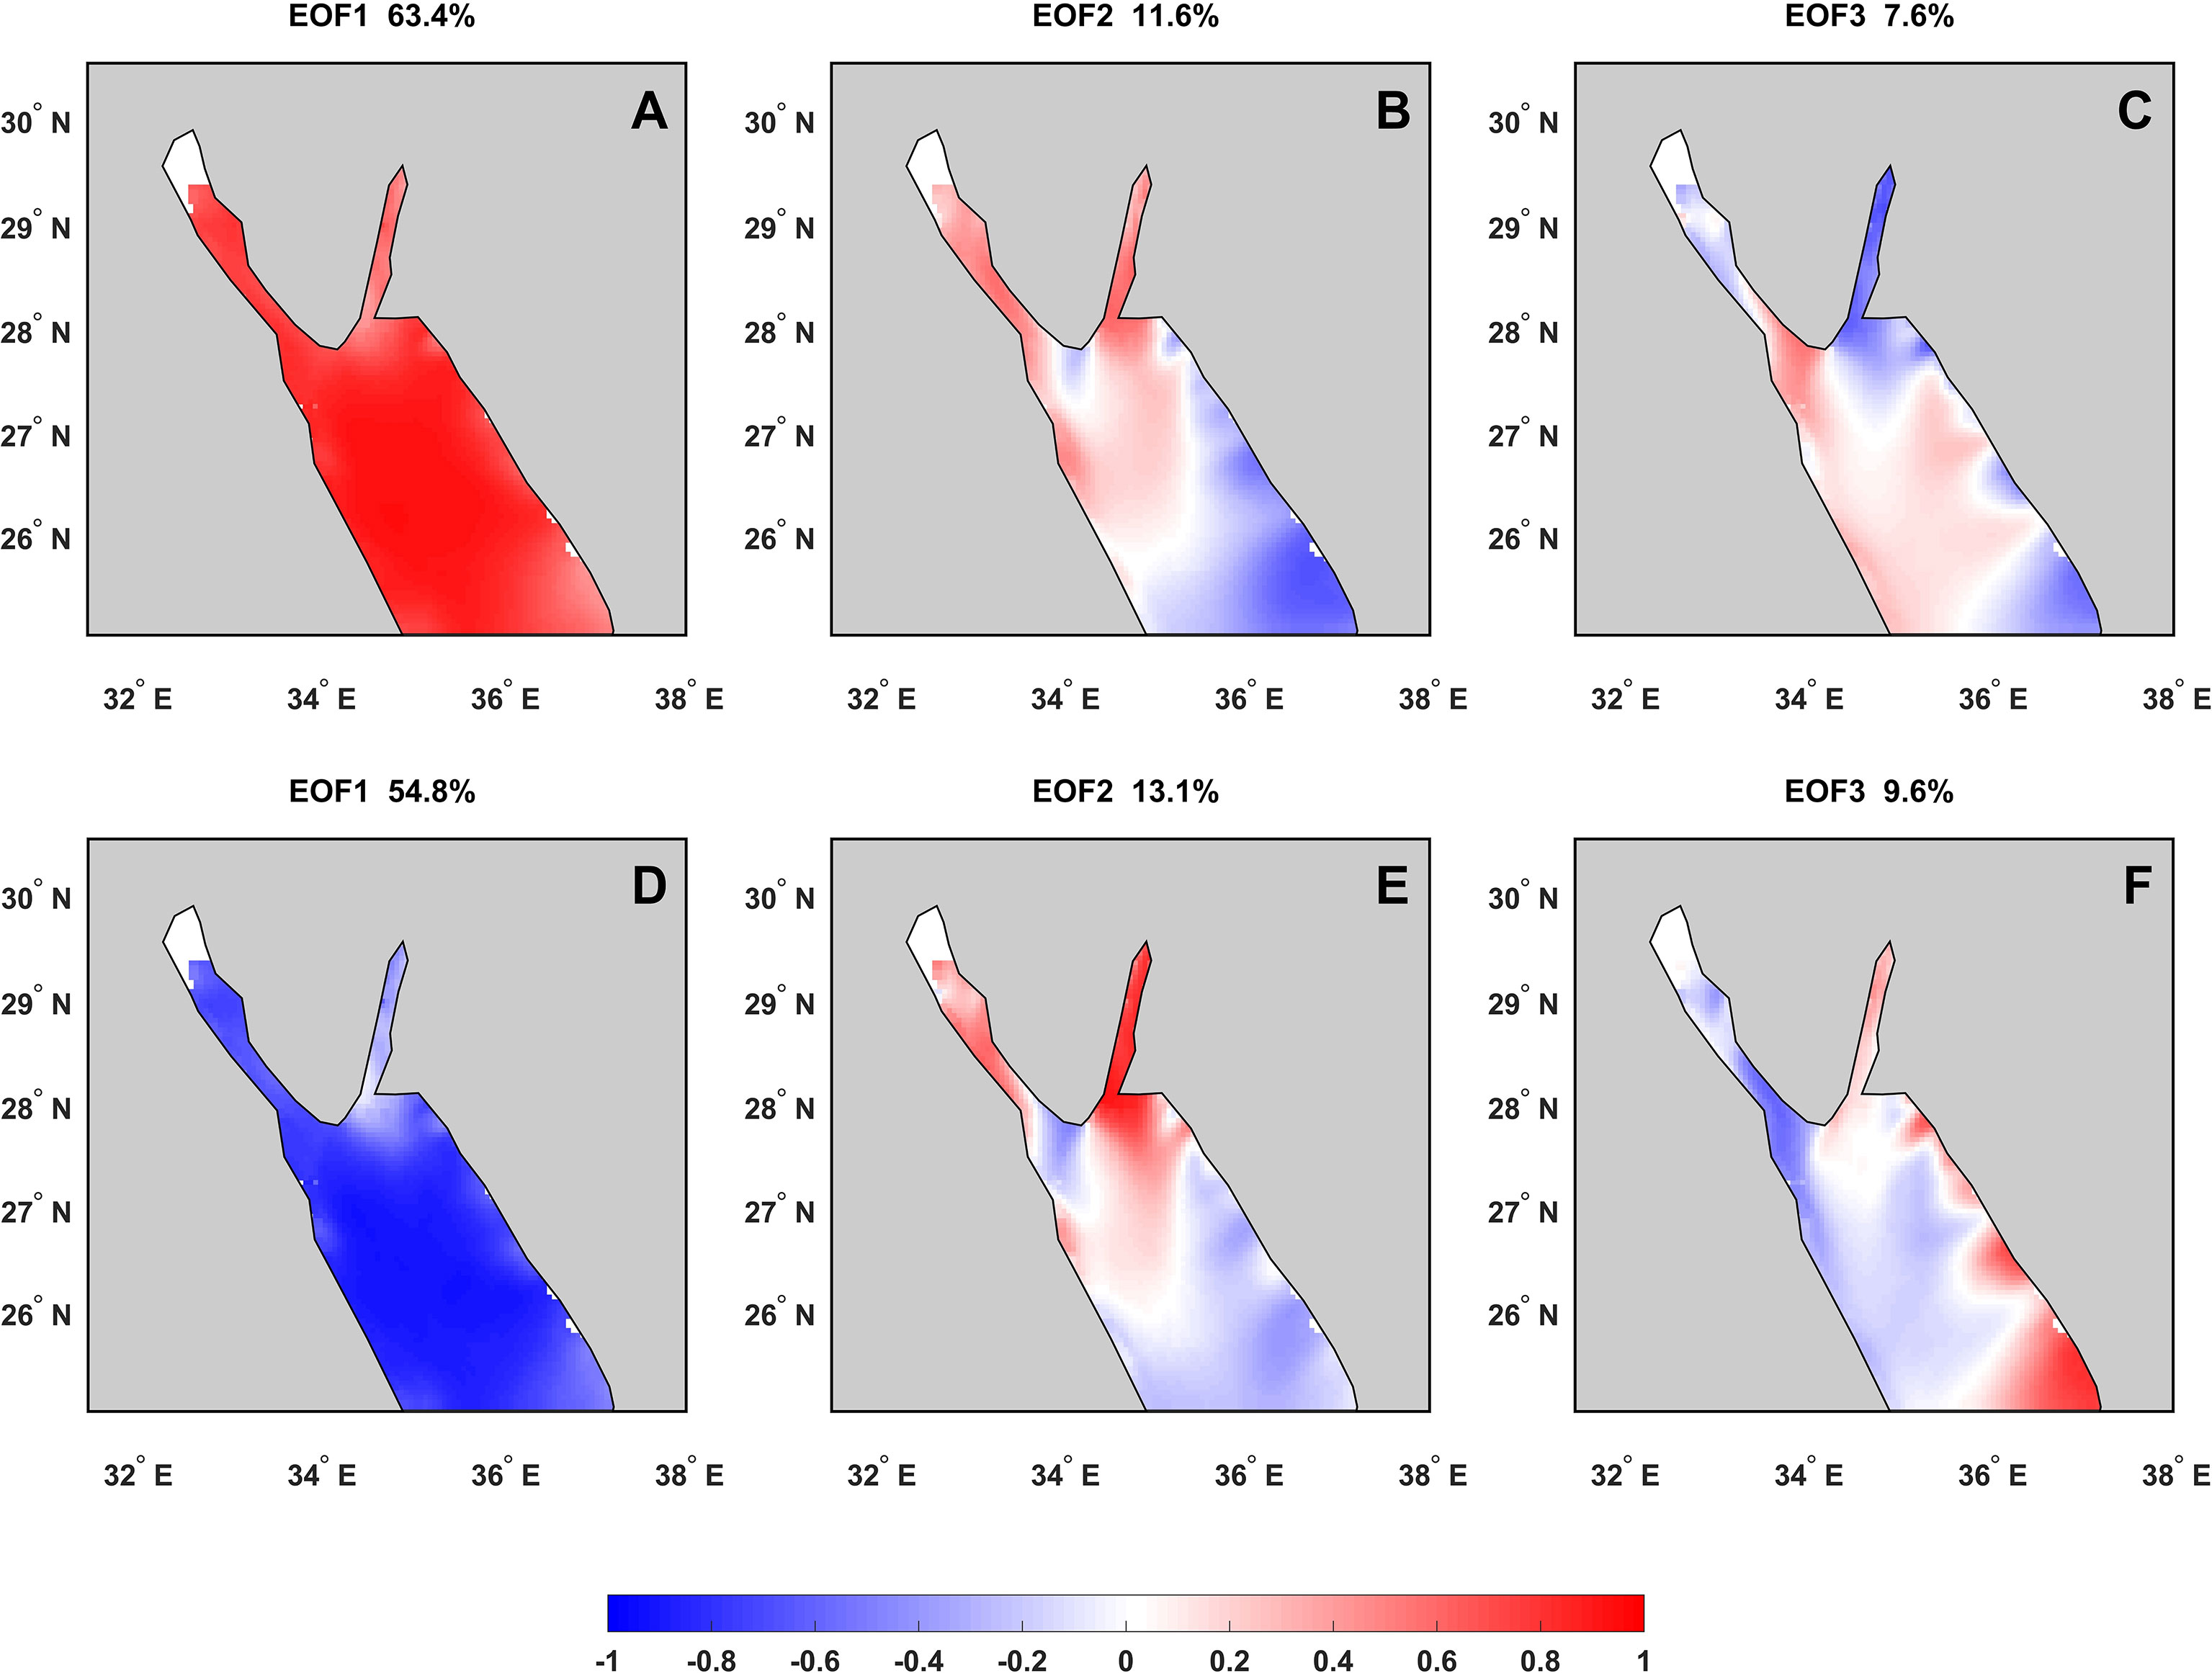
Figure 6 The first three EOF patterns for the 1443 days with Qnet values in the lowest tenth percentile (10%) of the time series presented as homogeneous correlation maps (A–C) and the same for the 289 days in the second percentile (2%, D–F).
Because the first EOF mode shows a uniform pattern and the two subsequent modes indicate extreme heat loss only over parts of the NRS, a reduction in the relative contribution of the second and third modes to the total variance would be expected for a smaller (narrower) percentile of Qnet. To assess the persistence and relative contribution of the leading modes obtained for the tenth percentile in even more intense heat loss events, we performed an EOF analysis by designating a lower threshold on Qnet. We considered only the second percentile (2%) of the lowest net heat flux values, which included 289 days with daily Qnet values lower than −390.58 W/m2. Quite similar patterns were obtained for the three leading EOF modes (Figures 6D–F) but with a small change in their contribution to the total variance. Interestingly, the first mode appears to have a considerably smaller contribution (54.8%), while the second and third modes increase their contributions (13.1% and 9.6%). The fractions of the explained mode variances suggest that, despite their regional impact, the second and third modes are important within the full range of heat loss events in the NRS.
4 Atmospheric forcing of extreme heat loss events
A preliminary investigation of the link between air–sea heat flux over the NRS and large-scale atmospheric circulation patterns can be found in PEA13. That study showed that turbulent heat flux minima occur when anticyclonic conditions prevail over the area extending from the Mediterranean Sea to eastern Asia coupled with a southward retreat of the equatorial African low system. However, because of the coarse resolution of the reanalysis product used by PEA13, the investigation of the potential link between the Qnet modes and specific atmospheric circulation patterns during the extreme events was practically not feasible. In the present study, taking advantage of the high-resolution reanalysis, we applied an SVD analysis to explore potential couplings between extreme heat loss and SLP on regional scale. The regional SLP patterns are representative of the atmospheric forcing as they govern the air masses distribution and the surface wind field, both factors regulating the air-sea heat flux over the NRS.
4.1 Extreme heat loss and associated atmospheric circulation
To examine probable links between extreme heat loss events in the NRS and atmospheric circulation patterns on regional scale, we applied an SVD analysis to the 1443 days that presented the most intense heat loss during the period 1980–2019. We investigated the potential links between extreme Qnet and SLP using the ERA-Interim reanalysis. The three leading SVD modes of the coupled variability account for more than 85% of the total square covariance (TSC) of the two fields. The Qnet pattern described using the first SVD mode (Figure 7A) is very similar to the pattern exhibited by the first EOF of Qnet. However, the coupled variability accounts for 53.7% of the total variability, remarkably less than the 63.2% accounted for by the first EOF for extreme Qnet. This lower fraction indicates that uniform cooling over the NRS can also occur under SLP patterns other than that described by the first SVD mode. This pattern associates uniform extreme heat loss over the NRS with higher SLP over the Mediterranean Sea and northeast Africa and lower SLP over southwest Asia and Middle East (Figure 7B). This combination appears to favor the transfer of colder air masses over the NRS and is similar to the general pattern of the SLP anomaly associated with strong heat loss described in PEA13 (see Figure 6A therein). The second SVD mode presents a Qnet pattern (Figure 7C) that resembles the third EOF mode of Qnet (Figure 6C). This mode accounts for 23.2% of the TSC and its characteristics are associated with a cross-axis wind pattern. It exhibits the strongest coupling correlation coefficient (r = 0.65), suggesting a strong link between the Qnet and SLP patterns. The second SVD mode indicates that cross-axis wind prevails when SLP is higher over the area covering the eastern Mediterranean Sea, Middle East, northeast Africa, and the Arabian Peninsula (Figure 7D). The third SVD mode accounts for 8.7% of the TSC and exhibits a Qnet pattern similar to the second Qnet EOF (Figure 7E). According to this SVD mode, strong heat loss (heat flux minima) in most of the NRS (except its southeastern part) is associated with higher SLP over higher latitudes with a southward protrusion over the Balkan Peninsula and eastern Mediterranean Sea (Figure 7F). In summary, the SVD analysis indicates that the dominant first mode transfers colder air masses from higher latitudes affecting the entire NRS. The associated SLP pattern suggests that the cold air reaches the NRS from the neighboring eastern Mediterranean Sea. The second and third modes are differentiated from the first mode in terms of the wind field (indirectly inferred by the Qnet associated patterns) and of the path by which air masses from higher latitudes reach the NRS. According to the associated SLP patterns for the second and third SVD modes, air masses are transferred over the NRS through the Middle East and the northern part of the Arabian Peninsula, bringing not only cold, but primarily dry air from arid/semiarid areas.
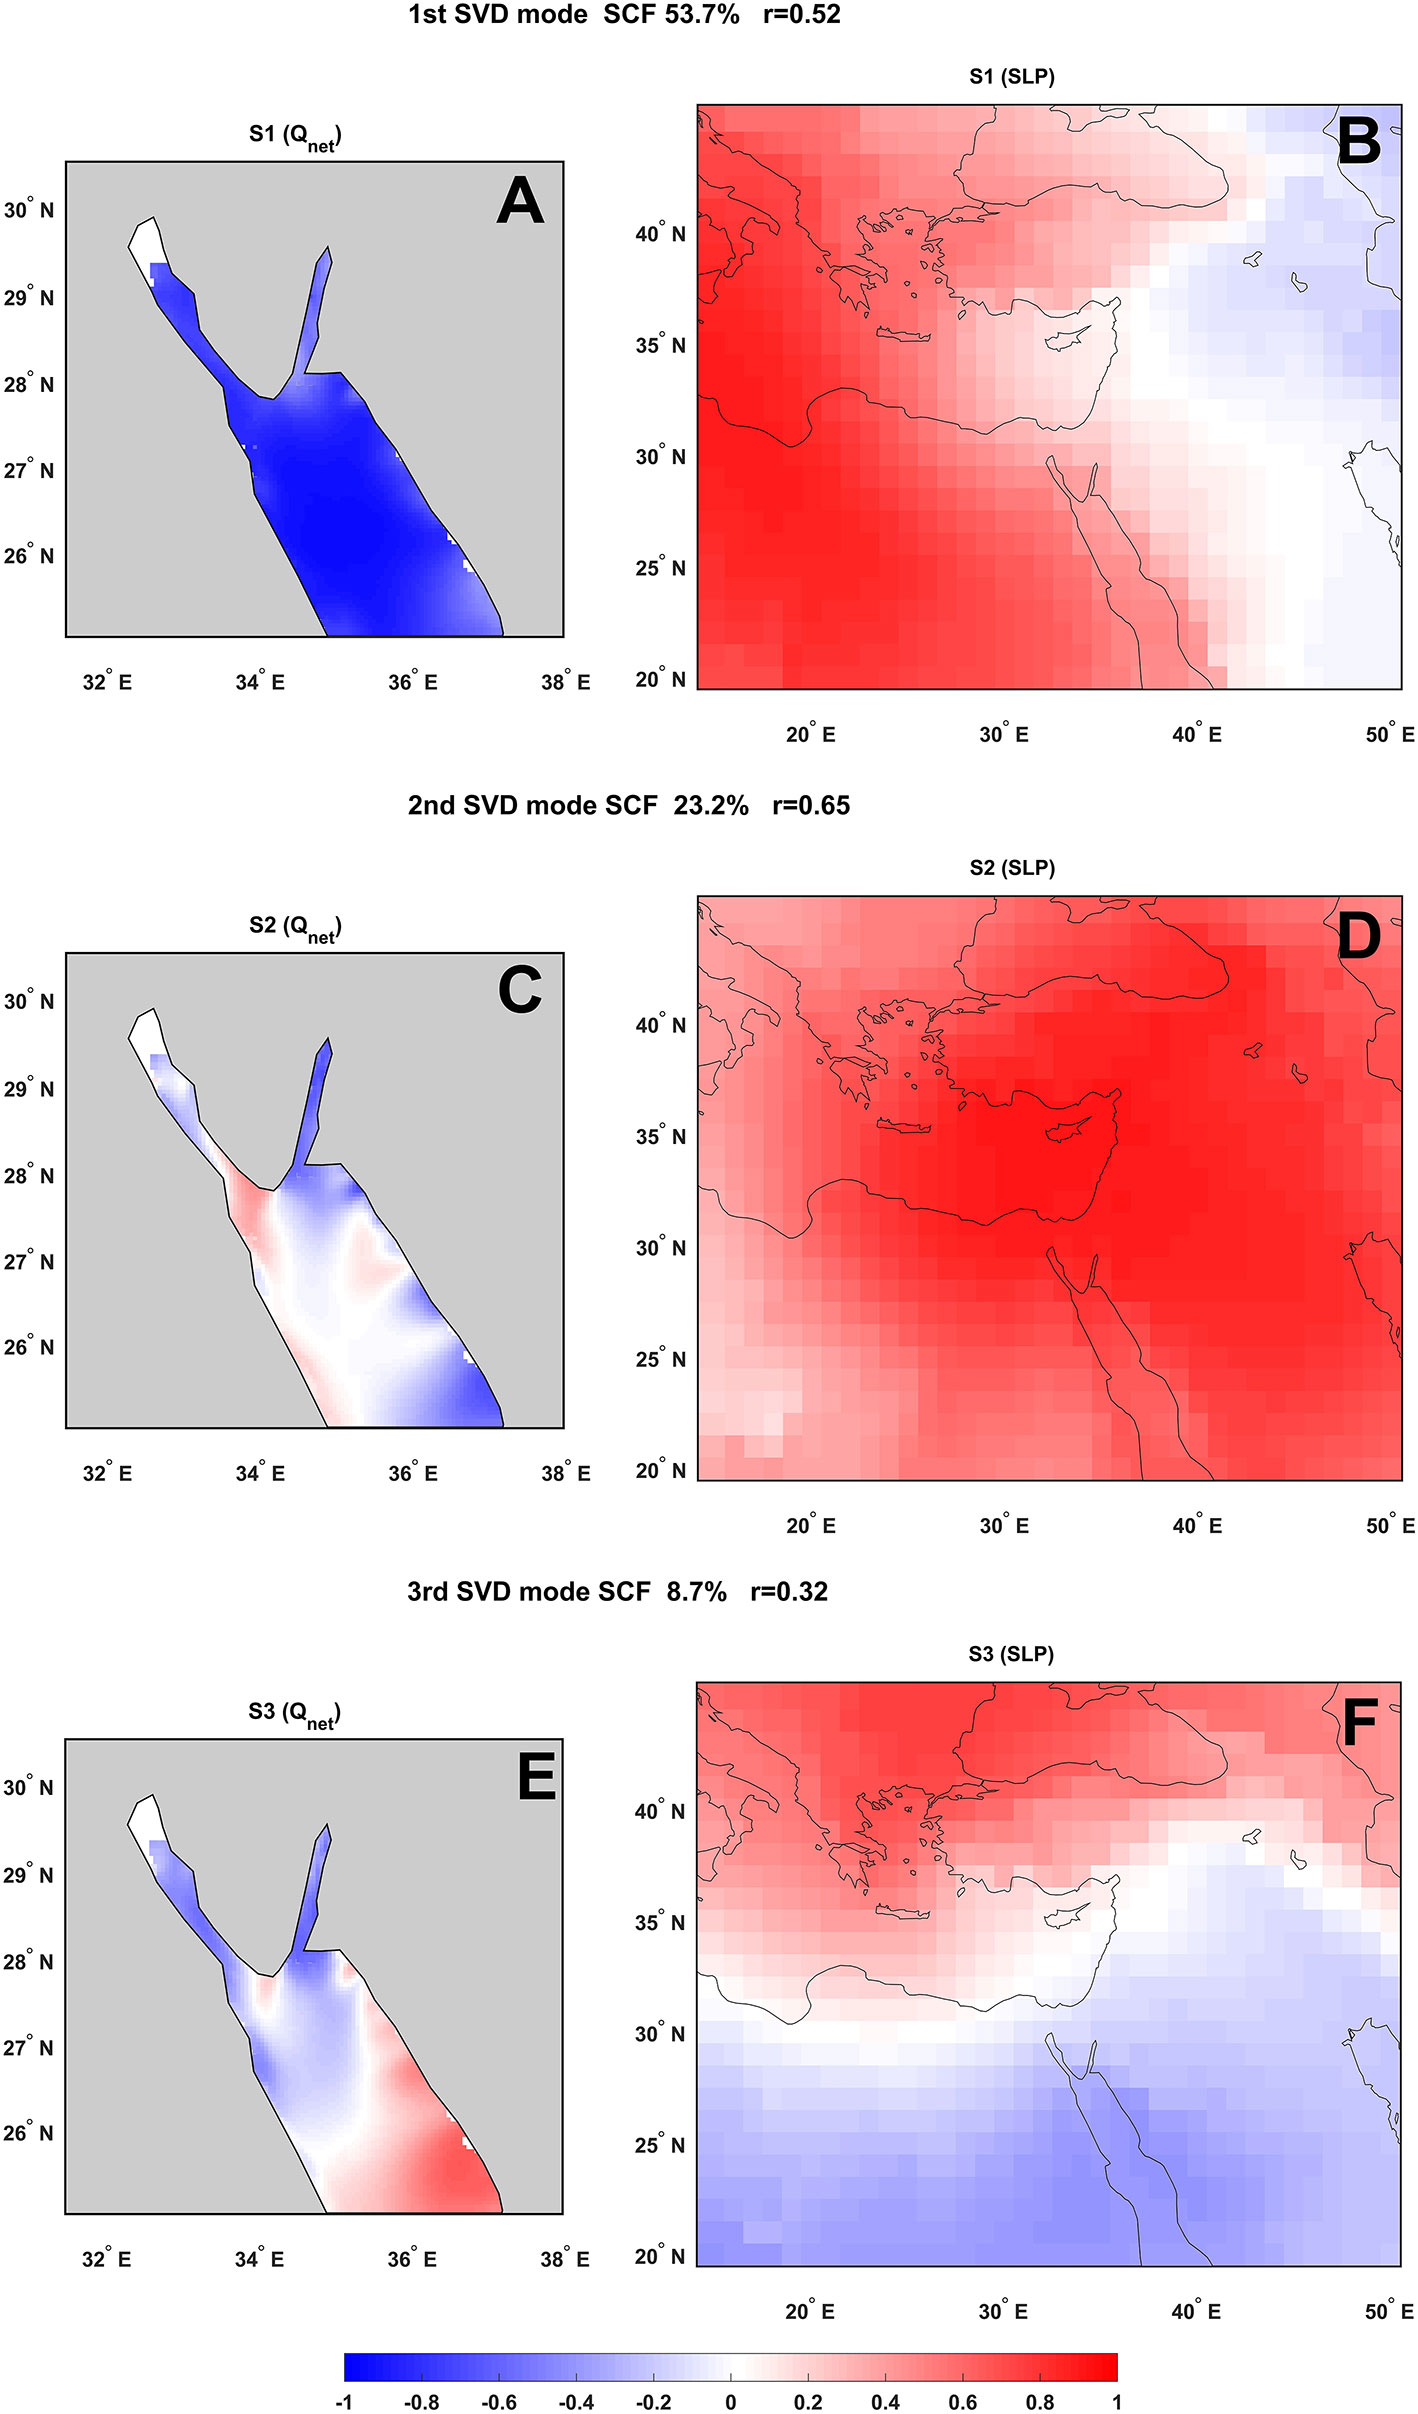
Figure 7 The three leading SVD modes of the coupled Qnet (A, C, E) and the regional SLP (B, D, F) from the ERA-Interim archive presented as homogeneous correlation maps. SCF is the fraction of the total squared covariance, and r is the coupling correlation coefficient between the expansion coefficients of both variables for each SVD mode.
4.2 Topographic modulations
The high-resolution regional reanalysis dataset provides sufficient information to reveal the characteristics of the extreme heat loss events in the NRS and the coupled atmospheric forcing. To highlight the regional features of the atmospheric circulation and the role of the complex topography in the region, we present here three cases that correspond to each of the modes detected by the SVD analysis. We selected three cases of roughly similar composite Qnet daily values averaged over the entire NRS.
The case corresponding to the first SVD mode occurred on December 27, 2016. The ERA-5 regional daily mean atmospheric circulation pattern and wind field (25-km resolution), as well as the daily mean Qnet and wind fields from the regional reanalysis, are shown in Figure 8. The regional SLP field (Figure 8A) appears to fit the pattern of the first SVD mode and exhibits a strong gradient across the NRS, resulting in a nearly uniform field of strong NW wind over the open NRS (Figure 8B). The strong, cold wind causes a widespread heat loss, especially in the open NRS (Figure 8C). However, wind lee areas that cannot be clearly discerned by the 25-km-resolution wind field are well displayed by the 5-km-resolution wind field (Figure 8D). The regional reanalysis shows that the topography effectively modulates the wind. The wind field is nonuniform and the wind vectors are steered to follow the peculiarities of the surrounding relief. In general, the wind field and the regional SLP structure suggest that the cold air masses reach the NRS from the neighboring Mediterranean Sea.
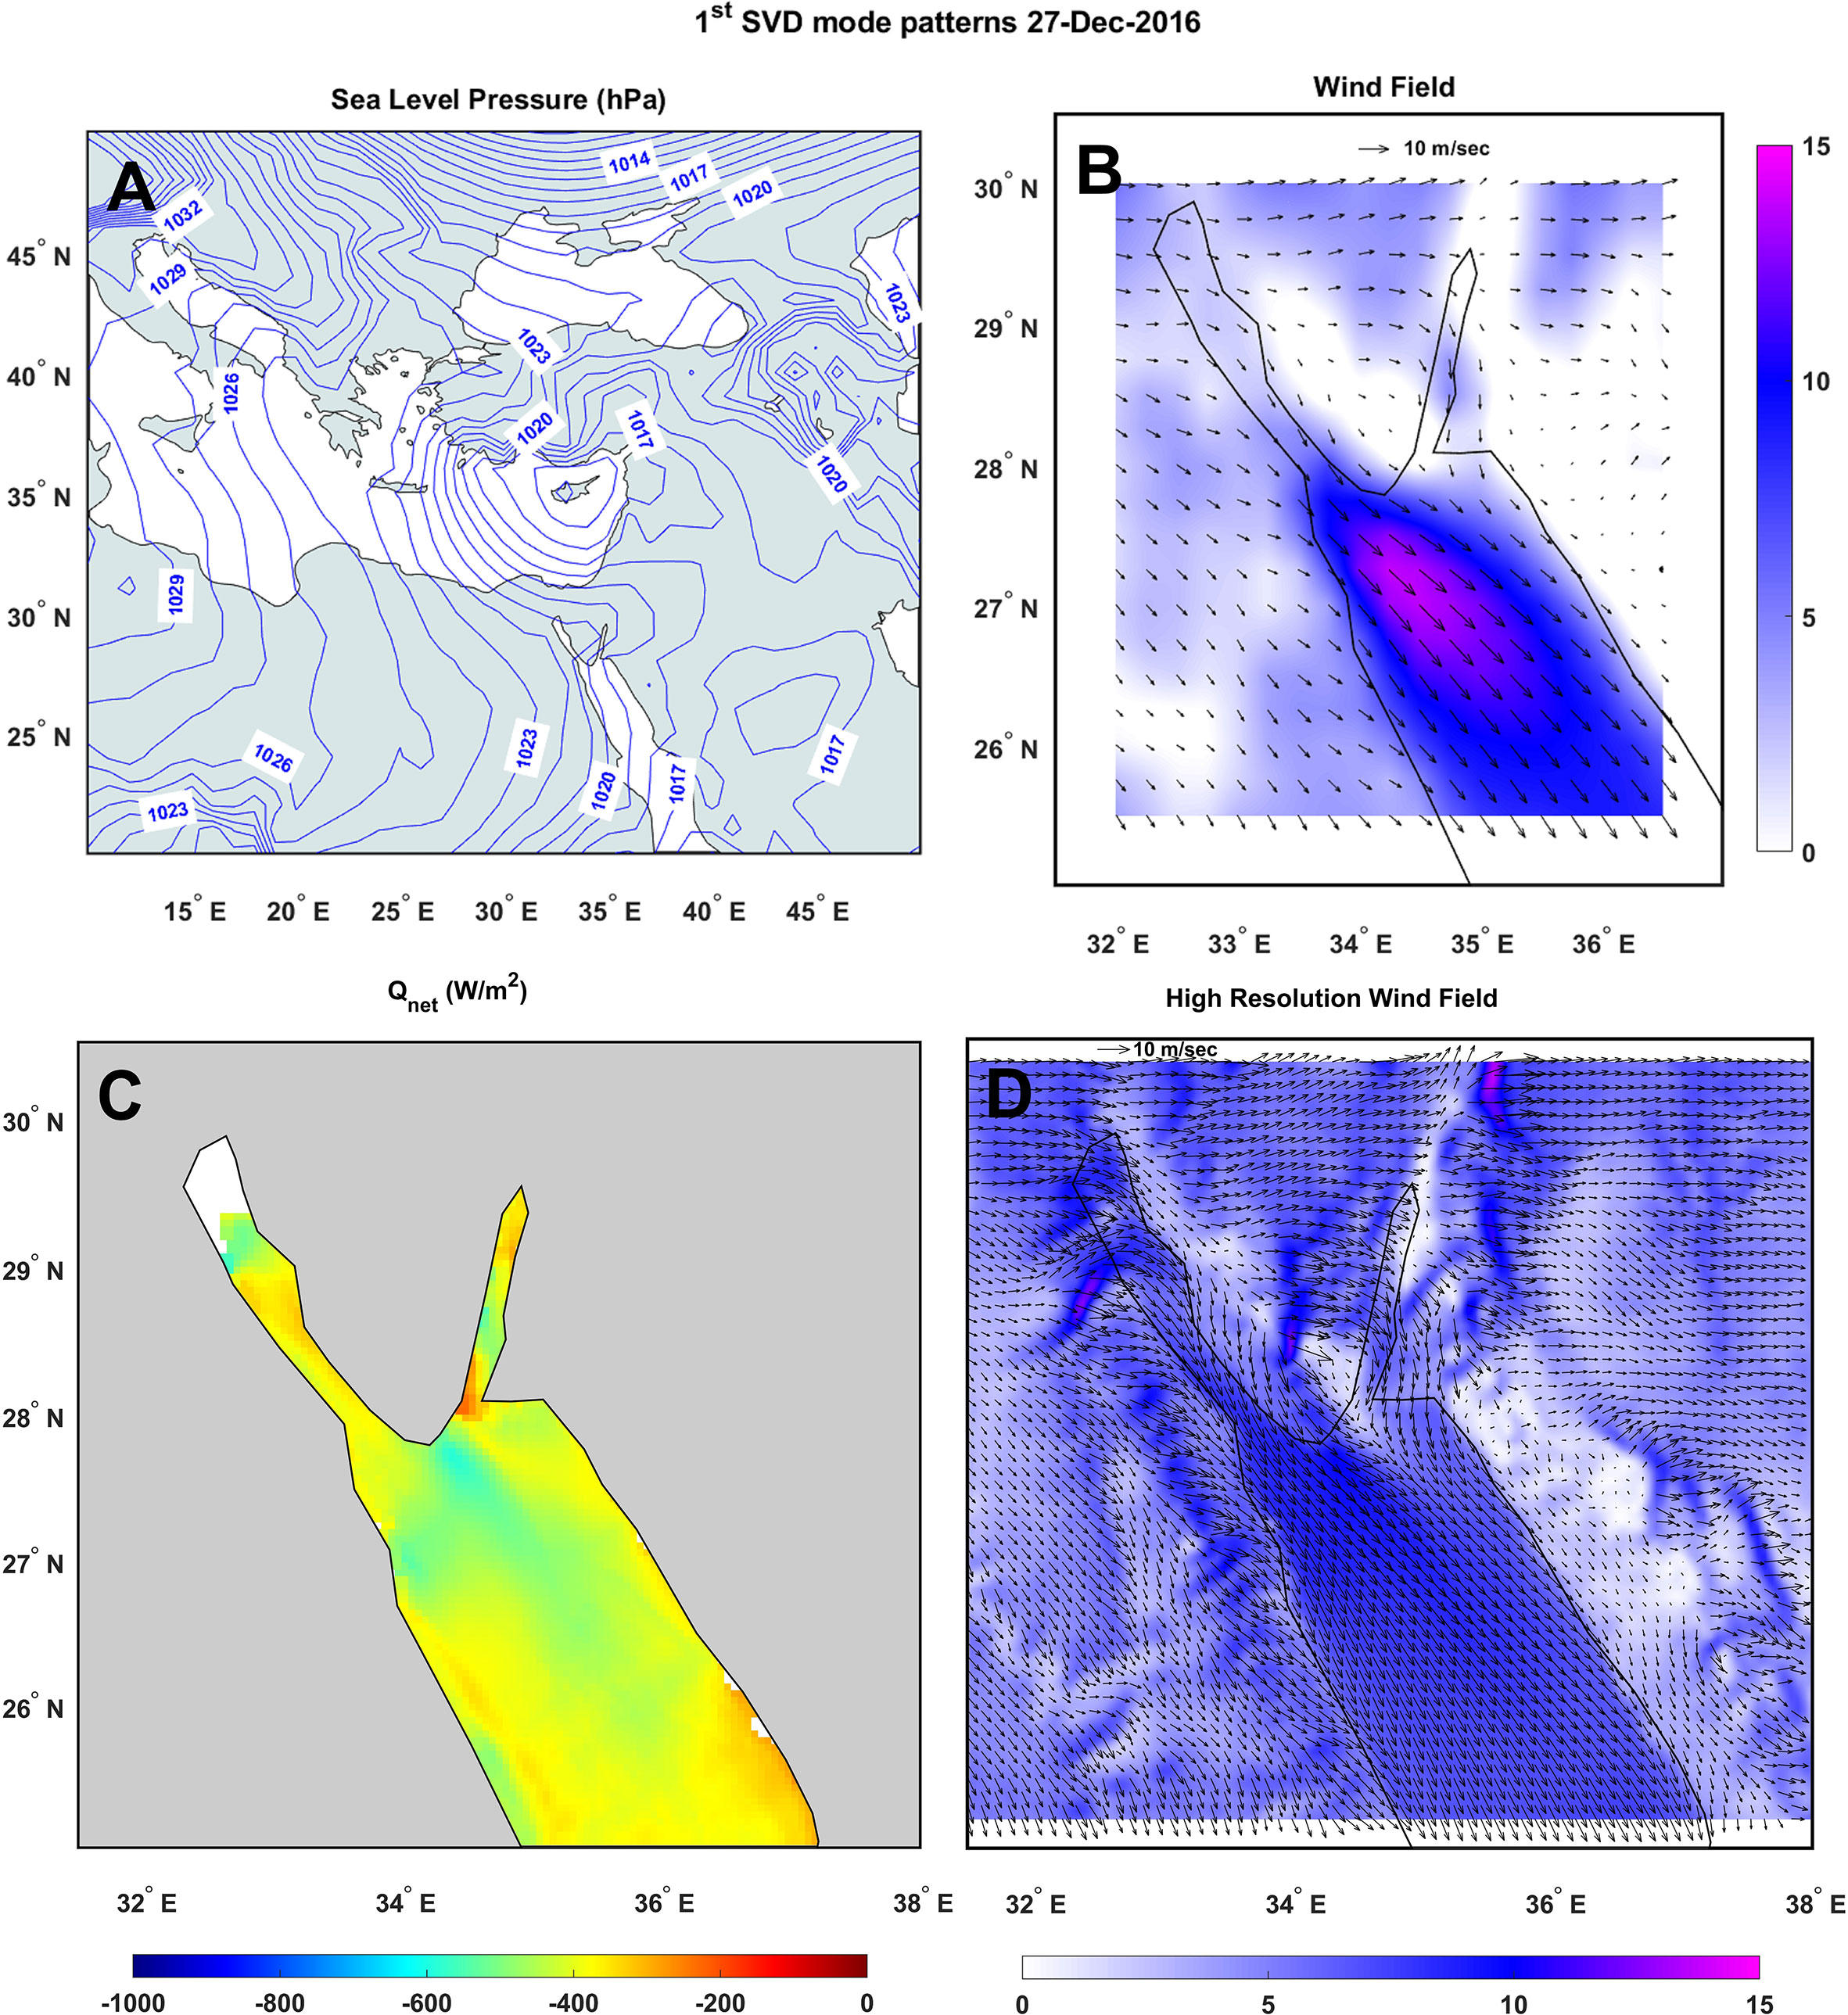
Figure 8 Case study for the first SVD mode on December 27, 2016: (A) regional SLP pattern from ERA-5 (0.25° × 0.25°); (B) wind field from ERA-5 (0.25° × 0.25°); (C) Qnet (W/m2) from the high-resolution reanalysis; and (D) wind from the high-resolution reanalysis averaged on a 10 km × 10 km grid.
The second SVD mode characteristics are well represented by an event that occurred on January 4, 1992. In this case, the SLP gradient was aligned almost along, rather than across, the NRS central axis (Figure 9A). Accordingly, compared to the first mode, the wind vectors are rotated clockwise and the wind blows from the north-northeast. Although the 25-km ERA-5 reanalysis is able to resolve this circulation pattern, it shows a smooth field with little variation in the magnitude over the NRS (Figure 9B). However, the high-resolution Qnet field indicates regions of stronger and weaker heat loss, suggesting much stronger wind variability in both, magnitude and direction (Figure 9C). Indeed, the high-resolution wind delineates a very different picture within the two gulfs and along the eastern coastline of the NRS (Figure 9D). This type of pressure gradient is associated with the transfer of air masses from the Middle East that follows the natural passages between the mountain gaps, especially along the Saudi coastline of the NRS, as also pointed out by previous studies (Jiang et al., 2009; Menezes et al., 2018; Menezes et al., 2019). Furthermore, the surface cooling is limited to areas where wind blowouts are favored as a result of the morphology of the relief.
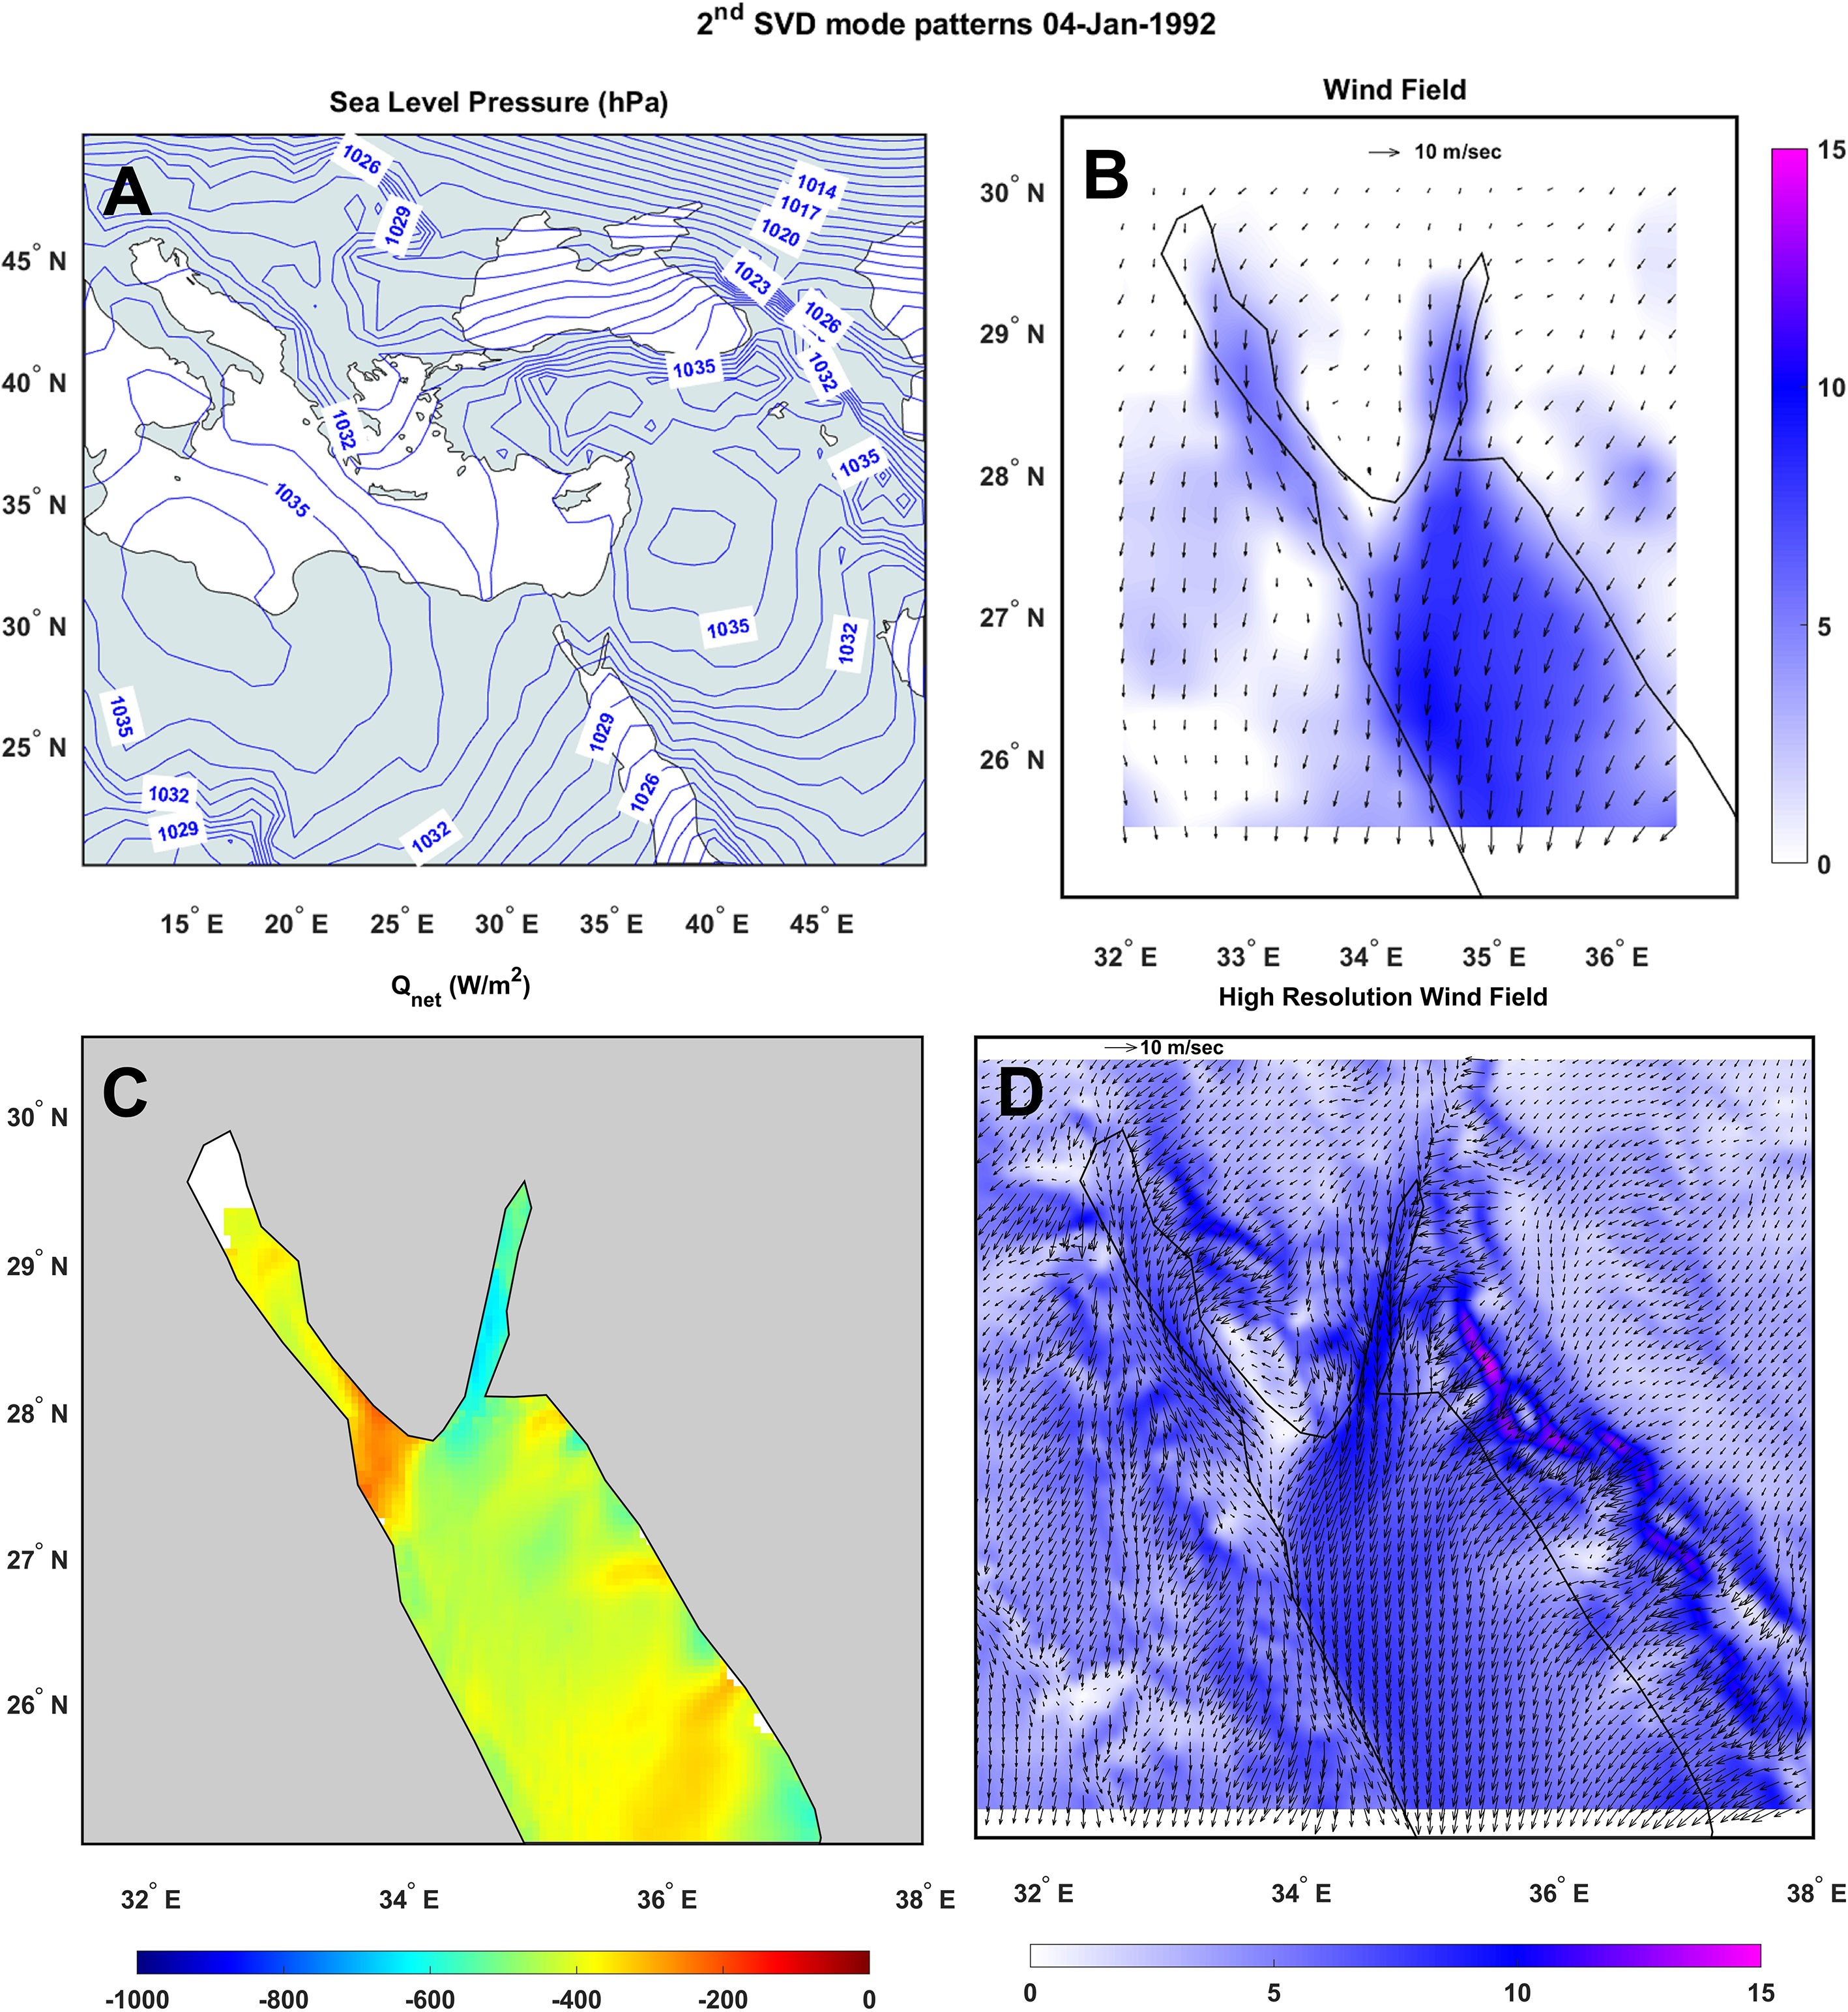
Figure 9 As in Figure 8, but for the second SVD mode on January 4, 1992.
An event that corresponds to the third SVD mode, occurred on November 28, 1999. It exhibits a SLP gradient similar to that of the second mode, except that the gradient is steeper over the two gulfs and the northern part of the open NRS (Figure 10A). In general, the wind field is similar to the second mode case, with wind bursts through the mount gaps along the Saudi coastline (Figure 10B). As for the second SVD mode, cooling is nonuniform and is confined to the areas with a steeper SLP gradient, whereas it is much weaker over the southern part of the NRS and lee areas (Figure 10C). Again, the high-resolution reanalysis reveals local wind outbursts due to channelization by the terrain structure, details that are not clearly resolved by the larger-scale dataset (Figure 10D). In summary, the high-resolution wind can show peculiarities critical to the extreme heat loss characteristics in the NRS. Our study corroborates the consistent contribution of cross-axis wind to the surface cooling of the NRS inferred by the second and third modes. This is a robust regional climatic feature that has been also recognized in earlier studies (Jiang et al., 2009; Menezes et al., 2018; Menezes et al., 2019). Cross-axis wind is mostly associated with intense evaporation, and the details of its possible contribution on dense water formation mechanisms deserves further investigation.
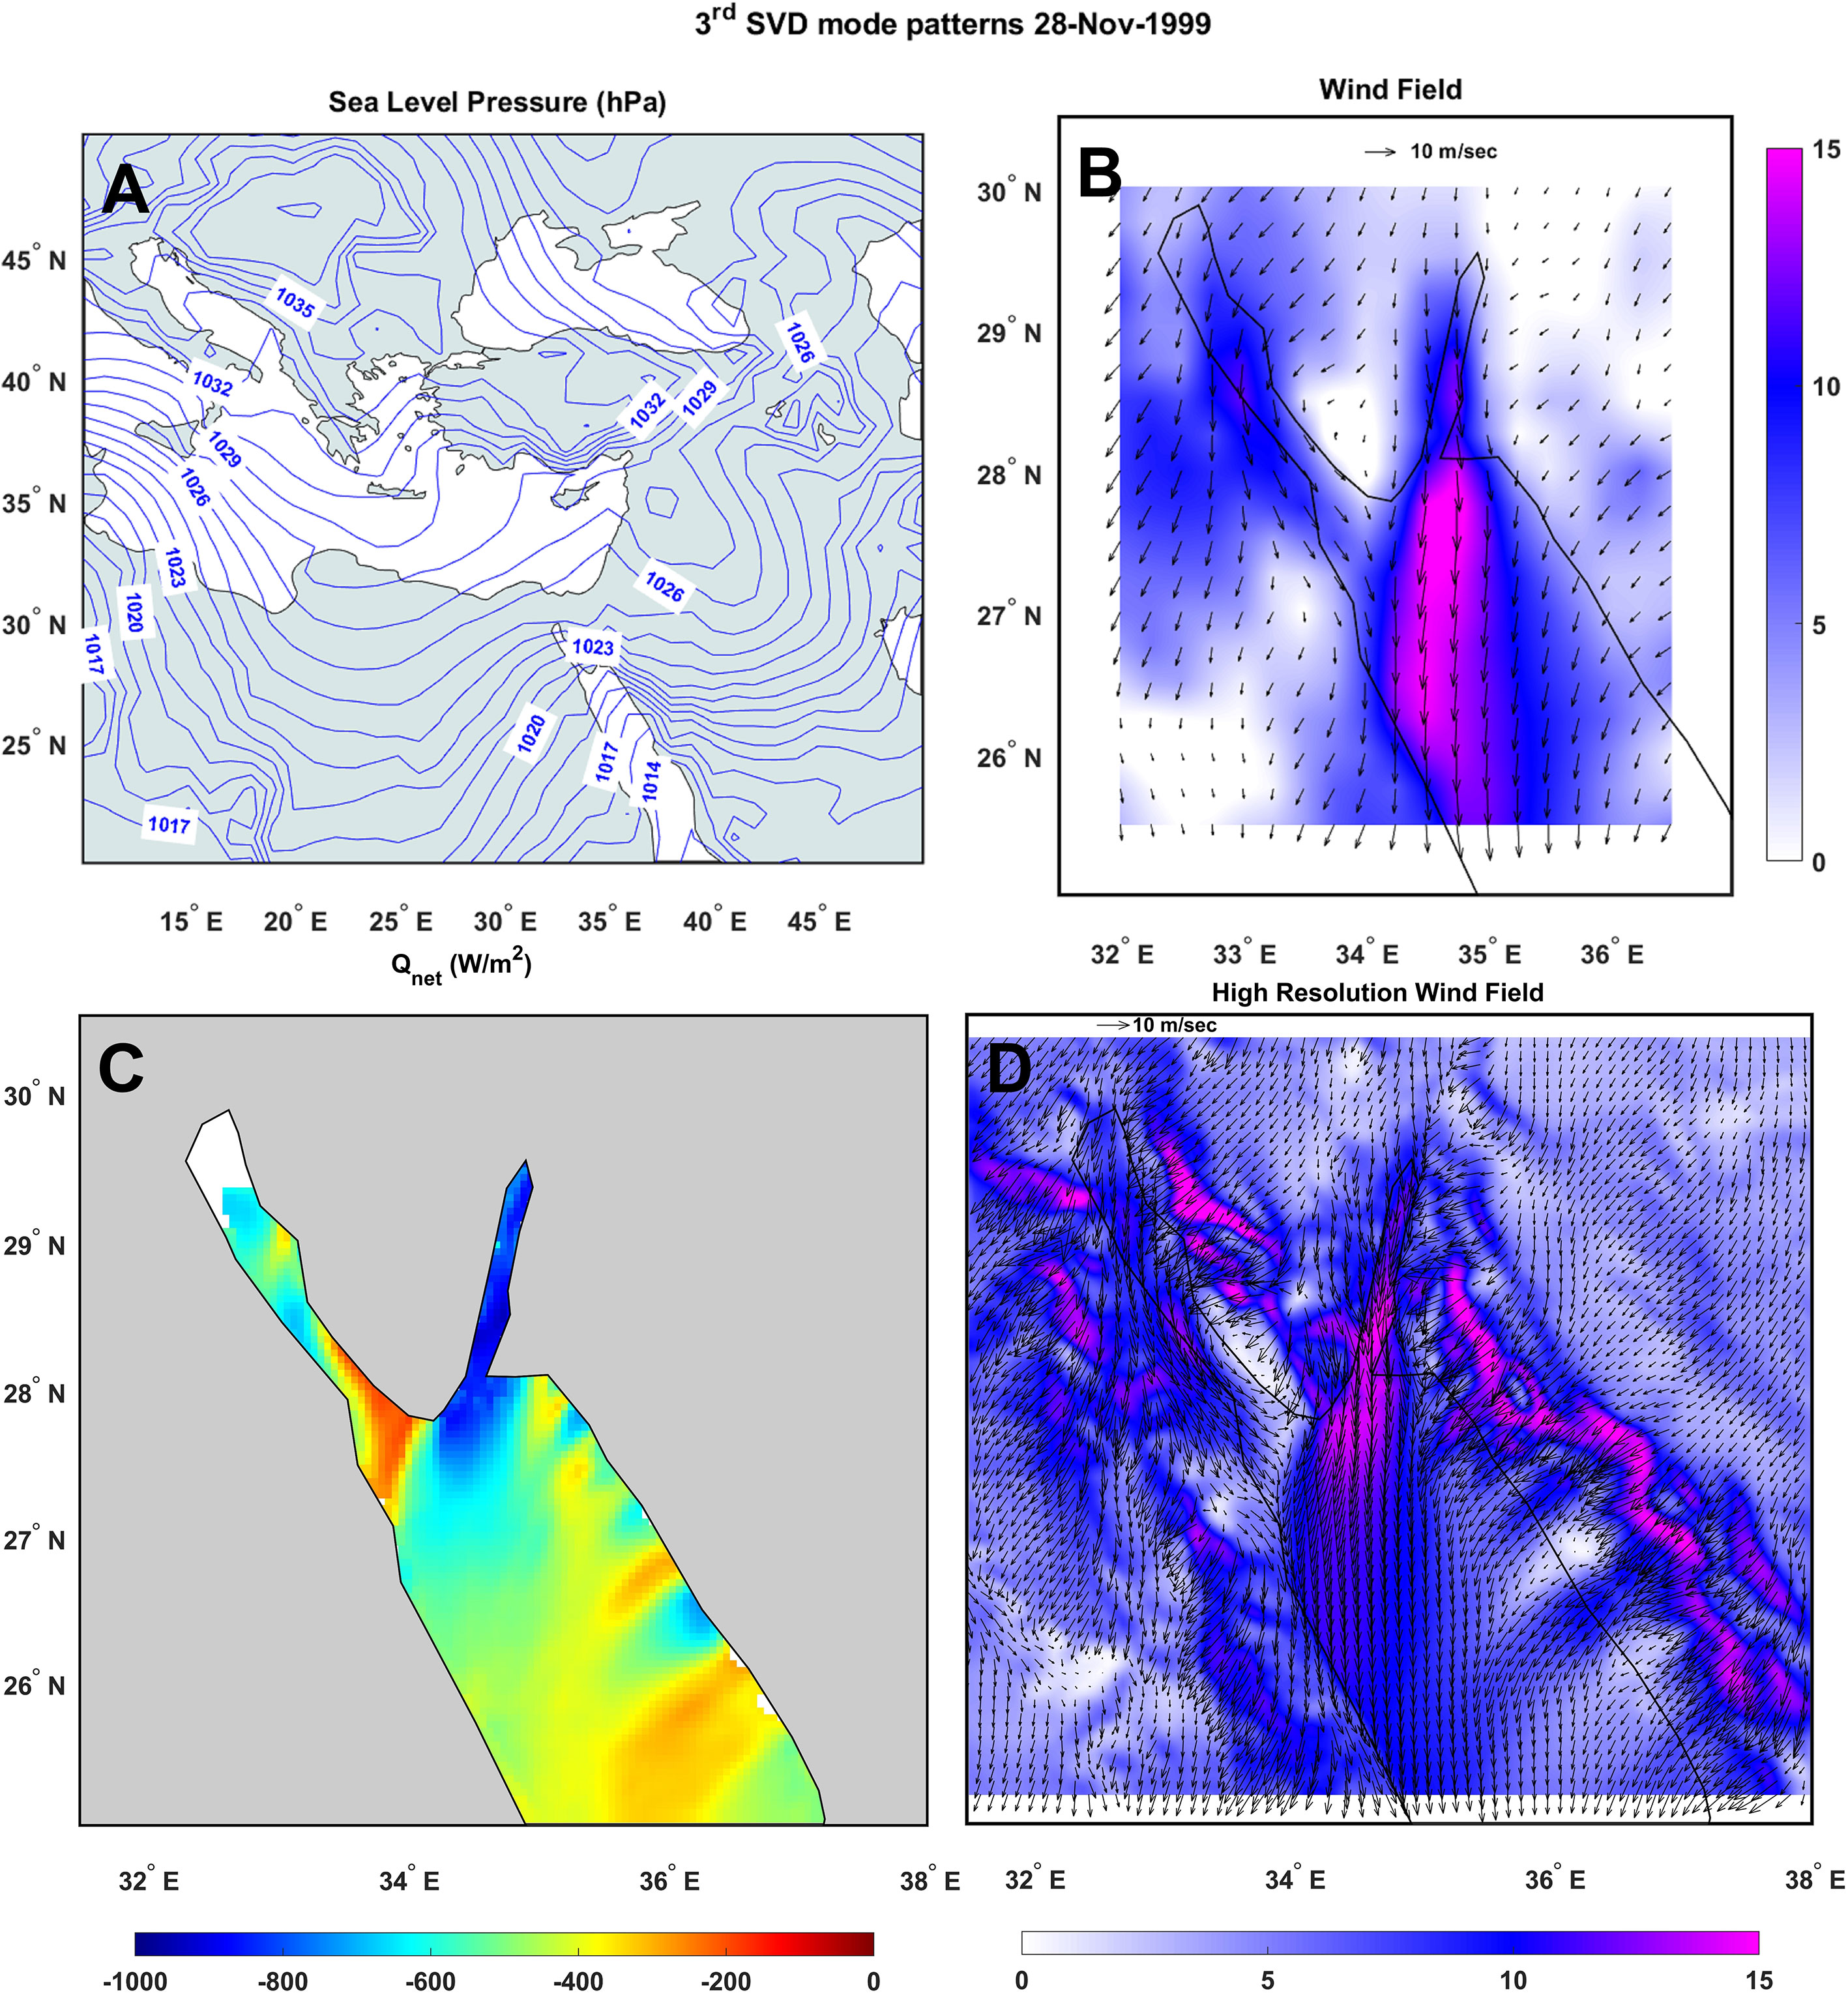
Figure 10 As in Figure 8, but for the third SVD mode on November 28, 1999.
Figure 11 presents the regional topographic relief as deduced from the GTOPO30 database and schematically summarizes the main wind directions associated with extreme surface cooling in the NRS. The two gulfs and the direction of the central axis of the elongated Red Sea provide the main channelization for the wind field as dictated by the first leading mode of the SVD. In this case, cold air masses reach the NRS from the adjacent eastern Mediterranean Sea. However, under less frequent atmospheric circulation patterns, as described by the second and third SVD modes, dry cross-axis winds with a Middle-Eastern origin prevail. The field intensity of these winds is regulated by mountain gaps located along the Saudi coastline. These gaps function as vent points, which locally intensify the heat loss by the sea, and might have a significant impact on the winter cooling of the NRS, as has been suggested by Menezes et al. (2019).
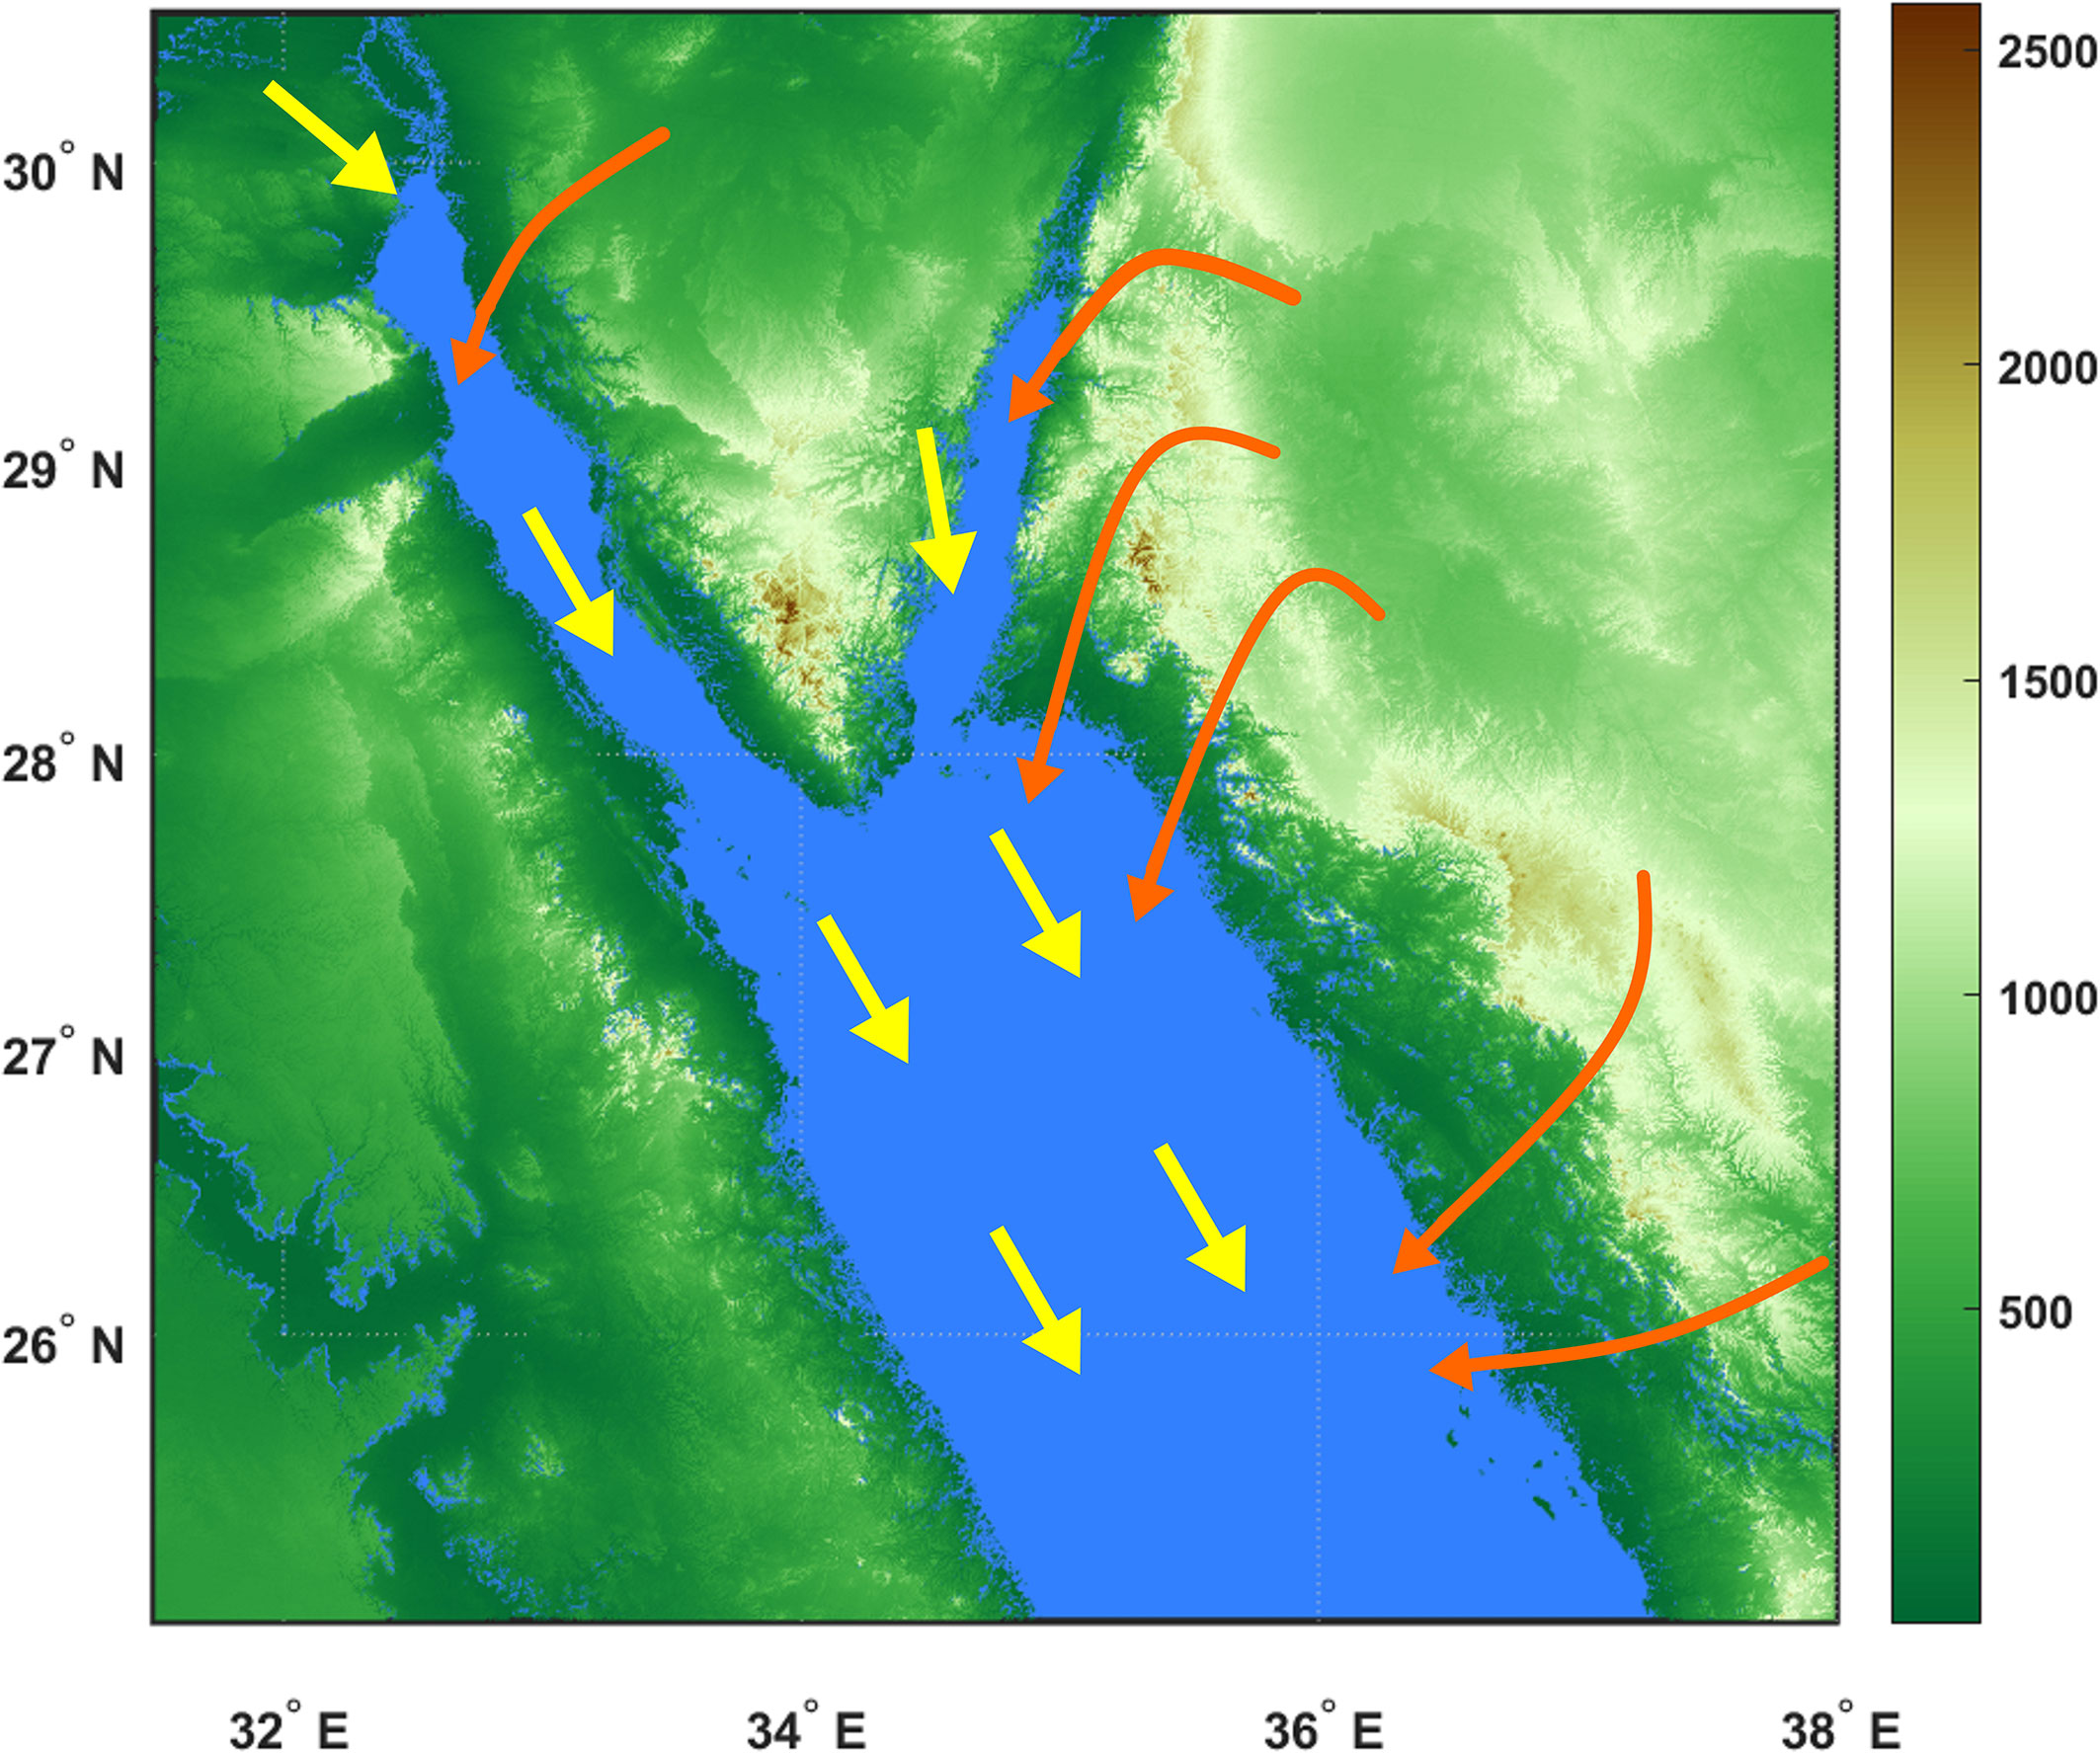
Figure 11 Regional topographic relief as deduced from the GTOPO30 database and the main wind directions associated with extreme surface cooling. Yellow vectors represent the wind field related to the first SVD mode of extreme cooling. Orange vectors mark the mountain gaps associated primarily with wind blowing under the second and third SVD modes of the extreme cooling events.
5 Conclusions
Episodes of extreme heat loss over the NRS are frequent during winter and lead to dense water formation, which is critical for the overturning circulation of the Red Sea. A high-resolution regional reanalysis spanning the period 1980–2019 was used in this study to investigate the characteristics of extreme heat loss events, their link to distinct regional atmospheric circulation patterns, and the role of the surrounding topographic relief. A total of 1443 days corresponding to the tenth percentile of the lowest net heat flux were considered as episodes of extreme heat loss events. Such events take place during winter from October to March and they are most frequent in December and January. An analysis of the heat loss minima revealed three major modes of spatial variability and a distinct atmospheric forcing linked to each mode. These modes depict two different routes of the arrival of the air-masses that conduce to surface cooling in the NRS. Each route is associated with different atmospheric circulation and the resulting wind field is strongly modulated by the local terrain morphology.
The majority of these episodes result in a nearly uniform cooling over the entire NRS; however, wind channelization due to the surrounding topography generates local differentiations of heat loss minima. Extraordinary low values of air-sea heat flux are observed in the southern part of the Gulf of Aqaba and along the western coastline of the NRS and are associated with stronger wind strips due to channelization. Uniform extreme heat loss occurs in the NRS under specific atmospheric circulation patterns; these patterns generate the required SLP gradient resulting in strong NW winds that transfer cold air masses from higher latitudes through the eastern Mediterranean Sea.
Apart from uniform cooling events, extreme heat loss events can occur over parts of the NRS as a result of the wind field under different SLP structures. In these cases, local cross-axis wind outbursts can affect the Gulf of Aqaba and the eastern coastline of the NRS or the northern half of the NRS, including the two elongated gulfs. These spatial modes of extreme-event variability are associated with a regional setup of the SLP gradient primarily favoring the transfer of cold and dry air from higher latitudes through the Middle East rather than the eastern Mediterranean Sea. The cooling modes are modulated by regional topographic features, which channelize and hinder or intensify the wind field in accordance with the SLP gradient.
Because the NRS is a pivotal area that sustains the entire basin’s intermediate and deep thermohaline circulation, analysis of the heat loss characteristics helps to better understand the regional dynamics and advance our interpretations of the complex hydrographic processes in the area. The results of the current study provide a useful guide for future analyses of when and how extreme heat loss leads to dense water formation in the space and time domains, which we will further investigate in our future work.
Data availability statement
The original contributions presented in the study are included in the article/Supplementary Material. Further inquiries can be directed to the corresponding author.
Author Contributions
VP and HD conducted the data analysis. All authors contributed to the article and approved the submitted version.
Funding
This work was partly funded by the Office of Vice President of Research at King Abdullah University of Science and Technology (KAUST) under the Collaborative Research Grant program (Grant URF/1/2979‐01‐01).
Conflict of interest
The authors declare that the research was conducted in the absence of any commercial or financial relationships that could be construed as a potential conflict of interest.
Publisher’s note
All claims expressed in this article are solely those of the authors and do not necessarily represent those of their affiliated organizations, or those of the publisher, the editors and the reviewers. Any product that may be evaluated in this article, or claim that may be made by its manufacturer, is not guaranteed or endorsed by the publisher.
Supplementary material
The Supplementary Material for this article can be found online at: https://www.frontiersin.org/articles/10.3389/fmars.2022.968114/full#supplementary-material
References
Abualnaja Y., Papadopoulos V. P., Josey S. A., Hoteit I., Kontoyiannis H., Raitsos D. E. (2015). Impacts of climate modes on air–sea heat exchange in the red Sea. J. Clim. 28 (7), 2665–2681. doi: 10.1175/JCLI-D-14-00379.1
Asfahani K., Krokos G., Papadopoulos V. P., Jones B. H., Sofianos S. S., Kheireddine M., et al. (2020). Capturing a mode of intermediate water formation in the red Sea. J. Geophys. Res. 125, e2019JC015803. doi: 10.1029/2019JC015803
Beal L. M., Ffield A., Gordon A. L. (2000). Spreading of red Sea overflow waters in the Indian ocean. J. Geophys. Res. 105, 8549–8564. doi: 10.1029/1999JC900306
Ben-Sasson M., Brenner S., Paldor N. (2009). Estimating air-sea heat fluxes in semi enclosed basins: The case of the gulf of elat (Aqaba). J. Phys. Oceanogr. 39, 185–202. doi: 10.1175/2008JPO3858.1
Biton E., Gildor H. (2011). The coupling between exchange flux through a strait and dynamics in a small convectively driven marginal sea: The gulf of aqaba (Gulf of eilat). J. Geophys. Res. 116, C06017. doi: 10.1029/2011JC006944
Bjornsson H., Venegas S. A. (1997). A manual for EOF and SVD analyses of climate data (Montreal, Quebec), 52. Technical Report, Mcgill University CCGCR Report No. 97-1.
Bond N. A., Cronin M. F. (2008). Regional weather patterns during anomalous air–sea fluxes at the kuroshio extension observatory (KEO). J. Clim. 21, 1680–1697. doi: 10.1175/2007JCLI1797.1
Bower A. S., Johns W. E., Fratantoni D. M., Peters H (2005). Equilibration and Circulation of Red Sea Outflow Water in the Western Gulf of Aden. J. Phys. Oceanogr. 35, 1963–1985. doi: 10.1175/JPO2787.1
Cayan D. R. (1992). Latent and sensible heat flux anomalies over the northern oceans: The connection to monthly atmospheric circulation. J. Clim. 5, 354–369. doi: 10.1175/1520-0442(1992)005<0354:LASHFA>2.0.CO;2
Cember R. P. (1988). On the sources, formation, and circulation of red Sea deep water. J. Geophys. Res. 93, 8175. doi: 10.1029/JC093iC07p08175
Dasari H. P., Desamsetti S., Langodan S., Viswanadhapalli Y., Hoteit I. (2021). Analysis of outdoor thermal discomfort over the kingdom of Saudi Arabia. GeoHealth 5, e2020GH000370. doi: 10.1029/2020GH00037
Dasari H., Srinivas D., Langodan S., Attada R., Kunchala R. K., Yesubabu V., et al. (2019). High-resolution assessment of solar energy resources over the Arabian peninsula. Appl. Energ. 248, 354–371. doi: 10.1016/j.apenergy.2019.04.105
Dee D. P., Uppala S. M., Simmons A. J., Berrisford P., Poli P., Kobayashi S., et al, et al. (2011). The ERA-interim reanalysis: Configuration and performance of the data assimilation system. Q. J. R. Meteor. Soc 137, 553–597. doi: 10.1002/qj.828
Dwivedi S., Viswanadhapalli Y., Venkat Ratnam M., Dasari H. P., Langodan S., Akhil Raj S. T., et al. (2020). Variability of monsoon inversion over the Arabian Sea and its impact on rainfall. Int. J. Climatol. 41, E2979–E2999. doi: 10.1002/joc.6896
Ellis J., Jamil T., Anlauf H., Coker D. J., Curdia J., Hewitt J., et al. (2019). Multiple stressor effects on coral reef ecosystems. Glob. Change Biol. 25, 4131–4146. doi: 10.1111/gcb.14819
Genin A., Lazar B., Brenner S. (1995). Vertical mixing and coral death in the red Sea following the eruption of mount pinatubo. Nature 377, 507–510. doi: 10.1038/377507a0
Hannachi A., Jolliffe I. T., Stephenson D. B. (2007). Empirical orthogonal functions and related techniques in atmospheric science: A review. Int. J. Climatol. 27, 1119–1152. doi: 10.1002/joc.1499
Hannachi A., Jolliffe I. T., Stephenson D. B., Trendafilov N. (2006). In search of simple structures in climate: simplifying EOFs. Int. J. Climatol. 26, 7–28. doi: 10.1002/joc.1243
Hersbach H., Bell B., Berrisford P., Hirahara S., Horányi A., Muñoz-Sabater J., et al. (2020). The ERA5 global reanalysis. Q. J. R. Meteor. Soc 146, 1999–2049. doi: 10.1002/qj.3803
Hoteit I., Abualnaja Y., Afzal S., Ait-El-Fquih B., Akylas T., Antony C., et al. (2020). Towards an end-to-end analysis and prediction system for weather, climate, and marine applications in the red Sea. B. Am. Meteorol. Soc 102, E99–E122. doi: 10.1175/BAMS-D-19-0005.1
Iacono M. J., Delamere J. S., Mlawer E. J., Shephard M. W., Clough S. A., Collins W. D. (2008). Radiative forcing by long-lived greenhouse gases: Calculations with the AER radiative transfer models. J. Geophys. Res. 113, D13103. doi: 10.1029/2008JD009944
Jiang H., Farrar J. T., Beardsley R. C., Chen R., Chen C. (2009). Zonal surface wind jets across the red Sea due to mountain gap forcing along both sides of the red Sea. Geophys. Res. Lett. 36, L19605. doi: 10.1029/2009GL040008
Josey S. A., Somot S., Tsimplis M. (2011). Impacts of atmospheric modes of variability on Mediterranean Sea surface heat exchange. J. Geophys. Res. 116, C02032. doi: 10.1029/2010JC006685
Konda M., Ichikawa H., Tomita H., Cronin M. F. (2010). Surface heat flux variations across the kuroshio extension as observed by surface flux buoys. J. Clim. 23, 5206–5221. doi: 10.1175/2010JCLI3391.1
Langodan S., Cavaleri L., Vishwanadhapalli Y., Pomaro A., Bertotti L., Hoteit I. (2017). The climatology of the red Sea–part 1: The wind. Int. J. Climatol. 37, 4509–4517. doi: 10.1002/joc.5103
Langodan S., Antony C., Shanas P. R., Dasari H. P., Abualnaja Y., Knio O., Hoteit I., et al (2020). Wave modeling of a reef-sheltered coastal zone in the Red Sea. IOcean Engin 207, 107378. doi: 10.1016/j.oceaneng.2020.107378
Liu G., Liu. Y., Endo S. (2013). Evaluation of surface flux parameterizations with long-term ARM observations. Mon. Weather Rev. 141, 773–409. doi: 10.1175/MWR-D-12-00095.1
Lucas-Picher P., Boberg F., Christensen A., Berg P. (2013). Dynamical downscaling with reinitializations: A method to generate fine scale climate datasets suitable for impact studies. J. Hydrometeorol. 14, 1159–1167. doi: 10.1175/JHM-D-12-063.1
Manasrah R., Badran M., Lass H. U., Fennel W. (2004). Circulation and winter deep-water formation in the northern red Sea. Oceanologia 46, 5–23.
Mariotti A., Dell’Aquila A. (2012). Decadal climate variability in the Mediterranean region: roles of large-scale forcings and regional processes. Clim. Dyn. 38, 1129–1145. doi: 10.1007/s00382-011-1056-7
Menezes V. V., Farrar J. T., Bower A. S. (2018). Westward Mountain-gap wind jets of the northern red Sea as seen by QuikSCAT. Remote Sens. Environ. 209, 677–699. doi: 10.1016/j.rse.2018.02.075
Menezes V. V., Farrar J. T., Bower A. S. (2019). Evaporative implications of dry-air outbreaks over the northern red Sea. J. Geophys. Res. Atmosph. 124, 4829–4861. doi: 10.1029/2018JD028853
Nakanishi M., Niino H. (2004). An improved mellor-yamada level-3 model with condensation physics: its design and verification. Bound. Lay. Meteorol. 112, 1–31. doi: 10.1023/B:BOUN.0000020164.04146.98
Niu G.-Y., Yang Z.-L., Mitchell K. E., Chen F., Ek M. B., Barlage M., et al. (2011). The community Noah land surface model with multiparameterization options (Noah-MP): 1. model description and evaluation with local-scale measurements. J. Geophys. Res. 116, D12109. doi: 10.1029/2010JD015139
Papadopoulos V. P., Abualnaja Y., Josey S. A., Bower A. S., Raitsos D. E., Kontoyiannis H., et al. (2013). Atmospheric forcing of the winter air-sea heat fluxes over the northern red Sea. J. Clim. 26, 1685–1701. doi: 10.1175/JCLI-D-12-00267.1
Papadopoulos V. P., Josey S. A., Bartzokas A., Somot S., Ruiz S., Drakopoulou P. (2012a). Large-Scale atmospheric circulation favoring deep and intermediate water formation in the Mediterranean Sea. J. Clim. 25, 6079–6091. doi: 10.1175/JCLI-D-11-00657.1
Papadopoulos V. P., Kontoyiannis H., Ruiz S., Zarokanellos N. (2012b). Influence of atmospheric circulation on turbulent air-sea heat fluxes over the Mediterranean Sea during winter. J. Geophys. Res. 117, C03044. doi: 10.1029/2011JC007455
Papadopoulos V. P., Zhan P., Sofianos S. S., Raitsos D. E., Qurban M., Abualnaja Y., et al. (2015). Factors governing the deep ventilation of the red Sea. J. Geophys. Res. Oceans 120, 7493–7505. doi: 10.1002/2015JC010996
Roman R. E., Lutjeharms J. R. E. (2007). Red sea intermediate water at the agulhas current termination. Deep Sea Res. Part I 54, 1329–1340. doi: 10.1016/j.dsr.2007.04.009
Roman R. E., Lutjeharms J. R. E. (2009). Red Sea intermediate water in the source regions of the agulhas current. Deep Sea Res. Part I 56, 939–962. doi: 10.1016/j.dsr.2009.01.003
Ruiz S., Gomis D., Sotillo M., Josey S. A. (2008). Characterization of surface heat fluxes in the Mediterranean Sea from a 44-year high-resolution atmospheric data set, global planet. Change 63 (2–3), 258–274. doi: 10.1016/j.gloplacha.2007.12.002
Schroeder K., Josey S. A., Herrmann M., Grignon L., Gasparini G. P., Bryden H. L. (2010). Abrupt warming and salting of the Western Mediterranean deep water after 2005: Atmospheric forcings and lateral advection. J. Geophys. Res. 115, C08029. doi: 10.1029/2009JC005749
Skamarock W. C., Klemp J. B., Dudhia J., Gill D. O., Liu Z., Berner J., et al. (2019). A description of the advanced research WRF version 4. NCAR tech. note NCAR/TN-556+STR Boulder, Colorado. 145.
Sofianos S. S., Johns W. E. (2003). An oceanic general circulation model (OGCM) investigation of the red Sea circulation: 2. three dimensional circulation in the red Sea. J. Geophys. Res. 108, 3066. doi: 10.1029/2001JC001185
Sofianos S. S., Johns W. E. (2015). “Water mass formation, overturning circulation, and the exchange of the red Sea with the adjacent basins,” in The red Sea. Eds. Rasul N. M. A., Stewart I. C. F. (Berlin Heidelberg: Springer), 343–353. doi: 10.1007/978-3-662-45201-1_20
Thompson G., Field P. R., Rasmussen R. M., Hall W. D. (2008). Explicit forecasts of winter precipitation using an improved bulk microphysics scheme. part II: implementation of a new snow parameterization. Mon. Weather Rev. 136, 5095–5115. doi: 10.1175/2008MWR2387.1
Venegas S. A., Mysak L. A., Straub D. N. (1997). Atmosphere–ocean coupled variability in the south Atlantic. J. Clim. 10, 2904–2920. doi: 10.1175/1520-0442(1997)010<2904:AOCVIT>2.0.CO;2
Viswanadhapalli Y., Dasari H. P., Dwivedi S., Venkat Ratnam M., Langodan S., Hoteit I. (2020). Variability of monsoon low level jet and associated rainfall over India. Int. J. Climatol. 40, 1067–1089. doi: 10.1002/joc.6256
Viswanadhapalli Y., Dasari H. P., Langodan S., Challa V. S., Hoteit I. (2017). Climatic features of the red Sea from a regional assimilative model. Int. J. Climatol. 37, 2563–2581. doi: 10.1002/joc.4865
Woelk S., Quadfasel D. (1996). Climatic features of the red Sea from a regional assimilative model. J. Geophys. Res. Oceans 101, 18155–18165. doi: 10.1029/96JC01148
von Storch H., Navarra A. (Eds.) (1995). Analyses of climate variability-applications of statistical techniques (Springer), 334.
Wallace J. M., Smith C., Bretherton C. S. (1992). Singular value decomposition of wintertime sea surface temperature and 500-mb height anomalies. J. Clim. 5, 561–576. doi: 10.1175/1520-0442(1992)005%3C0561:SVDOWS%3E2.0.CO;2
Yao F., Hoteit I., Pratt L. J., Bower A. S., Köhl A., Gopalakrishnan G., et al. (2014b). Seasonal overturning circulation in the red Sea: 2. winter circulation. J. Geophys. Res. Oceans 119, 2263–2289. doi: 10.1002/2013JC009331
Yao F., Hoteit I., Pratt L. J., Bower A. S., Zhai P., Köhl A., et al. (2014a). Seasonal overturning circulation in the red Sea: 1. model validation and summer circulation. J. Geophys. Res. Oceans 119, 2238–2262. doi: 10.1002/2013JC009004
Yao F., Hoteit I.. (2018). Rapid Red Sea Deep Water renewals caused by volcanic eruptions and the North Atlantic Oscillation. Sci. Adv 4, eaar5637. doi: 10.1126/sciadv.aar5637
Keywords: Northern Red Sea, extreme heat loss, heat loss variability, atmospheric forcing, topography effect
Citation: Papadopoulos VP, Krokos G, Dasari HP, Abualnaja Y and Hoteit I (2022) Extreme heat loss in the Northern Red Sea and associated atmospheric forcing. Front. Mar. Sci. 9:968114. doi: 10.3389/fmars.2022.968114
Received: 13 June 2022; Accepted: 26 September 2022;
Published: 12 October 2022.
Edited by:
Jacopo Chiggiato, National Research Council (CNR), ItalyReviewed by:
Antonio Ricchi, University of L’Aquila, ItalyKhaled Omar, National Research Institute of Astronomy and Geophysics, Egypt
Copyright © 2022 Papadopoulos, Krokos, Dasari, Abualnaja and Hoteit. This is an open-access article distributed under the terms of the Creative Commons Attribution License (CC BY). The use, distribution or reproduction in other forums is permitted, provided the original author(s) and the copyright owner(s) are credited and that the original publication in this journal is cited, in accordance with accepted academic practice. No use, distribution or reproduction is permitted which does not comply with these terms.
*Correspondence: Ibrahim Hoteit, aWJyYWhpbS5ob3RlaXRAa2F1c3QuZWR1LnNh