 Saurav Dutta
 Raoul Saar2
 Harold J. Bradbury
 Gilad Antler
- 1Department of Earth and Environmental Sciences, Faculty of Natural Sciences, Ben-Gurion, University of the Negev, Beer Sheva, Israel
- 2The Interuniversity Institute for Marine Sciences, Eilat, Israel
- 3Department of Zoology, George S. Wise Faculty of Life Sciences, Tel-Aviv University, Tel-Aviv, Israel
- 4Department of Earth Sciences, University of Cambridge, Cambridge, United Kingdom
- 5Department of Earth, Ocean and Atmospheric Sciences, University of British Columbia, Vancouver, BC, Canada
Marine sediment represents one of the most significant carbon reservoirs. Extraction of pore water from the uppermost 10 cm of the sediment column, just below the sediment-water interface, in coastal environments can be used to assess the rapid chemical changes caused by extensive subsurface biological and chemical reactions. However, owing to relatively large grain size of the sediment in some shallow coastal environments, sediment and pore water mixes quickly making collection of core samples for pore water extraction extremely difficult. Here, we present a simple method utilizing Rhizons to collect in situ pore water from coastal environments. We conducted both ex situ and in situ experiments, using fluorescein as a tracer, to understand the influence of overlying water during pore water collection through this method. These experiments also allowed us to assess the volume of pore water collected before fluorescein is observed in the samples at different vertical depths within the sediment column. We found that: 1. discarding the initial 2 mL of water minimizes the memory effect, 2. collection of 10 mL of water avoids interference from surrounding pore water and the overlying water column and 3. a vertical resolution of minimum 2 cm could be attained for sediments with grain size of 1 mm and less. We finally present data from two linear transects from different sites in the Gulf of Aqaba. Results from these case studies demonstrate expected patterns of high concentrations of iron and hydrogen sulfide in pore water from the sediment where surface coloration suggested iron and sulfate reduction was dominating, respectively. Both case studies, therefore, independently validated the Rhizon sampler method for collecting pore water in situ from marine sediments in coastal environments.
1 Introduction
Marine ecosystems like mangroves, salt marshes, and seagrasses meadows (also called blue carbon) captures a significant proportion of the carbon buried in marine sediments and stores them for millennial time scales, which is much longer than many carbon sinks (Nelleman et al., 2008; Laffoley and Grimsditch, 2009; Nellemann and Corcoran, 2009). These blue carbon sinks form part of the coastal environments and are comprised of sandy and permeable sediments with sediment grain sizes of 2 mm or larger. Pore water transportation and consequently, the fluxes in and out of these sandy sediments, are impacted by pressure fluctuation due to current and can induce advective flow of particulate and dissolved organic matter, nutrients and oxygen (Huettel et al., 1996). This causes sandy sediment to act as biogeochemical reactor that efficiently consumes organic matter and recycles organic carbon, sulfur, nitrogen and other metals (Bacon et al., 1994; Anschutz et al., 2009). Consequently, permeable sandy sediment and the pore water in it constitutes a fundamental component for benthic biogeochemistry research (Nissenbaum et al., 1972; Sholkovitz, 1973; Froelich et al., 1979).
Pore water collection from sandy sediments, however, is a difficult process because low cohesion and high conductivity within the sediment framework leads to collapse and mixture of the pore water within the sediment with minimal perturbation. The methods developed for collecting pore water from the shallow marine coarse-grained sediments employ in situ techniques involving either dialysis methods (Sayles et al., 1973; Hesslein, 1976; Charette and Allen, 2006; Shotbolt, 2010), suction filtration samplers (Makemson, 1972; Sayles et al., 1973; Charette and Allen, 2006; Beck et al., 2007), gel probe equilibrium sampler (Campbell et al., 2008a; Campbell et al., 2008b) or extraction by Rhizons (Seeberg-Elverfeldt et al., 2005; Shotbolt, 2010; Steiner et al., 2018). The basis for these in situ techniques is to minimize the perturbation of natural pore water inside the sediment column. Maintaining this strategy, the dialysis method and gel probe equilibrium sampler provides high depth resolution and suction samplers allow collection of pore water at depths between 1 and 5 m (Beck et al., 2007). However, the afore-mentioned methods are ideal for long term studies and the deployment requires an equilibration time which varies from hours to days. The Rhizon sampler method, even though seldom used, has enormous potential due to its simplicity, low cost and reusable properties. Seeberg-Elverfeldt et al. (2005), developed a “Rhizon in situ Sampler” for collecting pore water in combination with a benthic chamber. However, insertion of benthic chamber is an expensive affair and for sediments from coastal areas with higher grain size the insertion might lead to disturbance of the sediment column. Therefore, post sampling, the site might be permanently impacted by the removal of the benthic chamber preventing resampling from the same location.
In this study, we describe a method for in situ collections of pore water from sandy sediment with grain size as high as 2 mm with minimal disturbance. We have designed a simple setup where the Rhizons can be inserted vertically and extraction of porewater is possible at a vertical resolution of a couple of centimeters. Our Rhizon method can be employed for pore water extraction from shallow depths (maximum 10 cm from the subsurface) and does not require any other additional device (e.g. benthic chamber) or the extraction of a sediment core. Finally, we corroborate the potential of the method by presenting two case studies where the concentration of the expected element in the pore water demonstrates significant correlation between the subsurface activity and the surficial feature (color) on the sediment.
2 Methods
2.1 Study sites
The study was conducted at three different sites in the northern Gulf of Aqaba (GoA), Red Sea adjacent to the city of Eilat, Israel (Figure 1A). We selected the shallow offshore region at the Interuniversity Institute for Marine Science (IUI) (29°30’05.6”N, 34°55’01.2”E) for conducting the tracer in situ experiments. In general, the IUI site harbors healthy coral colonies, however, our experimental site was devoid of any such colonies and was located at 5 m water depth and ~10 m offshore (Figure 1B). We wanted to conduct the tracer experiments with minimum interference from any biotic or abiotic activities, however, the localities for the case studies were selected such that they represent a diverse habitat with different sets of environmental parameters. All the sites were entirely subtidal. Katza beach (29°31’31.9”N, 34°56’08.0”E) (Figure 1A) is adjacent to the Eilat Ashkelon Pipeline Co. Ltd (EAPC) setup and is dominated by anthropogenic activities. The collection of pore water was conducted at 5 m water depth and ~10 m offshore where the sediment floor was barren (devoid of any coral colonies or vegetation) and had traces of reddish deposits of ferric hydroxides (Figure 1C). The North beach (29°32’50.3”N 34°57’54.9”E), on the other hand, comprises of seagrass meadows and is situated along the western shores of the northern tip of GoA. Our study area is ~250 m offshore and at 7 m water depth (Figure 1D).
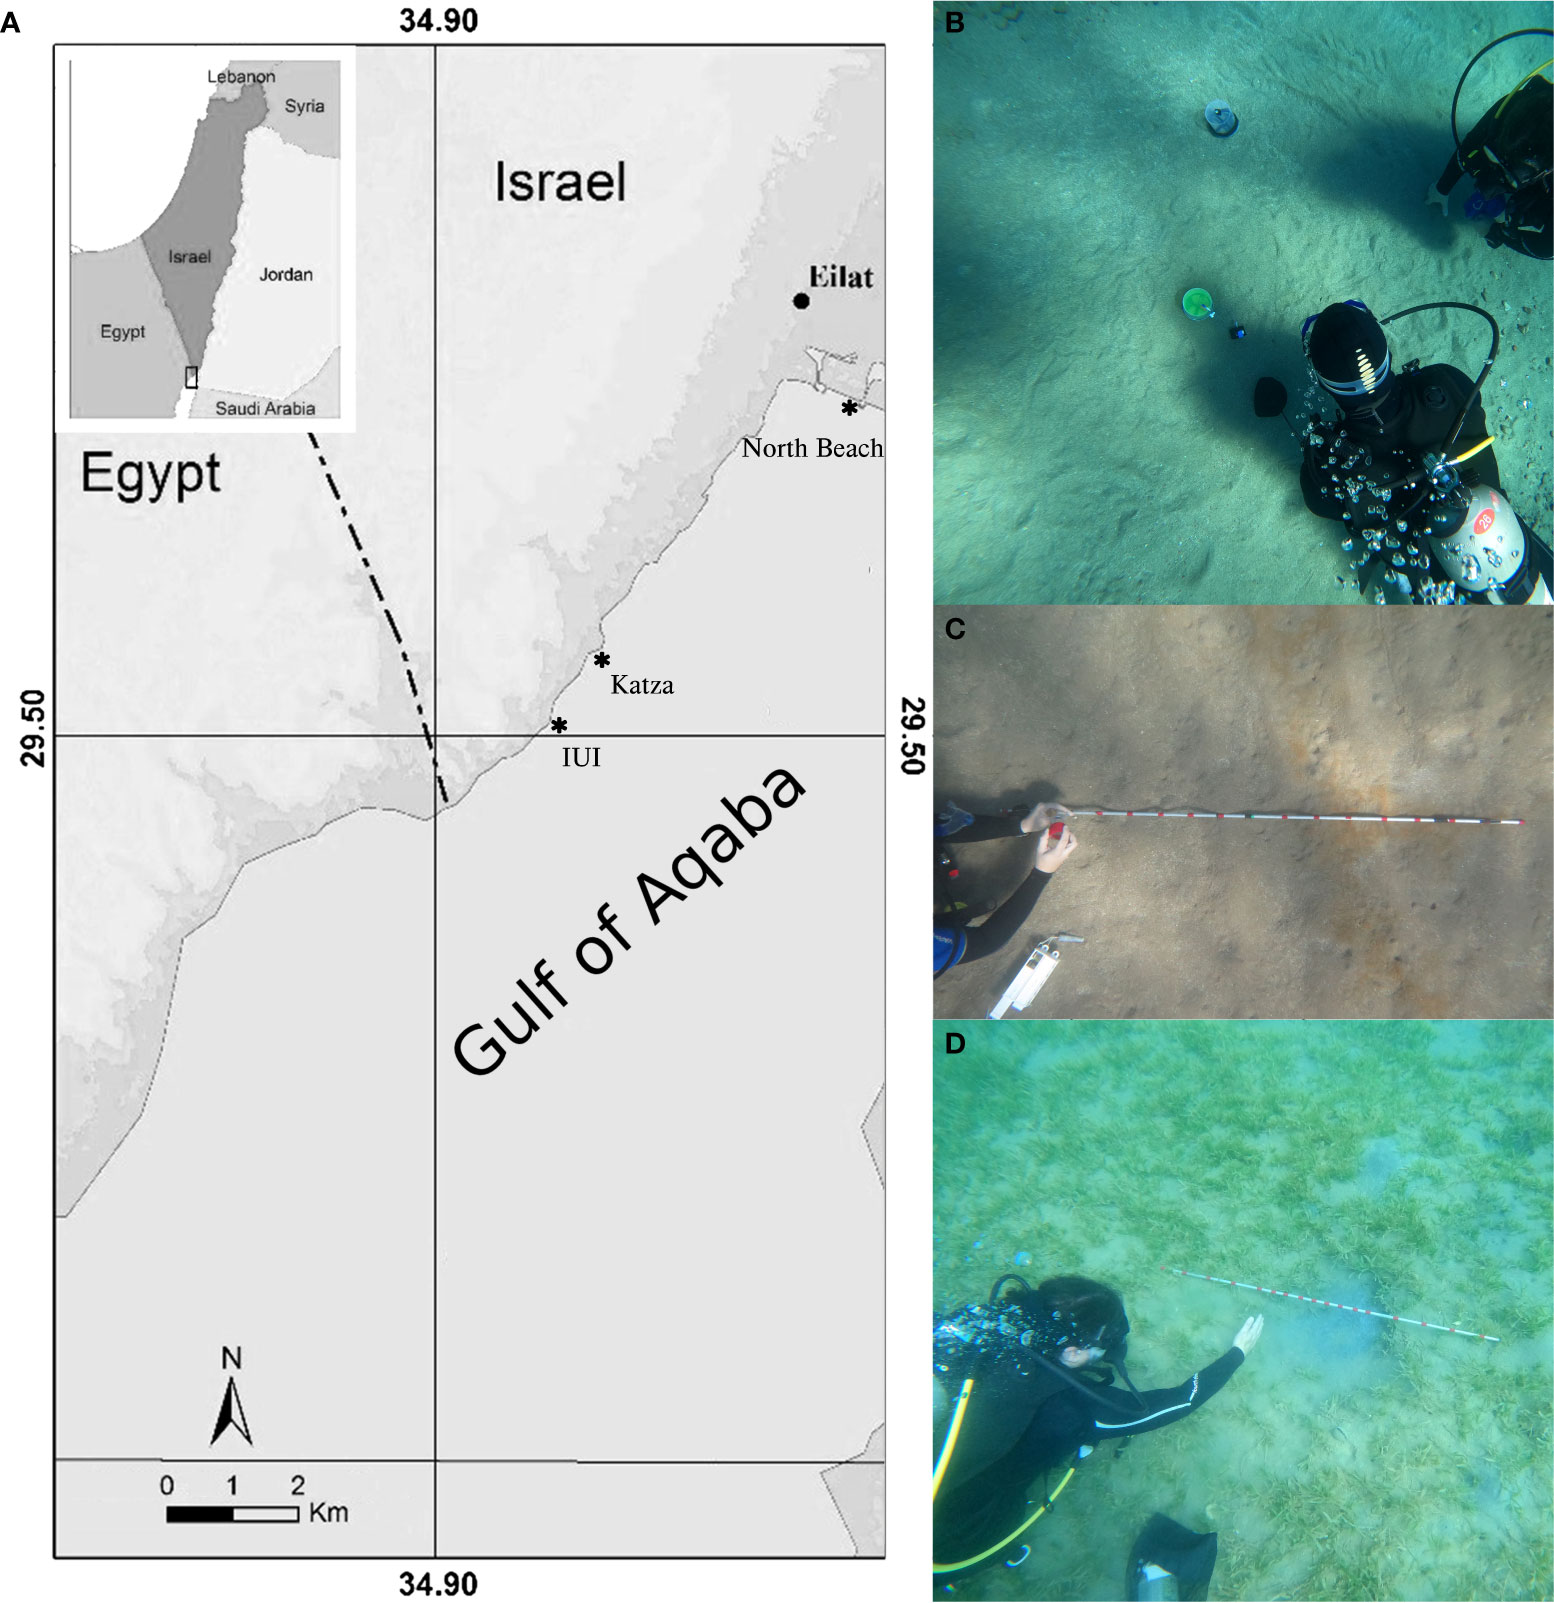
Figure 1 (A) Map of the study area with position of Israel and Red Sea relative to the surrounding countries (inset) (modified after Winters et al., 2017). The solid stars and the corresponding site names represent the localities where the in situ experiments were conducted. Photographs taken by the authors showing the environmental setting in (B) IUI, (C) Katza and (D) North Beach.
2.2 Numerical modelling
To model the breakthrough of Fluorescein with different Rhizon sampling depths we utilize the multi-component numerical reactive transport software CrunchTope (Druhan et al., 2013; Druhan et al., 2014; Steefel et al., 2015). We use CrunchTope to simulate contemporaneous advection over a 10 x 10 x 10 cm pore water box consisting of 40 x 40 x 100 cells (0.25 x 0.25 x 0.1 cm resolution) with flux or Danckwerts boundary conditions which requires continuity of advective flux across the boundaries. The initial box contains a fluid with the major ionic concentrations of sea water and the overlying water column (or Z-axis upper boundary condition) has the same major ionic concentrations with the addition of the non-reactive tracer Fluorescein. The permeability is fixed throughout the cell at a constant permeability of 8.4 x 10⁻⁵ m/s (West, 2010), apart from the ghost cell (z = 0) at the upper boundary which has a fixed permeability of 1 m/s to represent the seawater upper boundary. The pressure is fixed at each of the flux boundaries to a value of 2 Atmospheres to represent hydrostatic pressure at a shallow seafloor depth (10 mbsl). The presence of the Rhizon is modelled using a pump at the sampling depth plus 0.1 cm, which is extracting pore water at the rate of 10 ml/minute. The evolving pressure field created by the pump draws fluid from the surrounding cells and eventually the boundary conditions. The model is run for four different Rhizon depths, 1, 2, 3 and 4 cm below sediment surface for a total of 150 s at 5 second intervals extracting 25 ml, with the breakthrough curves showing the concentration of Fluorescein at the original Rhizon depth (0.1 cm above the pump locations).
2.3 Pore water sampling using Rhizon sampler
Rhizon samplers (Rhizosphere Research Products R.V., Wageningen, Rhizon CSS 19.21.23F) with a PVC/PE tubing (length—12 cm) and porous section (pore space of 0.15 µm and length of 5 cm) were utilized (Figure 2A). We designed a case made with polylactic acid (PLA) and/or Acrylonitrile butadiene styrene (ABS) material which covers the porous section of the Rhizon. It has a single opening for collection of water from a particular depth below the sediment surface. The luer lock of the Rhizon was either connected with a syringe or to a needle depending on the experiment. Two different vials varying in their maximum capacity—2 mL and 12 mL were utilized for storing the pore water. The vials were weighed, and vacuum was created inside them. The hydrophilic porous polymer of the Rhizon is inserted into the sediment and water is collected either by suction with the syringe or by inserting the needle into the vacuum vials. The vacuum inside the vials creates a suction which pulls in water through the Rhizon allowing for convenient collection underwater by SCUBA. This method allowed us to collect pore water from a maximum depth of 5 cm below the sediment-water interface while maintaining a resolution of ~1–2 cm. After collecting the pore water, the vials are weighed to determine the volume of water collected.
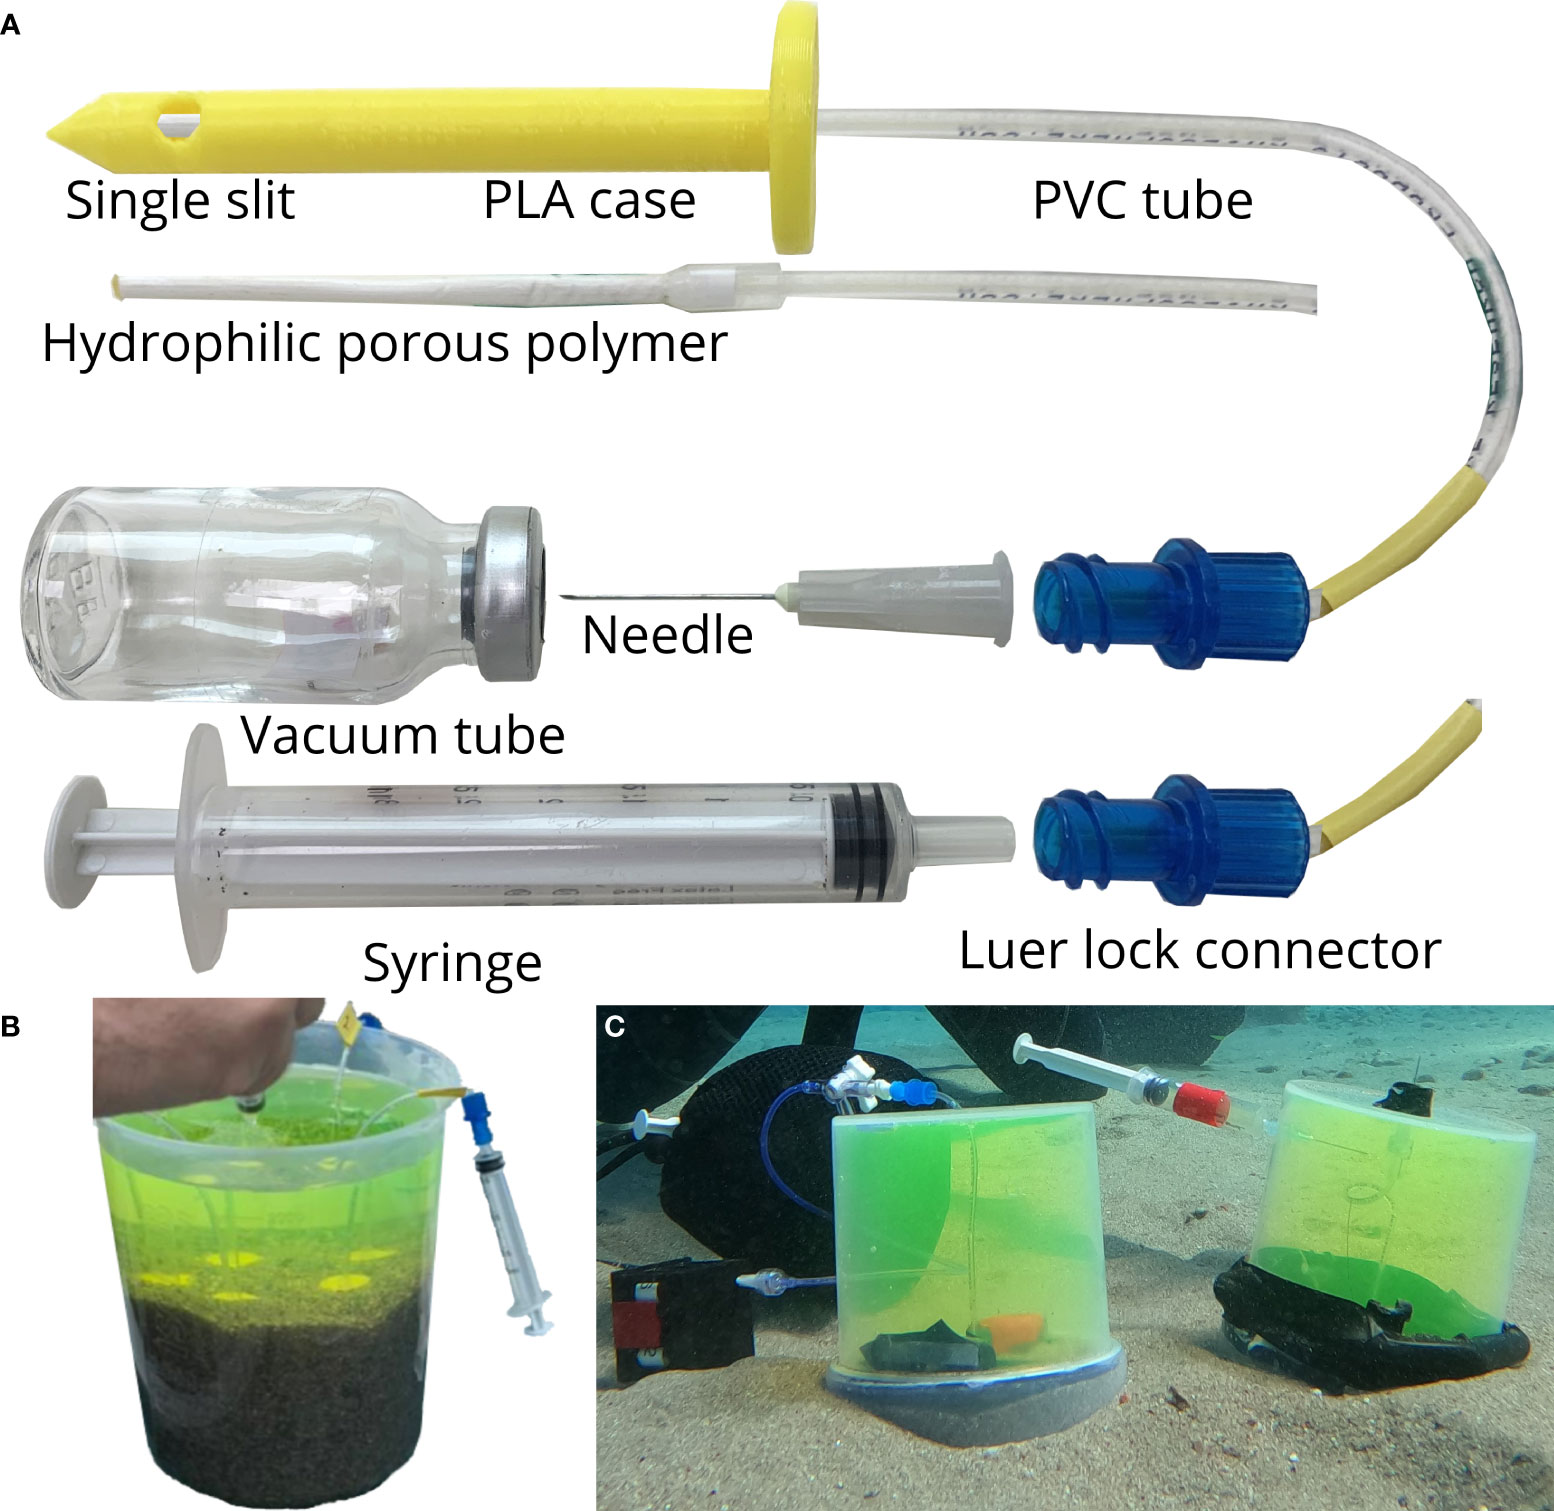
Figure 2 Schematic representation and photographs taken by the authors showing the Rhizon sampler setup and its application. (A) PLA/ABS case with a single slit opening which covers the hydrophilic porous polymer end of the Rhizon (length 5 cm, outer diameter 2.5 mm, pore size 0.1 µm, dead volume 0.5 mL) and the devices used for extracting pore water (vacuum vial, syringe). Pore water extraction by (B) inserting Rhizons through sediment and syringes in an experimental setup conducted in lab, and (C) inserting Rhizons through sediment and vacuum tubes in an experimental setup conducted in field.
2.4 Fluorescein experiment
The major issue associated with collecting pore water using the Rhizon sampler method is the possibility of contamination by overlying seawater through preferential flow during insertion. We designed two different experimental setups (lab and field based) to assess the impact of preferential flow caused by the insertion of the Rhizon by determining the incorporation of the overlying seawater in the pore water sampling system. The in-lab setup consisted of a plastic jar (14.5 cm diameter and 18.5 cm height) which contained ~9 cm sediment with seawater filling the rest of the jar (Figure 2B). We utilized sediment with three different grain sizes which are referred to as: 1. large (mesh size: 2000 µm), 2. small (1000 µm) and 3. mixed (which is a combination of large and small) for this experiment. Fluorescein was introduced in the water and thoroughly mixed. The overlying water mixture was collected using a syringe. Rhizons with PLA/ABS cases having the slit opening at different depths were inserted in the sediment. The pore water was collected through the Rhizon using the syringe.
The in-field experiments were conducted at IUI site and the set up consisted of a cylindrical plastic container with an internal diameter of ~11 cm and length of 12.1 cm (Figure 2C). A hole was drilled through the base of the chamber for inserting the Rhizon sampler and the jar was placed upside down on the sediment. Fluorescein was introduced and thoroughly mixed inside the jar using a syringe through a small hole drilled on the wall of the container. The fluorescein-water mixture inside the chamber overlying the sediment was collected in a syringe through the same hole. The pore water was collected in vacuum tubes through the Rhizon samplers. The fluorescein in the overlying and pore water samples for both the experiments were measured in a Varian Cary Eclipse spectrophotometer with wavelengths of 490–513 nm. The concentration of the fluorescein in the overlying sample for both the in situ and ex situ experiment is considered as the final concentration (100%).
2.5 Measurement of the ferrous iron concentrations
The concentration of ferrous iron was measured in pore water samples collected from Katza. Two different experiments were conducted on sediment patches with red surficial coloring. Experiment 1: We inserted four different Rhizons (representing four different depths due to positioning of the slits on the cap) for collecting pore water from a red patch. We collected a total of 10 mL porewater using each Rhizon while changing vials every 2 mL (Figure 5A), Experiment 2: We laid line transects on areas which contained red/brown patches (Figures 6A, C). Samples were taken with a horizontal resolution of 5 cm to minimize the impact that each Rhizon would have on adjacent Rhizons. The pore water samples were collected following the in-field pore water collection protocol utilized in the fluorescein experiment. Ferrozine reagent was used following Stookey, 1970 and the iron concentrations were measured in an Agilent Cary 8454 spectrophotometer with wavelength of 562 nm at the NEGEV Lab, IUI, Eilat. The detection limit for Fe was 1 µmol/L.
2.6 Sulfide analysis
The transect for sulfide (H2S) analysis was conducted in the North beach where black patches appear within the seagrass meadow due to seagrass die off caused by increased sulfide concentration in the sediment (Carlson Jr. et al., 1994) (Figures 7A, C). Samples were collected along a transit with a 5 cm horizontal resolution. The vacuum vials were filled with 2 mL Diamine (4%) prior to the pore water collection (Cline, 1969). We measured the sulfide concentration in the pore water sample in an Agilent Cary 8454 spectrophotometer with wavelength of 665 nm at the Negev Lab, IUI, Eilat. The detection limit for H2S was 1 µmol/L.
3 Results
3.1 Fluorescein experiment
3.1.1 Ex Situ
For the fluorescein experiment conducted in lab, we observe an increase in the fluorescein after an intake of 5 mL of the pore water every time we sampled from 1 cm depth irrespective of the sediment grain size (Figure 3A). When sampled at depth of 2 cm, the fluorescein remains relatively constant and below 20% till the first ~ 5–7.5 mL of pore water have been extracted following which we see a linear increase (Figure 3B). With an increase in the sampling depth (3, 4 and 5 cm), we observe an overall inclusion of less than 10% of the fluorescein except after ~12 mL at 3 cm depth (Figures 3C–E).

Figure 3 The proportion of fluorescein (%) in the samples with reference to the fluorescein in the overlying water as a function of the extracted volume of porewater through Rhizons for sediments with different grain sizes. This experiment was conducted in the lab. The large and small sized sediment grains were sieved through mesh with sieve size of 2000 µm and 1000 µm respectively and were mixed together in mix1, mix2 and mix 3 categories. The profiles represent porewater extraction when the single opening in the PLA/ABS case is at (A) 1 cm, (B) 2 cm, (C) 3 cm, (D) 4 cm and (E) 5 cm below the sediment surface. The corresponding theoretical model is plotted in required graphs.
3.1.2 In Situ
In the in situ (field) experiment we observed relatively lower concentrations of fluorescein entering the system. An excess of 10% fluorescein entered in the pore water only at depth of 1 cm and once (out of three times) at 2 cm after extracting 5 mL of pore water. The overall amount of fluorescein entering the sampling vials remains low and below 10% at greater depths with negligible concentrations of fluorescein measured at 3 cm and 4 cm depth (Figure 4).
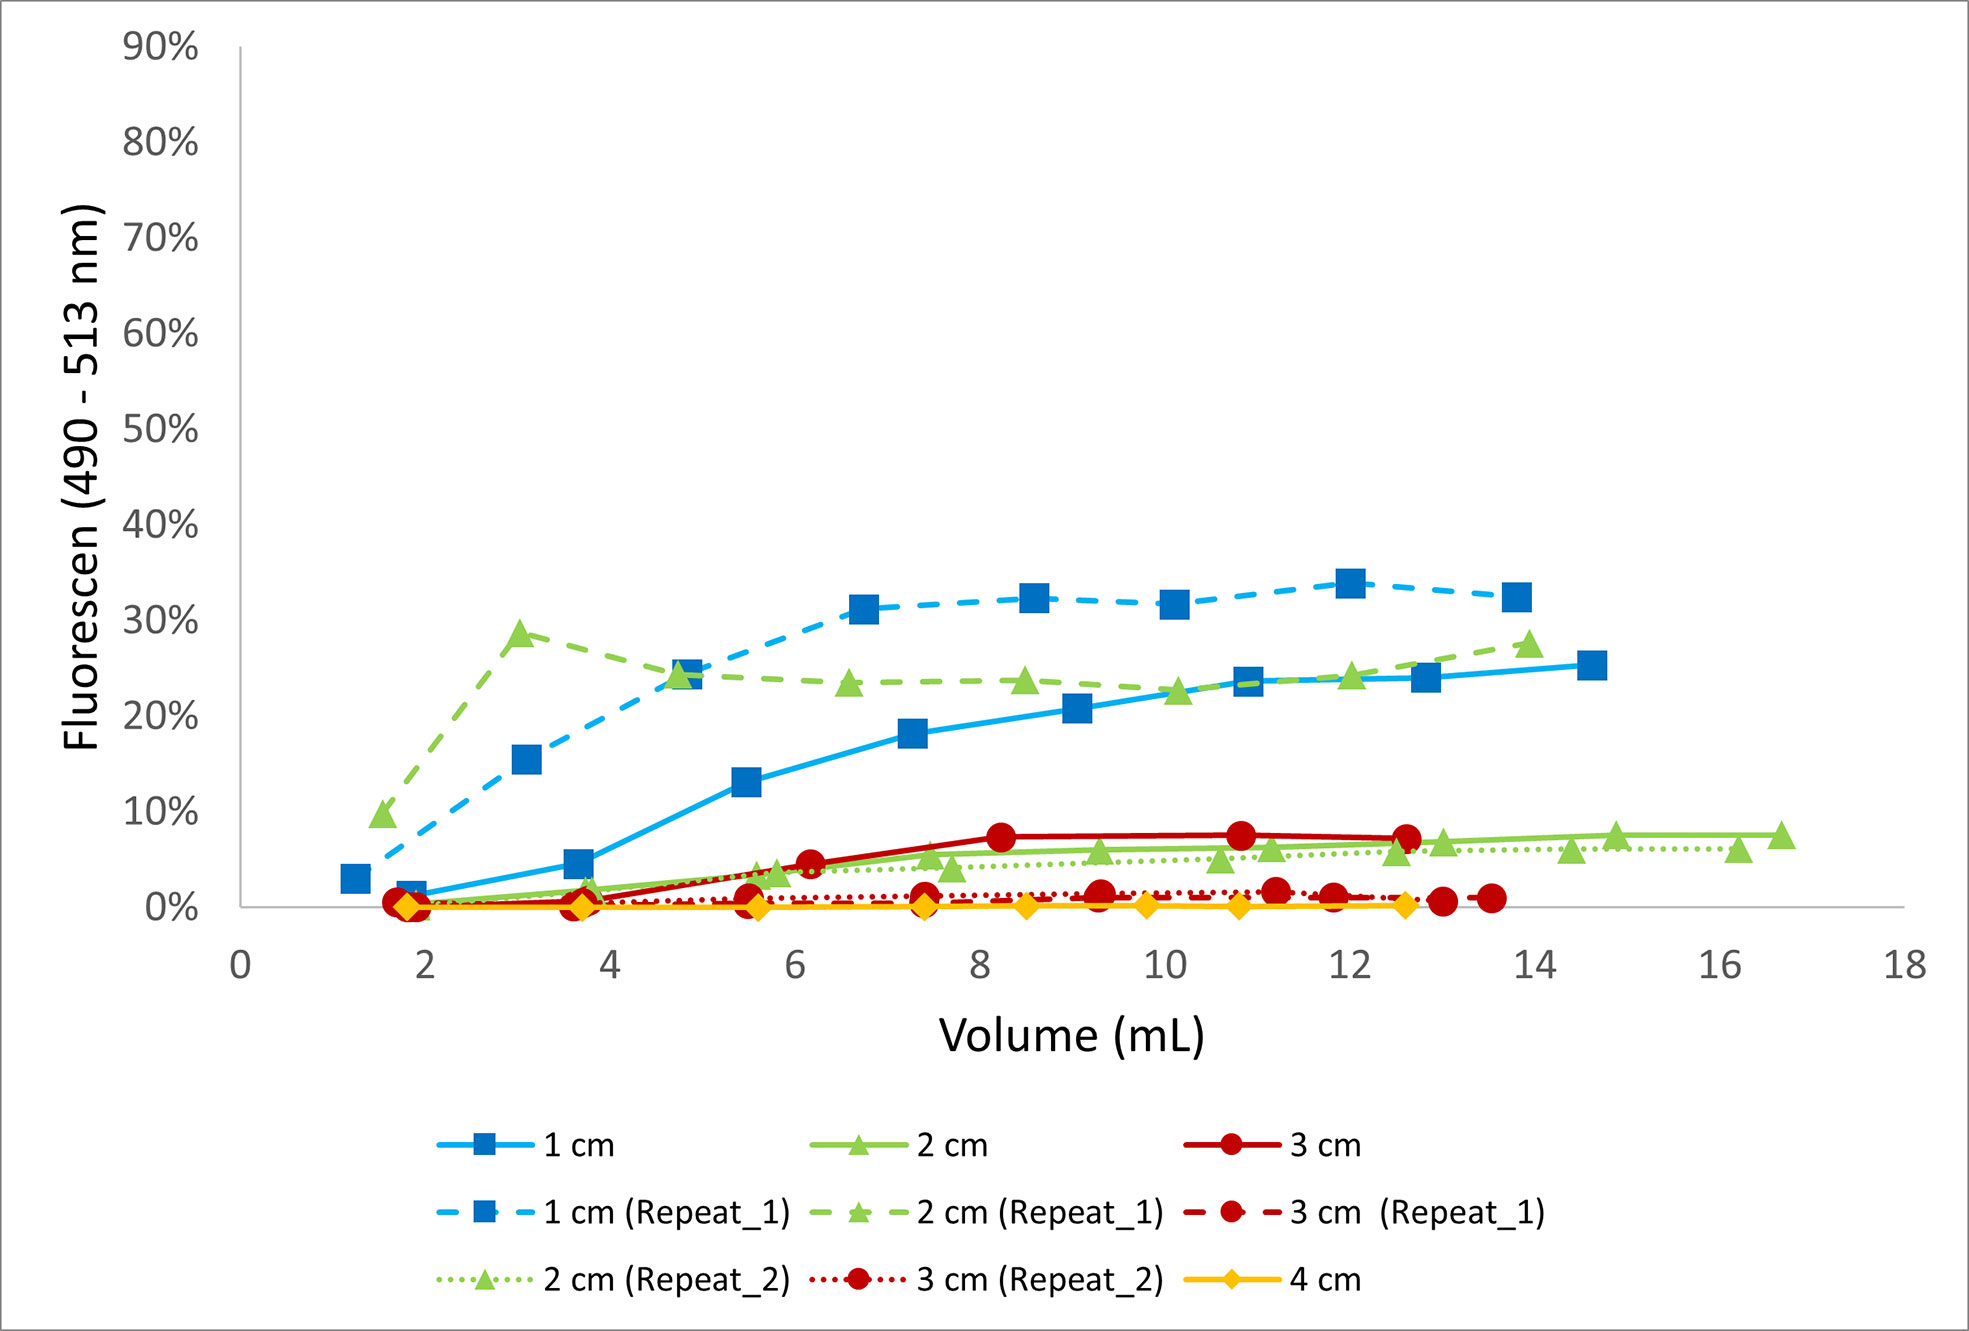
Figure 4 The proportion of fluorescein (%) in the samples with reference to the fluorescein in the overlying water as a function of the extracted volume of porewater through Rhizons from different depths. This experiment was conducted in the field.
3.2 Iron analysis
Figure 5B, demonstrates the relation between iron concentration and the amount of pore water collected at different depths ranging from 1–4 cm at 1 cm resolution. The concentration of Fe increases initially till 4 mL following which a saturation is attained. Overall, we observe an increase in saturated iron concentration with depth with a slight exception at 2 and 3 cm depth. The saturated Fe concentration value is lower for pore water collected from 3 cm (72.2 µmol/L) as compared to 2 cm (76.5 µmol/L). Figure 6 represents the redness on the sediment surface and the corresponding Fe concentration in the pore water from the same area before (Figures 6A, B) and after (Figures 6C,D) a storm event. There is a significant correlation between the surficial coloring and the measured iron concentrations (Figures 6B, D) and we observe a gradual increase of both from the edge to the center within the red patches. The pore water collected from the region outside the red patches has a significantly lower Fe concentration (Figures 6B, D). The peak values in Fe concentration observed for the same patch before (2000 µmol/L) and after (14 µmol/L) the storm event differed significantly.
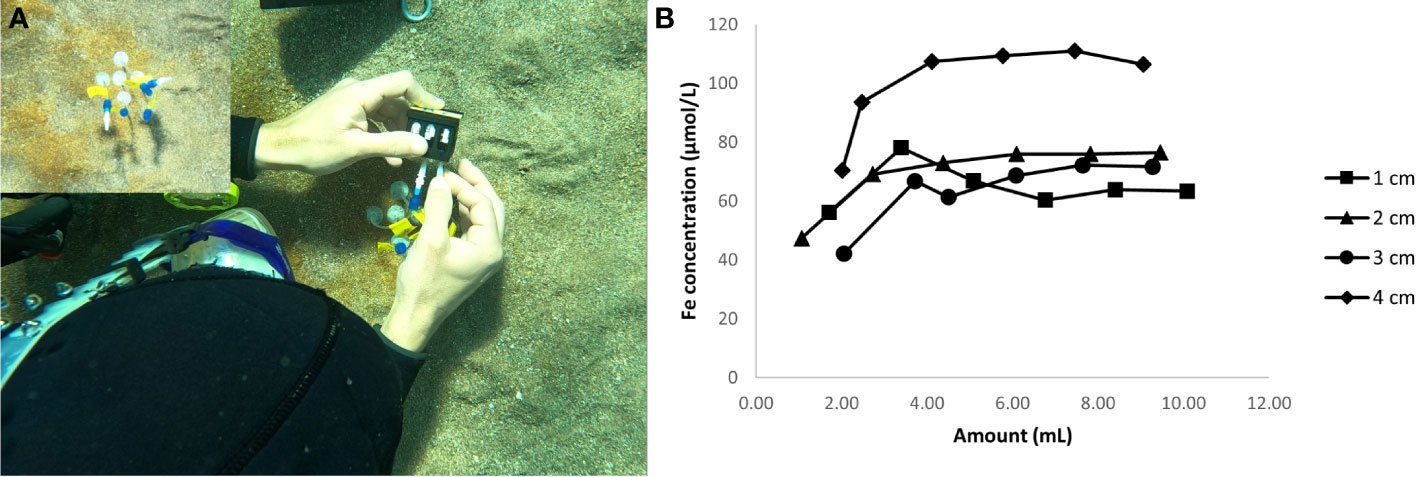
Figure 5 (A) Photographs taken by the authors showing the collection of pore water from one of the red patch using different Rhizons representing different depths in 2 mL vials, (B) Fe concentration in the pore water as function of the volume of porewater collected through Rhizons from different depths.
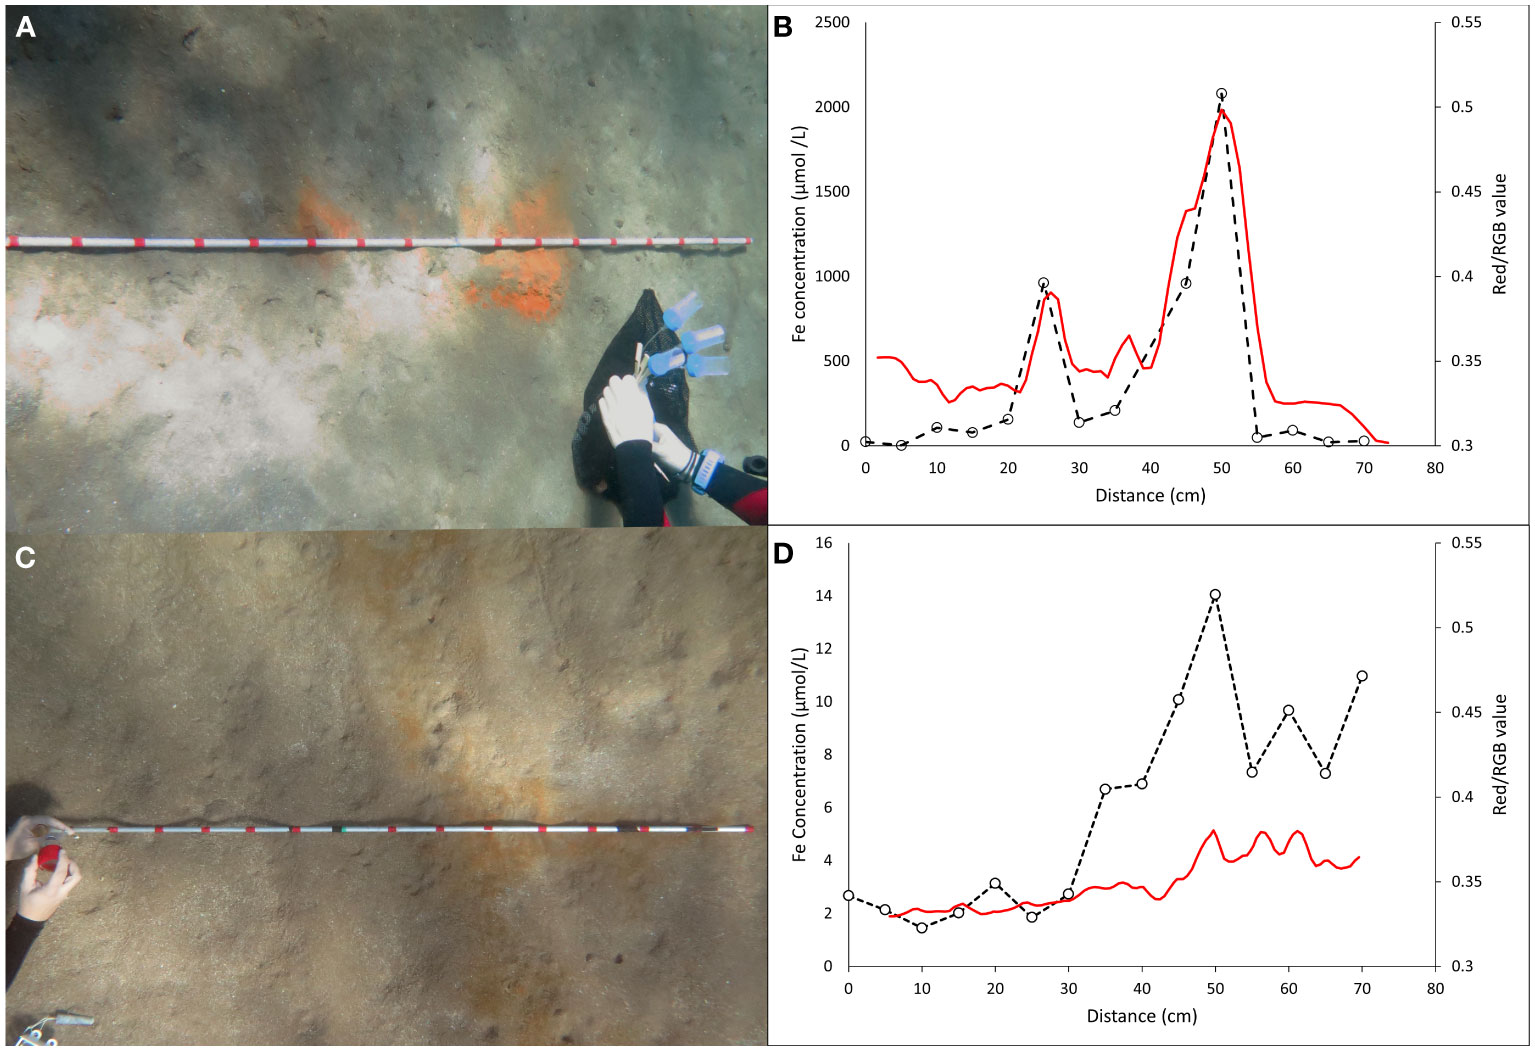
Figure 6 Photographs taken by the authors showing the line transect method for collecting pore water before (A) and after (C) a storm event. Collections were made at the red marks which are 5 cm apart. Fe concentration in the pore water and the intensity of redness as function of the sampling position in the sediment patch before (B) and after (D) a storm event.
3.3 Sulfide analysis
We observe 0 to 2 µmol/L concentration of sulfide in the region without the black patch. However, the pore water collected within the black patches of the sediment demonstrates presence of sulfide in the pore water and we observe a gradual increase from the edge to the center of the patch. This trend in sulfide concentration is similar for patches within the seagrass (Figure 7B) and sandy, seagrass devoid, environment (Figure 7D), with the peak reaching to 310 µmol/L and 384 µmol/L respectively.
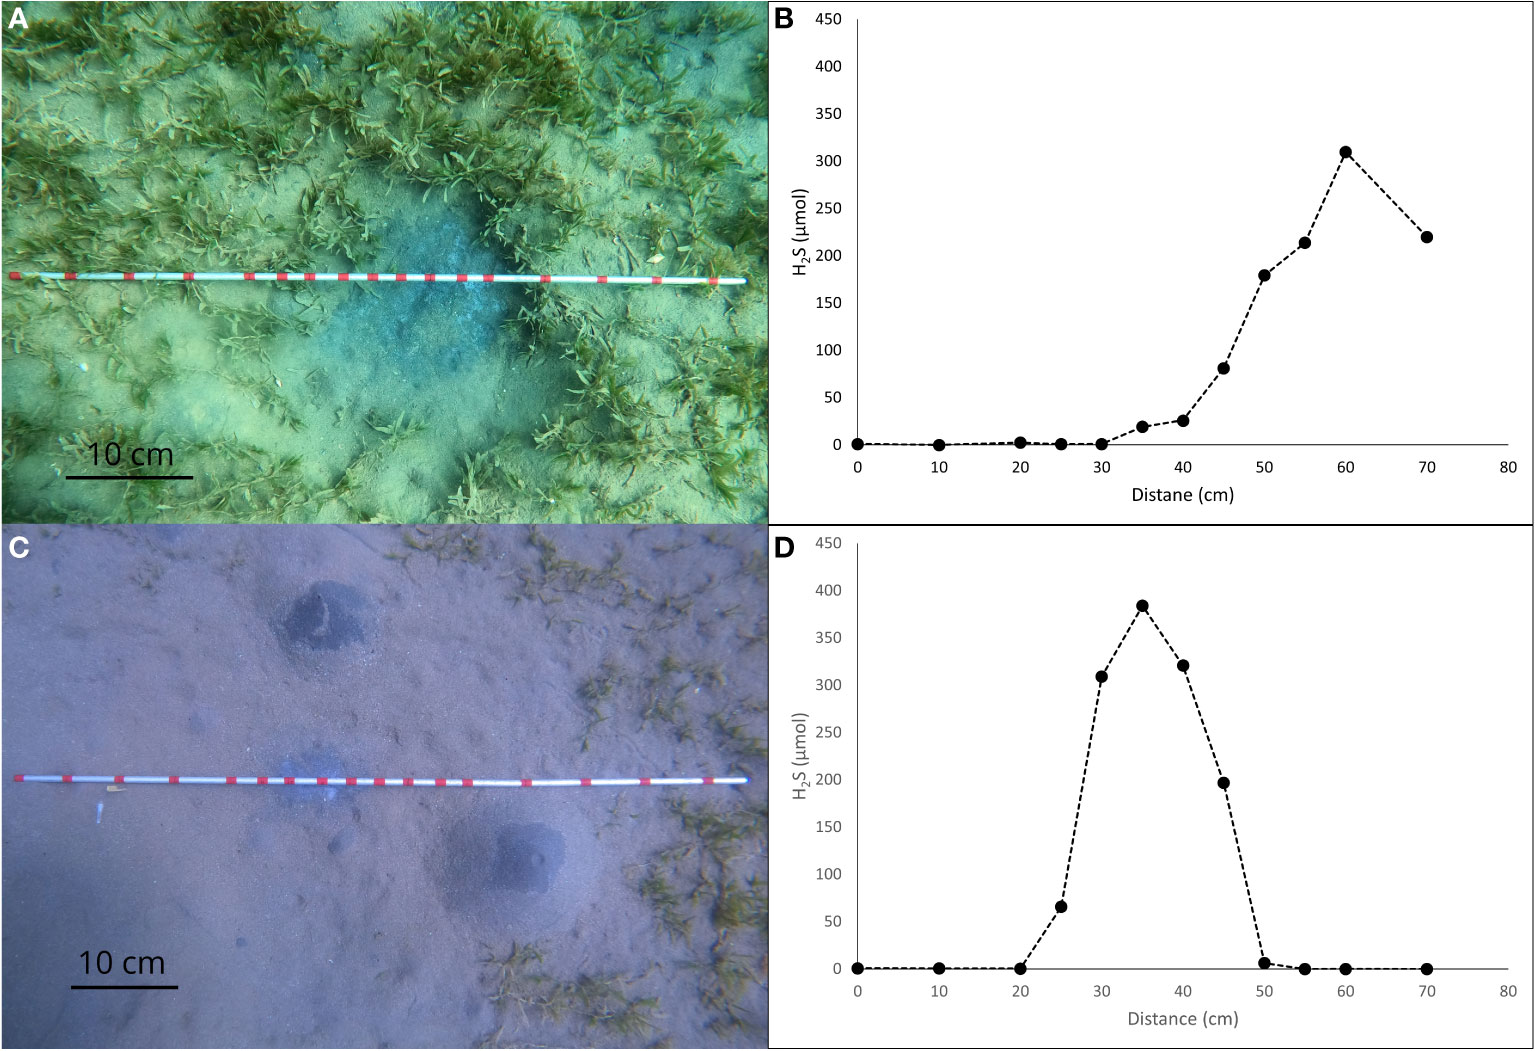
Figure 7 Photographs taken by the authors showing the line transect method for collecting pore water at a seagrass (A) and a non-seagrass (C) habitat. Collections were made at the red marks which are 5 cm apart. H2S concentration in the pore water as function of the sampling position in the sediment patch at a seagrass (B) and a non-seagrass (D) setting.
4 Discussion
Pore water chemistry is used to understand diagenetic processes, rate of benthic fluxes, and depositional environments in the sediment owing to their rapid and dynamic response to any subsurface chemical alterations (Aller, 2014; Steiner et al., 2018). Extracting pore water, especially from the uppermost 5 cm of sediments with coarse grain size (> 2 mm), however, is challenging. The most common extraction methods involves squeezing, centrifugation and Rhizon sampler with each method having advantages and/or disadvantages over others (Dickens et al., 2007; Schrum et al., 2012; Miller et al., 2014; Miller et al., 2017; Steiner et al., 2018). A common disadvantage with all the procedures developed so far is the disturbance of sediment column caused by insertion of sampling device. The Rhizon in situ sampler developed by Seeberg-Elverfeldt et al. (2005) has been an advancement in this aspect and creates very little disturbance in sediment with grain size ranging between 0.11 to 0.33 mm. This Rhizon sampling method involves implanting a poly carbonate platform which is 0.6 cm thick, ~ 5 cm wide (to protect the filter part of the Rhizons) and a height which varies depending on your sampling depth. In addition, there are nylon chords sticking out of the platform for manipulating the movement of the Rhizons. This deployment can be complex for sandy sediments of coastal environment with higher grain size, for underwater collection by self-contained underwater breathing apparatus (SCUBA) divers or for remotely operated underwater vehicles (ROVs).
By utilizing the PLA and ABS caps with slit opening at specific depths, we managed to vertically insert the Rhizon and collect water at desired depths (Figure 3). The closed system experiment in lab demonstrated detection of fluorescein in the pore water at 1 cm depth almost immediately after extracting water irrespective of the grain size of the sediment (Figure 3A). This suggests that the radius of influenced cylindrical volume around the slit openings are at least 1 cm (Seeberg-Elverfeldt et al., 2005). At 1 cm depth the model suggests a higher proportion of fluorescein entering the system given the same volume of pore water extracted. At 2 cm depth, we observe the entrance of fluorescein in the pore water almost immediately except for the smallest grain sized sediment (1 mm) used in our experiment where the fluorescein starts entering after ~10 mL (Figure 3B). This result indicates that given the grain size is 1 mm (maximum) or less, we can achieve a resolution of 2 cm for vertical depth profile through our method. The theoretical model indicates entrance of fluorescein after 18 mL of porewater extraction. At greater depth the model demonstrates no fluorescein in the system until 20 mL, however, irrespective of the grain size (1–2 mm), when more than 15 mL of water was drawn the proportion of fluorescein entering went above 10% (Figures 3C–E). This discrepancy between the model and the observed pattern in terms of early entrance of fluorescein in our experiment is most likely due to the closed system which allowed preferential flow of fluorescein from the top and along the boundaries of the inner wall of the container. Also there exists an additional influence of the adjacent Rhizons inserted in the sediment which are drawing water at the same time.
In the natural setting the proportion of fluorescein entering the pore water never goes above 30% irrespective of the depth profiles and stabilizes after collection of 4 mL (Figure 4). This suggests an overall lower preferential flow from the top and homogenization of fluorescein content in the pore water. The proportion of fluorescein entering the pore water decreases with depth of the slit through which the water is extracted with no fluorescein recorded below 3 cm. This vertical resolution was further supported by our case study of measuring the iron concentration at different depths, where we observed an overall increasing trend in the Fe concentration with depth (Figure 5). A discrepancy exists at 2 and 3 cm. The lower value at 3 cm rather than 2 cm demonstrates the heterogeneity within natural systems and for future work we recommend collecting multiple replicates especially when collecting pore waters within 3 cm of the sediment-water interface to capture the broader trends within the sediment column. We further recommend maintaining a resolution of at least 2 cm when the size of the sediment grains are more than 1 mm.
Previous studies, including the in situ sampling of pore water which involves the insertion of Rhizon horizontally limits our ability to characterize the underlying pore water geochemistry below areas of sediment with different surficial features. The vertical insertion of Rhizons as part of our method allowed us to assess the spatial variability in the concentration of both Fe and H2S in the pore water which were measured below red and black patches on the sediment surface respectively. The redness of the patches on the sediment surface represents the subsurface activity which is expressed as ferrihydrite veil on the surface. The iron after reacting with the available oxygen at the sediment-water interface forms ferrihydrate which controls the red color of the sediment surface. The congruence of the peak in redness and ferrous iron concentration in the pore water confirms the association between the surficial features and the subsurface activity. Similarly, sulfate reducing bacteria below the sediment-water interface reduces sulfate to sulfide which are located below the black patches on the sediment surface. The spatial variability in H2S concentration along with the presence of a peak likely due to formation of FeS in concentration at the black patch validates the same pattern.
Compared to other in situ sampling methods the method presented in our study requires minimal technical equipment and labor. We acknowledge the disadvantages associated with sampling artifacts e.g. contamination by overlying water at shallower depths (1–2 cm below sediment-water interface), the potential for clogging of the sampling slit due to sediment grains, sediment disturbances and the potential to create a preferential flow path. However, these could be dealt with by collecting multiple replicates of the pore water samples. In addition, due to the vacuum applied, there is a potential to loss dissolved gases, and for species where this is an important consideration another method should be used. The pore water can be utilized for myriad of geochemical studies, although, precaution should be taken as some of the colloids might be filtered out owing to small pore size of the Rhizon. The Rhizon method is ideal for assessing the spatial heterogeneity of pore water chemistry and has the potential to study depth profiles within the sediment at resolution of 1 to 2 cm. The low cost, reusable, equipment of the Rhizon and casing as well as the ease of sampling demonstrate the future utility of this method.
5 Conclusion
The present study demonstrates an easy, fast, and economical method to collect pore water from coarse sediment of coastal areas by employing Rhizon samplers. The deployment of Rhizon can be easily carried out by SCUBA divers and/or ROVs underwater. We validate the usage of the Rhizon sampler method by conducting two case studies where the pore water chemical properties represent the expected subsurface chemical and biological activities. The major disadvantage in using Rhizon has been previously stated to be the poor determination of the fluid migration distance. We placed PLA/ABS cap with a narrow circular opening on the porous section of the Rhizon samplers which demonstrated a depth resolution of 1 cm with best results observed at a depth of 2 cm or below the sediment surface. Utilizing this method, we recommend safe amount of porewater collection to be 10 mL after discarding the initial 2 mL to avoid any contamination from the overlying water. The method presented in this study, utilizes vertical insertion of the Rhizon which causes minimum disturbance in the sediment column with sediment grain size as high as 2 mm. The Rhizon sampler method, therefore, demonstrates high potential for easy in situ collection of pore water for various chemical analysis from permeable sandy sediments.
Data availability statement
The raw data supporting the conclusions of this article will be made available by the authors, without undue reservation.
Author contributions
SD, RS, ZL, and GA contributed to conception and design of the study. SD, RS, ZL, GV, and GA were involved in setting up the experiments and collecting underwater data. SD and HB performed the statistical analysis and the numerical model respectively. SD and GA wrote the first draft of the manuscript. HB wrote sections of the manuscript. All authors contributed to manuscript revision, read, and approved the submitted version.
Funding
Name of the granting agency: 1. Israel Science Foundation (2361/19) - Supported half of SD’s salary, the expenses related to procuring and usage of equipment and other essentials incurred during the project; 2. 2021-2022 IUI Post-Doctoral Fellowship Award - Provided half of the monthly salary for SD; 3. UKRI/NERC (NE/R013519/1) - Supported HJB’s expenses and also funds open access publication fees.
Acknowledgments
The authors acknowledge the Israel Science Foundation (ISF) (2361/19) and UKRI/NERC (NE/R013519/1) for financially supporting this work. SD is supported by IUI postdoctoral fellowship. We thank the dive center at IUI for providing us the necessary support for the dives. We are grateful to Inbal Kahan and Tanya Rivlin for the assistance with our dives and nutrient analysis respectively. And finally we convey our heartfelt appreciation to the reviewers for providing their valuable comments which helped improve the manuscript.
Conflict of interest
The authors declare that the research was conducted in the absence of any commercial or financial relationships that could be construed as a potential conflict of interest.
Publisher’s note
All claims expressed in this article are solely those of the authors and do not necessarily represent those of their affiliated organizations, or those of the publisher, the editors and the reviewers. Any product that may be evaluated in this article, or claim that may be made by its manufacturer, is not guaranteed or endorsed by the publisher.
Supplementary Material
The Supplementary Material for this article can be found online at: https://www.frontiersin.org/articles/10.3389/fmars.2022.968063/full#supplementary-material
References
Aller R. C. (2014). Sedimentary diagenesis, depositional environments, and benthic fluxes. In H. D. Holland, K. K. Turekian [eds.]Treatise on geochemistry. (Oxford: Elsevier). p. 293–334.
Anschutz P., Smith T., Mouret A., Deborde J., Bujan S., Poirier D., et al. (2009). Tidal sands as biogeochemical reactors. Estuar. Coast. Shelf Sci. 84, 84–90. doi: 10.1016/j.ecss.2009.06.015
Bacon M. P., Belastock R. A., Bothner M. H. (1994). 210Pb balance and implications for particle transport on the continental shelf, US middle Atlantic bight. Deep Sea Res. Part II Top. Stud. Oceanogr. 41, 511–535.
Beck M., Dellwig O., Kolditz K., Freund H., Liebezeit G., Schnetger B., et al. (2007). In situ pore water sampling in deep intertidal flat sediments. Limnol. Oceanogr. Methods 5, 136–144. doi: 10.4319/lom.2007.5.136
Campbell K. M., Root R., O’Day P. A., Hering J. G. (2008a). A gel probe equilibrium sampler for measuring arsenic porewater profiles and sorption gradients in sediments: I. laboratory development. Environ. Sci. Technol. 42, 497–503. doi: 10.1021/es071119b
Campbell K. M., Root R., O’Day P. A., Hering J. G. (2008b). A gel probe equilibrium sampler for measuring arsenic porewater profiles and sorption gradients in sediments: II. field application to haiwee reservoir sediment. Environ. Sci. Technol. 42, 504–510. doi: 10.1021/es071120a
Carlson P. R. Jr., Yarbro L. A., Barber T. R. (1994). Relationship of sediment sulfide to mortality of thalassia testudinum in Florida bay. Bull. Mar. Sci. 54, 733–746.
Charette M. A., Allen M. C. (2006). Precision ground water sampling in coastal aquifers using a direct-push, shielded-screen well-point system. Groundw. Monit. Remediat. 26, 87–93. doi: 10.1111/j.1745-6592.2006.00076.x
Cline J. D. (1969). Spectrophotometric determination of hydrogen sulfide in natural waters 1. Limnol. Oceanogr. 14, 454–458. doi: 10.4319/lo.1969.14.3.0454
Dickens G. R., Koelling M., Smith D. C., Schnieders L. (2007). Rhizon sampling of pore waters on scientific drilling expeditions: an example from the IODP expedition 302, Arctic coring expedition (ACEX). Sci. Drill. 4, 22–25. doi: 10.5194/sd-4-22-2007
Druhan J. L., Steefel C. I., Conrad M. E., DePaolo D. J. (2014). A large column analog experiment of stable isotope variations during reactive transport: I. a comprehensive model of sulfur cycling and δ34S fractionation. Geochim. Cosmochim. Acta 124, 366–393. doi: 10.1016/j.gca.2013.08.037
Druhan J. L., Steefel C. I., Williams K. H., DePaolo D. J. (2013). Calcium isotope fractionation in groundwater: molecular scale processes influencing field scale behavior. Geochim. Cosmochim. Acta 119, 93–116. doi: 10.1016/j.gca.2013.05.022
Froelich P. N., Klinkhammer G. P., Bender M. L., Luedtke N. A., Heath G. R., Cullen D., et al. (1979). Early oxidation of organic matter in pelagic sediments of the eastern equatorial Atlantic: suboxic diagenesis. Geochim. Cosmochim. Acta 43, 1075–1090. doi: 10.1016/0016-7037(79)90095-4
Hesslein R. H. (1976). An in situ sampler for close interval pore water studies 1. Limnol. Oceanogr. 21, 912–914. doi: 10.4319/lo.1976.21.6.0912
Huettel M., Ziebis W., Forster S. (1996). Flow-induced uptake of particulate matter in permeable sediments. Limnol. Oceanogr. 41, 309–322. doi: 10.4319/lo.1996.41.2.0309
Laffoley D., Grimsditch G. D. (2009). The management of natural coastal carbon sinks (Gland, Switzerland: Iucn).
Makemson J. C. (1972). An interstitial water sampler for sandy beaches. Limnol. Oceanogr. 17, 626–628. doi: 10.4319/lo.1972.17.4.0626
Miller M. D., Adkins J. F., Hodell D. A. (2014). Rhizon sampler alteration of deep ocean sediment interstitial water samples, as indicated by chloride concentration and oxygen and hydrogen isotopes. Geochem. Geophys. Geosyst. 15, 2401–2413. doi: 10.1002/2014GC005308
Miller C. M., Dickens G. R., Jakobsson M., Johansson C., Koshurnikov A., O’Regan M., et al. (2017). Pore water geochemistry along continental slopes north of the East Siberian Sea: inference of low methane concentrations. Biogeosciences 14, 2929–2953. doi: 10.5194/bg-14-2929-2017
Nelleman C. (2008). Blue carbon: the role of healthy oceans in binding carbon. In Corcoran E., Duarte C. M., Valdes L., DeYoung C., Fonseca L. (eds) Blue carbon: the role of healthy oceans in binding carbon. GRID-Arendal.
Nellemann C., Corcoran E. (2009). “Blue carbon: the role of healthy oceans in binding carbon,” in A rapid response assessment (UNEP/Earthprint).
Nissenbaum A., Presley B. J., Kaplan I. R. (1972). Early diagenesis in a reducing fjord, saanich inlet, British Columbia–i. chemical and isotopic changes in major components of interstitial water. Geochim. Cosmochim. Acta 36, 1007–1027. doi: 10.1016/0016-7037(72)90018-X
Sayles F. L., Wilson T. R. S., Hume D. N., Mangelsdorf J. P.C. (1973). In situ sampler for marine sedimentary pore waters: evidence for potassium depletion and calcium enrichment. Sci. (80-.). 181, 154–156. doi: 10.1126/science.181.4095.154
Schrum H. N., Murray R. W., Gribsholt B. (2012). Comparison of rhizon sampling and whole round squeezing for marine sediment porewater. Sci. Drill. 13, 47–50. doi: 10.5194/sd-13-47-2012
Seeberg-Elverfeldt J., Schlüter M., Feseker T., Kölling M. (2005). Rhizon sampling of porewaters near the sediment-water interface of aquatic systems. Limnol. Oceanogr. Methods 3, 361–371. doi: 10.4319/lom.2005.3.361
Sholkovitz E. (1973). Interstitial water chemistry of the Santa Barbara basin sediments. Geochim. Cosmochim. Acta 37, 2043–2073. doi: 10.1016/0016-7037(73)90008-2
Shotbolt L. (2010). Pore water sampling from lake and estuary sediments using rhizon samplers. J. Paleolimnol. 44, 695–700. doi: 10.1007/s10933-008-9301-8
Steefel C. I., Appelo C. A. J., Arora B., Jacques D., Kalbacher T., Kolditz O., et al. (2015). Reactive transport codes for subsurface environmental simulation. Comput. Geosci. 19, 445–478. doi: 10.1007/s10596-014-9443-x
Steiner Z., Lazar B., Erez J., Turchyn A. V. (2018). Comparing rhizon samplers and centrifugation for pore-water separation in studies of the marine carbonate system in sediments. Limnol. Oceanogr. Methods 16, 828–839. doi: 10.1002/lom3.10286
Stookey L. L. (1970). Ferrozine–a new spectrophotometric reagent for iron. Anal. Chem. 42, 779–781. doi: 10.1021/ac60289a016
Keywords: benthic biogeochemistry, coastal environments, grain size, Rhizon, sediment water interface
Citation: Dutta S, Saar R, Lavie Z, Vered G, Bradbury HJ and Antler G (2022) A method for a fast and economical in situ collection of pore water in sandy sediments. Front. Mar. Sci. 9:968063. doi: 10.3389/fmars.2022.968063
Received: 13 June 2022; Accepted: 24 August 2022;
Published: 21 September 2022.
Edited by:
Dong Feng, Shanghai Ocean University, ChinaReviewed by:
Xiting Liu, Ocean University of China, ChinaZhilei Sun, Qingdao Institute of Marine Geology (QIMG), China
Copyright © 2022 Dutta, Saar, Lavie, Vered, Bradbury and Antler. This is an open-access article distributed under the terms of the Creative Commons Attribution License (CC BY). The use, distribution or reproduction in other forums is permitted, provided the original author(s) and the copyright owner(s) are credited and that the original publication in this journal is cited, in accordance with accepted academic practice. No use, distribution or reproduction is permitted which does not comply with these terms.
*Correspondence: Saurav Dutta, c2F1cmF2Lmlpc2Vya0BnbWFpbC5jb20=; Harold J. Bradbury, aGpiNjJAY2FtLmFjLnVr; Gilad Antler, Z2lsYWRhbnRsZXJAZ21haWwuY29t