 Yaoping Mei1,2
 Yuan Tian
 Qinfeng Gao
 Shuanglin Dong
- 1Key Laboratory of Mariculture, Ministry of Education, Ocean University of China, Qingdao, China
- 2Function Laboratory for Marine Fisheries Science and Food Production Processes, Qingdao National Laboratory for Marine Science and Technology, Qingdao, China
Recently, abundant research has been devoted to investigating the variations of CO2 concentration in the atmosphere. However, the information of CO2 fluxes at the water-air interface remains limited, especially those from the respiratory metabolism of aquatic organisms. In the present study, a comprehensive analysis was carried out to evaluate the effects of different stocking densities of sea cucumber (Apostichopus japonicus) on the CO2 fluxes at water-air interface, and to explore the relationships between CO2 fluxes and respiratory metabolism. A total of 60 sea cucumbers were randomly classified into 4 groups with different stocking densities, including 2, 5 and 8 ind./tank (namely D2, D5 and D8 groups). After 34-day feeding trial, individuals in D5 had superior growth performance rather than D2 and D8. The analysis of modified floating static chambers clearly showed that the mean CO2 flux at the water-air interface in D5 was significantly higher than D2 and D8. Meanwhile, energy budget analysis revealed that D5 had higher carbon and nitrogen utilization, excretion energy and metabolizable energy, suggesting relatively active respiration metabolism in moderate stocking density. The activities of pyruvate dehydrogenase (PDH) and α-ketoglutarate dehydrogenase (OGDH) in respiratory tree and body wall tissues provided additional evidence for the higher respiration metabolism rate of individuals at D5, which may be responsible for the higher CO2 fluxes at the water-air interface. Transcriptome analysis was performed to uncover the molecular mechanism of respiratory metabolism affected by different stocking densities. The differentially expressed genes in respiration trees and body walls were significantly enriched in peroxisome, fatty acid degradation, and oxidative phosphorylation pathways. It may explain the differences of respiration metabolism rates at different stocking densities. The present study preliminarily revealed the CO2 fluxes variation at the water-air interface from aquatic invertebrates, and provided the scientific basis for the efficient and low-carbon agricultural technologies of sea cucumber.
1. Introduction
Carbon dioxide (CO2) is a pivotal long-lived greenhouse gas, which contributes about 80% of the NOAA Annual Greenhouse Gas Index from 1990 to 2020 (NOAA, 2020). In 2020, the global mean CO2 abundance in the air has reached 413.2 ppm with 149% increase compared to the pre-industrial revolution (WMO, 2021). Furthermore, the concentration of atmospheric CO2 will continue to increase for a long time in the future, which has received considerable attention from scientists and triggered research on aquatic ecosystems CO2 cycle. Among them, many of which are mainly focused on the balance between primary production and respiration at relevant spatial and temporal scales, and the status as the source or sink of atmospheric CO2 in aquatic ecosystems, such as rivers, lakes, reservoirs and wetlands (Yang et al., 2013; Chen et al., 2015; Wang et al., 2015). However, it lacked research on the direct effects of aquatic animals’ respiration on the water-air interface CO2 fluxes.
Respiration metabolism is a basic physiological activity of animals with the production of CO2. Changes in the respiration metabolism of aquatic organisms would directly affect the water-air interface CO2 fluxes. As known, some biotic and abiotic stresses are able to change the rates of respiratory metabolism of many aquatic vertebrates and invertebrates, such as osteichthyes (Liu et al., 2016), echinoderms (Bai et al., 2015; Kühnhold et al., 2017; Sin et al., 2019), crustaceans (Fernández-Cisnal et al., 2018; Bao et al., 2020; Ulaje et al., 2020) and molluscans (Haure et al., 2003; Romo et al., 2009). Oxygen consumption rate is generally worked as an important indicator to assess their respiratory and metabolic status. However, little literature is performed to measure respiratory metabolism based on CO2 production. Therefore, the study of aerobic respiratory metabolism together with the water-air interface CO2 fluxes in a single species culture system may provide new perspectives on understanding the respiratory mechanism and ecological functions of aquatic animals.
The aquaculture industry has grown rapidly in recent years due to the increasing requirements for higher quantities of aquatic products. Stocking density, an essential abiotic element, is generally affecting growth (Pei et al., 2014; Zhang et al., 2016), development (Motta et al., 2020), welfare (Liu et al., 2019a) and some other physiological processes (Pei et al., 2012; Xia et al., 2017a) of aquaculture species. Respiratory metabolism affected by stocking density may be variable or even contradictory, depending on the species, rearing conditions and developmental stage of aquatic animals. Previous studies have indicated that the respiratory metabolism of fishes was inhibited with stocking density increased (Liu et al., 2016; Liu et al., 2019b). In sharp contrast, increasing stocking density greatly improves the growth performance and physiological status of white shrimp (Litopenaeus vannamei) (Liu et al., 2017). In short, stocking density affects respiratory metabolism-related enzyme activities and metabolites of aquatic animals have been conducted. However, few works of literature were focused on respiratory mechanisms, tightly related to the water-air interface CO2 fluxes of aquatic ecosystems.
Sea cucumber (Apostichopus japonicus) is an economically important mariculture species in China. As typical deposit-feeding species, it can modify environmental physical and chemical parameters by burrowing and feeding activities. Therefore, sea cucumber might be an excellent material to study carbon migration and transformation. The ecological effects of sea cucumbers on integrated aquaculture systems have been extensively reported in recent documents (Zhang and Kitazawa, 2016; Zamora et al., 2018; Chary et al., 2020). Content and occurrence forms of nutrients in sediment, including carbon (Li et al., 2014; Hou et al., 2017), nitrogen and phosphorus (Ren et al., 2010; Gao et al., 2019) are greatly affected by the movement, feeding and excretion activities of sea cucumber. In this study, experiments were carried out to determine the water-air interface CO2 fluxes at different stocking densities and explored the connection between CO2 fluxes and the respiratory metabolism of sea cucumbers. Moreover, the gene expression patterns were also determined to uncover the molecular mechanism of respiratory metabolism affected by stocking densities in sea cucumbers. The results would provide valuable resources to enrich the knowledge of physiological mechanism and ecology of sea cucumbers and could offer a scientific basis for efficient and low-carbon culture technologies development and aquaculture sustainable development.
2. Materials and methods
2.1 Ethics statement
All animal experiments were conducted following the guidelines and approval of the respective Animal Research and Ethics Committees of Ocean University of China (Permit Number: 20141201). The field studies did not involve any endangered or protected species.
2.2 Experimental design
The experiment was carried out at the laboratory of Qingdao National Ocean Scientific Research Center, Ocean University of China. Sea cucumbers used with similar size (initial weights: 10.57 ± 0.05g) in this study were collected from a local commercial farm. Before formal experiments, all individuals acclimated in 140 L (70 × 50 × 40 cm) plastic tanks for 2 weeks. After acclimatizing to the laboratory conditions, these individuals were randomly divided into four different densities and cultured in 72L glass tanks (60 × 30 × 40 cm). The four density groups with four replicates were set as 0, 2, 5 and 8 individuals per tank, which were namely D0, D2, D5, and D8, respectively. During the 34-d experiment, the water environment was kept relatively constant during the periods of acclimation and formal experiment. By using a circulating water refrigerator with automatic temperature control (Zhejiang Sensen Industry Co., Ltd, Sunsun HYH-0.75DR-B) to keep seawater temperature at 16.5 ± 0.5°C, salinity at 32‰ and to maintain continue aerating. The aquarium water was exchanged 1/3 per day with filtered seawater. The commercial pelleted diet (Qingdao Hiford Ecology Technology Co., Ltd) was used once daily at 16:00 to feed sea cucumbers with the ration of 3% body weight.
2.3 Gas collection and measurement
During the period of formal experiment, the gas collection was conducted for four times (Time1, Time2, Time3 and Time4) with 1-week intervals at fixed timepoints, including 9:00-9:30 am, 1:30-2:00 pm and 6:00-6:30 pm. There was no changing water, no feeding and no aerating during the periods of gas collection. The water-air interface CO2 was sampled with the modified floating static chambers (Chen et al., 2015). At sampling, a lid (60 × 30 cm) covered the tank as a chamber for gas collection. Gas samples mixture was collected in the same place of the lid with a vertical vent. Prior to gas collection, the air in the chamber should be mixed carefully by pumping the 100 mL syringe several times. After deployment, 10 min intervals were set to draw samples from chambers, and four samples were collected in every tank at one sampling time. The empty gas bags (Dalian Delin Gas Packing Co., Ltd) were used to load gas samples. And these samples were taken to the laboratory and analyzed as soon as possible.
Gas samples were analyzed using GC-2010 plus Gas Chromatograph (Shimadzu) connected with MGS-4 gas sampler and MTN-1 methanizer. First, the gas samples were charged in MGS-4 gas sampler and separated from column SS-2m × 2mm at 40°C packed with TDX (60-80 mesh). Then, separated CO2 was catalyzed into CH4 in the methanizer at 375°C. At last, CH4 was submitted to FID detector and determined at 220°C. The gases flow rates of N2, H2 and compressed air were set at 30, 20 and 400 mL min-1, respectively. To ensure the accuracy of sample detection, standard gases (Qingdao Dehai Weiye Technology Co., Ltd, 482ppm) were measured for every four gas samples and the relative standard deviation was less than 0.55% in this study. So based on the speed of linear changes in the chamber, we used an equation to calculate CO2 fluxes.
2.4 Energy, organic carbon and nitrogen budget determination
One day before gas sampling, water samples were filtrated through 0.45μm PES (Jinteng) filters, stored in a clean centrifuge tube (50 mL) and then transported to the laboratory immediately, stored in a -20°C until measured. DOC (dissolved organic carbon) of all water samples was measured by multie2100s TOC analyzer (Analytikjena, German).
The quantities of feed supplied to D2, D5 and D8 were noted daily. The residual feed and excrement were collected and noted in the experimental. The whole individual sea cucumbers samples were collected at the initial and end of the formal experiment, then the organic carbon and nitrogen of feed, the residual feed and excrement, and whole individual sea cucumbers samples were measured by an elemental analyzer (Vario EL Ш, Elementar, Germany). The oxygen bomb calorimeter (PARR6400, Parr Instrument Company) was used to determine the energy levels of these samples.
The nitrogen and energy budget were calculated as the following equation (Yuan et al., 2007; Pei et al., 2012):
CN = UN + GN + FN
where CN is the nitrogen from feed, UN is the nitrogen excreted from animals, GN is the nitrogen deposited in animal tissue, AN is the nitrogen assimilated in animals, FN is the nitrogen lost in feces; C is the energy supplied, F represents the produced feces energy, G is animal growth energy, U is ammonia excretion energy and R stands for energy lost in respiration, the value 24830 is the excreted ammonia energy content (J g− 1).
The organic carbon budget was allocated to different physiological processes (Meng et al., 2013):
where CC is the feed carbon content, GC represents the carbon accumulated in animal tissue, FC is the feces carbon, RC stands for the respiration metabolism carbon.
2.5 Measurement of growth performance and enzyme activities
After the density experiment, the sea cucumbers were starved for 48h to ensure that the gut contents were fully evacuated before they were weighed and dissected. All sea cucumbers were weighted and weight gain (WGR), feed conversion ratio (FCR), the specific growth rate (SGR) and feeding rate (FR) as given below.
where, W0 and Wt were the initial and final body weights of the sea cucumber (g); t (d) is the duration of the experiment.
After being dissected on ice, three tissues were collected, including the coelomic fluid, respiratory trees and body walls. Among these tissues, the supernatant of centrifuged coelomic fluids was collected for later enzyme activity analysis. The rest of the tissues were rapidly frozen and stored at −80°C until RNA extraction.
The activities of pyruvate dehydrogenase (PDH) and α-ketoglutarate dehydrogenase (OGDH) were determined by a detection kit (G-Clone Biotechnology Co., Ltd, Beijing, China) and the coelomic fluid was used for enzymatic analysis, others were preprocessed according to instructions.
2.6 Transcriptome analysis
2.6.1 Library preparation and RNA-Seq
The respiratory trees and body walls of D2, D5 and D8 were selected for RNA-Seq. Total RNA of samples was extracted using RNA 6000 Nano kit (Agilent) according to the manufacturer’s instructions. After using 2100 Bioanalyser (Agilent) and the ND-2000 (NanoDrop Technologies) determining, we used the high-quality RNA samples to construct sequencing libraries on Illumina NovaSeq6000.
2.6.2 Bioinformatics analysis
The raw paired end reads were trimmed and quality controlled by SeqPrep (https://github.com/jstjohn/SeqPrep) and Sickle (https://github.com/najoshi/sickle) with default parameters. Clean reads were obtained by removing reads containing adapter, poly-N, and other low-quality reads. The reads were used to calculate the Q20, Q30 and GC contents. The A. japonicus genome and gene model annotation files (Zhang et al., 2017) were downloaded from the NCBI database (https://www.ncbi.nlm.nih.gov/genome/12044). Clean reads were mapped to the reference genome using Hisat2 with default parameters. The featureCounts software in Subread programs was employed to construct the counts matrix. Differentially expressed genes (DEGs) between two groups (triplicate per group, two tissue) were determined using DESeq2 R package. The significant threshold was set as |log2 (foldchange)| > 1 and adjusted p-value<0.05.
To investigate the potential biological function of these DEGs, KEGG pathway enrichment analysis was performed using KOBAS (http://kobas.cbi.pku.edu.cn/home.do) based on the whole-transcriptome background. The KEGG pathways with Bonferroni-corrected p-value< 0.05 were considered as significance and visualized using ggplot2 R package.
2.6.3 Quantitative real-time PCR (RT-qPCR) validation
Total RNA of each sample was reverse transcribed into cDNA using the HiScript ® III RT SuperMix for qPCR (+gDNA wiper) (Vazyme, Nanjing, China). The final cDNA products were diluted and stored at -20°C for following RT-qPCR. 10 DEGs were randomly picked for validation to confirm the accuracy of RNA-Seq. Primer 6.0 software was used to design specific primers (Table S1). The RT-qPCR experiments were performed using the method of SYBR Green quantitative real-time PCR on an Applied Biosystems™ QuantStudio™ 5 detection system (Thermo Fisher Scientific). The RT-qPCR was carried out in technology triplicates with the ChamQ™ SYBR R Color qPCR Master Mix (Low ROX Premixed) (Vazyme, Nanjing, China) in a reaction system of 20.0 μL, containing 10.0 μL 2 × ChamQ SYBR Color qPCR Master Mix (Low ROX Premixed), 2.0 μL diluted cDNA template, 0.4 μL 10 μmol/L each primer and 7.2 μL RNase-free water. The RT-qPCR program was set as follows: 95°C, 10 min; 40 cycles with 95°C for 15 s, annealing temperature (shown in Table S1) for 30s. To make sure the single product, melt curve analysis (60–95°C) was performed at the end of each run. In the present study, all amplification efficiencies were between 94% and 103%. The 2−ΔΔCt (Livak and Schmittgen, 2001) method was used to calculate target genes relative expression levels and normalized with CYTB.
2.7 Statistical analysis
SPSS 21.0 software was conducted for statistical analysis. Results are shown as mean ± standard deviation (S.D.). Data were checked for normality and homogeneity of variances, respectively. All data were statistically analyzed with one-way analysis of variance (ANOVA) with Bonferroni’s post-test analysis was used to compare treated groups with the controls, and the significance level between dates was considered as P< 0.05.
3. Results
3.1 Growth parameters
Table 1 showed the growth performances of sea cucumber at different stocking densities. In the beginning, no significant difference was observed in the initial body weights of sea cucumbers among different density groups (10.57 ± 0.05g). After the 34-d feeding trial, the results showed that significant differences were observed in the final body weights, SGR, WGR and FCR between different density groups (P< 0.05). The final weight, SGR and WGR of D5 were significantly higher than those of D8, while no significant differences were identified between D2 and D8. The FCR of D8 (7.14 ± 0.99) was significantly higher than those of D5 (2.81 ± 0.60), but no significant difference in FCR existed between D2 and D5.

Table 1 Growth performance of sea cucumber at different stocking densities.
3.2 Variations of the water-air interface CO2 fluxes
The variations of CO2 fluxes in the morning, noon and dusk were visualized and displayed in Figures 1A-C, respectively. During the experiment, D0 was sTable (P > 0.05). The CO2 fluxes at D2 and D5 showed the same trend with sampling time in the morning, and the value of Time4 was the highest, followed by Time2, Time3 and Time1. In contrast, D8 showed different changes, and the order of which were followed: Time3 > Time4 > Time2 > Time1. In four sampling times, the CO2 fluxes at D5 were the highest. And D2 was higher than those in D8 in the morning except Time3. Mean CO2 fluxes at D5 (30.62 mg. m−2 h−1) was significantly higher than that in D2 (25.76 mg. m−2 h−1) and D8 (25.03 mg. m−2 h−1) (P < 0.05), while no significant difference detected between D2 and D8 in the morning during the experimental period (Figure 1D, P > 0.05). The water-air interface CO2 fluxes at D2 and D5 showed the same trend with sampling time at noon, and the value of Time4 was the highest, followed by Time2, Time3 or Time1. In contrast, D8 showed an overall increasing trend with sampling times. At four sampling times, the water-air interface CO2 fluxes at D5 were the highest. And D8 was higher than those in D2 at noon except Time2. Mean CO2 flux at D5 (30.22 mg. m−2 h−1) was significantly higher than that in D8 (24.77 mg. m−2 h−1) and D2(24.09 mg. m−2 h−1) (P < 0.05), while no significant difference observed between D8 and D2 at noon during the experiment (Figure 1D, P > 0.05). The water-air interface CO2 fluxes at D2 showed increased and D5 showed decreased and then increased with sampling time at dusk. While D8 showed decreased with sampling times. In three sampling except Time1, the water-air interface CO2 fluxes at D2 was higher than those in D8 at dusk. Mean CO2 flux at D5 (30.22 mg. m−2 h−1) was significantly higher than that in D2 (24.77 mg. m−2 h−1) and D8 (24.09 mg. m−2 h−1) (P < 0.05), and D8 was significantly lower than that in D2 at dusk during the experimental period (Figure 1D, P < 0.05).
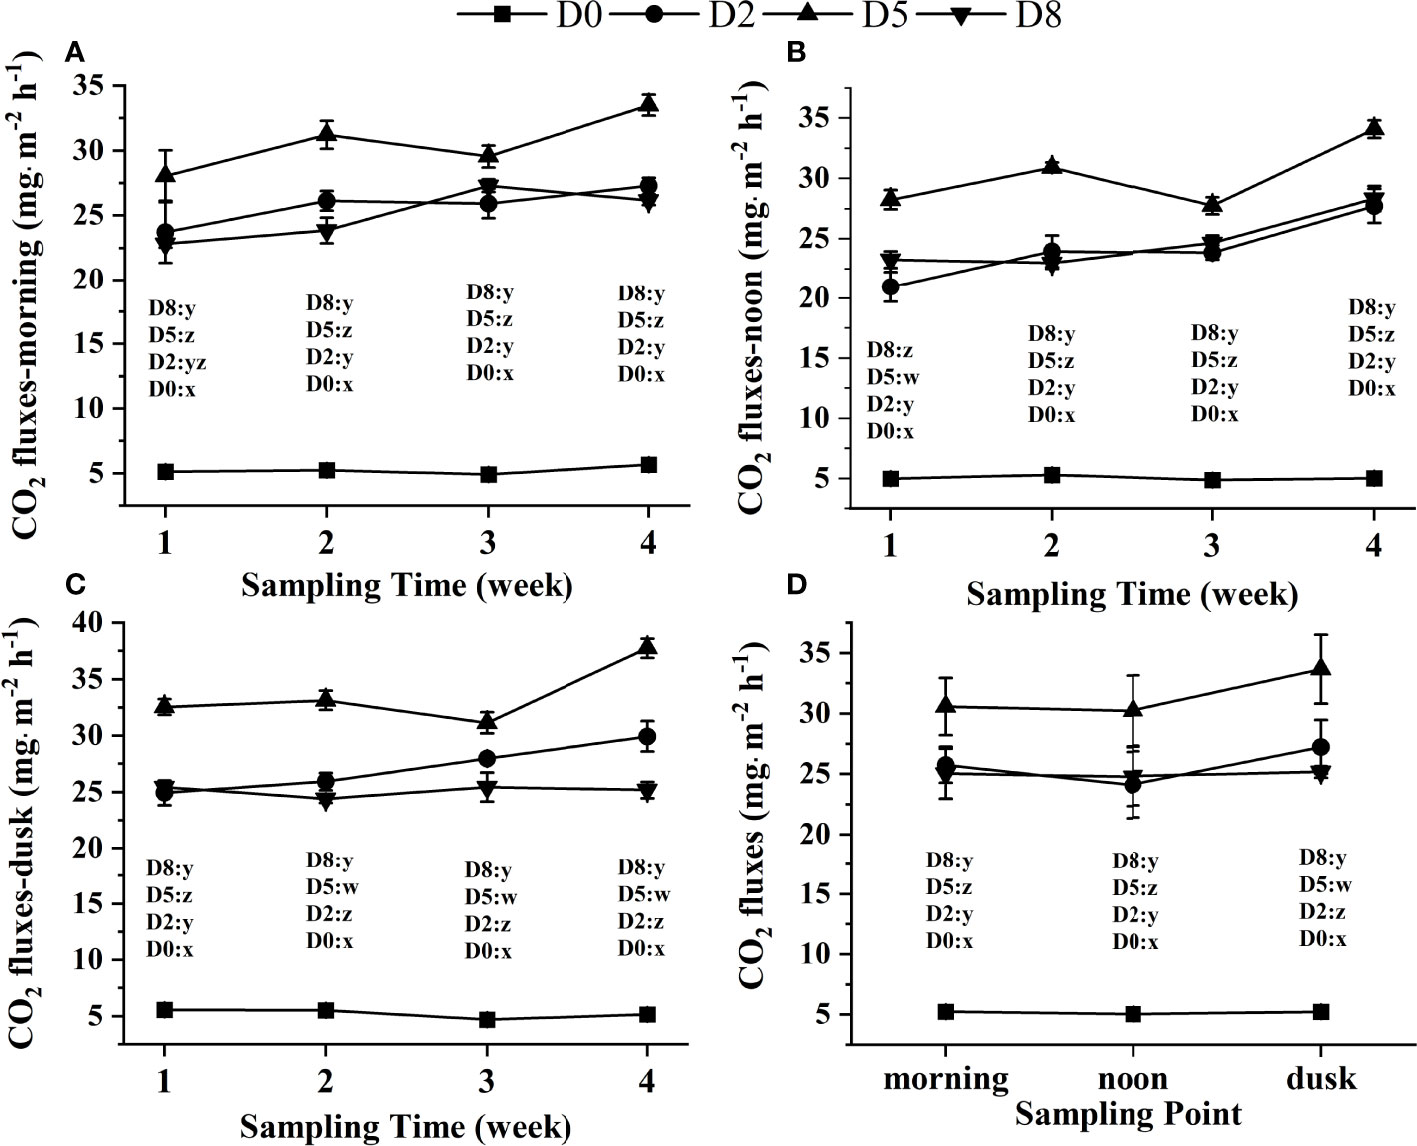
Figure 1 Variations of water-air interface CO2 fluxes (mg·m-2 h-1) at different stocking densities of sea cucumber in the morning (A), at noon (B), at dusk (C) and at different times of one day (D) during the experiment. The data are means ± S.D. and bars represent standard deviation. D0: control group; D2: 2 ind./tank; D5: 5 ind./tank; D8; 8 ind./tank. Different letters x, y, z and w represented significant differences among different densities (P< 0.05).
3.3 Energy, organic carbon and nitrogen budget
In the experiment, uptake nitrogen, growth nitrogen, fecal nitrogen, excretion nitrogen, absorption nitrogen and nitrogen budget of sea cucumber at different stocking densities were shown in Table 2. The quantity of growth nitrogen in D2, D5 and D8 were calculated as 0.224 ± 0.033 mg·g-1·d-1, 0.215 ± 0.034 mg·g-1·d-1 and 0.082 ± 0.014 mg·g-1·d-1, respectively. Of them, the values of D2 and D5 were significantly higher than D8. In addition, there were also significant differences among the quantity of fecal nitrogen at different stocking densities (P < 0.05). In details, the quantity of fecal nitrogen in D8 (2.661 ± 0.040 mg·g-1·d-1) was the highest, followed by D2 (1.863 ± 0.009 mg·g-1·d-1) and D5 (1.659 ± 0.109 mg·g-1·d-1). Nevertheless, D5 showed highest quantity of excretion nitrogen (5.207 ± 0.119 mg·g-1·d-1), followed by D2 (5.027 ± 0.031 mg·g-1·d-1) and D8 (4.239 ± 0.043 mg·g-1·d-1). These results indicated that most of uptake nitrogen was used for excretion, followed by fecal, and finally for growth.
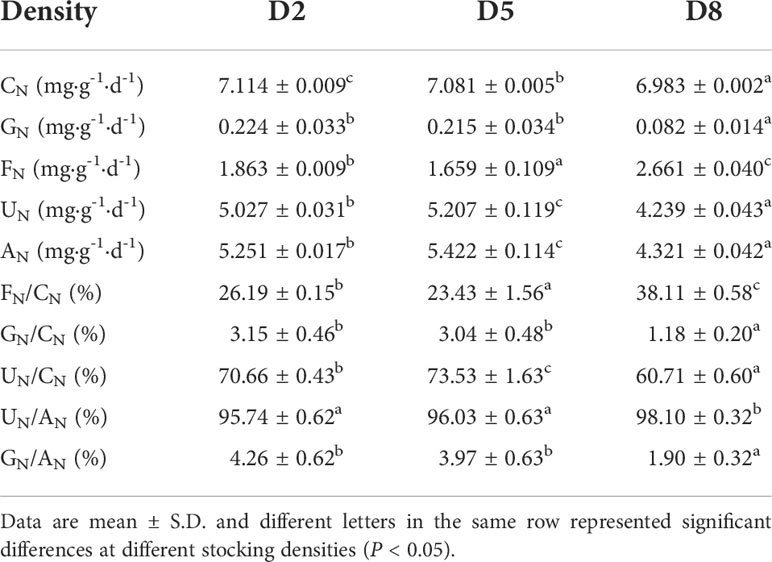
Table 2 Uptake nitrogen, growth nitrogen, fecal nitrogen, excretion nitrogen, absorption nitrogen and nitrogen budget of sea cucumber at different stocking densities.
Table 3. showed the energy budget of sea cucumbers at different stocking densities. The fecal energy (42.99 - 53.92%) and respiration energy (39.17 - 49.05%) accounted for the largest proportion of energy intake, followed by excretion energy (5.69 - 6.90%), and growth energy (1.07 - 1.22%). The respiration and excretion energy in D5 were remarkably higher than that in D2 and D8 (P < 0.05). In contrast, D5 showed the lowest fecal energy loss. There was no significant difference in growth energy among D2, D5 and D8 (P > 0.05).
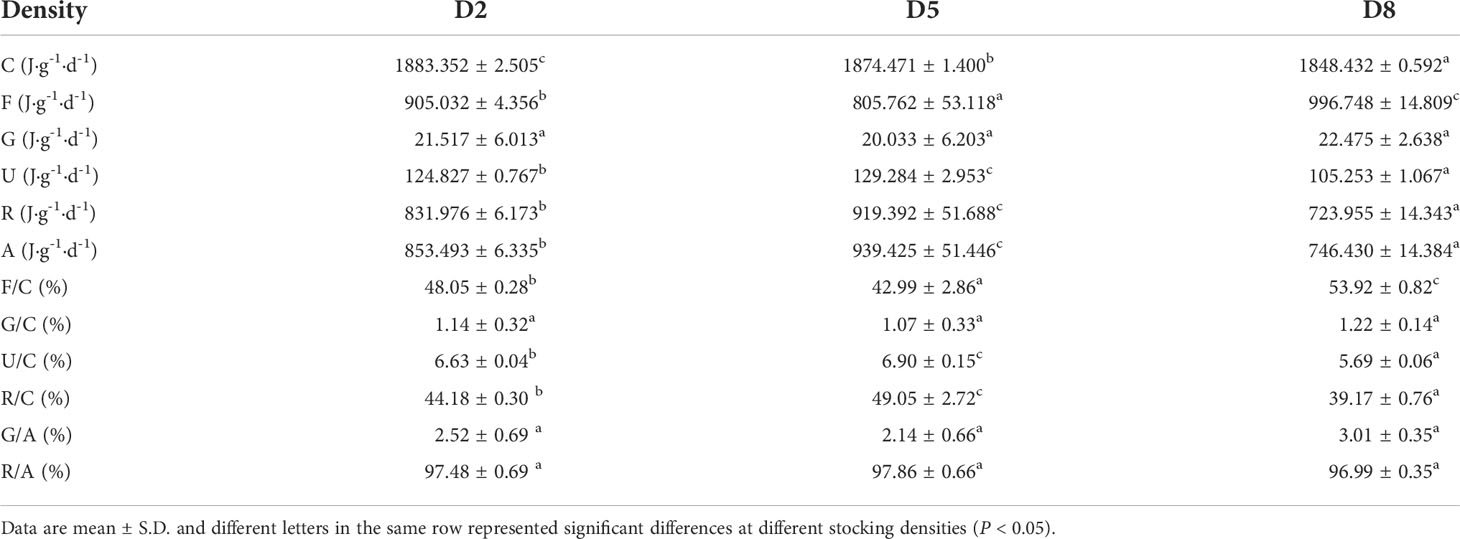
Table 3 Food energy, growth energy, metabolizable energy, fecal energy, excretion energy, absorption energy and energy budget of sea cucumber at different stocking densities.
Carbon input and allocation into different physio-ecological processes at different stocking densities of sea cucumber were shown in Table 4. During the feeding trial, the quantities of carbon for growth and respiration metabolizable in D5 were remarkably higher than those in D2 and D8, while carbon for fecal showed the lowest value (P < 0.05). The carbon lost in feces (46.25 - 56.88%) and respiration (43.39 - 50.67%) occupied the largest portion of carbon supply, followed by carbon for growth (-0.27 - 3.09%). The dissolved organic carbon lost in aquatic water was positively correlated with the stocking densities.
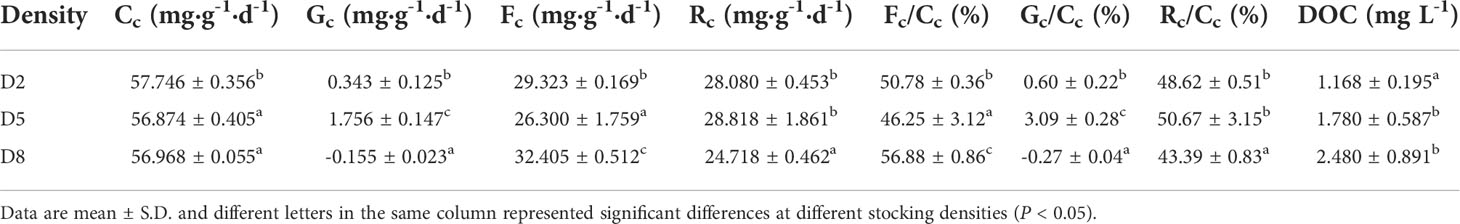
Table 4 Carbon parameters and carbon allocation into different physio-ecological processes in sea cucumber at different stocking densities.
3.4 Enzyme activities of respiratory trees, body walls and coelomic fluid
The enzyme activities associated with respiration, including pyruvate dehydrogenase (PDH) and α-ketoglutarate dehydrogenase (OGDH) were determined in respiratory trees, body walls and coelomic fluid of sea cucumber at different stocking densities. The PDH activities of individuals in D2 and D5 were significantly different among respiratory trees, body walls and coelomic fluid (P < 0.05), and the order of which were followed: respiratory trees > coelomic fluid > body walls. While individuals in D8 showed different patterns of PDH activities (coelomic fluid > respiratory trees > body walls). In addition, body walls, respiratory trees and coelomic fluid displayed various PDH activities at different stocking densities. The activities in body walls and coelomic fluid were gradually increased with increased stocking densities. In contrast, high stocking density repressed the activities of PDH in respiratory trees (Figure 2A). The OGDH activities of individuals in all density groups were significantly different among respiratory tree, body wall and coelomic fluid (P < 0.05), and the order of which were followed: respiratory trees > body walls > coelomic fluid. Moreover, body walls, respiratory trees and coelomic fluid displayed various OGDH activities at different stocking densities. The activities in coelomic fluid tissues were gradually increased with increased stocking densities. In contrast, high stocking density repressed the activities of OGDH in respiratory trees and body walls (Figure 2B).
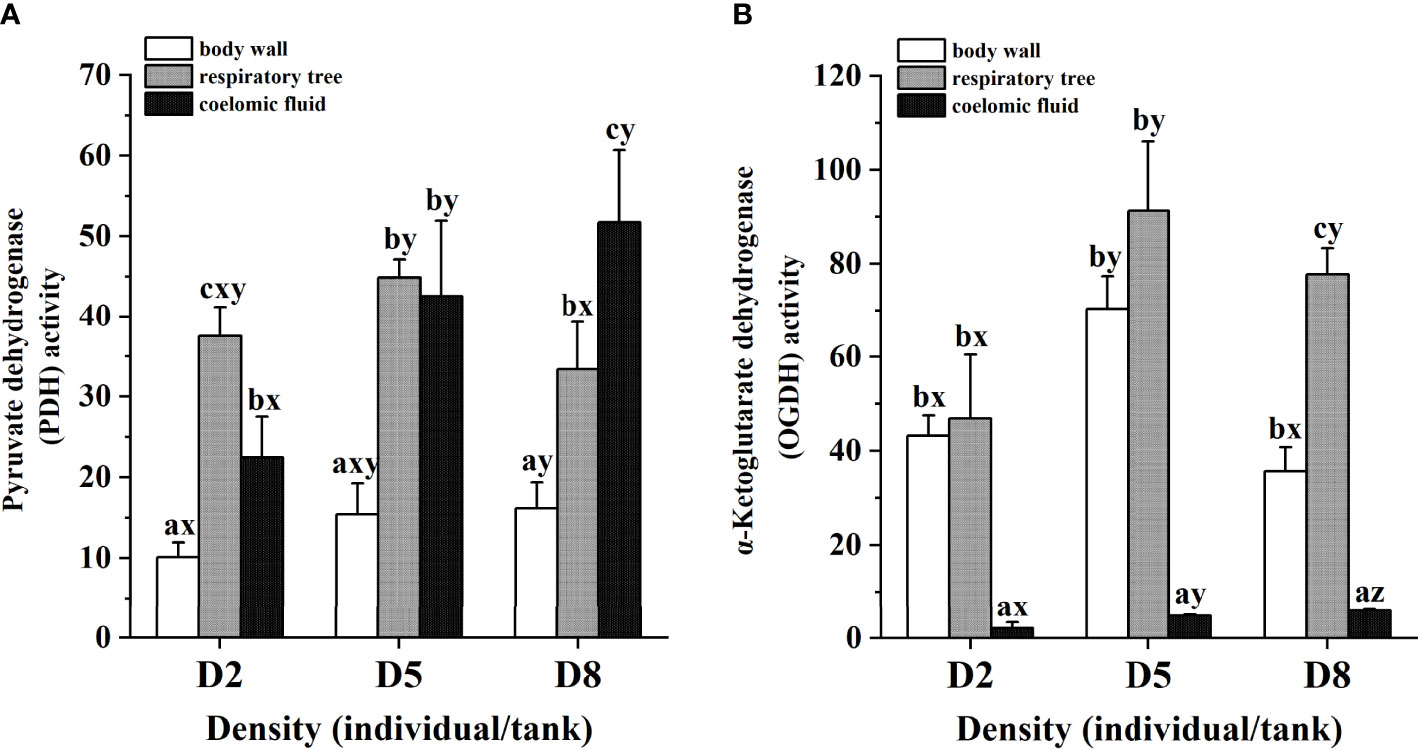
Figure 2 Pyruvate dehydrogenase enzyme activity (A) and α-ketoglutarate dehydrogenase enzyme activity (B) of sea cucumber at different stocking densities and tissues. Different letters a, b and c in the same density represented significant differences among different tissues (P< 0.05), and letters x, y and z at the same tissue represented significant differences among different densities (P< 0.05) and bars represented standard deviation. The enzyme activities units were U/g in respiratory tree and body wall tissues, and U/mL in coelomic fluid.
3.5 Transcriptome analysis
3.5.1 Overview of sequencing data
RNA-Seq analyses were performed for respiratory trees and body walls of sea cucumber at D2, D5 and D8 to explore the effects of stocking density on gene expression patterns. A total of 18 cDNA libraries (9 respiratory trees and 9 body walls) were constructed and sequenced, generating ~819 million clean reads and 120 Gb data. Their Q20 values varied from 97.70% to 98.13%, and Q30 (%) ranged from 93.47% to 94.47%, suggesting the high quality of sequencing data. Clean reads of approximately 61.89%-70.77% were matched to the reference genome. The detailed information was summarized in Table S2.
3.5.2 Differentially expressed genes identification
A total of 28,328 genes were expressed in respiratory trees and body walls of sea cucumber at D2, D5 and D8. Through the gene expression comparisons and strict thresholds, 1152, 165, 1581, 2057, 323, 939, 2481, 7450 and 806 differentially expressed genes (DEGs) were determined in D2S vs. D5S, D2S vs. D8S, D5S vs. D8S, D2B vs. D5B, D2B vs. D8B, D5B vs. D8B, D2S vs. D2B, D5S vs. D5B and D8S vs. D8B, respectively (Figures S1-S3). In this study, D2, D5 and D8 represented the group of 2 ind./tank, 5 ind./tank and 8 ind./tank, respectively. And the capital letters S and B stand for respiratory trees and body walls tissue of sea cucumber, respectively. The detailed information of up- and down- DEGs at different stocking densities and tissues were also shown in Figure S2. It was found that there were several common DEGs among various comparisons. For example, 9 genes showed differentially expressed levels in respiratory trees at different stocking densities, including D2, D5 and D8 (Figure S3A). And there were 18 common DEGs detected in body walls at the stocking densities of D2, D5 and D8 (Figure S3B). In addition, 512 genes were differentially expressed between respiratory trees and body walls at the same stocking density, suggesting tissue-specific gene expression in response to density stress (Figure S3C).
3.5.3 Functional enrichment analysis of DEGs
To better understand the biological function of these DEGs, KEGG pathways analyses were conducted in respiratory trees and body walls at the different stocking densities. The first 20 highly enriched pathways, ranked by Bonferroni-corrected p-value, were shown in Figures 3A–C. In respiratory trees, the DEGs were significantly enriched in peroxisome (Ko04146), fatty acid degradation (Ko00071), oxidative phosphorylation (Ko00190), glycine, serine and threonine metabolism (Ko00260), arginine and proline metabolism (Ko00330), glycolysis/gluconeogenesis (Ko00010) and pentose phosphate pathway (Ko00030). The enriched pathways of DEGs in body walls contained peroxisome, glycine, serine and threonine metabolism, oxidative phosphorylation, alanine, aspartate and glutamate metabolism (Ko00250), tryptophan metabolism (Ko00380), arginine and proline metabolism, fatty acid degradation, pyruvate metabolism (Ko00620), citrate cycle (TCA cycle) (Ko00020) and glycolysis/gluconeogenesis. In addition, DEGs between respiratory trees and body walls at the same stocking density were tightly related to peroxisome, fatty acid degradation, glycine, serine and threonine metabolism, tryptophan metabolism, arginine and proline metabolism, pyruvate metabolism, glycolysis/gluconeogenesis and alanine, aspartate and glutamate metabolism. Among them, a total of 11 significantly enriched KEGG pathways were commonly identified in at least 2 comparisons, including citrate cycle (TCA cycle), fatty acid degradation, oxidative phosphorylation, glycine, serine and threonine metabolism, glycolysis/gluconeogenesis, pyruvate metabolism, pentose phosphate pathway, peroxisome, alanine, aspartate and glutamate metabolism, tryptophan metabolism, arginine and proline metabolism. It was noted that there were several enriched pathways closely associated with carbohydrate metabolism, including citrate cycle (TCA cycle), pentose phosphate pathway, pyruvate metabolism and glycolysis/gluconeogenesis. Some other enriched pathways were involved in amino acid, lipid and energy metabolism.
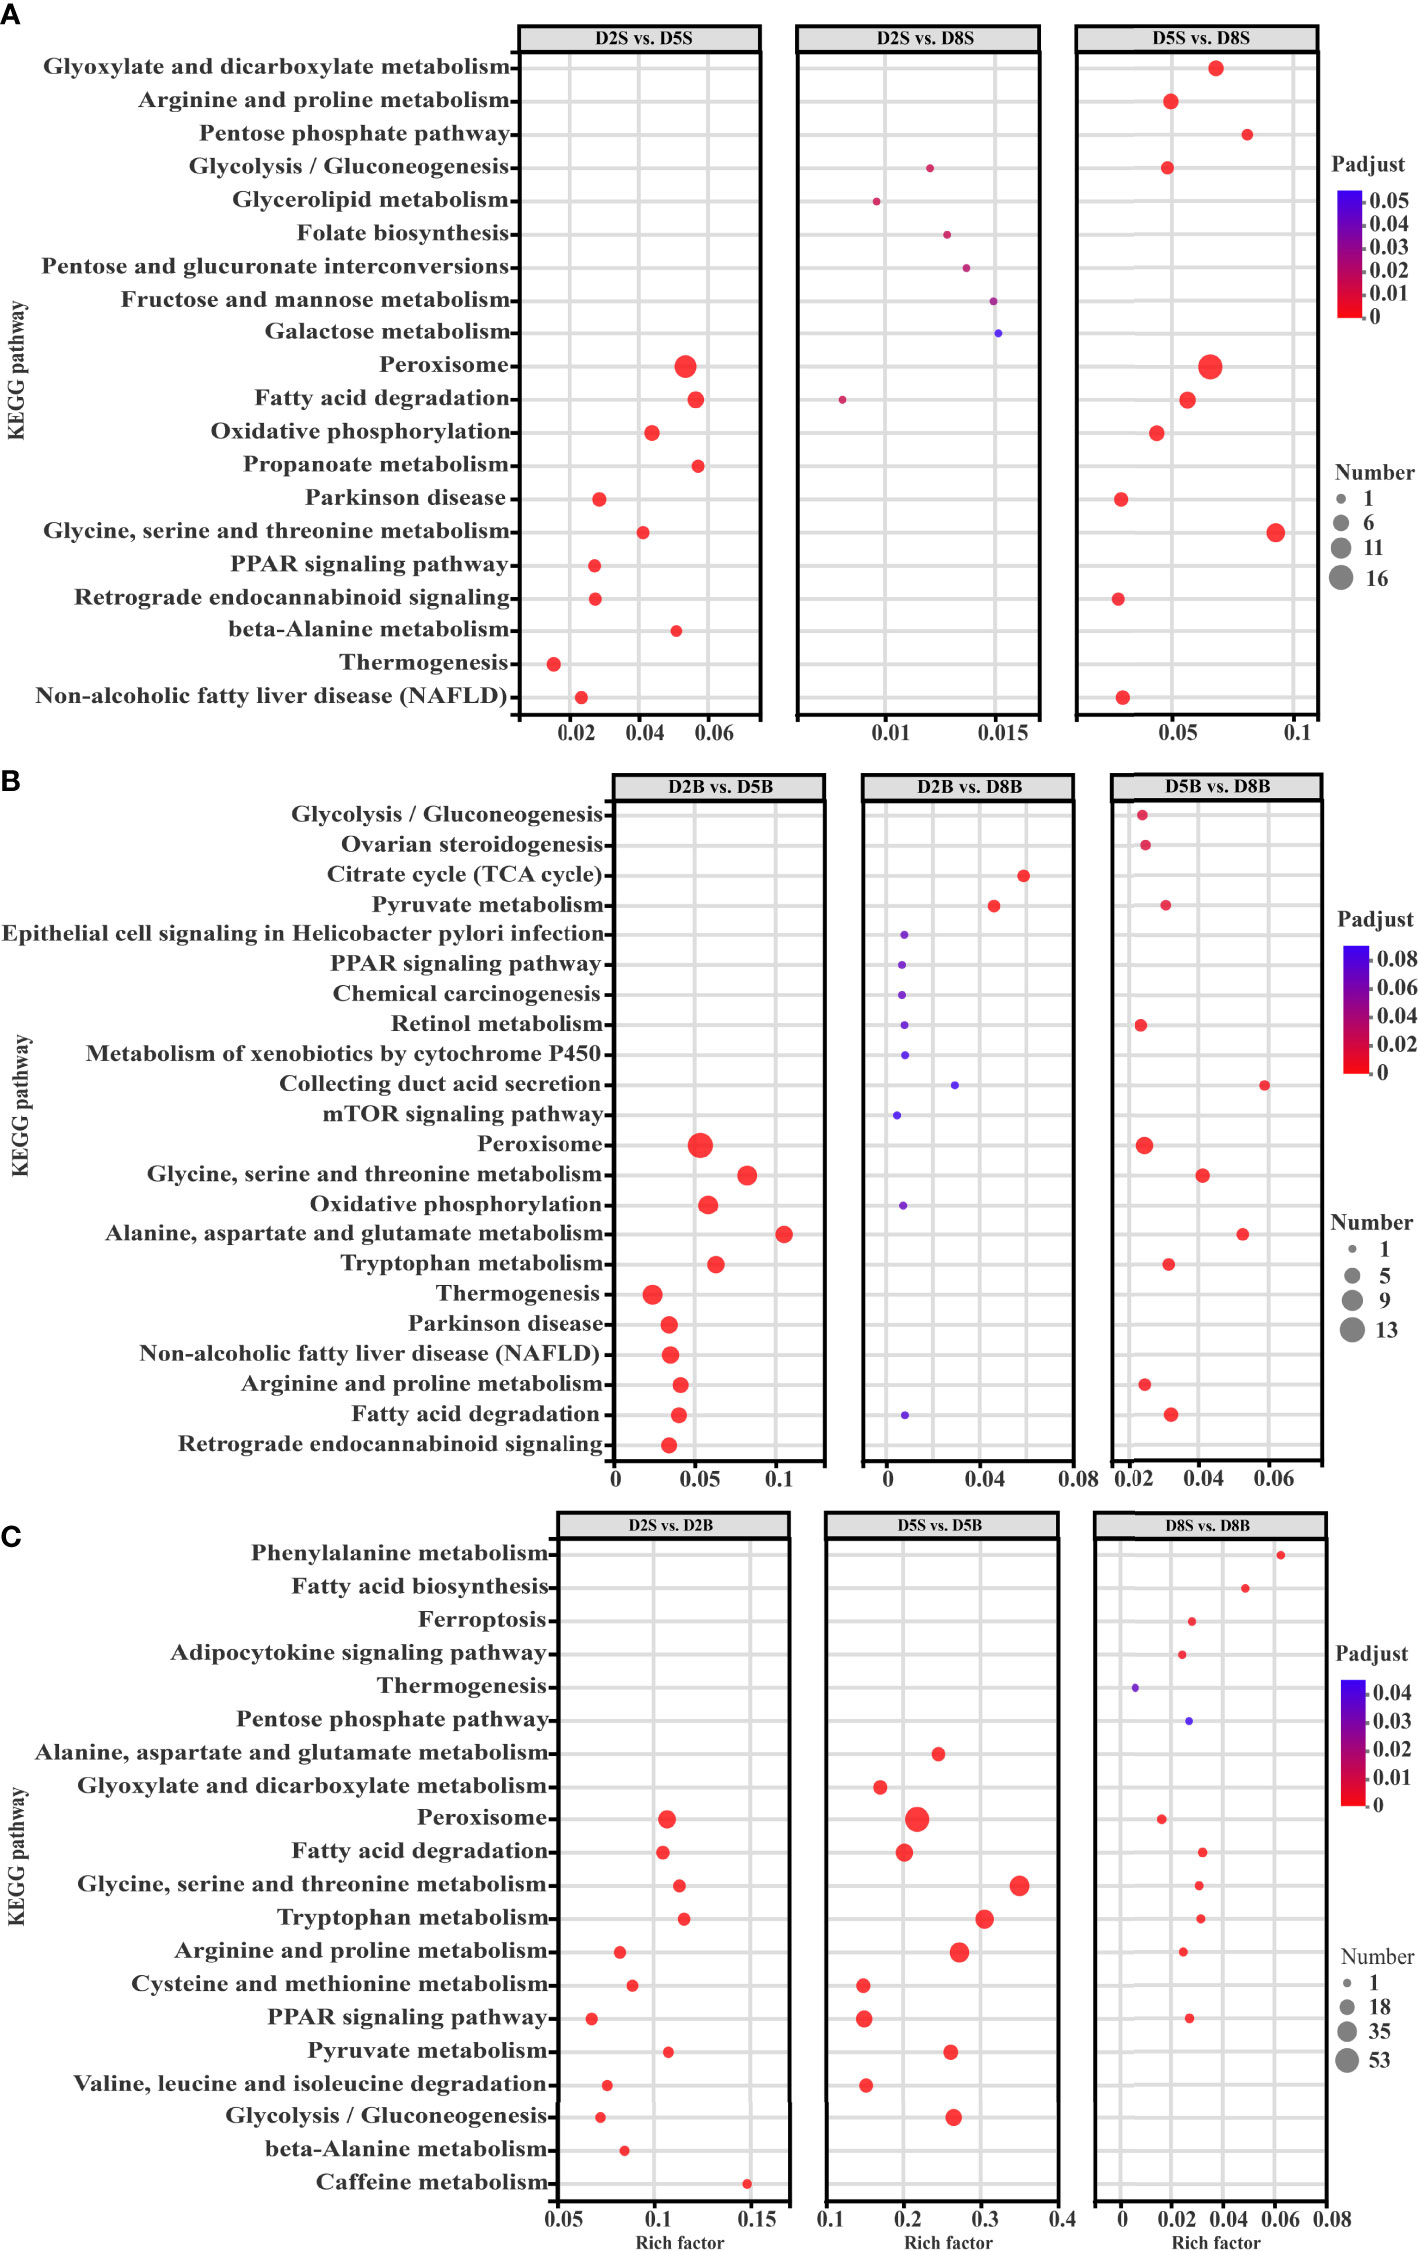
Figure 3 KEGG enrichment of differentially expressed genes (DEGs) in the respiratory tree and body wall at different stocking densities. (A) Enriched KEGG pathways of DEGs in the respiratory tree among different stocking densities; (B) Enriched KEGG pathways of DEGs in the body wall among different stocking densities; (C) Enriched KEGG pathways of DEGs between the respiratory tree and body wall at the same stocking density.
3.5.4 Validation of RNA-seq data by RT-qPCR
A total of 10 DEGs were randomly selected to validate the accuracy of RNA-seq data using qPCR experiment, including PC, ACSS1, TIM21, TPI, SORD, NDUFS6, OGDH, RNG, PDH and IDH. As shown in Figure 4, the expression patterns of DEGs from RNA-Seq were consistent with those from qPCR, and the coefficient of determination R2 was estimated as 0.961. The results suggested the reliability of RNA-Seq data in the present study.
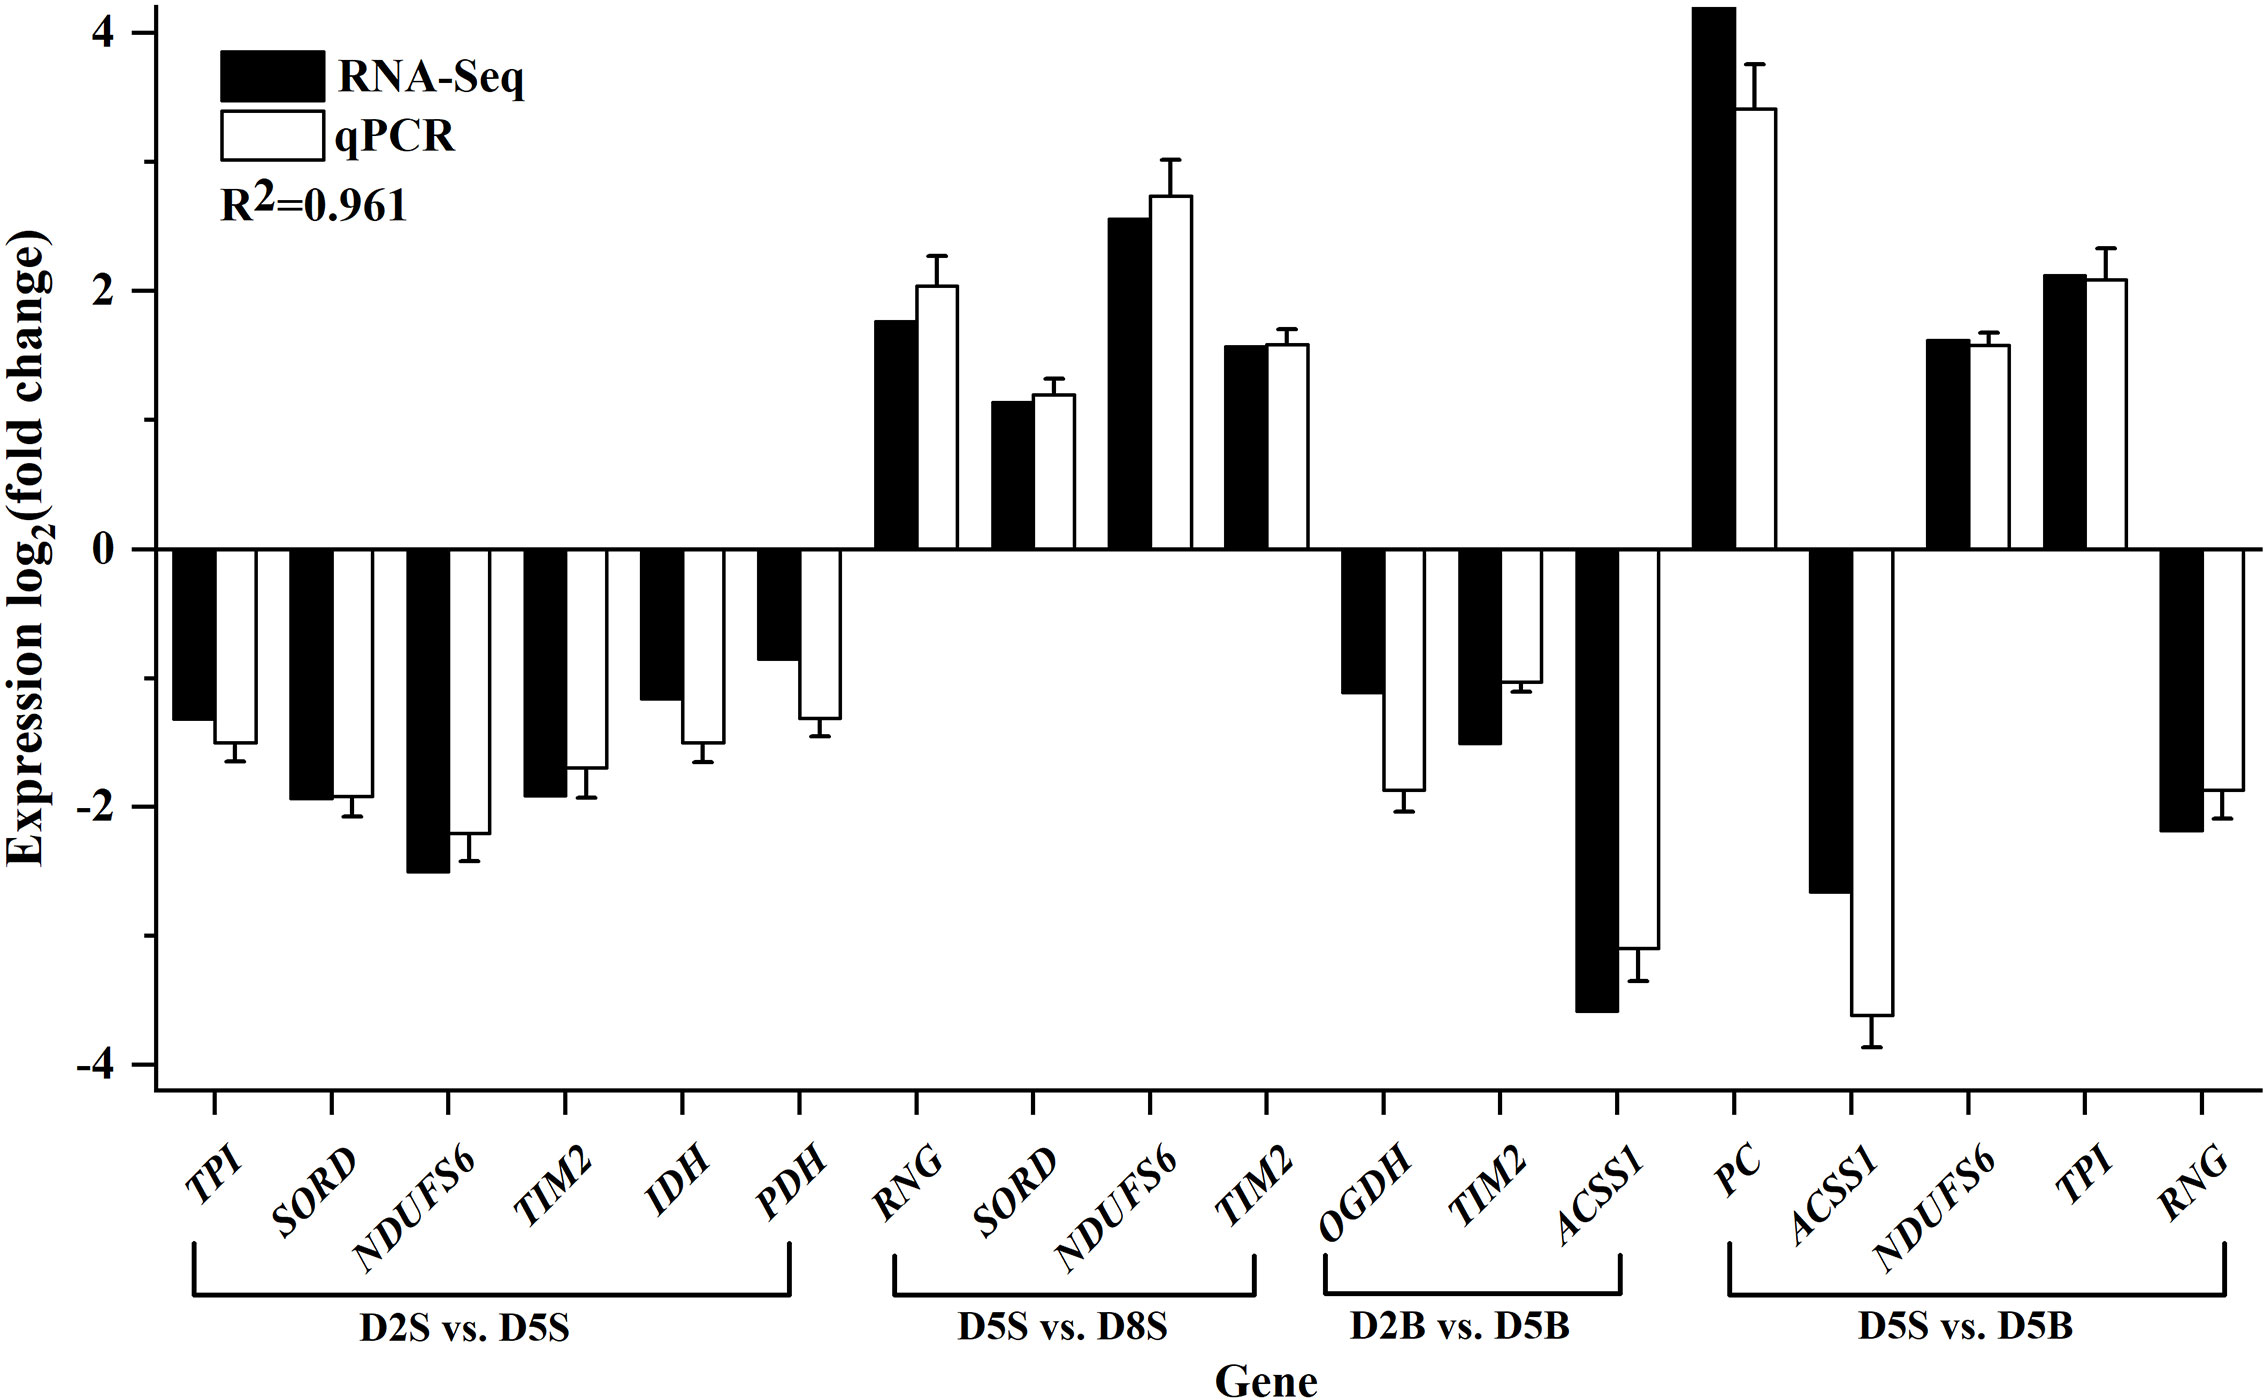
Figure 4 RNA-Seq validation using qPCR experiment. 10 DEGs were randomly selected for qPCR experiment. Gene expression patterns were presented as log2(fold change) and CYTB was set as the internal reference. D2, D5 and D8 represented the group of 2 ind./tank, 5 ind./tank and 8 ind./tank, respectively. And the capital letters S and B stand for respiratory trees and body walls tissue of sea cucumber, respectively.
4. Discussion
Stocking density represents a potential chronic stress source, tightly related to diverse physiological processes of aquatic organisms (Qi et al., 2016; Liu et al., 2017; Sacristán et al., 2019). In the present study, D5 was considered the appropriate stocking density for sea cucumber with great growth performance. It suggested that the physiological states and environmental conditions of sea cucumber were suiTable at D5 without excessive consumption of matter and energy to resist environmental stress and maintain the stability of the internal environment. This result is largely consistent with the previous observations of studies on sea cucumbers under other environmental stresses (Yuan et al., 2010; Meng et al., 2013). However, the growth of individuals in D8 is repressed by crowding stress. Sea cucumbers at high stocking density have to consume more energy to cope with crowding stress, resulting in less energy available for growth (Lupatsch et al., 2010). Meanwhile, high stocking density may increase the competition and feed conversion ratio. Similar observations are also reported in previous studies of other aquatic invertebrates, such as Chinese shrimp (Fenneropenaeus chinensis) (Li et al., 2006), prawn (Macrobrachium rosenbergii) (Nhan et al., 2010) and sea cucumber (Apostichopus japonicus) (Li and Li, 2010).
Our research investigated the energy allocation and respiration rate of sea cucumbers at different stocking densities. Feeds input, residual feed and excrement were recorded daily to determine the carbon, nitrogen and energy budget during the whole period of the experiment. Sea cucumber in D5 had the highest carbon content of growth and the highest Rc/Cc ratio, suggesting respiration metabolism was activated. Mean DOC concentration in D8 was significantly higher than the others (Zhang et al., 2014; Zhang et al., 2022), which might influence the surrounding water environment counteracting self-growth, and resulting in the lowest feeding carbon content and the lowest metabolism carbon (Hou et al., 2017). Nitrogen is well known as a major element in protein, the content of which directly represents the utilization efficiency of protein in organisms (Xia et al., 2017b; Xia et al., 2017a). In the present study, it has been found that the percent of GN/CN and GN/AN were negatively correlated with stocking densities, while a positive correlation was detected in the percent of UN/AN and FN/CN with stocking densities. Crowding stress could result in decreased protein retention rate and increased protein consumption, which may be responsible for the observations in our study (Yao et al., 2009). In addition, the energy budget provides a framework to evaluate nutrient utilization in various ways. In the present study, individuals in D5 exhibit the highest energy consumption for respiration metabolism and excretion, meaning the production of large amounts of CO2. It suggested that moderate stocking density could reduce the accumulation of growth energy and accelerate the energy consumption for respiration metabolism and excretion of sea cucumber (Xia et al., 2017a). In contrast, decreased energy for feeding and excretion were observed in these individuals of D8, indicating the repression of respiration metabolism by crowding stress (Gao et al., 2018). Therefore, the results demonstrated that different stocking densities have heavily affected the rate of respiration metabolism and the amount of CO2 from sea cucumber.
Modified floating static chambers were performed to directly determine the water-air interface CO2 fluxes generated from sea cucumber at different stocking densities. Notably, the highest CO2 fluxes were observed in D5, which is largely consistent with the active respiration metabolism. In addition, this result also demonstrated that there may be a close association between respiration metabolism and the water-air interface CO2 fluxes. Unexpectedly, D8, containing the largest number of sea cucumbers, showed significantly lower CO2 fluxes than D5, even a little lower than D2 at morning and dusk. It may be caused by the elevated DOC concentration that could repress respiration metabolism and reduce the generation of CO2 (Zwart et al., 2016).
The activities of two key enzymes were determined to provide additional evidence for different respiration rates of sea cucumbers at different stocking densities. PDH, a rate-limiting enzyme, regulates the generation of acetyl-CoA for entry into the TCA cycle and oxidative phosphorylation (Richards et al., 2002). OGDH is another important enzyme in the citric acid cycle and a key node in intracellular carbon metabolism (McLain et al., 2011). In the present study, the highest activities of PDH and OGDH are detected in D5, confirming the active respiratory metabolism at moderate density. The activities of PDH and OGDH also showed tissue-specific patterns: respiratory trees > body walls. The main reasons may be due to the fact that the respiratory tree, a unique tissue of sea cucumber, is proposed to be crucial for gas exchange (Zhang et al., 2019). In contrast, the body wall could only be responsible for the part of the respiratory role in sea cucumber (Yang et al., 2009).
In addition, RNA-Seq analysis is performed to reveal the potential molecular mechanism of respiratory metabolism affected by different stocking densities. As result, functional genes displayed distinct gene expression patterns in respiratory trees and body walls of sea cucumber at D2, D5 and D8. It is worth noting that DEGs in D2 vs. D5 and D5 vs. D8 were most significantly enriched in peroxisome pathways either in respiratory trees or body walls, highlighting its importance in response to stocking densities in sea cucumbers. Peroxisome, which acted as a cytoplasmic organelle, is proposed to be crucial for the oxidation of some specific biomolecules in eukaryotes (Lew and Rout, 2009; Antonenkov et al., 2010). Furthermore, emerging evidence demonstrates that peroxisome plays a complementary role in beta-oxidation of fatty acid in mitochondria, the proliferation of which would inhibit the beta-oxidation of fatty acid and respiratory chain in mitochondria (Zhou and Wallace, 1999; Scatena et al., 2004). In D2 and D8, several DEGs enriched in peroxisome pathways were significantly up-regulated relative to D5, suggesting the activation of peroxisomes in sea cucumber at low- or high-density environments. This observation may be responsible for the inhibition of respiratory in respiratory trees or body walls of sea cucumber in D2 and D8. Of these DEGs associated with peroxisome pathway, PHYH, FATP2 and ACOX have received much attention due to their important roles in fatty acid oxidation. PHYH is a member of the ubiquitous Fe (II) and 2OG (2-oxoglutarate) oxygenase superfamily, which has an important biological role in fatty acid metabolism (Schofield and McDonough, 2007). In the present study, it showed a high expression pattern in the D2 and D8 groups, indicating activation of fatty acid metabolism in the peroxisome at unsuiTable stocking densities. Fatty acid transport protein 2 (FATP2), a transmembrane protein, acts as a gatekeeper in catabolic very long chain fatty acid (VLCFA) metabolism and it is normally expressed in cells and tissues (Qiu et al., 2020). In the present study, it showed a very high expression pattern in the D8 group, this suggested that the peroxisomal pathway activated in sea cucumbers under high-density stress played an important role in resistance to adverse external conditions by promoting long-chain fatty acid metabolism in the peroxisome. Acyl-coenzyme A oxidase (ACOX), is responsible for fatty acid dehydrogenation to promote the beta-oxidation process in the peroxisomes but shows very low activities towards short chain substrates (Poirier et al., 2006). In the present study, it was also displayed a very high expression pattern in the D8 group, the results showed that the oxidation of long-chain fatty acids in peroxisomes was not complete under high-density stocking conditions, which produced greater oxidative damage to cells and led to lower physiological metabolism. In addition, comparisons between respiratory trees and body walls reveal the tissue-specific expression patterns in response to different stocking densities. The main function of the respiratory tree is the gas exchange (Eisapour et al., 2022), and the body wall may also take part of the respiratory function due to its dual respiratory characteristics (Wang and Tian, 2012). Although there were different gene expression patterns, enrichment analysis indicated that DEGs between respiratory trees and body walls were also closely associated with peroxisome pathway. Therefore, it suggested that both respiratory trees and body walls could regulate the activation of peroxisome in response to different stocking densities, through different functional genes or elements. However, studies are required to investigate the further molecular mechanism in the future.
5. Conclusions
In this study, the effects of three different stocking densities on CO2 fluxes at the water-air interface were determined. Sea cucumber under 5 ind./tank shows superior growth performance. More importantly, the stocking density of 5 ind./tank could promote the respiration metabolism of sea cucumber and release much more CO2 into water, resulting in the water-air interface CO2 fluxes increased. Transcriptome indicated that density affects CO2 fluxes by altering fatty acid metabolism and energy distribution of sea cucumber. Therefore, based on the consideration of sea cucumber physiological adaptations and welfare, the density should be further optimized, which can promote the development of efficient low-carbon culture technologies and achieve higher economic and ecological values. More attention can be paid to its ecological functions in integrated multi-trophic aquaculture systems in the future, which contribute to the industry sustainable development and environmental carbon emission reduction.
Data Availability Statement
The datasets presented in this study can be found in online repositories. The names of the repository/repositories and accession number(s) can be found below: PRJNA842509 (including 18 samples, SRR19612851-SRR19612868) has been deposited to NCBI.
Ethics Statement
All animal experiments were conducted following the guidelines and approval of the respective Animal Research and Ethics Committees of Ocean University of China (Permit Number: 20141201). The field studies did not involve any endangered or protected species.
Author Contributions
YM conducted the experiments, analyzed data and wrote the manuscript. YT visualized Figures and revised the manuscript. QG supervised and validated the manuscript. SD conceptualized the experiments. XL and YX investigated and participated in the feeding experiments. All authors contributed to the manuscript and agreed to submit it.
Funding
This work was supported by the National Natural Science Foundation of China (Project No. 31672657).
Acknowledgments
Thanks to Tianheng commercial farm to supply sea cucumbers. Meanwhile, thanks to the Function Laboratory for Marine Fisheries Science and Food Production Processes supplied the instrumentation.
Conflict of Interest
The authors declare that the research was conducted in the absence of any commercial or financial relationships that could be construed as a potential conflict of interest.
Publisher’s Note
All claims expressed in this article are solely those of the authors and do not necessarily represent those of their affiliated organizations, or those of the publisher, the editors and the reviewers. Any product that may be evaluated in this article, or claim that may be made by its manufacturer, is not guaranteed or endorsed by the publisher.
Supplementary material
The Supplementary Material for this article can be found online at: https://www.frontiersin.org/articles/10.3389/fmars.2022.965700/full#supplementary-material
Supplementary Table 1 | Information of primers used for RT-qPCR.
Supplementary Table 2 | The basic characteristic of reads in eighteen libraries.
Supplementary Figure 1 | Volcano of DEGs in the respiratory tree and body wall at different stocking densities. Up- and down-regulated DEGs were marked with red and green points, respectively.
Supplementary Figure 2 | Statistic of differentially expressed genes (DEGs) in the respiratory tree and body wall at different stocking densities. The stocking densities included D2, D5 and D8.
Supplementary Figure 3 | Upset plot showing the distributions of DEGs in respiratory tree and body wall at different stocking densities. (A) Distributions of DEGs in the respiratory tree at different stocking densities; (B) Distributions of DEGs in the body wall at different stocking densities; (C) Comparisons of DEGs at the same stocking density between the respiratory tree and body wall.
References
Antonenkov V. D., Grunau S., Ohlmeier S., Hiltunen J. K. (2010). Peroxisomes are oxidative organelles. Antioxid. Redox Signal. 13, 525–537. doi: 10.1089/ars.2009.2996
Bai Y. C., Zhang L. B., Liu S. L., Ru X. S., Xing L. L., Cao X. B., et al. (2015). The effect of salinity on the growth, energy budget and physiological performance of green, white and purple color morphs of sea cucumber, Apostichopus japonicus. Aquaculture 437, 297–303. doi: 10.1016/j.aquaculture.2014.12.020
Bao J., Li X. D., Xing Y. N., Feng C. C., Jiang H. B. (2020). Effects of hypoxia on immune responses and carbohydrate metabolism in the Chinese mitten crab, Eriocheir sinensis. Aquac. Res. 51, 2735–2744. doi: 10.1111/are.14612
Chary K., Aubin J., Sadoul B., Fiandrino A., Covès D., Callier M. D. (2020). Integrated multi-trophic aquaculture of red drum (Sciaenops ocellatus) and sea cucumber (Holothuria scabra): Assessing bioremediation and life-cycle impacts. Aquaculture 516, e734621. doi: 10.1016/j.aquaculture.2019.734621
Chen Y., Dong S. L., Wang Z. N., Wang F., Gao Q. F., Tian X. L., et al. (2015). Variations in CO2 fluxes from grass carp Ctenopharyngodon idella aquaculture polyculture ponds. Aquacult. Env. Interac. 8, 31–40. doi: 10.3354/aei00149
Eisapour M., Salamat N., Salari M. A., Bahabadi M. N., Salati A. P. (2022). Post-autotomy regeneration of respiratory tree in sea cucumber holothuria parva. J. Exp. Zool. Part B. Mol. Biol. Evol. 338, 155–169. doi: 10.1002/jez.b.23109
Fernández-Cisnal R., García-Sevillano M. A., García-Barrera T., Gómez-Ariza J. L., Abril N. (2018). Metabolomic alterations and oxidative stress are associated with environmental pollution in Procambarus clarkii. Aquat. Toxicol. 205, 76–88. doi: 10.1016/j.aquatox.2018
Gao X. L., Ke C. H., Zhang M., Li X., Wu F. C., Liu Y. (2019). N and p budgets of haliotis discus hanai, apostichopus japonicas, and Sebastes schlegeli in a polyculture system. Aquac. Res. 50, 2398–2409. doi: 10.1111/are.14193
Gao X. L., Li X., Shi C., Wu F. C., Song C. B., Liu Y. (2018). Effects of stocking density on growth, metabolism, and energy budget of Haliotis discus hannai ino. Aquaculture 483, 84–95. doi: 10.1016/j.aquaculture.2017.09.045
Haure J., Huvet A., Palvadeau H., Nourry M., Penisson C., Martin J. L. Y., et al. (2003). Feeding and respiratory time activities in the cupped oysters Crassostrea gigas, Crassostrea angulata and their hybrids. Aquaculture 218, 539–551. doi: 10.1016/S0044-8486(02)00493-3
Hou Y. R., Sun Y. J., Gao Q. F., Dong S. L., Wen B., Yu H. B. (2017). Effect of the bioturbation derived from sea cucumber Apostichopus japonicus (Selenka) farming on the different occurrence forms of sedimentary inorganic carbon. Aquaculture 480, 108–115. doi: 10.1016/j.aquaculture.2017.08.017
Kühnhold H., Kamyab E., Novais S., Indriana L., Kunzmann A., Slater M., et al. (2017). Thermal stress effects on energy resource allocation and oxygen consumption rate in the juvenile sea cucumber, Holothuria scabra (Jaeger, 1833). Aquaculture 467, 109–117. doi: 10.1016/j.aquaculture.2016.03.018
Lew D. J., Rout M. P. (2009). Cell structure and dynamics. Curr. Opin. Cell Biol. 21, 1–3. doi: 10.1016/j.ceb.2009.01.010
Li J. W., Dong S. L., Gao Q. F., Wang F., Tian X. L., Zhang S. S. (2014). Total organic carbon budget of integrated aquaculture system of sea cucumber Apostichopus japonicus, jellyfish Rhopilema esculentaand shrimp Fenneropenaeus chinensis. Aquac. Res. 45, 1825–1831. doi: 10.1111/are.12131
Li L., Li Q. (2010). Effects of stocking density, temperature, and salinity on larval survival and growth of the red race of the sea cucumber Apostichopus japonicus (Selenka). Aquacult. Int. 18, 447–460. doi: 10.1007/s10499-009-9256-4
Li Y. Q., Li J., Wang Q. Y. (2006). The effects of dissolved oxygen concentration and stocking density on growth and non-specific immunity factors in Chinese shrimp, Fenneropenaeus chinensis. Aquaculture 256, 608–616. doi: 10.1016/j.aquaculture.2006.02.036
Liu B. L., Fei F., Li X. T., Wang X. Y., Huang B. (2019a). Effects of stocking density on stress response, innate immune parameters, and welfare of turbot (Scophthalmus maximus). Aquacult. Int. 27, 1599–1612. doi: 10.1007/s10499-019-00413-2
Liu B. L., Jia R., Han C., Huang B., Lei J. L. (2016). Effects of stocking density on antioxidant status, metabolism and immune response in juvenile turbot (Scophthalmus maximus). Comp. Biochem. Phys. Part C-Toxicol. Pharmacol. 190, 1–8. doi: 10.1016/j.cbpc.2016.07.007
Liu Y., Liu H., Wu W., Yin J., Mou Z., Hao F. (2019b). Effects of stocking density on growth performance and metabolism of juvenile lenok (Brachymystax lenok). Aquaculture 504, 107–113. doi: 10.1016/j.aquaculture.2019.01.058
Liu G., Zhu S., Liu D., Guo X., Ye Z. (2017). Effects of stocking density of the white shrimp Litopenaeus vannamei (Boone) on immunities, antioxidant status, and resistance against Vibrio harveyi in a biofloc system. Fish Shellfish Immun. 67, 19–26. doi: 10.1016/j.fsi.2017.05.038
Livak K. J., Schmittgen T. D. (2001). Analysis of relative gene expression data using real-time quantitative PCR and the 2-ΔΔ CT method. Methods 25, 402–408. doi: 10.1006/meth.2001.1262
Lupatsch I., Santos G. A., Schrama J. W., Verreth J. A. J. (2010). Effect of stocking density and feeding level on energy expenditure and stress responsiveness in European sea bass Dicentrarchus labrax. Aquaculture 298, 245–250. doi: 10.1016/j.aquaculture.2009.11.007
McLain A. L., Szweda P. A., Szweda L. I. (2011). α-ketoglutarate dehydrogenase: a mitochondrial redox sensor. Free Radical Res. 45, 29–36. doi: 10.3109/10715762.2010.534163
Meng L. M., Wang L. L., Lei Y., Yao X., Li Y., Li L. (2013). Effects of salinity on carbon and nitrogen budgets in sea cucumber Apostichopus japonicus. J. Dalian Ocean Univ. 28, 34–38. doi: 10.16535/j.cnki.dlhyxb.2013.01.020
Motta J. H. S., Glória L. S., Polese M. F., De Souza A. B., Neto M. A. C., Vidal Júnior M. V. (2020). Stocking density influences common carp larval development. can restocking processes activate compensatory growth consequent to previous high stocking density? Span. J. Agric. Res. 18 (3), 0608–0619. doi: 10.5424/sjar/2020183-15652
Nhan D. T., Wille M., Hung L. T., Sorgeloos P. (2010). Effects of larval stocking density and feeding regime on larval rearing of giant freshwater prawn (Macrobrachium rosenbergii). Aquaculture 300, 80–86. doi: 10.1016/j.aquaculture.2009.12.012
NOAA (2020) The NOAA annual greenhouse gas index (AGGI). national oceanic and atmospheric administration, earth system research laboratories, global monitoring laboratory. Available at: http://www.esrl.noaa.gov/gmd/aggi/aggi.html.
Pei S. R., Dong S. L., Wang F., Gao Q. F., Tian X. L. (2014). Effects of stocking density and body physical contact on growth of sea cucumber, Apostichopus japonicus. Aquac. Res. 45, 629–636. doi: 10.1111/are.12004
Pei S. R., Dong S. L., Wang F., Tian X. L., Gao Q. F. (2012). Effects of density on variation in individual growth and differentiation in endocrine response of Japanese sea cucumber (Apostichopus japonicus selenka). Aquaculture 356–357, 398–403. doi: 10.1016/j.aquaculture.2012.04.032
Poirier Y., Antonenkov V. D., Glumoff T., Hiltunen J. K. (2006). Peroxisomal beta-oxidation–a metabolic pathway with multiple functions. Biochim. Biophys. Acta 1763, 1413–1426. doi: 10.1016/j.bbamcr.2006.08.034
Qiu P., Wang H., Zhang M., Zhang M., Peng R., Zhao Q., et al. (2020). FATP2-targeted therapies - a role beyond fatty liver disease. Pharmacol. Res. 161, 105228. doi: 10.1016/j.phrs.2020.105228
Qi S. B., Zhang W. J., Jing C. C., Wang H. F., Zhao S., Zhou M., et al. (2016). Long-term effects of stocking density on survival, growth performance and marketable production of the sea urchin Strongylocentrotus intermedius. Aquacult. Int. 24, 1323–1339. doi: 10.1007/s10499-016-9988-x
Ren Y. C., Dong S. L., Wang F., Gao Q. F., Tian X. L., Liu F. (2010). Sedimentation and sediment characteristics in sea cucumber Apostichopus japonicus (Selenka) culture ponds. Aquac. Res. 42, 14–21. doi: 10.1111/j.1365-2109.2010.02483.x
Richards J. G., Heigenhauser G. J. F., Wood C. M. (2002). Glycogen phosphorylase and pyruvate dehydrogenase transformation in white muscle of trout during high-intensity exercise. Am. J. Physiol. Regul. Integr. Comp. Physiol. 282, 828–836. doi: 10.1152/ajpregu.00455.2001
Romo Z. M., Re A. D., Díaz F., Mena A. (2009). Physiological responses of pink abalone Haliotis corrugata (Gray, 1828) exposed to different combinations of temperature and salinity. Aquac. Res. 41, 953–960. doi: 10.1111/j.1365-2109.2009.02377.x
Sacristán H. J., Di Salvatore P., Fernández-Gimenez A. V., Lovrich G. A. (2019). Effects of starvation and stocking density on the physiology of the male of the southern king crab Lithodes santolla. Fish. Res. 218, 83–93. doi: 10.1016/j.fishres.2019.05.006
Scatena R., Bottoni P., Martorana G. E., Ferrari F., De Sole P., Rossi C., et al. (2004). Mitochondrial respiratory chain dysfunction, a non-receptor-mediated effect of synthetic PPAR-ligands: biochemical and pharmacological implications. Biochem. Bioph. Res. Co. 319, 967–973. doi: 10.1016/j.bbrc.2004.05.072
Schofield C. J., McDonough M. A. (2007). Structural and mechanistic studies on the peroxisomal oxygenase phytanoyl-CoA 2-hydroxylase (PhyH). Biochem. Soc Trans. 35, 870–875. doi: 10.1042/BST0350870
Sin E., Min W. G., Kim Y. B., Kim T. W. (2019). Respiration of the sea urchin Mesocentrotus nudus in response to large temperature fluctuations. Mar. Environ. Res. 144, 178–185. doi: 10.1016/j.marenvres.2019.01.003
Ulaje S. A., Lluch-Cota S. E., Sicard M. T., Ascencio F., Cruz-Hernández P., Racotta I. S., et al. (2020). Litopenaeus vannamei oxygen consumption and HSP gene expression at cyclic conditions of hyperthermia and hypoxia. J. Therm. Biol. 92102666. doi: 10.1016/j.jtherbio.2020.102666
Wang F. S., Cao M., Wang B. L., Fu J. N., Luo W. Y., Ma J. (2015). Seasonal variation of CO2 diffusion flux from a large subtropical reservoir in East China. Atmospheric Environ. 103, 129–137. doi: 10.1016/j.atmosenv.2014.12.042
Wang J. Q., Tian X. L. (2012). Recent advances in the biology of sea cucumber aquaculture (Bei Jing: China Ocean Press).
WMO (2021). The state of greenhouse gases in the atmosphere based on global observations through 2020 (Geneva:Greenhouse Gas Bulletin).
Xia B., Ren Y. C., Wang J. Y., Sun Y. Z., Zhang Z. D. (2017a). Effects of feeding frequency and density on growth, energy budget and physiological performance of sea cucumber Apostichopus japonicus (Selenka). Aquaculture 466, 26–32. doi: 10.1016/j.aquaculture.2016.09.039
Xia B., Ren Y. C., Wang F., Yu D., Cui G. P., Chen J. H. (2017b). A comparative study on growth, protein turnover and energy budget of green and white color morphs of sea cucumber Apostichopus japonicus (Selenka). Aquacult. Env. Interac. 9, 405–414. doi: 10.3354/aei00241
Yang L., Lu F., Wang X. K., Duan X. N., Tong L., Ouyang Z. Y., et al. (2013). Spatial and seasonal variability of CO2 flux at the air-water interface of the three gorges reservoir. J. Environ. Sci.(China) 25, 2229–2238. doi: 10.1016/s1001-0742(12)60291-5
Yang A. F., Zhou Z. C., He C. B., Hu J. J., Chen Z., Gao X. G., et al. (2009). Analysis of expressed sequence tags from body wall, intestine and respiratory tree of sea cucumber (Apostichopus japonicus). Aquaculture 296, 193–199. doi: 10.1016/j.aquaculture.2009.08.016
Yao F., Zhang S. Q., Yang Y. O., Peng K. S. (2009). Effects of stocking density on nitrogen and energy budget of gibel carp. J. Anhui Agric. Univ. 36 (3), 451–455. doi: 10.13610/j.cnki.1672-352x.2009.03.034
Yuan X. T., Yang H. S., Wang L. L., Zhou Y., Gabr H. R. (2010). Effects of salinity on energy budget in pond-cultured sea cucumber Apostichopus japonicus (Selenka) (Echinodermata: Holothuroidea). Aquaculture 306, 348–351. doi: 10.1016/j.aquaculture.2010.04.026
Yuan X. T., Yang H. S., Wang L. L., Zhou Y., Zhang T., Liu Y. (2007). Effects of aestivation on the energy budget of sea cucumber Apostichopus japonicus (Selenka) (Echinodermata: Holothuroidea). Acta Ecol. Sin. 27, 3155–3161. doi: 10.1016/s1872-2032(07)60070-5
Zamora L. N., Yuan X., Carton A. G., Slater M. J. (2018). Role of deposit-feeding sea cucumbers in integrated multitrophic aquaculture: progress, problems, potential and future challenges. Rev. Aquac. 10, 57–74. doi: 10.1111/raq.12147
Zhang E. D., Dong S. L., Wang F., Tian X. L., Gao Q. F. (2019). Effects of dietary trp levels on growth and metabolic enzyme activities of Apostichopus japonicus selenka reared at various densities. Fish. Modernization 46, 35–40. doi: 10.3969/j.issn.1007-9580.2019.01.006
Zhang D. X., He J., Xu W. J., Li S., Liu H. L., Chai X. R. (2022). Carbon dioxide and methane fluxes from mariculture ponds: The potential of sediment improvers to reduce carbon emissions. Sci. Total Environ. 829, 154610. doi: 10.1016/j.scitotenv.2022.154610
Zhang J., Kitazawa D. (2016). Assessing the bio-mitigation effect of integrated multi-trophic aquaculture on marine environment by a numerical approach. Mar. pollut. Bull. 110, 484–492. doi: 10.1016/j.marpolbul.2016.06.005
Zhang S. C., Liu S. L., Zhang L. B., Ru X. S., Yang H. S. (2016). Effect of stocking density on key growth traits of a fast-growing and heat-resistant strain of sea cucumber (Apostichopus japonicus). Aquac. Res. 47, 3636–3643. doi: 10.1111/are.12816
Zhang X. J., Sun L. N., Yuan J. B., Sun Y. M., Gao Y., Zhang L. B., et al. (2017). The sea cucumber genome provides insights into morphological evolution and visceral regeneration. PloS Biol. 15, 2003790. doi: 10.1371/journal.pbio.2003790
Zhang P., Zhou X., Qin W., Bai A. X. (2014). Effects of culture medium and stocking density on substrate and benthic animals in a pond. J. Dalian Ocean Univ. 29, 391–396. doi: 10.3969/j.issn.2095-1388.2014.04.013
Zhou S., Wallace K. B. (1999). The effect of peroxisome proliferators on mitochondrial bioenergetics. Toxicol. Sci. 48, 82–89. doi: 10.1093/toxsci/48.1.82
Keywords: carbon dioxide, stocking density, aerobic respiration, transcriptomics, energy budget
Citation: Mei Y, Tian Y, Gao Q, Dong S, Li X and Xu Y (2022) Effects of different stocking densities on the CO2 fluxes at water-air interface and the respiration metabolism in sea cucumber Apostichopus japonicus (Selenka). Front. Mar. Sci. 9:965700. doi: 10.3389/fmars.2022.965700
Received: 10 June 2022; Accepted: 06 July 2022;
Published: 26 July 2022.
Edited by:
Bin Xia, Qingdao Agricultural University, ChinaCopyright © 2022 Mei, Tian, Gao, Dong, Li and Xu. This is an open-access article distributed under the terms of the Creative Commons Attribution License (CC BY). The use, distribution or reproduction in other forums is permitted, provided the original author(s) and the copyright owner(s) are credited and that the original publication in this journal is cited, in accordance with accepted academic practice. No use, distribution or reproduction is permitted which does not comply with these terms.
*Correspondence: Qinfeng Gao, cWZnYW9Ab3VjLmVkdS5jbg==