 Dandan Yan
 Jingtai Li
 Siying Xie
 Yao Liu
 Yufeng Sheng
 Zhaoqing Luan
95% of researchers rate our articles as excellent or good
Learn more about the work of our research integrity team to safeguard the quality of each article we publish.
Find out more
ORIGINAL RESEARCH article
Front. Mar. Sci. , 15 July 2022
Sec. Marine Ecosystem Ecology
Volume 9 - 2022 | https://doi.org/10.3389/fmars.2022.964172
This article is part of the Research Topic Degradation, Ecological Restoration and Adaptive Management of Estuarine Wetlands under Intensifying Global Changes View all 20 articles
The spread of Spartina alterniflora (smooth cordgrass) has put biodiversity and ecosystem function at risk since it was introduced to China just a few decades ago. A better understanding of how the range of S. alterniflora will expand in the future will help manage the invasion of this species in coastal wetlands. However, it is difficult to model the future extent of Spartina saltmarshes in China. To address this issue, we combined multi criteria evaluation with traditional CA Markov model to provide robust forecasting of the spatial expansion of S. alterniflora for the next ten years, at Dafeng Milu National Nature Reserve, Jiangsu, China. Our results showed that, compared with the interpretation results of high-resolution remote sensing images in 2020, the kappa coefficient of verification accuracy was 82.63%, indicating that the MCE-CA-Markov model has good prediction results. Therefore, the model can forecast the expansion process of S. alterniflora over the next ten years. The model predicts that the area of S. alterniflora continued to decrease from 910.25 ha in 2020 to 881.21 ha in 2030. The spatial distribution of S. alterniflora has been decreasing on the landward side while it has been expanding towards the sea on the seaward side. This study provides some suggestions for effective management and control of invasive species, which could be important for wetland biodiversity conservation and resource management.
Coastal wetlands are located in marine-terrestrial interlaced zones, which are critical in maintaining global biodiversity and ecological balance, offering important ecological service functions and economic values (Edwards and Mills, 2005; Zhang et al., 2005). Meanwhile, coastal wetlands are also a typically ecologically sensitive ecosystem,particularly within the context of increasing human activity and global change, and hence they are vulnerable to invasion by alien organisms (Ehrenfeld, 2010; Comeaux et al., 2012). Because Spartina alterniflora (S. alterniflora) is adaptable and has a high diffusion capacity, it has expanded extensively along the coast of China. Indeed, it has been one of the most widespread invasive plants in coastal wetlands (Liu, 2018a; Liu et al., 2018b; Yan et al., 2021; Yan et al., 2022). Tremendous researches has demonstrated that the invasion of S. alterniflora has resulted in severe ecological crises through its reshaping of the structure and function of the original coastal wetland ecosystem (Grosholz et al., 2009; Page et al., 2010). Consequently, accurate modelling and forecasting of the temporal and spatial dynamics of S. alterniflora expansion in the future is urgently needed. Moreover, anticipating the expansion of S. alterniflora in coastal wetlands will be a significant step towards the protection and ecological management of coastal ecosystems (Luan et al., 2020; Yan et al., 2021).
With the continuous improvement of remote sensing and geographic information systems, the research on the expansion of S. alterniflora community tends to be more accurate (Luan et al., 2020). Research into the spatial dynamic change of S. alterniflora in China mainly focuses on the spatial expansion and driving mechanisms of this species (Milzow et al., 2010; Wang, 2014; Luan et al., 2020). Wang et al. (2017) inverted the aboveground biomass of S. alterniflora using hyperspectral data and LiDAR data in Dafeng, Jiangsu Province. The biomass of S. alterniflora in coastal wetlands was recorded with high precision, providing an accurate and effective monitoring method for the spatial patterns of invasive S. alterniflora (Wang et al., 2017). Zhou et al. (2017) inversed S. alterniflora plant height by constructing two parameters of vegetation coverage and aboveground biomass based on SPOT6 high-resolution remote sensing images. The results showed that the estimation error of this method is small and the inversion result is feasible (Zhou et al., 2017). Therefore, high spatial resolution remote sensing images can reflect the geometric structure and texture information of ground objects in more detail. To better understand the invasion dynamics and driving mechanisms of S. alterniflora, simulation prediction models are important for dynamically simulating and predicting the spatial dispersal process of S. alterniflora (Zheng et al., 2015; Xie and Han, 2018). At present, the models for researching landscape pattern dynamics mainly include Markov chain models (Markov), cellular automata models (CA), and cellular automata-Markov (CA-Markov) models (Ruishan and Suocheng, 2013; Qin et al., 2020; Zhang et al., 2021; Yao et al., 2022a). The CA Markov model has the advantages of Markov models for time series and CA models for spatial forecasting (Mitsova et al., 2011; Yang et al., 2014; Zheng et al., 2015; Yao et al., 2022a). Huang et al. (2008) input elevation parameters to the transition rules and controlled the expansion speed by the selective Moore radius in the CA model (Huang et al., 2008). Zhang et al. (2021) only considered the asexual reproduction of S. alterniflora, and simulated the expansion dynamics of this species with a cellular automata model based on the spatial distribution of S. alterniflora, in the Yellow River Delta from 2014 to 2018 (Zhang et al., 2021). Multi criteria evaluation (MCE) is applied to the suitability atlas module of the CA-Markov model, which can combine multiple factors into restrictive factors of the transformation model, making the model both more scientific and more practical. Qiu and Lu (2018) added driving mechanisms for suitability analysis and predicted the expansion dynamics of S. alterniflora in 2018, 2022, 2026, and 2030 with a CA Markov model (Qiu and Lu, 2018). Qin et al. (2020) constructed an MCE-CA-Markov composite model to simulate landscape pattern changes using four Landsat remote sensing images from 2000–2015 (Qin et al., 2020). However, the above researches only concentrated on the spatial expansion law of S. alterniflora to predict its possible expansion dynamics. These models are only empirical in essence, and the spatial resolution of remote sensing images is not high. Moreover, internal driving factors such as hydrology and soil that affect the expansion of S. alterniflora failed to consider the suitability atlas module of the CA-Markov model. Therefore, the way to predict the spatial expansion dynamics of S. alterniflora is still not well understood and needs to be improved. Numerous studies have shown that tidal inundation and soil salinity are the key factors affecting the ecological characteristics of S. alterniflora (Burns, 2011; Moffett and Gorelick, 2016; Luan et al., 2020). Yan et al. (2022) showed that elevation and soil salinity are the main internal environmental drivers affecting the growth of S. alterniflora, and the number of elk and artificial ditches are the external factors affecting the growth of S. alterniflora (Yan et al., 2021). Therefore, fully considering the natural and human factors affecting the expansion of S. alterniflora is important for examining the expansion of S. alterniflora.
The biggest innovation of the present study is that we combined high resolution remote sensing images and the natural and human factors affecting the expansion of S. alterniflora to provide robust predictions for spatial expansion of S. alterniflora at Dafeng Milu National Nature Reserve over the next 10 years, with MCE-CA-Markov. In summary, the aims of this study were as follows: (1) to generate suitability maps of S. alterniflora based on the multi-criteria evaluation module (MCE); and (2) to forecast the expansion of S. alterniflora for the next 10 years by combining MCE with a traditional CA Markov model. This study not only provides suggestions for effective management and control of invasive species, but also provides scientific guidance for the promotion of coastal ecosystem protection and ecological management in Jiangsu.
Dafeng Milu National Nature Reserve (DMNNR; 32°56′ N–33°36′ N, 120°42′ E–120°51′ E) is located in the southeast of Dafeng, Yancheng, in Jiangsu. The DMNNR was considered to be the first and largest wildlife nature reserve in the world for Elaphurus davidianus (Père David’s deer). The Ramsar Wetland Convention Organization designated the DMNNR as a wetland of international importance, in 2002 (Lu et al., 2018; Yan et al., 2021). The present study took the third core area of DMNNR and its tidal flat as the research area (25 km2), which silted up in the last 30 years (Figure 1). The third core area is a coastal tidal wetland and a wild pasture for E. davidianus, with few human activities.
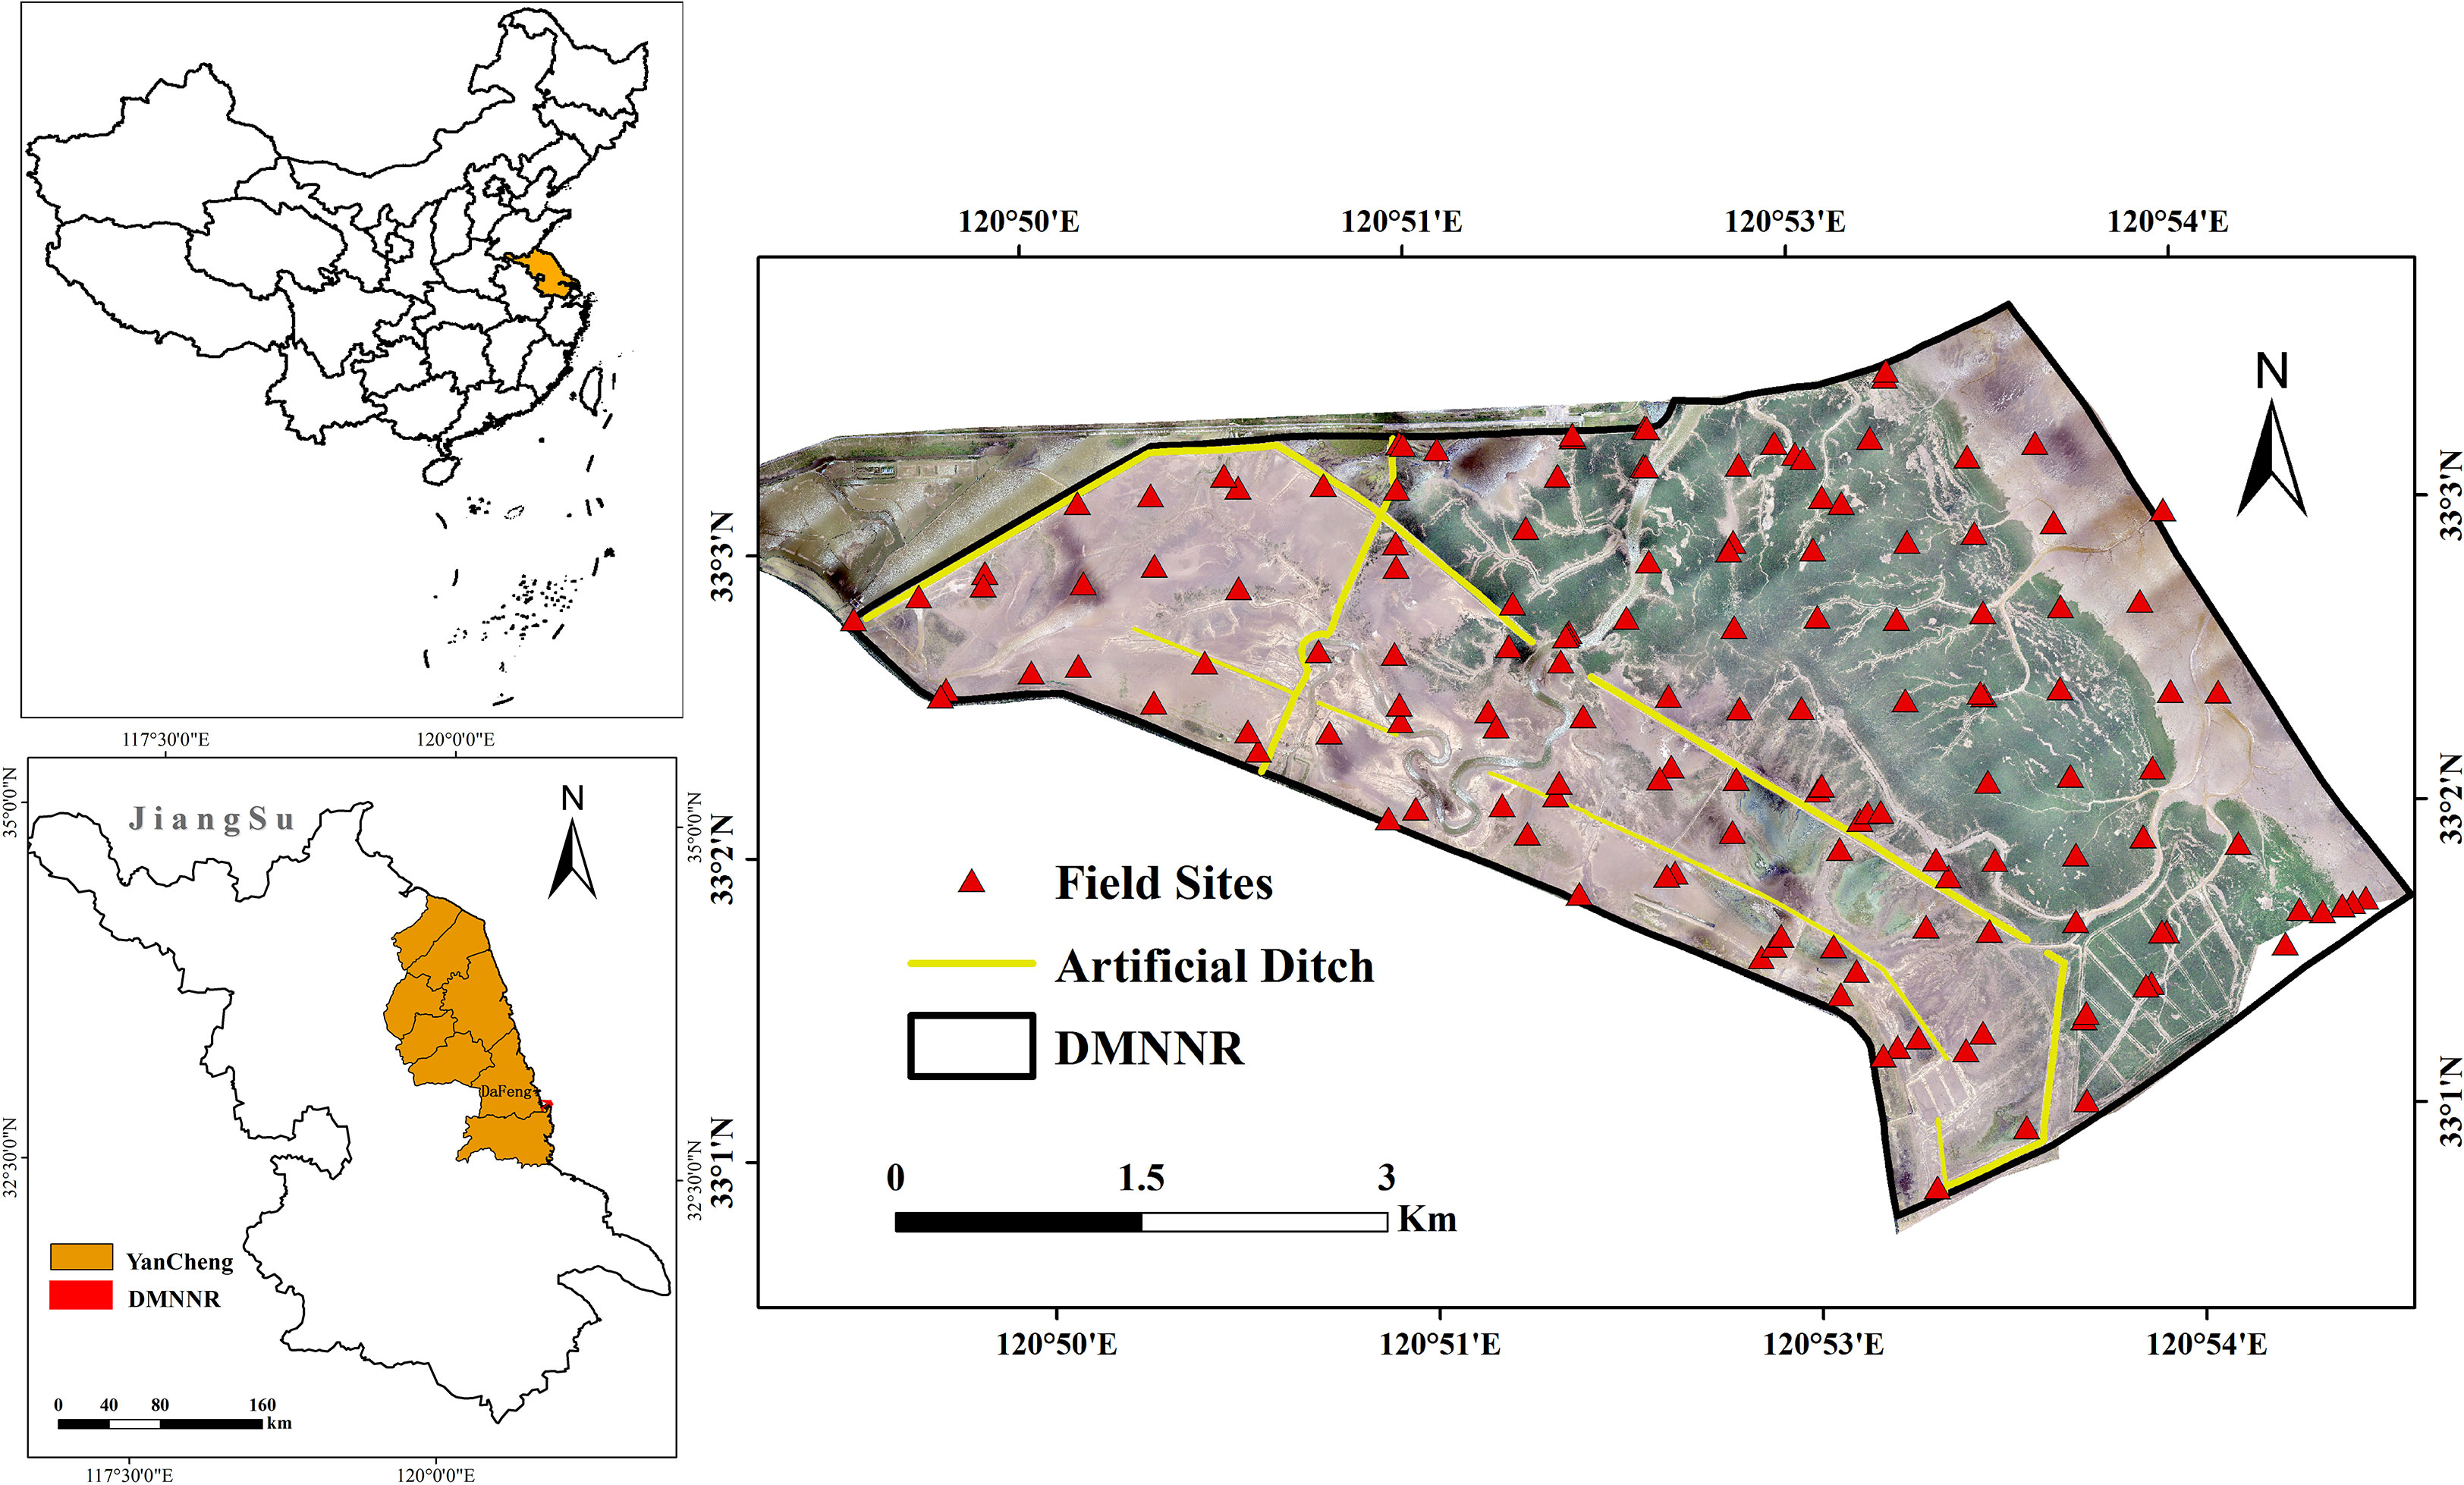
Figure 1 The location of the DMNNR, Jiangsu, China. The background image is the high resolution unmanned aerial vehicle (UAV) image with a natural true color composition (acquisition date: 2020/08/13).
Soil and water salinity is more than 30‰ all year round, which is especially suitable for the growth of S. alterniflora. Thus, S. alterniflora spreads rapidly in coastal tidal flats, encroaching on a large area of light beaches. At present, S. alterniflora accounts for 70% of the study area and is becoming the single, absolutely dominant, species in the study area (Ping et al., 2012; Zhu et al., 2016; Liu et al., 2018b). To effectively control the invasion of S. alterniflora and create a suitable habitat for birds and wild E. davidianus in DMNNR, since 2011 the government has been building small embankments and artificial ditches. A total of 2.5 km of small dykes and 10 km of artificial freshwater ditches were built to meet the needs of various wild animals and to control the spread of S. alterniflora (Figure 1). DMNNR reported that the number of wild E. davidianus individuals increased from 9 in 1999 to 1820 in 2020, which resulted in a decrease in S. alterniflora by foraging and trampling (Yan et al., 2021).
Land cover data were acquired from WorldView-2 (WV-2) and UAV Dabai-II high-resolution images from 2010 to 2020. The WV-2 image was purchased from AIRBUS, including a panchromatic band of 0.5 m spatial resolution and four multi-spectral bands (blue: 450–510 nm; green: 510–580 nm; red: 630–690 nm and near-infrared: 770–895 nm) at 1.8 m spatial resolution. The optical image of the WV-2 satellite on November 9, 2010 was obtained during a low tide period that was free from cloud coverage (Figure 2A). WV-2 images were preprocessed with ENVI 5.4 for radiometric calibration, atmospheric correction, pan-sharpening, and image registration. We applied the Gram-Schmidt pan sharpening method to merge the panchromatic and multi-spectral bands of the WV-2 image. Ground control points (GCPs) were measured by Trimble R8 GNSS RTK for the geographic registration of images with at least 50 GCPs evenly distributed in WV-2 image. The root mean squared error (RMSE) of geometric rectification was less than 0.5 pixels. Two UAV flights (wingspan 2.7 m; flight height: 500 m; flight speed: ∼30 m/s) were conducted during the low tide, on August 13, 2020. To avoid the impact of lighting conditions on the flight, the UAV flights were completed within a short time frame (<1 h). There was sufficient image overlap for image processing (>60% forward overlap and > 40% side overlap). More than 1000 camera images were collected. Finally, a set of position and orientation system dates (POS) and original RGB images were processed, in Photoscan, to generate a very high resolution (40 cm) RGB orthophoto and point cloud with 40 points/m2 covering the entire study area.
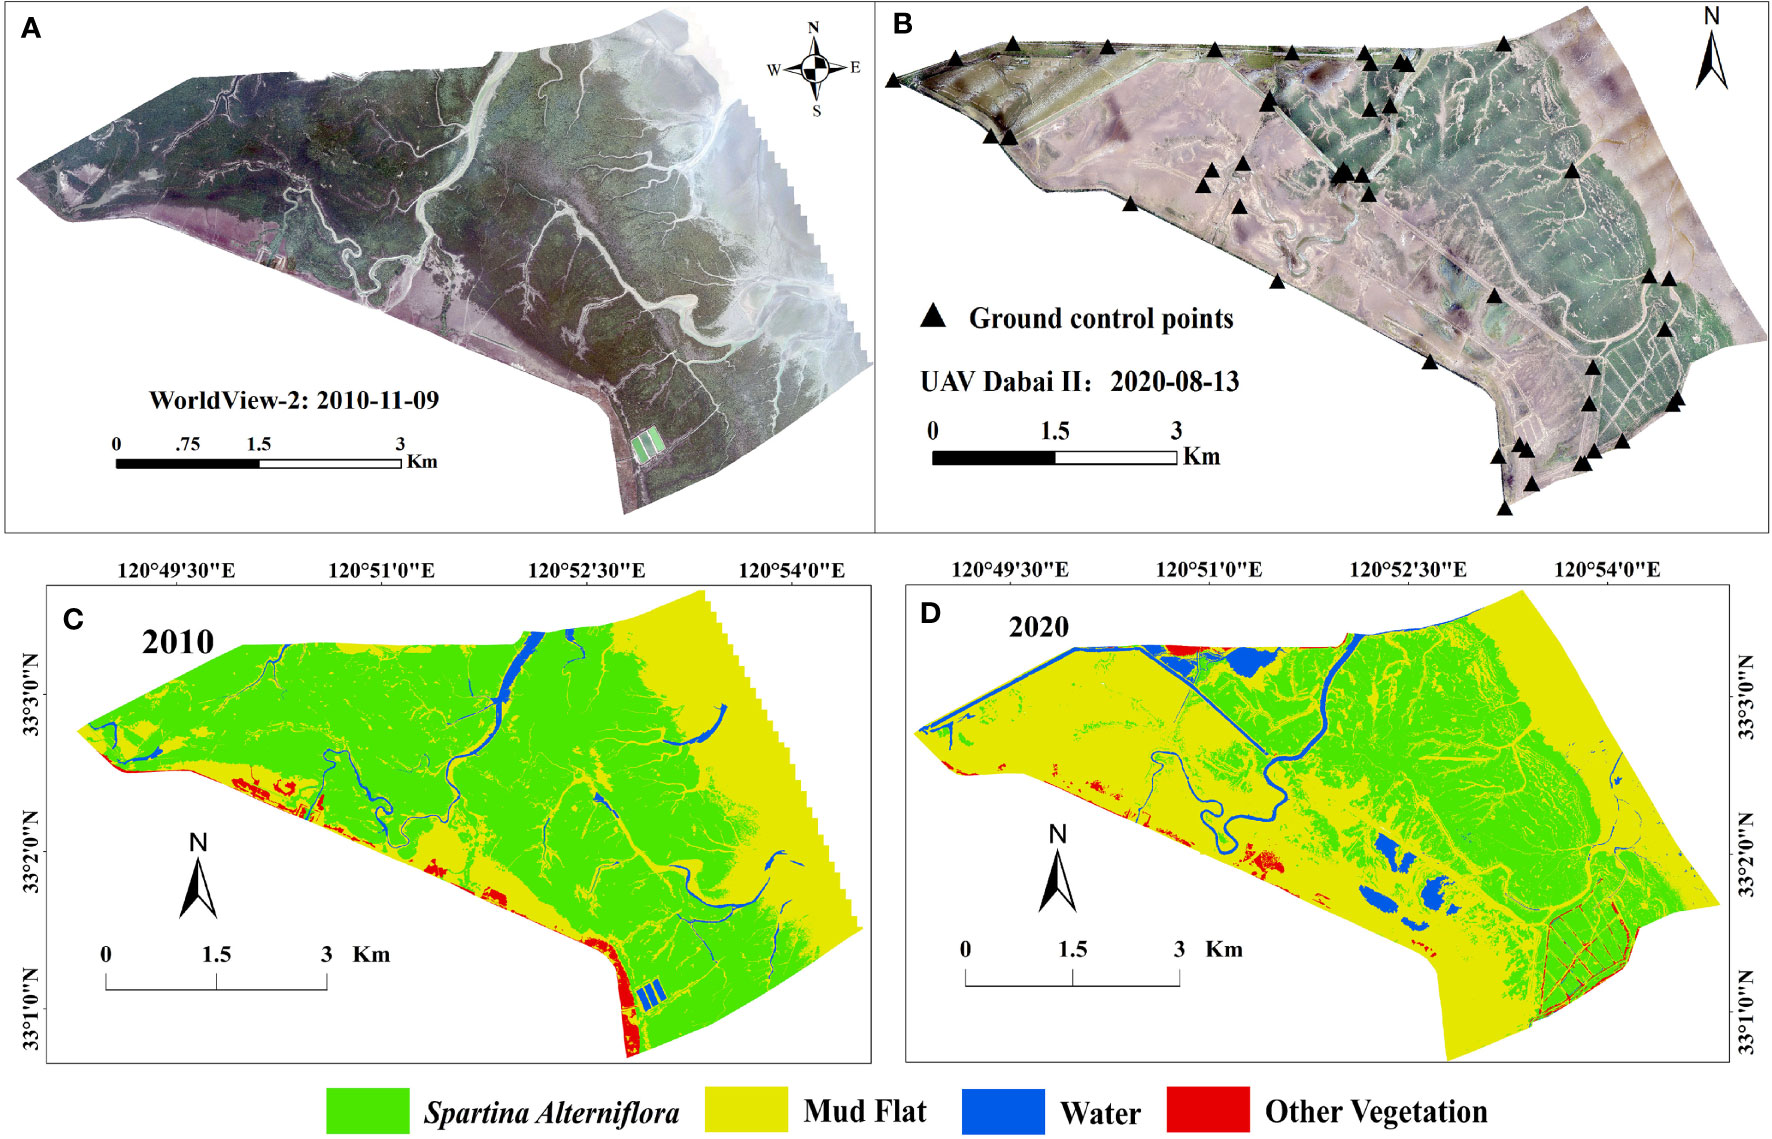
Figure 2 The spatial dynamics of Spartina saltmarshes between 2010 and 2020 in the DMNNR. (A) Data from WorldView-2 in 2010, (B) UAV Daibai-II image in 2020, and (C) wetland landscape classification results in 2010 and in (D) 2020.
To reduce positioning error, the digital orthophoto map (DOM) and point cloud data were spatially registered based on 50 ground control points (Figure 2B). To reduce the potential position errors among these images, all images were resampled to a pixel size of 0.5 × 0.5 m and projected to the Universal Transverse Mercator (UTM). We applied object-oriented and visual interpretation to map the spatial distribution of different features from 2010 to 2020 (Figures 2C, D). To analyze the accuracy of S. alterniflora data, we performed field sampling in August 2020. Ground surveys were conducted, with 140 sampling points (Figure 1) and overall was greater than 85%. The spatial distribution of artificial ditches was extracted by vectorizing the central axis of the ditches using visual interpretation based on ArcGIS spatial analysis tools.
Large-scale field vegetation sampling was conducted in the August 2020. It collected 140 sample points with a 500 m measurement interval. Three quadrats (100 cm × 100 cm) were laid out at each sample point, and a total of 420 sampling sites were collected (Figure 1). Geographical information was recorded for each sample point using a Trimble Geo7X differential GPS. At the same time, soil was collected from 0 to 20 cm depth using a soil drill, and then sieved through a 2 mm screen mesh. To measure soil salinity using the drying method, a 1:5 soil: water extract solution was prepared (Bao, 2000).
Based on the point cloud with 40 points/m2 from UAV high-resolution images, first, digital surface model (DSM) was constructed based on the grid and texture of the point cloud using the multi-view 3D reconstruction technology in Agisoft PhotoScan 1.2.5 (Agisoft LLC, 2014). The point cloud have different color, classification value, intensity value, etc. So we can identify vegetation points from ground points based on 3D point cloud with real object colors and geometric characteristics. However, the point cloud cannot reach the bare surface due to the dense S. alterniflora canopies. Therefore, we measured the elevation data for dense S. alterniflora canopies using a Trimble R8 GNSS GPS-RTK with 5 mm positioning accuracy, obtaining 123 elevation data (Figure 3A). Finally, we combined 123 elevation data for dense S. alterniflora canopies and ground points to generate digital elevation model (DEM) with 40 cm resolution (Figure 3A).
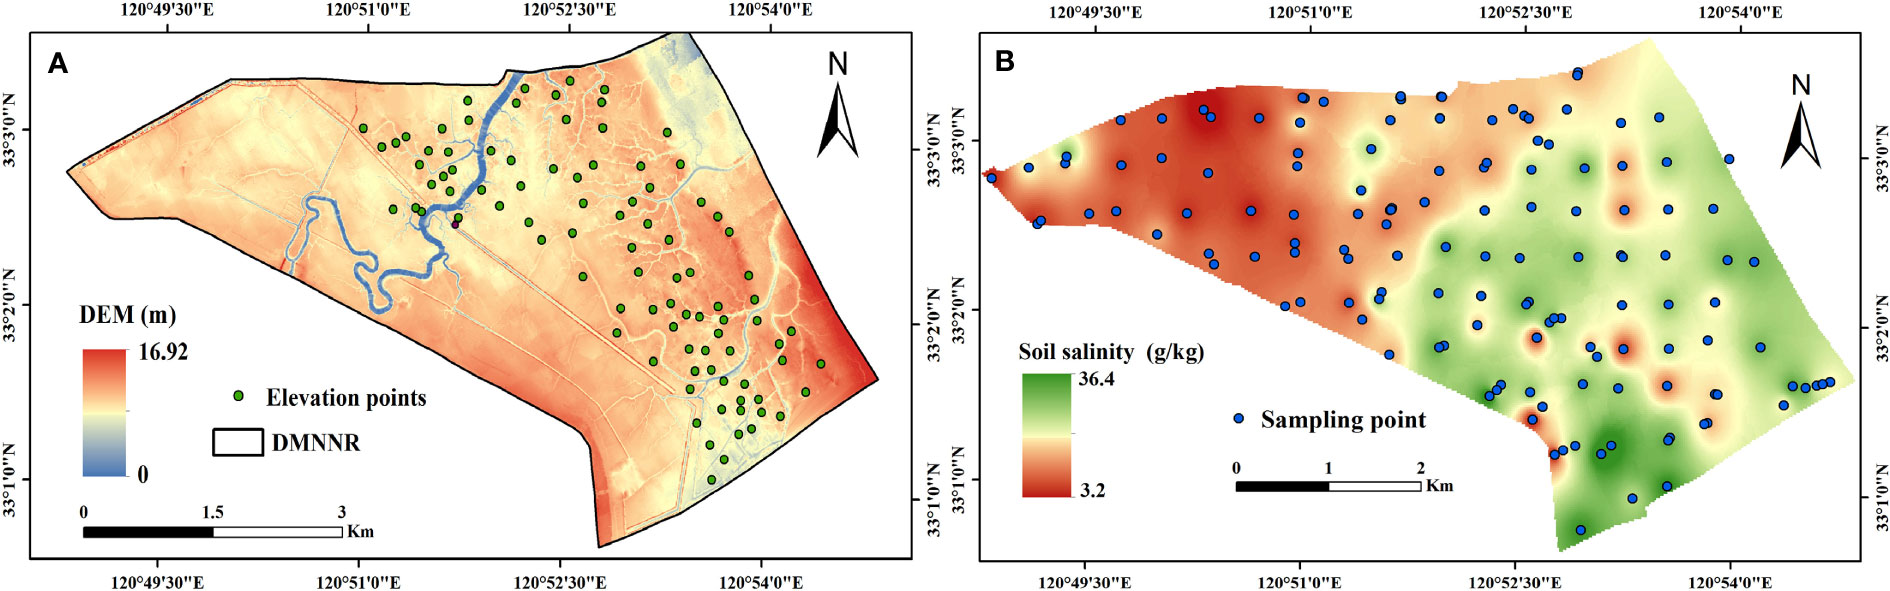
Figure 3 Digital elevation model in the DMNNR (A), and spatial distribution of soil salinity (B).
Inverse distance weighting (IDW) is based on the principle of similarity. It assumes that each simulated value is affected by the distance of the sampling point, and the influence on that sampling point decreases as the distance increases (Hammam and Mohamed, 2020). IDW interpolation is especially suitable for a uniform and dense distribution of sampling points (Zhao et al., 2019; Sheng et al., 2020). Thus, 140 soil samples were collected from 0–20 cm depth (Figure 1). The spatial distribution map of soil salinity was drawn by IDW interpolation in the geostatistical toolbox of ArcGIS 10.5 (Figure 3B).
The cellular automata model is a discrete spatiotemporal dynamic system, and each cell is a local feature (Chui, 2015). The model depends on the proximity relationship and transformation rules between local cells to simulate complex spatiotemporal dynamics during a specific period of time. A cellular automaton is composed of the cell itself, the state of the cell, a cell neighborhood, and transformation rules (Wolfram, 1984; Sanchayeeta and Jane, 2012). The cell is the most basic unit, and the cell at each time point has a corresponding state. The “S. alterniflora” and “mudflat” in this study are specific cell states at the current time. The neighborhood of a cell is a collection of cells and their surrounding adjacent cells. The distance between adjacent cells is mainly divided into square grids based on Euclidean space, where each cell has eight neighbors. Each cell only depends on the state of the cell and neighboring cells. Its rationale is that the state of a cell automaton at time (t+1) is a function of its state at time (t) (Tiné et al., 2019). A cellular automaton is defined as follows
where f is the transition rule or function of the local space; S is the set of finite and discrete states of the cell; t t+1denotes the transition step, and N is the number of cell neighbors.
CA has powerful spatial-operation capabilities which are suitable for simulating the temporal and spatial dynamics of land cover. However, the factors affecting land cover change are often nonlinear. It is difficult to accurately predict the spatio-temporal dynamics of S. alterniflora by only using the local transformation rules of cellular automata (Qiu and Lu, 2018; Guo, 2019).
The Markov model is a spatial transformation model based on raster data. It is a mathematical method for predicting the probability of events. The state and development trend of incidents were predicted by a transition probability matrix between the different time states (Sanchayeeta and Jane, 2012; Song, 2020). The equation is as follows:
where, Nt, Nt+1 represent the land cover types at the two time points; t is time; Pij is the matrix of state transition probabilities.
The temporal and spatial change processes of land cover will be affected by a variety of complex factors. Thus, the transformation between various land cover types is often associated with many uncertain factors. There are certain limitations to predicting the spatial change of land cover by the Markov model. It can accurately simulate the quantitative change of land cover in the future, but cannot simulate the spatial dynamic change of land cover (Song, 2020; Yao et al., 2022a).
CA and Markov can both dynamically simulate the spatial changes of land cover. Although the CA model has a powerful spatial analysis function, it is not as good as the Markov model in terms of quantitative numerical calculations. The Markov model is focused mainly on quantitatively simulating changes in land cover types over a long period of time, but cannot predict their spatial distribution. The CA model and Markov model are combined to generate a CA Markov model that has both the capacity of the CA model to simulate the spatial variation of complex systems and the numerical analysis capacity of the Markov model to forecast the long-term dynamic change. The CA Markov model can predict the temporal and spatial patterns of land cover change with high precision (Qiu and Lu, 2018; Qin et al., 2020; Yao et al., 2022a).
The change of land cover types is not only related to the state of the cell itself and its local environment, but is also affected by natural, social, economic, and other factors. Therefore, the biggest innovation of the present study is in fully considering the natural and human factors affecting the expansion of S. alterniflora in DMNNR. The suitability atlas of S. alterniflora was established through the multi standard evaluation system, and the spatial expansion of S. alterniflora in DMNNR was modelled and predicted using the CA-Markov model in the IDRISI software. Due to the IDRISI software has unique vector and raster data formats, meanwhile, all the data have the same geographic coordinate system, projection system, spatial resolution, and boundary range. Therefore, Data generation was conducted in three parts using the IDRISI software: First, we converted all raster data into the same projected coordinate system, and then set the raster size of the land cover type, DEM elevation, and soil salinity spatial distribution to 15 x 15 m. The raster data in ACSII format and the vector data of the Milu affected area and artificial ditch were imported into the IDRISI software and then reclassified. The transfer probability matrix of different land cover from 2010 to 2020 was generated using a Markov model. Second, the elevation, soil salinity, number of elk and artificial ditches were the main drivers affecting external factors affecting the growth of S. alterniflora. They all were quantitatively analyzed with the MCE model to generated suitability maps of wetland landscapes. Third, the transition matrix and suitability maps of S. alterniflora were integrated to simulate the expansion of S. alterniflora in the reserve in 2020 using the MCE-CA-Markov model. Finally, the spatial distribution of S. alterniflora through interpretation of high resolution remote sensing and the simulation results in 2020 were verified using the Kappa coefficient. After the verification for accuracy was passed, the spatial distribution of S. alterniflora in the reverse was simulated and predicted in 2030. The workflow for the MCE-CA-Markov model used in this study is shown in Figure 4.

Figure 4 Workflow for the MCE-CA-Markov model.
The research have revealed the expansion dynamics of S. alterniflora first increased during 1993–2010 but decreased substantially during 2011–2020 after ecological after ecological hydrological engineering and the increase in E.davidianus numbers (Yan et al., 2021). Therefore, to fully considerate the natural and human factors affecting the expansion of S. alterniflora in DMNNR and generate suitability maps of S. alterniflora, we chose spatial distribution map of wetland landscape types from 2010 to 2020 to examine the expansion of S. alterniflora in coastal wetlands. The landscape type transfer area matrix and the probability matrix describe the area change of each landscape type. Meanwhile, it also was considerated as conversion rule to simulate and predict the trends in land cover change in the next time period. Based on the spatial distribution map of wetland landscape types in 2010 and 2020 (Figures 2C, D), we generated the transition area matrix, transition probability matrix, and state transition atlas of wetland landscape types in the DMNNR from 2010 to 2020 using the Markov module in the IDRISI software. The transfer direction, spatial process, and transfer area matrix of wetland landscapes in the reverse from 2010 to 2020 are shown in Table 1. The results indicate that the area of S. alterniflora decreased from 1511.26 ha in 2010 to 910.25 ha in 2020, and mainly changed to mudflats. The area of mudflats mainly changed to S. alterniflora, while the total area converted to S. alterniflora was less than that converted to mudflats. Spatial-temporal dynamics of S. alterniflora in area and distribution were clearly observed from 2010 to 2020. S. alterniflora on the landward side of the study area transformed to mudflats, and the area of S. alterniflora decreased. The distribution of S. alterniflora on the seaward side has been expanding towards the sea, mainly occupying mudflats. The change in water area is greatly affected by tides, which are not the focus of the present study. Therefore, the wetland landscape type transfer area matrix and probability matrix from 2010 to 2020 were used to simulate and predict the dynamic changes of wetland landscape types in 2020.
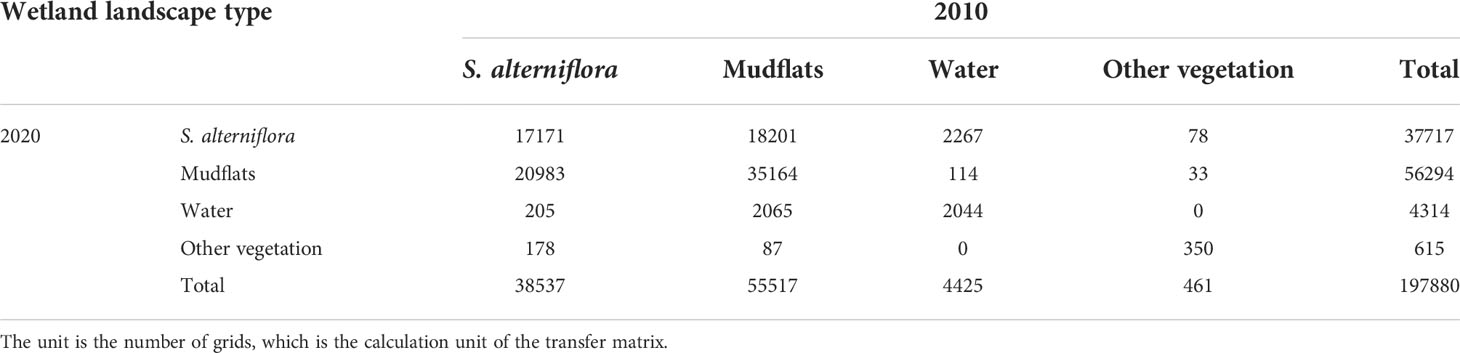
Table 1 Area transfer matrix of wetland landscape type change from 2010 to 2020.
The landscape type suitability atlas is an important part of the transformation rules in the CA Markov model, which refers to the spatial probability distribution map of landscape type being transformed into other landscape types. The suitability maps of wetland landscape types are based on the MCE. The MCE consists of a Boolean, the sequential weighted average, and the weighted linear combination method. Evaluation criteria mainly include constraint factors and influence factors. The constraint factor uses the Boolean method to generate restrictive conditions, and the influence factor uses different function modules to generate suitability layers. In the present study, due to tidal flooding, the distribution of water was formed in places with relatively low elevations of tidal creeks. The possibility of such areas transforming into S. alterniflora in a short time is low. Therefore, the distribution of water as the constraint factor of S. alterniflora suitability atlas. Based on the wetland landscape type data in 2020 (Figure 2D), the constraint image of the area of water was obtained by reclassification, where 0 represents the water areas in 2020 and 1 indicates non-water areas in 2020 (Figure 5).
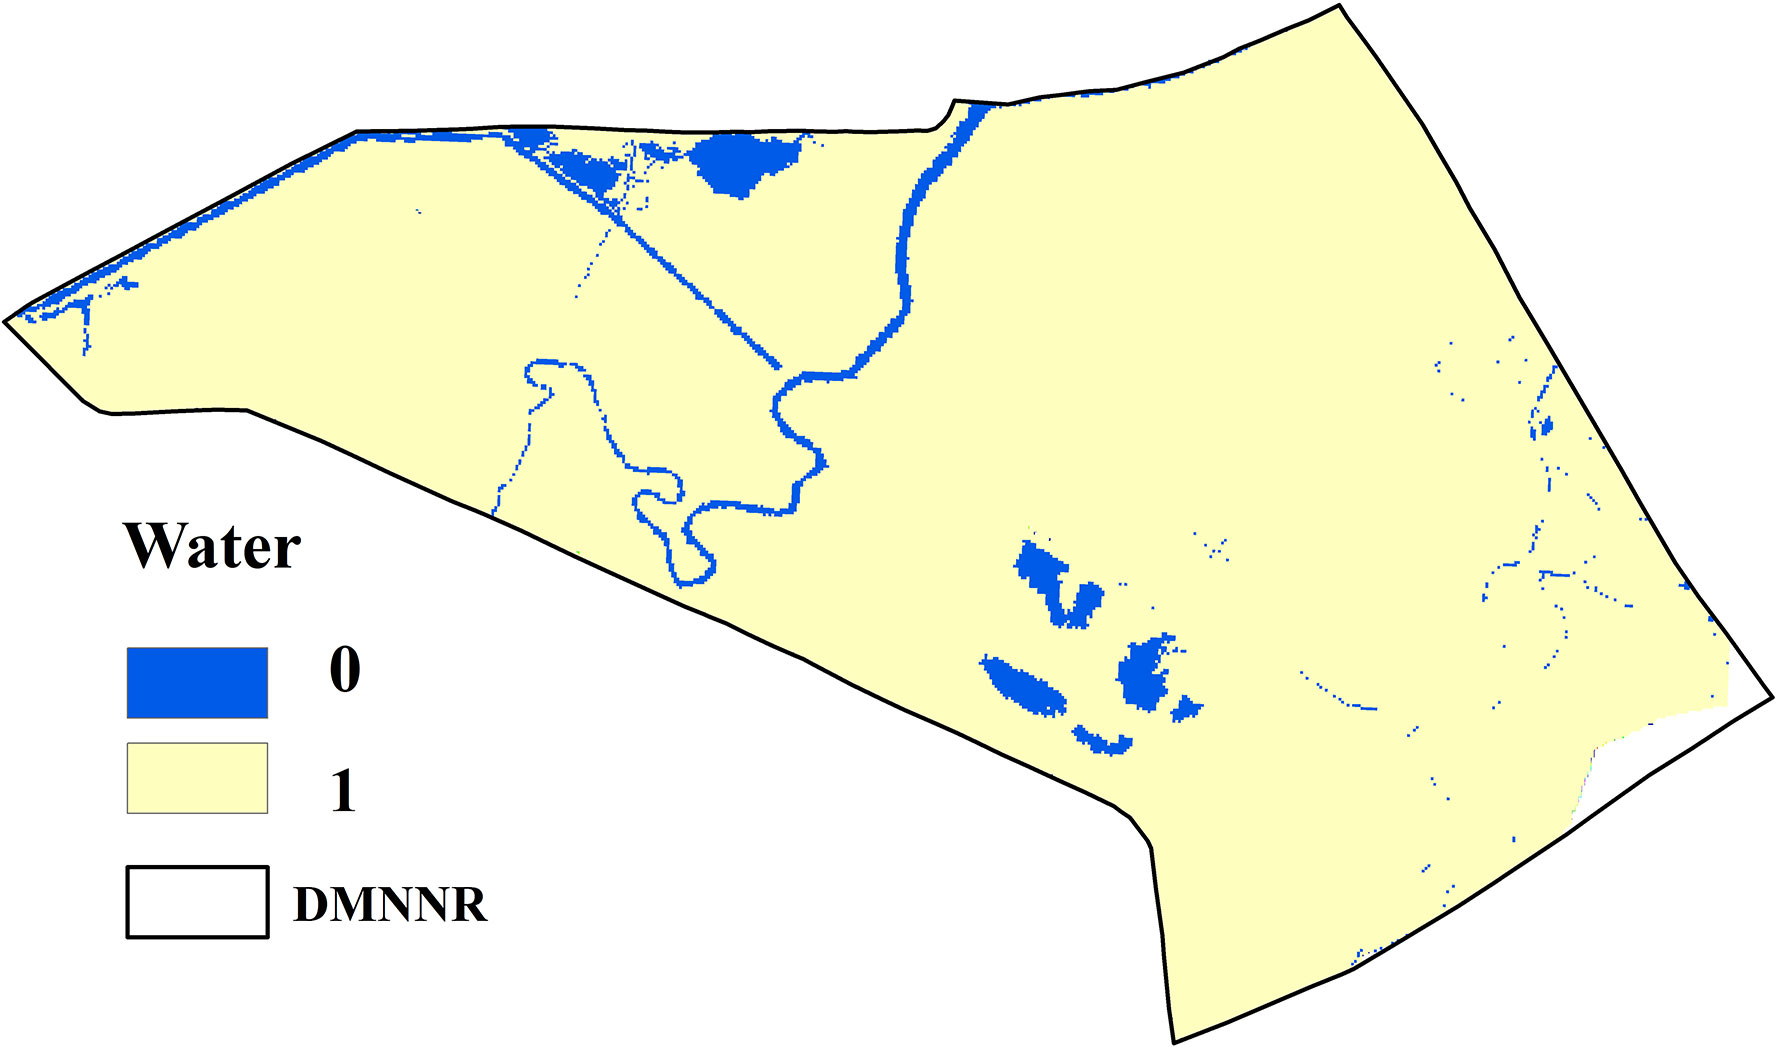
Figure 5 The constraint image of the area of water, where 0 represents the water areas in 2020 and 1 indicates non-water areas in 2020.
Elevation, soil salinity, artificial ditch, and Milu influence range are the influencing factors to generate the S. alterniflora suitability atlas. The fuzzy module provides monotonically increasing and decreasing S, J, linear, and symmetric parabolic functions. The field investigation found that the influence of artificial ditches and Milu on S. alterniflora was monotonically S increasing. The farther the S. alterniflora was from the tidal creek and the influence range of Milu, the better it grew. The distance of artificial ditches and the range of elk influence was calculated with the distance tool in the IDRISI software. We set the distance from the tidal ditch at 300–5000 m and the range from the Milu distribution area as 500–5000 m (Table 2). Yan et al. (2021) found that the relationship between S. alterniflora and flooding depth, soil salinity showed the same trend and was consistent with the Gaussian model. The plant biomass and height of S. alterniflora first increased and then decreased with elevation and soil salinity. Based on the optimal ecological range of elevation and soil salinity, the range of elevation was 9.74–11.02 m, and the range of soil salinity was 6.48–15.98 g/kg (Table 2). The layers for each influential factor were standardized using a fuzzy geometric function (Figure 6). The resulting standardized layers were mainly distributed from 0 to 255. The closer to 255, the more suitable, while the closer to 0, the less suitable, and the range of the suitable factor distribution was basically consistent with the spatial distribution of S. alterniflora. Finally, the constraint factors and influence factors are weighted and linearly combined to generate the suitability atlas of S. alterniflora based on the MCE.
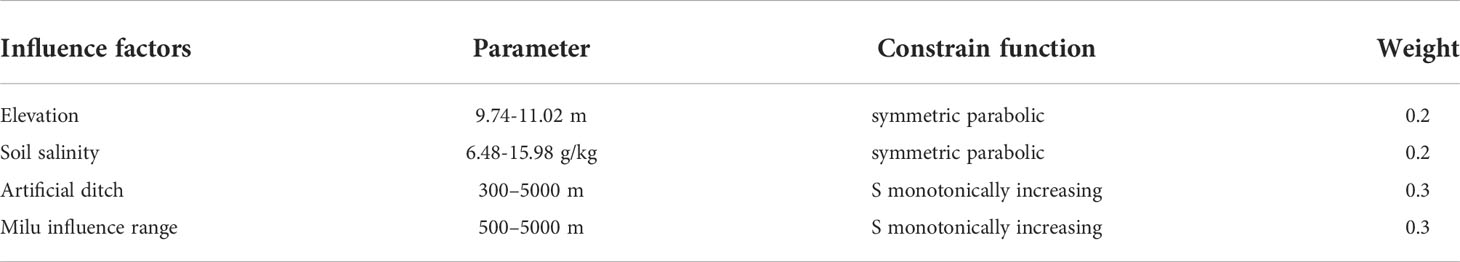
Table 2 Conversion of suitability atlas constraints of S. alterniflora.
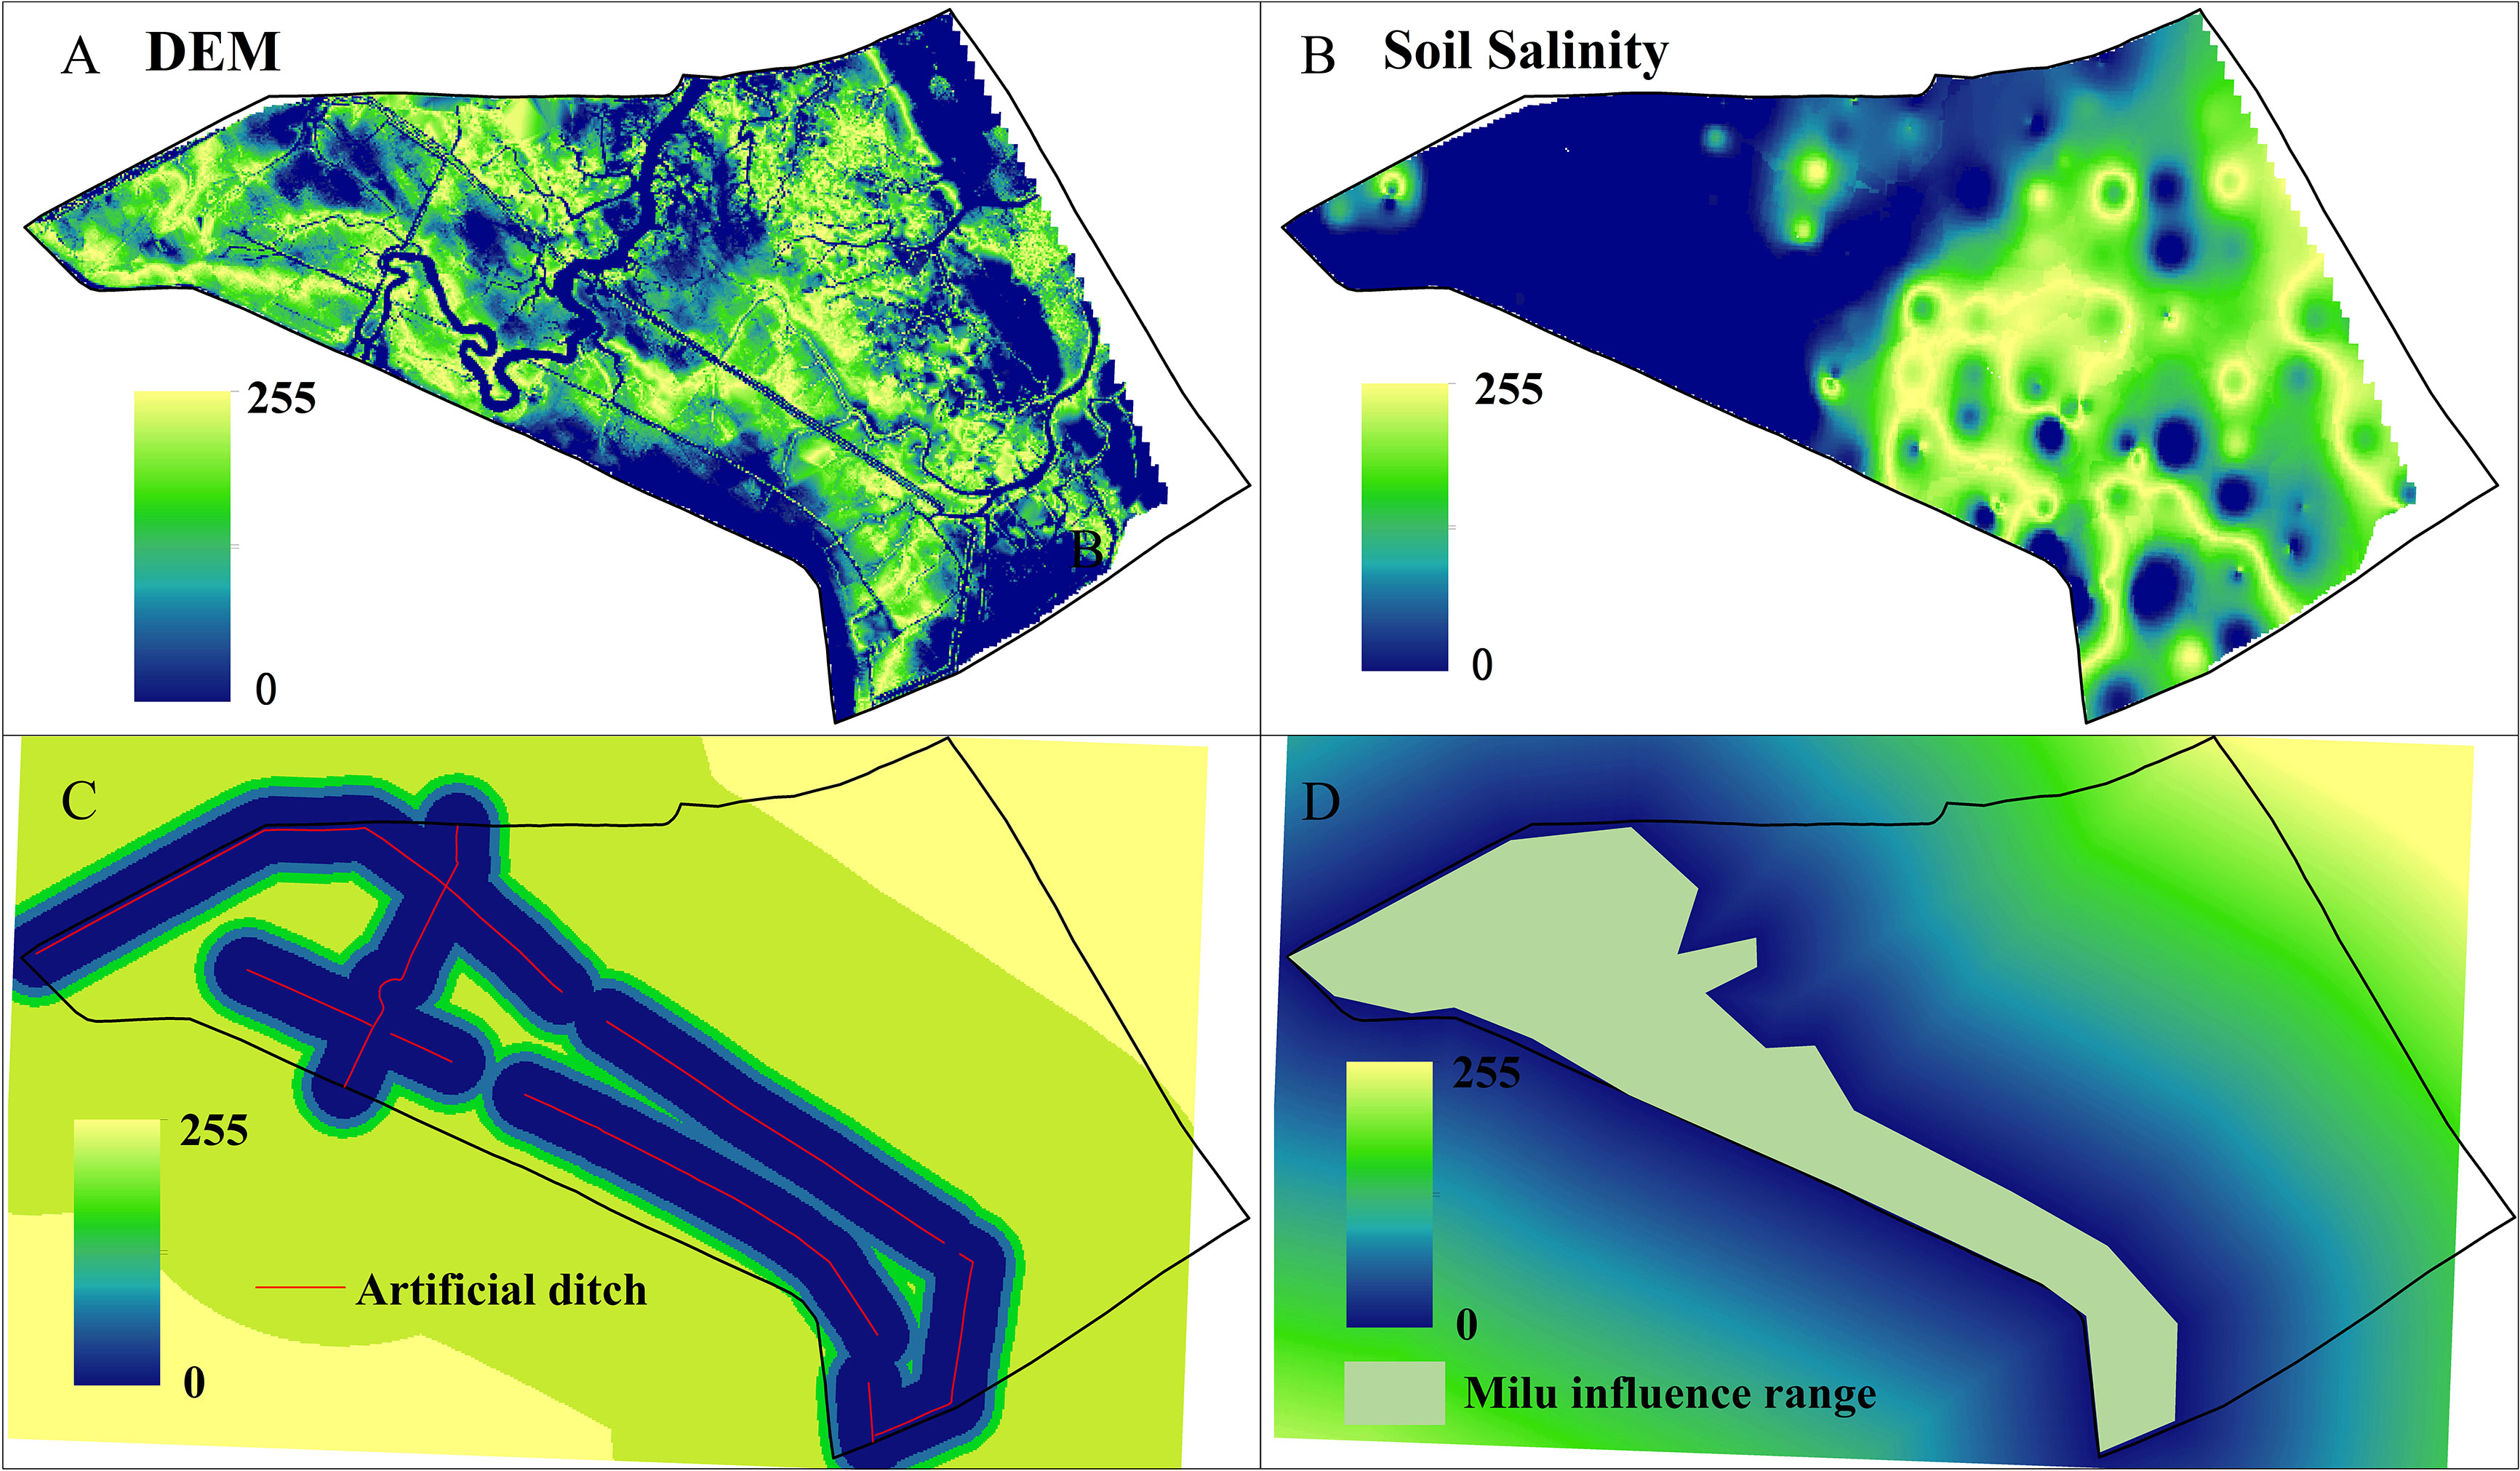
Figure 6 Fuzzy standardization of suitability atlas for S. alterniflora: DEM (A); soil salinity (B); artificial ditch (C); Milu influence range (D).
In the CA-Markov model, we input the S. alterniflora data for 2010 and 2020, transfer area and probability matrix of 2010-2020, and the suitability atlas of S. alterniflora. The research interval and the prediction interval should be the same. The optimal parameters of the simulation effect of this study were as follows: number of iterations: 10; filter size: 5 × 5. After long-term operation simulations, the simulation and prediction map of S. alterniflora in 2020 and 2030 was obtained (Figure 7).
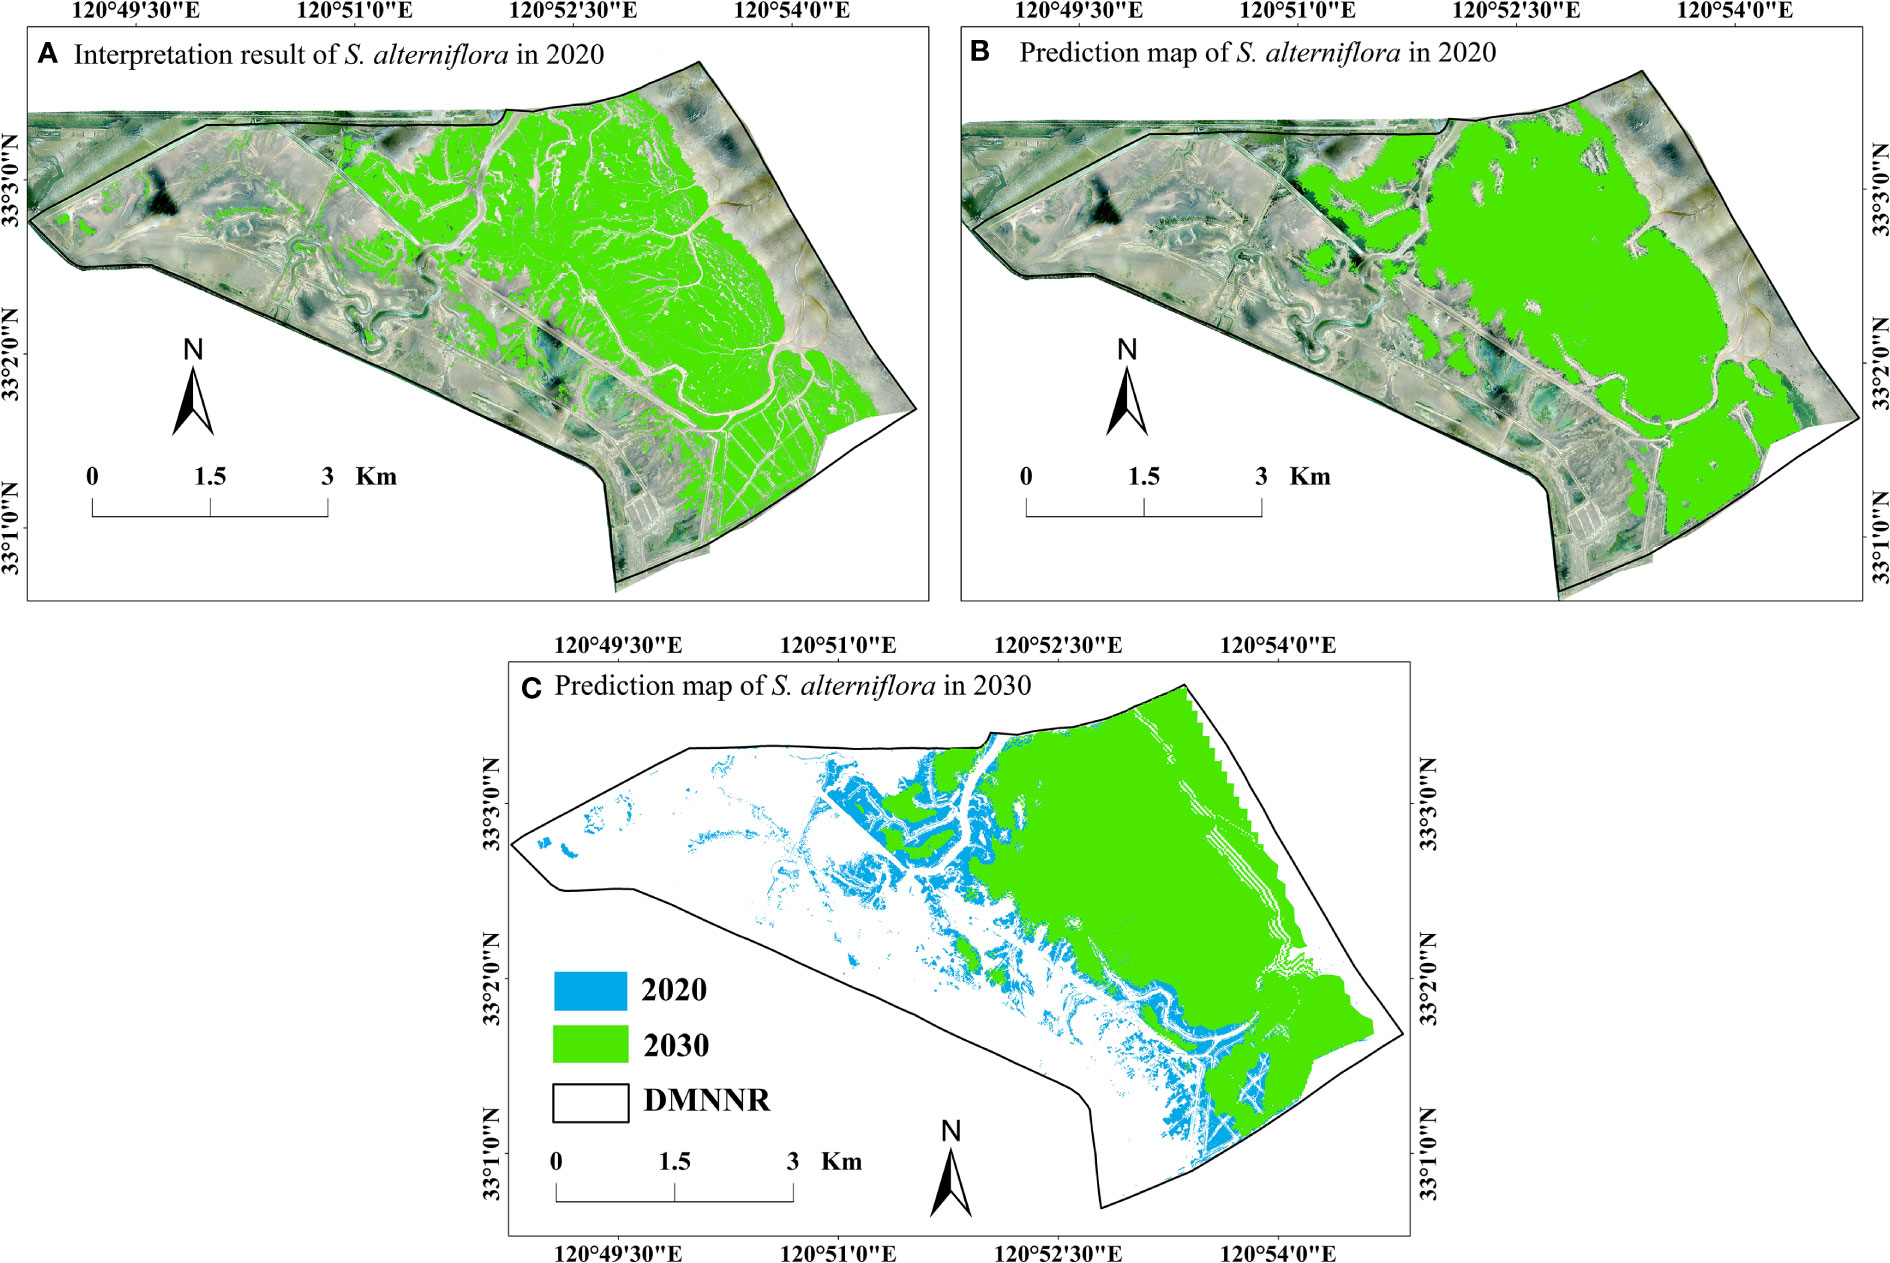
Figure 7 Comparison of the area and spatial distribution of S. alterniflora in DMNNR: (A) interpretation result of S. alterniflora in 2020; (B) prediction of S. alterniflora in 2020; (C) prediction of S. alterniflora in 3030.
First, we compared the interpretation result of S alterniflora in 2020 (Figure 7B) with the simulation and prediction map of S. alterniflora in 2020 (Figure 7A). The simulation results showed that the area of S. alterniflora changed little, with a total reduction of 5.7 ha. The spatial distribution of S. alterniflora was consistent with the interpretation result in 2020. The S. alterniflora turned into mudflats on the landward side, and the expansion of S. alterniflora to the sea was slow on the seaward side (Figure 7A). We tested the accuracy of the simulation result with a kappa coefficient by using the VALIDATE module in the IDRISI software. The kappa coefficient was obtained from statistics on the 2020 interpretation result and 2020 simulation map, which quantitatively reflected the accuracy of the model simulation. The kappa index exceeded 0.8, reflecting the high credibility of the simulation results and indicating that the MCE CA Markov model could be used to simulate the state of S. alterniflora invasion succession in a typical coastal wetland at DMNNR in the future.
The area and spatial distributions of S. alterniflora in 2030 are shown in Figure 7C. The simulation results showed that the change of S. alterniflora from 2020 to 2030 in DMNNR was consistent with the change from 2010 to 2020. The S. alterniflora area in the reserve decreased from 910.25 ha in 2020 to 881.21 ha in 2030. Compared with 2010–2020, the change of S. alterniflora from 2020 to 3030 was small. Spatial-temporal dynamics of S. alterniflora in area and distribution were clearly observed in 2030. Due to the construction of freshwater canals for wild E. davidianus, the amount of wild E. davidianus in the reserve increased, which resulted in a subsequent downward trend in S. alterniflora on the landward side. The spatial distribution of S. alterniflora has been decreasing on the landward side, and transformed into mudflats. However, S. alterniflora on the seaward side continued to expand towards the sea. S. alterniflora has invaded the mudflats of the entire study area on the seaward side. In addition, artificial ditches and E. davidianus in the northwest of the study area have had a considerable impact on S. alterniflora from 2010 to 2020. As S. alterniflora continued to expand to the sea, the impacts of artificial ditches and E. davidianus on S. alterniflora have weakened, and in the future S. alterniflora will continue to expand towards the sea (Figure 7C).
According to simulations of the spatial-temporal dynamics of S. alterniflora in the reverse during 2020–2030, the area of S. alterniflora continued to decrease from 910.25 ha in 2020 to 881.21 ha in 2030 (Figure 7). The spatial distribution of S. alterniflora has been decreasing on the landward side, while S. alterniflora has continued to expand towards the sea on the seaward side (Figure 7C). In our literature review, we did not find previous studies simulating and predicting the S. alterniflora area in DMNNR. Therefore, to date, the simulation result of S. alterniflora in our study is the only dataset showing the dynamics of S. alterniflora in DMNNR from 2020 to 2030. Several studies have reported the changing of S. alterniflora. Yan et al. (2021) found that the area occupied by S. alterniflora increased first and then decreased at DMNNR, Jiangsu, China from 1993 to 2020. The invasion exhibited a bi-directional pattern -the expansion of S. alterniflora was not only toward the seaward side but also colonized the mudflat area in the opposite direction, from 1993 to 2010. It continued to expand towards the sea on the seaward side from 2010 to 2020 (Yan et al., 2021). Li (2021) used the ANN-CA model to simulate and predict the expansion dynamics of S. alterniflora in Jiuduansha Nature Reserve. The results showed that S. alterniflora will expand further although the expansion rate will decrease, and it will mainly expand towards the sea, competing with Scirpus mariqueter (Li, 2021). Huang et al. (2008) simulated the community dynamics of S. alterniflora and Phragmites australis in Jiuduansha based on the cellular automata model. Their model predicted that S. alterniflora will continue to expand toward the sea for a long time into the future (Huang et al., 2008).The findings of these previous studies are generally consistent with the results of the present study.
The integrated MCE-CA-Markov model was used to simulate the future S. alterniflora pattern in DMNNR. First, the simulated S. alterniflora distribution pattern for 2020 was compared with the actual pattern through spatial visual comparison, and kappa coefficient was 82.63%. This indicates that factors influencing the progression of S. alterniflora from 2010 to 2020 can be used effectively to extract transition rules in order to predict the S. alterniflora pattern for 2030. There are two main factors that needed to be accounted for successfully simulate S. alterniflora in this piece of research: high-precision spatial distribution dates of S. alterniflora and suitability atlas of S. alterniflora. For this work, high spatial resolution remote sensing images can reflect the geometric structure and texture information of ground objects in more detail. Analysis of land use characteristics at high levels of precision is important to reveal the internal laws and driving mechanisms of land use change (Jiang et al., 2021; Wang and Wang, 2022). Wang and Wang (2022) undertook quantitative research on the characteristics of land use structure from 2005 to 2025, and the result showed that land use research involves different spatiotemporal scales, and different scales can only answer different ecological problems (Wang and Wang, 2022). The expansion of the S. alterniflora community is mainly affected by hydrological, climatic, soil, and topographic environmental factors, and S. alterniflora is mainly distributed in the direction parallel to the coastline (Burns, 2011; Li, 2018). Numerous studies have shown that tidal inundation and soil salinity are the key factors affecting the ecological characteristics of S. alterniflora (Burns, 2011; Moffett and Gorelick, 2016; Luan et al., 2020). Yan et al. (2022) showed that elevation and soil salinity are the main internal environmental drivers affecting the growth of S. alterniflora, and the height, biomass, flooding depth, and soil salinity all conformed to the Gaussian model. Thus, based on the optimal ecological range of elevation and soil salinity, we obtained the range of elevation and soil salinity (Yan et al., 2022). Yan et al. (2021) analyzed the spatial-temporal change of S. alterniflora in coastal wetlands during 1993–2020 based on GEE and Landsat images. The results showed that the number of elk and artificial ditches are the external factors affecting the growth of S. alterniflora (Yan et al., 2021).
To better predict S. alterniflora invasions, we selected the remote sensing images from 2010 to 2020 combined with information about the influencing factors as the basic data to simulate and predict the future expansion of S. alterniflora at DMNNR in 2030 with an MCE-CA-Markov model. As part of this analysis, there were two sources of error in predicting the future expansion of S. alterniflora. First, although the study used multi-source high-resolution remote sensing images to extract the spatial distribution of S. alterniflora with high accuracy, the long research time led to the data for S. alterniflora fluctuating greatly, which cannot fully reflect the long-term changes of S. alterniflora in the reserve. Thus, to minimize potential errors, the research period needs to be extended and the number of data nodes increased, in turn enabling a comprehensive understanding of the changes of S. alterniflora in the reserve (Yan et al., 2021). Second, the expansion of S. alterniflora is a complex process of change, which is affected by many factors. The transformation of the transient spatial pattern of S. alterniflora from vegetation colonization to expansion only took 2-3 years, and soil nutrients may be the main controlling factor (Xie et al., 2019; Yao et al., 2022b). When making the S. alterniflora suitability atlas, the present study comprehensively considered the effects of tidal inundation, soil salinity, artificial ditches, and elk-affected areas on the distribution of S. alterniflora based on previous research results. The simulation results have certain limitations, therefore nutrient availability, temperature, and benthic organisms (Deegan et al., 2012; Xie et al., 2019; Lu et al., 2020) should be included in future studies to improve the accuracy of the results. Meanwhile, our study suggest that S. alterniflora will continue to expand towards the sea in the future. Therefore, the control of S. alterniflora in coastal wetlands and the science based conservation and management of coastal wetland ecosystems must be placed on the agenda for ecological interventions
Present CA-Markov models fail to account for the influence of environmental factors and are therefore inadequate for accurately simulating the expansion of S. alterniflora marshes. This paper combined MCE with traditional CA Markov models to provide robust predictions about the spatial expansion of S. alterniflora over the next 10 years. This approach enhanced CA Markov models by integrating the influence of elevation, soil salinity, artificial ditches, and Milu influence range. The resultant accuracy of the simulated S. alterniflora expansion was 82.63%. This simulation suggests a good predictive result from the MCE-CA-Markov model. The area of S. alterniflora is predicted to continue to decrease from 910.25 ha in 2020 to 881.21 ha in 2030. The spatial distribution of S. alterniflora has been decreasing on the landward side, while S. alterniflora has continued to expand towards the sea on the seaward side. These findings suggest that S. alterniflora will continue to expand towards the sea in the future. Therefore, the control of S. alterniflora in coastal wetlands must be placed on the agenda of ecological interventions. In addition, the proposed predictions approach for spatial expansion of S. alterniflora could be used to other regions. However, for S. alterniflora potentially characterized by a differing plant structure surrounded by other types of land covers, the predictions approach used need to be tested.
The original contributions presented in the study are included in the article/supplementary material. Further inquiries can be directed to the corresponding author.
DY and ZL contributed to come up with the initial ideas and wrote the main manuscript text. JL reviewed and edited the manuscript. JL and SX prepared figures and tables and related analysis. DY discussed the results and wrote the paper. All authors made revisions and improvements to the final version. All authors contributed to the article and approved the submitted version.
The study of this paper was supported by National Natural Science Foundation of China (project no. 41871097, 41471078), and the Priority Academic Program Development of Jiangsu Higher Education Institution (PAPD), 333 High-level Talents Fostering Project of Jiangsu Province (Nos. BRA2020339).
The authors declare that the research was conducted in the absence of any commercial or financial relationships that could be construed as a potential conflict of interest.
All claims expressed in this article are solely those of the authors and do not necessarily represent those of their affiliated organizations, or those of the publisher, the editors and the reviewers. Any product that may be evaluated in this article, or claim that may be made by its manufacturer, is not guaranteed or endorsed by the publisher.
Agisoft LLC (2014). Agisoft PhotoScan user manual: Professional edition, version 1.1 (Russia: St Petersburg).
Burns T. N. D. (2011). Spartina alterniflora responses to flooding in two salt marshes on the Eastern shore of Virginia (Bachelor’s thesis. Columbia: Tulane University).
Chui W. (2015). Study and simulation of landscape pattern change of land use in chang’an district based on CA-Markov model (Xi’an: Chang’an University).
Comeaux R. S., Allison M. A., Bianchi T. S. (2012). Mangrove expansion in the gulf of Mexico with climate change: Implications for wetland health and resistance to rising sea levels. Estuarine Coast. Shelf Sci. 96, 81–95. doi: 10.1016/j.ecss.2011.10.003
Deegan L. A., Johnson D. S., Warren R. S., Peterson B. J., Fleeger J. W., Fagherazzi S., et al. (2012). Coastal eutrophication as a driver of salt marsh loss. Nat. 490, 295–388. doi: 10.1038/nature11533
Edwards K. R., Mills K. P. (2005). Aboveground and belowground productivity of spartina alterniflora (Smooth cordgrass) in natural and created Louisiana salt marshes. Estuaries 28, 252–265. doi: 10.1007/BF02732859
Ehrenfeld J. G. (2010). Ecosystem consequences of biological invasions. Annu. Rev. Ecol. Evol. Syst. 41, 59–80. doi: 10.1146/annurev-ecolsys-102209-144650
Grosholz E. D., Levin L. A., Tyler A. C., Neira C. (2009). Changes in community structure and ecosystem function following spartina alterniflora invasion of pacific estuaries (Berkley: University of California Press).
Guo J. (2019). Evolution and prediction of thermal environment pattern in nanjing based on CA-Markov model (Nanjing: Nanjing Forestry University).
Hammam A. A., Mohamed E. S. (2020). Mapping soil salinity in the East Nile delta using several methodological approaches of salinity assessment. Egypt. J. Remote. Sens. Space Sci. 23, 125–131. doi: 10.1016/j.ejrs.2018.11.002
Huang H., Zhang L., Guan Y., Wang D. (2008). A cellular automata model for population expansion of spartina alterniflora at jiuduansha shoals, shanghai, China. Estuarine Coast. Shelf Sci. 77, 47–55. doi: 10.1016/j.ecss.2007.09.003
Jiang S., Meng J., Zhu L., Cheng H. (2021). Spatial-temporal pattern of land use conflict in China and its multilevel driving mechanisms. Sci. Total Environ. 801, 149697. doi: 10.1016/j.scitotenv.2021.149697
Li W. (2018). Responses and thresholds of typical salt marsh species to flooding-salinity stress in Yangtze estuary (Shanghai: East China Normal University).
Li J. (2021). Study on population dynamics and diffusion model of invasive plant spartina alterniflora (Tangshan: North China University of Science and Technology).
Liu M. (2018a). Remote sensing analysis of spartina alterniflora in the coastal areas of China during 1990 to 2015 (Changchun: Northeast Institute of Geography and Agroecology, Chinese Academy of Sciences).
Liu M., Mao D., Wang Z., Li L., Man W., Jia M., et al. (2018b). Rapid invasion of spartina alterniflora in the coastal zone of mainland China: New observations from landsat OLI images. Remote Sens. 10, 1933–1951. doi: 10.3390/rs10121933
Luan Z., Yan D., Xue Y., Shi D., Xu D., Liu B. (2020). Research progress on the ecohydrological mechanisms of spartina alterniflora invasion in coastal wetlands. J. Agric. Resour. Environ. 37, 469–476. doi: 10.13254/j.jare.2019.0124
Lu X., Lin Y., Wu Y., Gu Y., Zhao Q., Zhang X. (2018). Spatial distribution characteristics of soil physical and chemical properties in milu national nature reserve of coastal wetland. Trans. Oceanol. Limnol. 4, 74–81. doi: 10.13984/j.cnki.cn37-1141.2018.04.010
Lu L., Shao X., Yang H., Wu M., Lou K., Hua K. (2020). Response of spartina alterniflora growth to soil chemical properties in coastal wetland of zhejiang. For. Res. 33, 177–183. doi: 10.13275/j.cnki.lykxyj.2020.05.022
Milzow C., Burg V., Kinzelbach W. (2010). Estimating future ecoregion distributions within the okavango delta wetlands based on hydrological simulations and future climate and development scenarios. J. Hydrol. 381, 89–100. doi: 10.1016/j.jhydrol.2009.11.028
Mitsova D., Shuster W., Wang X. (2011). A cellular automata model of land cover change to integrate urban growth with open space conservation. Landsc. Urban Plan. 99, 141–153. doi: 10.1016/j.landurbplan.2010.10.001
Moffett K. B., Gorelick S. M. (2016). Relating salt marsh pore water geochemistry patterns to vegetation zones and hydrologic influences. Water Resour. Res. 52, 1729–1745. doi: 10.1002/2015WR017406
Page H. M., Lastra M., Rodil I. F., Briones M., Garrido J. (2010). Effects of non-native spartina patens on plant and sediment organic matter carbon incorporation into the local invertebrate community. Biol. Invasions 12, 3825–3838. doi: 10.1007/s10530-010-9775-y
Ping Z., Zhao S., Liu C., Wang C., Liang Y. (2012). Distribution of spartina spp. along china’s coast. Ecol. Eng. 40, 160–166. doi: 10.1016/j.ecoleng.2011.12.014
Qin Y., Yan Q., Cai J. (2020). Evolution and dynamic simulation of landscape pattern in the south part of poyang lake wetland. J. Yangtze River Sci. Res. Inst. 37, 171–178. doi: 10.11988/ckyyb.20190252
Qiu Y., Lu J. (2018). Dynamic simulation of spartina alterniflora based on CA-Markov model–a case study of xiangshan bay of ningbo city, China. Aquat. Invasions 13, 299–309. doi: 10.3391/ai.2018.13.2.10
Ruishan H. U., Suocheng D. (2013). Land use dynamics and landscape patterns in shanghai, jiangsu and zhejiang. J. Resour. Ecol. 4, 141–148. doi: 10.5814/j.issn.1674-764x.2013.02.006
Sanchayeeta A., Jane S. (2012). Simulating forest cover changes of bannerghatta national park based on a CA-Markov model: A remote sensing approach. Remote Sens. 4, 3215–3243. doi: 10.3390/rs4103215
Sheng J., Yu P., Zhang H., Wang Z. (2020). Spatial variability of soil cd content based on IDW and RBF in fujiang river, mianyang, China. J. Soils Sediments. 21, 419–429. doi: 10.1007/s11368-020-02758-1
Song L. (2020). Spatiotemporal simulation of construction land and cultivated land in dianchi basin based on MCE-CA-Markov model. master’s thesis (Kunming: Yunnan Normal University).
Tiné M., Perez L., Molowny-Horas R. (2019). Hybrid spatiotemporal simulation of future changes in open wetlands: A study of the abitibi-témiscamingue region, québec, Canada. Int. J. Appl. Earth Obs. Geoinf. 74, 302–313. doi: 10.1016/j.jag.2018.10.001
Wang C. (2014). Study on spartina alterniflora marsh landscape evolution mechanism in coastal wetlands (Nanjing: Nanjing Normal University).
Wang J., Liu Z., Yu H., Li F. (2017). Mapping spartina alterniflora biomass using LiDAR and hyperspectral data. Remote Sens. 9, 589. doi: 10.3390/rs9060589
Wang Q., Wang H. (2022). An integrated approach of logistic-MCE-CA-Markov to predict the land use structure and their micro-spatial characteristics analysis in wuhan metropolitan area, central China. Environ. Sci. pollut. Res. 29, 30030–30053. doi: 10.1007/s11356-021-17750-6
Wolfram S. (1984). Universality and complexity in cellular automata. Phys. D 10, 1–35. doi: 10.1016/0167-2789(84)90245-8
Xie B., Han G.. (2018). Control of invasive spartina alterniflora: A review. J. Appl. Ecol. 29, 3464–3476. doi: 10.13287/j.1001-9332.201810.006
Xie R., Zhu Y., Li J., Liang Q. (2019). Changes in sediment nutrients following Spartina alterniflora invasion in a subtropical estuarine wetland, China. Catena 180, 16–23. doi: 10.1016/j.catena.2019.04.016
Yang X., Zheng X. Q., Chen R. (2014). A land use change model: Integrating landscape pattern indexes and Markov-CA. Ecol. Modell. 283, 1–7. doi: 10.1016/j.ecolmodel.2014.03.011
Yan D., Li J., Yao X., Luan Z. (2021). Quantifying the long-term expansion and dieback ofSpartina alterniflora using google earth engine and object-based hierarchical random forest classification. IEEE J. Sel. Top. Appl. Earth. Obs. Remote Sens. 14, 9781–9793. doi: 10.1109/JSTARS.2021.3114116
Yan D., Li J., Yao X., Luan Z. (2022). Integrating UAV data for assessing the ecological response of spartina alterniflora towards inundation and salinity gradients in coastal wetland. Sci. Total Environ. 814, 152631. doi: 10.1016/j.scitotenv.2021.152631
Yao S., Chen C., Chen Q., Zhang J., Li Y., Zeng Y. (2022a). An integrated hydrodynamic and multicriteria evaluation cellular automata–Markov model to assess the effects of a water resource project on waterbird habitat in wetlands. J. Hydrol. 607, 127561. doi: 10.1016/j.jhydrol.2022.127561
Yao X., Yan D., Li J., Liu Y., Sheng Y., Xie S., et al. (2022b). Spatial distribution of soil organic carbon and total nitrogen in a ramsar wetland, dafeng milu national nature reserve. Water 14, 197. doi: 10.3390/w14020197
Zhang X., Li P., Li P., Xu X. (2005). Present conditions and prospects of study on coastal wetlands in china. Adv. Mar. Sci. 23, 87–95. doi: 10.3969/j.issn.1671-6647.2005.01.013
Zhang S., Liu Y., Liu Y., Shao D., Sun L., Zheng S. (2021). Cellular automata simulation of population expansion dynamics of spartina alterniflora in the yellow river delta. J. Beijing Norm. Univ. Nat. Sci. 57, 121–127. doi: 10.12202/j.0476-0301.2020428
Zhao W., Cao T., Li Z., Sheng J. (2019). Comparison of IDW, cokriging and ARMA for predicting spatiotemporal variability of soil salinity in a gravel-sand mulched jujube orchard. Environ. Monit. Assess. 191, 371–376. doi: 10.1007/s10661-019-7499-8
Zheng Z., Tian B., Zhang L. W., Zou G. (2015). Simulating the range expansion of spartina alterniflora in ecological engineering through constrained cellular automata model and GIS. Math. Probl. Eng. 2015, 1–8. doi: 10.1155/2015/875817
Zhou Z., Yang Y., Chen B. (2017). Estimating the spartina alterniflora fractional vegetation cover using high spatial resolution remote sensing in a coastal wetland. Acta Ecol. Sin. 37, 505–512. doi: 10.5846/stxb201507271566
Keywords: Spartina alterniflora, suitability maps, MCE-CA-Markov, forecast spatial and temporal, Dafeng Milu National Nature Reserve
Citation: Yan D, Li J, Xie S, Liu Y, Sheng Y and Luan Z (2022) Examining the expansion of Spartina alterniflora in coastal wetlands using an MCE-CA-Markov model. Front. Mar. Sci. 9:964172. doi: 10.3389/fmars.2022.964172
Received: 08 June 2022; Accepted: 29 June 2022;
Published: 15 July 2022.
Edited by:
Junhong Bai, Beijing Normal University, ChinaReviewed by:
Zhaoning Gong, Capital Normal University, ChinaCopyright © 2022 Yan, Li, Xie, Liu, Sheng and Luan. This is an open-access article distributed under the terms of the Creative Commons Attribution License (CC BY). The use, distribution or reproduction in other forums is permitted, provided the original author(s) and the copyright owner(s) are credited and that the original publication in this journal is cited, in accordance with accepted academic practice. No use, distribution or reproduction is permitted which does not comply with these terms.
*Correspondence: Zhaoqing Luan, bHVhbnpoYW9xaW5nQG5qZnUuZWR1LmNu
Disclaimer: All claims expressed in this article are solely those of the authors and do not necessarily represent those of their affiliated organizations, or those of the publisher, the editors and the reviewers. Any product that may be evaluated in this article or claim that may be made by its manufacturer is not guaranteed or endorsed by the publisher.
Research integrity at Frontiers
Learn more about the work of our research integrity team to safeguard the quality of each article we publish.