 Sarah Brown-Vuillemin
 Denis Chabot
 Claude Nozères
 Réjean Tremblay
 Pascal Sirois3
95% of researchers rate our articles as excellent or good
Learn more about the work of our research integrity team to safeguard the quality of each article we publish.
Find out more
ORIGINAL RESEARCH article
Front. Mar. Sci. , 05 August 2022
Sec. Marine Fisheries, Aquaculture and Living Resources
Volume 9 - 2022 | https://doi.org/10.3389/fmars.2022.963039
Redfish (Sebastes mentella and S. fasciatus) are back at spectacular record high levels in the Gulf of St. Lawrence (GSL) and the effects of this massive resurgence on other components of the food web remain largely unknown. To better understand the trophic implications of the surging redfish biomass within the GSL ecosystem, 3,690 stomachs containing food were collected during two periods: one characterised by low redfish abundance (1993–1999) and the other during a period of record abundance (2015–2019). Taxonomical analysis of stomach contents from individuals of different sizes from three subareas of the GSL was carried out to determine diet composition during both periods. Zooplankton represented the main prey category for small redfish (< 20 cm), which was driven by a predation on amphipods, mostly Themisto sp. in North-East Gulf, in the 1990s and on copepods of the genus Calanus in the deep channels and euphausiids in North-West Gulf in the 2010s. Themisto sp. still dominated the diet of medium (20–30 cm) redfish in the 1990s while the copepods were predominant during the 2010s. Shrimp consumption increased with redfish size and two species were particularly important in large redfish diet (≥ 30 cm) during both periods: pink glass shrimp (Pasiphaea multidentata), mostly in the Laurentian Channel and northern shrimp (Pandalus borealis), especially in North-East Gulf. Redfish predation on shrimp represents a major concern for the dynamics of the northern shrimp which supports a valuable fishery in the GSL but has been declining in abundance since several years. Piscivory was observed in large redfish diet, with capelin (Mallotus villosus) being the major fish prey in the 1990s and redfish (cannibalism) in the 2010s, suggesting density-dependent control at high density of small redfish. By presenting a detailed overview into the redfish diet composition and its temporal variability, the present study offers a first look into the possible future trophic impacts of a resurging groundfish in the GSL ecosystem.
Knowledge of feeding ecology and prey-predator interactions is essential to apprise the respective roles of the mosaic of species that compose ecological communities (Arditi and Ginzburg, 2012). Information on trophic linkages, which have often been recognized as being ecosystem-specific, is essential for the robust implementation of ecosystem-based management strategies (Hanson and Chouinard, 2002; Crowder and Norse, 2008; Glaser et al., 2015). Stomach content analysis is a well-established method for the detailed assessment of individual diet composition. At the population level, stomach content data enable the determination of the contribution of the different prey species to the diet and how diet composition varies according to factors such as abundance, ontogeny or predator size (e.g., Hyslop, 1980; Baker et al., 2014; Amundsen and Sánchez‐Hernández, 2019; Sánchez-Hernández et al., 2019). Stomach content data are particularly relevant to assess fish trophodynamics because fish generally swallow their prey whole, allowing for robust inferences on biological traits such as feeding mode, as well as ecological characteristics such as habitat preference (Braga et al., 2012; Amundsen and Sánchez‐Hernández, 2019). Annual fishery-independent surveys offer the opportunity to collect stomachs from a wide size range and over the large part distribution of a species population. Moreover, long time series of stomach content data collected during yearly surveys can reveal major trophic changes in the ecosystem over time (e.g., Fahrig et al., 1993; Hanson and Chouinard, 2002; Dwyer et al., 2010).
Over the past three decades, the Gulf of St. Lawrence (GSL, Canada) ecosystem has undergone profound changes in species composition. In the early 1990s, several groundfish species, such as Atlantic cod (Gadus morhua Linnaeus 1758), American plaice (Hippoglossoides platessoides Fabricius 1780) and redfish (Sebastes sp. Cuvier 1829), collapsed as a result of overfishing during a period of low productivity and recruitment associated with exceptionally cold water temperatures (Murawski, 1997; Brêthes, 1998; Gascon, 2003), resulting in the implementation of fishing moratoria. Meanwhile, the abundance of boreal species such as northern shrimp (Pandalus borealis Krøyer 1838), snow crab (Chionoecetes opilio Fabricius 1788) and Greenland halibut (Reinhardtius hippoglossoides Walbaum 1792) increased to record high levels driven by cooling waters and reduced competition and predation pressure (Brêthes, 1998; Savenkoff et al., 2006). After a relative stability over two decades, the deep waters of the GSL warmed during the 2010s, resulting in a decline of dominant cold water species and the concurrent, unprecedented recruitment of the redfish, spelling a massive return of this fish in the GSL (Bourdages et al., 2017; Brassard et al., 2017; Galbraith et al., 2019). In the GSL, two sympatric redfish species coexist: the Acadian redfish Sebastes fasciatus (Storer 1854) and the deepwater redfish Sebastes mentella (Travin 1951) (Senay et al., 2019). These species are morphologically similar, which makes species identification difficult and nearly impossible by cursory examination (e.g., Gascon, 2003; Cadrin et al., 2010). As a result, S. mentella and S. fasciatus from the GSL have traditionally been managed as a single stock and have not been identified to species in historical databases. In the present study, the two species have thus not been discriminated and are both comprised under the name ‘redfish’.
In recent years, the annual research bottom trawl survey of the estuary and northern GSL, carried out by the Department of Fisheries and Oceans (DFO, Canada), revealed that redfish had become by far the most common taxon in the captures, accounting for 90% of the total biomass caught in 2019, compared to 15% in 1995–2012 (Senay et al., 2021). This represented a 72% redfish biomass increase from the 2017 estimate. The most recent redfish assessment report estimated an average minimum trawlable biomass of 113 kt in 1993–1999 and 2,423 kt in 2015–2019 (Senay et al., 2021). In 2019, total minimum trawlable biomass was estimated to be 4,365 kt, the highest value ever observed in the time series since 1984 (Senay et al., 2021). Redfish exploitation is still under moratorium, but this unprecedented increase in abundance, supported by the 2011–2013 cohorts, is expected leading to a rapid increase of spawning biomass, which will support a commercial fishery in the coming years. This increase in biomass also represents a major concern for the dynamics of forage species, including the northern shrimp, which supports a major fishery in the GSL (DFO, 2020). The growing redfish cohorts could exacerbate the ongoing regime shift within the GSL, but their potential impact on other components of the food web remains largely speculative as knowledge of redfish trophic ecology is scarce.
The objective of this study is to describe and quantify the GSL redfish diet composition over two time periods of contrasting population dynamics (the 1990s, collapse and the 2010s, resurgence) to provide an overall assessment of the potential changes and discuss possible implications of redfish predation within the GSL food web. For the entire 1990–2019 period, redfish were caught relying on the same methodology through an annual Research Vessel (RV) bottom trawl survey (Bourdages et al., 2007; Senay et al., 2019). Redfish stomachs were collected during two periods, 1993 to 1999 and 2015 to 2019, thus offering a unique opportunity to evaluate redfish feeding and assess decadal changes in feeding habits and prey preferences. Considering the shifting oceanographic and ecological characteristics of the GSL from a cold-water ecosystem during the 1990s to a warmer water ecosystem in the 2010s, combined with the contrast in redfish abundance between these two periods, marked decadal differences are expected in the redfish diet composition. By offering a unique glimpse into the temporal variability that exists in the diet composition of a dominant groundfish resource through ontogeny and across subareas of the GSL, the present study also provides insight into the implication of the surging redfish predation pressure on the northern shrimp.
The GSL is a stratified, semi-enclosed sea connected to the North Atlantic Ocean through the Cabot Strait to the southeast and the Strait of Belle-Isle to the northeast. Redfish were captured during annual summer trawl research surveys conducted by DFO using a stratified-random survey design covering the estuary and northern GSL (Figure 1). From 1990 to 2005, the survey was conducted onboard the Canadian Coast Guard Ship (CCGS) Alfred Needler using a URI trawl with a 19-mm liner in the cod-end (24-min tows). Since 2004, the survey has been conducted with the CCGS Teleost equipped with a Campelen 1800 trawl with a 13-mm liner (15-min tows). Based on comparative fishing experiments held in 2004 and 2005, data for most species, including redfish, were corrected for differences in catchability between the two periods. Details of bottom trawl surveys, sampling, protocol and conversion factors between the two trawl types can be found in Bourdages et al. (2007).
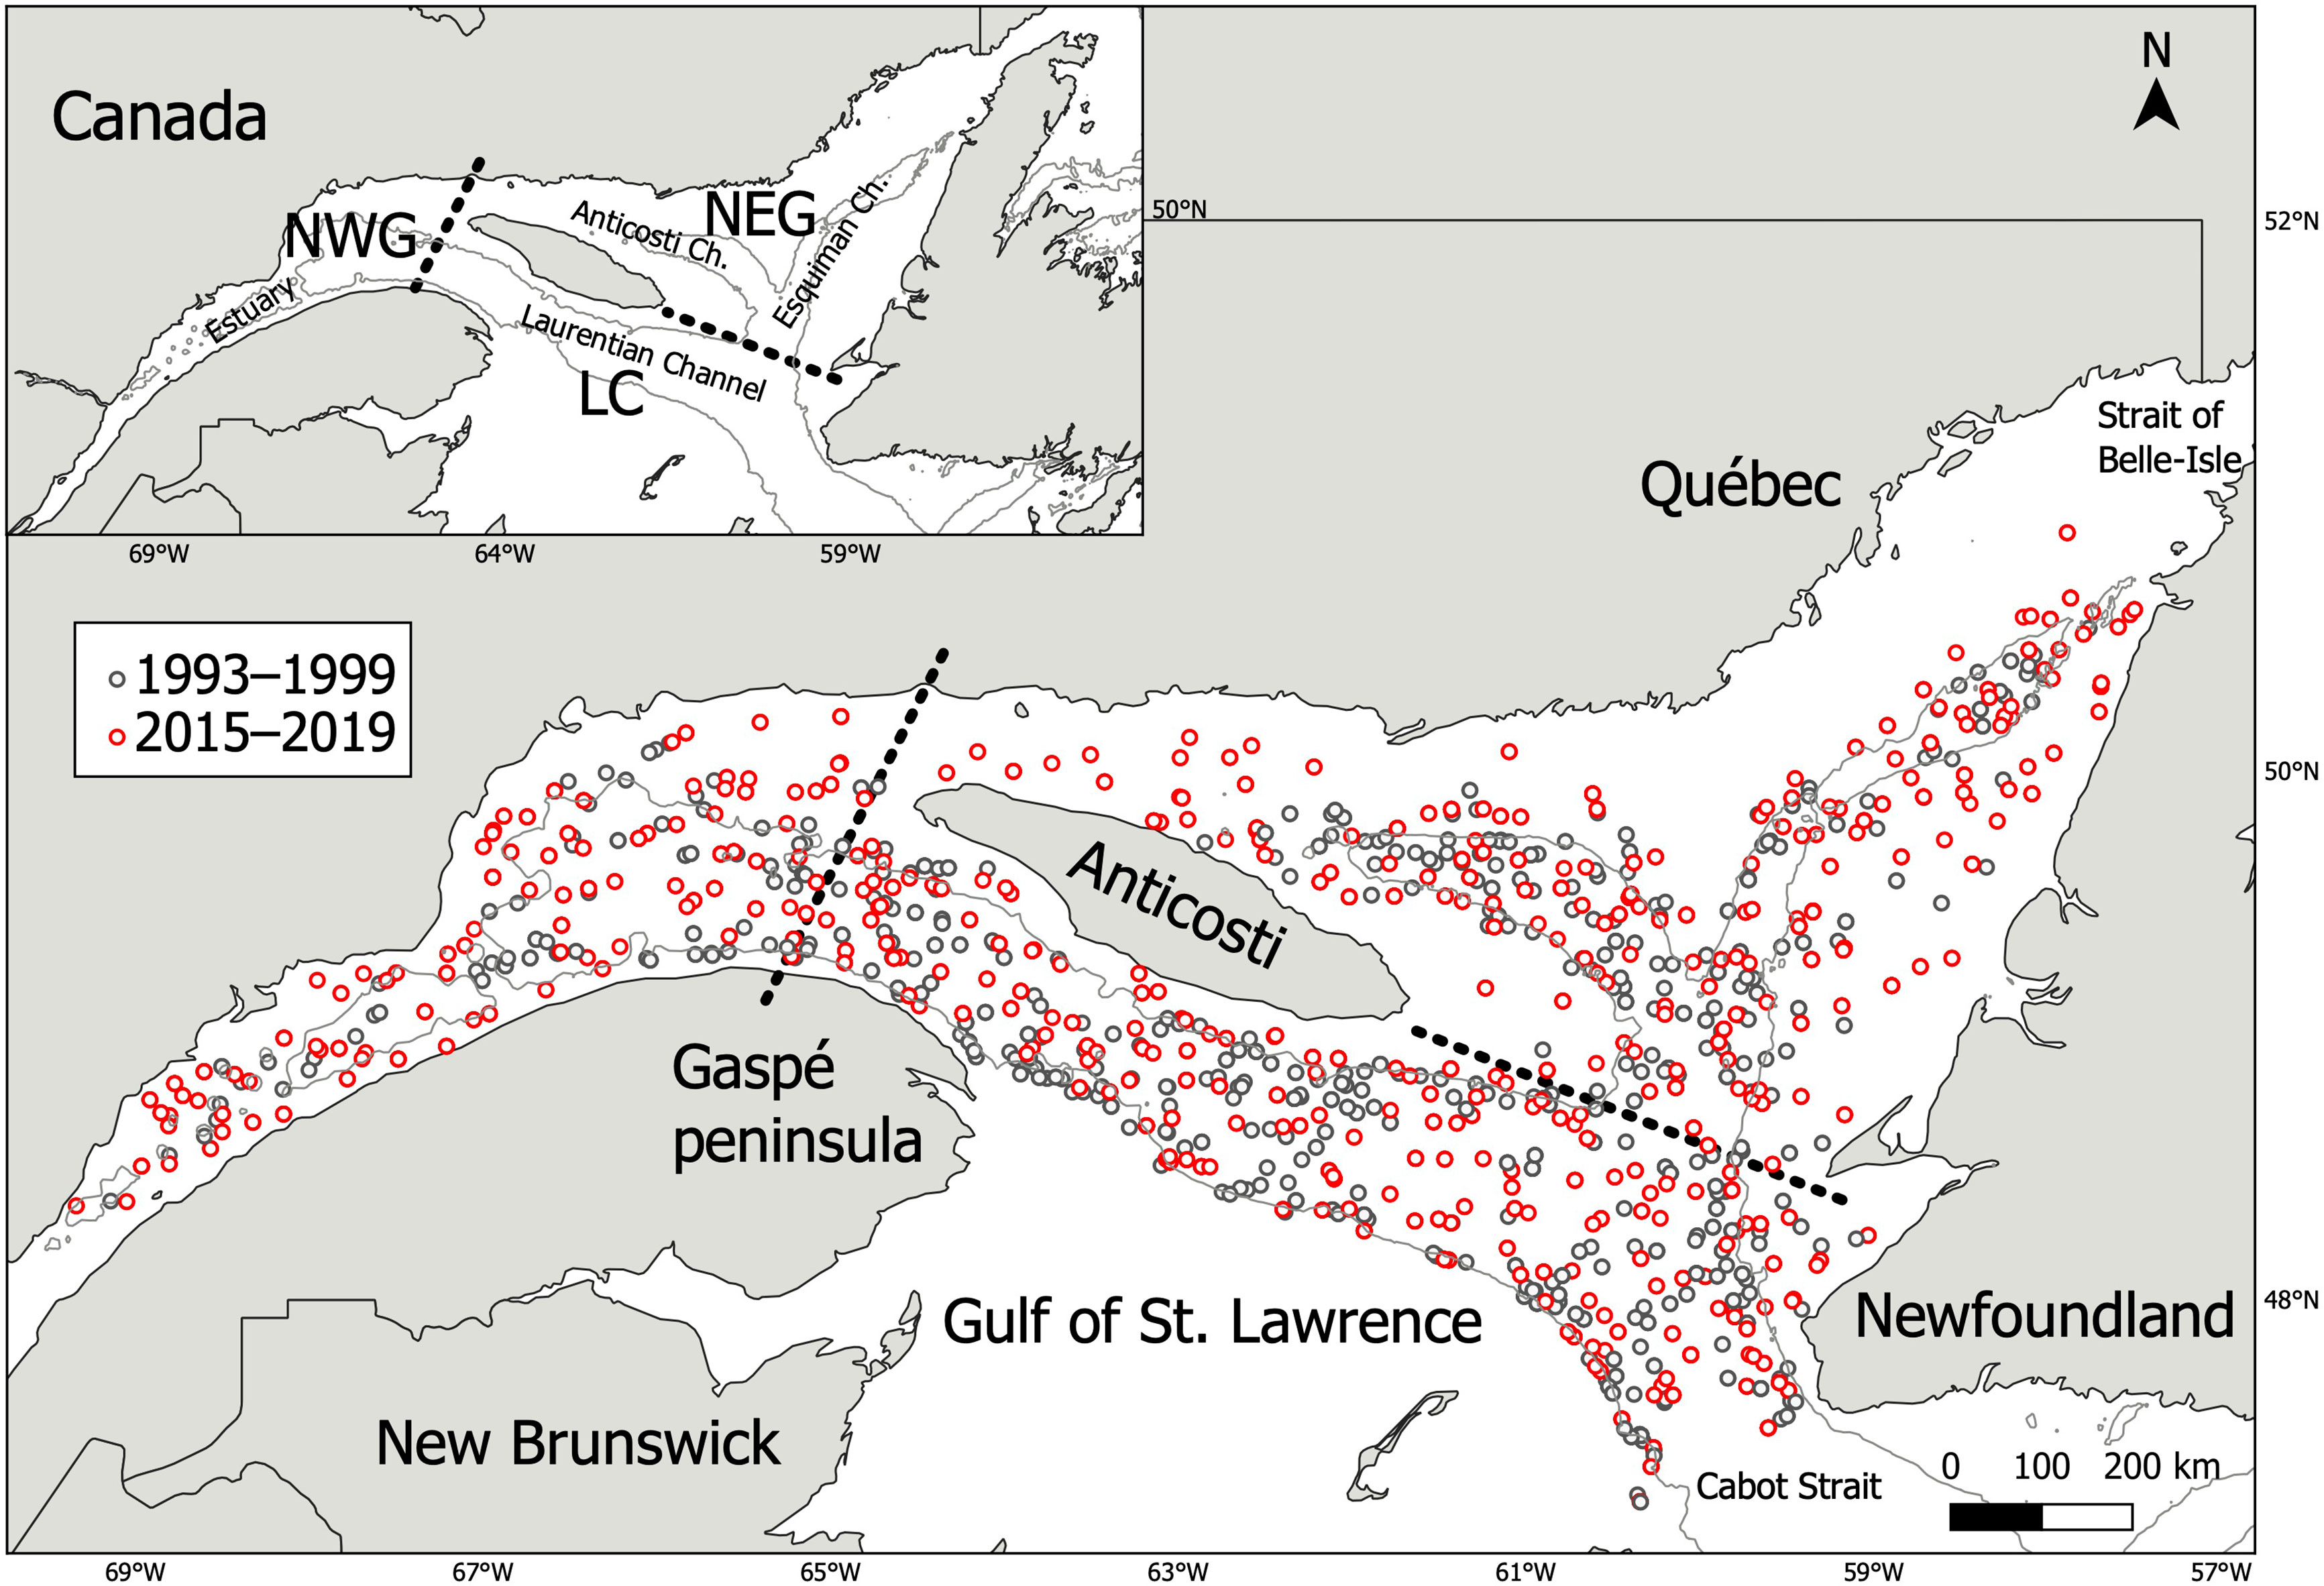
Figure 1 Map of the study area showing sampling hauls (1993–1999; n = 450 and 2015–2019; n = 447) where redfish stomachs containing prey were sampled (n = 3,690) from each period (1993–1999; n = 1,366 and 2015–2019; n = 2,324). The grey line indicates the 250 meters isobath. The three subareas considered for the analysis are delimited by the dotted lines with North-West Gulf (NWG), Laurentian Channel (LC) and North-East Gulf (NEG).
The annual surveys were similar among years, taking place from August into early September, thus avoiding seasonal effects in the estimation of redfish abundance and their diet in each of the two time periods. At each haul (exceptions were 2015, when redfish stomachs were sampled only on hauls with even numbers, and in 2016, when they were sampled only on hauls with odd numbers), the biomass of redfish captured by the trawl was estimated. A sub-sample of redfish was measured (fork length, FL, in cm in the 1990s, in mm converted to cm in the 2010s) and weighed (g). This sub-sample also allowed the estimation of the number of fish of each 1 cm length class in the catch. From these, a length-stratified sub-sample was chosen for stomach collection and redfish that showed obvious signs of regurgitation were rejected, a common consequence of barotrauma for these fish, or feeding within the trawl. Smaller specimens (FL < 15 cm) were collected whole to optimize sample collection at sea, while the stomachs of larger specimens, quicker to dissect, were excised at sea. Each sample was placed in a plastic bag with an identification label and kept frozen (-40°C) until examination.
In the laboratory, each stomach was opened to remove and weigh its content. All prey present in the stomach were sorted, weighted, and identified to the most precise taxonomic level possible with a binocular microscope and using keys, identification guides (e.g., Squires, 1990; Campana, 2004; Vassilenko and Petryashov, 2009; ICES, 2014) and the help of specialists. A number of different personnel carried out the analyses over the years but always followed the same protocol in recognizing common GSL fish and invertebrate species. It was however noted that less effort was dedicated in the 1990s than in the 2010s at identifying heavily digested prey. Stomachs from the 1990s were usually analysed within a few years of capture whereas those from the 2010s were analysed within a few months of capture. Frozen samples dating from 1997 to 1999 were still available to be analysed in 2019 to increase sample size of the 1990s and assess the impact of methodology (difference in effort for taxonomical resolution of very digested prey) on the results (Supplementary Figure 1).
Redfish are physoclist fish that have a closed swim bladder and therefore cannot adapt to rapid changes in depth. As a result, redfish are extremely sensitive to barotrauma when caught in deep water and brought to the surface rapidly (Jarvis and Lowe, 2008). Although redfish showing signs of regurgitation (food in their mouth or evaginated stomach) were discarded during sea sampling, decompression likely resulted in partial or total regurgitation in several sampled fish. Thus, the proportion of empty stomachs, a common measure of feeding intensity, was deemed unreliable for redfish. For this reason, empty stomachs were excluded from the analyses. Furthermore, it was necessary to assume that the probability of regurgitation was similar for all taxa when assessing the importance of different prey taxa or categories in redfish diet, a reasonable assumption considering the barotraumatic cause of regurgitation.
For both periods, redfish diet composition was analysed as a function of redfish size using 5 cm size classes, a uniform cut-off to visualize general trends as follows: < 10.0 cm, 10.0–14.9 cm, 15.0–19.9 cm, 20.0–24.9 cm, 25.0–29.9 cm, 30.0–34.9 cm, 35.0–39.9 cm and ≥ 40.0 cm. Since the GSL is physically and topographically heterogeneous (Koutitonsky and Bugden, 1991; Therriault, 1991; Rodrigues et al., 1993; Galbraith et al., 2019), three distinct subareas were distinguished and compared in this study: (1) the deepest part of the Laurentian Channel (LC) which extends from Cabot Strait to the centre of the Gulf and can reach a maximum water depth of about 550 m, (2) the North-East Gulf (NEG) including the Esquiman (maximum depth of about 285 m) and Anticosti (maximum depth of about 335 m) Channels and (3) and the North-West Gulf (NWG) comprising the estuary and the western part of the Laurentian Channel (maximum depth about 300 m) (Figure 1). In order to describe redfish diet during both periods in each subarea within the GSL and maintain sufficient sample sizes, it was necessary to regroup the 5-cm size classes into three major size classes (small < 20, medium 20–30 and large redfish ≥ 30 cm) (Table 1).
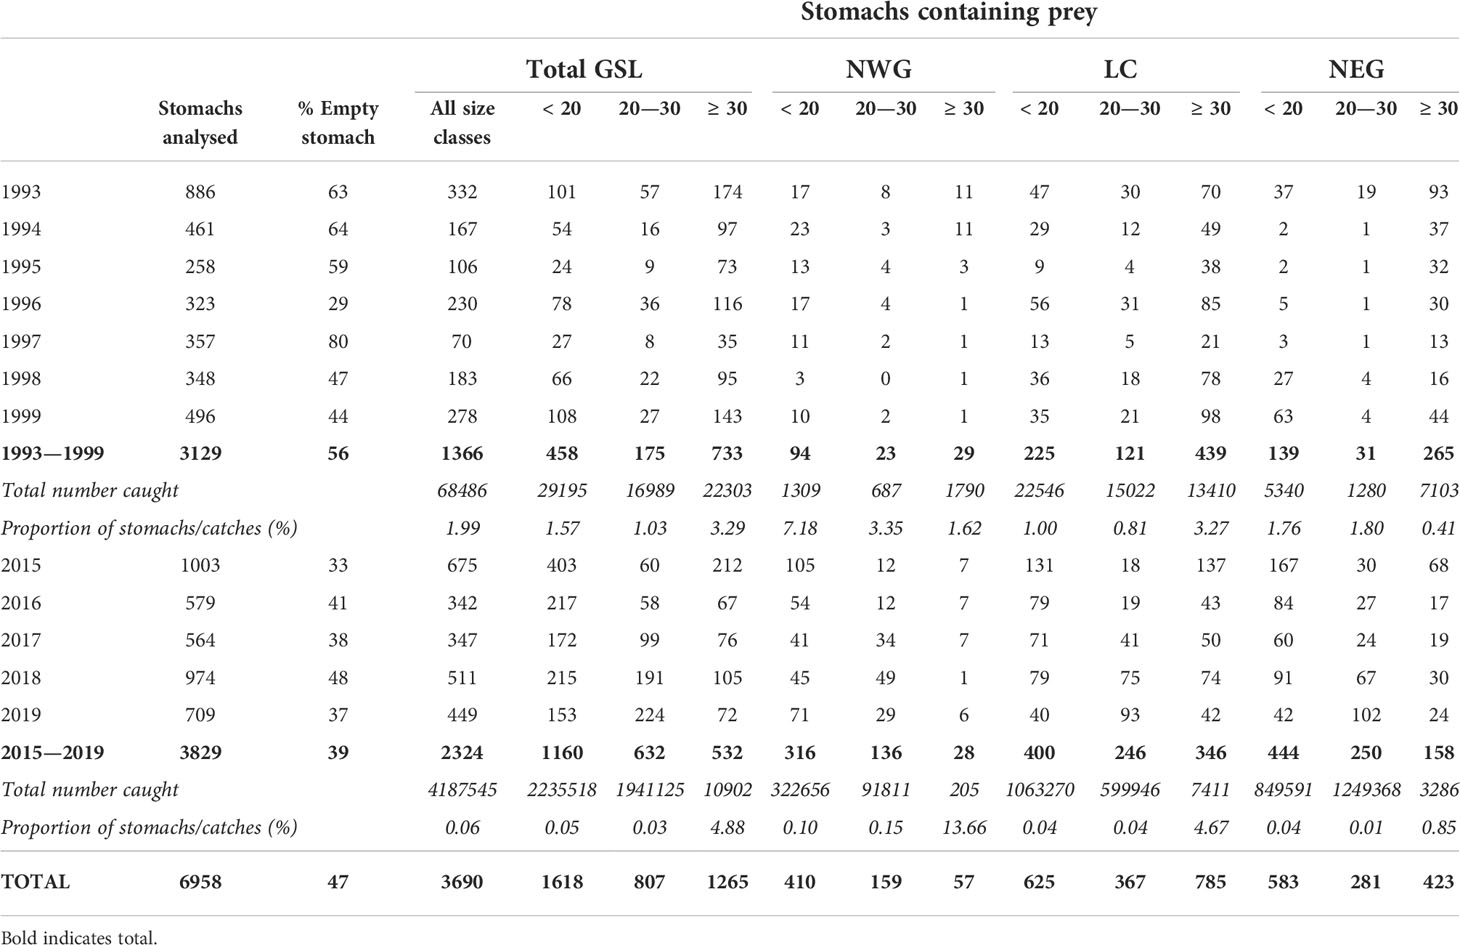
Table 1 Number of redfish stomachs analysed, percentage of empty stomachs, number of non-empty stomachs, total number in the catch and percent of stomachs of redfish caught in the GSL during annual DFO trawl research surveys according to subareas and three size classes for the periods 1993–1999 and 2015–2019.
Developing reliable indices of diet composition over different time periods based on stomach content analysis requires the consideration of several key issues. While stomach contents reveal information about one or a few recent meals when a fish was sampled, it is only a snapshot of an individual’s feeding habits, which needs to be considered when deriving indices that are representative of the predator’s diet. Stomach content data can be used to derive several types of diet indicators (Hyslop, 1980). Basic indicators include methods based on prey numbers, prey mass or volume, and frequency of occurrence. Composite indices (e.g., Index of Relative Importance, IRI) have also been developed to integrate two or more of the basic indicators. In a modelling experiment, Ahlbeck et al. (2012) clearly demonstrated that basic indicators based on prey mass or volume provide the best estimates of diet for a wide array of feeding strategies, while composite indices were less robust. Further, the basic currency to describe the contribution of different prey to the diet of a predator is energy, which is directly related to mass and energy density of prey.
In the present study, three measures were used to describe the redfish diet. First, the partial stomach fullness index (PFI) (Lilly and Fleming, 1981; Orr and Bowering, 1997) was calculated for each prey taxa in the redfish stomach according to the equation:
where Mij is the mass of prey i in redfish j, Lj is the FL (cm) of redfish j and b is the specific allometric exponent calculated for redfish (b = 3.19), corresponding to the slope of the linear relationship of log(mass) and log(FL) of redfish collected for this study during the 1993–1999 and 2015–2019 surveys (n = 6958; r2 = 0.99, P < 0.001). The PFI adjusts the amount of each prey taxon found in a stomach for the effect of predator size. The mean PFI of prey i in the sample (period, size class and/or subarea) was then obtained as follows:
where N is the number of redfish in the sample. Second, in order to assess the proportion of the contribution of prey in the diet of redfish, PFIi was transformed into a percentage (%FIi, percentage fullness index, Bernier and Chabot, 2012) and calculated as:
where total stomach fullness index (TFIj) was the sum of all PFIi for a fish j.
TFI was calculated as:
where I represents the number of different prey taxa found in the sample. Third, to qualitatively indicate whether a small or large proportion of redfish fed on a given prey, the percentage of occurrence (%O) of prey i was also calculated (Hyslop, 1980) as follows:
where Ni is the number of stomachs in the sample containing prey i.
To gain further insight on the importance of each prey category in the diet of redfish, we used Amundsen diagrams, a modification of Costello’s graphical method (Costello, 1990; Amundsen et al., 1996) which is a two-dimensional representation of prey-specific abundance in stomach fullness index (%FIspe) and percentage of occurrence (%O). Prey-specific abundance is defined as the percentage of a specific prey over all prey items, but only for those predators in which that prey occurs. Thus, prey-specific abundance in stomach fullness index for prey category i, %FIspe_i, was obtained exactly as %FIi (Eq. 3), but instead of using all N stomachs in a sample, using only the K stomachs containing prey category i:
where PFIspe_i is the average fullness index for prey i for the stomachs containing prey i, and TFIspe_i is the average total fullness index for the stomachs containing prey i. Prey categories scoring 25–50% in prey-specific abundance and ≥ 25%O were considered important, those with ≥ 50% in prey-specific abundance and 25–50%O were very important, and prey categories with ≥ 50% on both axes were considered dominant. Prey with high prey-specific abundance (≥ 50%) and just short of 25%O were considered « noteworthy ».
A particular consideration must be made with samples collected in RV surveys such as those considered in the present study. Typically, research survey protocols request a fixed number of stomachs to be taken in each haul where the predator is present, usually stratified in a number of predator size classes. As long as there are enough fish of the target species to fill the stratification, the number of stomachs becomes independent of the number of fish in the catch. In the present study, the number of non-empty stomachs sampled per haul ranged between 1 and 44. However, the abundance of redfish varied widely among hauls, in particular during the recent period of population recovery where total estimated numbers caught varied between 1 and 250,047 (1 and 10,745 for the 1990s). The subsampling design, combined to the difference of up to 5 orders of magnitude in redfish abundance among hauls, implies the risk of widely overrepresenting the diet of fish captured in subareas of relatively low abundance relative to those from the heart of the distribution. To account for this issue, we followed the recommendations of Chipps and Garvey (2006) and weighted the stratified diet data by the relative proportion of individuals actually caught within each size class at a given haul. Capture data and the subsample of redfish measured in each haul were used to estimate the number of redfish of each 1-cm length class in the catch. Mass of each stomach of length class 1 was then estimated according to the number of fish of length class 1 in the catch divided by the number of stomachs of that same class. Only weighted results are shown. Description of the prey taxon contributions to diet, before weighting for abundance in the catches, is provided in Supplementary Table 1 for the two periods.
Cumulative prey curves (Ferry and Cailliet, 1996) were calculated to assess whether the number of redfish samples was sufficient to describe the diet. Prey curves were generated after 100 randomizations of the original data (%FI) calculated according to the number of prey categories considered in further analyses. The slope of the linear regression (b) through the last five subsamples validated the sample size, where b ≤ 0.05 signified acceptable levelling off of the prey curve for diet analyses (Brown et al., 2012).
Differences in percentage fullness index (%FI) between (1) the two periods according to redfish size (< 20, 20–30 and ≥ 30 cm) and (2) among sizes classes over periods and GSL subareas (NWG, LC and NEG) were investigated. A nonparametric distanced-based permutation multivariate analysis of variance was conducted on the Bray-Curtis distance matrix (PERMANOVA, Anderson, 2014), calculated on average stomach contents per haul expressed as %FI: stomachs from the same major size class were averaged for each haul because they cannot be considered independent. Following significant test results (PERMANOVA), post hoc tests using pairwise multiple comparisons were used to identify differences between means. Similarity percentage analysis (SIMPER, Clarke, 1993) was used to identify the prey explaining most of the dissimilarities between factors. All analyses were performed with the software R version 4.0.1 (R Core Team, 2020) using packages ‘vegan’ (Oksanen et al., 2019), ‘plyr’ (Wickham, 2011), ‘ggplot2’ (Wickham, 2016) and ‘ggpubr’ (Kassambara, 2020).
A total of 6,958 stomachs were collected throughout the GSL and examined, of which 3,690 contained prey (47% of empty stomach), from a total of 897 hauls, with 1,366 and 2,324 stomachs for 1993–1999 and 2015–2019, respectively (Figure 1, Table 1). In 2015–2019, the number of redfish in the catch was 61 times higher, for the entire GSL, than during 1993–1999, and captures of small and medium redfish (< 20 and 20–30 cm) were 77 and 114 times higher, respectively, in the recent period, reflecting the strong recruitment of the 2011–2013 cohorts. The total number of large individuals ≥ 30 cm captured was approximately equal during both periods and a similar sampling intensity was obtained (3.29 and 4.88% of captured fish were sampled). Sampling intensity was similar (1.57 and 1.03% of captured fish) for small and mid-size fish in the 1990s. Despite a larger number of stomachs collected for these same size classes in the 2010s, sampling intensity was much less (0.05 and 0.03% of captured fish) due to the surging abundance of small and mid-sized individuals in recent years relative to the 1990s (Table 1). Even if the proportion of individuals sampled for stomach contents was small for some groups, most cumulative prey curves calculated for both periods according to three major size classes and subareas reached a stable asymptote, indicating sufficient sample sizes for an accurate description of the redfish diet (Supplementary Figures 2, 3). The only exceptions where an asymptote was not reached was for large redfish (≥ 30 cm) in NWG for both periods, as well as for mid-sized redfish (20–30 cm) in NEG in the 1990s (Supplementary Figure 3).
The range of redfish sizes for stomach collection was 7–50 cm in both periods (Figure 2), median (25th and 75th percentiles) FL was 31 (17 and 37) cm in the 1990s and 20 (16 and 28) cm in the 2010s. Size classes with largest sample sizes for stomachs were 35–38 and 17–20 cm in the 1990s and 2010s, respectively. For both periods, the NWG was characterised by a scarcity of large individuals sampled compared to other subareas, both in the number of stomachs and in the catch (Figure 2, Table 1). Most of redfish samples were collected from the deep channels (Laurentian, Esquiman and Anticosti, Figure 1, Table 1) of the GSL. In the 1990s, median depth (25th and 75th percentiles) where the stomachs with prey were obtained was 299 (255 and 315) m, 318 (256 and 382) m and 271 (248 and 288) m for the NWG, LC and NEG, respectively, and in the 2010s, median depth was 250 (181 and 316) m, 329 (245 and 391) m and 228 (177 and 276) m, for the three subareas, respectively.
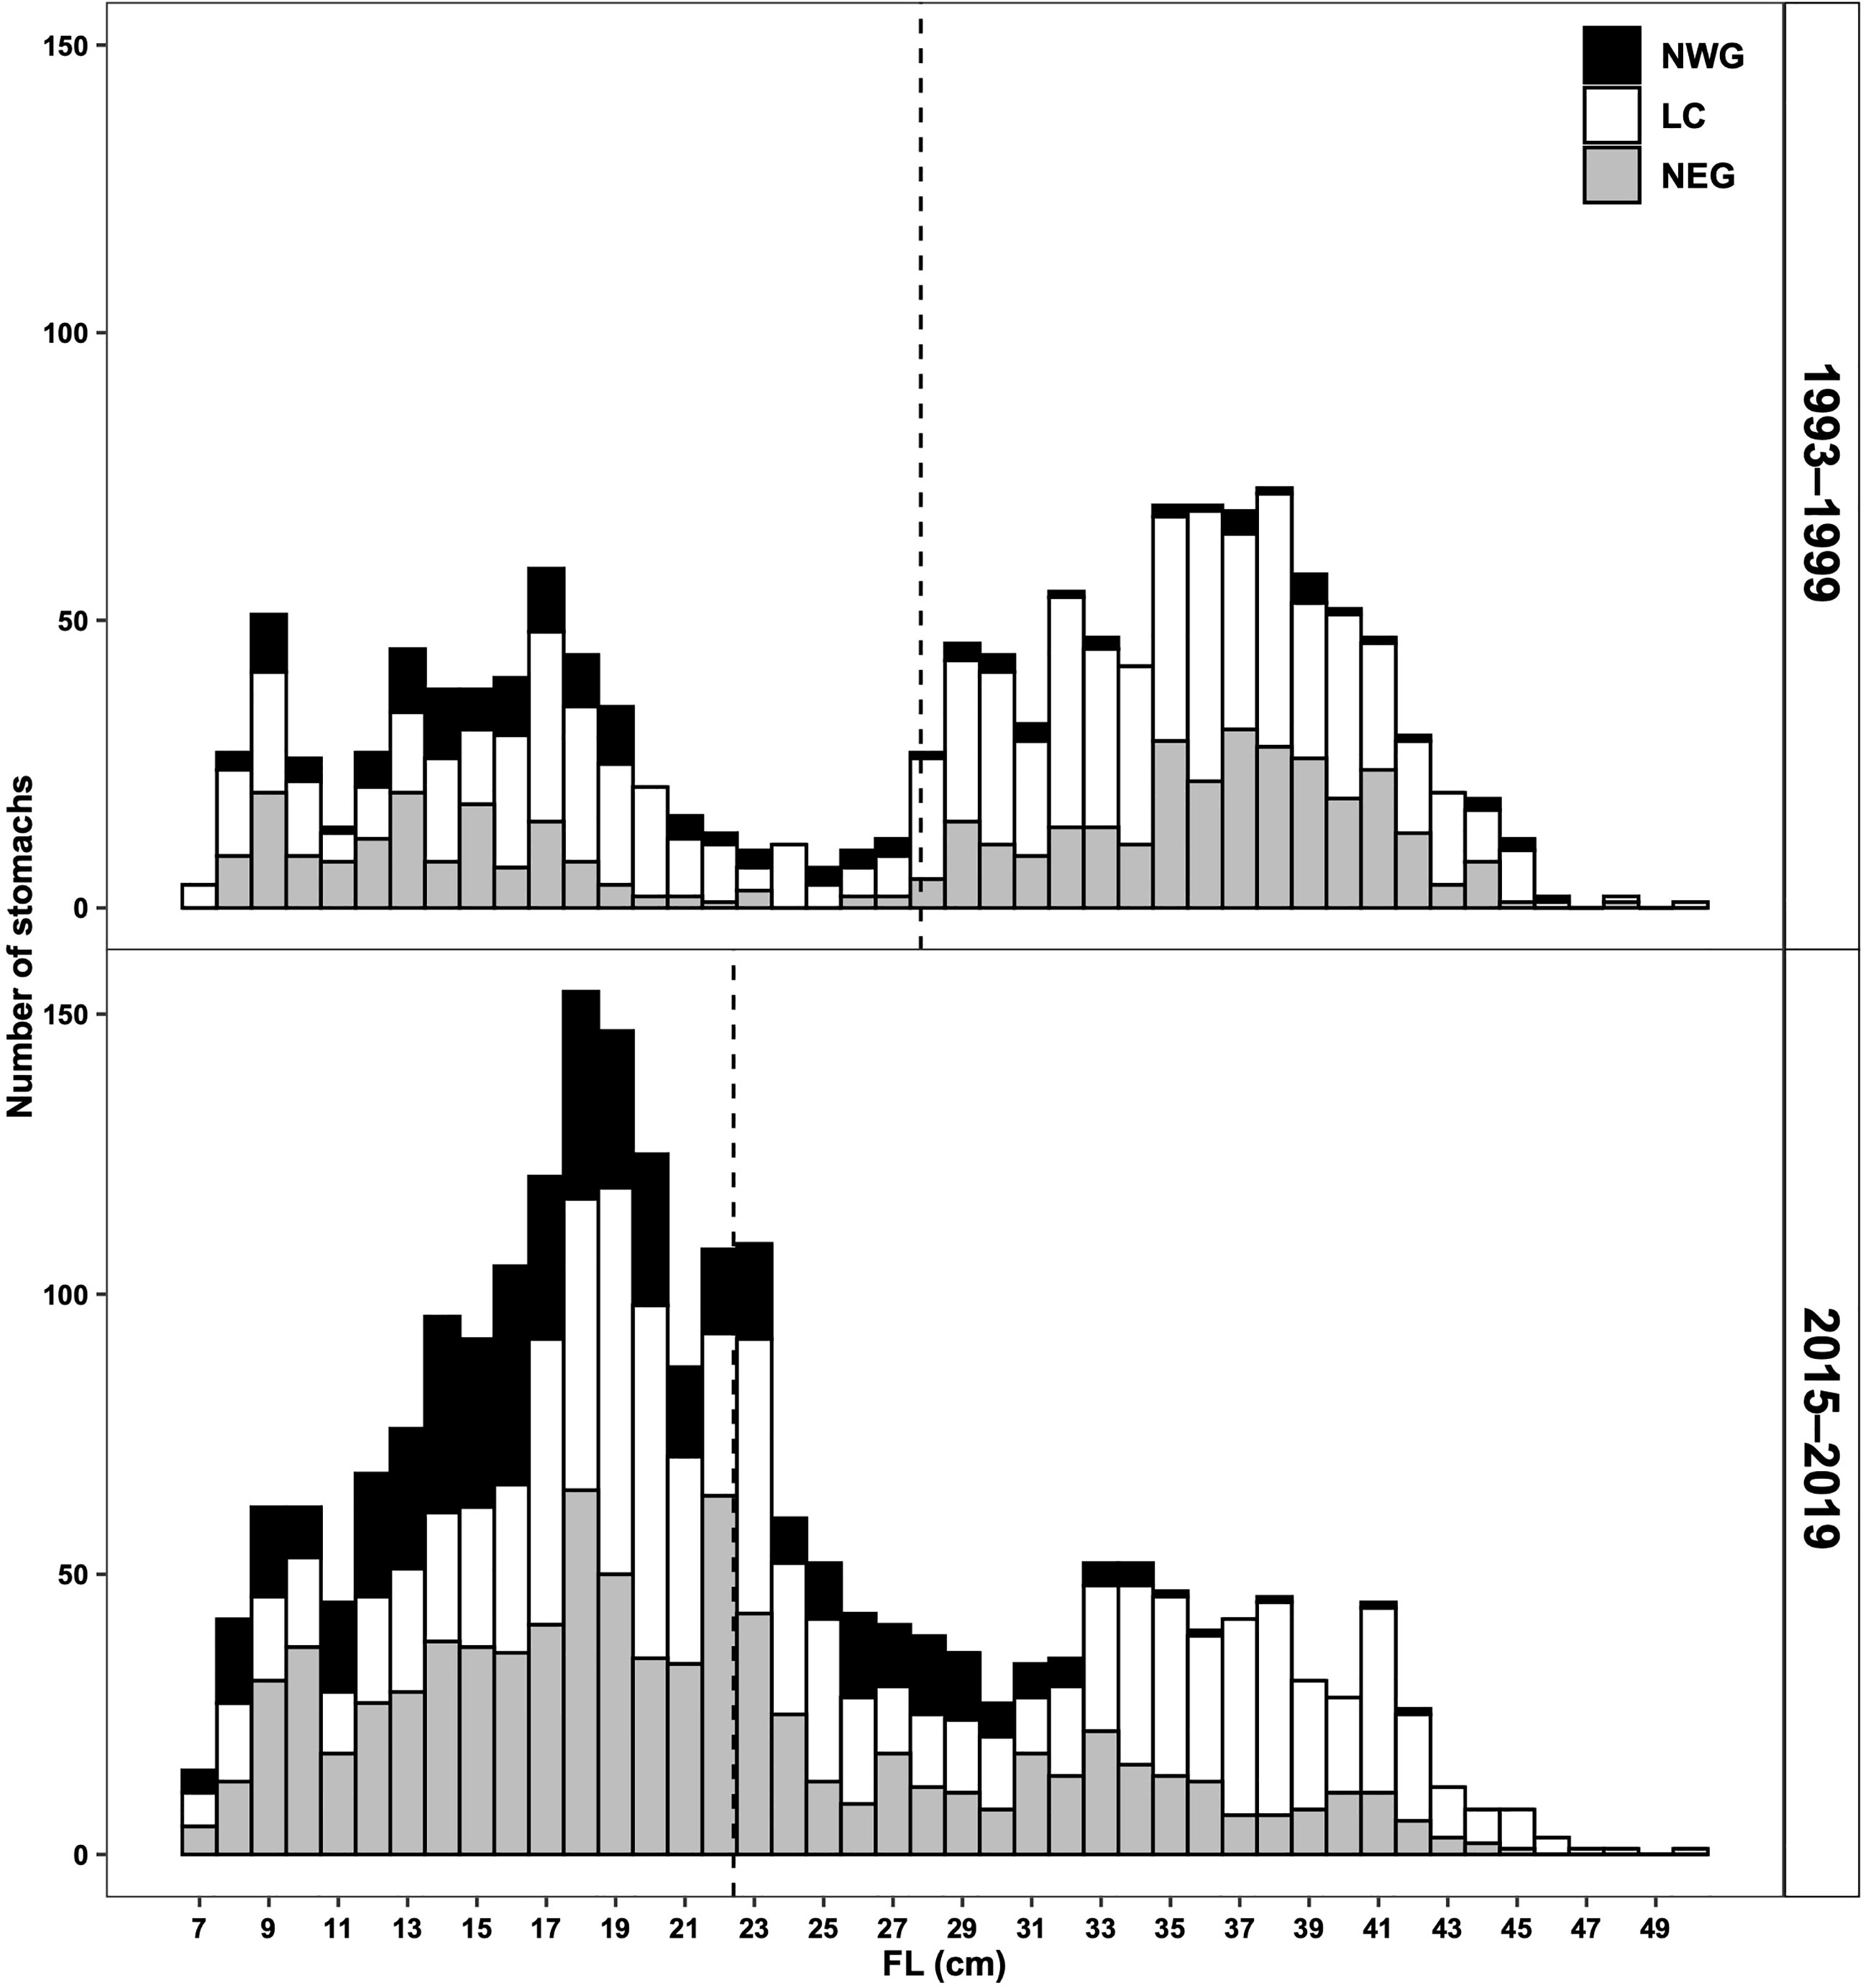
Figure 2 Size frequency distribution of redfish with stomachs containing prey collected in the GSL during 1993–1999 and 2015–2019 according to each defined subarea. Dashed lines represent the FL mean value for each period.
To provide and facilitate the description of the redfish diet for both periods, prey items were assigned to one of eight broad taxonomic categories under the common denomination: Fish, Shrimp, Amphipod, Copepod, Mysid, Euphausiid, Other Invertebrates and Unidentified Material. The TFI (sum of all PFIs) and the three measures for the assessment of prey contribution to redfish diet (PFI, %FI and %O) based on the entire stomach dataset for each period are presented in Table 2 and showed the eight broad dietary categories and each of the 58 and 93 different prey items found in stomachs collected in 1993–1999 and 2015–2019, respectively.
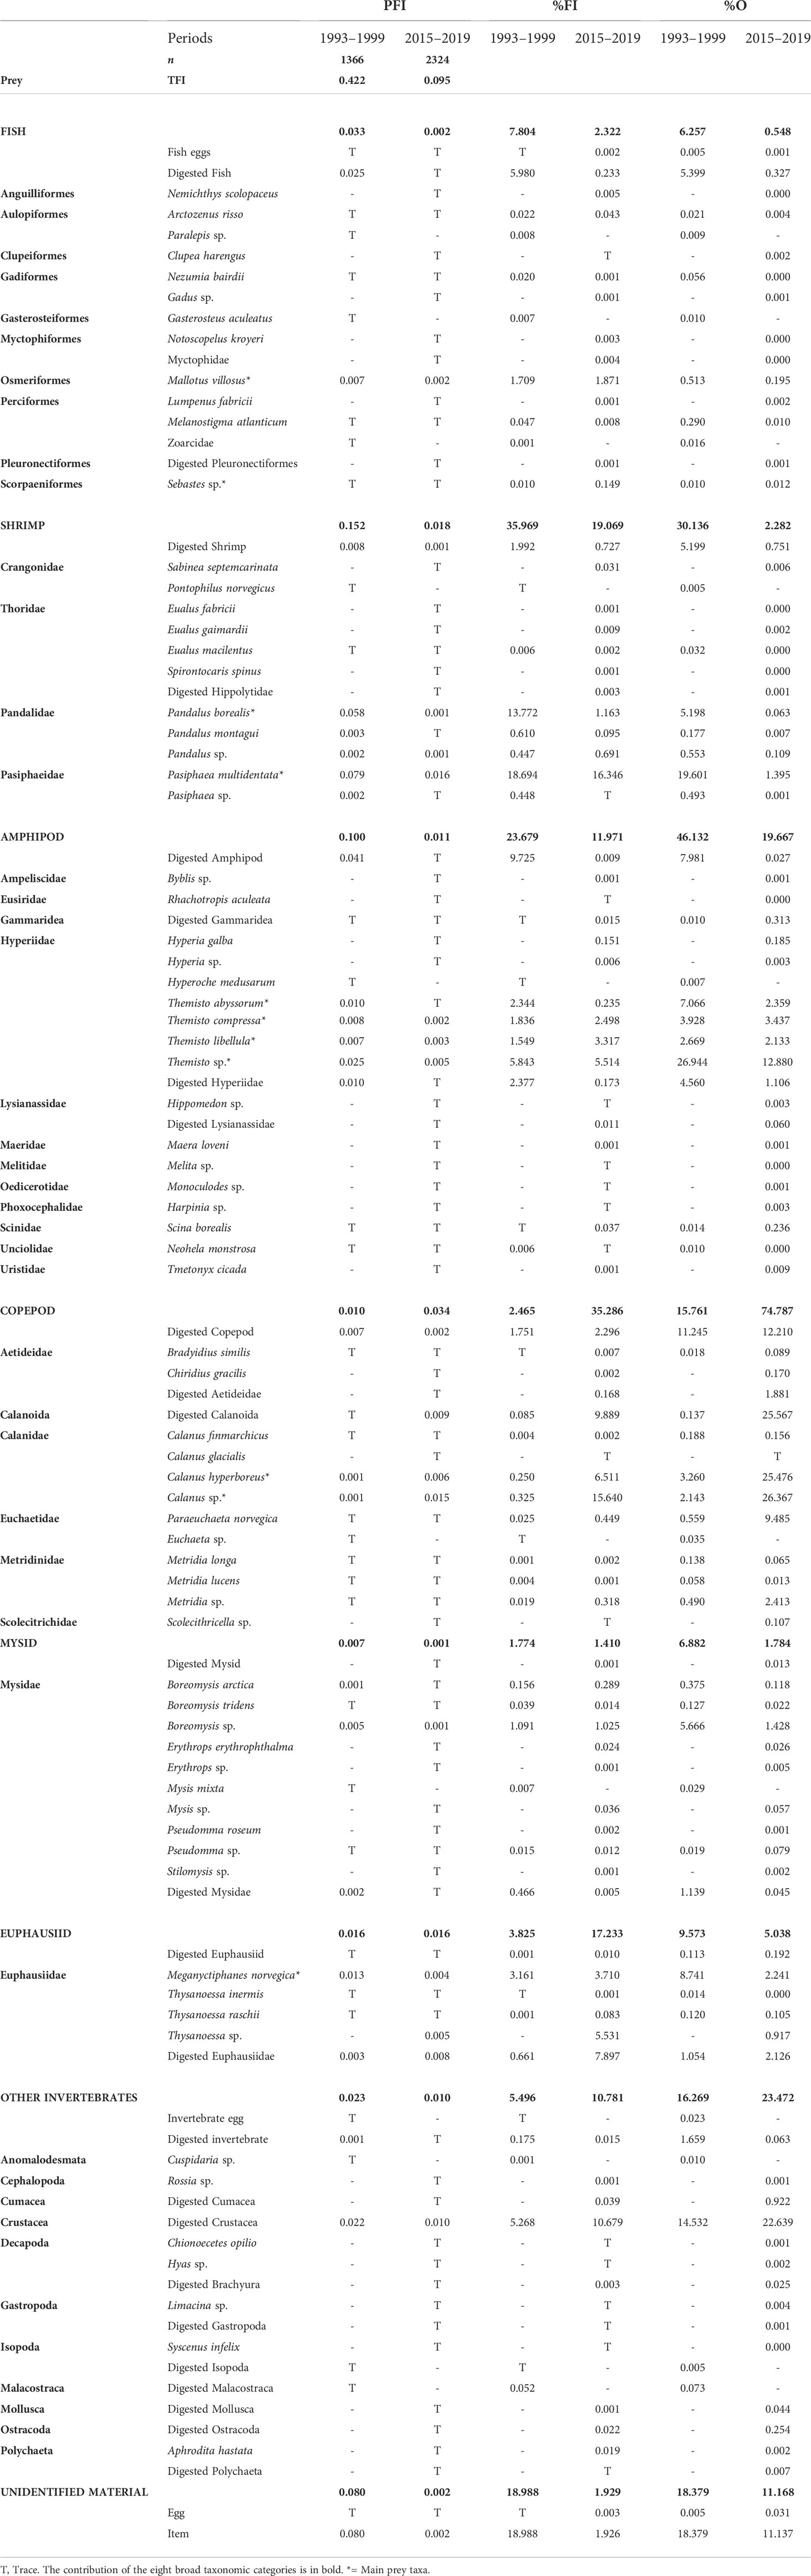
Table 2 Diet composition of GSL redfish expressed in partial stomach fullness index (PFI), percentage fullness index (%FI) and percentage of occurrence (%O) according to period.
As far as possible, prey that showed important signs of digestion, but which were identifiable by distinguishing features (e.g., telson for shrimp) were assigned to one of the eight categories with the name “digested”. The category Other Invertebrates was comprised mostly of remains of crustaceans, along with traces of identified groups from several classes of invertebrates that were rarely encountered in redfish stomach. Overall, only a few of the prey types identified at the genus or species level had important dietary contributions and were consumed regularly during both periods (taxon identified by an asterisk, Table 2). Capelin and redfish were the most frequent fish, while shrimp were most often represented by northern shrimp P. borealis and pink glass shrimp P. multidentata. Among amphipods, the greatest contributions were from unspecified Themisto sp. along with T. abyssorum, T. compressa and T. libellula. Of the copepods, unspecified Calanus sp. and C. hyperboreus were most important, while among euphausiids, the northern krill, Meganyctiphanes norvegica, was the main contributor. Another major zooplankter was the deepwater mysids of genus Boreomysis, though these were not significant enough to be major prey. These important taxa were retained in the following analyses, except that all four Themisto taxa were grouped into Themisto sp. since the three identified species contributed similarly to the diet. Other prey taxa were grouped together according to broad taxonomic categories, resulting in fifteen prey groups of interest (see Figure 3).
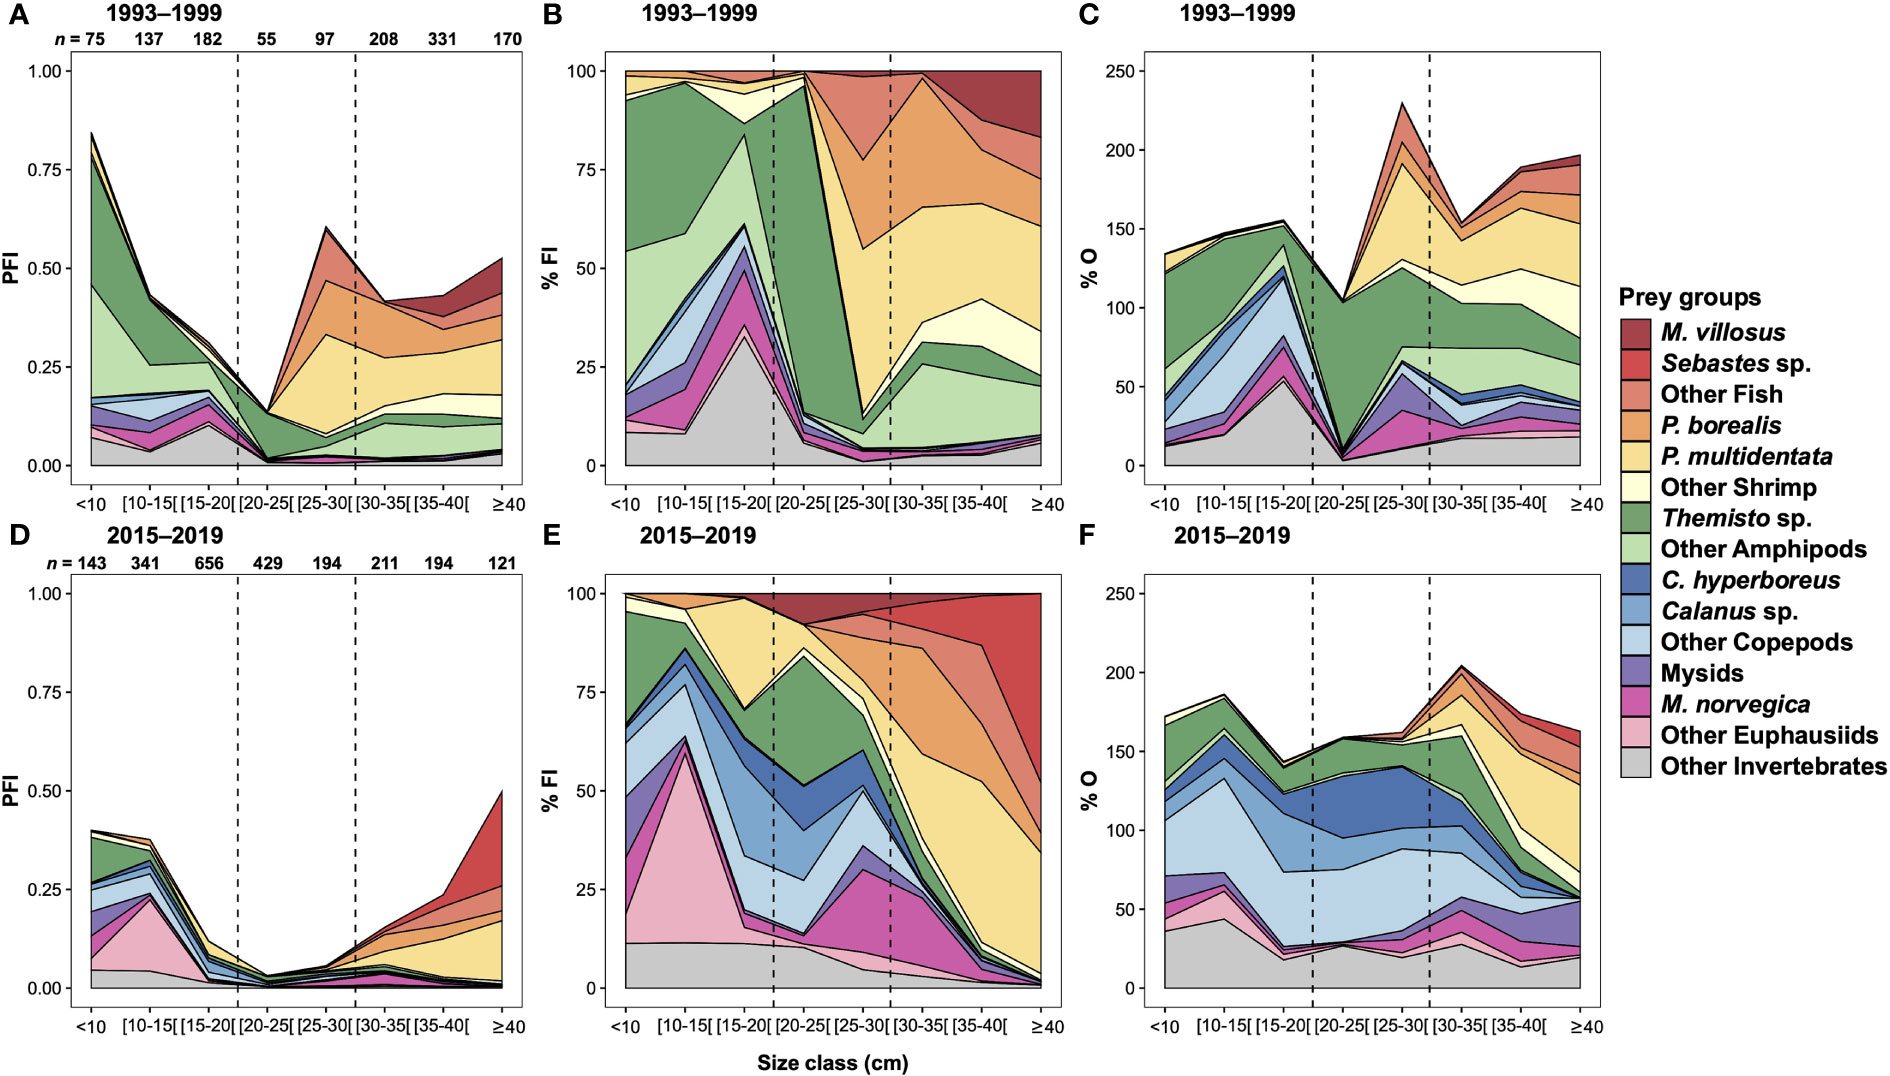
Figure 3 Contribution of the fifteen prey categories to GSL redfish diet, expressed as partial fullness index (PFI), percentage of fullness index (%FI) and percentage of occurrence (%O) during (A–C) 1993–1999 and (D–F) 2015–2019 as a function of 5 cm size class. The dashed lines indicate > 20, 20–30 and ≥ 30 cm used to separate small, medium and large individuals. Sample size for each 5 cm size class is indicated on panels (A, D).
Prey that could not be identified to a chosen taxonomic group were classified in the category Unidentified Material. Compared to the 2010s, the 1990s were characterised by a higher contribution and occurrence of Unidentified Material (the 1990s: %FI = 18.99, %O = 18.38; the 2010s: %FI = 1.93, %O = 11.17, Table 2). Some stomachs from the 1990s were analysed in 2019, allowing the assessment of the impact of protocol adjustments and differences in taxonomic expertise between the two periods. For example, the stomachs from the 1990s that were examined in 2019 had virtually no Unidentified Material, in contrast to the other stomachs from the 1990s that had been examined during that period (Supplementary Figure 1). Removal of the category Unidentified Material reveals similar trends in diet of the 1990s, regardless of when the stomachs were analysed, with two exceptions: amphipods and shrimp. For amphipods, the category Other Amphipods was more abundant in the stomachs from the 1990s analysed in the 1990s, whereas those examined in 2019 contained more Themisto sp. taxa. However, for the entire dataset, all identifiable Amphipod taxa were present as traces only, except Themisto taxa. Therefore, a major part of Other Amphipods in stomachs analysed in the 1990s were likely Themisto sp. and the trends for Amphipods very similar for stomachs from the 1990s regardless of when the stomachs were analyzed. For Shrimp prey, stomachs from the 1990s examined in 2019 did show more P. multidentata and less P. borealis than stomachs analysed in the 1990s. This switch in shrimp species likely represents interannual differences in diet, as most stomachs examined in the 1990s were collected in 1997 or before, and all stomachs from the 1990s analysed in 2019 were collected in 1997 and after. Both subsets of stomachs from the 1990s were considered comparable and combined for further analysis, and the category Unidentified Material was removed from the data for both the 1990s and 2010s, because differences in the importance of this group appeared to be caused by methodological differences (Supplementary Figure 1). This adjustment slightly reduced sample size by 111 for the 1990s and 35 for the 2010s (mainly for small individuals < 20 cm; n = 64 and n = 20, for both periods respectively) (Supplementary Table 2).
For both periods, zooplankton dominated the diet of the smallest redfish. With increasing predator size, their importance decreased while the proportion of shrimp and fish increased, according to all three diet measures (Figure 3). This same major shift in the diet of redfish is observed around 25 cm for the 1990s and 30 cm for the 2010s. Although the contribution of zooplankton in terms of %FI decreased drastically for large specimens, occurrences remained high, especially for amphipods in the 1990s and for copepods in the 2010s. For both periods, pink glass shrimp and northern shrimp were found in high proportion and occurrence in large redfish, although the contributions in %FI and %O of pink glass shrimp were greater than that of northern shrimp. For both periods, the specific contribution of northern shrimp was greatest for 30–35 cm redfish (%FI = 32.66 in the 1990s and 26.79 in the 2010s, Figure 3). Although the two periods were characterised by the same overall diet trends in relation to redfish size, differences in the importance of specific prey were observed. Diet composition based on %FI of the fifteen prey groups was influenced by the interaction between periods and size classes (PERMANOVA, p = 0.001, Table 3).
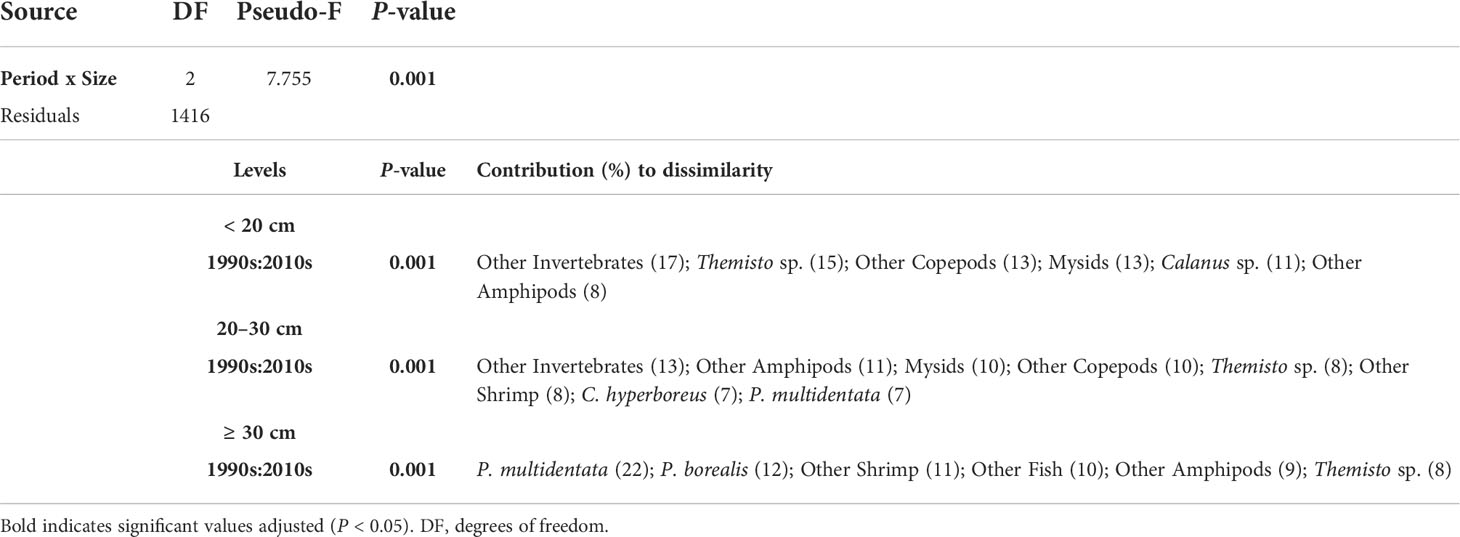
Table 3 PERMANOVA, pairwise comparisons and SIMPER results testing the dissimilarities in redfish diet composition based on percentage fullness index (%FI) of the fifteen prey categories between periods and for three size classes.
Amphipod groups, principally of Themisto, dominated the diet of small (< 20 cm) redfish in the 1990s, while euphausiid and copepod groups dominated during the recent period (Figure 3). SIMPER analysis revealed that for small redfish, differences between the two periods were explained at 47% by the relative abundance in the diet of Themisto sp. and Other Amphipods (more abundant in the 1990s), as well as Other Copepods and Calanus sp. (more abundant in the 2010s), whereas Other Invertebrates and Mysids, more abundant in the 1990s, contributed another 30% (Table 3).
Themisto sp. still dominated the diet of medium (20–30 cm) redfish in the 1990s while the three Copepod categories were predominant during the 2010s with C. hyperboreus as the species identified most frequently, though it was nearly absent in the 1990s (Figure 3). According to SIMPER analysis, Other Amphipods, Themisto sp., Other Copepods and C. hyperboreus accounted for 36% of the differences between medium redfish from the two periods, whereas Other Invertebrates, Mysids and Other Shrimp, slightly more abundant in the 2010s, contributed another 31% (Table 3). In the 1990s, there was a peak in the proportion of P. multidentata in the diet (41.51%) for 25–30 cm redfish (Figure 3) and this prey contributed 7% to the difference in the diet of the two periods for medium size redfish (Table 3).
Although the Shrimp groups were important in both periods in the diet of large (≥ 30 cm) redfish (%FI = 61.71 in the 1990s and 50.48 in the 2010s), the relative proportion of the three categories changed between periods (Figure 3) and contributed 45% to the differences in diets (Table 3). In terms of %FI, the diet of the largest redfish (≥ 40 cm) in the 2010s was almost exclusively based on shrimp and fish groups (%FI = 89.69) (Figure 3). Capelin was the most important fish prey consumed in large redfish in the 1990s, while a shift to cannibalism was observed for the same size class in the 2010s (Figure 3), but these changes did not contribute strongly to the differences between periods shown in Table 3. Amphipods remained important in the diet of large redfish during the 1990s, while their contribution was negligible during the 2010s (Figure 3), explaining 17% (Other Amphipods and Themisto sp.) of the differences between periods.
Diet composition was also influenced by the interaction among size classes (< 20, 20–30, ≥ 30 cm) over periods (1990s and 2010s) and subareas (NWG, LC, NEG) (PERMANOVA, p = 0.003). Pairwise comparisons indicated redfish diets differences, except for redfish ≥ 30 cm in the NWG (Table 4). The absence of difference for ≥ 30 cm redfish in the NWG should be interpreted with caution given the low numbers of large individuals in this subarea during both periods. Amundsen diagrams were used to depict the feeding strategy of redfish during both periods (Figures 4, 5). Overall, only the prey groups of Other Amphipods, Mysids, and P. borealis appeared as dominant, and then only in the 1990s (Figure 4).
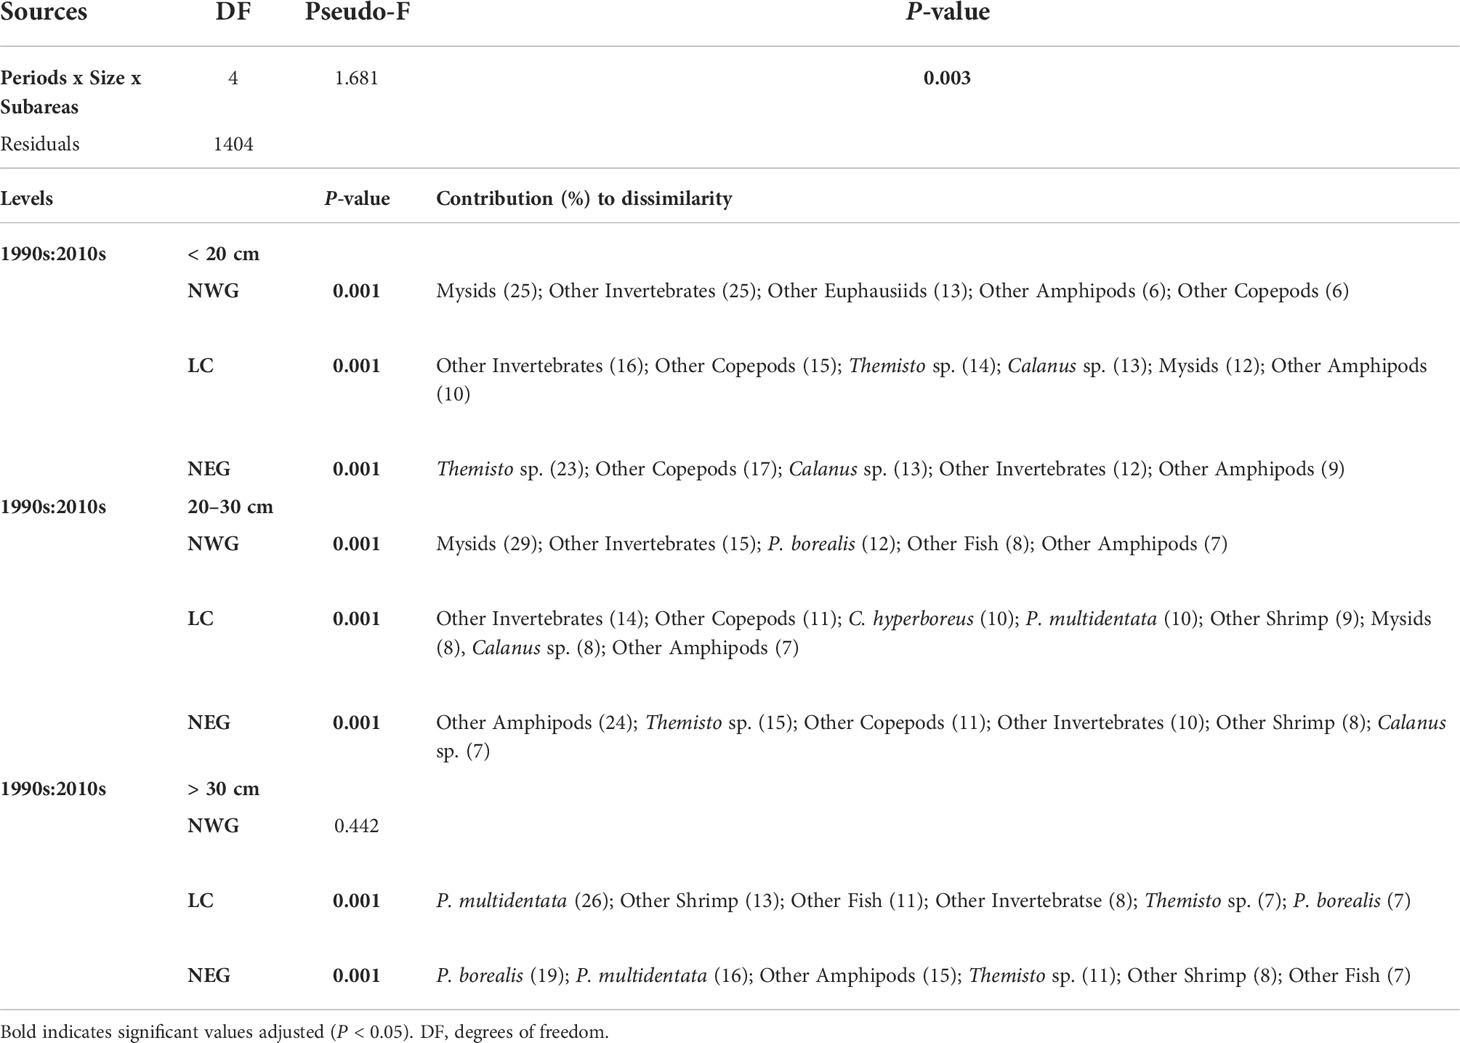
Table 4 PERMANOVA, pairwise comparisons and SIMPER results testing the dissimilarities in redfish diet composition based on percentage fullness index (%FI) of the fifteen prey categories among size classes over periods and subareas.
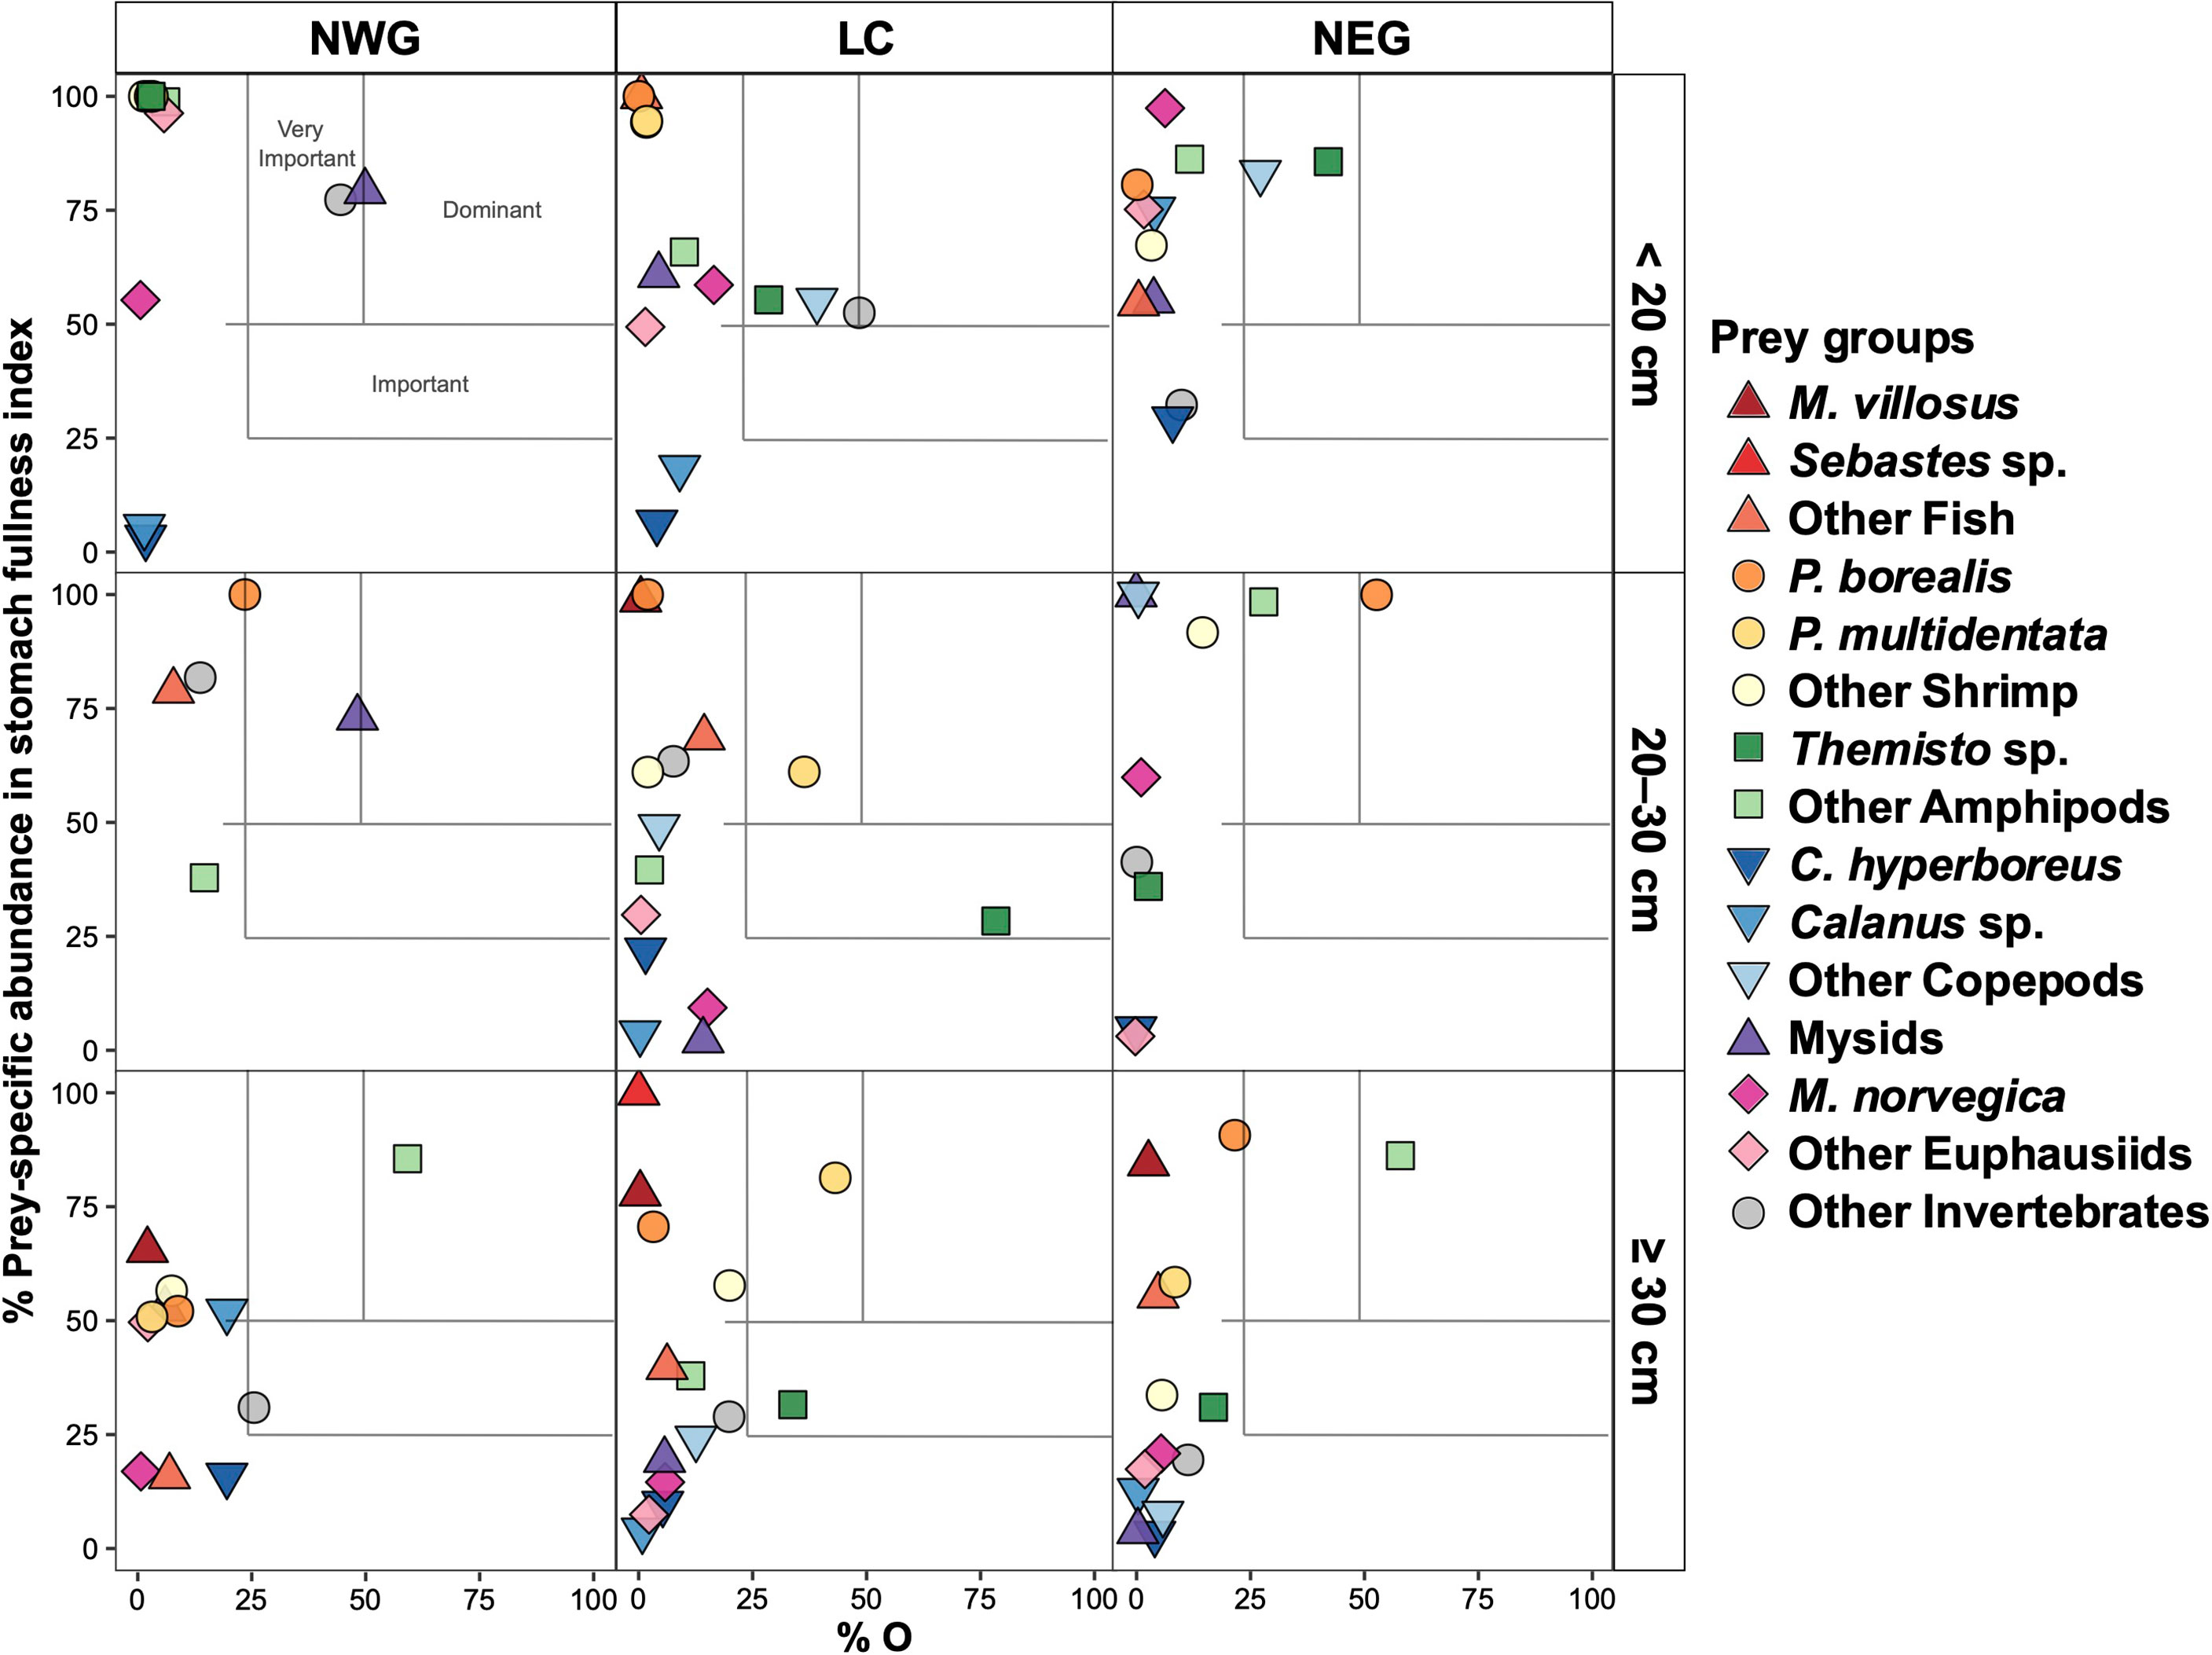
Figure 4 Feeding strategy of GSL redfish in the 1990s for three subareas and three major size classes. Prey-specific abundance in stomach fullness index (%FIspe_i ) is plotted against percentage of occurrence (%O).
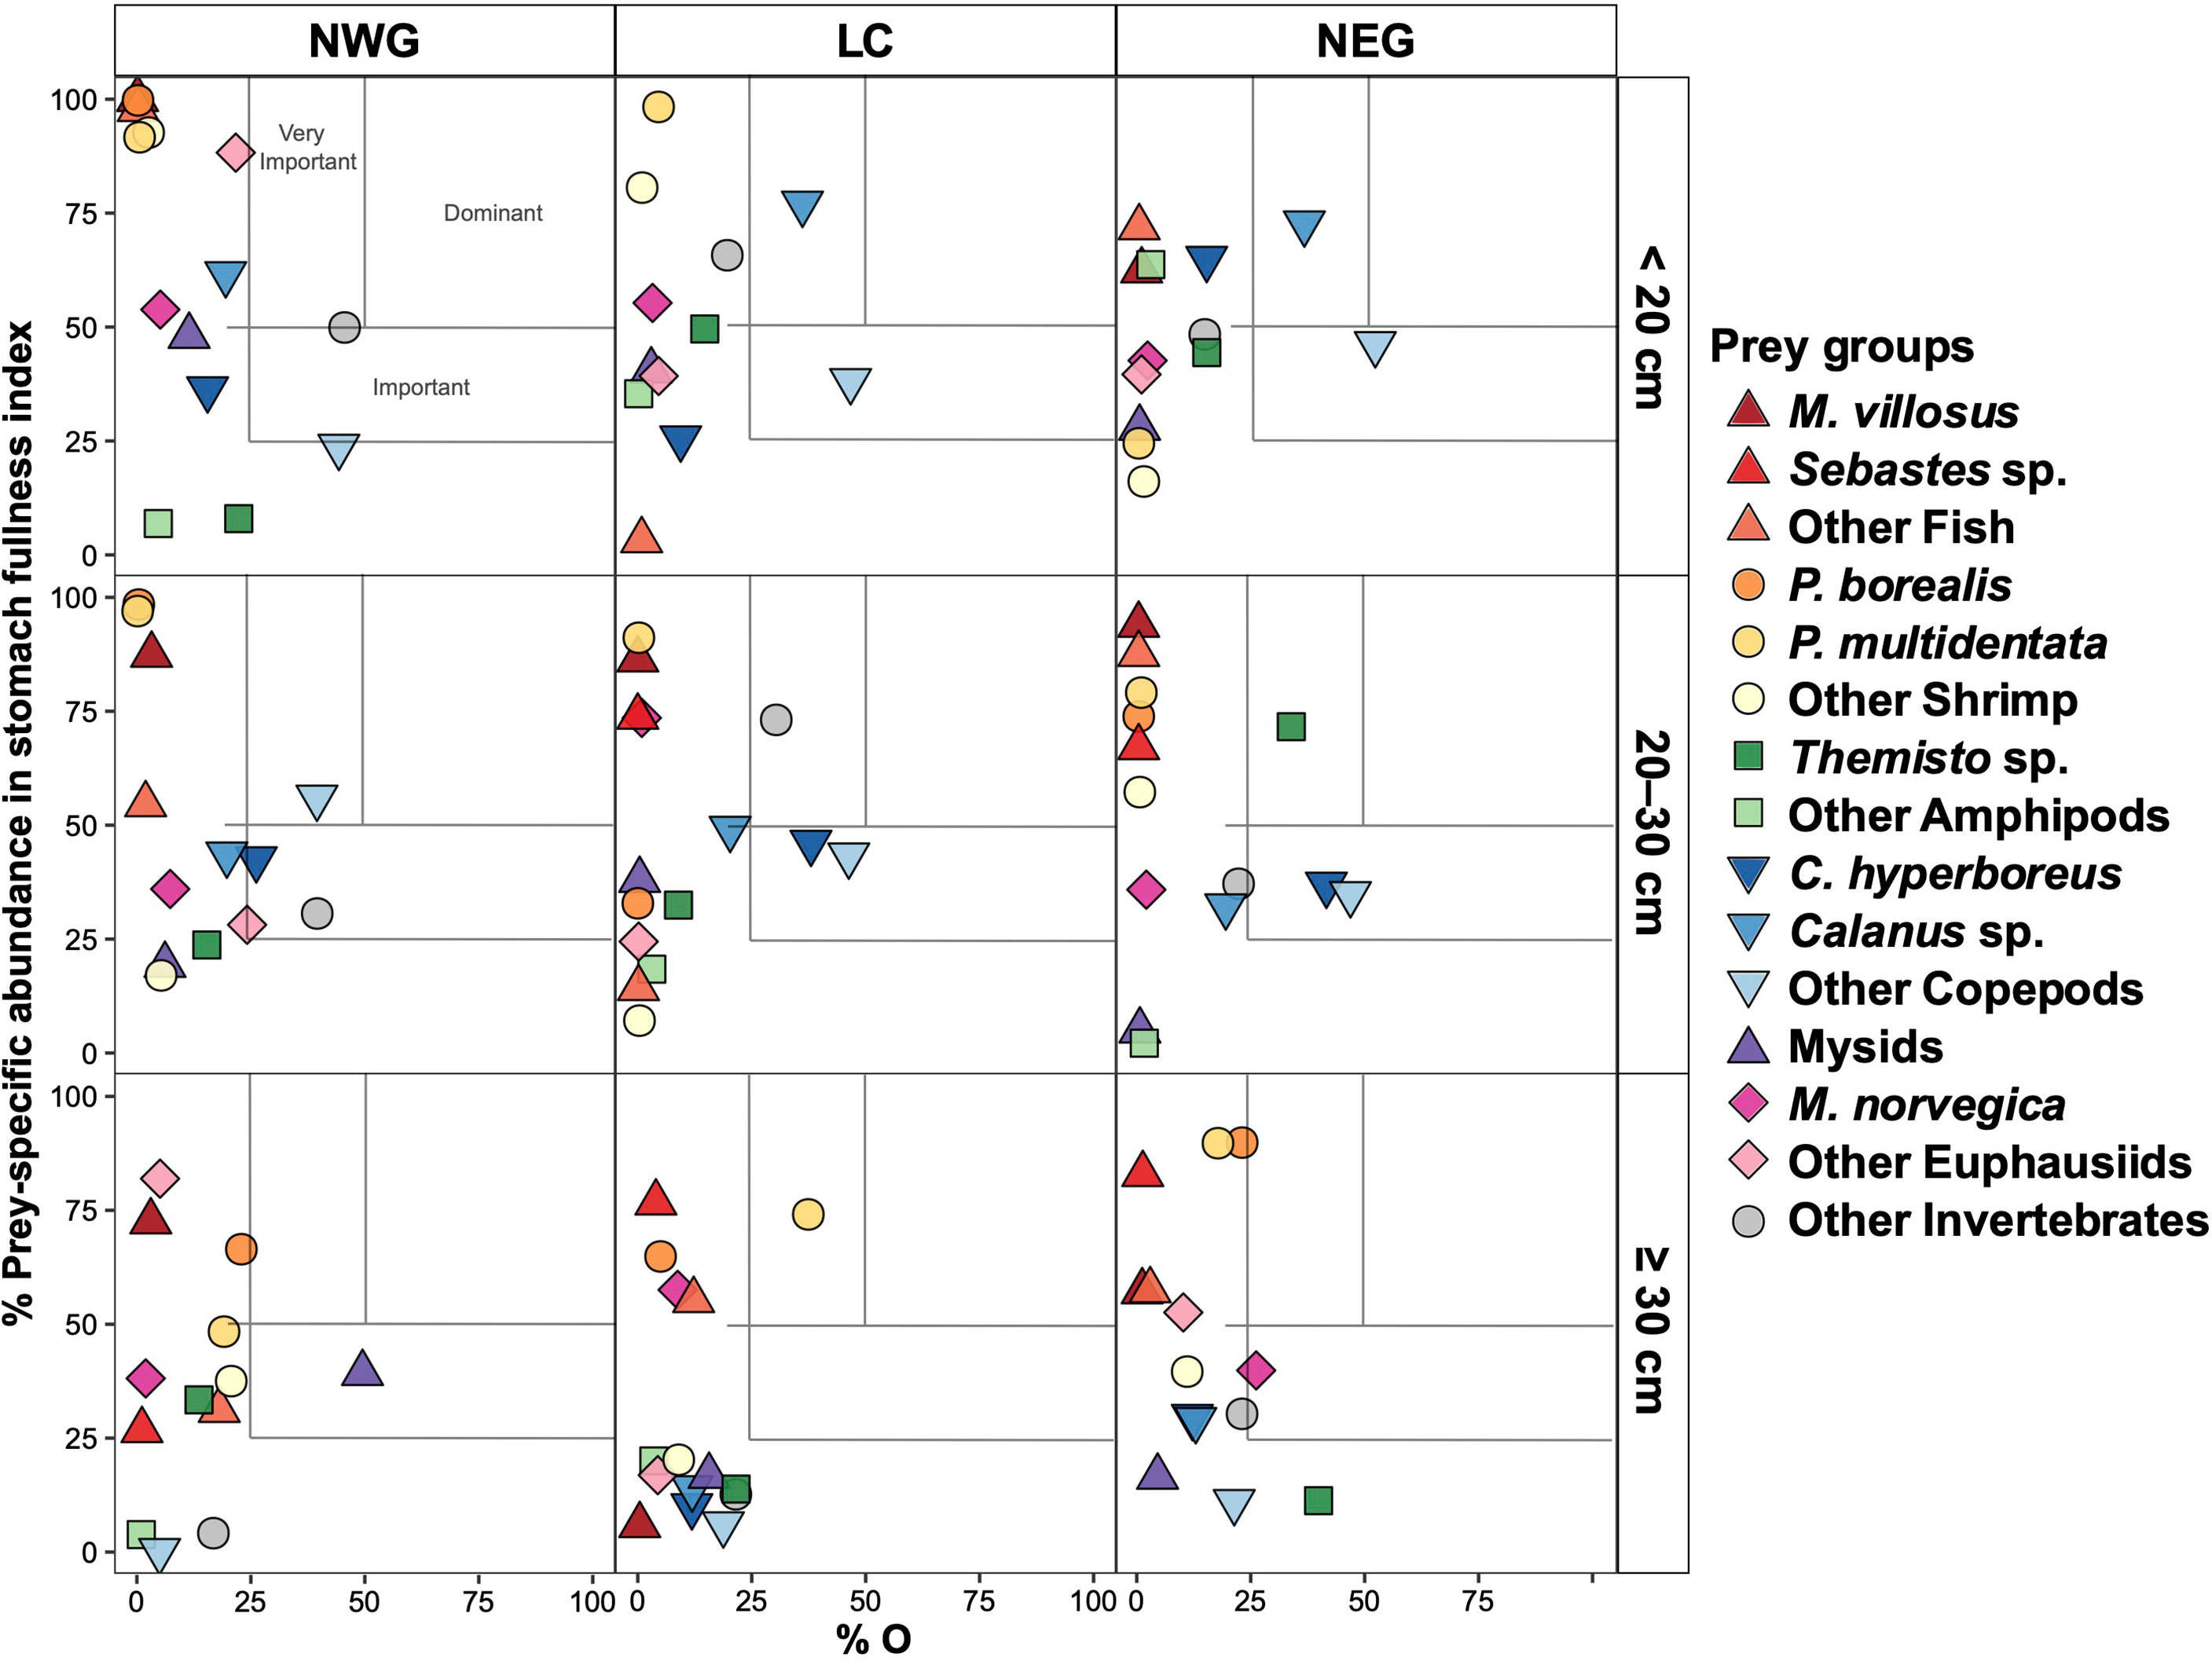
Figure 5 Feeding strategy of GSL redfish in the 2010s for three subareas and three major size classes. Prey-specific abundance in stomach fullness index (%FIspe_i ) is plotted against percentage of occurrence (%O).
The diets of small (< 20 cm) redfish during the 1990s were characterised by Mysids (i.e., Boreomysis sp., Table 2) as the dominant prey in NWG and by very important prey groups in the three subareas: Other Invertebrates (NWG), and Other Copepods and Themisto sp. (LC and NEG) (Figure 4). In the 2010s, the diets of small redfish were characterised by very important prey categories: Other Invertebrates in NWG, Calanus sp. in LC and NEG, and Other Copepods being important prey in the same two subareas. Other Euphausiids and Calanus sp. were noteworthy in NWG (Figure 5). Mysids (25% in NWG), Other Invertebrates (12–25% in the three subareas), Themisto sp. (23% in NEG) and Other Copepod (6–17% in the three subareas) explained the most of the dissimilarities observed in pairwise comparisons over periods and spatial subareas (Table 4).
In medium (20–30 cm) redfish diet and during the 1990s, only northern shrimp was the dominant prey type in NEG while Mysids, P. multidentata and Other Amphipods were very important in NWG, LC and NEG, respectively, and Themisto sp. was important in LC (Figure 4). In the 2010s, Other Copepods, Other Invertebrates (e.g., digested crustaceans, Table 2) and Themisto sp. were very important groups in NWG, LC and NEG, respectively. C. hyperboreus was important in all three subareas and Other Copepods were important in LC and NEG, whereas Other Invertebrates were important in NEG (Figure 5). Mysids explained 29% of the dissimilarity in NWG while Other Invertebrates and Other Amphipods respectively explained 14 and 24% in LC and NEG subareas, observed in pairwise comparisons (Table 4).
In the large (≥ 30 cm) redfish diet in the 1990s, Other Amphipods dominated the diet in NWG and NEG, and P. multidentata was a very important prey in LC, whereas Themisto sp. was important in LC as well as Other Shrimp and P. borealis were noteworthy in LC and NEG, respectively (Figure 4). In the 2010s, a single very important prey, P. multidentata, was observed in LC. Mysids and M. norvegica were important prey categories in NWG and NEG, respectively, and P. borealis was a noteworthy prey in NWG and NEG (Figure 5). Fish prey were noteworthy in large redfish diet for both time periods (Figure 3); these were important despite their low occurrence because they often consisted of large meals (high fullness index) (Figures 4, 5). The two shrimp species explained together 25% of the dissimilarity observed in NEG and P. multidentata explained 26% of the differences between periods in LC (Table 4).
The potential variability in stomach content data means that large sample sizes may be required to obtain a representative portrait of diet composition for a given category of fish, area or time period. This is particularly true for predators that often have regurgitated stomachs when sampled, as is seen with Greenland halibut and redfish. In a literature review, Baker et al. (2014) concluded that samples comprising ≥ 100 individuals generally provide a reliable depiction of diet composition. The validity of sample sizes can be assessed using prey accumulation curves. In cases when the asymptote is not reached (Supplementary Figure 3), the reliable depiction of diet composition can be further assessed by evaluating the convergence of diet indicators based on mass or volume (e.g., %FI) and %O. In the present study, we considered a total number of 6,958 stomachs, of which 3,690 contained prey taxa. Within a given period, each 5 cm size class comprised between 55 and 656 individual redfish stomachs. Even though there were only 55 stomachs available for 20–24.9 cm redfish in the 1990s, the progressive diminution of small prey items with increasing fish length is clearly visible using all three measures (PFIs, %FI, and %O) and the relative abundance of Amphipods and Copepods was coherent with other size classes of the 1990s, and different from their relative abundances in the 2010s (Figure 3). In some instances, smaller sample sizes were considered when splitting samples into subareas (e.g., NWG in the 1990s, Table 1), but for the large majority of subgroups (combination of size classes, period and geographic subarea) well above 100 stomachs with food were available, making us confident that our sample sizes and choice of diet indicators allowed for a representative description of the redfish diet and robust comparisons of redfish diet composition between periods and among subareas within the GSL.
For both periods considered in the present study, analysis of redfish diet composition revealed similar patterns of dietary shifts with size. Overall, zooplankton dominated the diet of small redfish (< 20 cm), but generally showed decreasing importance with increasing predator size as it was replaced by shrimp and fish. Size-related shifts in diet composition are commonly observed in fishes (e.g., Hovde et al., 2002; Buckley and Whitehouse, 2017; Sánchez-Hernández et al., 2019), given that body size often increases by more than one order of magnitude from the early juvenile to the late adult stages. Shifts in prey are generally linked to the combination of predator size, mouth opening and swimming ability, as well as changes in vertical distribution and habitat use (Cook and Bundy, 2010; Sánchez-Hernández et al., 2019).
Redfish occupy various depth strata during ontogeny. Larvae develop in surface waters then migrate to deeper waters as they develop (Templeman et al., 1959; Senay et al., 2021). Juveniles and adult redfish are bentho-pelagic, distributed near the sea floor at depths ranging between 40 and 500 m in the GSL, older fish occupying generally deeper waters than younger fish, then migrating vertically to feed on pelagic preys (e.g., Steele, 1957; Lambert, 1960; Planque et al., 2013; Senay et al., 2021; Froese and Pauly, 2022).
Our study provides a robust confirmation of trends observed in a preliminary analysis based on raw data, showing a dietary shift from zooplankton to shrimp and fish (Senay et al., 2021). Such a transition was also reported in both Barents (Dolgov and Drevetnyak, 2011) and Irminger (González et al., 2000) seas, as well as on the Flemish Cap (Albikovskaya and Gerasimova, 1993). Moreover, the main groundfish species co-occurring with redfish in the GSL, namely the Greenland halibut, Atlantic cod and white hake (Urophycis tenuis Mitchill 1814), are also characterised by a dietary shift from zooplankton to shrimp at sizes ranging between 20–25 cm, and then to piscivory at larger sizes (Ouellette-Plante et al., 2020).
Our capacity to detect whether the diet of a given species is either selective or reflects changes in the relative abundance of potential prey taxa requires sampling across the distribution of a given species that may vary between periods in relation to prey availability (Fahrig et al., 1993; Dwyer et al., 2010; Buckley and Whitehouse, 2017) and abiotic conditions, such as temperature (Cook and Bundy, 2010).
Since the early 2010s, changes have been noticed in the GSL environment and ecosystem. Deep waters have warmed from the inflow of oceanic water through Cabot Strait, contributing to a worsening of acidification and hypoxia of this deeper water layer (Mucci et al., 2011; Galbraith et al., 2019; Blais et al., 2021). This continuing warming of the deeper water layers will impact on species distribution and composition, such as the decline of dominant cold-water species like northern shrimp, snow crab, and Greenland halibut, and the increase of warm-water species like redfish and cod (Bourdages et al., 2017; Brassard et al., 2017; Galbraith et al., 2019). In the present study, the geographic coverage of the redfish stomach collection on trawl research surveys was relatively extensive and similar between both periods, allowing us to detect temporal changes among the three spatial subareas of the GSL. Moreover, weighting of diet composition to account for spatial variability in redfish abundance allowed us to document dietary changes between the two periods characterised by different regimes, considering redfish local abundance.
In addition to considering variability in redfish spatial distribution, a robust assessment of feeding strategies would be facilitated by information on prey availability over the full time series considered. DFO’s Atlantic Zone Monitoring Program (AZMP) provides abundance indices for mesozooplankton taxa such as copepods, and some information on macrozooplankton taxa, such as amphipods, euphausiids and mysids, but the program only started its large-scale monitoring activities in 2000 (Blais et al., 2021), i.e., after the first period considered in the present study. For shrimp, abundance of the commercially exploited northern shrimp has been assessed over the full time series. Data on pink glass shrimp are only partial, obtained by sampling from the annual bottom trawl survey. Compared with northern shrimp, pink glass shrimp is mostly pelagic and catch quantities are orders of magnitude lower (kilotons vs. kg; Bourdages et al., 2020b) on the trawl survey, representing an unknown fraction of the available biomass in the water column. The frequent presence of pink glass shrimp in redfish stomachs suggests it could be present at a similar scale of biomass as northern shrimp. In the 2015–2017 groundfish stomach contents summary by Ouellette-Plante et al. (2020), among deepwater predators, pink glass shrimp is ranked first in contributed prey for redfish, black dogfish (Centroscyllium fabricii), longfin hake (Phycis chesteri) and is significant in Greenland halibut, thus suggesting that it is widely available and abundant in the deep channels of the GSL. Regarding fish prey, small redfish has been monitored over the whole time series, while capelin is not assessed in the same manner in the GSL because the trawl research surveys has limited catchability for pelagic species, akin to the situation with pink glass shrimp noted above (Bourdages et al., 2020b). Even though several key prey species are mostly pelagic and abundance indices are not currently generated from the annual bottom trawl survey, complementary information based on specific research initiatives can be used to make robust inferences on redfish feeding strategies within the three main size classes considered.
Marked variability in diet composition was observed in small (< 20 cm) redfish diet, reflected by the dominance of different zooplankton prey taxa between periods and among subareas of the GSL. These differences were primarily driven by a dominance of amphipods (Themisto sp.) in the 1990s, in particular in the diet of North-East Gulf redfish, while in the 2010s, copepods (Calanus sp., especially large C. hyperboreus) and euphausiids (mostly M. norvegica) respectively dominated diet composition in the Laurentian Channel and the North-West Gulf. Information available on spatiotemporal variations of zooplankton taxa within the GSL suggests that small redfish diet composition was proportional to the relative abundance of main zooplankton taxa in time and space. For example, as Mysids were mostly composed of Boreomysis arctica and Boreomysis sp., their importance in the diet of NWG redfish was not surprising as their distribution is mostly in NWG, spilling over into the southwest part of LC (Chabot et al., 2007). This pattern may be similar to that with Atlantic cod, with their diet reflecting available prey (and thus a good sampler of the ecosystem, Link, 2004), possibly in contrast to Greenland halibut, which exhibit prey preferences and may thus not select alternate prey when preferred ones are less available (Ouellette-Plante et al., 2020).
In the 1990s, the massive intrusion of the cold Labrador Current waters into the GSL via the Strait of Belle Isle led to a sharp increase of the abundance of the arctic Themisto libellula and subarctic T. abyssorum into the ecosystem (Harvey et al., 2004; Harvey and Devine, 2009; Kraft et al., 2013). These two amphipod species were five times more abundant in 1998, corresponding to the end of the cold period, compared to 2000–2001 (Descroix et al., 2005). The importance of cold water amphipods in the GSL in the 1990s was also confirmed by Starr et al. (2002), who found strong concordance between their relative abundance in the environment to their importance in the diet of Atlantic cod between 1994 and 2001 in the North-West Gulf. This previous study, as well as our own results, suggest that small cod and redfish consume T. libellula in proportion to their availability in the environment. Since 2005, T. libellula abundance has strongly declined (Harvey and Devine, 2009), which is consistent with their reduced importance in the diet of redfish during the 2010s.
Calanus spp. copepods represent a large proportion of the mesozooplankton community in the GSL (Plourde et al., 2003; Harvey and Devine, 2009). They are distributed near the surface during the productive season but sink in the deep channels diapausing from August to early spring (Harvey et al., 2004; Dufour and Ouellet, 2007) where they become a major prey for redfish. The AZMP has revealed that peak abundance of C. hyperboreus has been recorded in recent years (Blais et al., 2021). Given its large body size, Devine et al. (2017) estimated that C. hyperboreus recently represented up to 80% of the total Calanus sp. biomass in the GSL. The current trends of increasing Calanus sp. biomass in the GSL is consistent with the higher contribution of this taxon to small redfish diet in the 2010s compared to the 1990s.
Euphausiids also contributed importantly to the diet of smaller redfish in the 2010s, with the highest contribution in 10–15 cm redfish. Between 1994 and 2007, the abundance of the two main species of euphausiids, Thysanoessa raschii and Meganyctiphanes norvegica, was estimated to have decreased (Harvey and Devine, 2009). However, acoustic surveys suggest that traditional sampling methodologies strongly underestimate actual abundances (McQuinn et al., 2015). Moreover, there are no data available to contrast euphausiid abundance between the 1990s and the 2010s, so it is not possible to determine whether euphausiids were consumed according to their relative abundance in the environment. Even though krill consumption by redfish requires further investigation, our results and available evidence relative to amphipod and copepod abundance in the GSL strongly suggest that small redfish consume their zooplankton prey in an opportunistic fashion, based on the relative availability of the main taxa in the environment, in particular near the sea bottom.
During both periods considered, redfish shifted from a zooplankton-based diet to a shrimp-dominated diet around sizes of 25 cm in the 1990s and 30 cm in the 2010s. Even if the relative proportion of the Shrimp categories contributed to variability between periods according to statistical analysis, two shrimp species stood out, northern shrimp and pink glass shrimp, which showed high relative importance in both periods. The commercially important northern shrimp is by far the most abundant shrimp species sampled across the DFO bottom trawl survey (on the order of kilotons) and its abundance has been estimated annually since 1990 in the GSL. The abundance of northern shrimp was high through the 1990s, peaked in the mid-2000s, after which it started to decline to reach a record-low value in 2017 (Bourdages et al., 2020a). In contrast, the abundance for pink glass shrimp sampled on the trawl survey is on the order of several dozen kilograms, reflecting the pelagic nature of the shrimp, with adult stages predominantly available on the bottom and which does not allow for an estimate of their population in the GSL.
Data from northern shrimp suggest that redfish systematically transition to preying on shrimp independent of predator or prey abundance. In the 2010s, average northern shrimp biomass throughout the northern Gulf survey region was estimated to be at half the levels estimated in the 1990s (Bourdages et al., 2020a) while mid-size redfish were estimated to be 114 times more abundant (Table 1). However, these contrasting numbers had little effect on the contribution of shrimp to diet, which suggests that redfish exhibit prey selectivity during this feeding transition, after the initial period when they fed more opportunistically on available zooplankton taxa, probably because there were no other large crustacean prey available in sufficient numbers. It is possible that medium size redfish would ingest more pink glass shrimp if the abundance of northern shrimp dropped below a yet to be determined level.
Large redfish ≥ 30 cm in length retained shrimp as main prey, accounting for more than 50% for each of the various feeding indices. The contribution of the mesopelagic P. multidentata to redfish diet gained in importance with increasing redfish size in recent years, but both shrimp species continued to contribute importantly to the diet of redfish of increasing size in the 1990s (Figure 3). The large contribution of pink glass shrimp to redfish diet in both periods, at similar or even greater levels than northern shrimp in the presented results, is evidence that this pelagic species is more widely available than indicated from the trace catches observed in the bottom trawl survey and that a large distributional overlap exists between large redfish and P. multidentata in the deep channels of the GSL. However, we have not speculated on pink glass shrimp selectivity since the population size and thus its importance or temporal trends cannot be estimated. Mean biomass of northern shrimp in the region has been estimated at 1,475 kg/km2 while pink glass shrimp was 70 kg/km2 from the trawl survey conducted by the DFO between 1990 and 2011 (Savard and Nozères, 2012) indicating that these two shrimp species were as much as 20:1 in survey catches compared to near 1:1 level in redfish diet. Though in recent years this ratio has been reduced (6:1 in 2020), because of large declines in northern shrimp survey catches while glass shrimp catches have displayed little or no declines (Bourdages et al., 2021), this could be evidence that the trawl survey is under sampling a pelagic species while adequately sampling a targeted species (northern shrimp).
Fish were the second most important prey category consumed by large adult redfish for both periods. Capelin was the main fish prey in the 1990s, although it was observed eaten by a very small proportion of redfish, constituting the majority of the stomach content when eaten. However, most fish prey were also not identified during that period, which may have led to an underestimation of capelin in the diet of large redfish in the 1990s, digested capelin being considered “Other Fish”. In recent years, digested fish was often identified to species by using otoliths and partial remains. Piscivory was more prevalent in the 2010s, primarily from cannibalism of small redfish. The high occurrence of cannibalism in the 2010s suggests density-dependent control at high redfish abundance and opportunistic selection of fish prey based on availability. Cannibalism is expected to intensify as the strong 2011–2013 year classes grow larger, if small redfish continue to recruit in high numbers. Given that redfish currently represent the vast majority of the biomass in the demersal habitats of the GSL (90% of sampled biomass in the 2019 trawl survey, compared to 15% from 1995–2012, Senay et al., 2021), cannibalism is expected to become an important source of mortality for early juveniles, which could prevent the emergence of strong year classes in the mid-term. In a previous study on GSL redfish predation mortality, Savenkoff et al. (2006) estimated that cannibalism represented 11–15% of total mortality, during a period when small redfish only constituted 2% of the diet of large piscivorous redfish. The anticipated high mortality rates of juvenile redfish attributable to cannibalism will have to be quantified for accurate projections of population dynamics.
The northern shrimp is a key forage species in the GSL demersal ecosystem and also sustains an important commercial fishery. There is growing evidence across multiple North Atlantic ecosystems that northern shrimp populations are impacted by bottom-up effects associated with regional warming (Ouellet et al., 2007; Koeller et al., 2009; Bourdages et al., 2020a). In the GSL, the warming of both surface and deep waters negatively affect northern shrimp recruitment from the larval stage until juvenile settlement in the demersal habitat (Bourdages et al., 2020a). Even though recruitment prospects are generally negative, Brosset et al. (2019) suggested that moderate warming could favour recruitment and abundance in the Esquiman Channel (NEG), which hosts one of the main northern shrimp aggregations in the GSL. However, these authors recognized that the potential northern shrimp abundance increase in Esquiman is conditional to the stability of current predation pressure in the area. Our results indicate that in the 2010s, the contribution of northern shrimp to diet of large redfish was highest in the NWG and NEG subareas, corresponding to known shrimp density hot spots. These results suggest that the potential northern shrimp population growth in the Esquiman Channel (NEG) will be buffered by the increasing biomass of large redfish in the subarea.
Redfish are slow-growing and long-lived species that can reach the size of 42 cm at an age of 40 years. Redfish minimal trawlable biomass was estimated at 4.4 million tons in 2019 with modal size at 23 cm (Senay et al., 2021). Senay et al. (2021) estimated the annual northern shrimp consumption by redfish was ca. 9,500 t during the 1997–1999 period, compared to 81,000 t for the 2017–2019 period, representing an 8.5 fold increase. Given that redfish are currently reaching the size corresponding to a shift between a zooplankton-dominated diet to one primarily based on fish and shrimp, consumption is expected to quickly rise in the short term, with important implications for the development of management strategies of commercial stocks such as the GSL northern shrimp. Apart from the impact on juvenile redfish and northern shrimp, the large redfish will also be expected to affect other pelagic prey such as pink glass shrimp and capelin (also a commercial species), with unknown consequences to the ecosystem for these important forage species to other predators such as Greenland halibut, Atlantic cod, marine mammals and seabirds.
Northern shrimp is an important prey for several other groundfish species besides redfish. Stomach content data collected between 2015–2017 in the GSL revealed that the contribution of northern shrimp and pink glass shrimp was important for medium-sized Greenland halibut (20–40 cm), Atlantic cod (30–55 cm) and white hake (< 35 cm) (Ouellette-Plante et al., 2020). The increased predation pressure on shrimp linked to the surge in large redfish biomass could result in competition interactions that will be detrimental to the condition and growth of several other large fish species. Greenland halibut currently constitutes an important valuable groundfish fishery in the GSL, and the rebuilding Atlantic cod stock in the northern GSL is also characterised by high cultural and commercial importance. In the GSL, white hake has experienced a past collapse and was conferred a “threatened” status by the Committee on the Status of Endangered Wildlife in Canada (COSEWIC) in 2013. Through competition for northern shrimp, redfish could thus contribute to the current ecosystem shift by impacting other commercially important and threatened groundfish species. These considerations should be explored further by modelling shrimp consumption and population dynamics under various redfish predation intensity scenarios and considered in the current efforts of developing ecosystem-based approaches to fishery management in the GSL.
The raw data supporting the conclusions of this article will be made available by the authors, without undue reservation.
Ethical review and approval was not required because the study was conducted in the field using animals killed during surveys.
All authors conceived the project objectives and methodology. DC designed and initiated the stomach collection program and the database. SB-V and CN analysed many of the stomach content. SB-V, DC, and RT conducted the data analyses. SB-V wrote the first draft of the manuscript. All authors have contributed to the revision and improvements of the manuscript and take responsibility for its content. All authors contributed to the article and approved the submitted version.
This project was part of the partnership program “Return of groundfish in the Estuary and Northern Gulf of St. Lawrence”, co-funded by Fisheries and Oceans Canada (DFO) and Ressources Aquatiques Québec (RAQ), a strategic research network funded by the Fonds de recherche du Québec – Nature et technologies (FRQNT). Funds for the stomach sampling program of the 1990s were granted to DC by DFO. DR was supported by the Canada Research Chair program. SB-V was supported by a Réseau Québec Maritime excellence scholarship.
We are grateful to all participants who helped with sample collection, laboratory analysis of stomach contents and prey identifications. We would also like to extend our thanks to crews of the Canadian Coast Guard’s scientific research vessels. We also thank C. Senay and J. Ouellette-Plante whose comments helped improve this manuscript.
The authors declare that the research was conducted in the absence of any commercial or financial relationships that could be construed as a potential conflict of interest.
All claims expressed in this article are solely those of the authors and do not necessarily represent those of their affiliated organizations, or those of the publisher, the editors and the reviewers. Any product that may be evaluated in this article, or claim that may be made by its manufacturer, is not guaranteed or endorsed by the publisher.
The Supplementary Material for this article can be found online at: https://www.frontiersin.org/articles/10.3389/fmars.2022.963039/full#supplementary-material
Ahlbeck I., Hansson S., Hjerne O. (2012). Evaluating fish diet analysis methods by individual-based modelling. Can. J. Fisheries. Aquat. Sci.69 (7), 1184–1201. doi: 10.1139/f2012-051
Albikovskaya L. K., Gerasimova O. V. (1993). Food and feeding patterns of cod (Gadus morhua l.) and beaked redfish (Sebastes mentella travin) on Flemish cap Vol. 19 NAFO Scientific Council Studies 19, 31–39.
Amundsen P. A., Gabler H. M., Staldvik F. J. (1996). A new approach to graphical analysis of feeding strategy from stomach contents data - modification of the Costello, (1990) method. J. fish. Biol.48 (4), 607–614. doi: 10.1111/j.1095-8649.1996.tb01455.x
Amundsen P. A., Sánchez-Hernández J. (2019). Feeding studies take guts - critical review and recommendations of methods for stomach contents analysis in fish. J. fish. Biol.95 (6), 1364–1373. doi: 10.1111/jfb.14151
Anderson M. J. (2014). Permutational multivariate analysis of variance (PERMANOVA) (Wiley statsref: statistics reference online), 1–15. Wiley StatsRef: Statistics Reference Online, 10.1002/9781118445112.stat07841
Arditi R., Ginzburg L. R. (2012). How species interact: altering the standard view on trophic ecology (Oxford University Press, Oxford).
Baker R., Buckland A., Sheaves M. (2014). Fish gut content analysis: robust measures of diet composition. Fish. Fisheries.15 (1), 170–177. doi: 10.1111/faf.12026
Bernier B., Chabot D. (2012). Assessment of Greenland halibut (Reinhardtius hippoglossoides) stock status in the gulf of st. Lawrence (4RST) in 2010 and diet description for this population (Canadian Science Advisory Secretariat) DFO Canadian Science Advisory Secretariat Research Document, 140. viii +85 p.
Blais M., Galbraith P. S., Plourde S., Devine L., Lehoux C. (2021). Chemical and biological oceanographic conditions in the estuary and gulf of st. Lawrence during 2019 (Canadian Science Advisory Secretariat Research Document) DFO Canadian Science Advisory Secretariat Research Document, iv + 66 p.
Bourdages H., Brassard C., Desgagnés M., Galbraith P., Gauthier J., Isabel L., et al. (2021). Preliminary results from the ecosystemic survey in august 2020 in the estuary and northern gulf of st. Lawrence (Canadian Science Advisory Secretariat Research Document) DFO Canadian Science Advisory Secretariat Research Document, iv + 93 p.
Bourdages H., Brassard C., Desgagnés M., Galbraith P., Gauthier J., Légaré B., et al. (2017). Preliminary results from the groundfish and shrimp multidisciplinary survey in august 2016 in the estuary and northern gulf of st. Lawrence (Canadian Science Advisory Secretariat Research Document) DFO Canadian Science Advisory Secretariat Research Document, v + 87 p.
Bourdages H., Brassard C., Desgagnés M., Galbraith P., Gauthier J., Nozères C., et al. (2020b). Preliminary results from the ecosystemic survey in august 2019 in the estuary and northern gulf of st. Lawrence (Canadian Science Advisory Secretariat Research Document) DFO Canadian Science Advisory Secretariat Research Document, iv + 93.
Bourdages H., Marquis M. C., Ouellette-Plante J., Chabot D., Galbraith P., Isabel L. (2020a). Assessment of northern shrimp stocks in the estuary and gulf of st. Lawrence in 2019: commercial fishery and research survey data (Canadian Science Advisory Secretariat Research Document) DFO Canadian Science Advisory Secretariat Research Document, xiii + 155 p.
Bourdages H., Savard L., Archambault D., Valois S. (2007). Results from the august 2004 and 2005 comparative fishing experiments in the northern gulf of st. Lawrence between the CCGS Alfred needler and the CCGS teleost (Canadian Technical Report of Fisheries and Aquatic Sciences) DFO Canadian Technical Report of Fisheries and Aquatic Sciences, ix + 57 p.
Braga R. R., Bornatowski H., Vitule J. R. S. (2012). Feeding ecology of fishes: an overview of worldwide publications. Rev. Fish. Biol. Fisheries.22 (4), 915–929. doi: 10.1007/s11160-012-9273-7
Brassard C., Bourdages H., Duplisea D., Gauthier J., Valentin A. (2017). The status of the redfish stocks (Sebastes fasciatus and s. mentella) in unit 1 (Gulf of st. Lawrence) in 2015 (Canadian Science Advisory Secretariat Research Document), ix + 53 p.
Brêthes J. C. (1998). The Canadian Atlantic groundfish experience and the constraints to the concervation of fisheries resources: a perspective. Ocean. Coast. Manage. 39, 135–150. doi: 10.1016/S0964-5691(98)00020-9
Brosset P., Bourdages H., Blais M., Scarratt M., Plourde S. (2019). Local environment affecting northern shrimp recruitment: a comparative study of gulf of st. Lawrence stocks. ICES. J. Mar. Sci. 76 (4), 974–986. doi: 10.1093/icesjms/fsy185
Brown S. C., Bizzarro J. J., Cailliet G. M., Ebert D. A. (2012). Breaking with tradition: Redefining measures for diet description with a case study of the Aleutian skate Bathyraja aleutica (Gilbert 1896). Environ. Biol. Fishes. 95, 3–20. doi: 10.1007/s10641-011-9959-z
Buckley T. W., Whitehouse G. A. (2017). Variation in the diet of Arctic cod (Boreogadus saida) in the pacific Arctic and Bering Sea. Environ. Biol. Fishes. 100 (4), 421–442. doi: 10.1007/s10641-016-0562-1
Cadrin S. X., Bernreuther M., Daníelsdóttir A. K., Hjörleifsson E., Johansen T., Kerr L., et al. (2010). Population structure of beaked redfish, Sebastes mentella: evidence of divergence associated with different habitats. ICES. J. Mar. Sci.67 (8), 1617–1630. doi: 10.1093/icesjms/fsq046
Campana S. E. (2004). Photographic atlas of fish otoliths of the Northwest Atlantic ocean (No. 133) (NRC Research Press Canadian Special Publication of Fisheries and Aquatic Sciences).
Chabot D., Rondeau A., Sainte-Marie B., Savard L., Surette T., Archambault P. (2007). Distribution of benthic invertebrates in the estuary and gulf of st. Lawrence (DFO Canadian Science Advisory Secretariat Research Document) vii+108p.
Chipps S. R., Garvey J. E. (2006). Assessment of food habits and feeding patterns. analysis and interpretation of freshwater fisheries data (Bethesda: American Fisheries Society).
Clarke K. R. (1993). Non-parametric multivariate analyses of changes in the community structure. Aust. J. Ecol.18, 117–143. doi: 10.1111/j.1442-9993.1993.tb00438.x
Cook A. M., Bundy A. (2010). The food habits database: an update, determination of sampling adequacy and estimation of diet for key species. DFO Canadian Technical Report of Fisheries and Aquatic Sciences, 2884
Costello M. J. (1990). Predator feeding strategy and prey importance: a new graphical analysis. J. fish. Biol.36 (2), 261–263. doi: 10.1111/j.1095-8649.1990.tb05601.x
Crowder L., Norse E. (2008). Essential ecological insights for marine ecosystem-based management and marine spatial planning. Mar. Policy32 (5), 772–778. doi: 10.1016/j.marpol.2008.03.012
Descroix A., Harvey M., Roy S., Galbraith P. S. (2005). Macrozooplankton community patterns driven by water circulation in the st. Lawrence marine system, Canada. Mar. Ecol. Prog. Ser.302, 103–119. doi: 10.3354/meps302103
Devine L., Scarratt M., Plourde S., Galbraith P. S., Michaud S., Lehoux C. (2017). Chemical and biological oceanographic conditions in the estuary and gulf of st. Lawrence during 2015 (Canadian Science Advisory Secretariat Research Document) DFO Canadian Science Advisory Secretariat Research Document, v + 48 pp.
DFO (2020). Redfish (Sebastes mentella and s. fasciatus) stocks assessment in units 1 and 2 in 2019 (Canadian Science Advisory Secretariat Report) DFO Canadian Science Advisory Secretariat Research Document, viii + 61p
Dolgov A. V., Drevetnyak K. V. (2011). Feeding of three species from the genus sebastes in the barents Sea ICES Conference and Meeting, A, 26.
Dufour R., Ouellet P. (2007). Estuary and gulf of st. Lawrence marine ecosystem overview and assessment report (Canadian Technical Report of Fisheries and Aquatic Sciences) DFO Canadian Technical Report of Fisheries and Aquatic Sciences, vii + 112 p.
Dwyer K. S., Buren A., Koen-Alonso M. (2010). Greenland Halibut diet in the Northwest Atlantic from 1978 to 2003 as an indicator of ecosystem change. J. Sea. Res.64 (4), 436–445. doi: 10.1016/j.seares.2010.04.006
Fahrig L., Lilly G. R., Miller D. S. (1993). Predator stomachs as sampling tools for prey distribution: Atlantic cod (Gadus morhua) and capelin (Mallotus villosus). Can. J. Fisheries. Aquat. Sci. 50 (7), 1541–1547. doi: 10.1139/f93-175
Ferry L. A., Cailliet G. M. (1996). “Sample size and data analysis: Are we characterizing and comparing diet properly?,” in Feeding ecology and nutrition in fish symposium proceedings (pp. 71–80). Eds. Mackinlay D., Shearer K. (San Francisco, CA: American Fisheries Society). doi: 10.1007/978-0-387-72825-4
Froese R., Pauly D. (2022). FishBase (World Wide Web electronic publication). Available at: www.fishbase.org.
Galbraith P. S., Chassé J., Caverhill C., Nicot P., Gilbert D., Lefaivre D., et al. (2019). Physical oceanographic conditions in the gulf of st. Lawrence during 2018 (DFO Canadian Science Advisory Secretariat Research Document), iv + 79 p.
Gascon D. (2003). Redfish multidisciplinary research zonal progra-1998) (Mont-Joli, Québec: Fisheries and Oceans).
Glaser S. M., Waechter K. E., Bransome N. C. (2015). Through the stomach of a predator: regional patterns of forage in the diet of albacore tuna in the California current system and metrics needed for ecosystem-based management. J. Mar. Syst. 146, 38–49. doi: 10.1016/j.jmarsys.2014.07.019
González C., Bruno I., Paz X. (2000). Food and feeding of deep-sea redfish (Sebastes mentella travin) in the north Atlantic Science Council Research Document,NAFO 33, 89–101.
Hanson J. M., Chouinard G. A. (2002). Diet of Atlantic cod in the southern gulf of St Lawrence as an index of ecosystem chang–2000. J. Fish. Biol. 60 (4), 902–922. doi: 10.1111/j.1095-8649.2002.tb02417.x
Harvey M., Devine L. (2009). Oceanographic conditions in the estuary and the gulf of st. Lawrence during 2008: zooplankton (DFO Canadian Science Advisory Secretariat Research Document), vi + 54 p.
Harvey M., St.-Pierre J.-F., Devine L., Gagné A., Gagnon Y., Beaulieu M. F. (2004). Oceanographic conditions in the estuary and the gulf of st. Lawrence during 2003: zooplankton (DFO Canadian Science Advisory Secretariat Research Document), 31 p.
Hovde S. C., Albert O. T., Nilssen E. M. (2002). Spatial, seasonal and ontogenetic variation in diet of northeast Arctic Greenland halibut (Reinhardtius hippoglossoides). ICES. J. Mar. Sci. 59 (2), 421–437. doi: 10.1006/jmsc.2002.1171
Hyslop E. J. (1980). Stomach contents analysis - a review of methods and their application. J. fish. Biol. 17 (4), 411–429. doi: 10.1111/j.1095-8649.1980.tb02775.x
ICES (2014). “Index for ICES identification leaflets for plankton,” in ICES identification leaflets for plankton. doi: 10.17895/ices.pub.18705005.v2
Jarvis E. T., Lowe C. G. (2008). The effects of barotrauma on the catch-and-release survival of southern California nearshore and shelf rockfish (Scorpaenidae, Sebastes spp.). Can. J. Fisheries. Aquat. Sci. 65 (7), 1286–1296. doi: 10.1139/F08-071
Kassambara A. (2020). Ggpubr: 'ggplot2' based publication ready plots. R package version 0.1, 6. r. Available online: https://cran.r-project.org/web/packages/ggpubr/index.html
Koeller P., Fuentes-Yaco C., Platt T., Sathyendranath S., Richards A., Ouellet P., et al. (2009). Basin-scale coherence in phenology of shrimp and phytoplankton in the north Atlantic ocean. Science 324 (5928), 791–793. doi: 10.1126/science.1170987
Koutitonsky V. G., Bugden G. L. (1991). “The physical oceanography of the gulf of St Lawrence: a review with emphasis on the synoptic variability of the motion,” in The gulf of St Lawrence: Small ocean or big estuary?, vol. 113 . Ed. Therriault J.-C. Canadian Special Publication of Fisheries and Aquatic Sciences,.113, 57–90
Kraft A., Nöthig E. M., Bauerfeind E., Wildish D. J., Pohle G. W., Bathmann U. V., et al. (2013). First evidence of reproductive success in a southern invader indicates possible community shifts among Arctic zooplankton. Mar. Ecol. Prog. Ser. 493, 291–296. doi: 10.3354/meps10507
Lambert D. G. (1960). The food of the redfish Sebastes marinus (L.) in the Newfoundland area. J. Fisheries. Board. Canada. 17 (2), 235–243. doi: 10.1139/f60-019
Lilly G. R., Fleming A. M. (1981). Size relationships in predation by Atlantic cod, gadus morhua, on capelin, mallotus villosus, and sand lance, ammodytes dublus, in the Newfoundland area Vol. 1 NAFO Scientific Council Studies, 41–45.
Link J. S. (2004). Using fish stomachs as samplers of the benthos: integrating long-term and broad scales. Mar. Ecol. Prog. Ser. 269, 265–275. doi: 10.3354/meps269265
McQuinn I. H., Plourde S., Pierre J. F. S., Dion M. (2015). Spatial and temporal variations in the abundance, distribution, and aggregation of krill (Thysanoessa raschii and Meganyctiphanes norvegica) in the lower estuary and gulf of st. Lawrence. Prog. Oceanograp.131, 159–176. doi: 10.1016/j.pocean.2014.12.014
Mucci A., Starr M., Gilbert D., Sundby B. (2011). Acidification of lower st. Lawrence estuary bottom waters. Atmosphere-Ocean 49 (3), 206–218. doi: 10.1080/07055900.2011.599265
Murawski S. (1997). “Groundfish stocks and the fishing industry,” in Northwest Atlantic Groundfish: Perspectives on a fishery collapse, Northwest Atlantic Groundfish: Perspectives on a Fishery Collapse. American Fisheries Society 27–70.
Oksanen J., Blanchet F. G., Friendly M., Kindt R., Legendre P., McGlinn D., et al. (2019) Vegan: Community ecology package. r package version 2.5-6. Available at: https://CRAN.R-project.org/package=vegan.
Orr D. C., Bowering W. R. (1997). A multivariate analysis of food and feeding trends among Greenland halibut (Reinhardtius hippoglossoides) sampled in Davis strait, during 1986. ICES. J. Mar. Sci. 54 (5), 819–829. doi: 10.1006/jmsc.1996.0198
Ouellet P., Savard L., Larouche P. (2007). Spring oceanographic conditions and northern shrimp pandalus borealis recruitment success in the north-western gulf of st. Lawrence. Mar. Ecol. Prog. Ser. 339, 229–241. doi: 10.3354/meps339229
Ouellette-Plante J., Chabot D., Nozères C., Bourdages H. (2020). Diets of demersal fish from the CCGS teleost ecosystemic surveys in the estuary and northern gulf of st. Lawrence, august 2015-2017 Vol. 3383 DFO Canadian Technical Report of Fisheries and Aquatic Sciences, 3383, v + 121 p.
Planque B., Kristinsson K., Astakhov A., Bernreuther M., Bethke E., Drevetnyak K., et al. (2013). Monitoring beaked redfish (Sebastes mentella) in the north Atlantic, current challenges and future prospects. Aquat. Living. Resour. 26 (4), 293–306. doi: 10.1051/alr/2013062
Plourde S., Joly P., Runge J. A., Dodson J., Zakardjian B. (2003). Life cycle of calanus hyperboreus in the lower st. Lawrence estuary and its relationship to local environmental conditions. Mar. Ecol. Prog. Ser. 255, 219–233. doi: 10.3354/meps255219
R Core Team (2020). R: A language and environment for statistical computing (Vienna, Austria: R Foundation for Statistical Computing). Available at: https://www.R-project.org/.
Rodrigues C. G., Ceman J. A., Vilks G. (1993). Late quaternary paleoceanography of deep and intermediate water masses off gaspé peninsula, gulf of st. Lawrence: foraminiferal evidence. Can. J. Earth Sci. 30 (7), 1390–1403. doi: 10.1139/e93-120
Sánchez-Hernández J., Nunn A. D., Adams C. E., Amundsen P. A. (2019). Causes and consequences of ontogenetic dietary shifts: a global synthesis using fish models. Biol. Rev.94 (2), 539–554. doi: 10.1111/brv.12468
Savard L., Nozères C. (2012). Atlas of shrimp species of the estuary and northern gulf of st. Lawrence Vol. 3007 DFO Canadian Technical Report of Fisheries and Aquatic Sciences, 3007, vi + 67 p.
Savenkoff C., Savard L., Morin B., Chabot D. (2006). Main prey and predators of northern shrimp (Pandalus borealis) in the northern gulf of st. Lawrence during the mid-1980s, mid-1990s, and early 2000s Vol. 2639 DFO Canadian Technical Report of Fisheries and Aquatic Sciences, 2639, v + 28 pp.
Senay C., Gauthier J., Bourdages H., Brassard C., Duplisea D., Ouellette-Plante J. (2019). Redfish (Sebastes mentella and s. fasciatus) stocks status in unit 1 in 2017 (Ottawa, ON: Canadian Science Advisory Secretariat).
Senay C., Ouellette-Plante J., Bourdages H., Bermingham T., Gauthier J., Parent G., et al. (2021). Unit 1 redfish (Sebastes mentella and s. fasciatus) stock status in 2019 and updated information on population structure, biology, ecology, and current fishery closures DFO Canadian Science Advisory Secretariat Research Document, xi + 119 p.
Squires H. J. (1990). Decapod Crustacea of the Atlantic coast of Canada Vol. 221 Canadian Bulletin of Fisheries and Aquatic Sciences, 221, 1–532.
Starr M., Harvey M., Galbraith P. S., Gilbert D., Chabot D., Therriault J. C. (2002). Recent intrusion of Labrador shelf waters into the gulf of st. Lawrence and its influence on the plankton community and higher trophic levels Int. Counc. Explor. Sea (ICES) CM 2002/N, 16
Steele D. H. (1957). The redfish (Sebastes marinus l.) in the western gulf of st. Lawrence. J. Fisheries. Board. Canada. 14 (6), 899–924. doi: 10.1139/f57-038
Templeman W., Ricker W. E., Carter N. M. (1959). Redfish distribution in the north Atlantic (Fisheries Research Board of Canada). 120, 1–173.
Therriault J.-C. (1991). “The gulf of st. Lawrence: Small ocean or big estuary?,” in Canadian Special publication of fisheries and aquatic sciences DFO Canadian Special publication of fisheries and aquatic sciences, No. 113.
Vassilenko S. V., Petryashov V. V. (2009). Illustrated keys to free-living invertebrates of Eurasian Arctic seas and adjacent deep waters, vol. 1. rotifera, pycnogonida, cirripedia, leptostraca, mysidacea, hyperiidea, caprellidea, euphausiasea, dendrobranchiata, pleocyemata, anomura, and brachyura (Alaska Sea Grant: University of Alaska Fairbanks).
Wickham H. (2011). The split-Apply-Combine strategy for data analysis. J. Stat. Software. 40 (1), 1–29. doi: 10.18637/jss.v040.i01
Keywords: fullness index, stomach content, shrimp, temporal changes, trophic impact
Citation: Brown-Vuillemin S, Chabot D, Nozères C, Tremblay R, Sirois P and Robert D (2022) Diet composition of redfish (Sebastes sp.) during periods of population collapse and massive resurgence in the Gulf of St. Lawrence. Front. Mar. Sci. 9:963039. doi: 10.3389/fmars.2022.963039
Received: 07 June 2022; Accepted: 12 July 2022;
Published: 05 August 2022.
Edited by:
Miquel Planas, Institute of Marine Research (CSIC), SpainReviewed by:
George Minos, International Hellenic University, GreeceCopyright © 2022 Brown-Vuillemin, Chabot, Nozères, Tremblay, Sirois and Robert. This is an open-access article distributed under the terms of the Creative Commons Attribution License (CC BY). The use, distribution or reproduction in other forums is permitted, provided the original author(s) and the copyright owner(s) are credited and that the original publication in this journal is cited, in accordance with accepted academic practice. No use, distribution or reproduction is permitted which does not comply with these terms.
*Correspondence: Sarah Brown-Vuillemin, c2FyYWguYnJvd24tdnVpbGxlbWluQHVxYXIuY2E=
Disclaimer: All claims expressed in this article are solely those of the authors and do not necessarily represent those of their affiliated organizations, or those of the publisher, the editors and the reviewers. Any product that may be evaluated in this article or claim that may be made by its manufacturer is not guaranteed or endorsed by the publisher.
Research integrity at Frontiers
Learn more about the work of our research integrity team to safeguard the quality of each article we publish.