 Ri Jin Jiang1,2,3†
 Fan Yang1,2,3,4†
 Feng Chen1,2,3*Rui Yin1,2,3
 Ming Zhi Liu1,2,3,4Wen Bin Zhu1,2,3Ai Guo1,2,3
 Lian Wei Liu1,2,3
- 1Zhejiang Marine Fisheries Research Institute, Zhoushan, China
- 2Scientific Observation and Experimental Station of Fishery Resources of Key Fishing Grounds, Ministry of Agriculture and Rural Affairs of the People’s Republic of China, Zhoushan, China
- 3Key Laboratory of Sustainable Utilization of Technology Research for Fishery Resources of Zhejiang Province, Zhoushan, China
- 4Marine and Fisheries Institute, Zhejiang Ocean University, Zhoushan, China
Trophic research is essential to the conservation and management of fishery resources. This study analyzed the feeding habits and nutritional interactions among three tuna species in the waters of the Solomon Islands (5°12′S–15°20′S, 157°31′E–172°19′E). A total of 103 bigeye tuna (Thunnus obesus), 296 yellowfin tuna (Thunnus albacores), and 264 albacore tuna (Thunnus alalunga) samples were collected from September to December 2019. Samples for stomach content and stable isotope analysis were randomly selected. The stomach content analysis results showed that the stomach contents of the three tuna species were rich in prey, and 48 prey species were identified, including fish, cephalopods, and crustaceans, with high between-phenotype component (BPC). Yellowfin tuna consumed the largest variety of food and bigeye tuna consumed the smallest. The feeding intensity of bigeye tuna were higher than that of yellowfin and albacore tuna. Yellowfin tuna had the highest empty stomach rate (35.69%) and lowest average stomach fullness index (0.064). The degree of stomach fullness in the three tuna species was mainly 1, and the difference in the stomach fullness index among them was significant (P<0.001). Food overlap (0.3–0.6) and Levins index (<0.6) among the three species were low, indicating a specialized feeding tendency. Bigeye tuna mainly feed on Ommastrephes bartrami and Myctophidae, yellowfin tuna mainly feed on Hyperiidea and Aluterus monoceros, and albacore tuna mainly feed on Gempylus serpens and Loligo chinensis. The stable isotope results showed that the δ13C and δ15N values of the three tuna species were significant (P<0.001). The standard ellipse area corrected for small sample sizes (SEAc) and total niche area (TA) of bigeye tuna, range of δ15N (NR) of yellowfin tuna, and range of δ13C (CR) of albacore tuna were the highest. The results of this study will help improve our understanding of the feeding ecology of these three tuna species and their important roles in the ecosystem and food web structure.
Introduction
Trophic research is an important part of ecosystem conservation and comprehensive assessment of marine living resources (Martins et al., 2021). Feeding is an important component of this process. Through feeding research, we can understand the trophic relationships and functional roles of species in ecosystems (Willson et al., 2010). Understanding the feeding habits of large pelagic fish, such as tuna and other top predators, is important for modeling nutrient relationships and understanding the dynamics of marine ecosystems (Albuquerque et al., 2019). As top predators, tuna occupy a high trophic level in oceanic ecosystems (Zhu et al., 2008b). They can control the resource and population changes of prey organisms at all trophic levels through the top-down effect, thereby affecting the entire marine ecosystem and food web.
Stomach content analysis is commonly used to quantify fish food types and the distribution of resources among predators, as it allows visualizing the food composition of a species (Braga et al., 2012). However, the results of stomach contents analysis can represent only the instantaneous feeding situation of predators (Gee, 1989). The stable carbon and nitrogen isotopes of fish muscle can preserve dietary information for a long time, and the similarity between δ13C from fish muscle and that of prey organisms can provide information about food sources (Peterson and Fry, 1987). The enrichment effect of δ15N between adjacent trophic levels is approximately 3–4‰ and can be used to estimate the trophic levels of organisms (Caut et al., 2009). In addition, a series of multivariate statistical indicators developed based on the ratio of stable carbon and nitrogen isotopes provide an important means for comparing the breadth overlap of trophic niche between species and identifying trophic relationships (Jackson et al., 2011). Niche Cait measures how well a species uses resources (Crozier, 1985), while niche overlap can reflect species’ competition for prey (Zhang et al., 2010). The combination of these two methods facilitates better research on food webs (Peterson and Fry, 1987) and is, therefore, used worldwide (Tripp-Valdez et al., 2015; Wang et al., 2021).
The Solomon Islands (5°–15°S, 154°–174°E), located in the central and western Pacific Ocean, are a large archipelago comprising 992 islands (Denley et al., 2020). The islands have an area of 28,370 km2, a coastline of 4,270 km, and an exclusive economic zone of 1.34 million km2. In addition, the islands are surrounded by 1,325 km2 of marine protected areas, including 113 km2 of coral reefs. Archipelagos are of unique importance to the surrounding marine environment, with an uninterrupted abundance of plankton that attract gatherings of marine life due to the perennial circulation of ocean currents. They are rich in marine resources that provide a variety of food types and habitats for numerous predators and are a part of the migration routes of highly migratory species such as tuna (White et al., 2014).
In the waters surrounding the Solomon Islands, we observed three tuna species: bigeye tuna (Thunnus obesus), yellowfin tuna (Thunnus albacores), and albacore (Thunnus alalunga). These warm-water migratory fishes are widely distributed in the tropical and subtropical waters of the Atlantic, Pacific, and Indian Oceans, of which the Pacific Ocean has most abundant tuna resources (Shi et al., 2022). The Solomon Islands mainly fall under FAO’s Region 71. According to data from the FAO website (https://www.fao.org/fishery/en/facp/slb?lang=en), the total annual catch of tuna in the region is over 1.4 million tons, accounting for approximately 38% of the world’s major tuna (Thunnus alalunga, Thunnus obesus, Katsuwonus pelamis, and Thunnus albacores) production, the highest among the world’s fisheries and FAO fisheries regions. Solomon tuna is mainly caught using longlines, purse seines, and bait boats. In recent years, the production has remained between 39,000 and 67,000 tons, with an average output of 55,000 tons. In 2019, the tuna production reached an all-time high of 67,000 tons, of which more than 85% was caught using purse seines.
To understand the food composition of tuna diets, the feeding ecology of these predators has been studied in the Atlantic, Pacific, and Indian Oceans (King and Ikehara, 1956; Moteki et al., 2001; Zhu et al., 2007). Studies have shown that they are opportunistic, feeding mainly on fish, cephalopods, and crustaceans. However, no studies have been conducted specifically on tuna feeding in the waters of the Solomon Islands. Therefore, to explore the feeding situations and nutritional relationships of tuna species in this area, tuna samples were collected from the waters of the Solomon Islands from September to December 2019. A preliminary study of food diversity was conducted, and the nutrient relationships between them were quantitatively analyzed using stomach content analysis data and carbon and nitrogen stable isotope data. This study fills a gap in nutritional knowledge regarding important fishery resources around the Solomon Islands and can inform further assessment, conservation, and management of fishery resources.
Materials and methods
Sample collection
The tuna samples were collected by a Chinese longline tuna fishing boat that operated in the waters of the Exclusive Economic Zone (5°12′S–15°20′S, 157°31′E–172°19′E) of the Solomon Islands from September to December 2019. Sampling sites are shown in Figure 1. Biological data of three tuna species are shown in Table 1. For ease of description, an abbreviation is used for each tuna species, BET (Thunnus obesus),YFT (Thunnus albacores), and LFT (Thunnus alalunga).
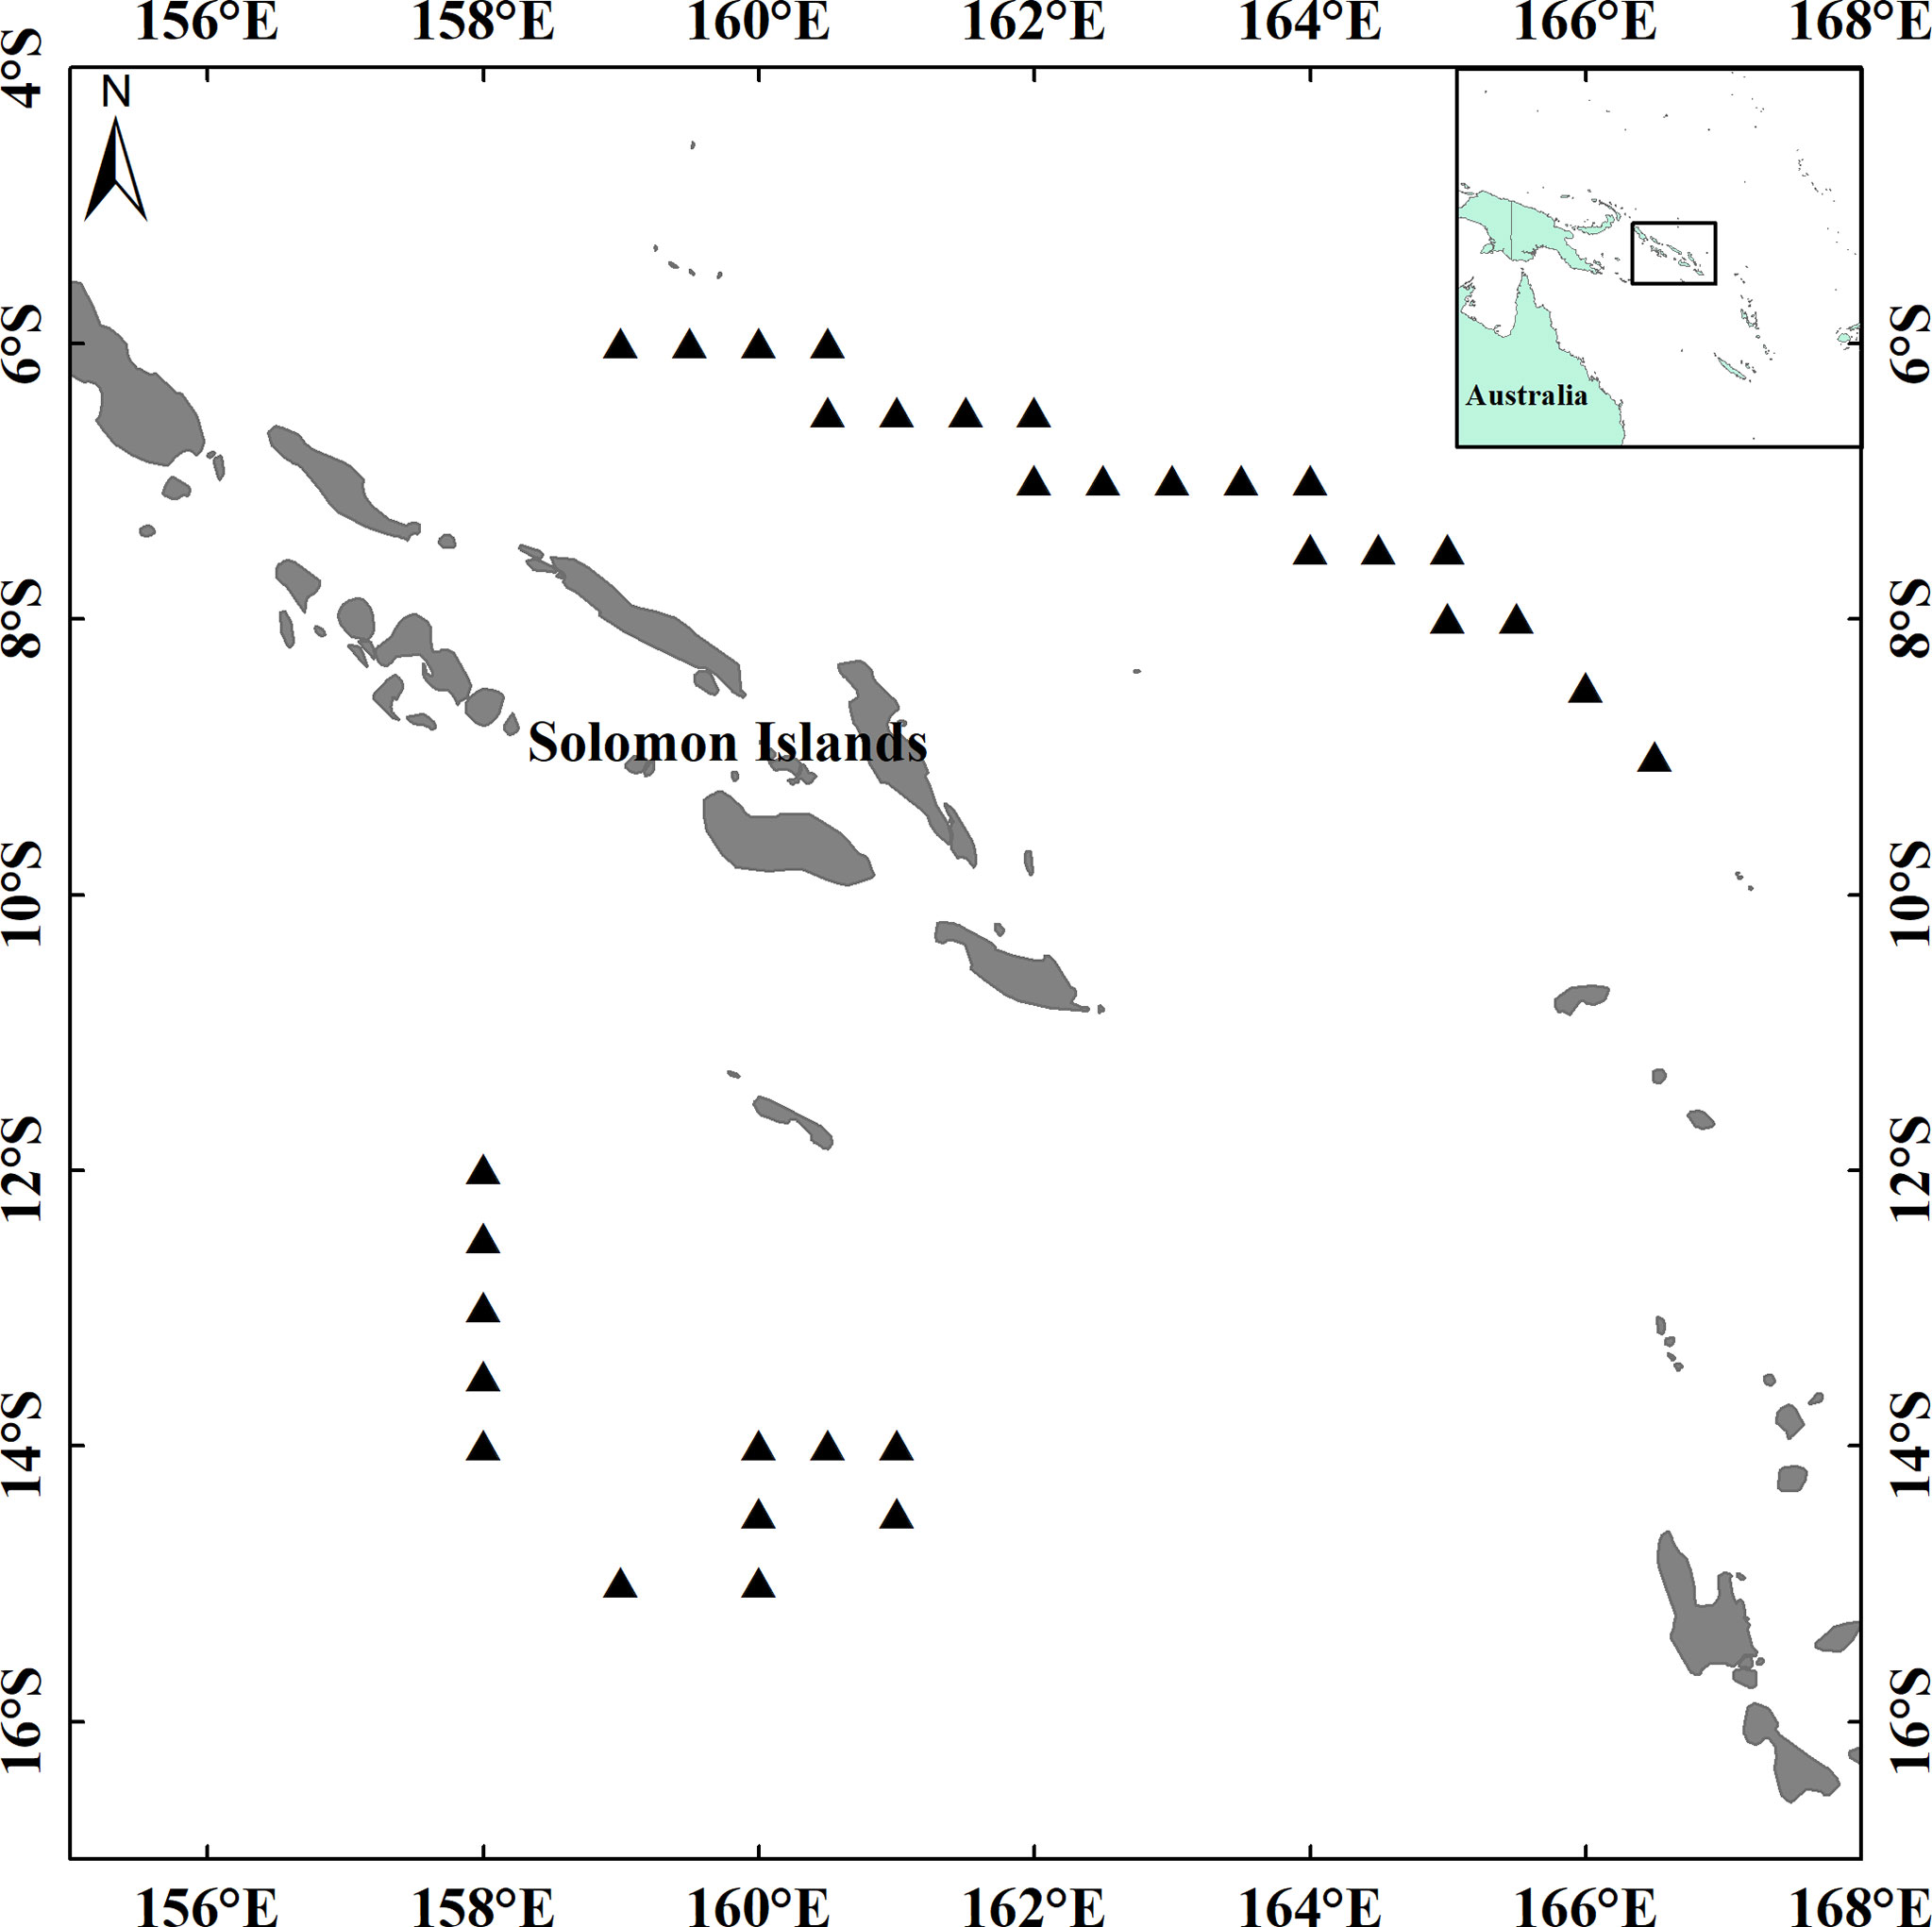
Figure 1 Sampling locations.
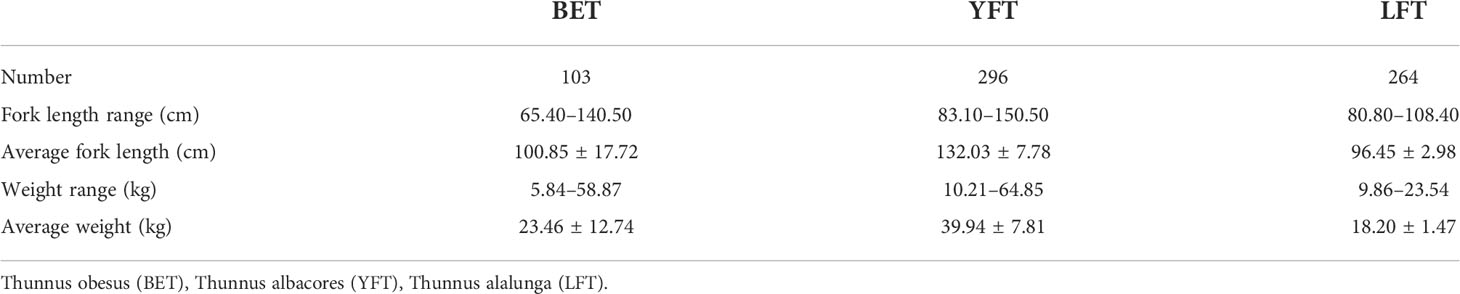
Table 1 Biological data for three species of tuna.
Biological assay
Biological data including body length (cm), fork length (cm), and body weight (kg) of the tuna were measured on-site. According to the size, some tuna were randomly selected for stomach content analysis and stable isotope analysis, and the pure body weight (kg) and stomach weight (g) were measured. The degree of stomach filling was divided into five grades, ranging from 0 to 4. The grades 0–4 were: 0 (empty stomach); 1 (there is a small amount of food in the stomach, its volume does not exceed half of the stomach cavity); 2 (more food in the stomach, its volume is more than half of the stomach cavity); 3 (the stomach is full of food, but the stomach wall is not inflated); 4 (the stomach is full of food, and the stomach wall expands and becomes thin). The stomach and back muscles of the tuna were dissected out and packaged separately, then stored frozen at −20°C until subsequent identification of prey species and stable isotope determination. Prey were divided into broad categories (fish, cephalopods, and crustaceans) and the FishBase (Froese and Pauly, 2022) and the book by Kent and Volker (2001) were used to determine species names. Undigested and partially digested prey were counted and weighed. Partially digested prey were grouped into broad categories (e.g., fish) and weighed using a Mettler Toledo PL403 electronic balance with a precision of 0.001 g. Before weighing, the surface of the prey was dried using paper towels to ensure it was free of moisture. Undigested prey were identified and counted using a Nikon SMZ-2000 dissecting microscope. The corrected mass (average mass of intact prey individuals) was calculated for partially or fully digested prey.
Data analysis
To determine the contribution of each prey organism to the diet composition of tuna, the following metrics were used: weight percentage (W%), numerical abundance (N%), frequency of occurrence (FO%) (Hyslop, 1980), and the index percentage of relative importance (IRI%) (Pinkas, 1971), which reduces bias in descriptions of animal dietary data. Because Sardinella zunas are used as bait in longline fishing, the data for this genus were excluded when calculating the importance of prey. These metrics were calculated as follows:
A strong correlation exists between the stomach content weight and body length of fish, which can be expressed by the fullness index; therefore, the fullness index can be used to determine the feeding status of fish (Wang et al., 2013). The proportion of different feeding grades in the stomach can also reflect the feeding status. The empty stomach rate is the proportion of grade 0. The empty stomach rate index and the fullness index (Figueiredo et al., 2005) can comprehensively reflect the feeding status of fish (Zhu et al., 2008). The formula used is as follows:
The trophic niche range of tuna was calculated using the Levins index, whereby a value of<0.6 indicates that the predator selected a small group of prey, and a value closer to 1 (>0.6) indicates that the predator has a wide range of food sources. The Levins index is calculated as follows:
where Pxi is the proportion of predator x ingesting prey organism i, expressed as a percentage (N%), and n is the number of species of prey organisms that can be ingested (Feinsinger et al., 1981).
To determine the niche overlap, Pianka’s niche overlap index (Oij) was calculated as follows:
where Pik is the weight percentage of prey i in the food composition of predator k, s is all prey types consumed by the three tuna species, and the variation range of Oijis 0–1. The larger the value, the higher the degree of overlap. Oij >0.3 indicates a small degree of overlap, and Oij >0.6 indicates significant overlap (Krebs, 1999).
Amundsen et al. (1996) improved the graphic method proposed by Costello (1990) for the ecological study of feeding. The feeding strategy graph was formed by taking the occurrence frequency of prey Fias the abscissa and the abundance of a specific prey Pi as the ordinate. The feeding strategies of the three tuna species are visually displayed according to the scatter positions in Figure 3. Along the vertical axis, the top denotes a narrow eating strategy, and the bottom denotes a broad eating strategy. Along the horizontal axis, the lower left corner represents the non-important or rare prey, and the upper right corner represents the important prey. The upper left corner represents a high between-phenotype component (BPC), and the lower right corner represents a high within-phenotype component (WPC). The formula for calculating the abundance of specific prey is as follows:
where Piis the abundance of specific prey, Si is the weight of prey i in the stomach contents, and Sti is the weight of the stomach contents of individuals with prey i in their stomach.
Stable isotope analysis
The back muscle tissue extracted from tuna was washed with distilled water, wrapped with tin foil, dried in an Alpha 1-2LDplus freeze dryer (Beijing BMH Instruments Co. Ltd., Shanghai, China) for 24 h, and thoroughly ground. The sample powder was placed in a 2 ml centrifuge tube and stored under dry conditions. Stable carbon and nitrogen isotope ratios were determined for all samples using an EA-HT elemental analyzer (Thermo Fisher Scientific, Inc., Bremen, Germany) and a DELTA V Advantage Isotope Ratio Mass Spectrometer (Thermo Fisher Scientific). After the sample was burned at a high temperature in the elemental analyzer, CO2 and N2 were generated. A mass spectrometer was used to detect the ratio of 13C to 12C of CO2 and compare it with the international standard Peedee Belemnite to calculate the δ13C value of the sample, and to detect the ratio of 15N to 14N of N2 and compare it with the international standard (Atm-N2) to calculate the δ15N value of the sample. The calculation method of isotope abundance is as follows:
where δX = δ13C or δ15N, and R = 13C/12C or 15N/14N. The δ13C and δ15N accuracies were< ± 0.1‰ and< ± 0.2‰, respectively. Rsample is the isotope ratio of the measured sample and Rstandard is the isotope ratio of the standard material. To ensure the precision and accuracy of the detection results, three international standard samples were placed after every 10 samples to calibrate the stable isotopes of carbon and nitrogen. Moreover, each sample was measured 10 times.
Trophic niche
The δ15N-δ13C double-bit map drawn from the average isotopic value of an individual can be used to study the isotopic composition of a species (Layman et al., 2007). Using quantitative indicators of the nutritional structure of the food web and analyzing the coordinate point information in the double-bit map can better show the characteristics of a nutritional niche (Li et al., 2021). The main indicators include diversity of food sources (CR; range of δ13C; range of stable carbon isotope values), nutrient length (NR; range of δ15N; range of stable nitrogen isotope values), total niche area (TA; total convex hull area; convex polygon area of coordinate points represented by all individuals), and core niche area (SEA; standard ellipse area). The SEA generally needs to conform to a normal distribution, and the sample size should be greater than 30. For a small sample size, the standard ellipse area corrected for small sample sizes (SEAc) is typically used (Jackson et al., 2011). The relationship between the SEA and SEAc is as follows:
where n is the number of samples of a species.
SPSS version 24 and Excel 2019 were used for data analysis. One-way ANOVA was used to test whether there were significant differences between carbon and nitrogen stable isotope values and the average stomach fullness index among the three tuna species (α = 0.05). First, data were tested for normality and homogeneity of variance. If any of the above requirements were not met, a non-parametric test (Kruskal-Wallis) was performed. The Pearson correlation coefficient was used to test the relationship between the fork length and stable isotopes of carbon and nitrogen. The trophic structures of δ13C and δ15N for the three tuna species were mapped using the Stable Isotope Bayesian Ellipses in R (SIBER) package in the program R Core Team (2021) (version 4.0.2). SIBER model fitting was performed via Markov chain Monte Carlo (MCMC) simulation, which calculates a posterior estimate by combining the priors and likelihoods. The model was run for 10,000 iterations (Jackson et al., 2011). The trophic niche indicators and Bayesian standard ellipse areas (SEAB) of various tuna species were calculated, with confidence intervals of 95%, 75%, and 50% presented in the resulting graphs, respectively. To quantify the differences in isotopic niche utilization among the three tuna species, the R package nicheROVER was used to estimate the probability of one population occurring within the niche area (space) of another population with 95% confidence intervals based on 10,000 iterations (Swanson et al., 2015).
Results
Food composition of tuna
Analysis of the stomach contents of 42 BET, 84 YFT, and 75 LFT showed that the three tuna species fed on 48 prey species, including fish, cephalopods, and crustaceans (Table 2). A total of 31 families (26 fish families and 5 cephalopod families), 12 fish species (including Sternoptyx diaphana, Alepisaurus ferox, Gempylus serpens, and Ruvettus pretiosus), and 3 cephalopod species were identified. The BET stomachs contained 23 identified species, including 16 fishes, 4 cephalopods, and 3 crustaceans with IRIs of 49.82%, 38.68%, and 11.49%, respectively, and unidentified fishes and cephalopods. The dominant prey were Ommastrephes bartrami (IRI = 25.01%) and Myctophidae (IRI = 12.34%), followed by Penacus sp. (IRI = 10.24%%) and G. serpens (IRI = 8.72%). The IRIs of S. diaphana, A. ferox, and L.chinensis were 6.76%, 5.65%, and 5.61%, respectively. YFT fed on unidentified fish and cephalopods, and 35 identified species, including 22 fishes, 4 cephalopods, and 9 crustaceans with IRIs of 67.84%, 10.32%, and 21.84%, respectively; fish accounted for the largest proportion of prey taxa. The dominant prey were Hyperiidea spp. (IRI = 19.57%), Aluterus monoceros (IRI = 11.74%), Eumegistus illustris (IRI = 8.13%), and O. bartrami (IRI = 7.55%). The IRI of unrecognizable fish was 38.99%, and the digestion degree was high. LFT ingested unidentifiable fish and cephalopods, and 31 identified species, including 18 fishes, 3 cephalopods, and 8 crustaceans with IRIs of 76.43%, 15.45%, and 8.12%, respectively. Fish made up the largest proportion of prey, unidentifiable fish had the highest IRI (48.72%), and the degree of digestion was high, which was similar to the results for YFT. The dominant prey was G. serpens (IRI = 17.16%), and its IRI proportion was the largest among the identified prey species. This was followed by L.chinensis (IRI = 8.58%), and Hyperiidea spp. (IRI = 6.45%). In addition, the IRI of Synodus spp. was also high (6.37%), second only to that of L. chinensis and Hyperiidea spp.
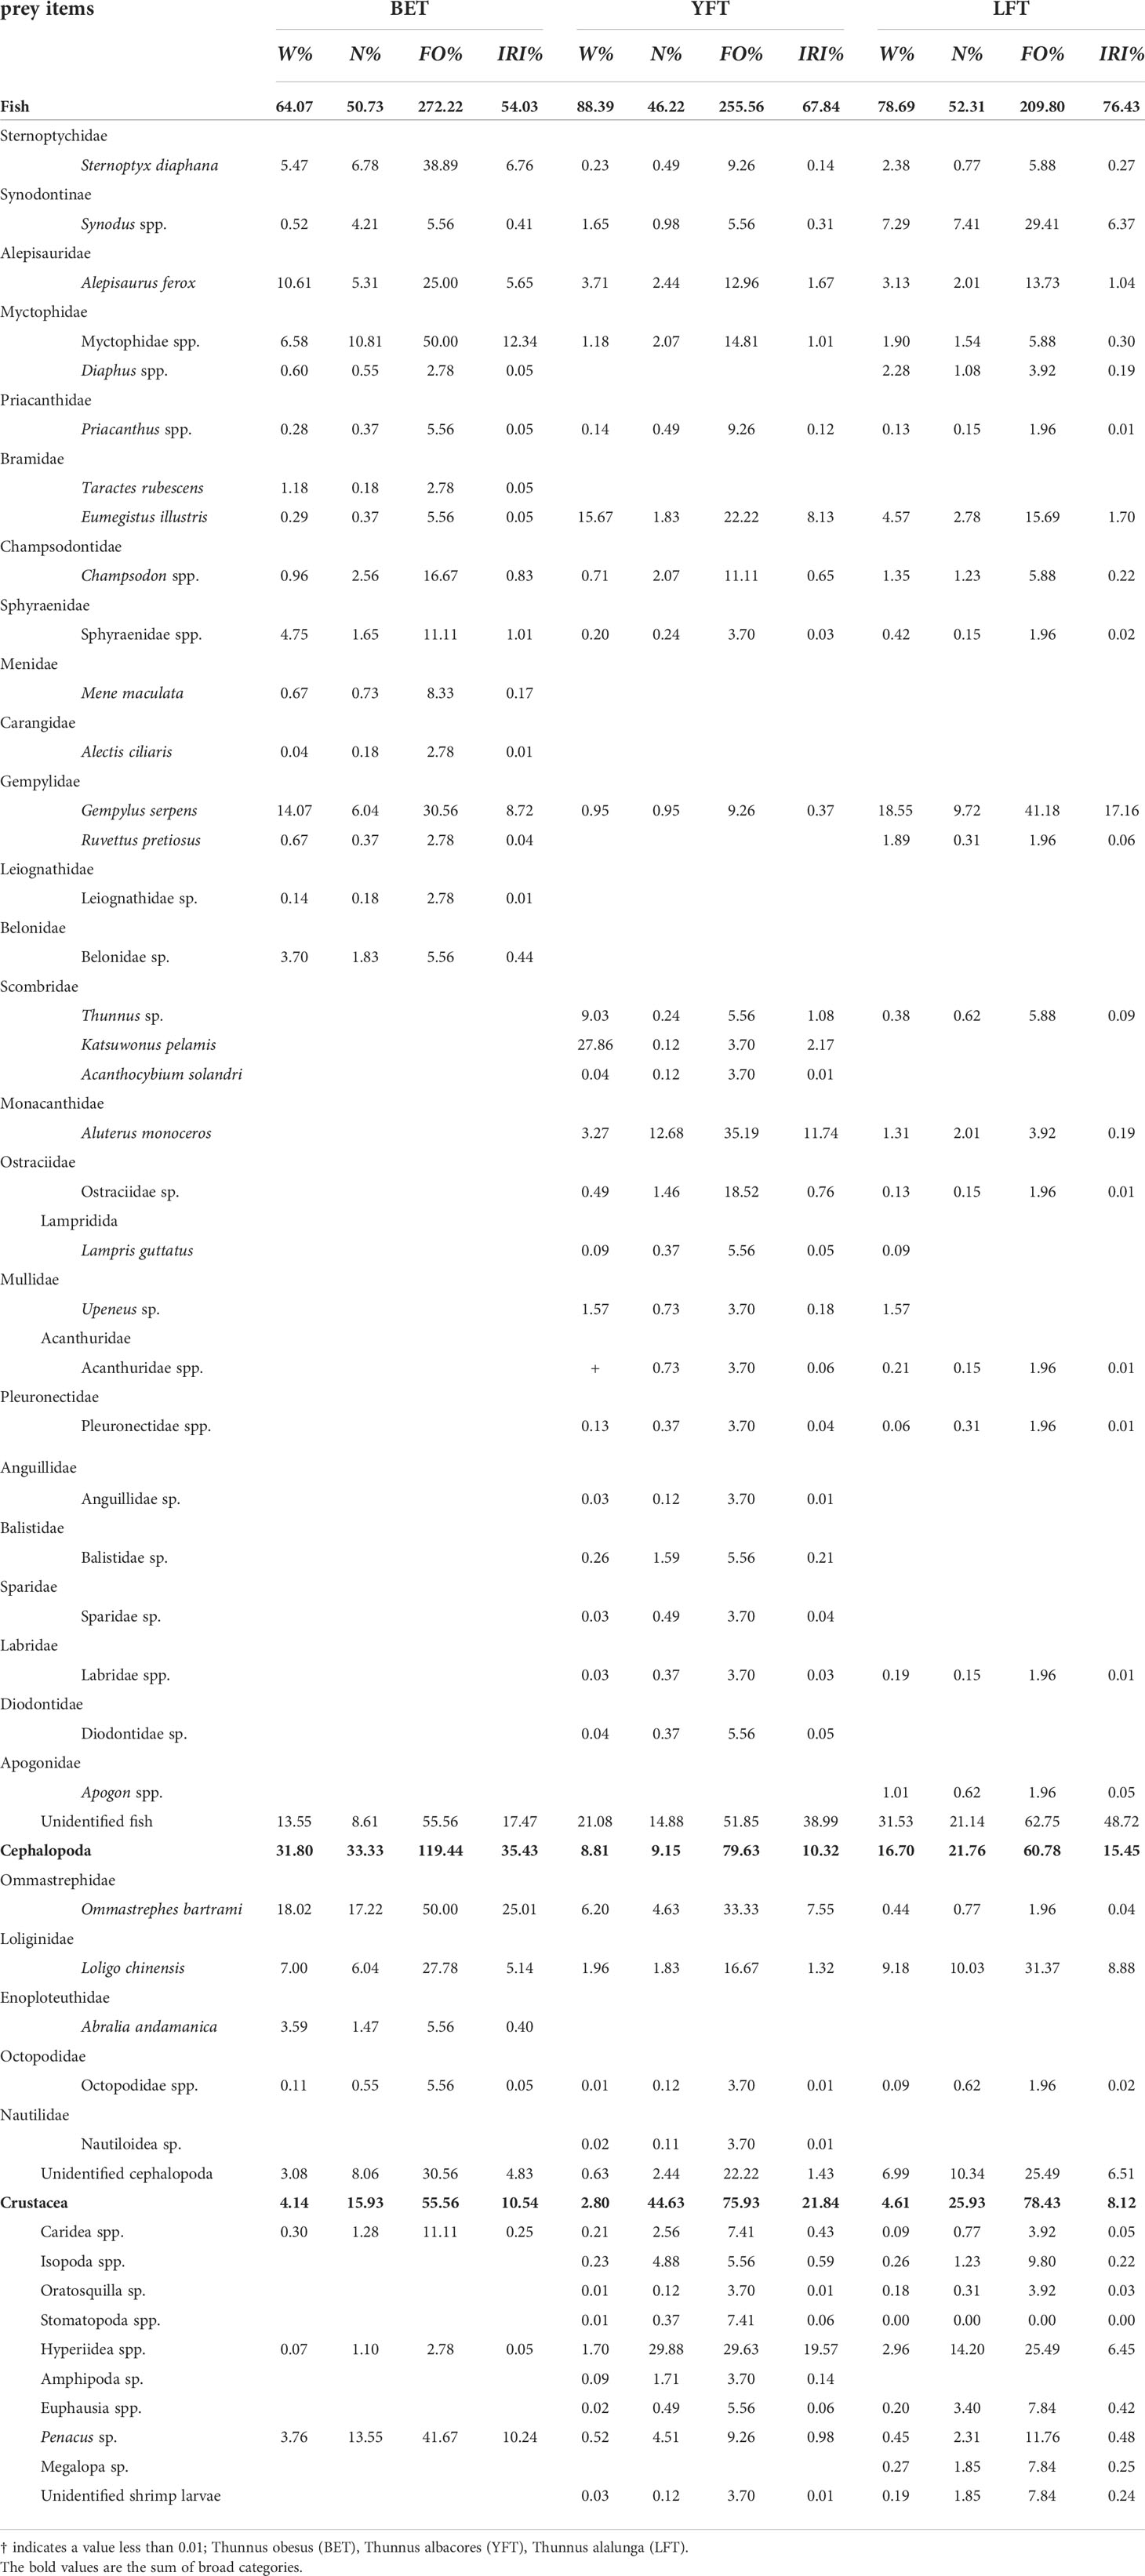
Table 2 Diet composition of three species of tuna.
Feeding intensity
Grade 1 was the dominant feeding grade in all three tuna species; that is, most individuals had only a small amount of food in their stomach. The feeding grade of all LFT was less than 4 (Figure 2). There was a significant difference in the stomach fullness index among the three species (P<0.001), and the empty stomach rate and the average fullness index showed opposite trends; that is, the higher the empty stomach rate, the smaller the average fullness index. The empty stomach rates of BET, YFT, and LFT were 14.40%, 35.69%, and 31.60%, respectively, and the corresponding average gastric fullness indices were 0.188, 0.064, and 0.065, respectively.
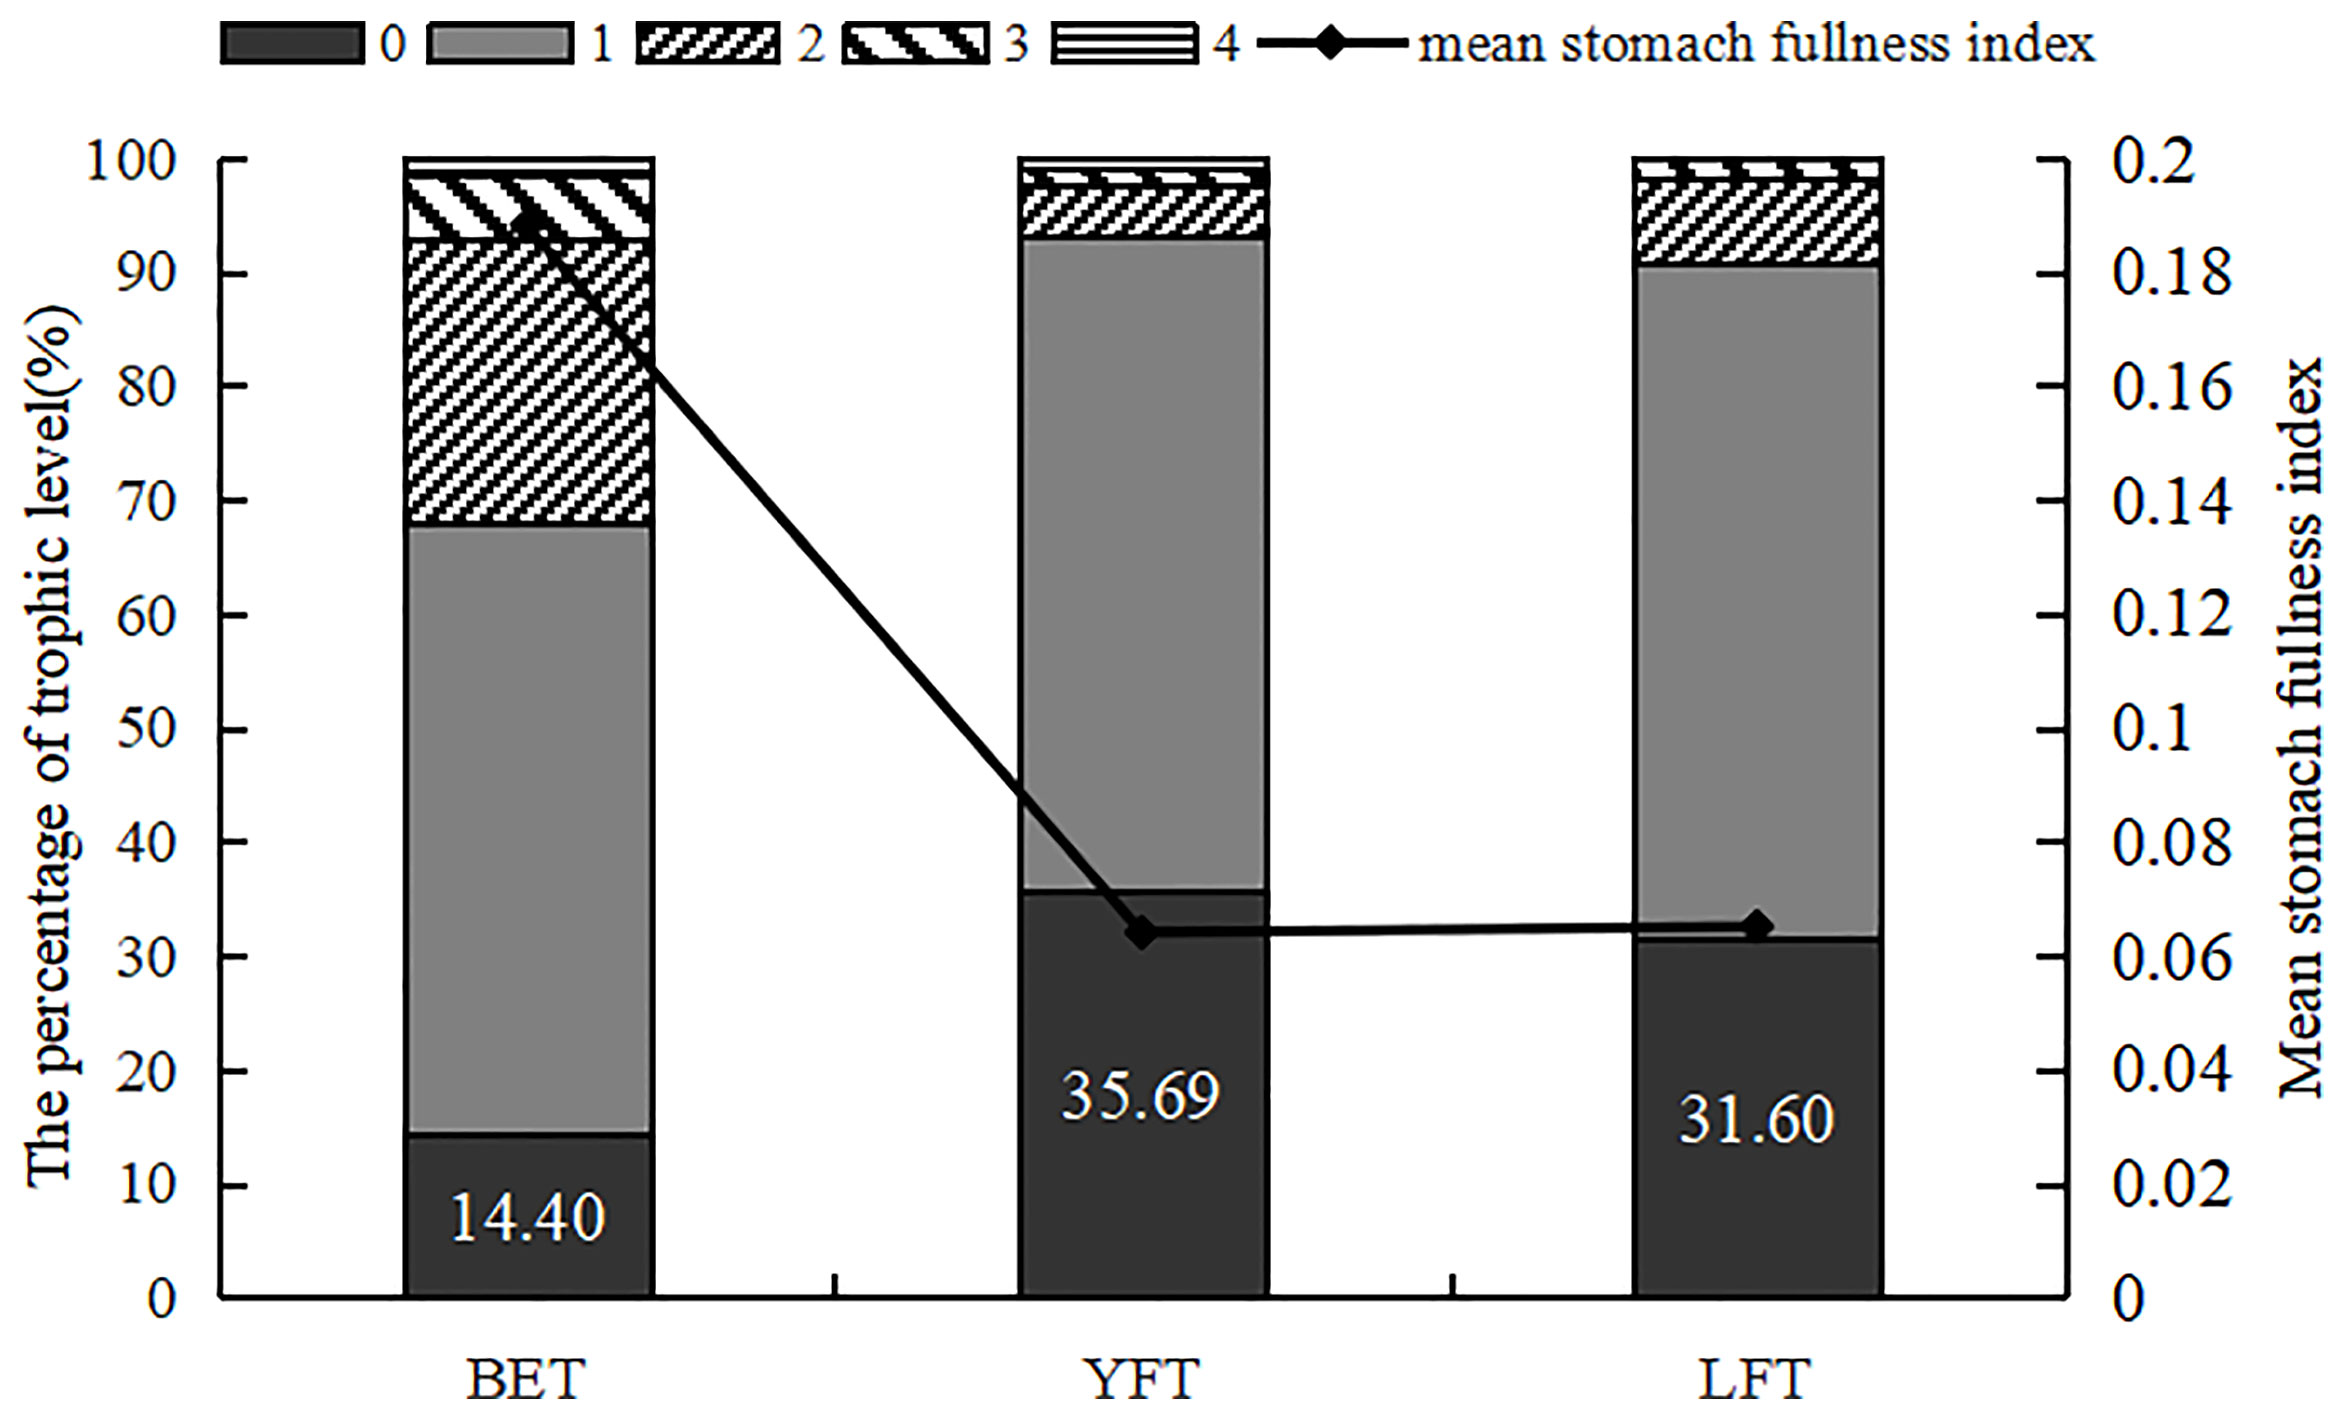
Figure 2 The percentage of trophic level and mean stomach fullness index of three species of tuna. BET, big eye tuna, Thunnus obesus; YFT, yellow fin tuna, T. albacares; LFT, albacore tuna, T. alalunga.
Feeding strategies and food overlap
Feeding strategies showed that prey concentrations were generally high with low occurrence frequency (Fi) and low abundance of specific prey (Pi) (Figure 3). Regarding distribution of prey, O. bartrami was the most important food for BET, with the highest occurrence frequency and food abundance. There was also a moderate proportion of A. ferox, G. serpens, and L. chinensis. Despite their low frequency, Sphyraenidae and Belonidae had higher prey-specific abundances because of their larger size. Conversely, despite their high frequency, Sternoptychidae, Myctophidae, and Penacus sp. are small in size and low in quality, resulting in lower prey-specific abundance. Taxa such as Octopodidae and Synodus spp. in the lower left corner of the graph belong to the secondary prey species of BET (Figure 3). Ommastrephes bartrami, A. monoceros, Hyperiidea, and Bramidae were the most important prey for YFT. The main prey of LFT were Gempylidae, L. chinensis, Synodontinae, Cephalopoda, and Apogon spp. Non-important prey accounted for the largest proportion of ingested organisms (Figure 3). In general, most of the prey were distributed on the left side of the graph; that is, there were differences in food composition among larger polyphagous individuals. However, the tuna species tended to utilize exclusive resources, as evidenced by the low B values (0.48, 0.19, and 0.32 for BET, YFT, and LFT, respectively) and low dietary overlap between species (Table 3). Fifteen prey species overlapped among the three tuna species, including nine species of fish, three species of cephalopods, and two species of crustaceans. The overlap index (Oij) results showed that the food overlap coefficient among the three tuna species was greater than 0.3, and there was a possibility of food competition.
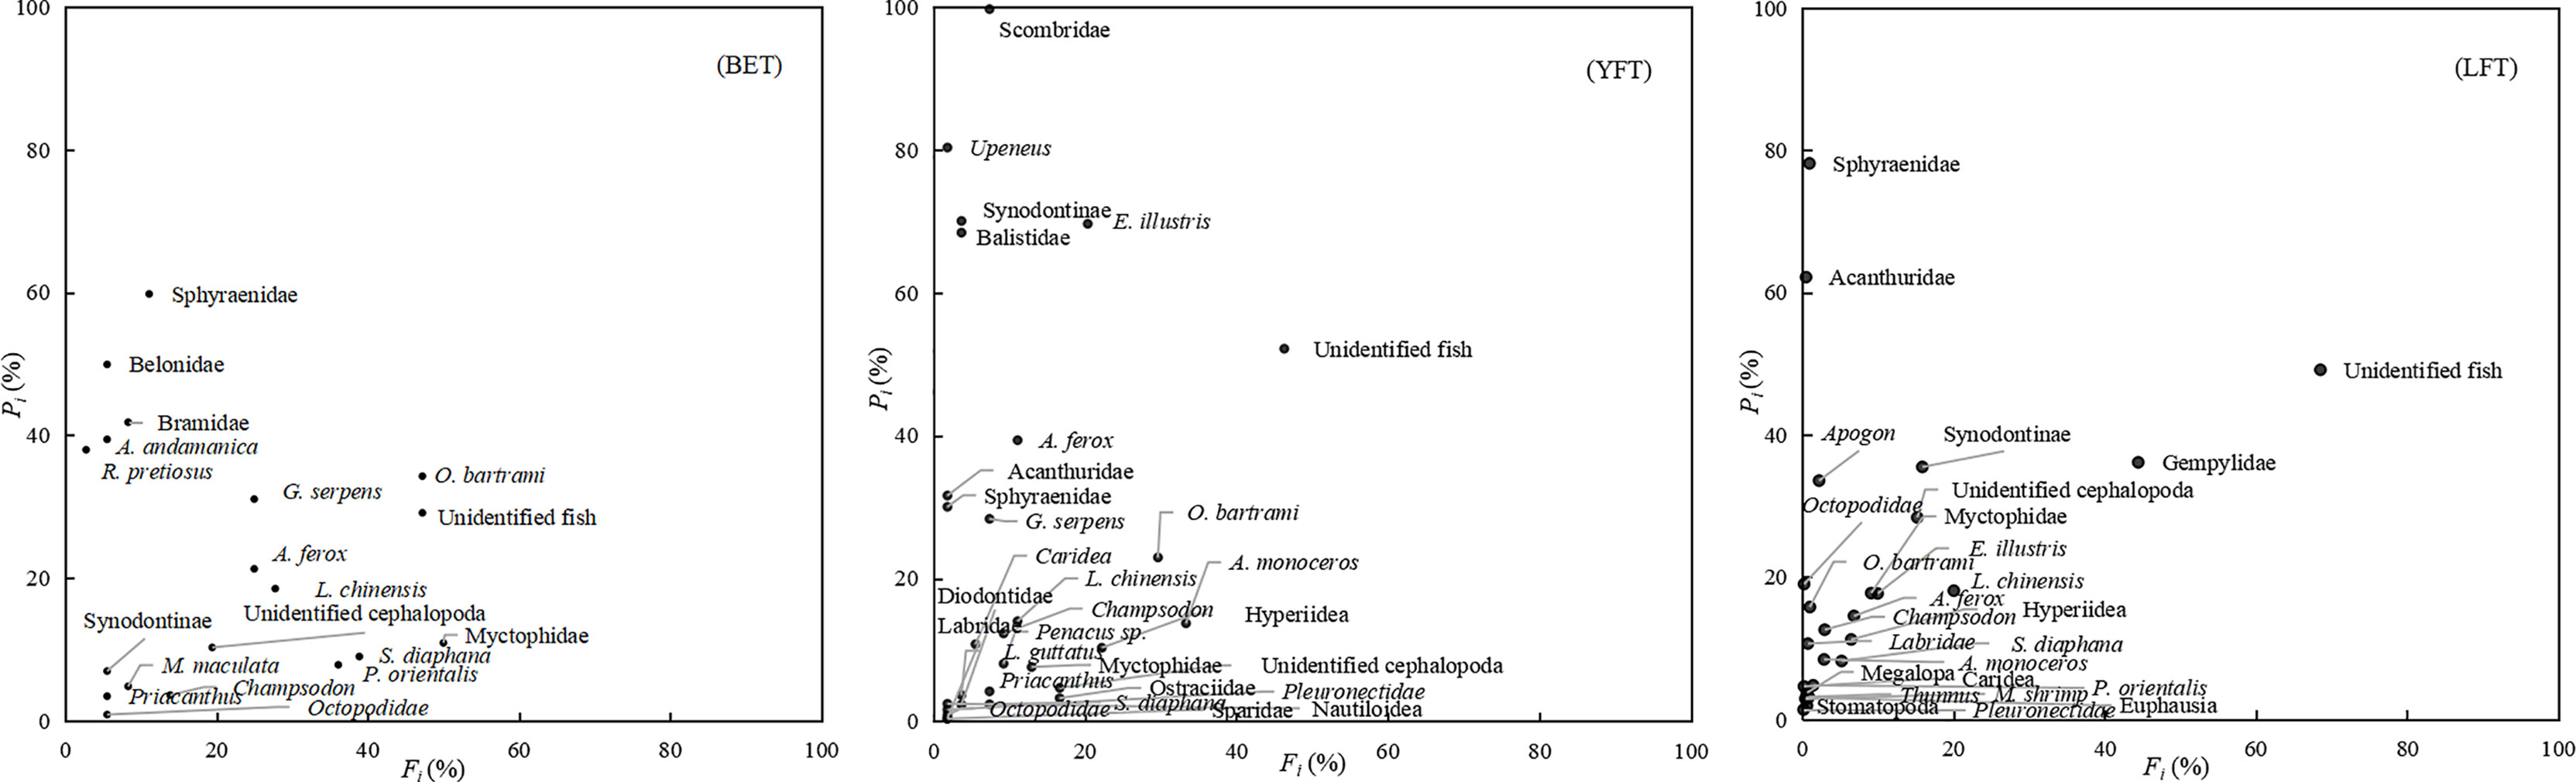
Figure 3 Relationship between relative prey-specific abundance (Pi, %) and frequency of occurrence (Fi, %) of prey items in the diet of three species of tuna. BET, big eye tuna, Thunnus obesus; YFT, yellow fin tuna, T. albacares; LFT, albacore tuna, T. alalunga.
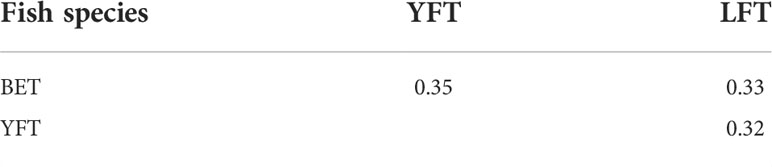
Table 3 Food overlap coefficient of three species of tuna: Thunnus obesus (BET), Thunnus albacores (YFT), and Thunnus alalunga (LFT).
Ratios of stable isotope
Some tuna with stomach food were selected for isotope analysis. The δ13C and δ15N values for the three tuna species are listed in Table 4. The total δ13C values ranged from −19.96‰ to −13.64‰, with an average of −16.94 ± 1.64‰. The total δ15N values ranged from 6.6‰ to 21.03‰, with an average of 14.48 ± 3.87‰. LFT had the widest range of δ13C values, and the mean δ13C values for YFT and LFT were similar. BET had the highest δ15N value and YFT had the lowest δ15N value. The ANOVA showed significant differences in carbon (P<0.001) and nitrogen (P<0.001) isotope values among the three species. The Pearson correlation results showed that δ15N and δ13C had no significant effect on the fork length of the three species (P>0.05), whereas δ15N and δ13C were positively correlated with the fork length of YFT and LFT (Figure 4).
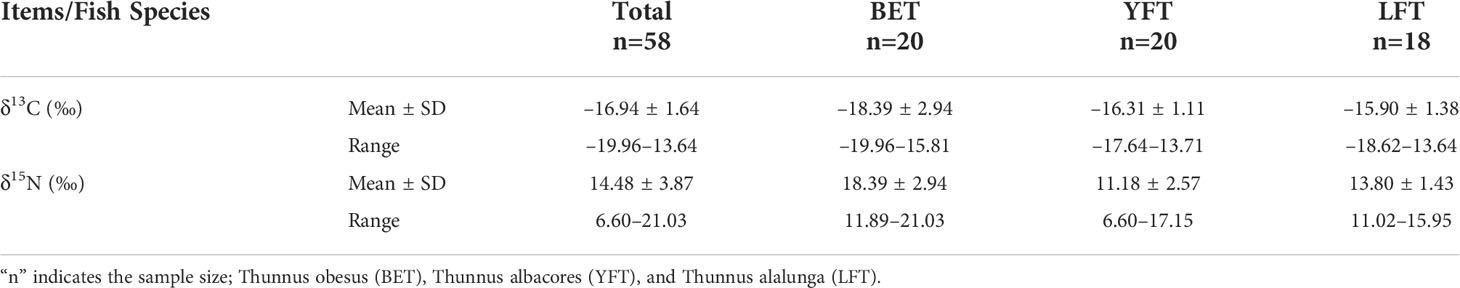
Table 4 Comparison of stable isotope differences among three species of tuna.
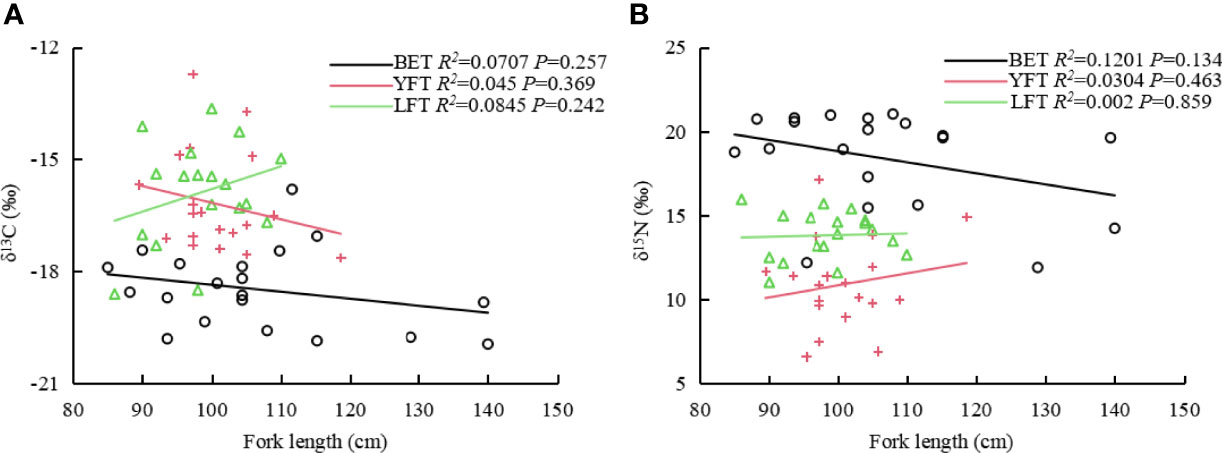
Figure 4 Correlation between fork lengths of three tuna species and δ13C (A) and δ15N (B). BET: big eye tuna, Thunnus obesus; YFT, yellow fin tuna, T. albacares; LFT, albacore tuna, T. alalunga.
Trophic niche
As shown in Table 5 and Figure 5, BET had the largest SEAc and TA, YFT had the largest NR, and LFT had the largest CR. The Bayesian standard ellipse area (SEAB) representations (Figure 6) showed that BET had the largest SEAB mode value (9.53‰2) and a 95% confidence interval of 6.05–15.45‰2, followed by YFT with a SEAB mode value of 8.61‰2 and 95% confidence interval of 5.27–13.19‰2. LFT had the smallest SEAB mode value (5.79‰2) and a 95% confidence interval of 3.28–9.01‰2. The results showed that the bigeye tuna had a greater niche width.
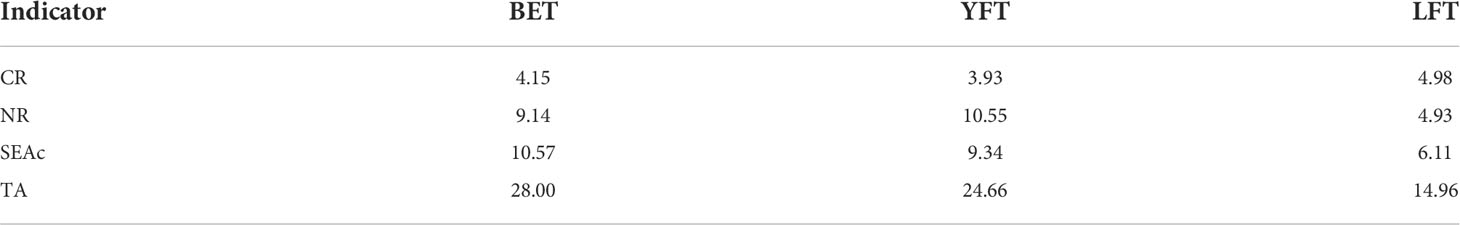
Table 5 Trophic structure parameters of three species of tuna: Thunnus obesus (BET), Thunnus albacores (YFT), and Thunnus alalunga (LFT).
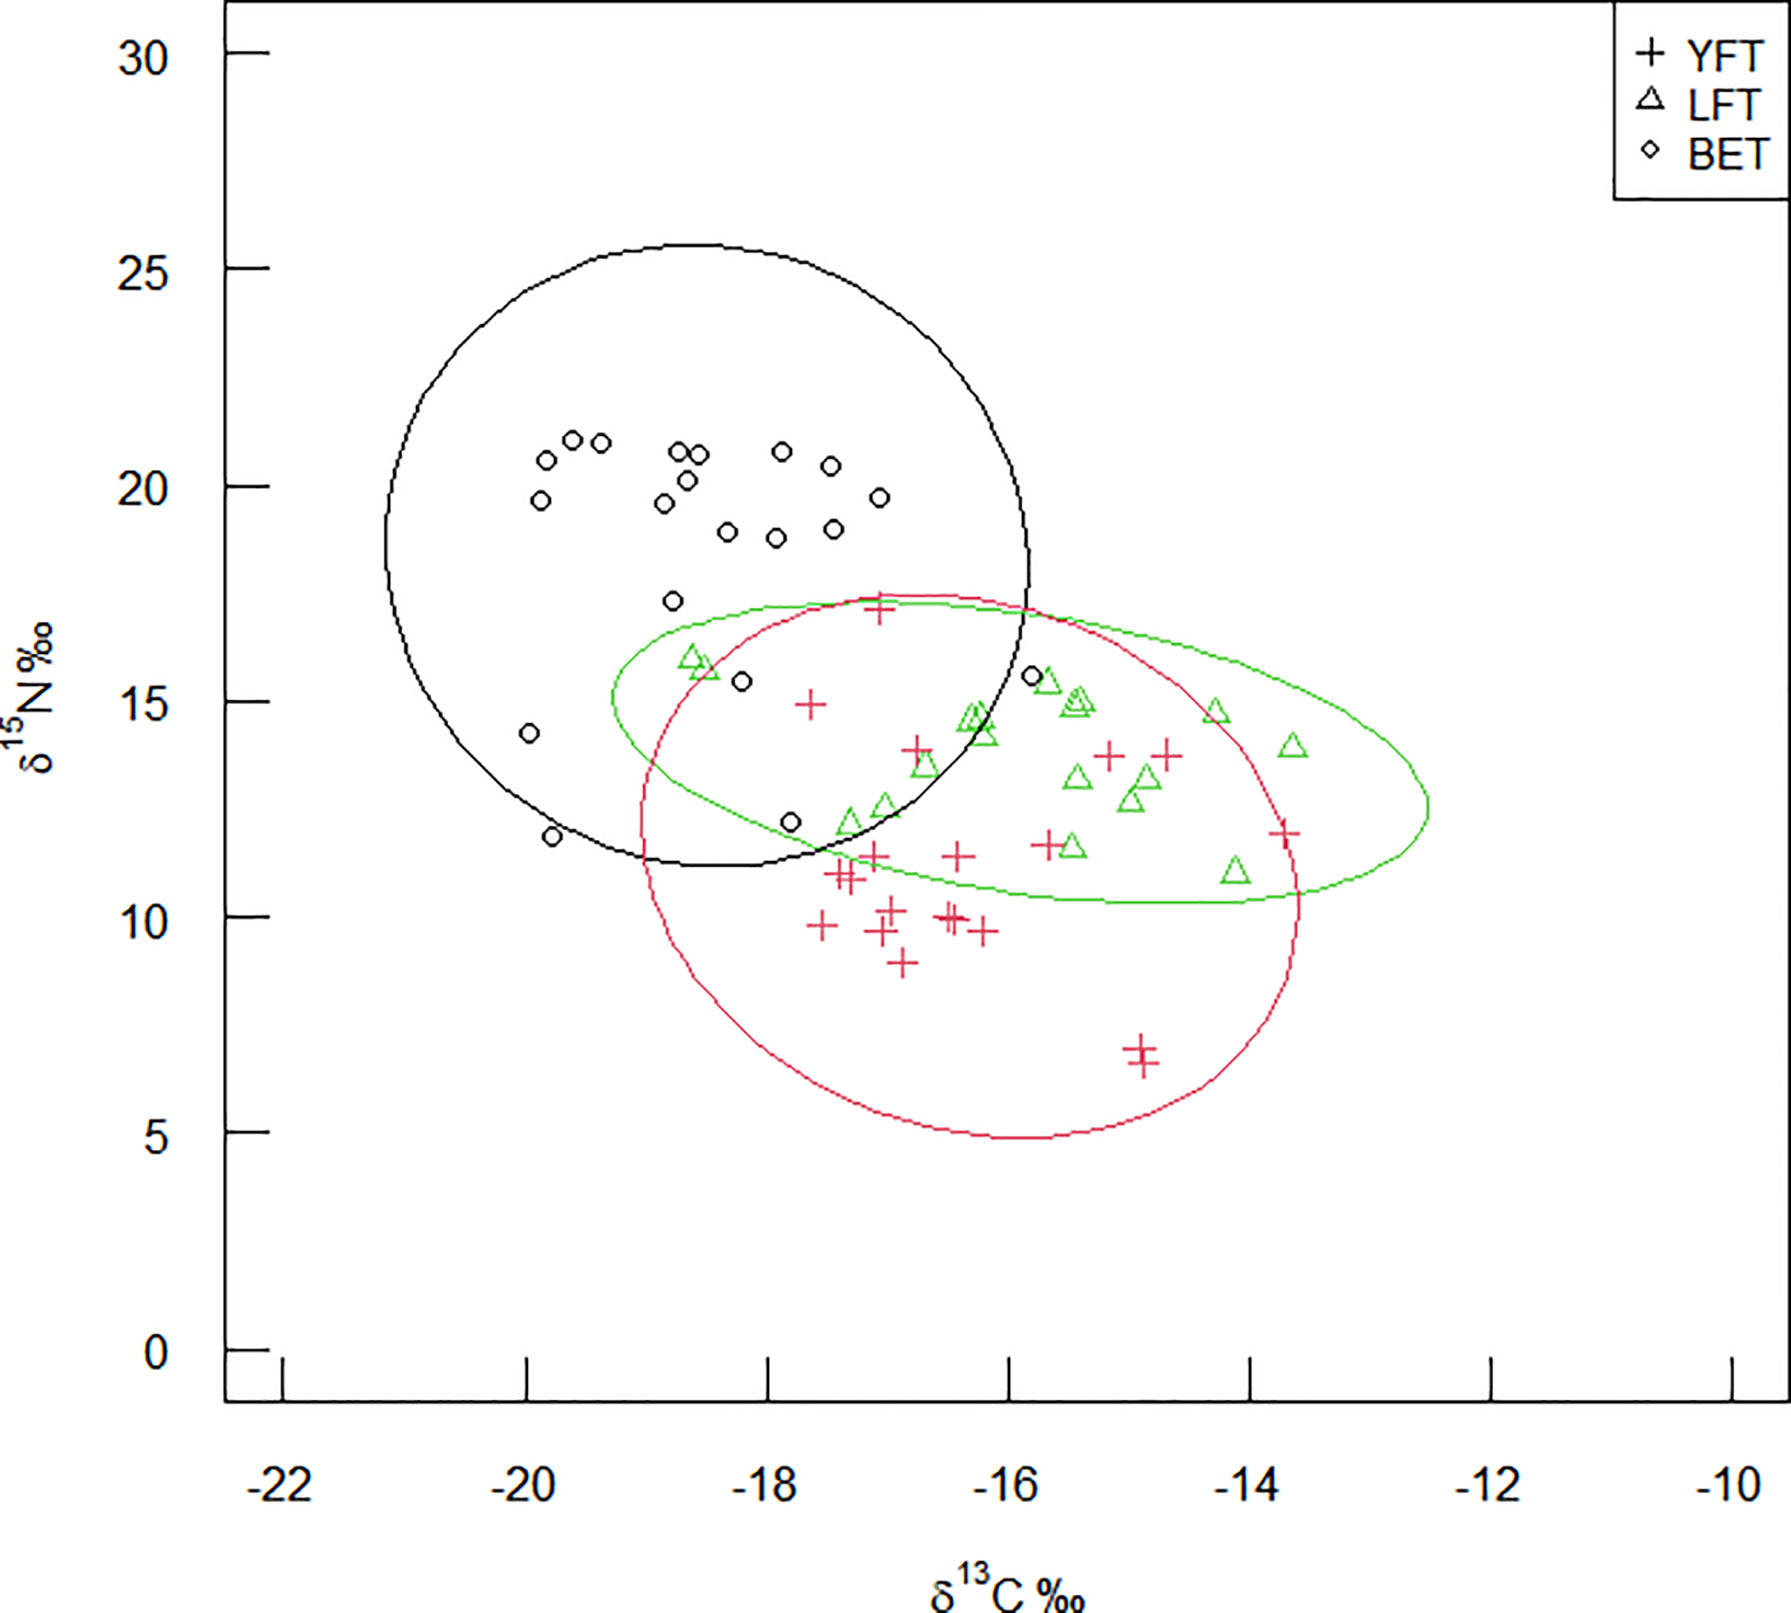
Figure 5 Trophic structure of three species of tuna. BET, big eye tuna, Thunnus obesus; YFT, yellow fin tuna, T. albacares; LFT, albacore tuna, T. alalunga.
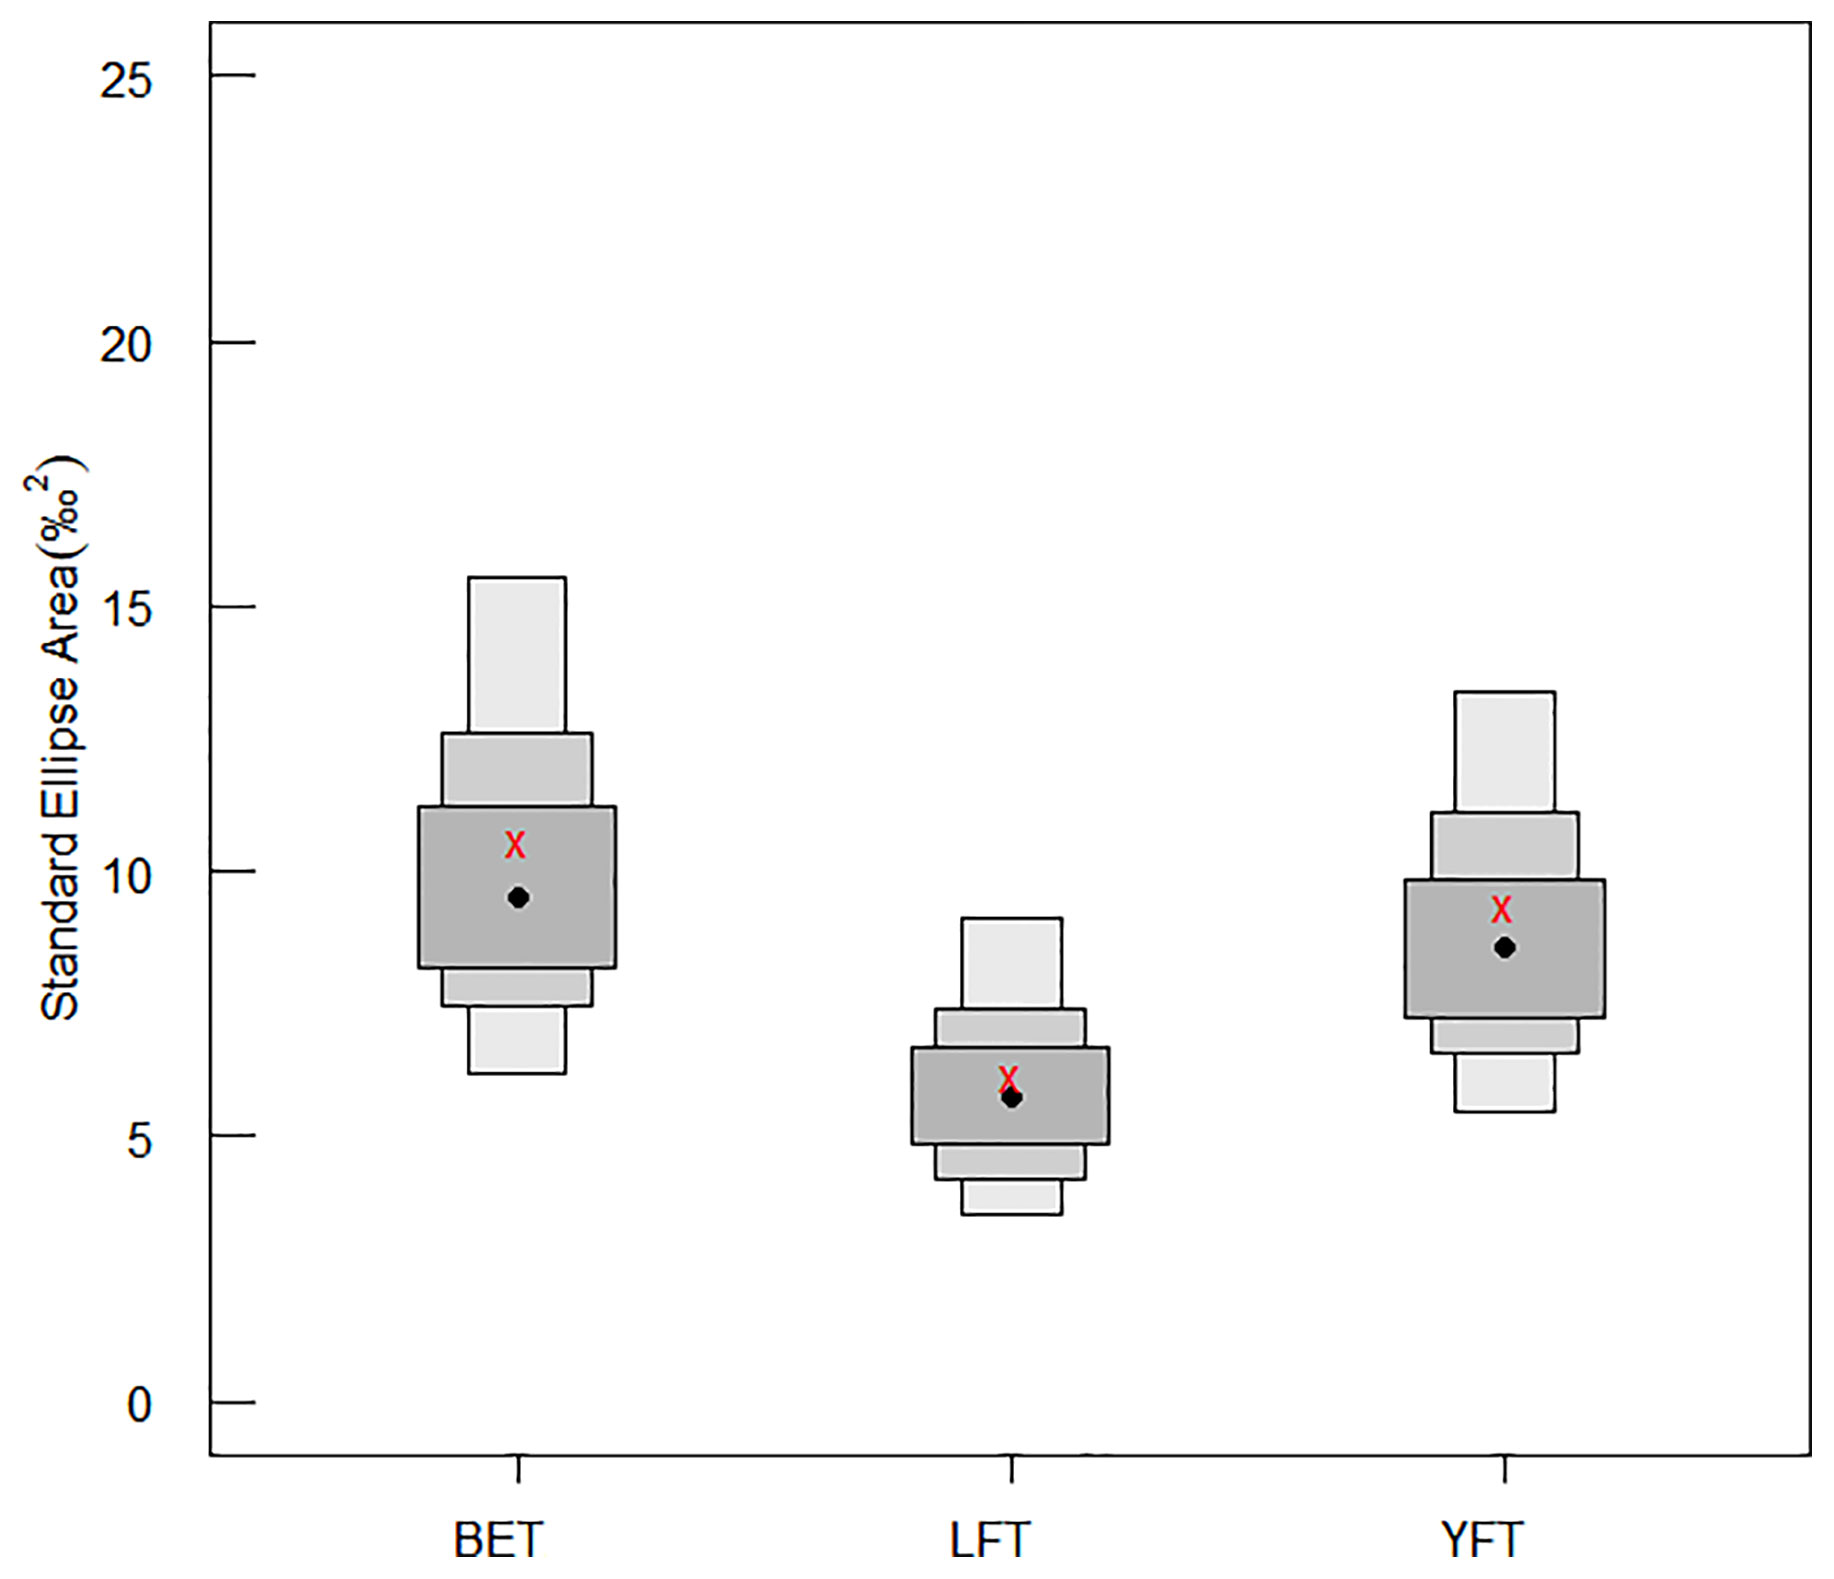
Figure 6 Bayesian standard ellipse area (SEAB) for three species of tuna (with credibility intervals of 50%, 75%, and 95%). BET, big eye tuna, Thunnus obesus; YFT, yellow fin tuna, T. albacares; LFT, albacore tuna, T. alalunga.
The trophic niche area composed of the carbon and carbon stable isotopes of each tuna species, and the 10 randomly generated elliptical projections are shown in Figure 7. Smoothing histograms (density plots) and scatter plots showed no violation of normality. As shown in Figure 5, BET had higher δ15N ratios, YFT had more extensive NR, and LFT had the largest CR. The three species occupied different trophic niche areas that were overlapping.
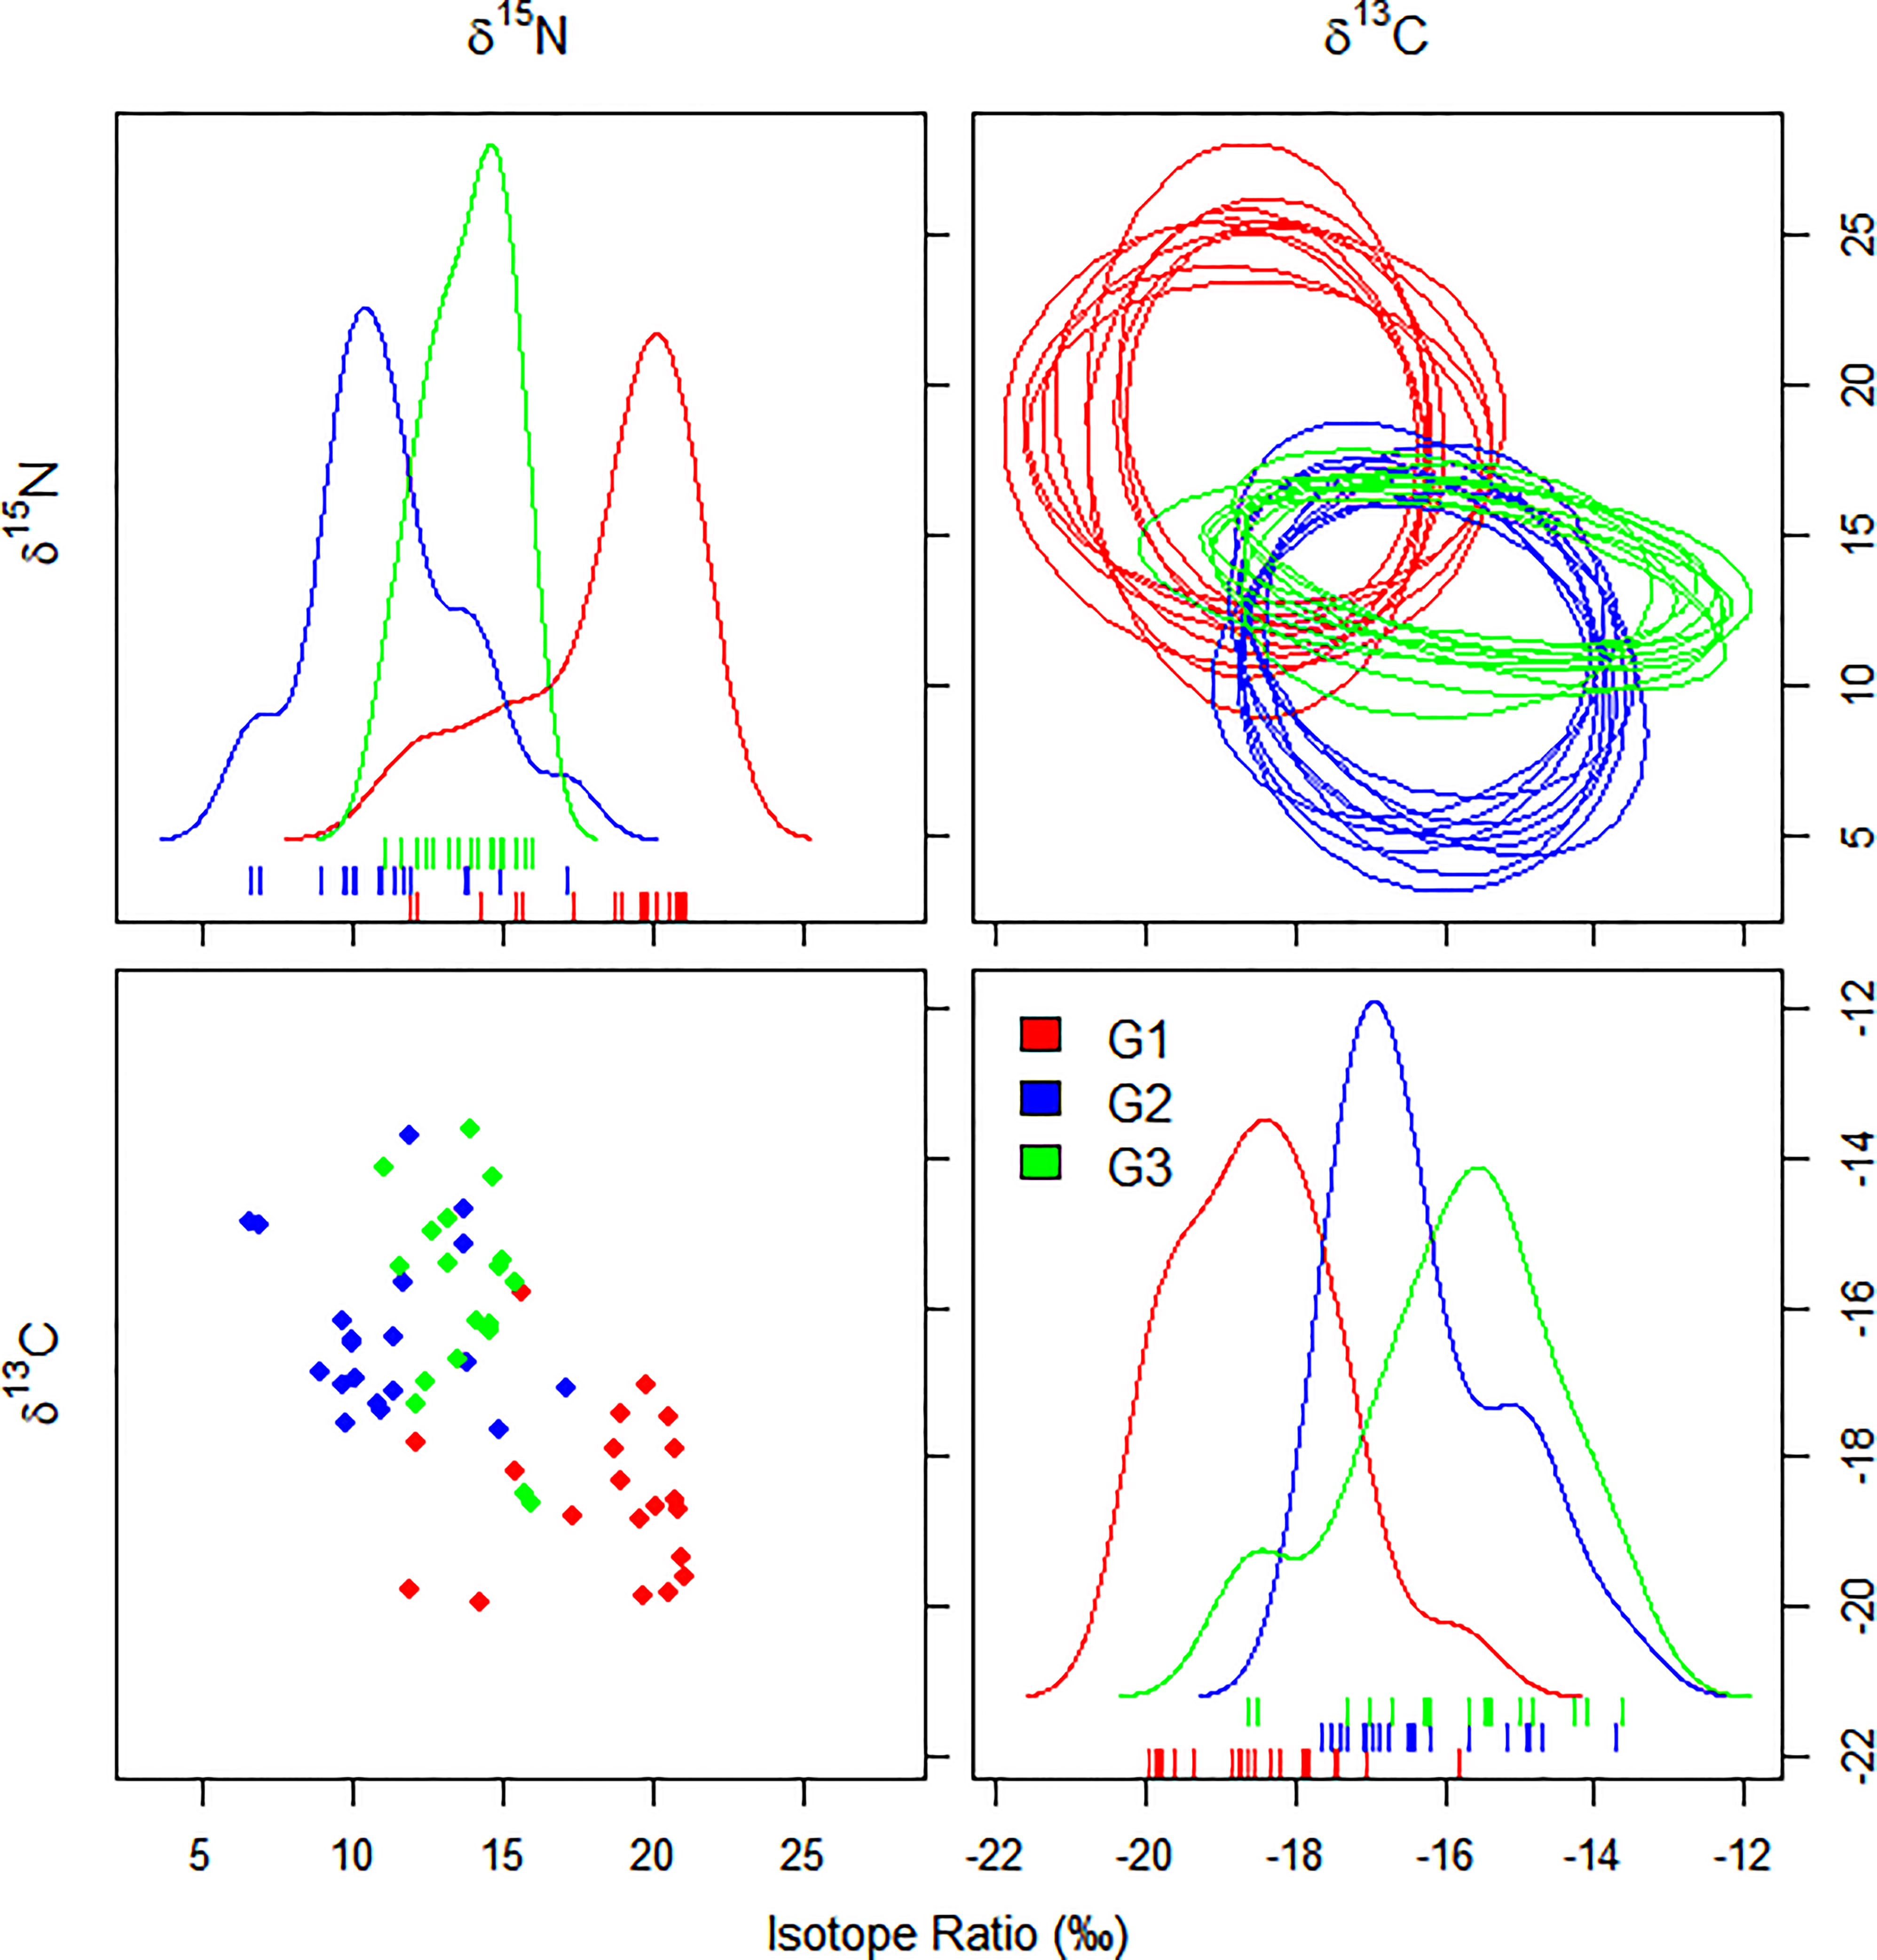
Figure 7 Ten random elliptical projections of trophic niche region (NR) for each tuna species and pair of isotopes (elliptical plots). One-dimensional density plots (lines) and two-dimensional scatterplots are also displayed. G1, big eye tuna, Thunnus obesus; G2, yellow fin tuna, T. albacares; G3, albacore tuna, T. alalunga.
Figure 8 shows the posterior distribution of the overlap metric. The nicheROVER analysis revealed the probability of a species being found in the niche area of another species. The isotopic niches of BET were found in 13% and 17% of the niche areas of YFT and LFT, respectively. The isotopic niches of YFT were found in 11% and 42% of the niche areas of BET and LFT, respectively. The isotopic niches of LFT were found in 29% and 75% of the niche areas of BET and YFT, respectively. Therefore, YFT and LFT are more likely to occupy the same niche area.
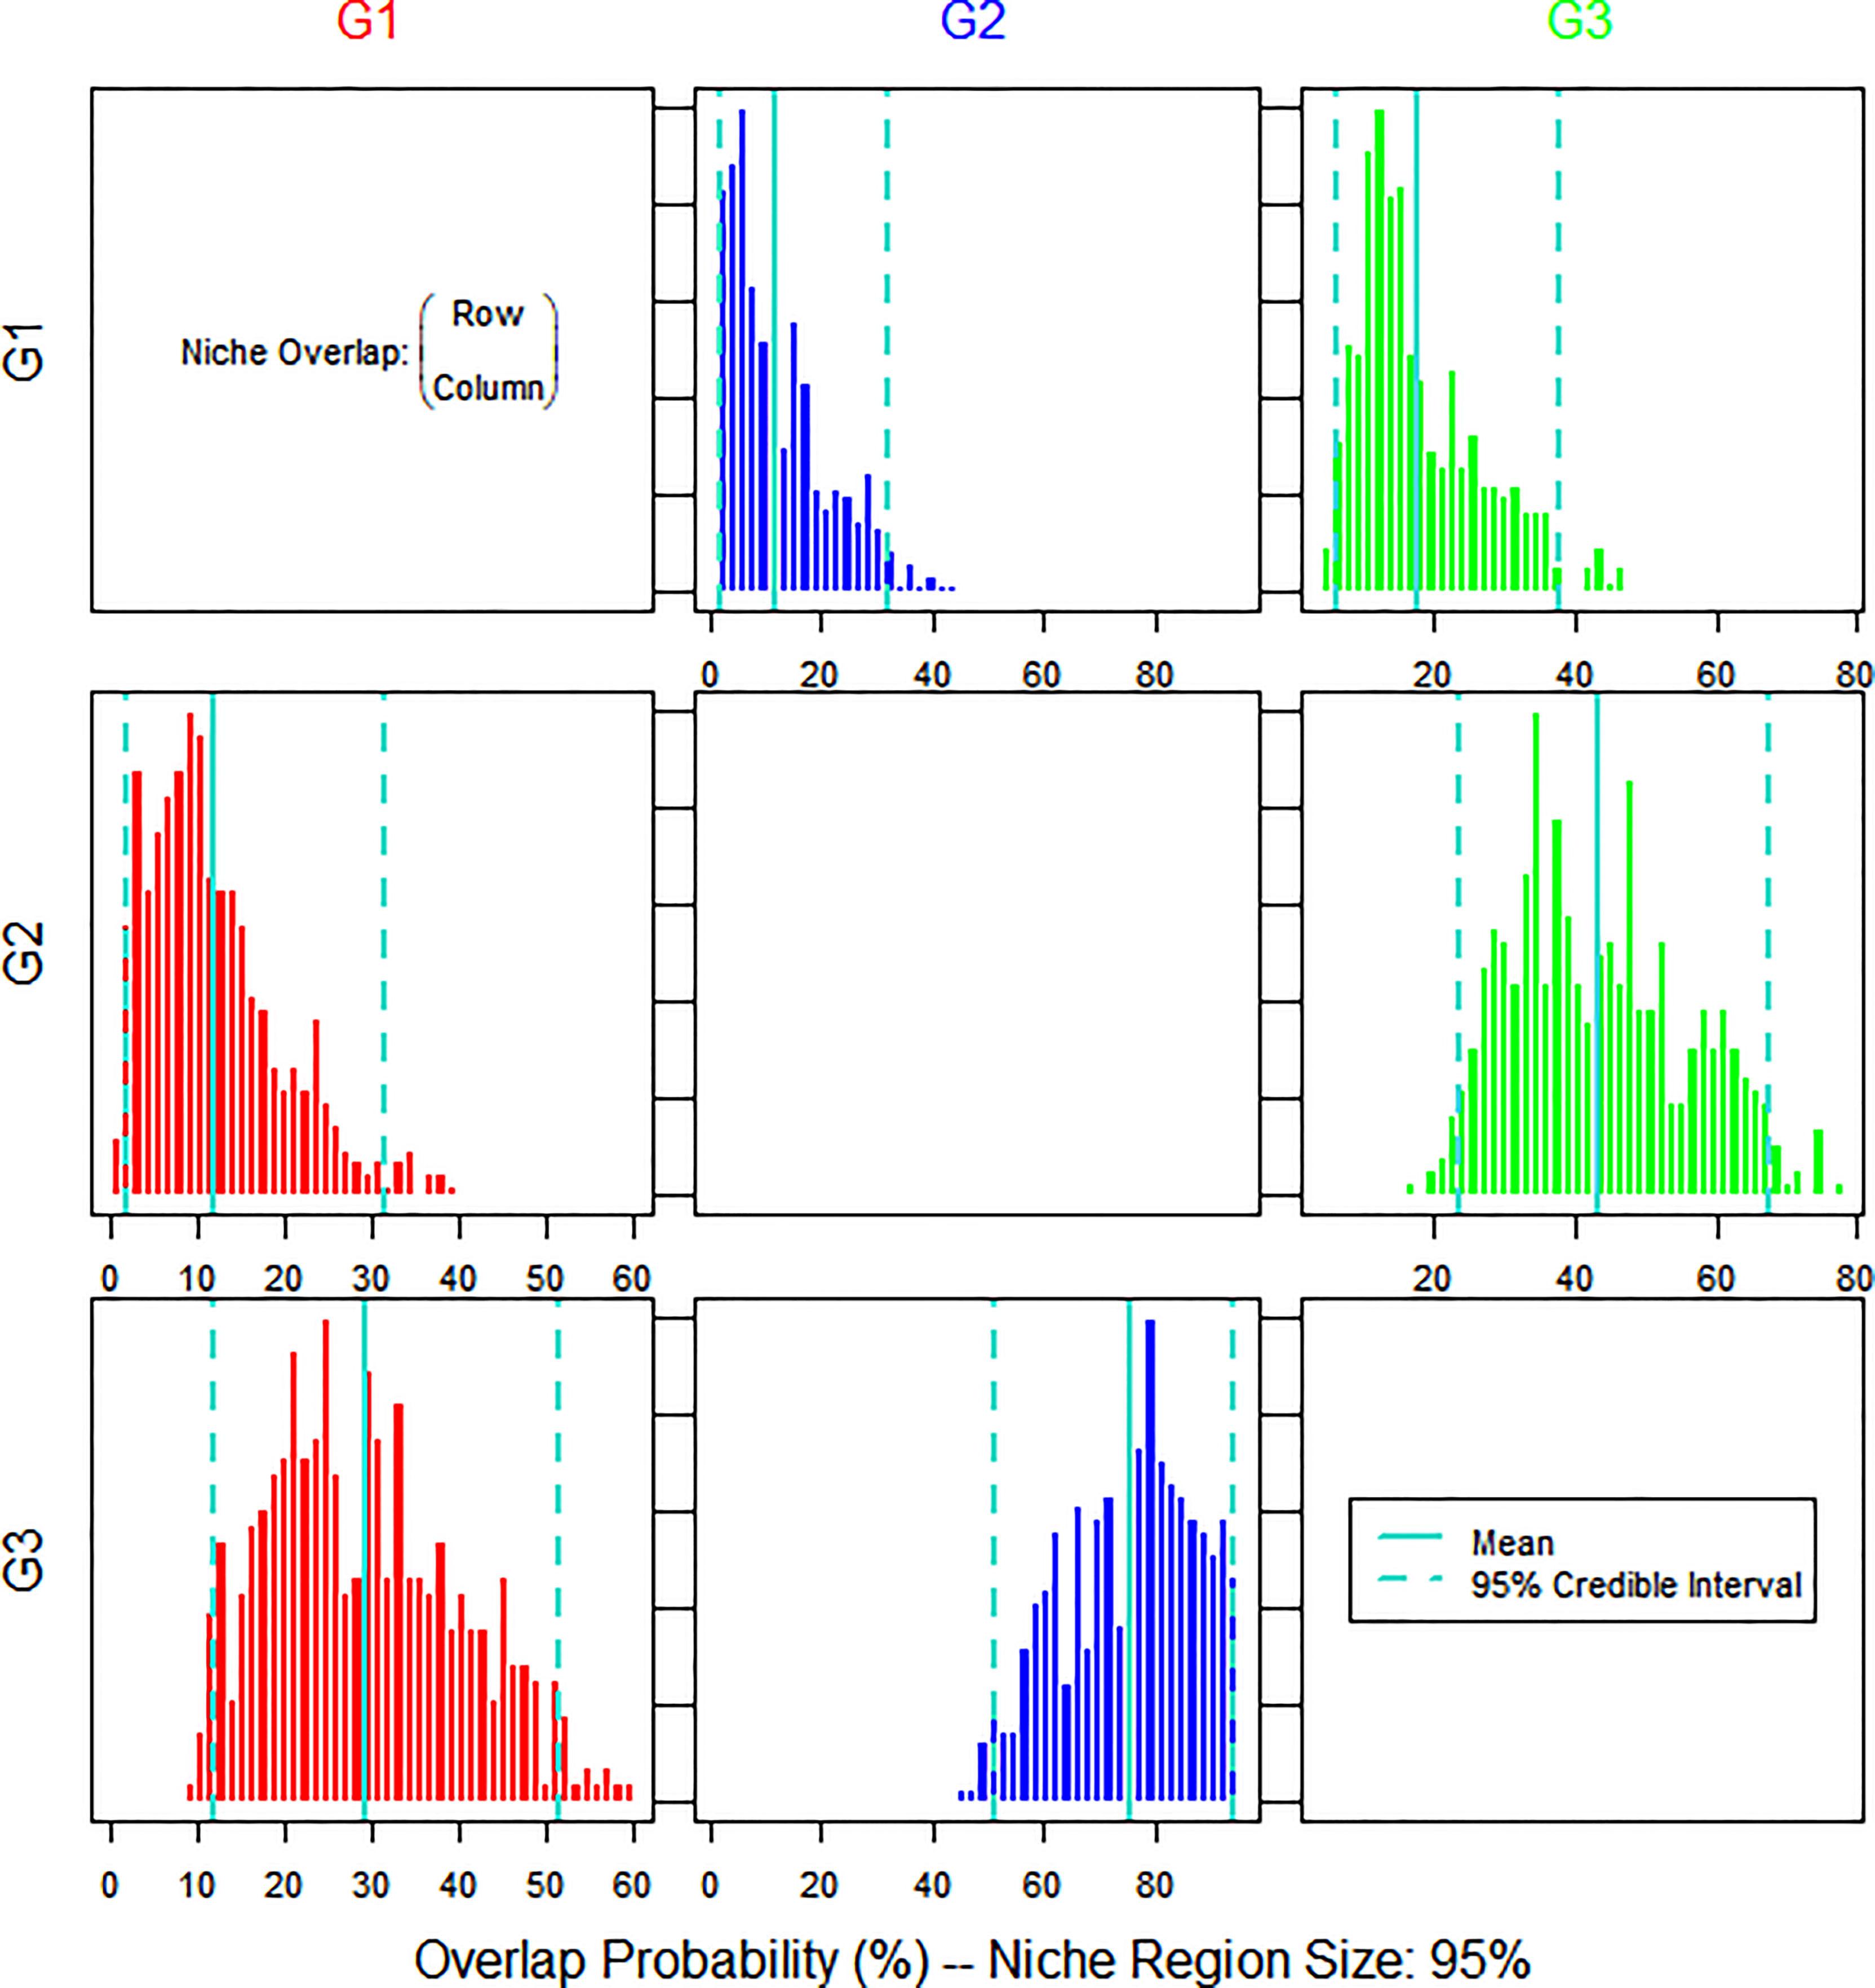
Figure 8 Bayesian plot of the posterior probability distribution of niche region metric (%) for the tuna species estimated using nicheROVER analysis. The posterior means and 95% credible intervals are displayed in turquoise. G1, big eye tuna, Thunnus obesus; G2, yellow fin tuna, T. albacares; G3, albacore tuna, T. alalunga.
Discussion
The results of the food composition analysis indicated that the three species of tuna in the Solomon Islands were polyphagous, mainly eating fish, cephalopods, and crustaceans, which is consistent with the findings of other studies (Xu et al., 2008; Zhu et al., 2015; Tao et al., 2017). Although the composition of food could be identified by observing stomach contents, owing to the influence of fish digestion and artificial errors, many prey, most of which were fish, could not be identified. For example, unidentifiable fish accounted for 38.99% and 48.72% of prey composition in YFT and LFT, respectively. This affects the results to a certain extent; therefore, it is necessary to use the carbon and nitrogen stable isotope values of prey organisms and potential food sources to determine the contribution rates of different food types. Studies have shown that tuna are opportunistic predators (Ménard et al., 2006), with diets that vary according to the abundance of food in a region (Mendoza-Ávila et al., 2017). In different seas, the types of prey that tuna eat are different. BET in the central Pacific Ocean mainly consume Alepisauridae, Gempylidae, and Bramidae (King and Ikehara, 1956), whereas those in the tropical waters of the eastern Pacific Ocean mainly consume Myctophidae, Gempylidae, and Sternoptychidae (Moteki et al., 2001). The main families that BET feed on in the western Atlantic Ocean are Alepisauridae, Ommastrephidae, and Clupeidae (Zhu et al., 2007). YFT mainly consume squid, sardines, and shrimp in the middle of the Atlantic Ocean (Song et al., 2004); Lestrolepis japonica, Benthosema pterotum, Mene maculata, Exocoetidae, and Chaetodontidae in the waters off Taiwan (Weng et al., 2015); and Oxyporhamphus micropterus, Auxis thazard, Lampanyctus alatus, Onykia carribbaea, and Gammaridea in the eastern Pacific Ocean (Perrin et al., 1973). LFT mainly feed on Triacanthus, Alepisauridae, and Gempylidae in the western Indian Ocean (Koga, 1958), whereas the main food sources in the southern Pacific Ocean are crustaceans (such as shrimp), squid, and fish (Saito, 1973).
The combined results of the food composition analysis and feeding strategy map showed that all three tuna species had the characteristics of polyphagia, and their food sources were wide and rich. The three tuna types showed high between-phenotype component (BPC) and low intraspecific food overlap and consumed a large variety of rare or incidental prey. Archipelagos provide abundant food for marine predators and are important environments for maintaining local biodiversity and non-resident species because surrounding physical processes trigger increases in primary biomass that affect entire adjacent food webs. Although tuna are oceanic migratory fish, species that inhabit coastal areas or islands, such as Hyperiidea and the larvae of shrimp, also appear in their stomach contents, as found in this study. Coral reefs are distributed around the Solomon Islands and studies have shown that they provide abundant food for oceanic predators (Allain et al., 2012). Several coral reef fishes, such as Balistidae, Acanthuridae, Monacanthidae, and Synodontinae, are found in the stomachs of tuna. In this study, reef fish constituted a low proportion of the BET diet because it foraged in deeper habitats, whereas YFT mainly foraged in shallower waters.
Generally, the type and size of food consumed by fish varies with body length or fork length (Yan et al., 2012), which is related to factors such as an increase in body length and body mass, and the gradual development of mouthparts (Li et al., 2019). For example, Ménard et al. (2006) studied the relationship between tuna size and prey size and found that tuna prey choice is related to the size of its mouth opening. Tuna usually only consume prey that they can swallow whole; therefore, as they grow, their mouths open wider, and they consume larger prey. To process the data, we briefly analyzed the dietary shifts of the three tuna species. With an increase in fork length, the proportion of fish and cephalopods in the stomach contents of BET and YFT increased, and the proportion of crustaceans decreased. No crustaceans were found in the stomach contents of LFT with a fork length >100 cm.
Studies on isotope differences among species have strengthened dietary analyses of feeding strategies and foods with different nutrient levels (Li et al., 2016). In the marine environment, there are more primary producers and nutrients in the waters around oceanic islands, and the δ13C ratio of primary producers decreases with decreasing offshore distance (Hobson et al., 1994). This spatial heterogeneity is transmitted to predators along the food chain, which affects the δ13C ratio of predators. The LFT in this study had higher δ13C values and the largest CR, whereas BET had lower δ13C values and YFT had the smallest CR. The CR reflects the diversity of food sources available to predators (Kong et al., 2020). The larger the CR, the more extensive and simpler the food sources of predators. Although they are all migratory species, the different δ13C values indicate that the three tuna species use different habitats. The δ15N ratio reflects the nutrient position of the organism, with BET having the highest δ15N ratio. The δ15N ratio results combined with the results of the stomach content analysis indicated the BET diet consisted of more high-nutrient prey, whereas YFT and LFT diets contained a small proportion of planktonic crustaceans. NR represents the diversity of nutrient levels and vertical structure of the food web. A larger NR value indicates a longer food chain (Davenport and Bax, 2002). The largest NR in YFT indicates that it was part of a longer food chain and may have fed in different water layers.
There was no significant correlation between fork length and the δ15N and δ13C values for the three tuna species. δ15N was positively correlated with the fork length of YFT, suggesting that nitrogen concentration may increase with individual growth. This positive correlation may be related to the decreased dietary importance of small zooplankton and increased consumption of large prey with high nutritional value. The positive correlation between the fork length and δ13C values of LFT suggests that individual size influences δ13C values.
Niche width reflects the adaptability and tolerance of organisms to the environment (Crozier, 1985), whereas niche overlap reflects the similarity of resources used and potential prey competition between species (Zhang et al., 2010). The BET in this study had a larger niche width, which indicates that it had a relatively strong utilization capacity for environmental resources and occupied more ecological resources, thus having a higher dominant position in this area. According to the food overlap coefficient of the three tuna species, there was food competition among them, but the food overlap was not significant. This is similar to the results of Young et al. (2010). As top predators, tuna species differ in hunting type and size, timing, and depth to reduce competition. BET, for example, have similar feeding depths to LFT, but feed during both day and night, whereas LFT forage mainly during the day. Although YFT are thought to feed mainly above the thermocline, they can also dive deeper in search of food. Responding to habitat differences in prey is a strategy to reduce competition between species (Costa et al., 2020). In addition, the similarity between diets usually points to the overlap level, representing the food resources that can be shared between organisms, and does not necessarily indicate the existence of competition (Lucena et al., 2000). Therefore, the possibility of fierce food competition among the three tuna species is low, and food competition among them can be alleviated by the differentiation of prey type, feeding proportion, feeding time, and feeding depth (Song et al., 2020).
Conclusion
In this study, stomach contents and stable isotope analysis were used to determine the feeding situation and nutritional relationships of three tuna species in the Solomon Islands. The food sources of the tuna species were wide, with high phenotypic composition (BPC) and low intraspecific food overlap. The feeding intensity and nutrient location of BET were higher than those of YFT and LFT. BET had a greater niche breadth based on the ratio of carbon and nitrogen stable isotopes. There was no significant overlap of food among the three species, although there was some competition; however, because of the differences in feeding times and depths, they fed on different prey, which can maximize the use of resources and reduce competition. Understanding the trophic interactions within and among fishery resources is useful in assessing the ecological role of the Solomon Islands and supporting the development of management policies based on an ecosystem approach. The combined use of multiple methods, such as gastric content analysis and stable isotope analysis, can also provide the basis for further analysis of food web dynamics to develop ecosystem models of energy flow. Finally, owing to the economic importance of these predators, further consideration of ontogeny patterns, isotopic information on food, and seasonal variation is required to better understand spatiotemporal changes in feeding habits and nutritional dynamics.
Data Availability Statement
The original contributions presented in the study are included in the article/Supplementary Material. Further inquiries can be directed to the corresponding author.
Ethics Statement
The animal study was reviewed and approved by the Zhejiang Marine Fisheries Research Institute.
Author Contributions
RRJ designed the paper and the experiment, and FY wrote the paper, these authors contributed equally to this work. RY adjusted and tested the equipment. MZL helped with the analysis and discussions. WBZ assisted with the experiment. AG coordinated the sampling. LWL offered technical support. FC contributed to the conception of the study. All authors contributed to the article and approved the submitted version.
Funding
This study was supported by grants from the Chinese Ministry of Science and Technology through the National Key Research and Development Program of China (2019YFD0901405, 2020YFD0901205), Key Research and Development program of Zhejiang Province (2018C02026), and Routine monitoring project of Zhejiang distant-fishery resources.
Acknowledgements
We thank Feng Cheng and the technical staff from the Zhejiang Marine Fisheries Research Institute for their assistance with sample collection and stomach content analyses.
Conflict of Interest
The authors declare that the research was conducted in the absence of any commercial or financial relationships that could be construed as a potential conflict of interest.
Publisher’s Note
All claims expressed in this article are solely those of the authors and do not necessarily represent those of their affiliated organizations, or those of the publisher, the editors and the reviewers. Any product that may be evaluated in this article, or claim that may be made by its manufacturer, is not guaranteed or endorsed by the publisher.
Supplementary material
The Supplementary Material for this article can be found online at: https://www.frontiersin.org/articles/10.3389/fmars.2022.961990/full#supplementary-material
References
Albuquerque F. V., Navia A. F., Vaske T. Jr., Crespo O., Hazin F. H. V. (2019). Trophic ecology of large pelagic fish in the saint Peter and saint Paul archipelago, Brazil. Mar. Freshw. Res. 70, 1402–1418. doi: 10.1071/MF18352
Allain V., Fernandez E., Hoyle S. D., Caillot S., Jurado-Molina J., Andréfouët S., et al. (2012). Interaction between coastal and oceanic ecosystems of the western and central pacific ocean through predator-prey relationship studies. PLos One 7, e36701. doi: 10.1371/journal.pone.0036701
Amundsen P. A., Gabler H. M., Staldvik F. J. (1996). A new approach to graphical analysis of feeding strategy from stomach contents data: modification of the Costello, (1990) method. J. Fish Biol. 48, 607–614. doi: 10.1111/j.1095-8649.1996.tb01455.x
Braga R. R., Bornatowski H., Simões Vitule J. R. (2012). Feeding ecology of fishes: an overview of worldwide publications. Rev. Fish Biol. Fish. 22, 915–929. doi: 10.1007/s11160-012-9273-7
Caut Stéphane., Angulo E., Courchamp F. (2009). Variation in discrimination factors (δ15N and δ13C):the effect of diet isotopic values and applications for diet reconstruction. J. Appl. Ecol. 46, 443–453. doi: 10.1111/j.1365-2664.2009.01620.x
Costa A. F., Botta S., Siciliano S., Giarrizzo T. (2020). Resource partitioning among stranded aquatic mammals from Amazon and northeastern coast of Brazil revealed through carbon and nitrogen stable isotopes. Sci. Rep. 10, 12897. doi: 10.1038/s41598-020-69516-8
Costello M. J. (1990). Predator feeding strategy and prey importance: A new graphical analysis. J. Fish Biol. 36, 261–263. doi: 10.1111/j.1095-8649.1990.tb05601.x
Crozier W. W. (1985). Observations on the food and feeding of the angler-fish, lophim piscatorius l., in the northern Irish Sea. J. Fish Biol. 27, 655–665. doi: 10.1111/j.1095-8649.1985.tb03210.x
Davenport S. R., Bax N. J. (2002). A trophic study of a marine ecosystem off southeastern Australia using stable isotopes of carbon and nitrogen. Can. J. Fish. Aquat. Sci. 59, 514–530. doi: 10.1139/f02-031
Denley D., Metaxas A., Scheibling R. (2020). Subregional variation in cover and diversity of hard coral (Scleractinia) in the Western province, Solomon islands following an unprecedented global bleaching event. PLos One 15, e0242153. doi: 10.1371/journal.pone.0242153
Feinsinger P., Spears E. E., Poole R. W. (1981). A simple measure of niche breadth. Ecology. 62, 27–32. doi: 10.2307/1936664
Figueiredo M., Morato T., Barreiros J. P., Afonso P., Santos R. S.. (2005). Feeding ecology of the white seabream,Diplodus sargus, and the ballan wrasse, labrus bergylta, in the Azores. Fish Res. 75, 107–119. doi: 10.1016/j.fishres.2005.04.013
Froese R., Pauly D. (2022). FishBase. Available at: https://www.fishbase.se/search.php.
Gee J. M. (1989). An ecological and economic review of meiofauna as food for fish. Zool. J. Linn. Soc 96, 243–261. doi: 10.1111/j.1096-3642.1989.tb01830.x
Hobson K. A., Piatt J. F., Pitocchelli J. (1994). Using stable isotopes to determine seabird trophic relationships. J. Anim. Ecol. 63, 786–798. doi: 10.2307/5256
Hyslop E. J. (1980). Stomach contents analysis-a review of methods and their application. J. Fish Biol. 17, 411–429. doi: 10.1111/j.1095-8649.1980.tb02775.x
Jackson A. L., Inger R., Parnell A. C., Bearhop S. (2011). Comparing isotopic niche widths among and within communities: SIBER- stable isotope Bayesian ellipses in r. J. Anim. Ecol. 80, 595–602. doi: 10.1111/j.1365-2656.2011.01806.x
Kent E. C., Volker H. N. (2001). “FAO species identification guide for fishery purposes,” in The living marine resources of the Western central pacific, vol. Volume 1-6. Food and Agriculture Organization of the United Nations.
King J. E., Ikehara I. I. (1956). Comparative study of food of bigeye and yellowfin tuna in the central. Fish. Bull. 57, 61–85.
Koga S. (1958). On the stomach contents of tuna in the west Indian ocean. Bull. Faculty Fish 6, 85–92.
Kong Y. F., Wu Zh.X., Yan Y. R. (2020). Trophic structure of pelagic fishery organism assemblage in the central and western south China Sea in spring revealed by carbon and nitrogen stable isotope analysis.Chin. J. Appl. Ecol. 31, 3559–3567. doi: 10.13287/j.1001-9332.202010.038
Layman C. A., Arrington A. A., Montaña C. G., Post D. M. (2007). Can stable isotope ratios. Provide for community-wide measures of trophic structure? Ecology 88 (1), 42–48. doi: 10.1890/08-0167.1
Li Y. K., Cheng Z. A., Gong Y., Chen X. J. (2021). A review on the methods used in trophic niche studies of marine animals and their applications. J. Trop. Oceanogr. 40, 143–156. doi: 10.11978/2020071
Li B., Yang X. F., Wang J. X., Yi M. R., He X. B., Tao J. Y., et al. (2019). Feeding ecology of bigeye tuna (Thunnus obesus) in the south of China Sea. Oceaanologia Limnologia Sinica. 50, 336–346. doi: 10.11693/hyhz20180900215
Li Y., Zhang Y., Dai X. (2016). Trophic interactions among pelagic sharks and Large predatory. teleosts in the northeast central pacific. J. Exp. Mar. Biol. Ecol. 483, 97–103. doi: 10.1016/j.jembe.2016.04.013
Lucena F. M., Vaske T., Ellis J. R., O’Brien C. M. (2000). Seasonal variation in the diets of bluefish, pomatomus saltatrix (Pomatomidae) and striped weakfish, cynoscion guatucupa (Sciaenidae) in southern Brazil: Implications of food partitioning. Environ. Biol. Fishes. 57, 423–434. doi: 10.1023/A:1007604424423
Martins K., Pelage L., Justino A. K. S., Frédou F. L., Júnior T. V., Loc'h F. L., et al. (2021). Assessing trophic interactions between pelagic predatory fish by gut content and stable isotopes analysis around Fernando de noronha archipelago (Brazil), equatorial west Atlantic. J. Fish Biol. 99, 1576–1590. doi: 10.1111/jfb.14863
Ménard F., Labrune C., Shin Y. J., Asine A., Bard F. (2006). Opportunistic predation in tuna: a size-based approach. Mar. Ecol. Prog. Ser. 323, 223–231. doi: 10.3354/meps323223
Mendoza-Ávila M., Zavala-Zambrano G., Galván-Magaña F., Loor-Andrade P. (2017). Feeding habits of wahoo (Acanthocybium solandri) in the eastern pacific ocean. J. Mar. Biol. Ass. UK. 97, 1505–1510. doi: 10.1017/S0025315416000850
Moteki M., Arai M., Tsuchiya K., Okamoto H. (2001). Composition of piscine prey in the diet of large pelagic fish in the eastern tropical pacific ocean. Fisheries. Sci. 67, 1063–1074. doi: 10.1046/j.1444-2906.2001.00362.x
Perrin W. F., Warner R. R., Fiscus C. H., Holts D. B. (1973). Stomach contents of porpoise, stenella spp., and yellowfin tuna, thunnus albacares, in mixed-species aggregations. Fishery Bull. 71, 1077–1092.
Peterson B. J., Fry B. (1987). Stable isotopes in ecosystem studies. Annu. Rev. Ecol. Syst. 18, 293–320. doi: 10.1146/annurev.es.18.110187.001453
Pinkas L. (1971). Food habits of albacore, bluefin tuna, and bonito in California waters. Fish. Bull. 152, 1–105.
R Core Team. (2021). R: A language and environment for statistical computing. Vienna, Austria: R Foundation for Statistical Computing. Available at: https://www.R-project.org/.
Saito S. (1973). “Studies on fishing of albacore, thunnus alalunga(Bon-naterre) by experimental deep sea tuna long – line,” in Memoirs of the Faculty of Fisheries. (Hokkaido University). 21, 107–184. Available at: http://eprints.lib.hokudai.ac.jp/dspace/bitstream/2115/21856/1/2.
Shi X. F., Wang X., Wang Y. X., Shi J. G., Zhang J. (2022). Feeding biology of yellowfin tuna(Thunnus albacares) in tropical central and western pacific ocean. S. China Fish. Sci. 18, 43–51. doi: 10.12131/20210140
Song L. M., Chen X. J., Xu L. X. (2004). Preliminary analysis of biological characteristics of yellowfin tuna thunnus albacares in the tuna longline fishing ground of the central Atlantic ocean. Oceanologia Limnologica Sinica. 35, 538–542. doi: 10.3321/j.issn:0029-814X.2004.06.009
Song Y. H., Xue Y., Xu B. D., Zhang C., Ren Y. P. (2020). Composition of food and niche overlap of three sciaenidae species in haizhou bay. J. Fish. China. 44, 2017–2027.
Swanson H. K., Lysy M., Power M., Stasko A. D., Johnson J. D., Reist J. D., et al. (2015). A new probabilistic method for quantifying n-dimensional ecological niches and niche overlap. Ecology. 96, 318–324. doi: 10.1890/14-0235.1
Tao Y. J., Mo M., He (2017). Feeding habits and ontogenetic diet shifts of yellowfin tuna (Thunnus albacores) in the south China Sea. Process Fishery Sci. 38, 1–10.
Tripp-Valdez A., Galván-Magaña F., Ortega-García S. (2015). Food sources of common dolphinfish (Coryphaena hippurus) based on stomach content and stable isotopes analyses. J. Mar. Biol. Assoc. United Kingdom. 95, 579–591. doi: 10.1017/S0025315414001842
Valerie A., Emilie F., Simon D. H., Sylvain C., Jurado-Molina J., Andréfouët S., et al. (2012). Interaction between coastal and oceanic ecosystems of the Western and central pacific ocean through predator-prey relationship studies. PLos One 7 (5), e36701. doi: 10.1371/journal.pone.0036701
Wang J., Jiang R. J., Hu C. L., Li Z., Xiao Y., Xu Y. J., et al. (2021). Feeding ecology of engraulis japonicus based on stomach contents and stable isotope. Ying Yong Sheng Tai Xue Bao. 32, 2035–2044. doi: 10.13287/j.1001-9332.202106.029
Wang X. F., Xu L. X., Zhou Ch., Zhu G. P., Tang H. (2013). The relationship between fishing success and feeding status in skipjack tuna katsuwonus pelamis in tuna purse seine. J. Dalian Ocean Univ. 28, 622–626. doi: 10.3969/j.issn.2095-1388.2013.06.020
Weng J., Lee M., Liu K., Hsu M. S., Hung M. K., Wu L. J., et al. (2015). Feeding ecology of juvenile yellowfin tuna from waters southwest of Taiwan inferred from stomach contents and stable isotope analysis. Mar. Coast. Fish. 7, 537–548. doi: 10.1080/19425120.2015.1094157
White A. T., Aliño P. M., Cros A., Fatan N. A., Green A. L., Teoh S. J., et al. (2014). Marine protected areas in the coral triangle: progress, issues, and options. Coast. Management. 42, 87–106. doi: 10.1080/08920753.2014.878177
Willson J. D., Winne C. T., Pilgrim M. A., Romanek C. S., Gibbons J. W. (2010). Seasonal variation in terrestrial resource subsidies influences trophic niche width and overlap in two aquatic snake species: a stable isotope approach. Oikos. 119, 1161–1171. doi: 10.1111/j.1600-0706.2009.17939.x
Xu L. X., Zhu G. P., Song L. M. (2008). Feeding behavior of thunnus obesus in the west-central Indian ocean. J. Fish. China. 03, 387–394. doi: 10.3321/j.issn:1000-0615.2008.03.009
Yan Y. R., Zhang W. K., Lu H. S., Wang X. F., Lai J. Y. (2012). Using stable isotopes to analyze feeding habits and trophic position of hairtail (Trichiurus lepturus) from the beibu gulf, south China sea. Oceaanologia Limnologia Sinica. 43, 192–200. doi: 10.11693/hyhz201201031031
Young J. W., Lansdell M. J., Campbell R. A., Cooper S. O., Francis Juanes Guest M. A., et al. (2010). Feeding ecology and niche segregation in oceanic top predators off eastern Australia. Mar. Biol. 157, 2347–2368. doi: 10.1007/s00227-010-1500-y
Zhang X. J., Cheng J. H., Shen W., Liu Z. L. (2010). Feeding ecology of lophius litulon in the south of yellow Sea. Acta Ecol. Sin. 30, 3117–3125. doi: 10.1016/S1872-5813(11)60001-7
Zhu W. J., Xu L. X., Jiang J. J., Chen J. T. (2015). Fishery biology of albacore thunnus alalunga in the north pacific ocean. J. Dalian Ocean Univ. 30, 546–552. doi: 10.16535/j.cnki.dlhyxb.2015.05.018
Zhu G. P., Xu L. X., Zhou Y. Q., Song L. M. (2008a). Feeding habits and its seasonal variations of thunnus albacares in the west-central Indian ocean. J. Fish. China. 32, 725–732. doi: 10.3724/SP.J.00001
Zhu G. P., Zhou Y. Q., Xu L. X. (2008b). Long-term changes in the mean trophic level of tuna fishery in the Indian ocean. J. Dalian Ocean Univ. 23, 484–488. doi: 10.3969/j.issn.1000-9957.2008.06.015
Keywords: Solomon Islands, tuna, food composition, carbon and nitrogen stable isotopes, trophic niche
Citation: Jiang RJ, Yang F, Chen F, Yin R, Liu MZ, Zhu WB, Guo A and Liu LW (2022) Assessing trophic interactions among three tuna species in the Solomon Islands based on stomach contents and stable isotopes. Front. Mar. Sci. 9:961990. doi: 10.3389/fmars.2022.961990
Received: 05 June 2022; Accepted: 28 June 2022;
Published: 27 July 2022.
Edited by:
Jun Xu, Institute of Hydrobiology, Chinese Academy of Sciences (CAS), ChinaReviewed by:
Binsong Jin, Hangzhou Normal University, ChinaChuanxin Qin, South China Sea Fisheries Research Institute, Chinese Academy of Fishery Sciences (CAFS), China
Copyright © 2022 Jiang, Yang, Chen, Yin, Liu, Zhu, Guo and Liu. This is an open-access article distributed under the terms of the Creative Commons Attribution License (CC BY). The use, distribution or reproduction in other forums is permitted, provided the original author(s) and the copyright owner(s) are credited and that the original publication in this journal is cited, in accordance with accepted academic practice. No use, distribution or reproduction is permitted which does not comply with these terms.
*Correspondence: Feng Chen, Y2YwNDIxMjIzQDE2My5jb20=
†These authors have contributed equally to this work