 Yuanmin Sun1,2,3
 Kunxian Tang1,2,3*Yong Ma1,2,3Xuan Zhu1,4Heyang Li1,2,3Fei Zhang1,2,3Shan Chen1Haiping Huang1
- 1Third Institute of Oceanography, Ministry of Natural Resources, Xiamen, China
- 2Key Laboratory of Marine Ecological Conservation and Restoration, Ministry of Natural Resources, Xiamen, China
- 3Fujian Provincial Key Laboratory of Marine Ecological Conservation and Restoration, Xiamen, China
- 4College of Fisheries, Jimei University, Xiamen, China
The release of pollutants in sediment often causes secondary pollution of seawater. In this paper, marine aquaculture sediment was added to seawater in a coastal land–based mesocosm, and the changes in microbial and physicochemical parameters were measured to study the influence of sediment disturbance on seawater. The results showed that sediment disturbance had adverse effects on seawater. After adding and stirring the aquaculture sediment, the concentration of dissolved oxygen (DO) gradually decreased, and those of nutrients gradually increased; in particular, the concentrations of ammonia and dissolved inorganic phosphorus (DIP) increased most sharply. After day 9, a bloom dominated by Chaetoceros occurred. Concentrations of chlorophyll a (Chl-a) increased, and two obvious Chl-a peaks were observed; the trends of DO and pH were similar to that of Chl-a during the bloom period; and DIP and ammonia were exhausted during periods of Chl-a peaks. During the extinction of algal blooms, the concentrations of Chl-a and DO decreased, whereas those of DIP and ammonia increased. The variation trends of bacteria and viruses were similar to that of Chl-a, with two obvious peaks, which were later than those of Chl-a. There were close connections between Chl-a and nutrients, bacteria and viruses and they showed a trend of changes in turn from nutrients to phytoplankton to bacteria to viruses during the experiment. We concluded that bloom formation was mainly affected by nutrients and weather, and the main reason for bloom decline was the depletion of nutrients. The increase in zooplankton, bacteria, and virus abundance was the ecological effect after the occurrence of algal blooms, and they affected the development of algal blooms.
Introduction
There are large amounts of nutrients in aquaculture sediment, which can be released into water under certain conditions (De Casabianca et al., 1997), causing secondary pollution that may also lead to algal blooms (Rasmussen et al., 2003; Robb et al., 2003; Gao et al., 2014; Lei et al., 2022). The algal blooms may also have other severe influences on marine aquaculture and the marine environment (Anderson et al., 2002; Alonso-Rodriguez and Paez-Osuna, 2003; Gary DiLeone and Ainsworth, 2019; Brown et al., 2020). Therefore, research on the mechanisms of algal bloom formation is important for protecting the marine environment and biology (Ou et al., 2022).
Many authors have researched the conditions of bloom formation, the main parameters during blooms, and the impacts on the environment during bloom decline through field investigations and mesocosm experiments (Tada et al., 2001; Sellner et al., 2003; Gao and Song, 2005; Li et al., 2015; Chen, 2019). A number of studies have shown that nutrients, light intensity, temperature, and so on are important conditions for forming algal blooms (Berges and Falkowski, 2003; Ornolfsdottir et al., 2004; Zohdi and Abbaspour, 2019; Lin et al., 2019). Nutrient limits, weather, zooplankton grazing, and viral lysis are usually key factors causing bloom decline (Evans et al., 2003; Zhang et al., 2018). In particular, the interactions between microbes and phytoplankton have become a hot topic in recent years. Some authors have proposed that bacteria could affect the growth of algae by directly lysing algae, secreting extracellular substances indirectly lysing algae, competing for nutrients and so on (Wu et al., 2003; Zhao et al., 2005; Gao et al., 2021). There are also reports abroad that bacteria can attack the outer membrane of diatom cell walls by hydrolytic enzymes (Bidle and Azam, 1999), but there has been no report in which bacteria can lead to the disappearance of algal blooms. Viruses can infect algae, and many authors consider them to be one of the main causes of bloom decline. However, reports on the mortality rate of phytoplankton by viruses have been significantly different (Jacquet et al., 2002; Zhang et al., 2018). There have been few reports on the effects of various factors together on the formation and extinction impacts of algal blooms.
To explore the impacts of special factors on algal blooms, especially nutrients, bacteria, and viruses, an experiment enriched with marine aquaculture sediment was conducted in a mesocosm. Diatom red tides occur frequently in the sea area where the project was located due to land-based pollution discharge and nutrient input from the Jiulong River (Chen et al., 2013). The main physicochemical and microbial parameters were measured during the experiment. The relationships between chlorophyll a (Chl-a) and nutrients, dissolved oxygen (DO), bacteria, and viruses during the whole period of an algal bloom were revealed. The mechanisms of algal blooms and the potential harm of marine aquaculture sediment to the environment were examined. The purpose of this study is to provide a reference for preventing blooms and reducing the environmental impacts after algal blooms.
Materials and methods
The experiment site
The coastal land–based mesocosm (24°26.11′N, 118°5.49′E) was located in Xiamen, Fujian Province, southeastern China and the western Taiwan Strait, adjacent to southern Xiamen Bay.
Mesocosm construction
Two mesocosm bags were mounted in a concrete pool with bamboo poles. Each enclosure’s length, width, and depth were 5.08, 2.40, and 1.90 m, respectively. The enclosures were composed of 0.15-mm-thick polyethylene film and opened to the air. Two mesocosms were designated A and B. A glass shed was built above the mesocosms.
Methods
Mesocosms A and B were filled with seawater pumped from the adjoining sea and filtered by gunny bags at the same time. Each mesocosm depth was 1.65 m, and the volume was 20.1 m3. In the first afternoon, Mesocosm B was added to marine aquaculture sediment collected from Dongshan Island, Fujian Province, a typical mariculture area that was approximately 150 km away from Xiamen. The wet weight of mud in Mesocosm B was 1,184.82 kg, and the thickness was 6.2 cm. Mesocosm A acted as a control group without mud. During the experiment, the “T” type agitator made of stainless steel pipes was used to agitate the sediment around Mesocosm B approximately 20 times daily, prompting the nutrients in the sediment to be released into the water.
Parameters and analysis methods
Light intensity and transparency were measured with an illuminometer and transparency disk in the field, respectively. Parameters of temperature, salinity, pH, DO, and DO saturation were measured with probes, P4 multiparameters made by WTW, Germany, in the field. Seawater samples were filtered through a 0.45-μm filter membrane, and then, the concentration of Chl-a was measured by a spectrophotometer after extraction in 90% acetone for 24 h at 4°C in darkness. Concentrations of dissolved inorganic phosphorus (DIP), NH4-N, NO2-N, NO3-N, and SiO3-Si were measured with a spectrophotometer within 12 h. Chemical oxygen demand (COD) was measured by the alkaline potassium permanganate method.
Seawater samples were fixed with polyformaldehyde (2% final concentration), filtered onto 0.2-μm pore size, 25-mm-diameter black polycarbonate filters, and stained with di-amidino-phenyl-indole. Then, bacteria were photographed and counted under a fluorescence microscope. Two milliliters of seawater samples were fixed with glutaraldehyde (0.5% final concentration) and frozen at −20°C until laboratory analysis. The samples were stained with SYBR green І, and then, virus abundance was determined by flow cytometry (FCM). Samples were fixed in Lugol’s solution (1% final concentration) in the field, the phytoplankton cell number was counted, and the species were identified under a microscope with an algal counting box.
Sampling time and frequency
Samples were sampled or measured at approximately 12:00 every day, usually once a day, and once every 2~3 days in the last 10 days during postbloom. The samples were collected at 0.5 m below the water surface center for each half mesocosm. The average value calculated from two parallel datasets of each mesocosm is expressed as the mean ± SD.
Experiment of nutrient release from sediment
A total of 100 g (wet weight) of sediment was placed into 1 L of ammonia-free water and fully stirred. After precipitation, the supernatant was filtered through filter paper and 0.45-μm pore size filters to determine the concentrations of DIP, NH4-N, NO2-N, NO3-N, and SiO3-Si.
Data analysis
Linear regression and ANOVA were performed with SPSS software, and the significance level was 0.05.
Results
Nutrient release and water quality before and after sediment addition
The results of the nutrient release experiment from the sediment showed that a large amount of DIP and NH4-N was released from the sediment after full stirring. Concentrations of nutrients in Mesocosm B could theoretically rise to very high levels if fully released after adding aquaculture sediment (Table 1). However, the concentrations of nutrients in Mesocosm B were much lower than the possible concentrations after mud was mixed. The concentrations of DIP and NH4-N, which had the largest increase in the addition and stirring of sediment on the second day, were only 8.7% and 5.7% of the results of the experiment of nutrient release, respectively.
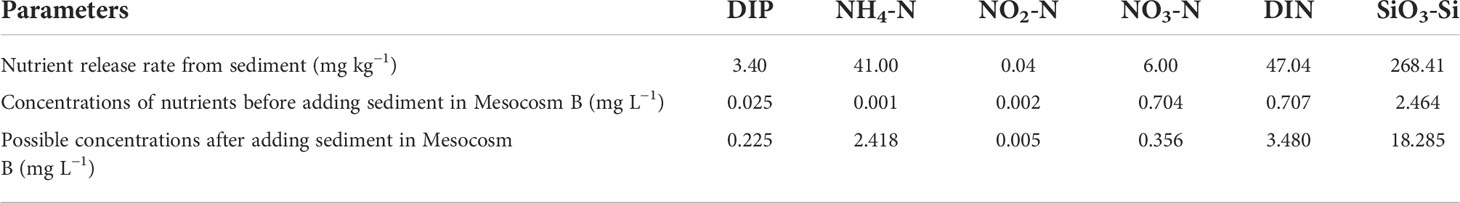
Table 1 Results of the experiment of nutrient release from sediment and nutrient concentrations before and after adding sediment to Mesocosm B.
Although nutrients were not fully released, there were obvious variations in the main parameters of water quality before (day 1) and after (day 2) adding sediment (Figure 1). In particular, the concentrations of NH4-N and DIP increased, and the concentration of DO decreased.
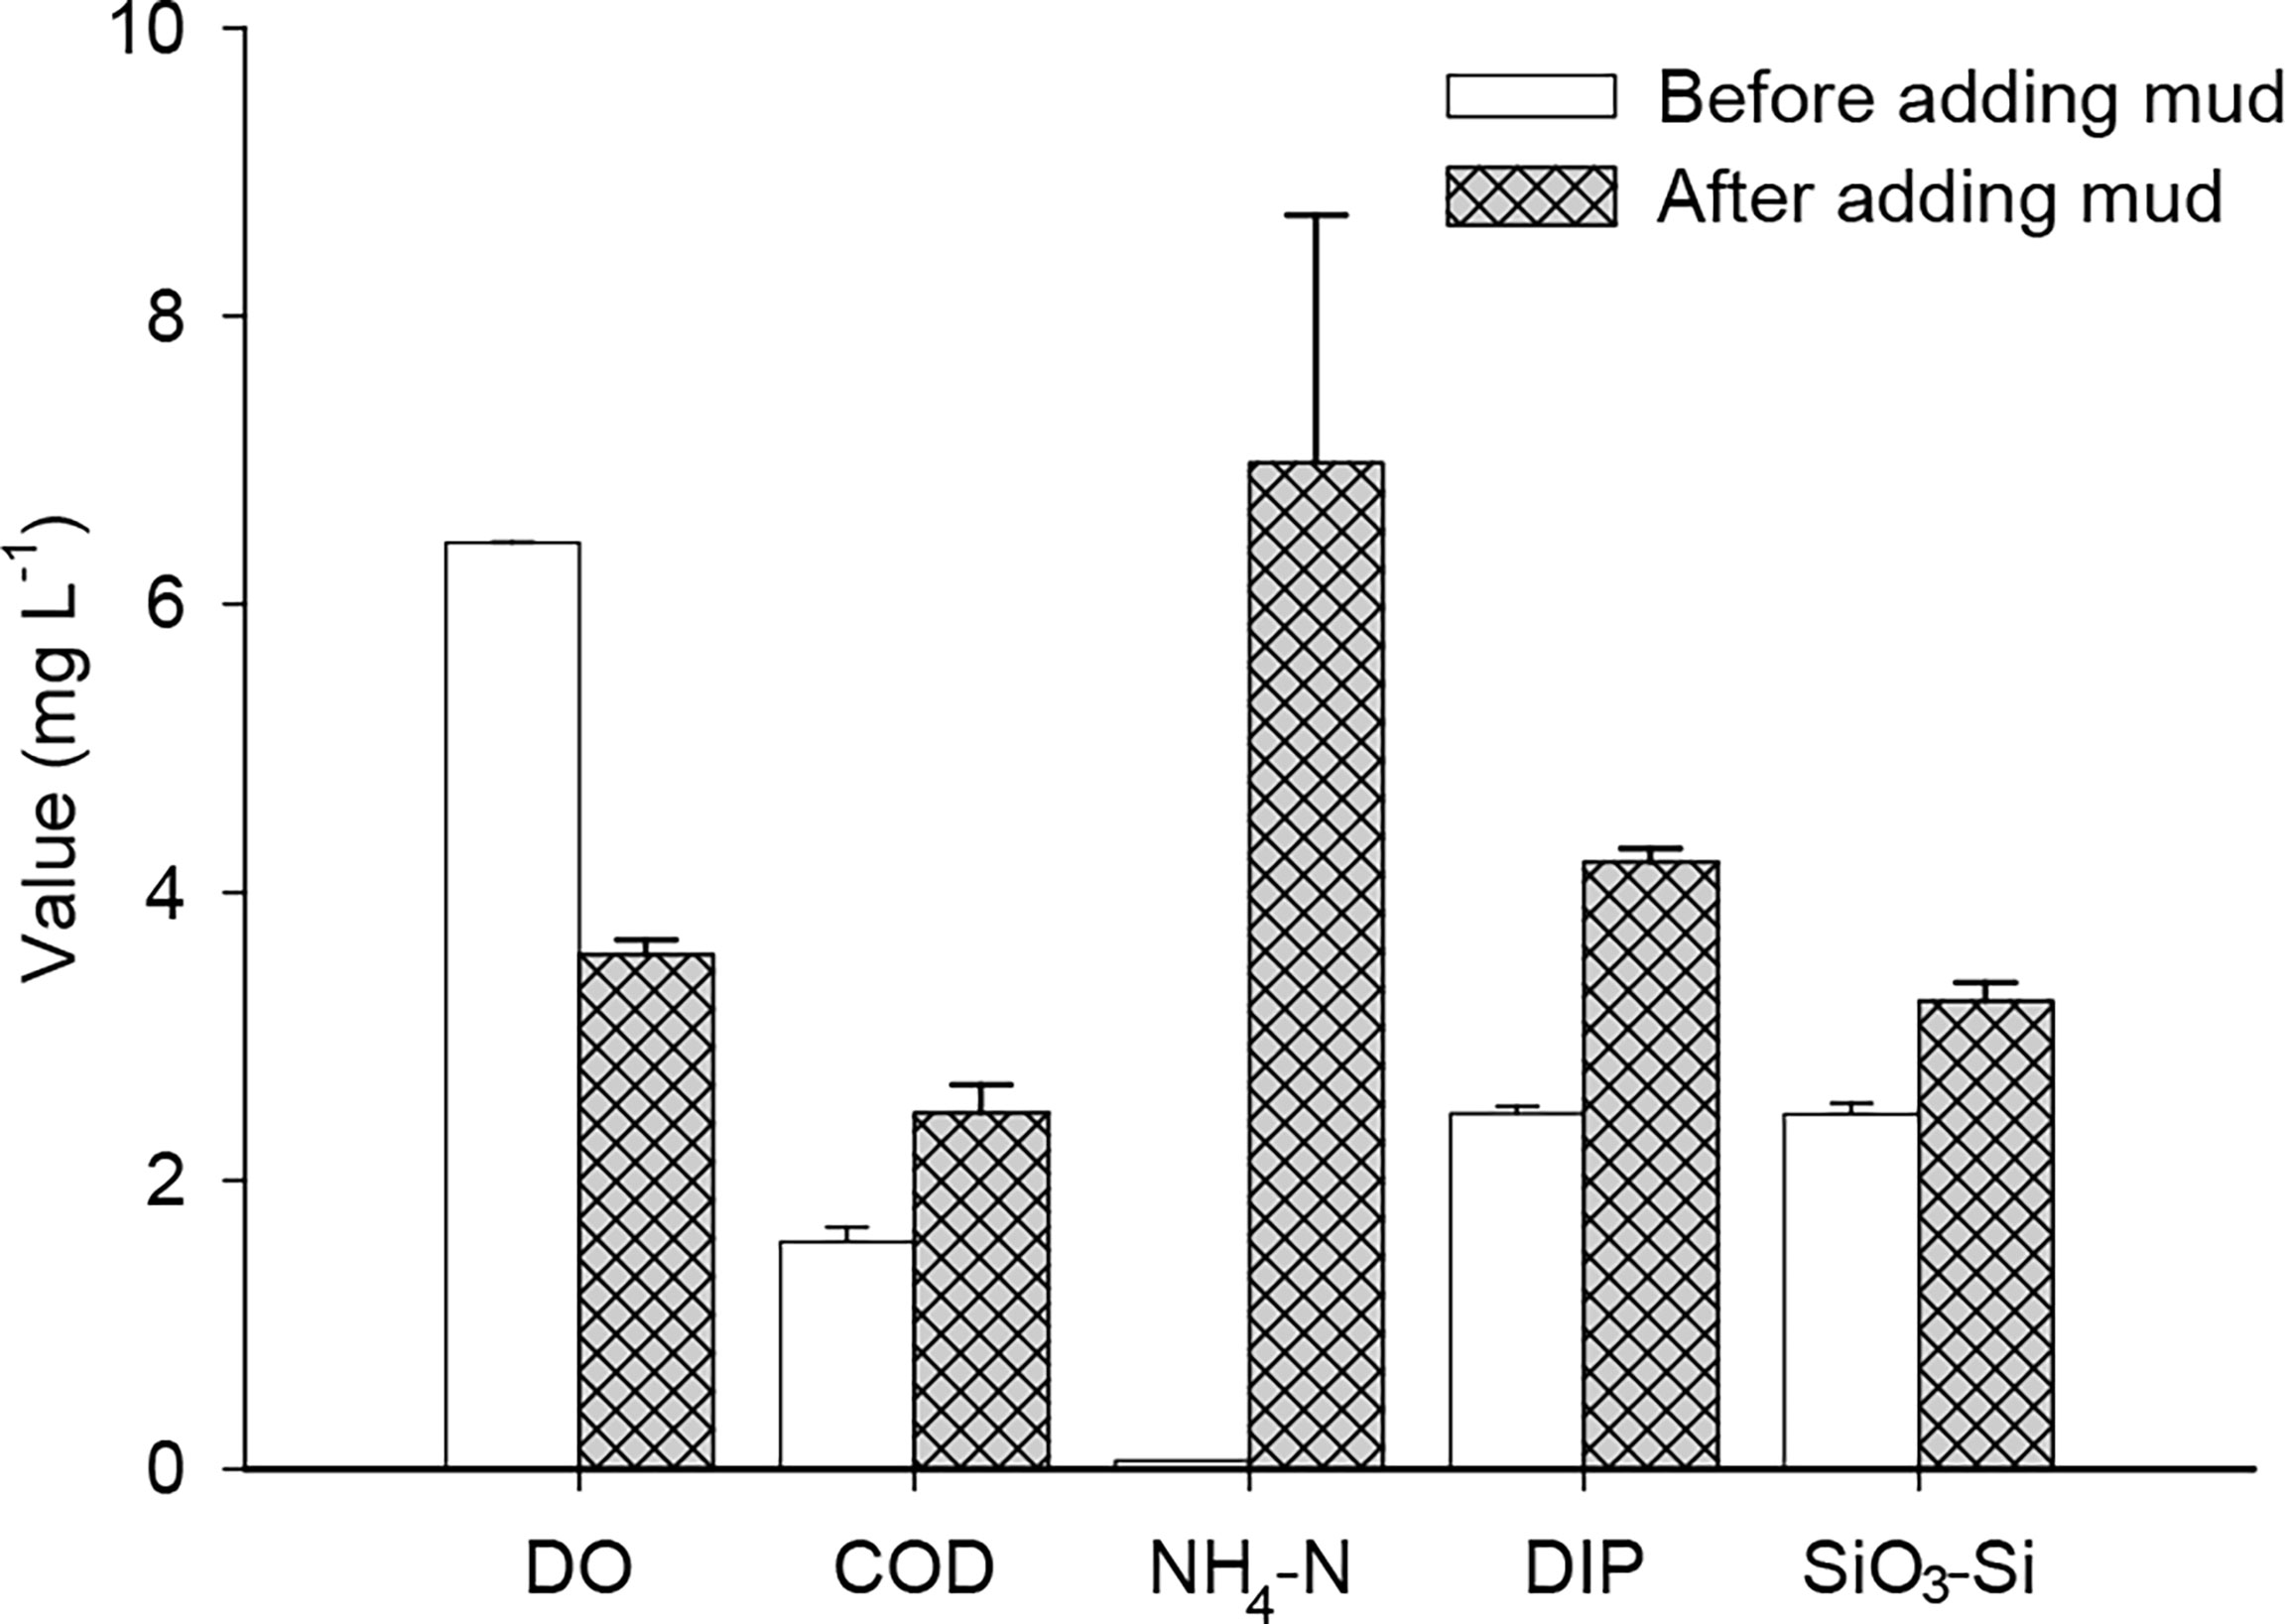
Figure 1 DO, COD, NH4-N, DIP, and SiO3-Si values before and after adding sediment into Mesocosm B (mean ± SD, NH4-N × 50, and DIP × 100).
Main environmental parameters
The results of the main environmental parameters during the experiment are shown in Table 2. Affected by the canopy, the light intensity in mesocosms was approximately 1/4 of the direct sunlight outside. In mesocosms, the light intensity was mostly less than 10,000 lx on cloudy or rainy days and was generally greater than 10,000 lx on sunny days. Transparency in Mesocosm B usually ranged from 0.7 to 1.1 m, except at approximately 0.5 m during blooms, and the lowest value was 0.2 m after adding sediment. In contrast, the transparency in Mesocosm A was greater than 1.65 m at all times. Water temperature increased in general during the experiment, and the difference was small between the two mesocosms. The range of salinity was only approximately 1 during the experiment. The pH value in Mesocosm B gradually decreased after adding and stirring sediment, reaching the lowest value, 7.90, on day 4. pH increased after bloom formation, reaching the highest value, 8.82, on day 17, and then gradually decreased during bloom decline. Concentrations of COD in Mesocosm B increased obviously after adding sediment, reached the highest value, 2.47 mg L−1, and then gradually decreased. During the algal bloom, it reached another peak value of 2.30 mg L−1 on day 16 and then gradually decreased during the bloom decline. Nevertheless, pH and COD values in Mesocosm A were smaller than those in Mesocosm B.
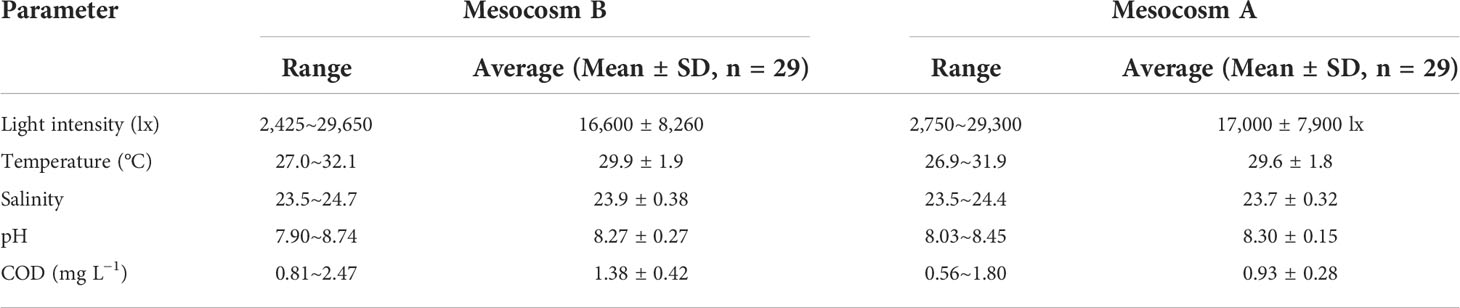
Table 2 Comparisons of the main environmental parameters during the experiment.
Chl-a and plankton
The concentrations of Chl-a were in a low range during the first 8 days in the two mesocosms. Those in Mesocosm B increased rapidly on day 9 and then reached the first peak on day 11, showing that an algal bloom had formed. The concentrations of Chl-a decreased from days 12 to 14 and reached the second peak from days 15 to 17, with the highest values, 64.00 mg m−3. The dominant genus of the bloom was Chaetoceros, whose cell density was 4.44 × 10⁷ cells L−1 and density was 96.2% of the total density at 12:00 on day 16. The highest density appeared at 18:00 that day, which was 1.29 × 10⁸ cells L−1. The diatoms decreased, whereas dinoflagellates increased after day 18. After the formation of blooms, ciliates, fleas, rotifers, and other zooplankton were observed successively. The density of zooplankton was the largest during the bloom decline, and the individual species were small in the early stage and large in the later stage. There were no obvious dominant species of diatoms and dinoflagellates during the third Chl-a peak from days 14 to 18. An algal bloom was observed in Mesocosm A on day 10; however, the concentration and variation range of Chl-a were smaller than those in Mesocosm B, and the highest concentration of Chl-a was only 11.88 mg m−3 (Figure 2A).
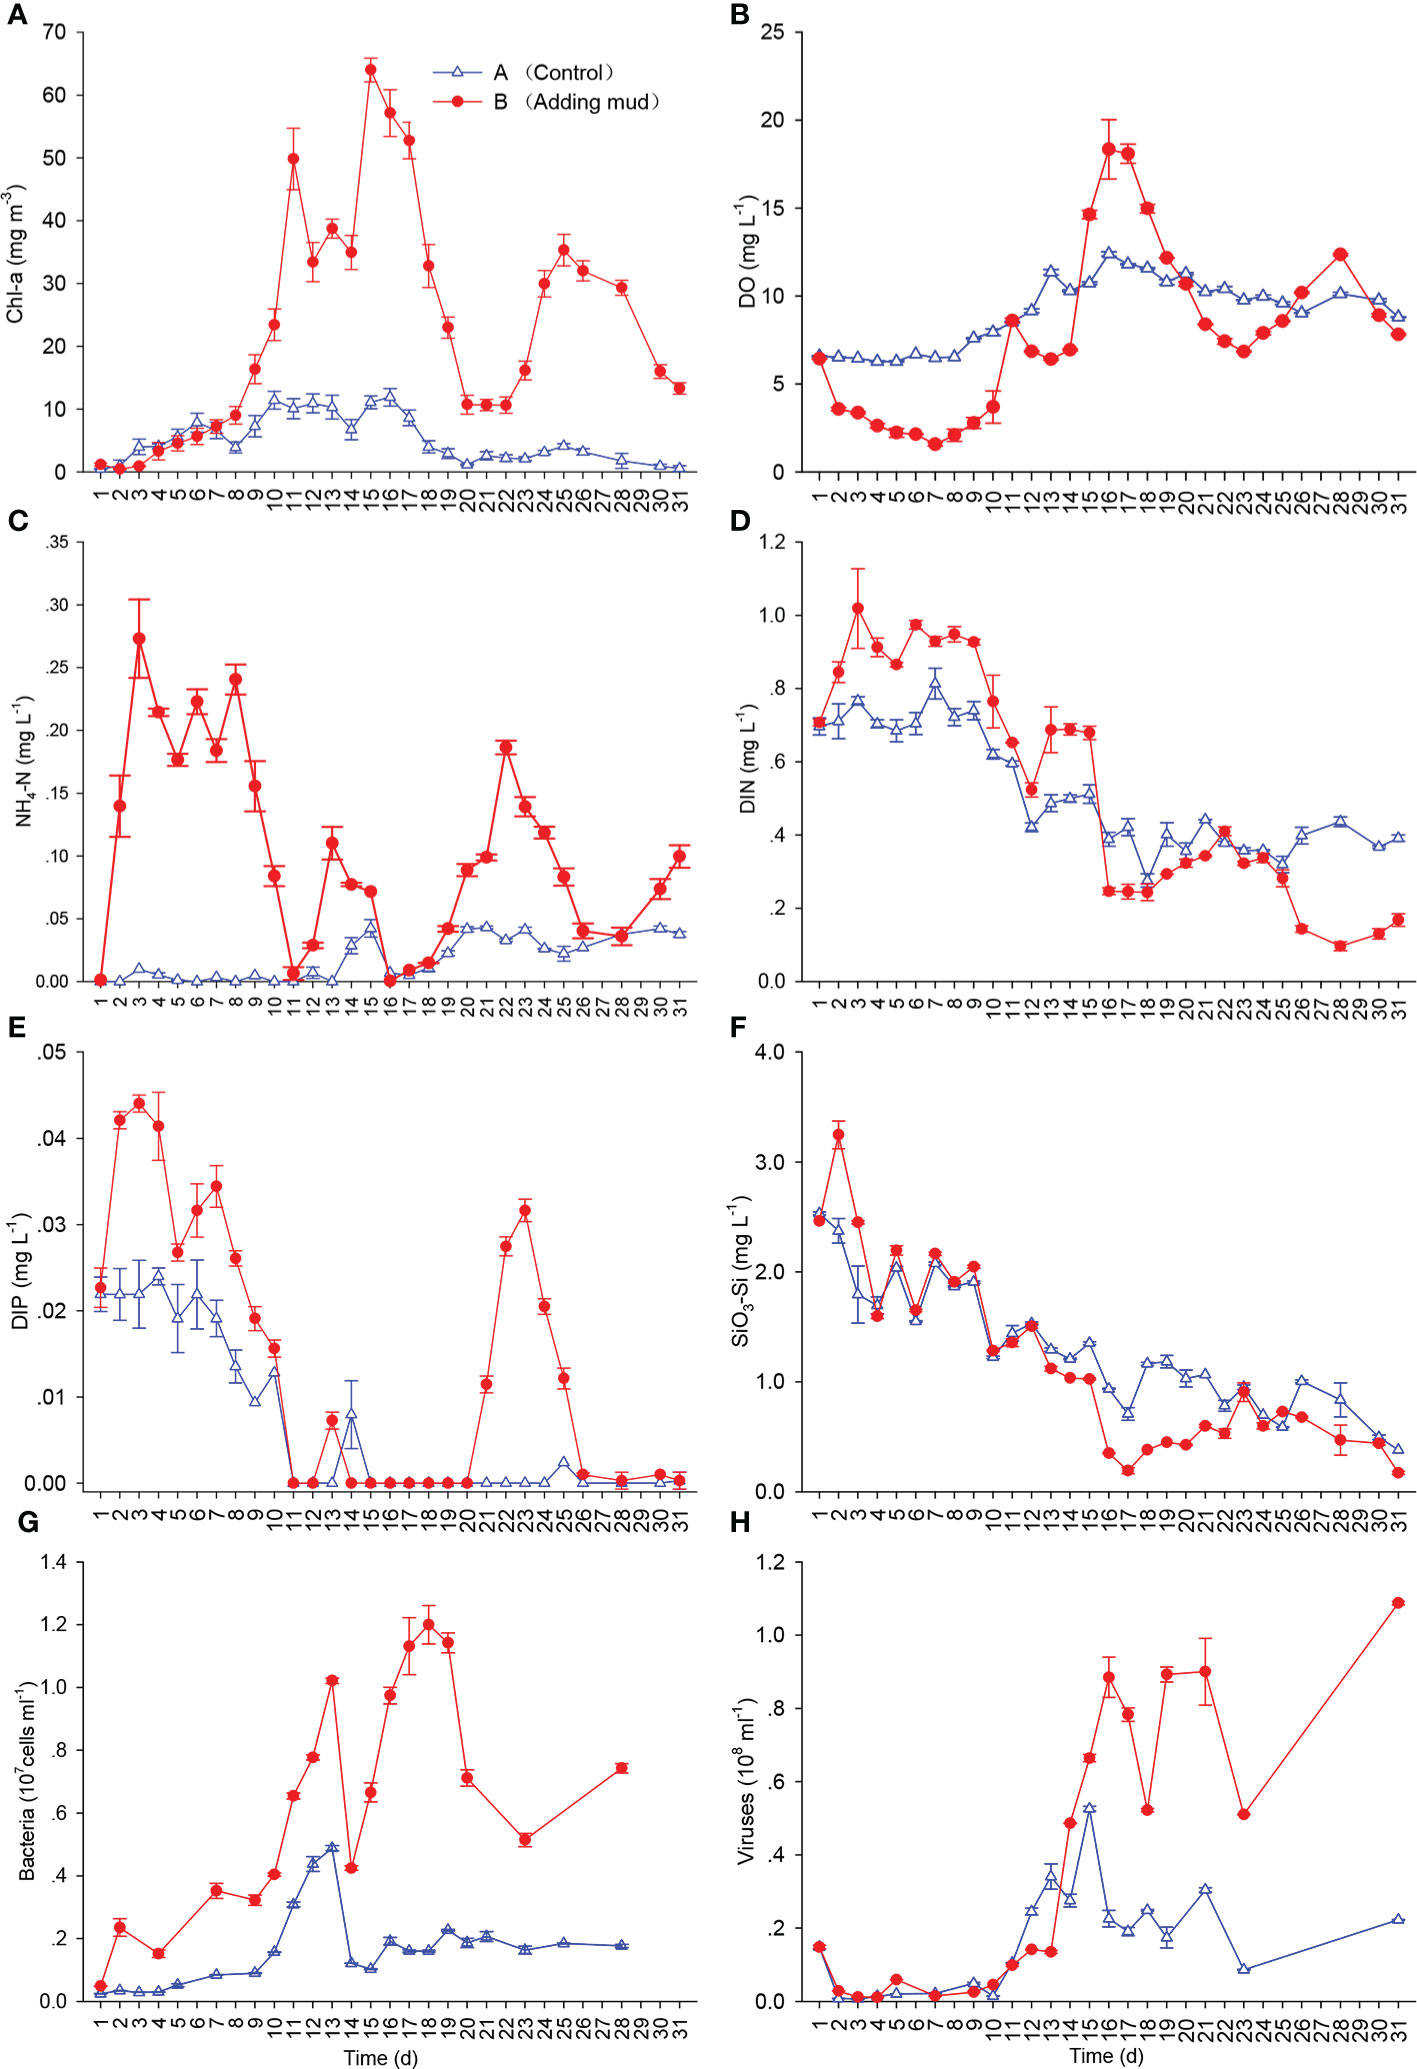
Figure 2 Concentrations of Chl-a (A), DO (B), NH4-N (C), DIN (D), DIP (E), and SiO3-Si (F) and abundances of bacteria (G) and viruses (H) during the experiment (Mean ± SD).
DO
After adding the sediment, the DO concentration gradually decreased in the early period, reaching the lowest value, 1.50 mg L−1, on day 7, and the lowest DO saturation was 21.3% in Mesocosm B, and then DO concentration gradually increased. The DO concentration increased rapidly after bloom formation, and the trend was similar to that of Chl-a in general, reaching the first peak on day 11 and then decreasing from days 12 to 14. DO concentrations reached the second peak on days 16 and 17, when Chl-a concentrations reached the second peak as well, with the highest DO value, 19.53 mg L−1, and the highest DO saturation, 262%, on day 16. DO concentrations gradually decreased during bloom decline and reached another trough on day 23. The variation range of DO concentrations in Mesocosm A was much smaller than that in Mesocosm B (Figure 2B).
Nutrients
As shown in Figures 2C–F, after adding sediment, the concentrations of dissolved inorganic nitrogen (DIN), DIP, and SiO3-Si increased rapidly in the early days and then decreased gradually. They decreased sharply after bloom formation and increased during bloom decline, in general. Variations in DIP concentrations were the largest among the three main nutrients, and DIP was even exhausted when Chl-a concentrations peaked. The concentrations of DIN and SiO3-Si showed downward trends in general during the experiment, but they were never exhausted. The trend of nutrients in Mesocosm A was wholly similar to that in Mesocosm B. The concentration of nutrients in Mesocosm A was relatively stable in the beginning period in cloudy or rainy weather and showed a downward trend under later sunny weather conditions, with a smaller range in Mesocosm A than in Mesocosm B. In contrast, the concentrations of DIN and SiO3-Si in Mesocosm A were higher than those in Mesocosm B in the late period of the experiment.
Bacteria and viruses
The abundance of bacteria in Mesocosm B increased gradually after bloom formation and reached the first peak on day 13 as Chl-a was at a low concentration. After the second Chl-a peak, the abundance of bacteria decreased sharply and then gradually increased following the bloom, reaching the second peak during bloom decline. Two peaks of bacterial abundance were obviously the same as those of Chl-a in Mesocosm B, but the peaks of bacterial abundance were approximately 2 days later than those of Chl-a. The abundance of bacteria in Mesocosm A was lower than that in Mesocosm B, with only one obvious peak (Figure 2G).
The trend of viral abundance was similar to that of bacteria. The viral abundance in Mesocosm B was very low in the early period, and two obvious peaks were observed, but the occurrence time was approximately 2 days later than that of bacteria. The viral abundance was smaller in Mesocosm A than in Mesocosm B, and only one obvious peak was observed (Figure 2H).
Correlation of Chl-a with NH4-N, DIP, bacteria, and virus
The correlation analysis results of the main environmental parameters and Chl-a are shown in Table 3. The F-values of DIP, DIN, and SiO3-Si were all significantly negatively related to Chl-a. The R2 and F-values of DIP were larger than those of DIN and SiO3-Si, and the P-value was lower than those of DIN and SiO3-Si. In the three types of DIN, only NH4-N was significantly negatively correlated with Chl-a. Significant relationships were also found between DO concentrations, pH values, and Chl-a concentrations. No relationship was found between light intensity and Chl-a during the whole experiment, but the relationship was significant in the early stage of the experiment (days 2 to 17). In addition, the DO concentrations and NH4-N concentrations were significantly negatively correlated.

Table 3 Correlation analysis between the main environmental parameters and Chl-a.
There was no significant correlation between Chl-a concentrations and bacterial abundance or viral abundance during blooms. If the time of bacteria and viruses was advanced 2 and 4 days, respectively, then they were significantly correlated (Table 4).
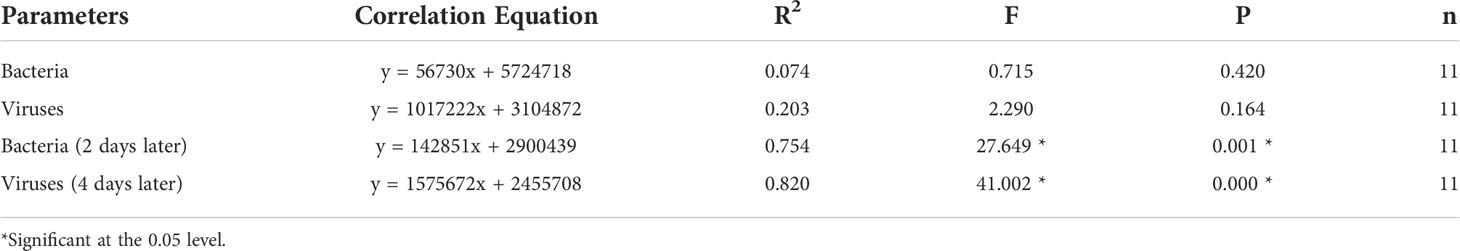
Table 4 Correlation analysis between bacteria, viruses, and Chl-a.
Discussion
Impact of sediment on the environment
Aquaculture sediment contains a large amount of nutrients, which can be effectively released into the water after full stirring (Table 1). The most severe influences on the environment were the sharp increase in the concentrations of DIP and NH4-N and the gradual decrease in the concentrations of DO, whereas the abundance of bacteria increased slightly and the abundance of viruses did not change obviously (Figures 2B, C, E, G, H). On the other hand, nutrients continuously released from the daily stirring of sediment affected the occurrence and maintenance of algal blooms.
Relationship between nutrients and algal blooms
The nutrients provide sources for the formation of algal blooms. The higher concentration of nutrients led to the higher concentration of Chl-a during algal blooms; therefore, obvious algal blooms and higher concentrations of Chl-a were observed in Mesocosm B than in Mesocosm A (Figure 2A). The increase and decrease in Chl-a were accompanied by a sharp decline and increase in nutrients, indicating that the formation of algal blooms consumed a large amount of nutrients. After the disappearance of algal blooms, nutrients were remineralized and released into the water.
DIP was the nutrient limitation factor of algal blooms in the experiment. The mole ratio of DIN and DIP released from sediment was 31:1 and that of water pumped from the sea was 63:1 (Table 1). Both were far higher than the ratio of N and P in normal algal cells (16:1). The mole ratio of DIN and DIP of mixed water in Mesocosm B was 53:1; therefore, it could be seen that the seawater of the experiment had a phosphorus limitation status. Other studies have also shown that the sea area where the project was located has potential P limitation characteristics (He et al., 2021). When the two peaks of Chl-a were formed, DIP was exhausted quickly, whereas DIN and SiO3-Si were never depleted (Figures 2A, D–F). The correlation between DIP concentrations and Chl-a concentrations was the most significant, suggesting that DIP had the closest relationship with Chl-a among the three main nutrients (Table 1). Among the three types of DIN, only NH4-N concentrations were significantly correlated with Chl-a concentrations (Table 1). Because NH4-N can be directly absorbed by phytoplankton and synthesized into amino acids (Carpenter and Dunham, 1985), algae absorb NH4-N during the formation of algal blooms and then absorb NO2-N and NO3-N after NH4-N exhaustion. In addition, NH4-N was produced foremost during bloom decline (Figure 2C); therefore, NH4-N values were the most obvious during the formation and decline of algal blooms.
DIP and NH4-N were exhausted on day 11 during the first Chl-a peak, but DIN concentrations continued to decrease on day 12, indicating that algae could continue to absorb and store nitrogen when phosphorus was depleted. DIP was exhausted again at the beginning of the second Chl-a peak (Figure 2E), but NH4-N was exhausted after two days (Figure 2C), and DIN also maintained a stable period of 3 days (Figure 2D), indicating that there was still sufficient nitrogen in algal cells when the second peak was just formed, which might have been stored during the period when DIP was depleted. Andersen et al. (1991) pointed out that the phosphorus stored in the body could maintain the growth of microalgae for several hours. In this study, Chl-a reached its maximum value on day 15 after DIP was exhausted on day 14, which may be related to the continuous release of DIP from sediment to seawater. However, phosphorus limitation arrested the growth of microalgae, and the Chl-a concentration and algal cell density decreased gradually (Figures 2A, E). This indicated that phosphorus limitation was one of the main reasons for the disappearance of this bloom.
Relationship between bacteria and algal blooms
The results showed that the abundance of bacteria increased after algal bloom formation and reached peaks during bloom decline. A significant increase in the number of debris in the water during bloom decline was observed by microscopy, and a large number of bacteria were often observed on the surface under a fluorescence microscope. Riemann et al. (2000) pointed out that dead diatoms would be quickly invaded by bacteria with a strong particle hydrolysis function, and the proportion of adherent bacteria during late blooms was much higher than that during early blooms.
Although the abundance of bacteria peaked after the first Chl-a peak decline (days 12~13), the second Chl-a peak formed rapidly as the weather became clear (Figures 2A, G), indicating that bacteria could not effectively control the formation of algal blooms. Riemann et al. (2000) also found that the abundance of bacteria in the early stage of algal blooms was large, but it did not hinder the formation of algal blooms. Therefore, the role of bacteria was to degrade cell detritus and accelerate nutrient cycling.
Relationship between viruses and algal blooms
A large number of viruses can effectively infect a considerable part of the phytoplankton community (Fuhrman, 1999). Algal dynamics could be controlled by reducing the number of hosts or preventing the number of algae from reaching a high level (Brussaard, 2004). There have also been reports of the isolation of Trichomonas viruses in the East China Sea (Wu et al., 2011). In this study, the abundance of viruses did not increase obviously as the Chl-a concentration decreased (days 12~14). The abundance decreased from days 16 to 18 during the bloom decline (Figures 2H), indicating that viruses did not play an important role in the bloom decline, and the reduction in the number of algal cells did not release a large number of viruses. The effects of viruses on algal death have varied greatly in different research studies. Some studies have shown that the mortality of algae caused by viruses is only 2%–10% (Waterbury and Valois, 1993; Cottrell and Suttle, 1995). Nevertheless, Jacquet et al. (2002) estimated that 230–400 viruses could be released from each algal cell after lysis, and the mortality rate of viral infection per day accounted for 40%–100% of the total net mortality of algal cells. Evans et al. (2003) estimated that the virus-induced mortality of Micromonas ranged from 10% to 34% every day. Therefore, they considered that viruses played an important role in bloom decline. However, their experiments only measured the density of phytoplankton and the abundance of viruses and did not measure the abundance of bacteria nor did they confirm whether these viruses came from the lysis of algal cells or whether they all had an algal-killing function. They may have also regarded bacterial viruses as alga viruses, and the role of viruses may have been overestimated. In this study, the viruses could be divided into algal viruses and bacterial viruses by flow cytometry, and bacterial viruses accounted for 93.0 ± 3.5% of the total viruses. Moreover, the trend of viruses was similar to that of bacteria, and the peaks of viruses were approximately 2 days later than those of bacteria (Figures 2G, H). These results indicated that viruses were released mainly from lysed cells of bacteria, and algal viruses only accounted for a small fraction of the total viruses. Winter et al. (2005) also pointed out that viruses mainly came from the infection of prokaryotic organisms, and algal viruses did not contribute significantly to the virus pool. Schroeder et al. (2003) considered that although several viral genotypes appeared at the beginning of an Emiliania huxleyi bloom, only a small number of viral genotypes eventually continued to show algaecidal function in the late bloom. Therefore, we point out that viruses mainly came from bacterial infection and did not play a key role in the extinction of algal blooms. In addition, the first peak of viruses occurred during the sustained phase of the second Chl-a peak (Figures 2A, H), indicating that viruses could not effectively control the formation of algal blooms.
Relationship between bacteria, viruses, and algal blooms
In this study, there was no significant correlation between bacteria, viruses, and Chl-a during algal blooms (Table 4). The main reason for this was that the peak time of bacteria and viruses lagged behind that of Chl-a (Figures 2A, G, H). If the data of bacteria and viruses were advanced by 2 and 4 days, respectively, there was a significant correlation between bacteria, viruses, and Chl-a (Table 4), indicating that phytoplankton, bacteria, and viruses were closely linked in regard to temporal changes. The death of phytoplankton promoted the mass reproduction of bacteria, and bacterial lysis released a large number of viruses. Marchant et al. (2000) found that the abundance of viruses was not significantly correlated with the abundance of bacteria and the concentration of Chl-a in the Southern Ocean, whereas there were significant correlations between bacteria or viruses and Chl-a in other studies (Culley and Welschmeyer, 2002). Different correlations may be related to the duration of algal blooms. If the duration of algal blooms is longer, then there may be a good correlation between bacteria, viruses, and Chl-a in their spatial distribution.
Other factors affecting the formation and extinction of algal blooms
The algal bloom occurred shortly after seawater was pumped into mesocosms, whereas no bloom was observed in the adjacent sea area during that period, showing that the stable water body was beneficial to the formation of algal blooms.
Sufficient light intensity is one of the conditions for the formation of algal blooms (Kana et al., 2004). The number of algal cells decreases sharply when light is insufficient, and algae can grow again after relighting (Berges and Falkowski, 2003). Therefore, the first 9 days of cloudy and rainy weather conditions prevented the formation of algal blooms. The 10th day after the weather turned clear, algal blooms quickly formed, but due to the subsequent days of cloudy and rainy weather, algal blooms declined. The 14th day turned clear and a second peak of algal blooms formed.
Zooplankton grazing on phytoplankton is usually one of the main reasons for bloom decline (Strom et al., 2001). Zooplankton grazing has little effect on phytoplankton during algal blooms but increases during diatom bloom decline (Tsuda et al., 2006). In this study, the density of zooplankton in the early stage of algal blooms was small, which had little effect on algal blooms and could not control the rapid formation of the second algal bloom peak. However, the density of zooplankton increased sharply during the bloom decline. Therefore, zooplankton grazing was another main reason for the bloom decline.
During the algal bloom, the concentration of DO increased, and the concentration of nutrients decreased. Phytoplankton and zooplankton with large densities are ideal food for cultured animals. Therefore, maintaining a certain density of phytoplankton in aquaculture ponds is conducive for improving water quality and promoting the growth of aquacultural organisms.
However, it is difficult to control phytoplankton, and some reasons for this include nutrient depletion and weather changes, which usually cause bloom decline. During bloom decline, the concentration of DO decreased, whereas the concentration of ammonia increased, which is harmful to aquatic animals and leads to disease outbreak and spread.
Research prospects
The formation and extinction of algal blooms were affected by nutrient concentrations, light intensity, and water stability. The extinction process was accompanied by an increase in NH3 concentration and a decrease in DO concentration, which may lead to the deterioration of seawater quality and the outbreak of marine biological diseases. Research on the mechanisms of algal blooms and the early warning and monitoring of algal blooms should be further strengthened to prevent algal blooms and reduce the harm to aquaculture and the ecological environment after algal blooms.
Data availability statement
The original contributions presented in the study are included in the article/supplementary material. Further inquiries can be directed to the corresponding author.
Author contributions
KT and YM conducted the sampling and measurements. HL, SC, and FZ analyzed the results. YS wrote the original manuscript. KT, XZ and HH revised the manuscript. All authors contributed to the article and approved the submitted version.
Funding
This research was supported by National Key R&D Program of China (Grant No. 2020YFA0607603) and Co-construction Program of Xiamen Ocean Research and Development Institute (Grant No. K200701).
Conflict of interest
The authors declare that the research was conducted in the absence of any commercial or financial relationships that could be construed as a potential conflict of interest.
Publisher’s note
All claims expressed in this article are solely those of the authors and do not necessarily represent those of their affiliated organizations, or those of the publisher, the editors and the reviewers. Any product that may be evaluated in this article, or claim that may be made by its manufacturer, is not guaranteed or endorsed by the publisher.
References
Alonso-Rodriguez R., Paez-Osuna F. (2003). Nutrients, phytoplankton and harmful algal blooms in shrimp ponds: A review with special reference to the situation in the gulf of California. Aquaculture 219, 317–336. doi: 10.1016/S0044-8486(02)00509-4
Andersen T., Schartau A. K. L., Paasche E. (1991). Quantifying external and internal nitrogen and phosphorus pools, as well as nitrogen and phosphorus supplied through remineralization, in coastal marine plankton by means of a dilution technique. Mar. Ecol. Prog. Ser. 69, 67–80. doi: 10.3354/meps069067
Anderson D. M, Gilbert P. M., Burkholder J. M. (2002). Harmful Algal Blooms and Eutrophication: Nutrient Sources, Composition, and Consequences. Estuaries 25(4), 704–726. doi: 10.1007/BF02804901
Berges J. A., Falkowski P. G. (2003). Physiological stress and cell death in marine phytoplankton: Induction of proteases in response to nitrogen or light limitation. Limnol. Oceanogr. 43 (1), 129–135. doi: 10.4319/lo.1998.43.1.0129
Bidle K. D., Azam F. (1999). Accelerated dissolution of diatom silica by marine bacterial assemblages. Nature 397, 509–512. doi: 10.1038/17351
Brown A. R., Lilley M., Shutler J., Lowe C., Artioli Y., Torres R., et al. (2020). Assessing risks and mitigating impacts of harmful algal blooms on mariculture and marine fisheries. Rev. Aquacult. 12 (3), 1663–1688. doi: 10.1111/raq.12403
Brussaard C. P. D. (2004). Viral control of phytoplankton populations-a review. J. Eukaryot. Microbiol. 51 (2), 125–138. doi: 10.1111/j.1550-7408.2004.tb00537.x
Carpenter E. J., Dunham S. (1985). Nitrogenous nutrient uptake, primary production, and species composition of phytoplankton in the carmans river estuary, long island, new York. Limnol. Oceanogr. 30 (3), 513–526. doi: 10.4319/lo.1985.30.3.0513
Chen J. (2019). Effects of sand dust addition and nutrient input on phytoplankton in the offshore waters. [master’s thesis] [Xiamen (China)]. Xiamen University.
Chen B., Ji W., Chen J., Lin C., Huang H., Huo Y., et al. (2013). Characteristics of nutrients in the jiulong river and its impact on xiamen water, China. Chin. J. Oceanol. Limn. 31 (5), 1055–1063. doi: 10.1007/s00343-013-2263-3
Cottrell M. T., Suttle C. A. (1995). Dynamics of a lytic virus infecting the photosynthetic marine picoflagellate Micromonas pusilla. Limnol. Oceanog. 40 (4), 730–739. doi: 10.4319/lo.1995.40.4.0730
Culley A. I., Welschmeyer N. A. (2002). The abundance, distribution, and correlation of viruses, phytoplankton, and prokaryotes along a pacific ocean transect. Limnol. Oceanogr. 47 (5), 1508–1513. doi: 10.4319/lo.2002.47.5.1508
De Casabianca M. L., Laugier T., Marinho-Soriano E. (1997). Seasonal changes of nutrients in water and sediment in a Mediterranean lagoon with shellfish farming activity (Thau lagoon, France). Ices. J. Mar. Sci. 54, 905–916. doi: 10.1006/jmsc.1996.0201
Evans C., Archer S. D., Jacquet S., Wilson W. H. (2003). Direct estimates of the contribution of viral lysis and microzooplankton grazing to the decline of a Micromonas spp. population. Aquati. Microb. Ecolo. 30 (3), 207–219. doi: 10.3354/ame030207
Fuhrman J. A. (1999). Marine viruses and their biogeochemical and ecological effects. Nature 399, 541–548. doi: 10.1038/21119
Gao Q., Huang L., Xu W., Chen X., Gu H., Luo Z. (2021). Review on the algicidal effect of bacteria on red tide related algae. J. Fish. Res. 43 (4), 426−435. doi: 10.14012/j.cnki.fjsc.2021.04.010
Gao X., Song J. (2005). Phytoplankton distributions and their relationship with the environment in the changjiang estuary, China. Mar. pollut. Bull. 50 (3), 327–335. doi: 10.1016/j.marpolbul.2004.11.004
Gao D., Zhang M., Hong B. (2014). The quality control of eutrophic culture sediment by immobilized cells and conditions manipulation. Appl. Mechanics Mater. 644-650, 5169–5173. doi: 10.4028/www.scientific.net/AMM.644-650.5169
Gary DiLeone A. M., Ainsworth C. H. (2019). Effects of Karenia brevis harmful algal blooms on fish community structure on the West Florida shelf. Ecol. Model. 392, 250–267. doi: 10.1016/j.ecolmodel.2018.11.022
He E., Ji X., Li X., Li X., Wang D., Yang J. (2021). The spatial-temporal distribution and hazard grading of red tides in fujian coast waters during 2001-2020. Mar. Sci. Bull. 40 (5), 578–590. doi: 1001-6932(2021)05-0578-13
Jacquet S., Heldal M., Iglesias-Rodriguez D., Larsen A., Wilson W., Bratbak G. (2002). Flow cytometric analysis of an Emiliana huxleyi bloom terminated by viral infection. Aquat. Microb. Ecol. 27 (2), 111–124. doi: 10.3354/ame027111
Kana T. M., Lomas M. W., MacIntyre H. L., Cornwell J. C., Gobler C. J. (2004). Stimulation of the brown tide organism, Aureococcus anophagefferens, by selective nutrient additions to in situ mesocosms. Harmful Algae. 3 (4), 377–388. doi: 10.1016/j.hal.2004.06.008
Lei X., Zhang Y., Jiang L., Luo Y., Zhou G., Sun Y., et al. (2022). Zonal macroalgae blooms influenced by different aquaculture discharges in the xuwen fringing reef, southern China. Sci. Total Environ. 822. doi: 10.1016/j.scitotenv.2022.153594
Li B., Lan W., Li T., Li M. (2015). Variation of environmental factors during Phaeocystis globosa blooms and its implications for the bloom decay. Chin. J. Ecol. 34 (5), 1351–1358. doi: 1000-4890(2015) 5-1351-08
Lin S., Ji N., Luo H. (2019). Recent progress in marine harmful algal bloom research. Chin. J. Oceanol. Limn. 50 (3), 495–510. doi: 10.11693/hyhz20180800191
Marchant H., Davidson A., Wright S., Glazebrook J. (2000). The distribution and abundance of viruses in the southern ocean during spring. Antarct. Sci. 12 (4), 414–417. doi: 10.1017/S0954102000000481
Ornolfsdottir E. B., Lumsden S. E., Pinckney J. L. (2004). Phytoplankton community growth-rate response to nutrient pulses in a shallow turbid estuary, Galveston bay, Texas. J. Plankton. Res. 26 (3), 325–339. doi: 10.1093/plankt/fbh035
Ou L., Li J., Zhang X., Wang Z., Zou J., Lu S. (2022). Dissolved organic matter and activities of extracellular enzymes in two lagoons (South China Sea) affected by aquaculture. Front. Mar. Sci. 9. doi: 10.3389/fmars.2022.864579
Rasmussen B., Gustafsson B. G., Stockenberg A., Ærtebjerg G. (2003). Nutrient loads, advection and turnover at the entrance to the Baltic Sea. J. Marine. Syst. 39, 43–56. doi: 10.1016/S0924-7963(02)00246-4
Riemann L., Steward G. F., Azam F. (2000). Dynamics of bacterial community composition and activity during a mesocosm diatom bloom. Appl. Environ. Microbi. 66 (2), 578–587. doi: 10.1128/AEM.66.2.578-587.2000
Robb M., Greenop B., Goss Z., Douglas G., Adeney J. (2003). Application of PhoslockTM, an innovative phosphorus binding clay, to two Western Australian waterways: Preliminary findings. Hydrobiologia 494, 237–243. doi: 10.1023/A:1025478618611
Schroeder D. C., Oke J., Hall M., Malin G., Wilson W. H. (2003). Virus succession observed during an Emiliania huxleyi bloom. Appl. Environ. Microb. 69 (5), 2484–2490. doi: 10.1128/AEM.69.5.2484-2490.2003
Sellner K. G., Doucette G. J., Kirkpatrick G. J. (2003). Harmful algal blooms: Causes, impacts and detection. J. Ind. Microbiol. Biot. 30 (7), 383–406. doi: 10.1007/s10295-003-0074-9
Strom S. L., Brainard M. A., Holmes J. L., Olson M. B. (2001). Phytoplankton blooms are strongly impacted by microzooplankton grazing in coastal north pacific waters. Mar. Biol. 138 (2), 355–368. doi: 10.1007/s002270000461
Tada K., Morishita M., Hamada K., Montani S., Yamada M. (2001). Standing stock and production rate of phytoplankton and a red tide outbreak in a heavily eutrophic embayment, dokai bay, Japan. Mar. pollut. Bull. 42 (11), 1177–1186. doi: 10.1016/S0025-326X(01)00136-9
Tsuda A., Saito H., Nishioka J., Ono T., Noiri Y., Kudo I. (2006). Mesozooplankton response to iron enrichment during the diatom bloom and bloom decline in SERIES (NE pacific). Deep-Sea Res. Pt. II. 53, 2281–2296. doi: 10.1016/j.dsr2.2006.05.041
Waterbury J. B., Valois F. W. (1993). Resistance to Co-occurring phages enables marine synechococcus communities to coexist with cyanophages abundant in seawater. Appl. Environ. Microb. 59 (10), 3393–3399. doi: 10.1128/AEM.59.10.3393-3399.1993
Winter C., Smit A., Herndl G. J., Weinbauer M. G. (2005). Linking bacterial richness with viral abundance and prokaryotic activity. Limnol. Oceanogr. 50 (3), 968–977. doi: 10.4319/lo.2005.50.3.0968
Wu W., An C., Liu X., Wu X., Wen D., Shi M. (2003). Preliminary research on alga removal characteristics and efficiency of the algae-lysing bacterium (Strain B5). Acta Scientiarum Naturalium Universitatis Pekinensis. 39 (4), 489–493. doi: 10.13209/j.0479-8023.2003.074
Wu Q., Cheng K., Yang J., Chen J., Zhao Y., Xu M. (2011). Isolation and characterization of a marine Chaetoceros muelleri virus. Oceanol. Et Limnol. Sinica. 42 (3), 455–459. doi: 10.11693/hyhz201103019019
Zhang Z., Tang L., Zhang Y. (2018). Algae-bacteria interactions and their ecological functions in the ocean. Microbiol. China 45 (9), 2043–2053. doi: 10.13344/j.microbiol.china.180178
Zhao C., Pu Y., Yin L., Lu X., Li X. (2005). Isolation and algicidal effect of a lytic microcystis bacterium from taihu lake. J. Southeast Univ. (Natural Sci. Ed.) 35 (4), 602–606. doi: 1001-0505(2005)04-0602-05
Keywords: algal bloom, nutrient, bacterium, virus, mesocosm experiment, marine aquaculture sediment
Citation: Sun Y, Tang K, Ma Y, Zhu X, Li H, Zhang F, Chen S and Huang H (2022) Variations in nutrients and microbes during the occurrence and extinction of algal blooms: A mesocosm experiment with the addition of marine aquaculture sediment. Front. Mar. Sci. 9:959161. doi: 10.3389/fmars.2022.959161
Received: 01 June 2022; Accepted: 08 July 2022;
Published: 01 August 2022.
Edited by:
Meilin Wu, South China Sea Institute of Oceanology, Chinese Academy of Sciences (CAS), ChinaReviewed by:
Xianmin Wang, Guangdong Ocean University, ChinaYalan Peng, State Oceanic Administration, China
Copyright © 2022 Sun, Tang, Ma, Zhu, Li, Zhang, Chen and Huang. This is an open-access article distributed under the terms of the Creative Commons Attribution License (CC BY). The use, distribution or reproduction in other forums is permitted, provided the original author(s) and the copyright owner(s) are credited and that the original publication in this journal is cited, in accordance with accepted academic practice. No use, distribution or reproduction is permitted which does not comply with these terms.
*Correspondence: Kunxian Tang, dGFuZ2t1bnhpYW5AdGlvLm9yZy5jbg==