 Christopher Tenebruso1
 Shane Nichols-O’Neill1
 Jorge Lorenzo-Trueba1*
 Daniel J. Ciarletta2Jennifer L. Miselis2
- 1Department of Earth and Environmental Studies, Montclair State University, Montclair, NJ, United States
- 2U.S. Geological Survey, St. Petersburg Coastal and Marine Science Center, St. Petersburg, FL, United States
Barrier islands and their associated backbarrier environments protect mainland population centers and infrastructure from storm impacts, support biodiversity, and provide long-term carbon storage, among other ecosystem services. Despite their socio-economic and ecological importance, the response of coupled barrier-marsh-lagoon environments to sea-level rise is poorly understood. Undeveloped barrier-marsh-lagoon systems typically respond to sea-level rise through the process of landward migration, driven by storm overwash and landward mainland marsh expansion. Such response, however, can be affected by human development and engineering activities such as lagoon dredging and shoreline stabilization. To better understand the difference in the response between developed and undeveloped barrier-marsh-lagoon environments to sea-level rise, we perform a local morphologic analysis that describes the evolution of Long Beach Island (LBI), New Jersey, over the last 182 years. We find that between 1840 and 1934 the LBI system experienced landward migration of all five boundaries, including 171 meters of shoreline retreat. Between the 1920s and 1950s, however, there was a significant shift in system behavior that coincided with the onset of groin construction, which was enhanced by beach nourishment and lagoon dredging practices. From 1934 to 2022 the LBI system experienced ~22 meters of shoreline progradation and a rapid decline in marsh platform extent. Additionally, we extend a morphodynamic model to describe the evolution of the system in terms of five geomorphic boundaries: the ocean shoreline and backbarrier-marsh interface, the seaward and landward lagoon-marsh boundaries, and the landward limit of the inland marsh. We couple this numerical modeling effort with the map analysis during the undeveloped phase of LBI evolution, between 1840 and 1934. Despite its simplicity, the modeling framework can describe the average cross-shore evolution of the barrier-marsh-lagoon system during this period without accounting for human landscape modifications, supporting the premise that natural processes were the key drivers of morphological change. Overall, these results suggest that anthropogenic effects have played a major role in the evolution of LBI over the past century by altering overwash fluxes and marsh-lagoon geometry; this is likely the case for other barrier-marsh-lagoon environments around the world.
Introduction
Barrier islands and their associated backbarrier environments, including salt marsh, lagoon, bay, and tidal flat environments, front 10–13% of the world’s coastlines; this percentage is even higher in the United States, which has the greatest length of barrier shoreline and the largest number of barriers of any country in the world (Stutz and Pilkey, 2011). These barrier-marsh-lagoon systems commonly serve as buffer zones between the coastal ocean and mainland development, protecting investments in infrastructure, human population centers, and agricultural lands from the impacts of storm surge and wave energy during storm events (Gedan et al., 2011; Ferreira et al., 2014; Anarde et al., 2018; Passeri et al., 2018; Kopp et al., 2019). In addition to coastal protection, barrier-marsh-lagoon environments also support diverse ecologic communities (Boesch and Turner, 1984; Erwin, 1996; Day et al., 2008), and provide long-term carbon storage (Mcleod et al., 2011; Kirwan and Mudd, 2012; Theuerkauf and Rodriguez, 2017), recreation, and tourism (Barbier et al., 2011).
Notwithstanding recent improvements in understanding the response of barrier islands to anthropogenic effects (Stutz and Pilkey, 2005; Werner and Mcnamara, 2007; McNamara and Werner, 2008a; McNamara and Werner, 2008b; Roberts and Wang, 2012; Hapke et al., 2013; Lazarus and Goldstein, 2019; Lazarus et al., 2021), the interplay between natural processes and human development over decadal to centennial time scales remains poorly quantified. Simultaneous with the increase in human influence on the coasts, the rate of sea-level rise has accelerated from 1.4 mm/year throughout most of the twentieth century to 3.6 mm/year between 2006–2015 (IPCC, 2014; Kopp et al., 2019), which in the absence of coastal engineering can lead to an increase in the rate of barrier island retreat (Deaton et al., 2017; Odezulu et al., 2017). Rapid sea-level rise can also result in drastic changes in the backbarrier environment, including lagoon deepening and lateral expansion, with the associated squeeze of the marsh platforms (Mariotti and Fagherazzi, 2013; Kirwan et al., 2016; Miselis and Lorenzo‐Trueba, 2017; Fagherazzi et al., 2020; Zhang et al., 2020). The rate of overwash sedimentation can be influenced by nearshore and foreshore influences (Houser et al., 2008), as well as changes in backbarrier geometry, which can enhance the ocean-lagoon tidal exchange and increase the rate of barrier landward migration (Walters et al., 2014; Lorenzo-Trueba and Mariotti, 2017; FitzGerald et al., 2018; Lauzon et al., 2018; Reeves et al., 2020). Many coastal communities have decided to limit these effects by investing in either soft (i.e. beach nourishment) or hard (i.e. groins, revetments) engineering structures (Kolodin et al., 2021; Janoff, 2021; Janoff et al., 2020). Additionally, morphological changes in backbarrier environments have been often counteracted with engineering efforts such as hardening of marsh shorelines to prevent marsh-edge erosion, removal of embankments in previously reclaimed saltmarsh land, opening dikes, (re)creating or deepening tidal channels, or vegetating intertidal dredge disposal areas (Weinstein et al., 2001; Teal and Weishar, 2005; Wolters et al., 2005; Hein et al., 2021). It is unclear, however, what the relative effect of these anthropogenic changes is on the evolution of barrier-marsh-lagoon systems over decadal to centennial time scales.
To address this, here we study and quantify the geomorphic change contrast between the undeveloped and developed phases of Long Beach Island (LBI), New Jersey over the past two centuries. Specifically, we analyze historical maps and images that describe the evolution of LBI between 1840 and 2022 and separate it into undeveloped and developed phases. We then couple the undeveloped phase with a numerical model for barrier-marsh-lagoon evolution. LBI (Figure 1) is an ideal location to study the role of anthropogenic effects on barrier-marsh-lagoon evolution as it transitioned from an undeveloped outpost for hunters and fishers to a populated and developed region that hosts an additional 100,000 inhabitants seasonally over the last ~180 years (Lloyd, 2005).
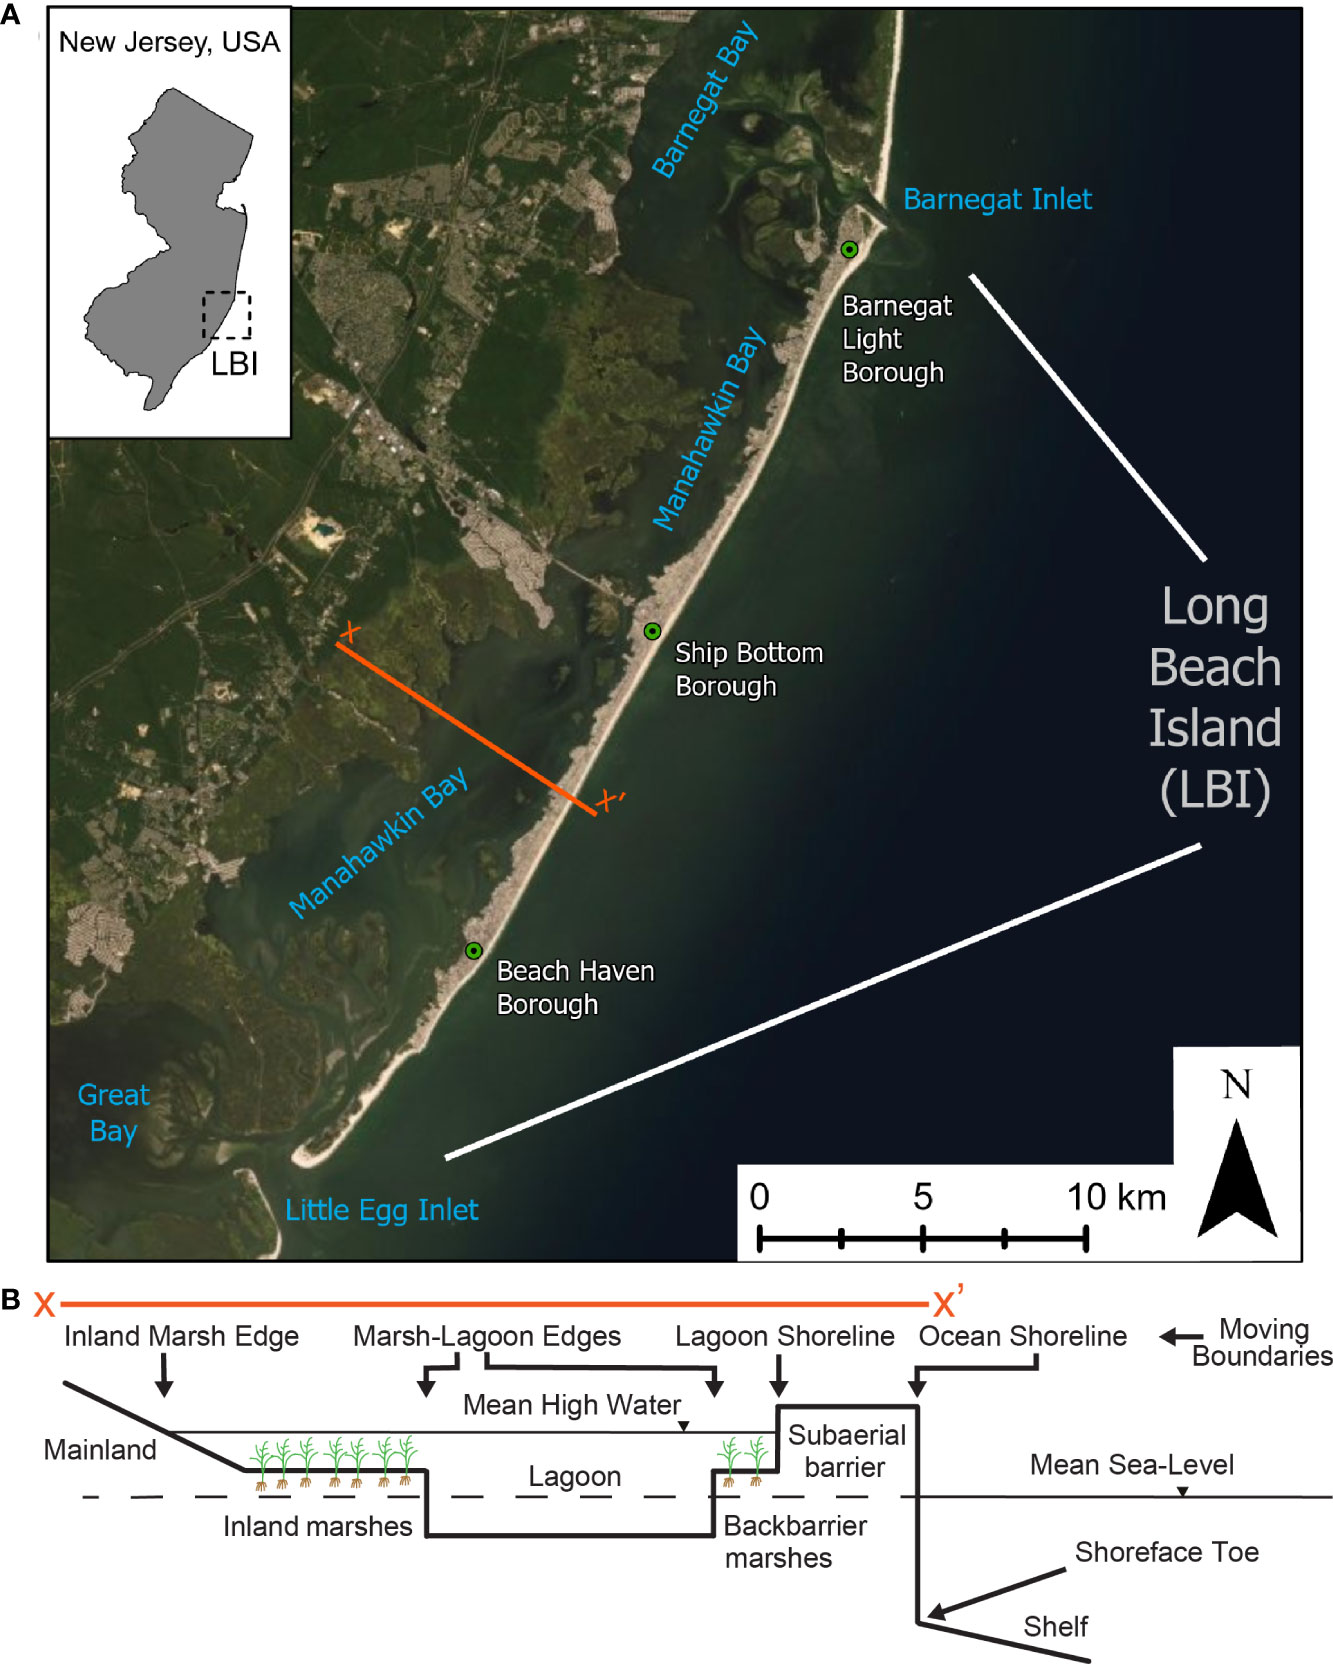
Figure 1 (A) Regional setting: Long Beach Island New Jersey. (B) Idealized cross-shore geometry of the barrier-marsh-lagoon system, including the key geomorphic moving boundaries. Base map image is the property of Esri and is used herein under license. Copyright © 2022 Esri and its licensors. All rights reserved.
Physical setting and morphology
LBI is a ~34 km long barrier island located on the southern half of the New Jersey coastline, separated from adjacent barriers by Barnegat Inlet and Little Egg Inlet, and from the mainland by Barnegat Bay, Manahawkin Bay, and Little Egg Harbor (Figure 1A). LBI is generally characterized as a mixed-energy, semidiurnal micro-tidal barrier with a neap range of 0.9 m, a spring range of 1.5 m, and southward alongshore sediment transport (Cialone and Thompson, 2000; McBride et al., 2013). From an idealized cross-section of a barrier-marsh-lagoon system such as LBI (Figure 1B), we typically see different ecogeomorphic environments such as the subaqueous shoreface, the subaerial portion of the barrier, and the backbarrier region, which can be separated into backbarrier marsh, lagoon, and inland marsh habitats. The boundaries between these environments are generally visible on maps and represent fundamental transitions in terms of sediment transport, plant growth, and organic sediment accumulation. From ocean to the mainland, we find the ocean shoreline, associated with the transition from subaqueous shoreface to the subaerial barrier, the backbarrier-marsh interface, where the sandy subaerial barrier converts into organic-rich backbarrier marsh, the seaward and landward lagoon-marsh boundaries, and the mainland limit of the inland marsh (Figure 1B). The trajectories of these boundaries describe the morphological evolution of the system over decadal to millennial time scales (Lorenzo-Trueba and Ashton, 2014; Lorenzo-Trueba and Mariotti, 2017), and can be used to describe the long-term geomorphic and stratigraphic evolution of the barrier-marsh-lagoon system (Ciarletta et al., 2019a; Ciarletta et al., 2019b; Ciarletta et al., 2019c; Shawler et al., 2021).
The geological setting on which LBI has developed comprises channel and baymouth deposits dating back to the Pleistocene and slopes gently upward from offshore towards the mainland (Uptegrove et al., 2012). Overlying layers contain bay/estuarine deposits and then barrier/shoal deposits (where the barrier is currently located) of Holocene age, indicative of a landward retreating barrier system. However, based on historical imagery, we know that this landward migration has stalled over the past few decades. To better understand the circumstances leading to this behavioral shift, we analyze different historical records in the next section.
Phases of LBI evolution: From undeveloped to fully developed
In this section, we use historical maps from National Oceanic and Atmospheric Administration (NOAA), images from the U.S. Army Corps of Engineers, and records from state departments (New Jersey Department of State, 1906; United States Bureau of the Census, 1912; New Jersey State Data Center, 2001) to quantify changes in morphology, population, and human development at LBI over the past two centuries. We georeference NOAA T-sheets and nautical charts from 1840, 1879, 1934, 1957 and 2022 to quantify the magnitude of change of each geomorphic boundary in the system (Figure 2). Boundary positions for the ocean shoreline, the backbarrier-marsh interface, the seaward and landward lagoon-marsh interfaces, and the marsh-mainland boundary were identified for each year (Supplementary Figures 1, 2). We then compute the cross-shore location for each by averaging over the length of the island. Additionally, we determine changes in the areal extent of the primary environments, including the marsh platforms (Figure 2C). We note that publicly available GIS datasets for this period, including those from Smith and Terrano, 2017, do not account for backbarrier and inland marsh areas. Thus, the dataset that we provide for the years 1840, 1879, 1934, 1957, and 2022, is novel as it spans both the barrier and its backbarrier environment, digitizing inland and backbarrier marsh areas, along with ocean and bay shorelines (Supplementary Figure 3). We also use historical images from 1920, 1944, 1962 of three communities in LBI: Beach Haven, Barnegat Light, and Ship Bottom (Figures 1A) to illustrate the morphological transition the island underwent over this time period (Figure 3). All historical images, maps, and GIS files used in this analysis are included in a Zotero database described in the Supplementary Information.
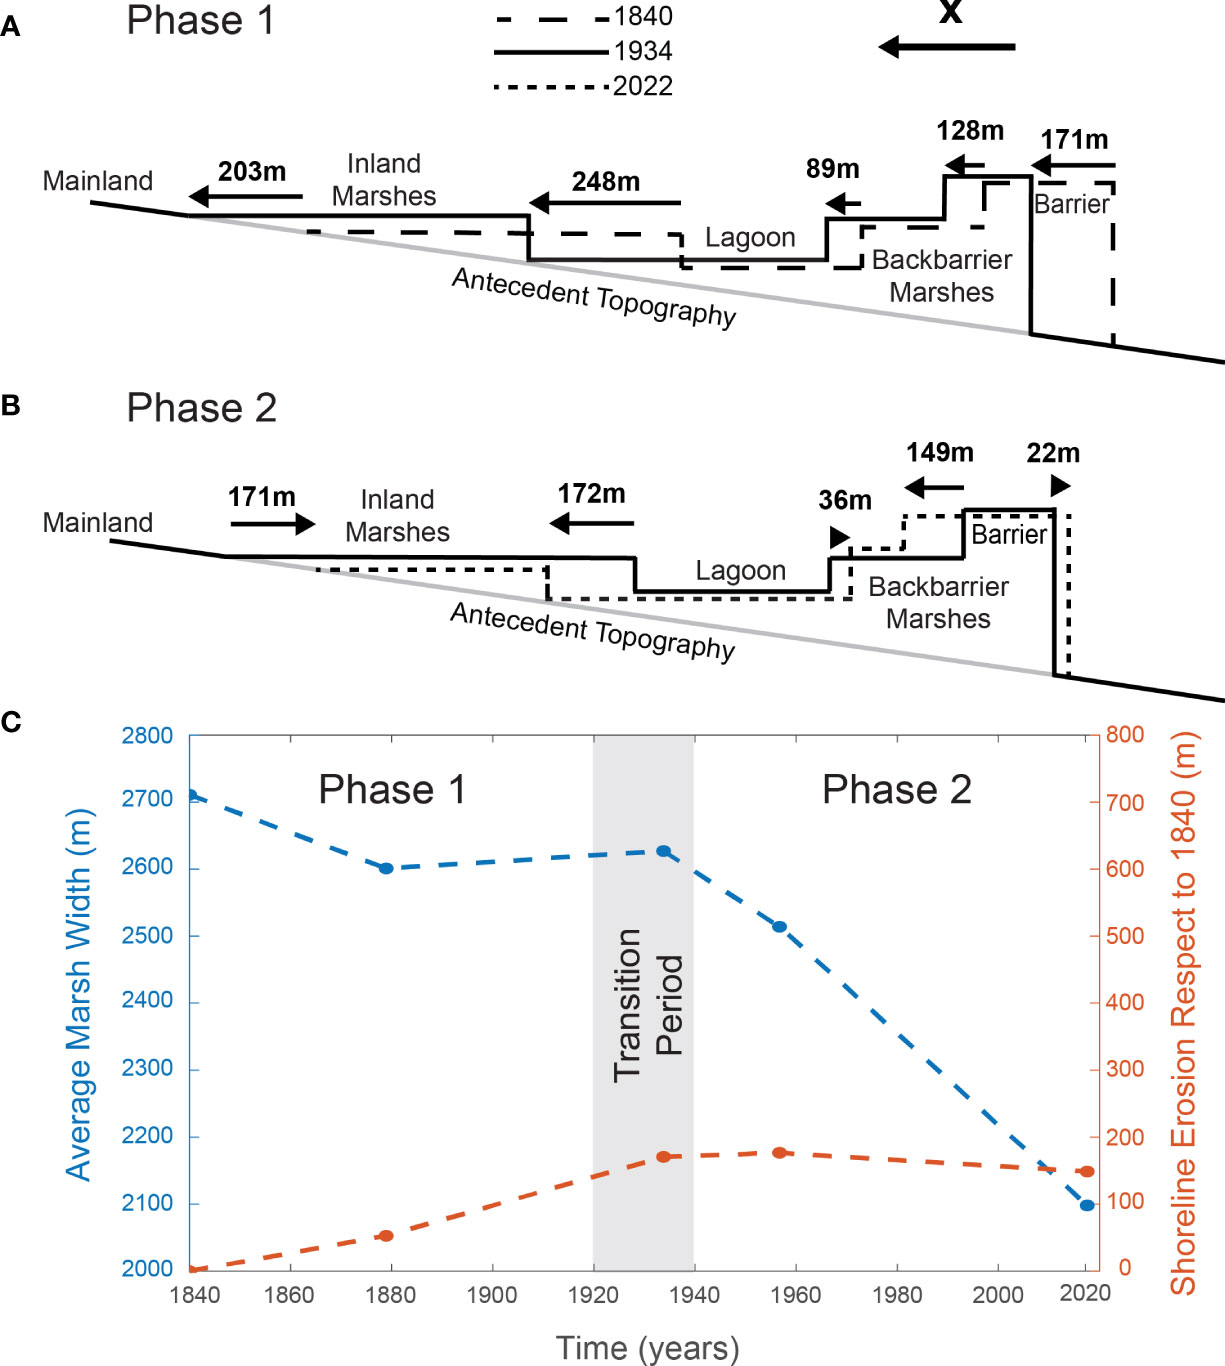
Figure 2 Long Beach Island cross-shore evolution between (A) 1840 and 1934, and (B) 1934 and 2022. (C) Average marsh width and ocean shoreline location respect to 1840 over time.
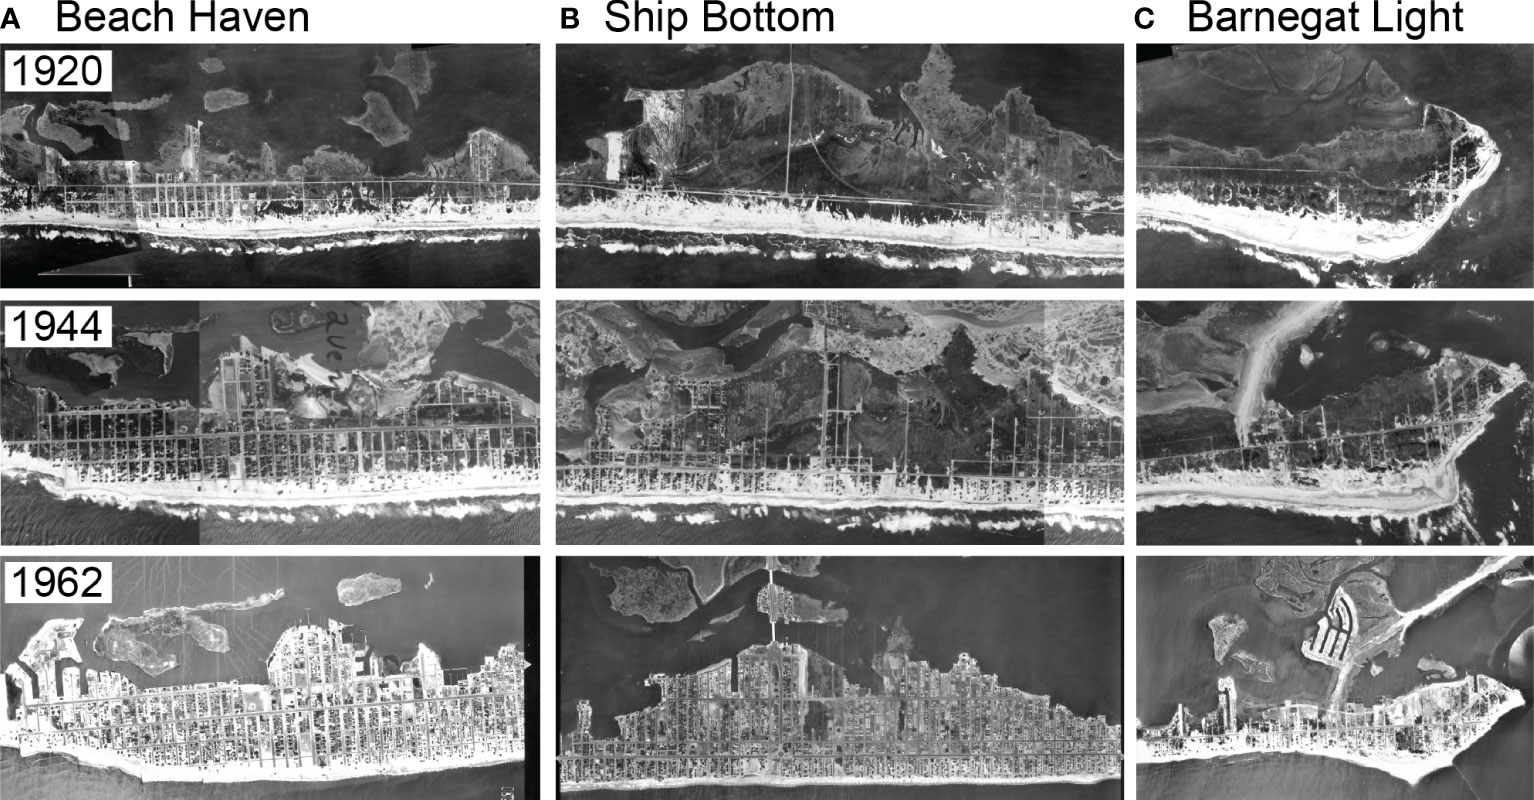
Figure 3 Historical images that demonstrate the transition from undeveloped to developed barrier-marsh lagoon system between 1920 and 1962 of three coastal towns in LBI: (A) Beach Haven, (B) Ship Bottom, and (C) Barnegat Light. Aerial photographs from archives of Beach Erosion Board (BEB), United States Army Corps of Engineers (USACE). Original prints digitized by USACE Engineer Research and Development Center for use by coastal managers and researchers. See https://rsm.usace.army.mil/shore/index.php.
The construction of the first tended lighthouse at LBI in 1834, a railroad connecting the island to the mainland in 1886, and the establishment of Beach Haven in 1872 and Barnegat Light in 1878 did not prevent LBI from maintaining an overall landward migration. We find evidence of this dynamic and associated morphological change in NOAA T-sheets and nautical charts from the 1800s and early 1900s (Figure 2A). In the late 1920s and early 1930s, the population of Beach Haven, Barnegat Light, and Ship Bottom was on the order of a few hundred people each (Supplementary Figure 4), and coastal protection measures such as wooden jetties were implemented for the first time at a few locations during this time period (U.S. Army Corps of Engineers, 1999; Lloyd, 2005). Given the limited effect of development and coastal engineering, LBI continued to undergo substantial morphological changes between 1920 and 1944, including the expansion of backbarrier marshes into the lagoon (Figure 3). After 1944, this trend changed with increased levels of development and coastal engineering, including the onset of beach nourishment activities in 1954 (Trembanis et al., 1999; U.S. Army Corps of Engineers, 1999; Valverde et al., 1999), the opening of a four-lane highway in 1956 to replace a railroad and a 1914 wooden bridge, and LBI population doubling between the 1944 and 1970 (Supplementary Figure 3). With coastal engineering and development accelerating and spanning a larger portion of the island, morphological changes between 1944 and 1962 were substantially reduced compared to the previous period, between 1920 and 1944 (Figure 3).
Based on this temporal variation in morphological change (Figure 2) and human development (Supplementary Figure 3) between 1920 and 1944, we separate the evolution of LBI into two phases: a largely undeveloped phase 1 between 1840 and 1934, and a developed phase 2 between 1934 and 2022. We selected 1934 as a breakpoint that corresponds to the 1920 to 1944 period that separates phases 1 and 2 based on the availability of NOAA T-sheets and nautical charts; the purpose of this selection, however, is just to mark a significant change in morphological behavior. During phase 1 all geomorphic boundaries migrate landwards, including a 171 m retreat of the ocean shoreline, an 89 m migration of backbarrier marshes into the lagoon, and a 203 m migration of inland marshes into the mainland (Figure 3A). Backbarrier marshes contract as barrier-island migration outpaces their expansion into the lagoon. Similarly, marsh erosion in the lagoon drives inland marsh loss despite their expansion towards the mainland. Overall, the marsh platform area is reduced by 4% during phase 1. Phase 2 is characterized by the reversal of the dynamics in phase 1, with seaward growth of the ocean shoreline, erosion of the marsh platforms on both sides of the lagoon, and marsh loss to development on both the backbarrier and the mainland environments (Figure 3B). The overall marsh loss during phase 2 is ~20% (Figure 3C), a significant increase with respect to phase 1.
The migration of all the different geomorphic boundaries during phase 1 is the result of a complex interaction between physical and biological processes, whereas in phase 2 anthropogenic effects dominate. To quantify such complex interplay during phase 1, we present a numerical modeling framework that describes the rates of migration of each boundary as a function of the leading physical and biological processes. A key aspect of this modeling framework is the treatment of the geomorphic moving boundaries as internal boundaries, whose location must be defined as part of the numerical solution to the overall morphodynamic problem (Swenson et al., 2000; Lorenzo-Trueba et al., 2009; Lorenzo-Trueba et al., 2013; Lorenzo-Trueba and Mariotti, 2017; Anderson et al., 2019; Ciarletta et al., 2019a).
Barrier-marsh-lagoon numerical model for the undeveloped phase
Our starting point is a morphodynamic model for cross-shore barrier-marsh-lagoon evolution recently developed by Lorenzo-Trueba and Mariotti (2017) (Figures 1A, 4A). With this modeling framework, we account for the dynamics of the ocean shoreline, driven by overwash processes, and the expansion/contraction of the marsh and lagoon environments in terms of wave energy and sedimentation processes in the lagoon. Unlike Lorenzo-Trueba and Mariotti (2017), the model introduced here does not account for changes in shoreface geometry or vertical dynamics of the marsh-lagoon environment. In this way, we characterize the geometry of the system with the average barrier width W and height H, shoreface depth DT, lagoon depth respect to mean high water (MHW) zL, lagoon width bL, marsh platform depth respect to MHW zm, backbarrier marsh width mb, and inland marsh width mi (Figure 4B). Below, we describe the dynamic changes of this idealized geometry as a function of key processes that operate on the barrier and marsh-lagoon domains.
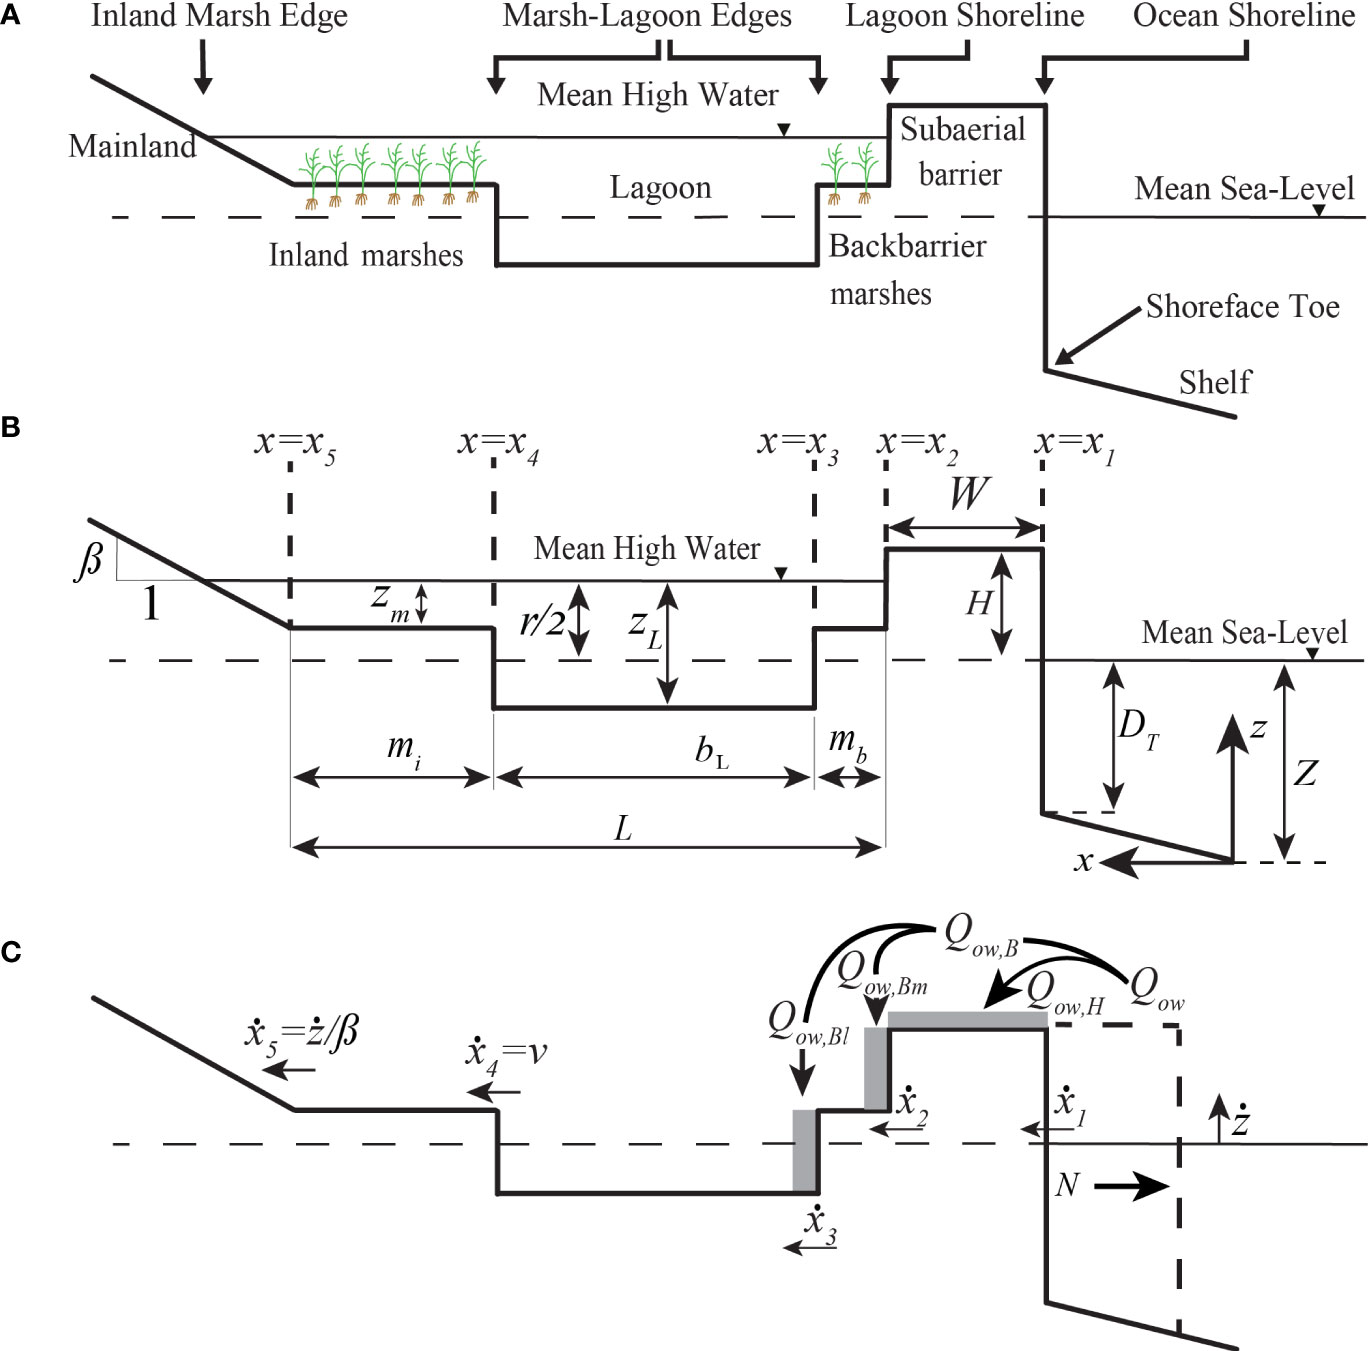
Figure 4 Cross-shore barrier-marsh-lagoon model set up, including (A) the different geomorphic domains and their moving boundaries, (B) state variables, and (C) the key processes that drive the evolution of the moving boundaries.
Barrier dynamics
Given the idealized geometry included in Figure 4, we can describe the evolution of the barrier in terms of the ocean shoreline x1 and the backbarrier-marsh interface x2 locations. We express the rate of migration of the ocean shoreline (i.e., ẋ1 = dx1/dt) as a function of the total sediment flux from the front to the top and back of the island Qow, and the net sediment loss at the shoreface via alongshore sediment transport E (Figure 4C), as follows:
In an undeveloped barrier island, natural processes such as storm overwash and aeolian processes drive landward migration of the backbarrier-marsh interface during storms and growth of the subaerial volume of the barrier during fair weather. Thus, to first order we compute Qow as follows:
where Qow,H and Qow,B are the top-barrier and backbarrier overwash components (Figure 4C). Given the limited information on barrier height dynamics in LBI while it was undeveloped during the 1800’s and early 1900’s, we assume that barrier height keeps pace with the rate of sea-level rise ż (i.e., Qow,H = W·ż). Additionally, following Lorenzo-Trueba and Ashton, 2014, we compute Qow,B in terms of the maximum overwash flux Qow,max, its associated maximum deficit volume Vd,max, and the backbarrier deficit volume Vd,B, i.e.,
We partition the backbarrier flux into a barrier-marsh edge flux Qow,Bm and a marsh-lagoon edge flux Qow,Bl (i.e., Qow,B = Qow,Bm+Qow,Bl; see Figure 4C), and define the backbarrier deficit volume Vd,B as (Lorenzo-Trueba and Mariotti, 2017):
where We is the critical barrier width (first defined by Leatherman, 1979) beyond which the deficit volume and therefore the backbarrier overwash flux is equal to zero (i.e., Qow,B = 0). Similarly, we define the partitioning coefficient ϕ = min (1,mb/mbc) in terms of the critical width of the backbarrier marsh platform mb mbc mbc and compute the backbarrier fluxes as follows:
As stated in equations (5) and (6), when the backbarrier marsh width is greater than its critical value (i.e., mb > mbc), overwash sediment does not reach the backbarrier marsh-lagoon edge (i.e., Qow,Bl = 0). In contrast, when the backbarrier marsh completely erodes away (i.e., mb = 0), the backbarrier flux only contributes to the landward migration of the backbarrier-marsh interface (i.e., Qow,Bm = 0), and therefore we recover the formulation introduced by Lorenzo-Trueba and Ashton, 2014. In intermediate cases, when mbc >mb > 0, the backbarrier overwash is partitioned between the barrier and the backbarrier marsh platform. In this way, we can describe the rate of migration of the backbarrier-marsh interface ẋ2 = dx2/dt as follows:
where r is the tidal range. Thus, as captured by equations (5), (6), and (7), the rate of backbarrier-marsh interface migration is a function of marsh-lagoon geometry.
Marsh-lagoon dynamics
The geometry of the backbarrier environment can be described by the width of the marsh platforms mb and mi the lagoon width bL (Figure 4B), which can in turn be expressed in terms of the locations of the seaward and landward lagoon-marsh boundaries x3 and x4, and the upland limit of mainland marsh x5 as follows:
where x20 is the initial location of the backbarrier-marsh interface (i.e., x2(t = 0) = x20), and L(t) is the backbarrier cross-shore width. We define L as a function of the change in sea level and the mainland slope ß as follows:
where Z is sea level, Z0 is the initial sea level (i.e., Z0 = Z (t=0)), and L0 is the initial basin length (i.e., L0 = L (t = 0)). Given the range of physical and biological feedbacks that allow marshes to keep up vertically with sea-level rise (Kirwan and Megonigal, 2013), we assume to first order that marsh-lagoon lateral changes dominate backbarrier dynamics (Mariotti and Fagherazzi, 2013). We can therefore fully describe the dynamics of the backbarrier environment as a function of the backbarrier marsh ṁb = dmb/dt and the inland marsh ṁi = dmi/dt width change rates. Such changes are driven by the rates of barrier migration ẋ2, backbarrier mash expansion into the lagoon ẋ3 = Qow,Bl/(zL-zm)-v, marsh-lagoon edge progradation ẋ4 = v, and mainland marsh expansion ẋ5 = ż/ß (Lorenzo-Trueba and Mariotti, 2017), which leads to the following state equations:
We calculate v as a balance between erosion driven by lagoon waves and progradation due to lagoon sedimentation (Mariotti and Fagherazzi, 2013). The rate of progradation is computed in terms of a reference suspended sediment concentration in the lagoon Cr, the settling velocity of suspended sediments at the marsh-lagoon edge ws, a shape factor that represents the geometry of the marsh-lagoon edge ka, and the average sediment bulk density ρ. The rate of erosion is defined based on the wave power density at the marsh-lagoon edge Wp, an erodability coefficient kϵ, and the marsh boundary cliff face height zL-zm, i.e.,
We define the wave power density as (Marani et al., 2011; Mariotti and Fagherazzi, 2013), where γ is the specific weight of water, Hs is the significant wave height, and cg is the group velocity, computed using the wave period T. We use basic formulations to determine the significant wave height and wave period T as a function of the average wind speed u, and the lagoon width, i.e., (Komar, 1998), and T = 6.238·10-2·(u·bL)1/3 (U.S. Army Corps of Engineers, 1984).
Numerical solution
The evolution of the coupled barrier-marsh-lagoon-marsh system is fully determined by the rates of change of the ocean shoreline ẋ1 and the backbarrier-marsh interface ẋ2, described in equations (1) and (7), and the rates of back-barrier ṁb and inland ṁi marsh width change, described by equations (10) and (11). To examine system behavior, we numerically solve equations (1) to (14) using a simple Euler scheme. All the variables and input parameters involved in the calculation are included in Supplementary Tables 1, 3, and the initial barrier-marsh-lagoon geometry is included in Supplementary Table 2.
A process-based perspective on LBI’s evolution
In this section we use the numerical model and our analysis of historical maps and images to describe the evolution of LBI during phase 1, with the geometry of the barrier-marsh-lagoon system in 1840 as our initial condition (Supplementary Table 2). Furthermore, we extend the map analysis from section 3 to include supplementary data points; in addition to 1840, 1879, 1934, 1957 and 2022 (see Figure 3 and Supplementary Figure 4), we georeference and analyze nautical charts from 1983, 1993, 2007, and 2012 to better constrain the last few decades of phase 2. We then analyze and contrast the process-based context provided by the numerical model during the phase 1 evolution with our map analysis of LBI during phases 1 and 2.
Parameter estimation
We include a full list of the input parameters of the model in Supplementary Table 3. We define the majority of the parameter values based on the historical image analysis from section 3, Google Earth to estimate mainland slope or additional constraints from the literature. Additionally, we estimate those parameters that are not well constrained over centennial time scales (Supplementary Table 4) by minimizing the differences in moving boundary positions between the model and the map analysis of the barrier-marsh-lagoon phase 1 evolution. We compute this difference in terms of the root mean square error ϵ, which we define as follows:
where Δxi/xi is the normalized boundary movement difference between the model and observations, i = 1,2,…n is a counter to specify each geomorphic moving boundary, with n = 5 (Figures 1B, 4B), and j = 1,2,…m is a counter to describe the points in time used for comparison, with m = 5 (i.e., 1840, 1879, and 1934). Note that we normalize the boundary movements to avoid giving a higher weight to those that undergo larger displacements. We compute ϵ for a wide parameter space (Supplementary Table 4) and select the combination of parameter values associated with the total minimum error. The selected values are sensitive to neither the resolution nor the boundary limits employed for each parameter and fall within the range of values reported in the literature (Supplementary Table 4). We use these parameter values to produce the results presented below.
Undeveloped phase: Observations-model coupling
We first present the evolution of each geomorphic boundary of the system during phase 1 as described by field observations constrained by data points in 1840, 1879, and 1934 (Figure 5, open circles). We find that the ocean shoreline eroded on average at ~2m/y during phase 1, with an increase in this rate to ~3m/y after 1879 (Figure 5A). The backbarrier-marsh interface migrated seaward initially due to backbarrier marsh migration onto the barrier island (Supplementary Figure 5); this trend was followed by landward migration at ~3m/y after 1879 (Figure 5B). The lagoon-backbarrier marsh boundary also reversed its direction of migration during phase 1, with mild marsh erosion initially and followed by lagoonward expansion at 2-3m/y (Figure 5C). In contrast, erosion of the inland marshes on the lagoon side was maintained during phase 1 at 2-3m/y (Figure 5D), whereas the mainland boundary remained stable on average before 1879 and then expanded landward at 3-4m/y (Figure 5E). The initial stability of the mainland-inland marsh boundary location was due to a balance between natural landward expansion and marsh conversion to agricultural fields (Supplementary Figure 6).
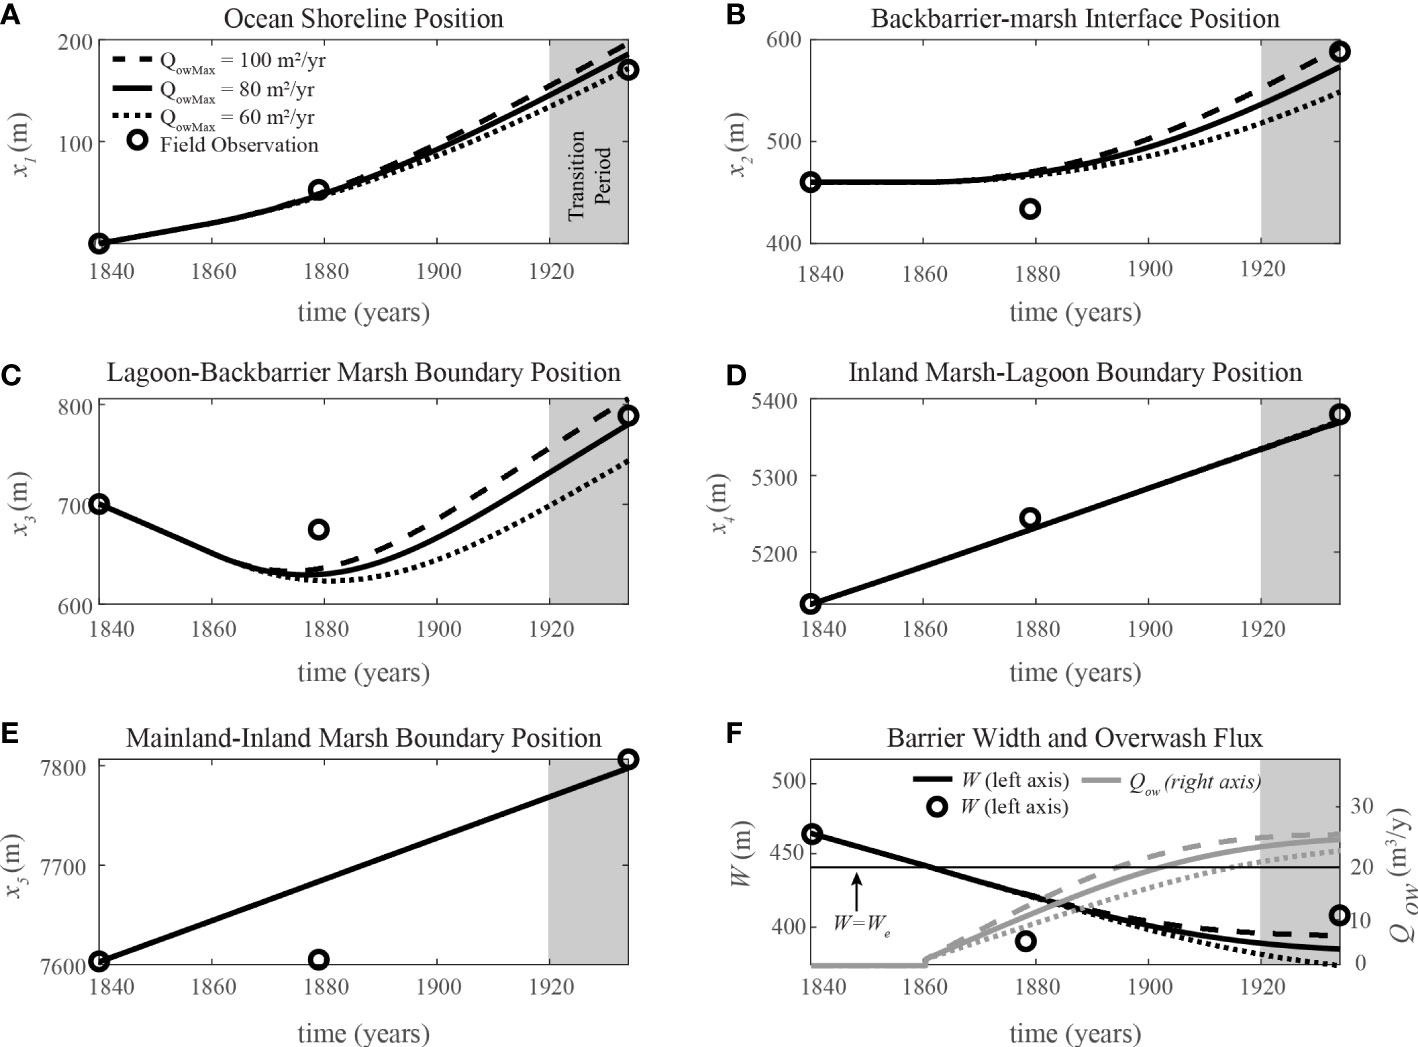
Figure 5 Evolution of the geomorphic moving boundaries (panels A–E) with landward directed migration assumed to be positive, and overwash fluxes and barrier width (panel F), during phase 1. Sensitivity of barrier-influenced geomorphic boundaries to variations in maximum overwash are indicated for rates of 60, 80, and 100 m2/yr. See Figure 4B for a schematic of model geometry that includes the boundaries being tracked, x1 to x5. The input parameter values are included in Supplementary Table 3.
Using the numerical model (Figure 5, solid and dashed lines), we can provide a process-based explanation of the dynamics captured by field observations. During the initial portion of phase 1, the barrier was too wide for overwash fluxes to reach the backbarrier environment (Figure 5F). Without this sediment source and natural disturbance, the backbarrier-marsh interface was relatively stable (Figure 5B), and the marsh edges eroded at similar rates on both sides of the lagoon (Figures 5C, 5D). As the ocean shoreline retreated (Figure 5A) and the barrier narrowed below a critical value (Figure 5F), overwash fluxes activated and drove landward migration of the backbarrier-marsh interface (Figure 5B), as well as backbarrier marsh expansion into the lagoon (Figure 5C). Although inland marshes eroded on the lagoon side, they also migrated up the mainland slope (Figure 5E) and approximately maintained their aerial extent during phase 1 (Supplementary Figure 1). Although our model does not account for the conversion of marshes to agricultural land, the average rate of inland marsh expansion towards land matched the ratio between sea-level rate and the average mainland slope (i.e. ż/ß) as described in equation (13) and depicted in Figure 4C.
In Figure 5, we also include an example of the sensitivity of the results to changes in the input parameter values. We find that the higher the Qow,max value, the faster the migration of the ocean shoreline, backbarrier-marsh interface, and lagoon-backbarrier marsh boundary towards land after the barrier width threshold condition is met (i.e., W<Wϵ). Despite the change in the magnitude of the migration rates, the system’s dynamics are qualitatively the same under the different Qow,max scenarios. Similarly, when we change the values of other key input parameters (i.e., kϵ,Wϵ, mbc, and E, in Supplementary Figures S5–S7), the migration rates and the timing at which the width threshold condition is met can vary. Still, the direction of migration of all geomorphic boundaries is the same under the full range of explored input parameter values.
Developed phase observations
As expected from an undeveloped barrier-marsh-lagoon system responding to sea-level rise, all boundaries migrate landwards during phase 1. In contrast, during phase 2 the dynamics of the barrier and the backbarrier environment were decoupled due to human development, with an associated reversal in the migration direction of most geomorphic boundaries. The ocean shoreline transitioned from a landward migration rate of above 1m/y during phase 1 to less than 0.5m/y during the first half of phase 2, and a complete reversal during the last two decades of phase 2 with substantial seaward growth (Figure 6A). Although there is some natural variability, this shift in the rate and direction of migration of the ocean shoreline can be explained by the exponential increase in beach nourishment volumes that took place in New Jersey during phase 2 (Figure 6B). Such excess sand added to the coastline helped counteract the long-term geomorphic signal of storm events such as Ash Wednesday in 1962 or Hurricane Sandy in 2012 in Figure 6B. Additionally, the quick expansion of residential/commercial infrastructure at LBI significantly reduced the overwash reaching the backbarrier environment, which led to rapid wave-driven erosion of backbarrier marshes during the first couple of decades of phase 2 (Figure 6D). Soon after 1957, however, housing and infrastructure occupied the majority of barrier and backbarrier marsh environments (Figure 2). Under such a level of development, the separation between the barrier and backbarrier marshes fades (Figures 2, 6C), and the lagoon-backbarrier marsh boundary location remained fixed until present (Figure 6D). While inland marsh erosion on the lagoon side continued at a similar pace as in phase 1, human structures such as roads, seawalls, dikes, and revetments prevented the expansion of marshes on the mainland (Figure 6F and Supplementary Figure 2). Moreover, large portions of the inland marsh were lost to development during phase 2 (Supplementary Figure 2).
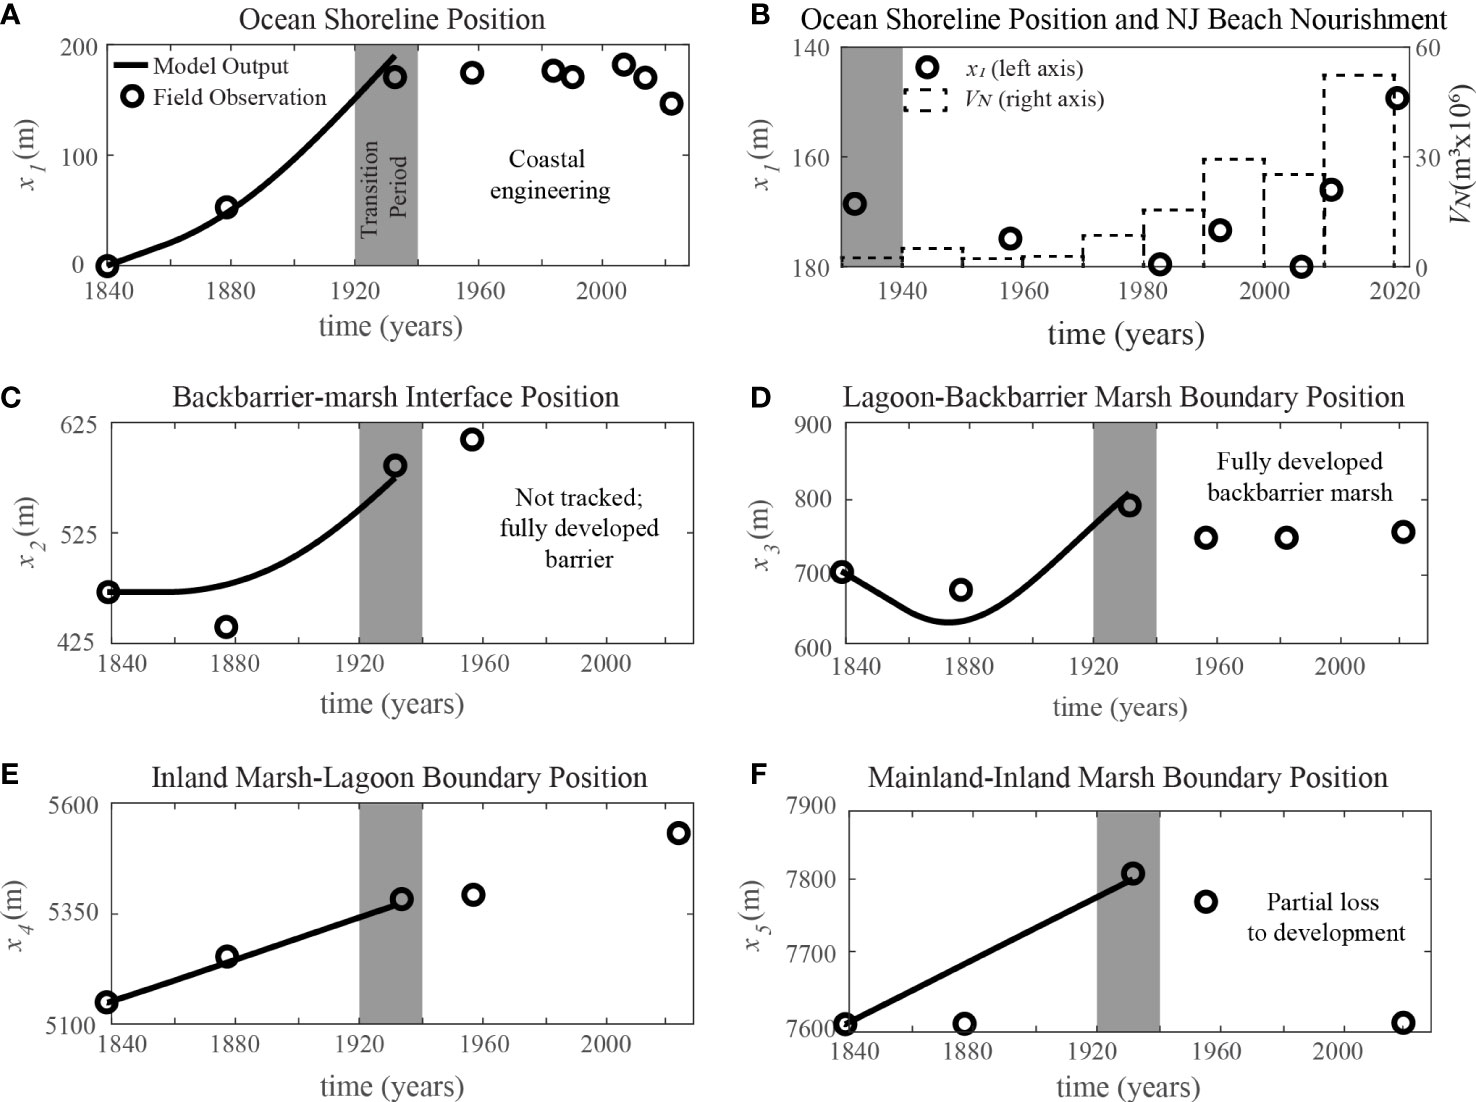
Figure 6 Evolution of the geomorphic moving boundaries (A–F) during phases 1 and 2. See Figure 4B for a schematic of model geometry that includes the boundaries being tracked, x1 to x5. The input parameter values are included in Supplementary Table 3. Ocean shoreline position compared to decadal Long Beach Island beach nourishment volume (VN) (B).
Discussion
Barrier island and backbarrier evolution are generally treated separately; however, our spatial analysis demonstrates that all key geomorphic boundaries of the barrier-marsh-lagoon system migrate towards land during the LBI undeveloped phase (i.e., phase 1). Such behavior suggests important relationships exist between LBI and its associated backbarrier environment during this period. We further explore these relationships by integrating the spatial analysis with a process-based numerical model and find that the cross-shore evolution of LBI in phase 1 can be to a large extent explained by natural processes. That is, with the exception of the mainland-inland marsh boundary between 1840 and 1879, which was partially affected by an expansion of agricultural practices (Supplementary Figure 6), the rate of migration of all boundaries can be quantified by the processes included in the model and with a set of parameter values that are within the range reported in the literature (see Supplementary Tables S3, S4). Moreover, the mechanics of the numerical model used to describe the dynamics of these boundaries are consistent with several recent studies on different barrier islands along the U.S. East and Gulf Coasts (e.g., Walters et al., 2014; Rogers et al., 2015; Walters and Kirwan, 2016, and Bernier et al., 2021). For instance, barrier width can exert a primary control over the magnitude of overwash fluxes (Figure 5F), which not only drive barrier landward migration (Figure 5B) but also are an important sediment source for backbarrier marshes (Figure 5C), allowing lower rates of erosion in comparison to isolated marshes (Figures 5D). Additionally, despite the role of marsh conversion that partially affected the migration of the mainland-inland marsh boundary, we find that the ratio between the rate of sea-level rise and mainland slope is a first-order control of the average response of this boundary (Figure 5E); in other words, the steeper the mainland slope, the lower the rate of inland marsh upland migration as discussed by Kirwan et al., 2016, Fagherazzi et al., 2019, and others.
Although the integration between the geomorphological analysis and the numerical model provides a novel process-based understanding of the evolution of LBI during phase 1, we do not account for the impacts of event-scale processes (e.g., individual storms) or alongshore variability on the morphological response of the coupled system. We focus on decadal to centennial timescales, which are consistent with the resolution of our field observations, and use conceptual relationships between barrier geometry and overwash fluxes instead of laboratory-validated sediment transport formulations from engineering approaches (e.g., Roelvink et al., 2009; Lin et al., 2010, Lin et al., 2014; Orton et al., 2015). In particular, in our current version of the numerical model, we assume the existence of an average ‘characteristic’ event that merges the effects of storms and recovery periods and drives the long-term geomorphic evolution of the barrier in conjunction with sea-level rise and backbarrier processes. In future work, however, we plan to integrate individual storm events and account for the effect of changes in the frequency and intensity of storms and recovery periods. We will then assess if this updated version of the model offers improvements over the storm-integrated approach presented here. Additionally, we neglect the alongshore variability captured by our map analysis to focus on the average cross-shore evolution; future efforts aim to integrate a more detailed analysis of the historical maps, records, and images we have collected with recent modeling efforts that account for the plan view evolution of the barrier (Ashton and Lorenzo-Trueba, 2018; Nienhuis and Lorenzo-Trueba, 2019a; Nienhuis and Lorenzo-Trueba, 2019b).
The current model version does not incorporate land-use changes and human development, which would be required to model the migration of the geomorphic boundaries in phase 2. For instance, the reversal in the direction of migration of the mainland-marsh boundary between phase 1 and phase 2 (Figure 6F) cannot be explained by the ratio between sea-level rise rate and mainland slope as the model suggests; a seaward migration of this boundary requires a loss of inland marshes to development (Supplementary Figure 2). Similarly, the migration reversal of the ocean shoreline (Figure 6A) cannot be explained without accounting for beach nourishment volumes at LBI or from updrift locations (Figure 6B). Soon after the beginning of phase 2, the backbarrier-marsh interface disappears and the lagoon-backbarrier marsh remains stagnant, as development occupies the subaerial portion of LBI and the backbarrier marsh platform (Figures 2, 6C). Highlighting this stark contrast in landscape change between the undeveloped and developed phases of LBI is the focus of this manuscript; in future work, we aim to extend the moving-boundary framework to account for human development, land-use changes, and different coastal protection strategies.
Implications for coastal management
Overall, our analysis of the undeveloped phase of LBI evolution supports previous work that indicates that barrier-marsh-lagoon systems can be analyzed using a variety of moving boundaries to predict their response to global climate change. This statement is most applicable when human development is absent and barrier systems are allowed to evolve naturally and can freely roll over and migrate landward in response to sea-level rise (Figure 7A). Such an approach has been taken by The Nature Conservancy along much of the Virginia Eastern Shore coast since the 1970s. The opposite approach is to “hold the line” (Figure 7B) with either the placement of sand fill on the beach or the construction of hard infrastructures, such as groins, jetties, dikes, seawalls, or revetments (Titus et al., 1991; Valverde et al., 1999; Hapke et al., 2013; Kolodin et al., 2021). The U.S. Army Corps of Engineers has followed this approach by engineering a significant portion of the U.S. coast, including LBI after the 1930s (Figure 6), using a combination of hard infrastructure and localized beach replenishment, allowing economic benefits for coastal living and tourism to continue to be realized.
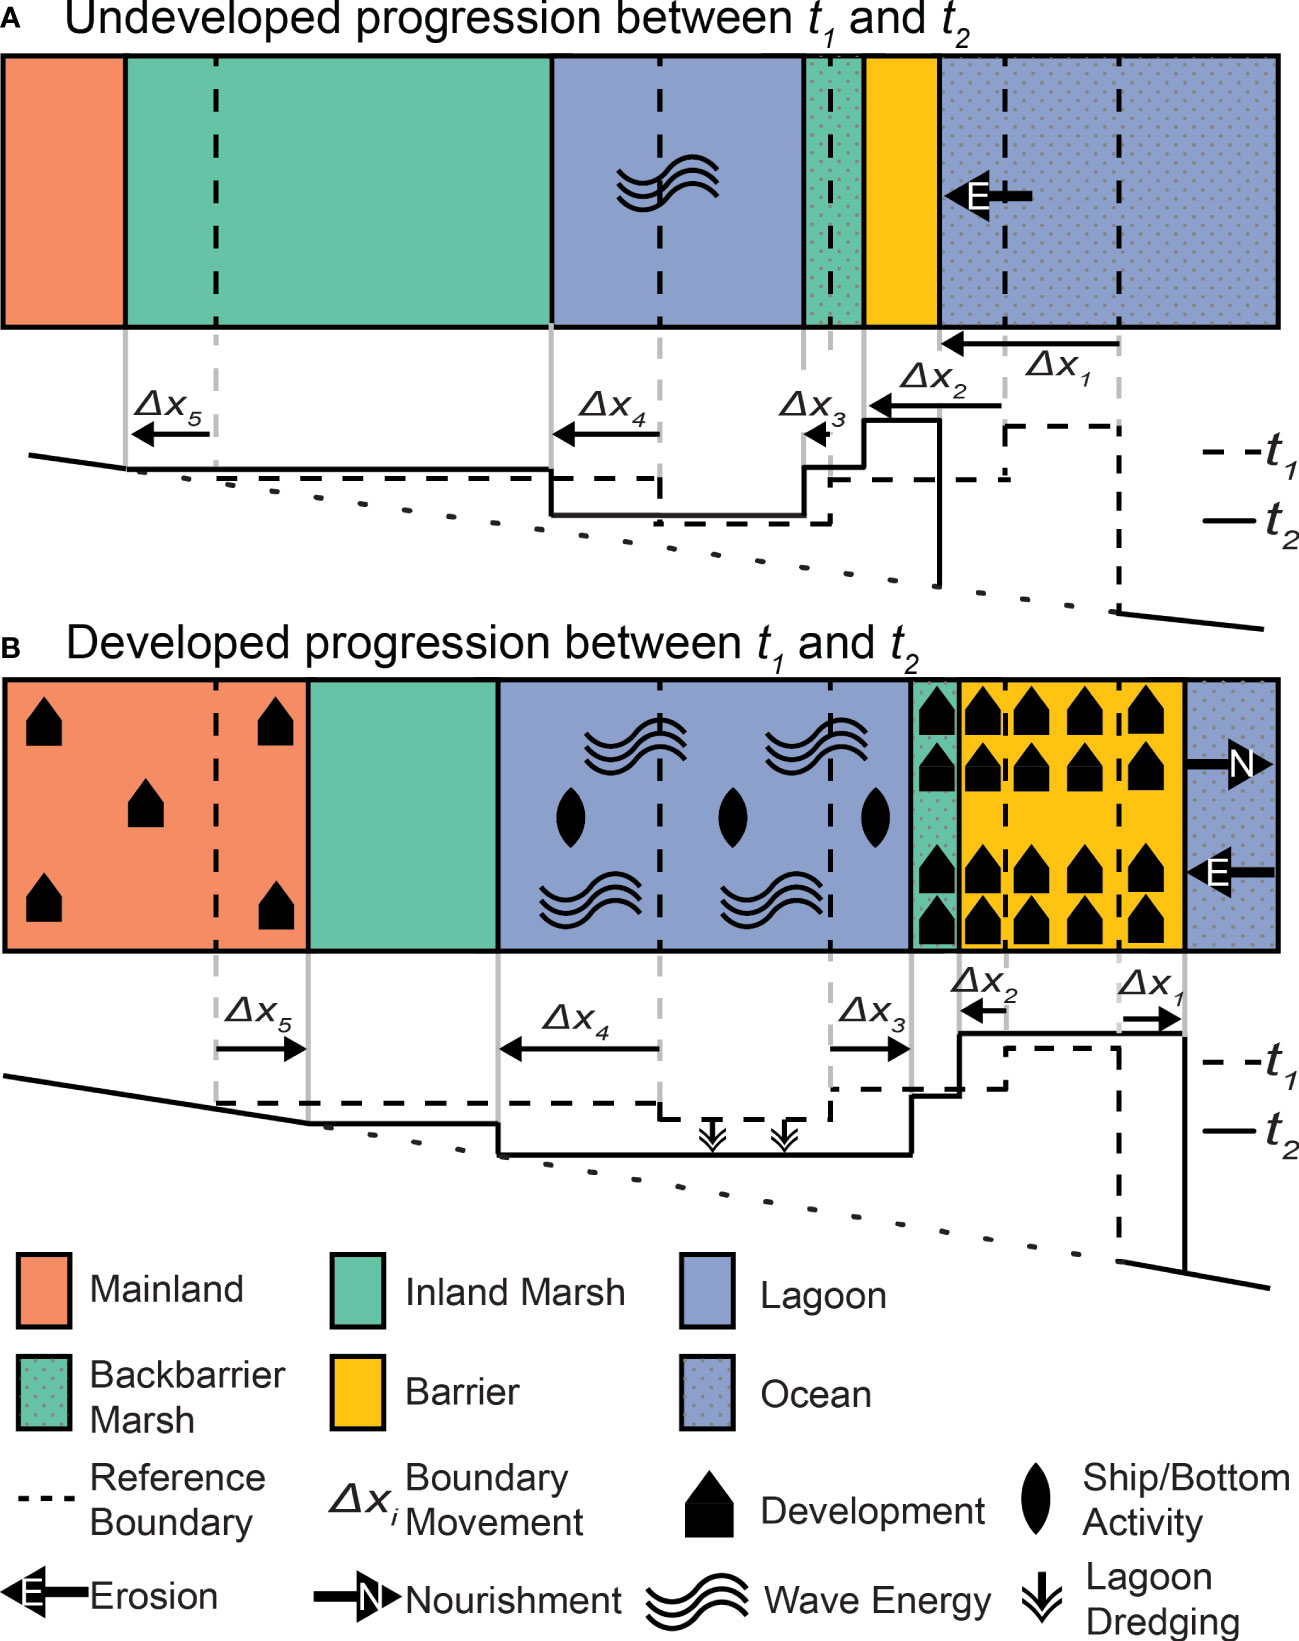
Figure 7 Conceptual illustrations depicting the evolution of (A) an undeveloped and (B) a fully developed barrier-marsh-lagoon system.
The two approaches illustrated in Figure 7 do not cover the full range of coastal responses and management decisions we see today or will likely see in the future (Janoff et al., 2020; Janoff, 2021; Kolodin et al., 2021). First, the “no action” management plan adopted in Virginia (Figure 6A) can lead to a substantial loss of marsh platforms due to the squeezing of the backbarrier environment (Deaton et al., 2017). Such rapid loss of valuable ecosystem services may make this approach unlikely to become widely implemented. On the other hand, it is unclear whether coastal communities will be able or willing to continue to cover the costs associated with holding the line as sea-level rise accelerates (IPCC, 2014; Kopp et al., 2019), large storms potentially become more frequent (Emanuel, 2005; Emanuel, 2013; Kirshen et al., 2020), and the cost of sand for nourishment practices increases (McNamara et al., 2011). We can therefore envision a third management option that balances the costs and benefits of barrier stabilization and ecosystem services by recognizing the interconnected nature of barriers and their backing marshes and lagoons (Miselis et al., 2021) but retreats at a lower rate than the undeveloped scenario. Relatively little is known about the mechanisms of such an approach, and efforts such as the one presented here can contribute to obtaining the required quantitative understanding for practical implementation.
Conclusions
Linking the evolution of barrier island and backbarrier environments through biogeomorphic feedback under a geomorphic moving-boundary framework represents an innovative approach for coastal management and scientific study; yet, our approaches remain largely untested with specific field locations over decadal to centennial time scales. Here, we test whether these concepts indeed govern the integrated evolution of barrier systems by analyzing the 180-year evolution of LBI using a moving-boundary approach. The first step of our approach is to map the location of five geomorphic boundaries over time: the ocean and bay shorelines, the marsh-lagoon boundaries on the landward and seaward sides of the lagoon, and the mainland-marsh boundary. This map analysis demonstrates that LBI transitioned from an undeveloped and coupled barrier-marsh-lagoon system with all its geomorphic boundaries moving landwards to a second phase in which anthropogenic effects overwhelmed the expected morphological natural response, with the ocean shoreline migrating seaward, the absence of overwash fluxes reaching the backbarrier environment, and a faster rate of marsh loss. For the second step of our approach, we integrate our map analysis with a numerical model of barrier-marsh-lagoon evolution; this effort demonstrates that the cross-shore dynamics of LBI during the undeveloped phase can be solely explained by the natural processes accounted by the numerical model, whereas the second or developed phase requires additional factors associated with human development and coastal protection. Such approaches for analyzing the morphological evolution of LBI are portable and have the potential to inform best practices for managing coupled barrier-marsh-lagoon systems under different sea-level rise scenarios.
Data availability statement
Historical nautical charts or NOAA T-sheets sheets from 1840, 1897, and 1934 can be accessed as scanned images in digital format at NOAA’s “Historical maps and chart collection” database (https://historicalcharts.noaa.gov). The codes and data associated with the GIS analysis can be found on the following GitHub repository: https://github.com/JorgeMSU/LBI_Cross-shore_Barrier-Marsh-Lagoon. Access to the data and code are not restricted, and lie in the public domain.
Author contributions
JL-T, DC, CT, and JM contributed to the conception and design of the study. SN-O, CT and DC performed the GIS analysis. SN-O organized the database of historical maps and images. JL-T and CT developed the numerical model and carried out the simulations. CT and JL-T wrote the first draft of the manuscript. All authors contributed to manuscript revision, read, and approved the submitted version.
Funding
This work was supported by the USGS Coastal and Marine Hazards and Resources Program. Additionally, federal funds as part of the Megalopolitan Coastal Transformation Hub under NSF award ICER-2103754 and the New Jersey Sea Grant Consortium under NOAA grant number NA14OAR4170085 supported CT, JL-T, and SN-O.
Acknowledgments
Any use of trade, firm, or product names is for descriptive purposes only and does not imply endorsement by the US Government. We thank the three reviewers for their constructive feedback, which helped to improve the quality of the manuscript.
Conflict of interest
The authors declare that the research was conducted in the absence of any commercial or financial relationships that could be construed as a potential conflict of interest.
Publisher’s note
All claims expressed in this article are solely those of the authors and do not necessarily represent those of their affiliated organizations, or those of the publisher, the editors and the reviewers. Any product that may be evaluated in this article, or claim that may be made by its manufacturer, is not guaranteed or endorsed by the publisher.
Supplementary material
The Supplementary Material for this article can be found online at: https://www.frontiersin.org/articles/10.3389/fmars.2022.958573/full#supplementary-material
References
Anarde K. A., Kameshwar S., Irza J. N., Nittrouer J. A., Lorenzo-Trueba J., Padgett J. E., et al. (2018). Impacts of hurricane storm surge on infrastructure vulnerability for an evolving coastal landscape. Natural Hazards Rev. 19 (1), 04017020. doi: 10.1061/(ASCE)NH.1527-6996.0000265
Anderson W., Lorenzo-Trueba J., Voller V. (2019). A geomorphic enthalpy method: Description and application to the evolution of fluvial-deltas under sea-level cycles. Comput. Geosci. 130, 1–10. doi: 10.1016/j.cageo.2019.05.006
Ashton A. D., Lorenzo-Trueba J. (2018). Morphodynamics of Barrier Response to Sea-Level Rise, in Barrier Dynamics and Response to Changing Climate. Cham: Springer International Publishing. 277–304.
Barbier E. B., Hacker S. D., Kennedy C., Koch E. W., Stier A. C., Silliman B. R. (2011). The value of estuarine and coastal ecosystem services. Ecol. Monogr. 81 (2), 169–193. doi: 10.1890/10-1510.1
Bernier J. C., Miselis J. L., Plant N. G. (2021). Satellite-derived barrier response and recovery following natural and anthropogenic perturbations, northern chandeleur islands, Louisiana. Remote Sens. 13, 3779. doi: 10.3390/rs13183779
Boesch D. F., Turner R. E. (1984). Dependence of fishery species on salt marshes: the role of food and refuge. Estuaries 7, 460–468. doi: 10.2307/1351627
Cialone M. A., Thompson E. F. (2000). Wave climate and littoral sediment transport potential, long beach island, new Jersey (Vicksburg, MS: Engineer Research and Development Center Vicksburg, MS Coastal and Hydraulics Lab). Available at: https://apps.dtic.mil/sti/citations/ADA385444.
Ciarletta D. J., Shawler J. L., Tenebruso C., Hein C. J., Lorenzo-Trueba J. (2019a). Reconstructing coastal sediment budgets from beach-and foredune-ridge morphology: A coupled field and modeling approach. J. Geophys. Res.: Earth Surf. 124 (6), 1398–1416. doi: 10.1029/2018JF004908
Ciarletta D. J., Lorenzo-Trueba J., Ashton A. D. (2019b). Mechanism for retreating barriers to autogenically form periodic deposits on continental shelves. Geology 47 (3), 239–242. doi: 10.1130/G45519.1
Ciarletta D. J., Lorenzo-Trueba J., Ashton A. D. (2019c). Interaction of sea-level pulses with periodically retreating barrier islands. Front. Earth Sci. 279. doi: 10.3389/feart.2019.00279
Day J. W., Christian R. R., Boesch D. M., Yanez-Arancibia A., Morris J., Twilley R. R., et al. (2008). Consequences of climate change on the ecogeomorphology of coastal wetlands. Estuaries coasts 31 (3), 477–491. doi: 10.1007/s12237-008-9047-6
Deaton C. D., Hein C. J., Kirwan M. L. (2017). Barrier island migration dominates ecogeomorphic feedbacks and drives salt marsh loss along the Virginia Atlantic coast, USA. Geology 45 (2), 123–126. doi: 10.1130/G38459.1
Emanuel K. A. (2005). Increasing destructiveness of tropical cyclones over the past 30 years. Nature 436 (7051), 686–688. doi: 10.1038/nature03906
Emanuel K. A. (2013). Downscaling CMIP5 climate models shows increased tropical cyclone activity over the 21st century. Proc. Natl. Acad. Sci. 110 (30), 12219–12224. doi: 10.1073/pnas.1301293110
Erwin R. M. (1996). Dependence of waterbirds and shorebirds on shallow-water habitats in the mid-Atlantic coastal region: an ecological profile and management recommendations. Estuaries 19 (2), 213–219. doi: 10.2307/1352226
Fagherazzi S., Anisfeld S. C., Blum L. K., Long E. V., Feagin R. A., Fernandes A., et al. (2019). Sea Level rise and the dynamics of the marsh-upland boundary. Front. Environ. Sci. 7. doi: 10.3389/fenvs.2019.00025
Fagherazzi S., Mariotti G., Leonardi N., Canestrelli A., Nardin W., Kearney W. S. (2020). Salt marsh dynamics in a period of accelerated sea level rise. J. Geophys. Res.: Earth Surf. 125 (8), e2019JF005200. doi: 10.1029/2019JF005200
Ferreira C. M., Irish J. L., Olivera F. (2014). Quantifying the potential impact of land cover changes due to sea-level rise on storm surge on lower Texas coast bays. Coast. Eng. 94, 102–111. doi: 10.1016/j.coastaleng.2014.08.011
FitzGerald D. M., Hein C. J., Hughes Z., Kulp M., Georgiou I., Miner M. (2018). ““Runaway barrier island transgression concept: Global case studies.”,” in Barrier dynamics and response to changing climate. Eds. Moore L., Murray A (Cham: Springer), 3–56. doi: 10.1007/978-3-319-68086-6_1
Gedan K. B., Kirwan M. L., Wolanski E., Barbier E. B., Silliman B. R. (2011). The present and future role of coastal wetland vegetation in protecting shorelines: answering recent challenges to the paradigm. Clim. Change 106 (1), 7–29. doi: 10.1007/s10584-010-0003-7
Hapke C. J., Kratzmann M. G., Himmelstoss E. A. (2013). Geomorphic and human influence on large-scale coastal change. Geomorphology 199, 160–170. doi: 10.1016/j.geomorph.2012.11.025
Hein C. J., Fenster M. S., Gedan K. B., Tabar J. R., Hein E. A., DeMunda T. (2021). Leveraging the interdependent relationship between barrier islands and backbarrier marshes to enhance resilience to sea-level rise. Front. Mar. Sci. 8, 721904. doi: 10.3389/fmars.2021.721904
Houser C., Hapke C., Hamilton S. (2008). Controls on coastal dune morphology, shoreline erosion and barrier island response to extreme storms. Geomorphology 100, 223–240. doi: 10.1016/j.geomorph.2007.12.007
IPCC (2014). “Sea level change”, in climate change 2013 – the physical science basis: Working group I contribution to the fifth assessment report of the intergovernmental panel on climate change (Cambridge: Cambridge University Press), 1137–1216. doi: 10.1017/CBO9781107415324.026
Janoff A. (2021). Community-scale beach nourishment and groin construction decisions along human-modified coasts: The interplay between socioeconomics, coordination, tourism, and shoreline change (Montclair (NJ: Montclair State University). Available at: https://digitalcommons.montclair.edu/etd/696.
Janoff A., Lorenzo-Trueba J., Hoagland P., Jin D., Ashton A. D. (2020). From coastal retreat to seaward growth: Emergent behaviors from paired community beach nourishment choices (Washington DC: Earth and Space Science Open Archive ESSOAr). doi: 10.1002/essoar.10505464.1
Kirshen P., Borrelli M., Byrnes J., Chen R., Lockwood L., Watson C., et al. (2020). Integrated assessment of storm surge barrier systems under present and future climates and comparison to alternatives: A case study of Boston, USA. Clim. Change 162 (2), 445–464. doi: 10.1007/s10584-020-02781-8
Kirwan M. L., Megonigal J. P. (2013). Tidal wetland stability in the face of human impacts and sea-level rise. Nature 504 (7478), 53–60. doi: 10.1038/nature12856
Kirwan M. L., Mudd S. M. (2012). Response of salt-marsh carbon accumulation to climate change. Nature 489 (7417), 550–553. doi: 10.1038/nature11440
Kirwan M. L., Walters D. C., Reay W. G., Carr J. A. (2016). Sea Level driven marsh expansion in a coupled model of marsh erosion and migration. Geophys. Res. Lett. 43 (9), 4366–4373. doi: 10.1002/2016GL068507
Kolodin J., Lorenzo-Trueba J., Hoagland P., Jin D., Ashton A. (2021). Engineered coastal berm-dune renourishment in New Jersey: Can coastal communities continue to hold the line? Anthropocene Coasts 4 (1), 193–209. doi: 10.1139/anc-2020-0024
Komar P. D. (1998). Beach processes and sedimentation (Upper Saddle River, New Jersey: Simon & Schuster), 544 p.
Kopp R. E., Gilmore E. A., Little C. M., Lorenzo-Trueba J., Ramenzoni V. C., Sweet W. V. (2019). Usable science for managing the risks of sea-level rise. Earth’s Future 7 (12), 1235–1269. doi: 10.1029/2018EF001145
Lauzon R., Murray A. B., Moore L. J., Walters D. C., Kirwan M. L., Fagherazzi S. (2018). Effects of marsh edge erosion in coupled barrier island-marsh systems and geometric constraints on marsh evolution. J. Geophys. Res.: Earth Surf. 123 (6), 1218–1234. doi: 10.1029/2017JF004530
Lazarus E. D., Goldstein E. B. (2019). Is there a bulldozer in your model? J. Geophys. Res.: Earth Surf. 124 (3), 696–699. doi: 10.1029/2018JF004957
Lazarus E. D., Goldstein E. B., Taylor L. A., Williams H. E. (2021). Comparing patterns of hurricane washover into built and unbuilt environments. Earth’s Future 9 (3), e2020EF001818. doi: 10.1029/2020EF001818
Leatherman S. P. (1979). Migration of assateague island, Maryland, by inlet and overwash processes. Geology 7, 104–107. doi: 10.1130/0091-7613(1979)7<104:MOAIMB>2.0.CO;2
Lin N., Emanuel K. A., Smith J. A., Vanmarcke E. (2010). Risk assessment of hurricane storm surge for New York city. J. Geophys. Res. 115, D18121. doi: 10.1029/2009JD013630
Lin N., Lane P., Emanuel K. A., Sullivan R. M., Donnelly J. P. (2014). Heightened hurricane surge risk in northwest Florida revealed from climatological-hydrodynamic modeling and paleorecord reconstruction. Journal of Geophysical Research: Atmospheres 119, 8606–8623. doi: 10.1002/2014JD021584
Lloyd J. B. (2005). Two centuries of history on long beach island (Harvey Cedars, NJ: Down The Shore Publishing Corp).
Lorenzo-Trueba J., Ashton A. D. (2014). Rollover, drowning, and discontinuous retreat: Distinct modes of barrier response to sea-level rise arising from a simple morphodynamic model. J. Geophys. Res.: Earth Surf. 119 (4), 779–801. doi: 10.1002/2013JF002941
Lorenzo-Trueba J., Mariotti G. (2017). Chasing boundaries and cascade effects in a coupled barrier-marsh-lagoon system. Geomorphology 290, 153–163. doi: 10.1016/j.geomorph.2017.04.019
Lorenzo-Trueba J., Voller V. R., Muto T., Kim W., Paola C., Swenson J. B. (2009). A similarity solution for a dual moving boundary problem associated with a coastal-plain depositional system. J. Fluid Mech. 628, 427–443. doi: 10.1017/S0022112009006715
Lorenzo-Trueba J., Voller V. R., Paola C. (2013). A geometric model for the dynamics of a fluvially dominated deltaic system under base-level change. Comput. Geosci. 53, 39–47. doi: 10.1016/j.cageo.2012.02.010
Marani M., D’Alpaos A., Lanzoni S., Santalucia M. (2011). Understanding and predicting wave erosion of marsh edges. Geophys. Res. Lett. 38 (21), L21401. doi: 10.1029/2011GL048995
Mariotti G., Fagherazzi S. (2013). Critical width of tidal flats triggers marsh collapse in the absence of sea-level rise. Natl. Acad. Sci. 110 (14), 5353–5356. doi: 10.1073/pnas.1219600110
McBride R. A., Anderson J. B., Buynevich I. V., Cleary W. J., Fenster M. S., FitzGerald D. M., et al. (2013). Morphodynamics of barrier systems: a synthesis, in treatise on geomorphology, v. 10 (San Diego, CA: Academic Press), 166–244. doi: 10.1016/B978-0-12-374739-6.00279-7
Mcleod E., Chmura G. L., Bouillon S., Salm R., Björk M., Duarte C. M., et al. (2011). A blueprint for blue carbon: toward an improved understanding of the role of vegetated coastal habitats in sequestering CO2. Front. Ecol. Environ. 9 (10), 552–560. doi: 10.1890/110004
McNamara D. E., Murray A. B., Smith M. D. (2011). Coastal sustainability depends on how economic and coastline responses to climate change affect each other. Geophys. Res. Lett. 38 (7), L07401. doi: 10.1029/2011GL047207
McNamara D. E., Werner B. T. (2008a). Coupled barrier island-resort model: 1. emergent instabilities induced by strong human-landscape interactions. J. Geophys. Res. 113, F01016. doi: 10.1029/2007JF000840
McNamara D. E., Werner B. T. (2008b). Coupled barrier island–resort model: 2. tests and predictions along ocean city and assateague island national seashore, Maryland. J. Geophys. Res.: Earth Surf. 113, F01017. doi: 10.1029/2007JF000841
Miselis J. L., Flocks J. G., Zeigler S., Passeri D., Smith D. R., Bourque J., et al. (2021). “Impacts of sediment removal from and placement in coastal barrier island systems. United States Geological survey open-file report 2021–1062. Reston, VA: United States Geological Survey,” in Geological survey open-file report 2021–1062, 94 p. doi: 10.3133/ofr20211062
Miselis J. L., Lorenzo-Trueba J. (2017). Natural and human-induced variability in barrier-island response to sea level rise. Geophys. Res. Lett. 44 (23), 11–922. doi: 10.1002/2017GL074811
New Jersey Department of State (1906). Compendium of censuses 1726-1905, together with the tabulated returns of 1905 (Trenton, NJ: Murphy Publishing Co. Printers).
New Jersey State Data Center (2001) New Jersey population trends 1790 to 2000; census 2000 (Division of Labor Market and Demographic Research). Available at: http://hdl.handle.net/10929/42812 (Accessed May 30, 2022).
Nienhuis J. H., Lorenzo-Trueba J. (2019a). Can barrier islands survive sea-level rise? quantifying the relative role of tidal inlets and overwash deposition. Geophys. Res. Lett. 46 (24), 14613–14621. doi: 10.1029/2019GL085524
Nienhuis J. H., Lorenzo-Trueba J. (2019b). Simulating barrier island response to sea level rise with the barrier island and inlet environment (BRIE) model v1. 0. Geosci. Model. Dev. 12 (9), 4013–4030. doi: 10.5194/gmd-12-4013-2019
Odezulu C. I., Lorenzo-Trueba J., Wallace D. J., Anderson J. B. (2017). Stratigraphic and sedimentological evidence for unprecedented shoreline migration rate during historic time: Follets island, TX, in barrier island dynamics and response to changing climate (New York, NY: Springer). doi: 10.1007/978-3-319-68086-6
Orton P., Vinogradov S., Georgas N., Blumberg A., Lin N., Gornitz V., et al. (2015). New York city panel on climate change 2015 report chapter 4: Dynamic coastal flood modeling. Ann. New York Acad. Sci. 1336 (1), 56–66. doi: 10.1111/nyas.12589
Passeri D. L., Bilskie M. V., Plant N. G., Long J. W., Hagen S. C. (2018). Dynamic modeling of barrier island response to hurricane storm surge under future sea level rise. Clim. Change 149 (3), 413–425. doi: 10.1007/s10584-018-2245-8
Reeves I. R., Moore L. J., Goldstein E. B., Murray A. B., Carr J. A., Kirwan M. L. (2020). Impacts of seagrass dynamics on the coupled long-term evolution of barrier-marsh-bay systems. J. Geophys. Res.: Biogeosci. 125 (2), e2019JG005416. doi: 10.1029/2019JG005416
Roberts T. M., Wang P. (2012). Four-year performance and associated controlling factors of several beach nourishment projects along three adjacent barrier islands, west-central Florida, USA. Coast. Eng. 70, 21–39. doi: 10.1016/j.coastaleng.2012.06.003
Roelvink D., Reniers A., van Dongeren A., van Thiel de Vries J., McCall R., Lescinski J. (2009). Modelling storm impacts on beaches, dunes and barrier islands. Coast. Eng. 56 (11-12), 1133–1152. doi: 10.1016/J.COASTALENG.2009.08.006
Rogers L. J., Moore L. J., Goldstein E. B., Hein C. J., Lorenzo-Trueba J., Ashton A. D. (2015). Anthropogenic controls on overwash deposition: Evidence and consequences. J. Geophys. Res.: Earth Surf. 120 (12), 2609–2624. doi: 10.1002/2015JF003634
Shawler J. L., Ciarletta D. J., Connell J. E., Boggs B. Q., Lorenzo-Trueba J., Hein C. J. (2021). Relative influence of antecedent topography and sea-level rise on barrier-island migration. Sedimentology 68 (2), 639–669. doi: 10.1111/sed.12798
Smith K. E. L., Terrano J. F. (2017). “Shorelines for barnegat and great bay, NJ: 1839 to 2012,” in U.S. geological survey data release, ver 1.1, December 2017 St. Petersburg, FL: United States Geological Survey. doi: 10.5066/F75X275C
Stutz M. L., Pilkey O. H. (2005). The relative influence of humans on barrier islands: Humans versus geomorphology. Rev. Eng. Geol. 16, 137–147. doi: 10.1130/REG16
Stutz M. L., Pilkey O. H. (2011). Open-ocean barrier islands: global influence of climatic, oceanographic, and depositional settings. J. Coast. Res. 27 (2), 207–222. doi: 10.2112/09-1190.1
Swenson J. B., Voller V. R., Paola C., Parker G., Marr J. G. (2000). Fluvio-deltaic sedimentation: A generalized Stefan problem. Eur. J. Appl. Math. 11 (5), 433–452. doi: 10.1017/S0956792500004198
Teal J. M., Weishar L. (2005). Ecological engineering, adaptive management, and restoration management in Delaware bay salt marsh restoration. Ecol. Eng. 25 (3), 304–314. doi: 10.1016/j.ecoleng.2005.04.009
Theuerkauf E. J., Rodriguez A. B. (2017). Placing barrier-island transgression in a blue-carbon context. Earth’s Future 5 (7), 789–810. doi: 10.1002/2017EF000568
Titus J. G., Park R. A., Leatherman S. P., Weggel J. R., Greene M. S., Mausel P. W., et al. (1991). Greenhouse effect and sea level rise: the cost of holding back the sea. Coast. Manage. 19 (2), 171–204. doi: 10.1080/08920759109362138
Trembanis A. C., Pilkey O. H., Valverde H. R. (1999). Comparison of beach nourishment along the US Atlantic, great lakes, gulf of Mexico, and new England shorelines. Coast. Manage. 27 (4), 329–340. doi: 10.1080/089207599263730
United States Army Corps of Engineers (1999) Barnegat inlet to little egg inlet, long beach island, ocean county, new Jersey (revised draft feasibility report and integrated environmental impact statement). EPA number: 990228D. Available at: https://www.sciencebase.gov/catalog/item/5057a80de4b01ad7e02881f6.
United States Bureau of the Census (1912). Thirteenth census of the united states 1910: Population by counties and minor civil divisions 1900, 1890 (Washington, D.C: Washington Government Print Office).
Uptegrove J., Waldner J., Stanford S., Monteverde D., Sheridan R., Hall D. (2012). Geology of the New Jersey offshore in the vicinity of Barnegat Inlet and Long Beach Island. New Jersey Geological and Water survey, Geologic Map Series (GMS). GMS. 12-2. Available at: https://www.researchgate.net/publication/305809013_Geology_of_the_New_Jersey_offshore_in_the_vicinity_of_Barnegat_Inlet_and_Long_Beach_Island_New_Jersey_Geological_and_Water_Survey_Geological_Map_Series_GMS_12-2
U.S. Army Corps of Engineers (1984). “Shoreline protection manual (fourth edition)”: in U.S. Department of the Army, coastal engineering research center technical papers and reports. Washington DC: Department of the Army Waterways Experiment Station, Corps of Engineers. Available at: https://archive.org/details/shoreprotectionm01unit.
Valverde H. R., Trembanis A. C., Pilkey O. H. (1999). Summary of beach nourishment episodes on the US east coast barrier islands. J. Coast. Res. 15, 1100–1118. Available at: https://www.jstor.org/stable/4299028
Walters D. C., Kirwan M. L. (2016). Optimal hurricane overwash thickness for maximizing marsh resilience to sea level rise. Ecol. Evol. 6 (9), 2948–2956. doi: 10.1002/ece3.2024
Walters D., Moore L. J., Duran Vinent O., Fagherazzi S., Mariotti G. (2014). Interactions between barrier islands and backbarrier marshes affect island system response to sea level rise: Insights from a coupled model. J. Geophys. Res.: Earth Surf. 119 (9), 2013–2031. doi: 10.1002/2014JF003091
Weinstein M. P., Teal J. M., Balletto J. H., Strait K. A. (2001). Restoration principles emerging from one of the world’s largest tidal marsh restoration projects. Wetlands Ecol. Manage. 9 (5), 387–407. doi: 10.1023/A:1012058713910
Werner B. T., Mcnamara D. E. (2007). Dynamics of coupled human-landscape systems. Geomorphology 91 (3-4), 393–407. doi: 10.1016/j.geomorph.2007.04.020
Wolters M., Garbutt A., Bakker J. P. (2005). Salt-marsh restoration: evaluating the success of de-embankments in north-west Europe. Biol. Conserv. 123 (2), 249–268. doi: 10.1016/j.biocon.2004.11.013
Keywords: barrier island, marsh, lagoon, overwash processes, coastal development, beach nourishment, hold the line
Citation: Tenebruso C, Nichols-O’Neill S, Lorenzo-Trueba J, Ciarletta DJ and Miselis JL (2022) Undeveloped and developed phases in the centennial evolution of a barrier-marsh-lagoon system: The case of Long Beach Island, New Jersey. Front. Mar. Sci. 9:958573. doi: 10.3389/fmars.2022.958573
Received: 31 May 2022; Accepted: 26 September 2022;
Published: 21 October 2022.
Edited by:
Javier Benavente, University of Cádiz, SpainReviewed by:
Carlos Loureiro, University of Stirling, United KingdomEli Lazarus, University of Southampton, United Kingdom
Duncan FitzGerald, Boston University, United States
Copyright © 2022 Tenebruso, Nichols-O’Neill, Lorenzo-Trueba, Ciarletta and Miselis. This is an open-access article distributed under the terms of the Creative Commons Attribution License (CC BY). The use, distribution or reproduction in other forums is permitted, provided the original author(s) and the copyright owner(s) are credited and that the original publication in this journal is cited, in accordance with accepted academic practice. No use, distribution or reproduction is permitted which does not comply with these terms.
*Correspondence: Jorge Lorenzo-Trueba, bG9yZW56b3RydWVqQG1vbnRjbGFpci5lZHU=