 Hongmei Zhang
 Zhaobin Xu
 Junxiao Xu
 Zhenlin Wei1
- 1Shandong Provincial Key Laboratory of Biophysics, Shandong Universities Key Laboratory of Functional Biological Resources Utilization and Development, College of Life Science, Dezhou University, Dezhou, China
- 2Key Laboratory of Freshwater Aquatic Genetic Resources, Shanghai Ocean University, Ministry of Agriculture, Shanghai, China
Drosha is critical for producing mature microRNAs (miRNAs) from their precursor molecules and small interfering RNAs (siRNAs). Although Drosha has been well characterized in most vertebrate species, identifying the Japanese flounder Drosha has remained elusive. In this study, we cloned the Japanese flounder Drosha gene, which has 4,122 nucleotides (nt), including a 5’-untranslated region (UTR) of 14 nt, a 3’-UTR of 230 nt, and a 3,879 nt open reading frame (ORF) encodes a 1,292 amino acid polypeptide. Then, we analyzed the conservation and phylogenetic evolution of Drosha in some species. Real-time quantitative PCR revealed that Drosha mRNA is highly expressed in the brain, and a lower amount of mRNA was also found in muscle than in other tissues. Drosha plays a vital role in controlling flounder development and metabolism, and its mRNA levels were relatively high at 36 dph (days post-hatching) in the period of metamorphosis and growth of the Japanese flounder. Drosha expression showed in advance with a peak at 23 dph following TH (thyroid hormone) treatment. To further investigate the role of Drosha in metamorphosis, we performed siRNA knockdown of Drosha in flounder embryonic cells (FEC) cells. The result shows that the Drosha-specific siRNA significantly down-regulated Drosha mRNA and miR-1,133,17,214,181a,181b levels, while primary miRNA (pri-miRNA) levels were not significantly different from negative control (NC). These results suggest that Drosha plays a vital role in Japanese flounder development and metamorphosis through processing to produce mature miRNAs, providing essential information for further studying of the part of the Drosha gene in the Japanese flounder development.
1 Introduction
Japanese flounder (Paralichthys olivaceus) is one of the most critical economic fish in marine aquaculture in China, Korea, and Japan (Gawantka et al., 1998). The Japanese flounder market has increased in economic value due to high consumption (Han et al., 2006). The best-studied example of vertebrate metamorphosis is the anuran amphibian—the frog. However, the Japanese flounder is a noteworthy example of a commercially valuable metamorphosis. The planktonic larvae are symmetrical before metamorphosis. After metamorphosis, one eye migrates to the opposite side of the head and produces asymmetric bottom larvae (Campinho et al., 2010). Japanese flounder takes about 40 days to complete metamorphosis (Policansky and Sieswerda, 1979). During metamorphosis, tissues are also reconfigured, and their structure and function are altered due to tissue-specific expression of genes. Retinoic acid signaling plays a critical role in the developmental regulatory system of ocular-side-specific asymmetric pigmentation in flounders (Chen et al., 2020). During metamorphosis of flounder larvae, Sox10-positive progenitor cells migrate from the base of the dorsal fin to the blind side of the skin starting from a specific stimulus and causing ectopic pigmentation (Togawa et al., 2018). Tissue-specific expression of genes is induced directly or indirectly by thyroid hormones. Treatment of Japanese flounder with exogenous thyroid hormones induces premature metamorphosis, whereas thiourea inhibits metamorphosis (Hoke et al., 2006; Mullur et al., 2014). In addition, the regulation of gene expression is tissue-specific during metamorphosis of Japanese flounder. Thyroid hormones (TH) have been shown to be a necessary and sufficient factor during metamorphic development in Japanese flounders (Miwa and Inui, 1987; Manchado et al., 2008; Power et al., 2008).
Nevertheless, TH-regulated cellular and molecular events driving eye migration during Japanese flounder asymmetric development remain elusive. The forces behind driving Japanese flounder eye migration have also been troubling biologists, and recently, it has been proposed that cell proliferation in the subocular region is the primary cause (Bao et al., 2011). However, this model cannot account for remodeling during metamorphosis of the ventral blind lateral jaw and eye still migrate when cell proliferation has been inhibited.
MicroRNA is a class of small non-coding RNA consisting of about 22 bases, which, usually, negatively regulates mRNA expression of target genes at the translation level (Hatfield et al., 2005). MicroRNA is an endogenous small molecule RNA encoded by the genome, which must be processed to become a functional microRNA. In general, the processing of RNA transcripts into mature miRNAs can be divided into four steps: primary miRNAs (pri-miRNAs), pre-miRNAs, miRNA/miRNA* duplexes, and mature miRNAs. Drosha enzyme is mainly responsible for cleaving pri-miRNA into pre-miRNA (about 70 nt) in the nucleus and exporting pre-miRNA from the nucleus to the cytoplasm under the action of Export5. Then, the precursor is cleaved into mature miRNA(about 22 nt) by Dicer in the cytoplasm (Denli et al., 2004; Okada et al., 2009; Ha and Kim, 2014; O’Brien et al., 2018).
Drosha belongs to the RNaseIII family, which contains a rich thymine domain, arginine domain, a CED domain, a double-stranded RNA binding domain, and two RNA catalytic domains (Lee et al., 2006; Kwon et al., 2016). Drosha and DGCR8 form a microprocessor complex, and both act synergistically for precise cleavage of the stem-loops of pri-mRNA to create pre-mRNA (Luhur et al., 2014). They play a major role in miRNA formation. If Drosha is knocked out, the production of pre-miRNA and mature miRNA will be affected (Jeong et al., 2016), which will eventually cause cellular dysfunction and even apoptosis. It has been shown that microRNAs play an essential role in the metamorphosis of Japanese flounders (Fu et al., 2011; Zhang et al., 2015). Here, we cloned Drosha, a critical gene in the miRNA synthesis pathway of Japanese flounder, and analyzed its expression levels in different tissues and metamorphosis stages by QRT-PCR and the effect of exogenous TH on the expression of the Drosha gene. The result provides a reference for further study on the effect of the Drosha gene on the metamorphosis of Japanese flounders.
2 Material and methods
2.1 Experimental fish and sample collection
Japanese flounder embryos, larvae, and adult fish were collected from Beidaihe Central Experimental Station (Chinese Academy of Fishery Sciences, China). Embryos and larvae were maintained in tanks with circulating water, and the temperature was 16°C. The samples were periodically collected (n=3 pools, 15–30 specimens/pool) at 0 h (unfertilized egg), 26 hpf (hour post-fertilization, gastrula stage), 71 hpf (heart-beating stage), 3 dph (days post-hatching), 9 dph, 14 dph, 17 dph (pre-metamorphosis, the stage before the start of eye migration), 23 dph (pro-metamorphosis, the right eye moved toward the dorsal margin but still could not be seen from the left/ocular side), 29 dph (climax metamorphosis, the right eye has become visible from the ocular side while not reached the dorsal midline), 36 dph (post-metamorphosis, the right eye has just located on the dorsal margin), and 41 dph (completed metamorphosis) (Policansky and Sieswerda, 1979). Under standard conditions in our laboratory, larvae survive an average of 41 days from hatching to completion of metamorphosis. Referring to the Policansky and Miwa’s classification method for the metamorphosis development period of Japanese flounder (Policansky and Sieswerda, 1979; Miwa, 1987), according to the changes in the appearance of the fish, the metamorphism process corresponds to the number of days after hatching as shown in the Supplementary Table 1.
Collected samples were immediately cryopreserved in liquid nitrogen at -196°C until RNA extraction.
To study the effect of TH on Drosha in Japanese flounder metamorphosis, we divided the 15-day-old larvae into three groups with 5,000 larvae in each. We reared them in seawater containing either 0.1 ppm concentration of TH (T3), 30 ppm of TU (Inui and Miwa, 1985), or none. We replace the 1/3 water daily to keep T3 and TU concentrations constant. Until day 41, we terminated the TH and TU treatments. Larvae (n=3 pools, 15–30 specimens/pool) were collected at 17, 23, 29, and 36 dph, frozen in liquid nitrogen, and stored at −196°C until RNA extraction.
The adult fish’s heart, liver, spleen, stomach, kidney, brain, gill, muscle, gonad, and intestine (n=3) were separated, frozen in liquid nitrogen directly, and stored at -196°C until RNA extraction.
Japanese flounder embryonic cells (FEC) (the Yellow Sea Fisheries Research Institute, Chinese Academy of Fishery Sciences) were cultured in DMEM (GIBCO, CA) supplemented with 10% fetal bovine serum (GIBCO) and 1x penicillin/streptomycin (Gibco), then maintained at 24°C in an ambient air incubator (Chen et al., 2004).
2.2 RNA extraction and cDNA cloning of Drosha
Total RNA was isolated from embryos, whole larvae (including control, TH-treated or TU-treated) and adult tissues/organs (gill, heart, intestine, stomach, spleen, muscle, kidney, and liver) using TRIZOL reagent (Life Technologies, CA, USA) genomic DNA contamination was removed using RQ1 RNASE-FreeDNASE (Promega, Madison, WI, USA) according to the manufacturer’s instructions. RNA integrity was detected by agarose gel electrophoresis using a NANODROP2000 spectrophotometer (ThermoScientific, Waltham, MA, USA) to quantify the RNA concentration, and the ratio of A260/A280 was between 1.8 and 2.0.
Using M-MLV Reverse Transcriptase (Promega), DNase-treated total RNAs (1.0 μg) from each sample were reverse-transcribed by Oligodt (Takara, China). We compare the published Drosha cDNA sequences on NCBI (http://www.ncbi.nlm.nih.gov) and then design five pairs of primers for cloning the partial fragments of Drosha from Japanese flounder. The components for PCR amplification were combined: 1 μl of cDNA template, 2.0 μl of 10× Ex Taq buffer, 1.6 μl of dNTP (2.5 mM of each), 2 μl of each the forward and reverse primers (10 μM), and 0.2 μl of Ex Taq® DNA polymerase (TaKaRa, Japan) and 11.2 μl dH20 in a final volume of 20 μl. The PCR amplification condition: denaturation at 94°C for 4 min, with 35 cycles at a melting temperature of 94°C for 30 s, an annealing temperature of 50–60°C (according to the primers) for 30 s, and an extension temperature of 72°C for 60–150 s (according to the primers). The gene-specific primers for the 3’ and 5’ RACE were designed based on the partial fragment, and adaptor primers and the full-length cDNA of Japanese flounder Drosha were cloned using the 5’ and 3’ -Full RACE Kit (Takara, Japan). The primers used in the present study are listed in Table 1.
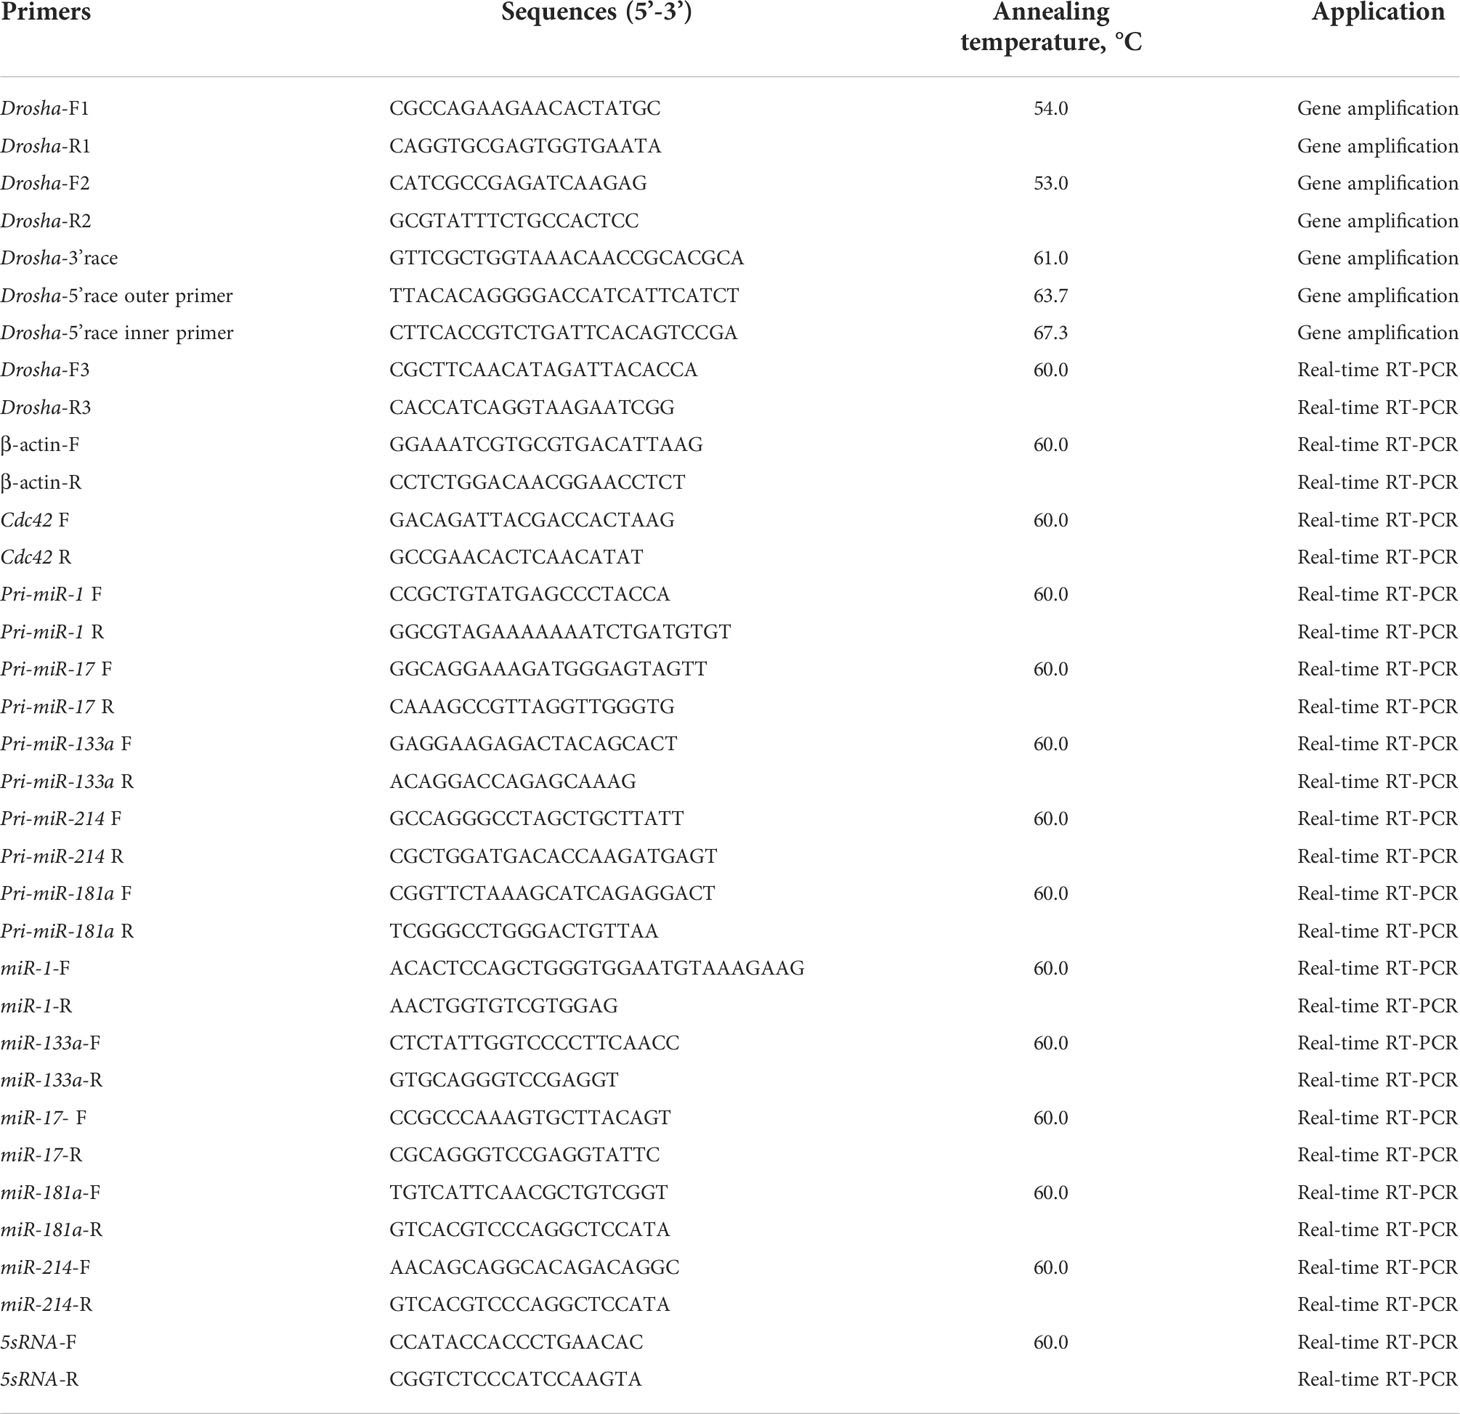
Table 1 The primer sequences for the PCR used in the present study.
The amplified products were separated by 1.5% agarose gel electrophoresis. The desired band was present and ligated into PMD®19-T vector (TAKARA, Japan) after purification using a Gel Extraction Kit (Tiangen, China), and transformed into Escherichia coli strain DH5α competent cells. The positive clones were sequenced on an ABI PRISM 3730 Automated Sequencer (ABI, USA).
2.3 Sequence and phylogenetic evolution analysis
Other species homologues were obtained by a BLASTX search of the Japanese flounder DROSHA protein, which was our cloned. The accession numbers of which are in the Supplementary Table 2. The Drosha amino acid sequences were aligned and the phylogenetic tree was constructed using the MEGA program (version 11.013; www.megasoftware.net) with the neighbor-joining method and maximum-likelihood method with 1,000 bootstraps. Then, the phylogenetic tree was visualized by Evolview (https://www.evolgenius.info/evolview) (Subramanian et al., 2019).
2.4 Real-time quantitative PCR
Total RNA from adult tissues, embryos, and larvae was isolated using Trizol® reagent (Invitrogen, USA) and treated with DNase (5 U/μl) (TaKaRa, Japan) for 1 h. RNA integrity was assessed by 0.8% agarose gel electrophoresis, and the concentration of RNA samples was determined by spectrophotometer NANODROP2000C (Thermo). The ratio of A260/A280 is between 1.83 and 2.02. DNase (Promega, Madison, WI, USA) without RQ1RNase eliminated genomic DNA contamination. We then used PCR amplification to confirm that the genomic DNA was free of contamination.
We used CFX96 Touch™ Real-Time PCR Detection System (Bio-Rad, USA) to accomplish the Real-time quantitative PCR. The components of reactions were in a 20 μl volume containing 1 μl cDNA generated from the RNA template, 2 μl of each of the specific forward and reverse primers (Drosha qPCR1- F and Drosha qPCR1- R, 10 μM), and 10 μl of 2 × iO™ SYBR Green Supermix (Bio-Rad, USA).
The condition of amplification was used as follows: initial denaturation for 1 min at 95°C, followed by 40 cycles of 95°C for 30 s, and 60°C for 10 s and a melting curve was obtained for assessing the specificity of the qPCR amplification, additional cycles were performed by reading the fluorescence value from 55 to 95°C. We used sterile deionized water instead of a cDNA template for negative controls. Each experiment was repeated in duplicate. For normalization of cDNA loading, the housekeeping gene β-actin was run in parallel with all samples. A standard curve of each pair of primers was generated to estimate amplification efficiencies based on known quantities of cDNA (4-fold serial dilutions corresponding to cDNA transcribed from 100 to 0.1 ng of total RNA). All calibration curves exhibited correlation coefficients higher than 0.99, and the corresponding real-time PCR efficiencies (E) were higher than 0.95. We used the 2−ΔΔCT method to determine the relative mRNA expression for the Drosha gene. The primer sequences see the Table 1.
2.5 siRNA inhibit Drosha expression in vitro
Based on the synthesized Drosha sequences, three interfering sequences (Drosha-siRNA1, Drosha-siRNA2, and Drosha-siRNA3) targeting Drosha silencing and one negative control (Drosha-siRNA-FAM-NC) with fluorescence were designed. The negative control is a sequence that is not present in the fish. The siRNA sequences were synthesized by Shanghai Jima Pharmaceutical Technology Co.
The FEC cells in the culture flasks were digested with 0.25% trypsin 1 day before transfection, and about 0.4×10 6 cells were inoculated into 6-well culture plates, and the cells were transfected after 24 h when they reached about 70%–80% confluence. Three Drosha (siRNA-1, siRNA-2, and siRNA-3) and Drosha-siRNA-FAM-NC (Table 2) were transfected into FEC cells with Lipofectamine 2000 (Invitrogen).
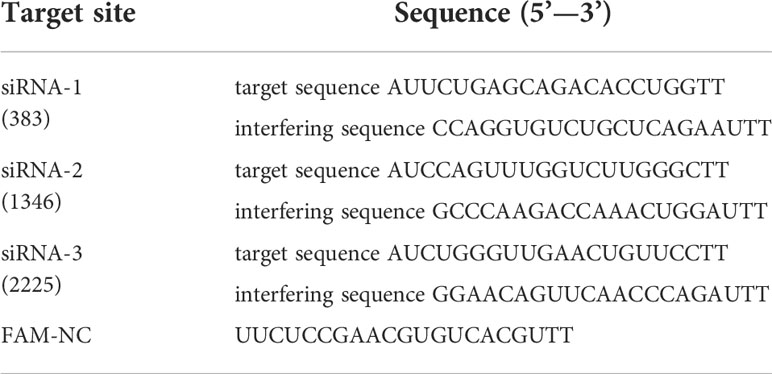
Table 2 siRNA target site and sequence.
The LipoFiter TM-DNA mixture was prepared at a certain ratio and 500 ul of LipoFiter TM-DNA mixture was added to each well, followed by gentle 8-word shaking and mixing; after 6 h of incubation in the cell culture incubator, the culture medium containing LipoFiter TM-DNA was removed. The culture was continued by adding 2 ml of fresh cell culture medium per well and detected under fluoroscopy after 48 h. The expression of pri-miRNA (pri-mir-1,133,17,214,181a,181b), the corresponding miRNA and Cdc42 were assessed at the mRNA level by Realtime-PCR When Drosha was knocked down in FEC cells by siRNA against Drosha. Real-time PCR was performed according to the method in 2.4, 5sRNA was used as an internal reference. The primer sequences are shown in Tables 1, 2.
2.6 Statistical analysis
The one-way ANOVA and post-hoc Dunnett’s T3 test was used to analyze the comparisons among different stages and adult tissues. As for the comparisons among drug treatments, we used two-way ANOVA and a Bonferroni post-hoc analysis. All experimental data were shown as the mean ± Standard Error (SE) (n=3). At the level of p < 0.05, the results of significance were accepted.
3 Results
3.1 Characters and analysis of Japanese flounder Drosha
The Drosha fragment was amplified with some primers (Table 1). The 5’-RACE fragment and the 3’-RACE fragment were amplified based on the Drosha fragment, respectively. The complete cDNA consists of 14 bp 5’-UTR, 230 bp 3’-UTR, and an open reading frame (ORF) of 3879 bp. In addition, the ORF encodes a polypeptide of 1292 amino acids.
Drosha sequences from five species were aligned. As shown in Figure 1, Drosha had five highly conservative amino acid sequence domains: DEXD/H-box, DUF283, PAZ_Drosha_like, two neighboring RNase III, and dsRBD domain. BLAST analysis showed an average homology of 78% to other species. The highest homology of 89% was found between the amino acid sequence of Oreochromis niloticus and that of Japanese flounder. Moreover, it showed that the lowest identity of 72% was found between the amino acid sequence of Xenopus laevis and that of Paralichthys olivaceus.
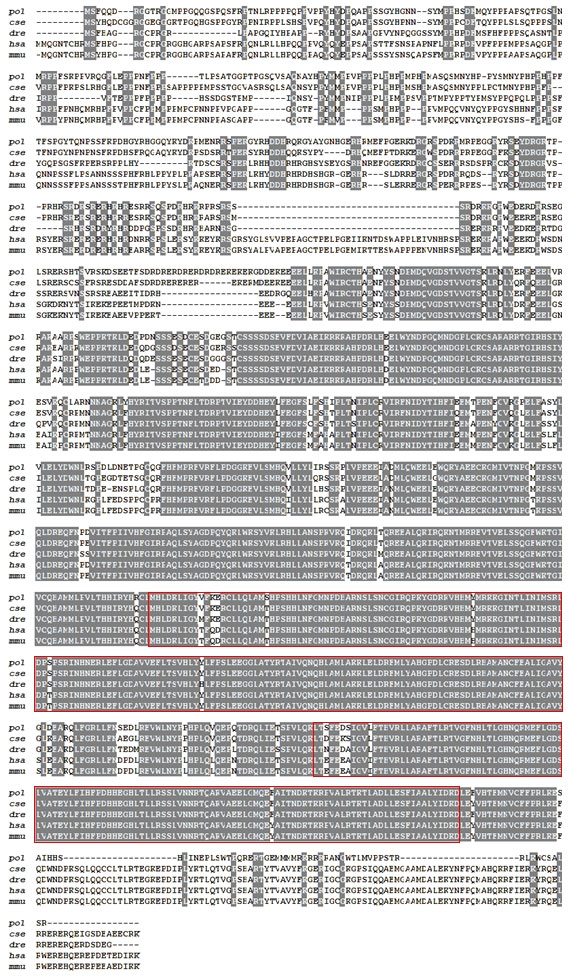
Figure 1 Amino acid sequence alignment of Japanese flounder Drosha with that of other species. Light gray blocks showed a few different residues between those sequences shown. The red box contains the active region of the RNase III superfamily. pol: Paralichthys olivaceus; cse: Cynoglossus semilaevis (XP_008306545.1); dre: Danio rerio (NP_001103942.1); hsa: Homo sapiens (NP_037367.3); mmu: Mus musculus (NP_081075.3).
A phylogenetic tree of Drosha, which used DROSHA protein sequences for 26 species in animal, was constructed to ascertain the evolutionary relationship of Drosha in metazoan. Both neighbor-joining (NJ) and maximum likelihood (ML) methods were used for evolutionary analysis. The evolutionary relationship between the ML tree and the NJ tree is very similar (Figures 2A, B). The Paralichthys olivaceus was clustered with Scophthalmus-maximus, located in the osteichthyes branch. The phylogeny (based on amino acid sequence) of DROSHA was largely consistent with that of the expected species.
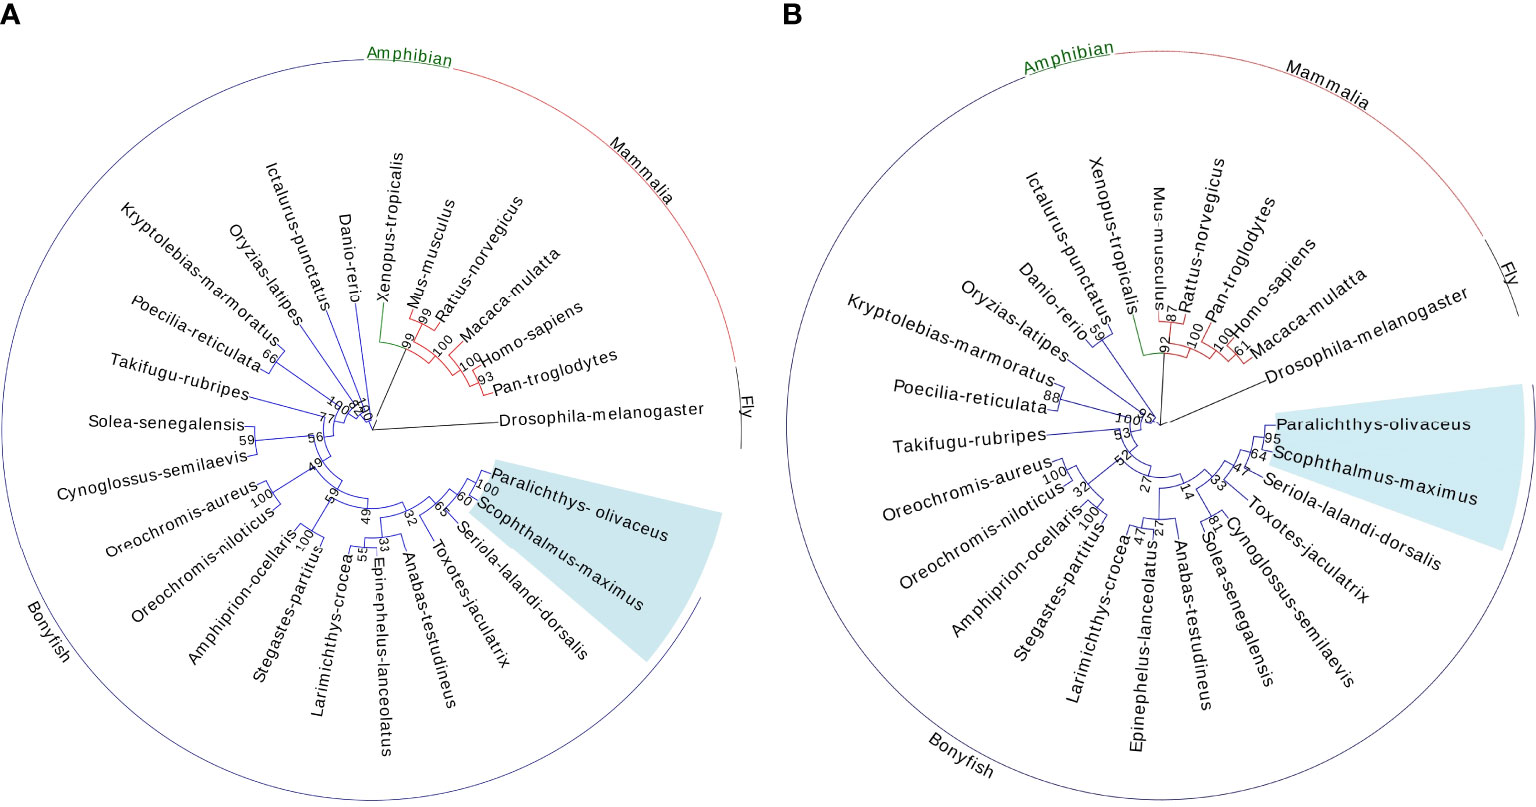
Figure 2 Phylogenetic tree of the selected Drosha sequences by the Neighbor-Joining method (1000 bootstrap) (A) and by the maximum-likelihood method (1000 bootstrap) (B). Bootstrap values are shown at the branch points. Scale bar indicates the number of changes inferred as having occurred along each branch. The Drosha amino acid sequences used for analysis are extracted from the GenBank database.
3.2 Tissue distribution of Drosha mRNA
We used real-time quantitative PCR to conduct the expression pattern of Drosha mRNA in different tissues of adult Japanese flounder. As shown in Figure 3, Drosha mRNA was detected in all investigated tissues. It was observed that the brain was the highest, the ovaries, gills, and kidneys were the lowest, and other tissues were medium. Drosha levels, which are about equal among heart, stomach, and liver, are significantly lower than that in muscle and intestine (p < 0.05).
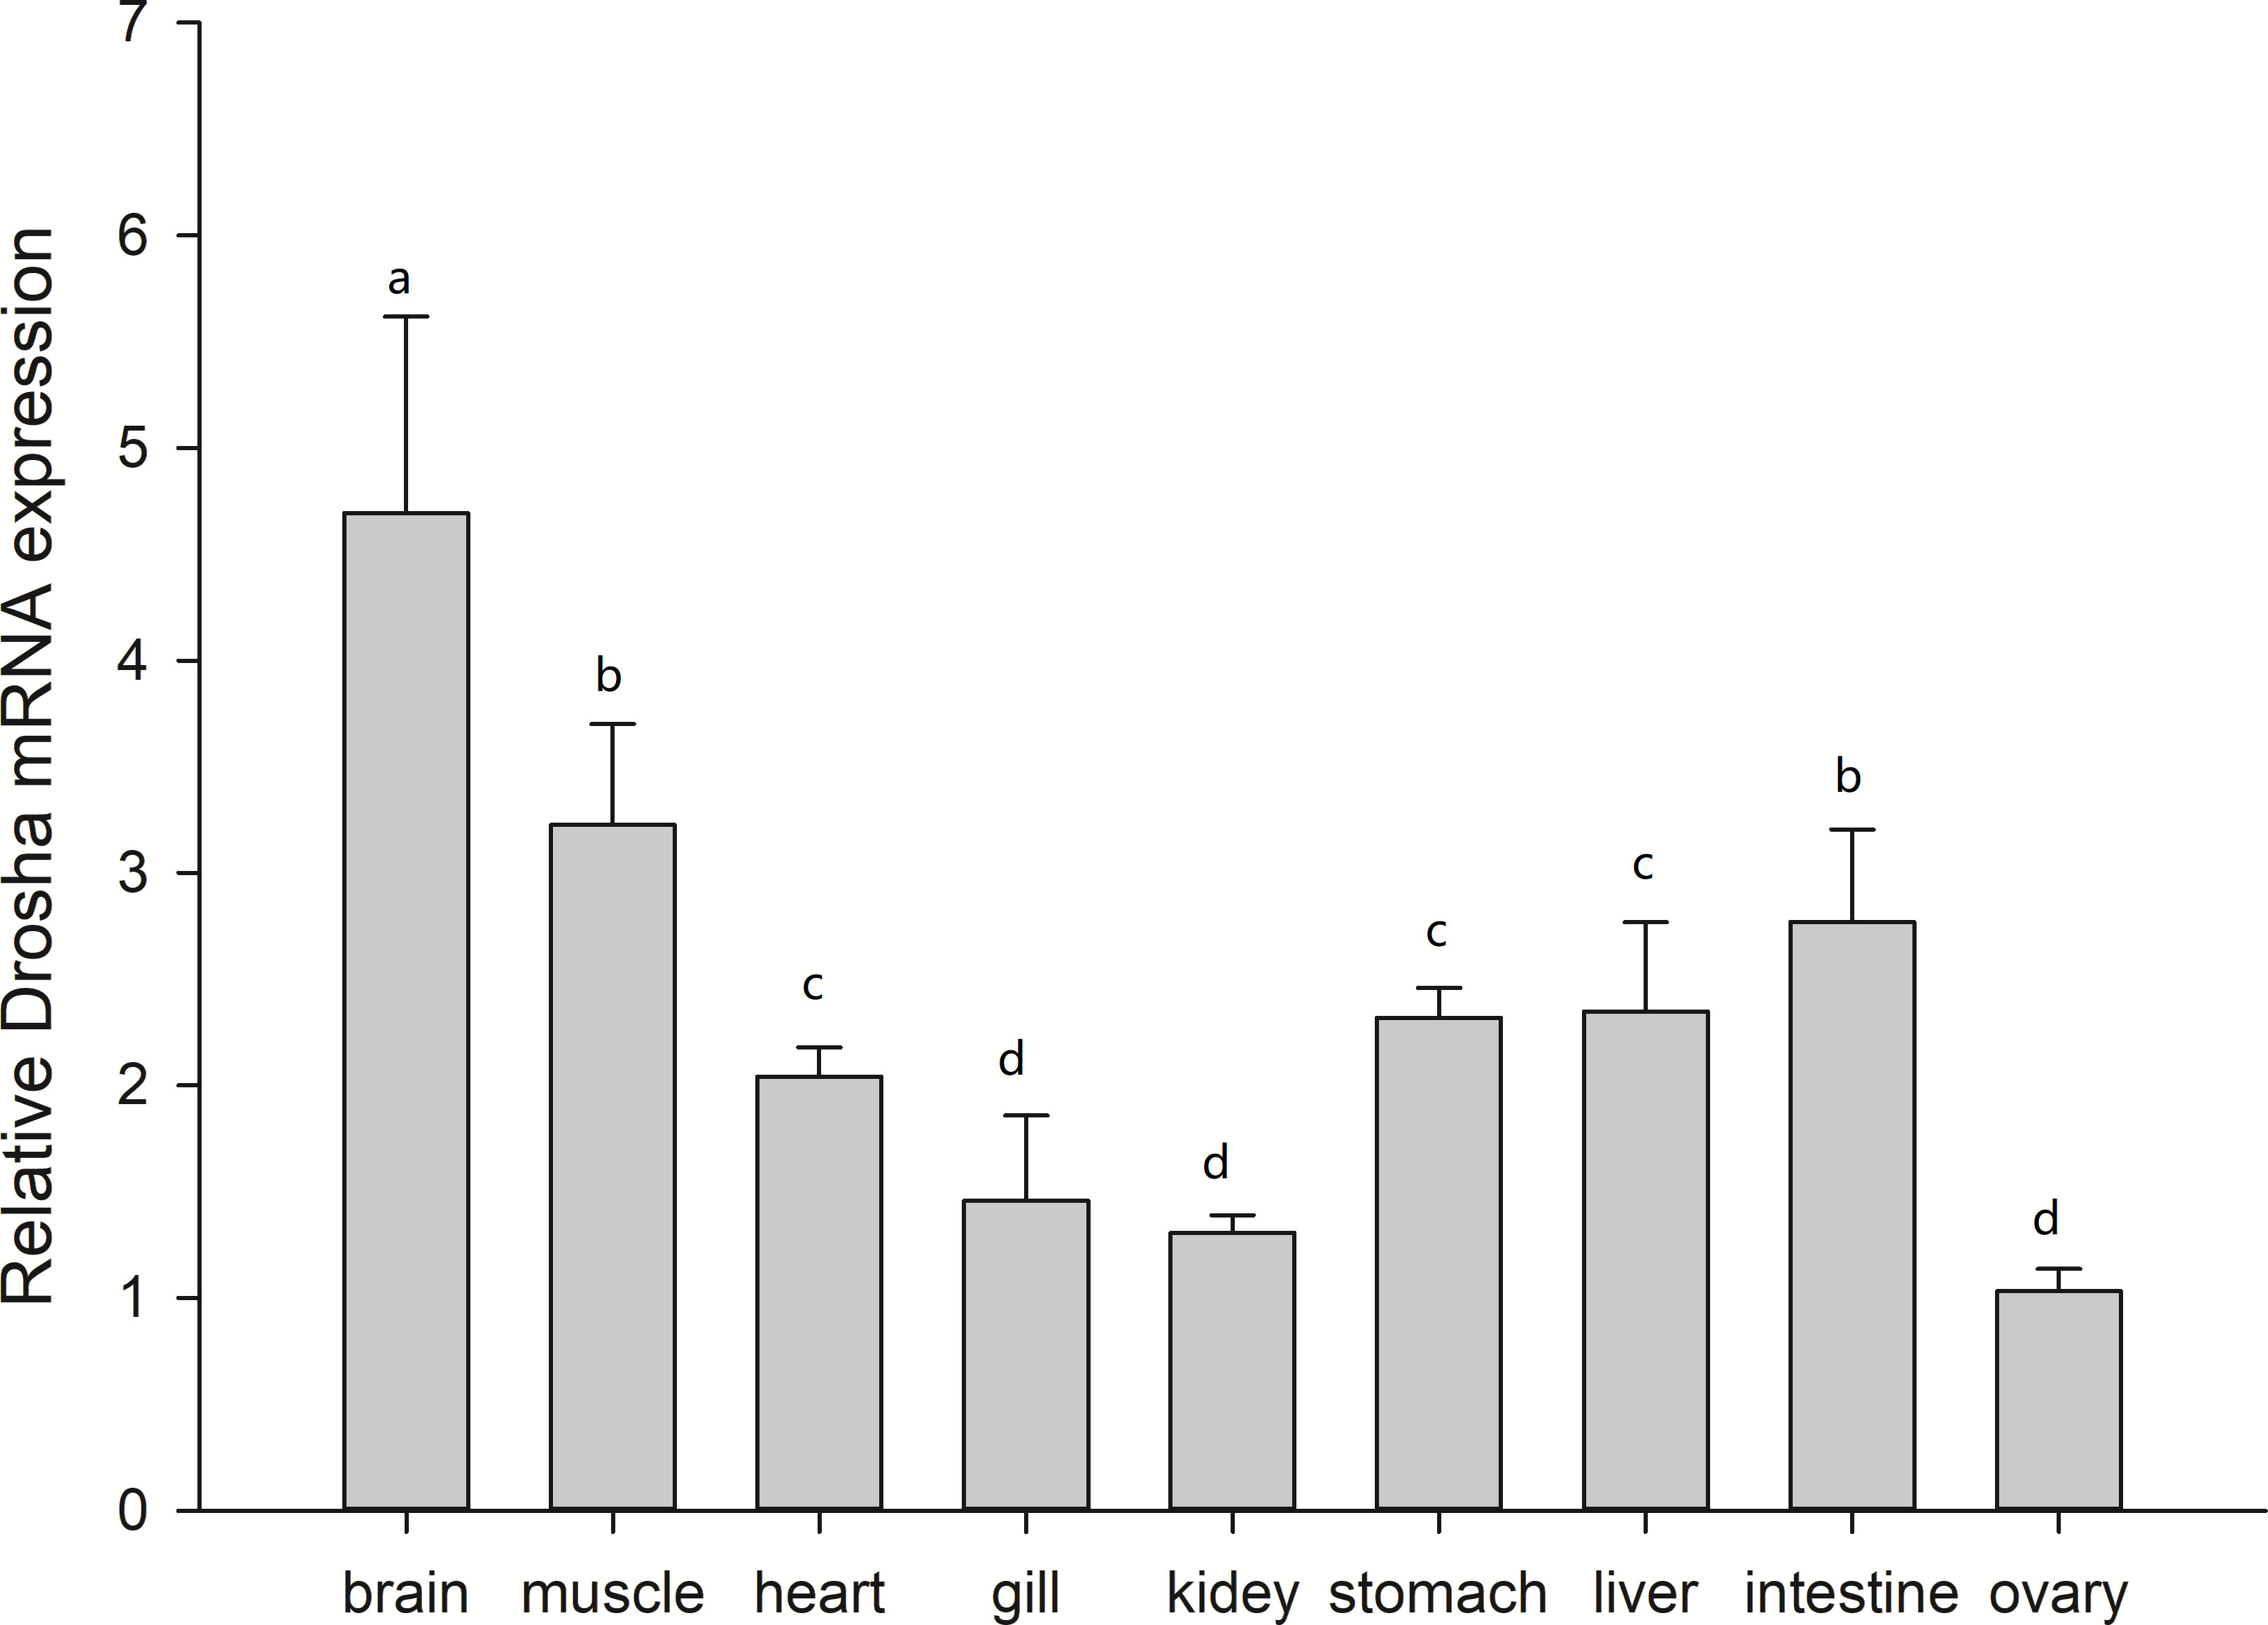
Figure 3 Relative expression levels of Drosha mRNA in adult tissues of Japanese flounder. The data are expressed as the mean ± Standard Error (SE) (n = 3) from the calibrator group (Muscle) and expression were normalized to those of β-actin. Different letters indicate significant differences between the two tissues (P < 0.05).
3.3 Expression of Drosha mRNA during embryonic and larval development
The mRNA of Drosha could be detected in all developmental stages (Figure 4). As shown in Figure 4, the highest expression level of Drosha was detected in 36 dph. The Drosha gene is hardly expressed during unfertilized eggs. Additionally, it significantly declined at 3 dph, when the yolk absorption was almost complete. However, the expression of Drosha kept a higher level and was no significant difference at four metamorphic stages.
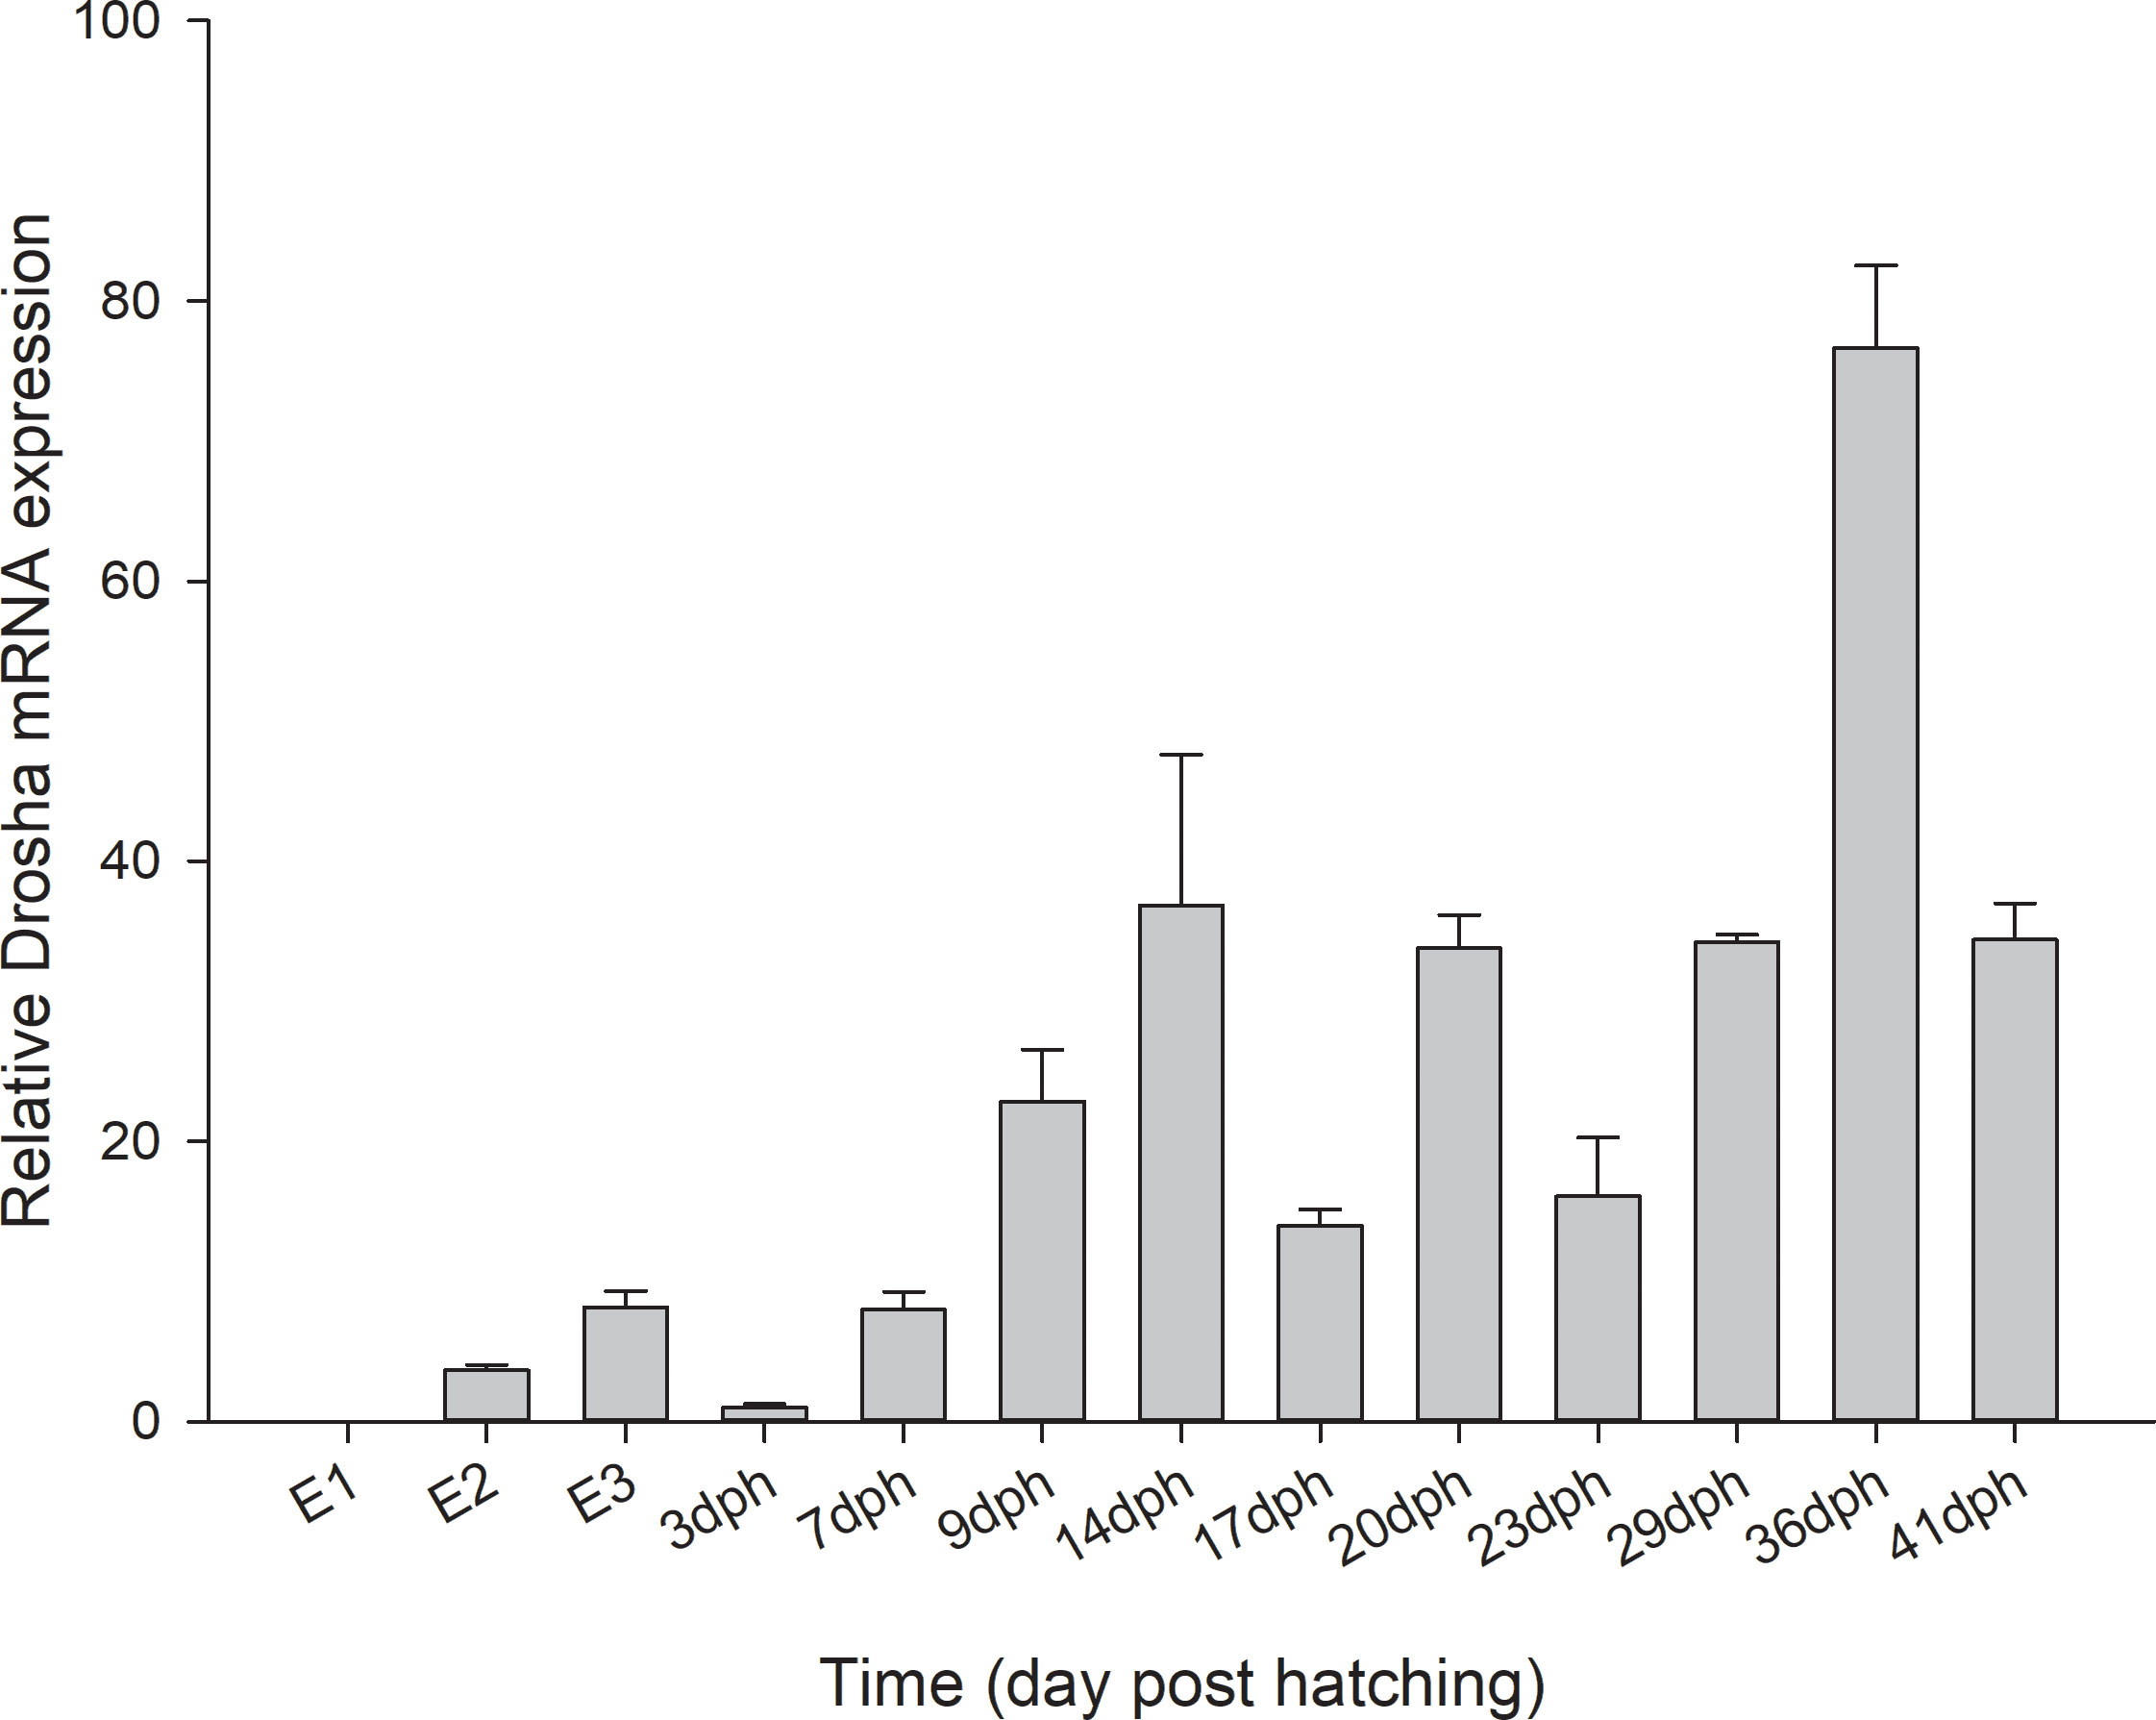
Figure 4 Relative levels of Drosha mRNA during early development of Japanese flounder. Expression values were normalized to those of β-actin, and data are expressed as the mean ± Standard Error (SE) (n = 3) from the calibrator group (E1). E1, unfertilized stage; E2, gastrula stage; E3, heart-beating stage.
3.4 Effect of TH and TU on the expression of Drosha mRNA during metamorphosis
We determined the expression pattern of Drosha in larvae sampled 17, 23, 29, and 36 days after TH and TU treatment (Figure 5). In 17 d, 23 d, and 29 d, the expression of Drosha was not significantly different between TH and TU. Significantly, the level of Drosha in TH-treated at 36 d declined compared to the CK (untreated group), and 29 d was higher than that in other states. The expression of Drosha in TU-treated larvae was kept at the same level among the other three stages except 23 d. Moreover, the level of Drosha in the untreated group was almost steady except 36 d. There were significant differences in Drosha mRNA in the TH (17, 20, 29, 36, 41 dph) and TU (17, 20, 23, 29, 36, 41 dph) treated groups compared to the control group (p < 0.05).
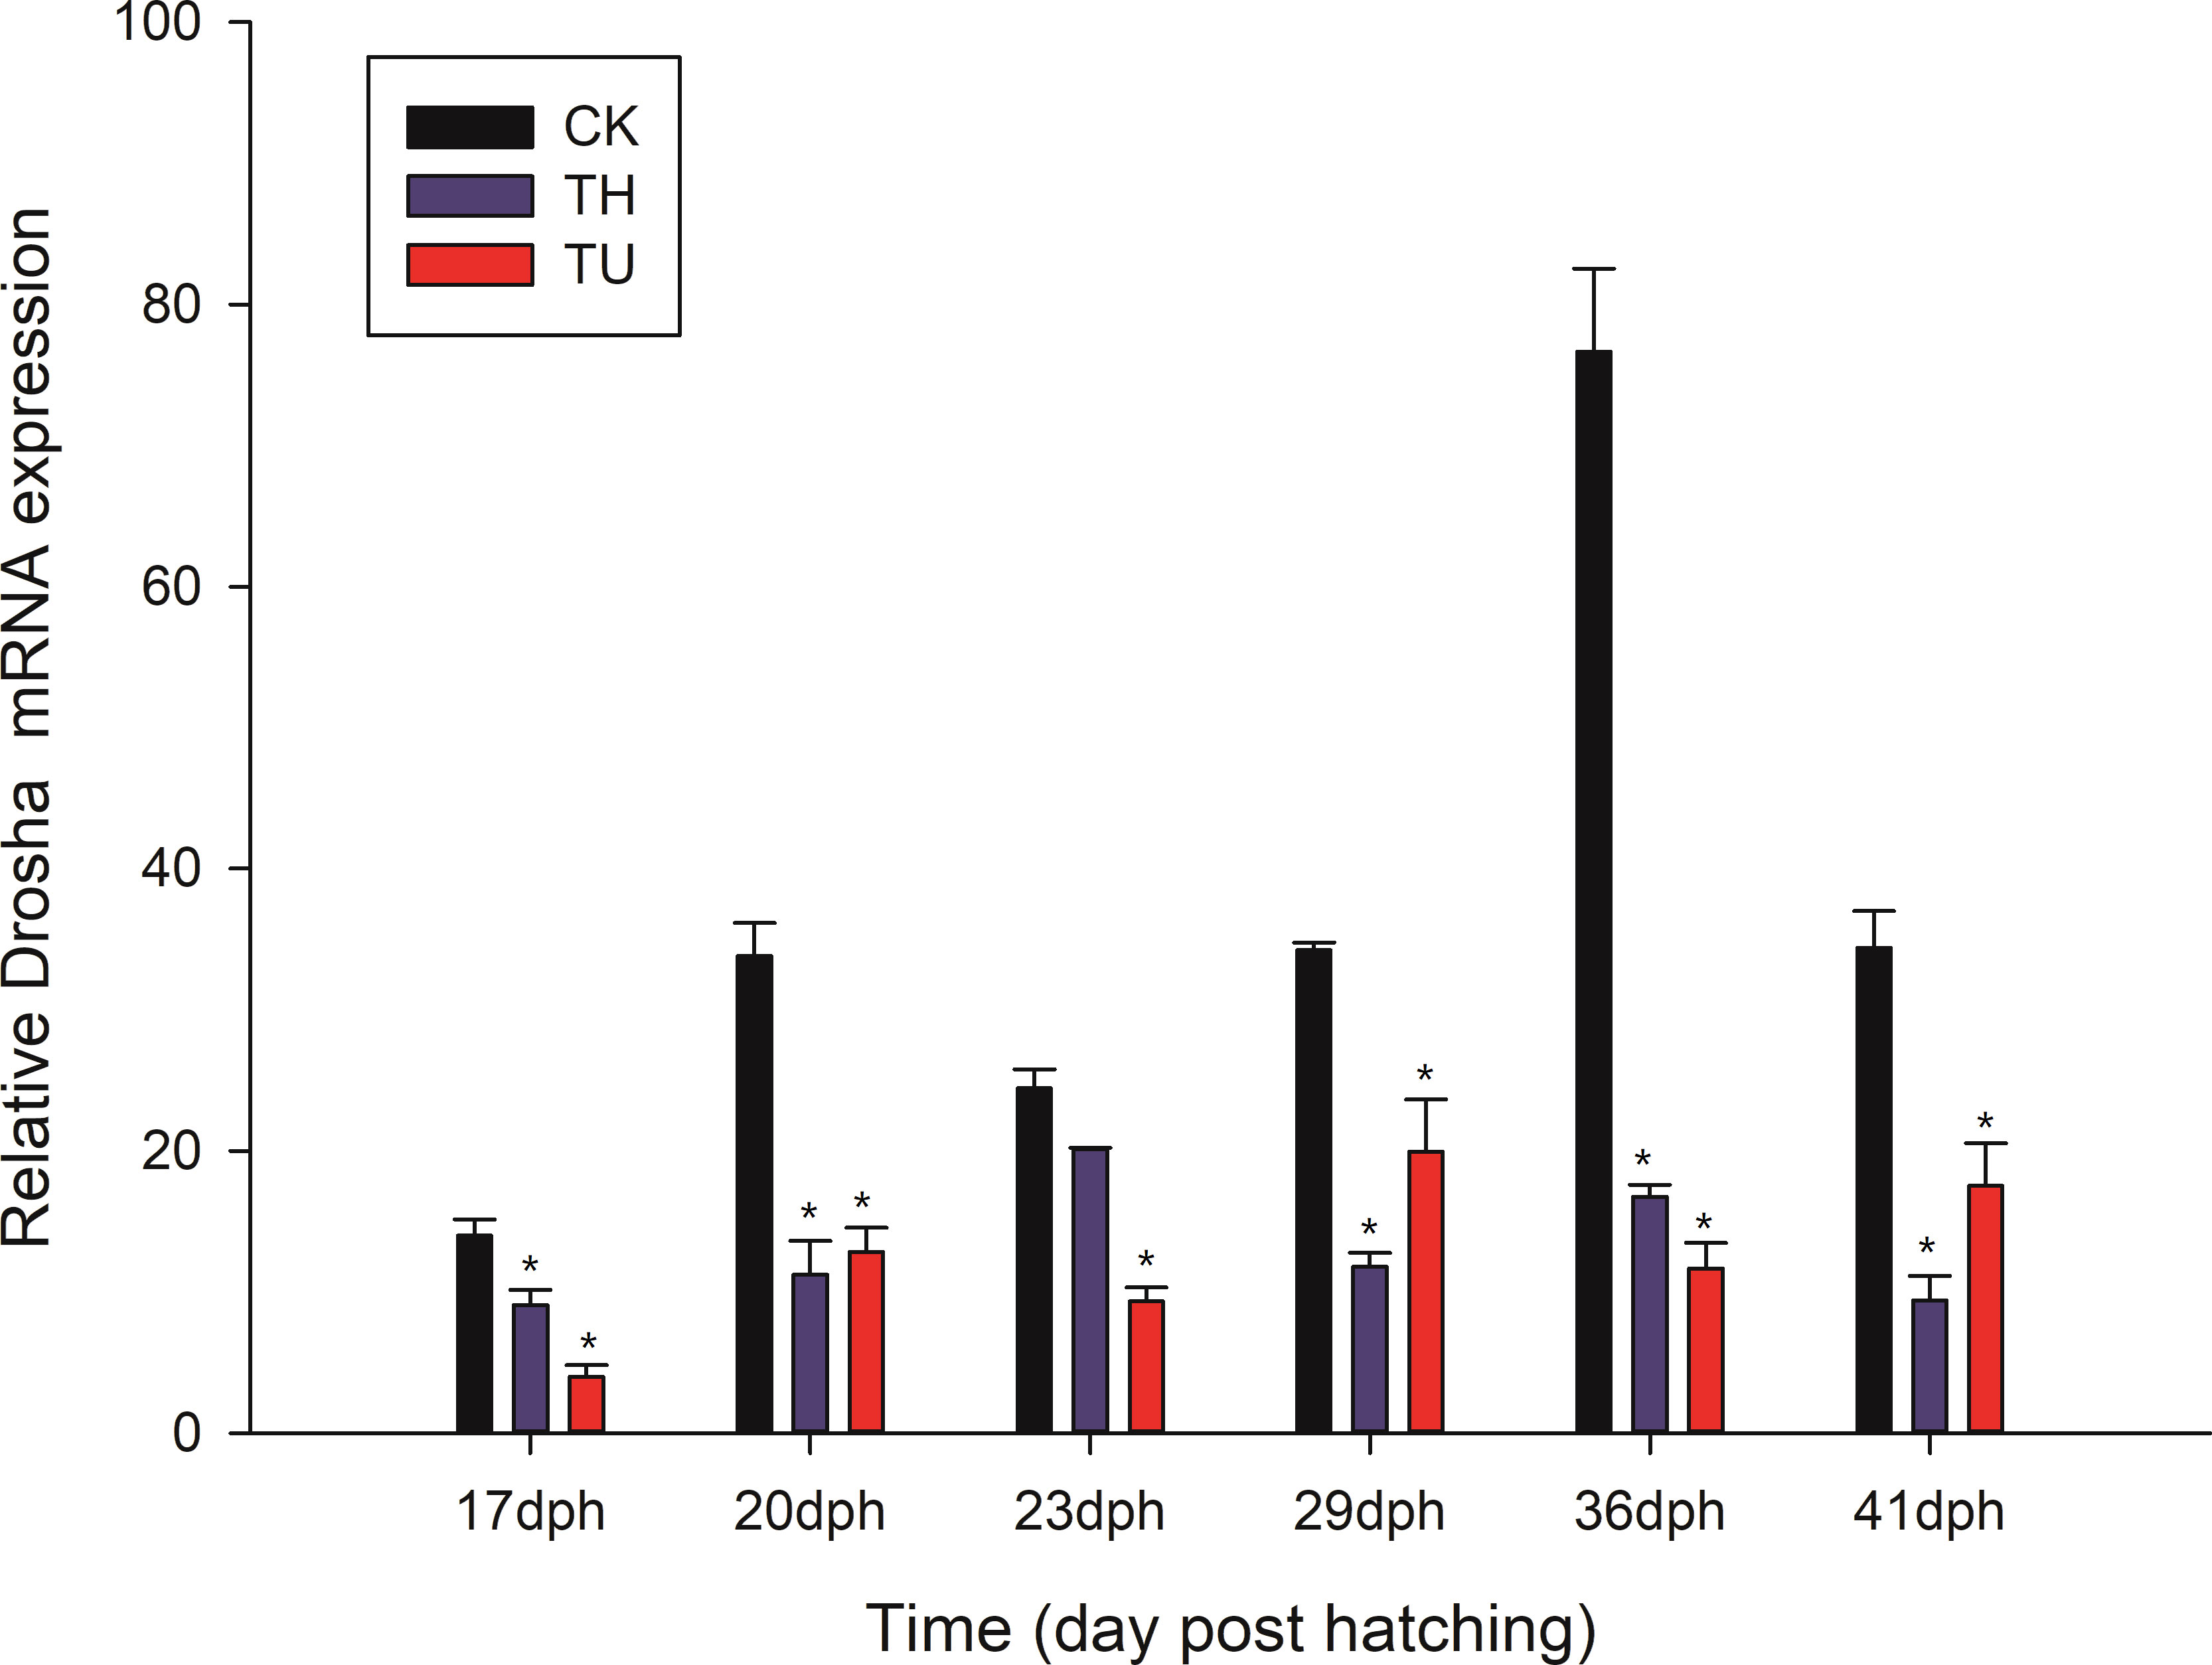
Figure 5 Relative Drosha mRNA expression levels in TH- and TU-treated larvae during Japanese flounder metamorphosis. Expression values were normalized to those of β-actin, and data are expressed as the means ± Standard Error (SE) (n = 3) from the calibrator group (36 d-TU). CK displayed the untreated group; TH and TU displayed the thyroid hormone and thiourea-treated group. *, indicates a significant difference (*, p < 0.05) compared to control.
3.5 Drosha-siRNA transfection
3.5.1 Drosha-siRNA transfection
To further confirm the role of Drosha in Japanese flounder metamorphosis, we used siRNA interference. The interference efficiency of siRNA was routinely assessed by fluorescence at 24 h after transfection of FEC cells with Drosha-siRNA-FAM-NC. A large amount of fluorescence appeared and the transfection efficiency was 51%. Figure 6A shows the observation results under white light 24 h after transfection, and Figure 6B shows the observation results under green fluorescence light under the same field of view 24 h after transfection.
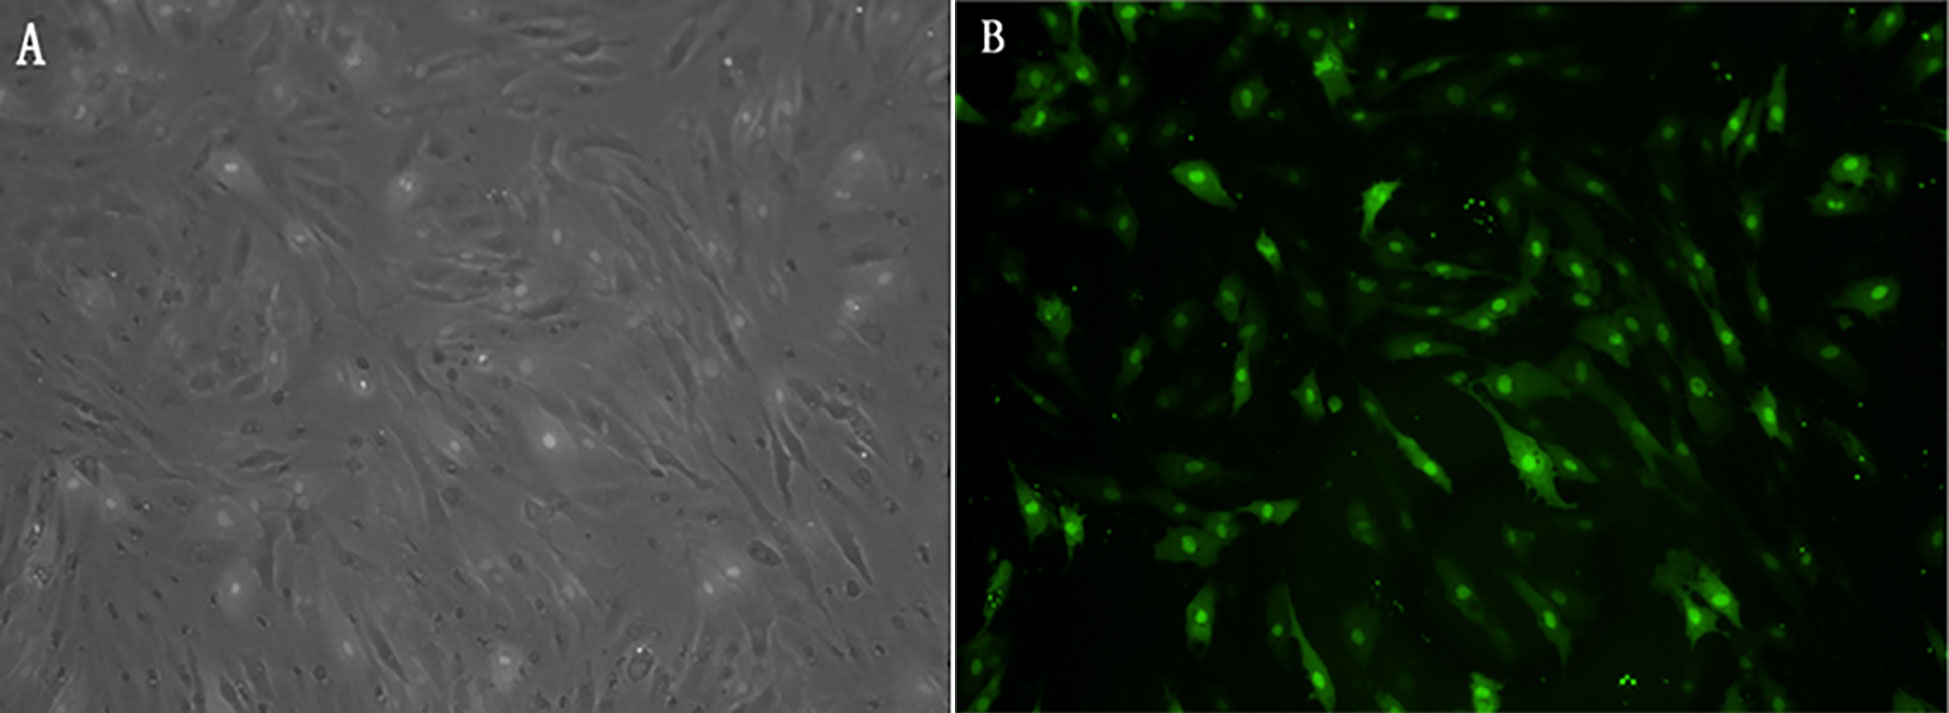
Figure 6 (A) Drosha-siRNA white-light; (B) Drosha-siRNA-FAM-NC green fluorescence Drosha-siRNA-FAM-NC: The siRNA sequence is not present in the fish.
3.5.2 Drosha expression after Drosha gene silencing
We designed three siRNAs to knockdown Drosha and found that siRNA-2 has the highest interference efficiency among three designed siRNAs in FEC cells. Then, 2 ug/ml Drosha-siRNA2 was transfected into FEC cells. The FEC cells were collected after 24 h, 48 h, and 72 h incubation, and the NC (siRNA sequence is not present in the fish) was used as the control. Finally, fluorometric quantification and Western blot assay were performed. The results showed that Drosha mRNA and protein expression were inhibited in the 24 h, 48 h, and 72 h transfected groups compared with the NC group, and the difference between transfection 48 h and 72 h groups was not statistically significant (P>0.05) (Figure 7).
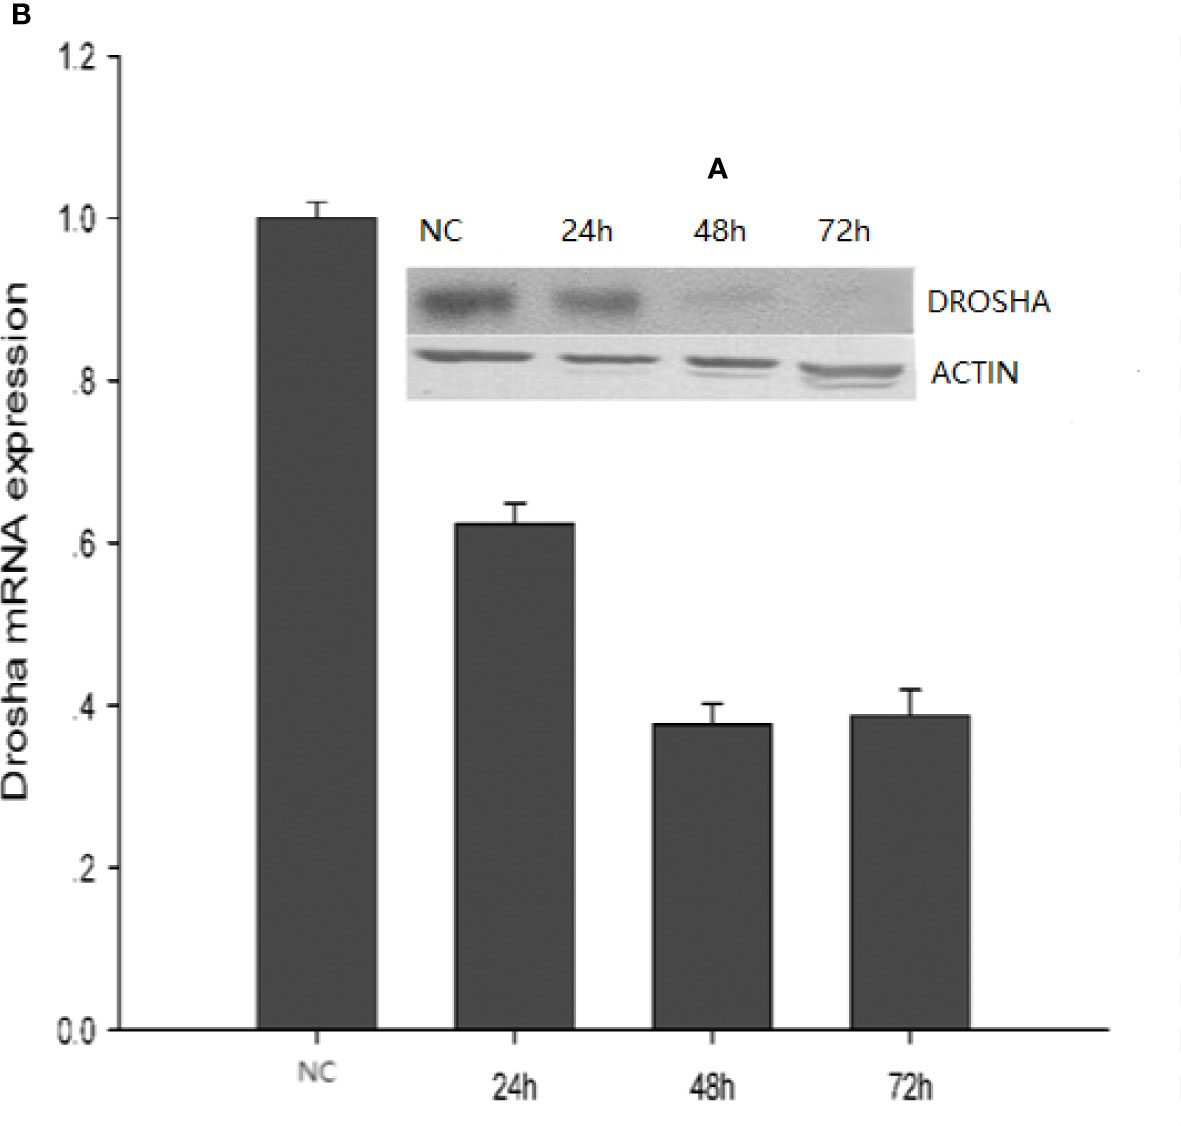
Figure 7 Expression of Drosha protein (A) and mRNA (B) at different transfection times. NC: Drosha-siRNA-FAM-NC. The siRNA sequence is not present in the fish.
3.5.3 Expression of pri-miRNA and miRNA after Drosha gene silencing
To determine if Drosha knockdown was reducing mature miRNAs or pri-miRNAs, we examined the levels of mature and pri-miRNAs. Drosha-siRNA2 was used to transfect FEC cells for 48 h. The FEC cells were collected and Real-time PCR assay of pri-miRNA and miRNA was performed, and the results showed that pri-miRNAs (pri-miR-1, 133, 17, 214, 181a, 181b) were not affected after transfection with Drosha-siRNA, while that mature miRNAs were significantly reduced, as shown in Figures 8A, B. This suggests that the reduction of these miRNAs occurs at the precursor stage and Drosha knockdown reduced the levels of some miRNAs in FEC cells.
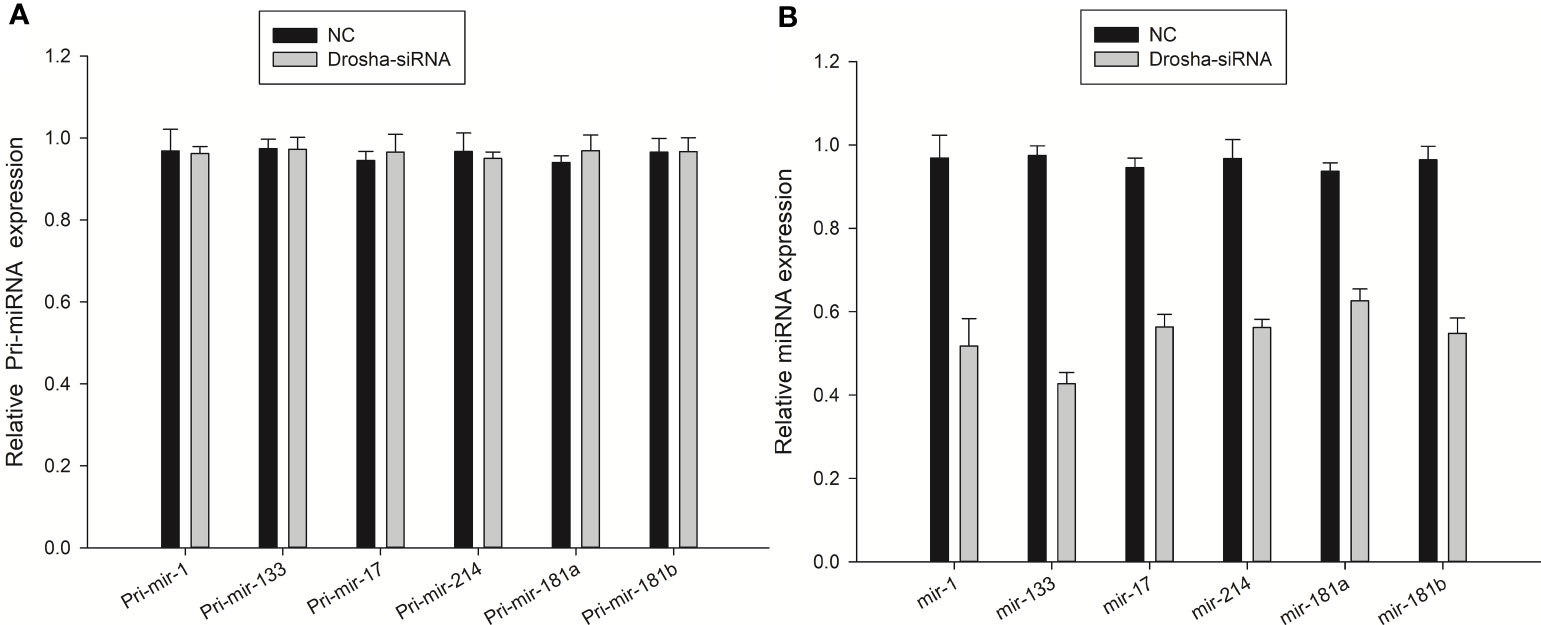
Figure 8 Expression of pri-miRNA (A) and mature miRNA (B) in transfected Drosha-siRNA. NC: Drosha-siRNA-FAM-NC, The siRNA sequence is not present in the fish.
3.5.4 Gene expression of Cdc42 after Drosha gene silencing
To assess the effect of Drosha knockdown on cell proliferation, we examined the expression level of Cdc42 in FEC cell. The Cdc42 gene was associated with apoptosis and proliferation, Cdc42 protein is a cell division cyclin, which belongs to the Rho family of proteins and acts as a “molecular switch” in cell signaling. Drosha silencing resulted in decreased Cdc42 mRNA expression, indicating decreased cell proliferation (Figure 9). This result implicates the role of Drosha in the development and growth of Japanese flounder.
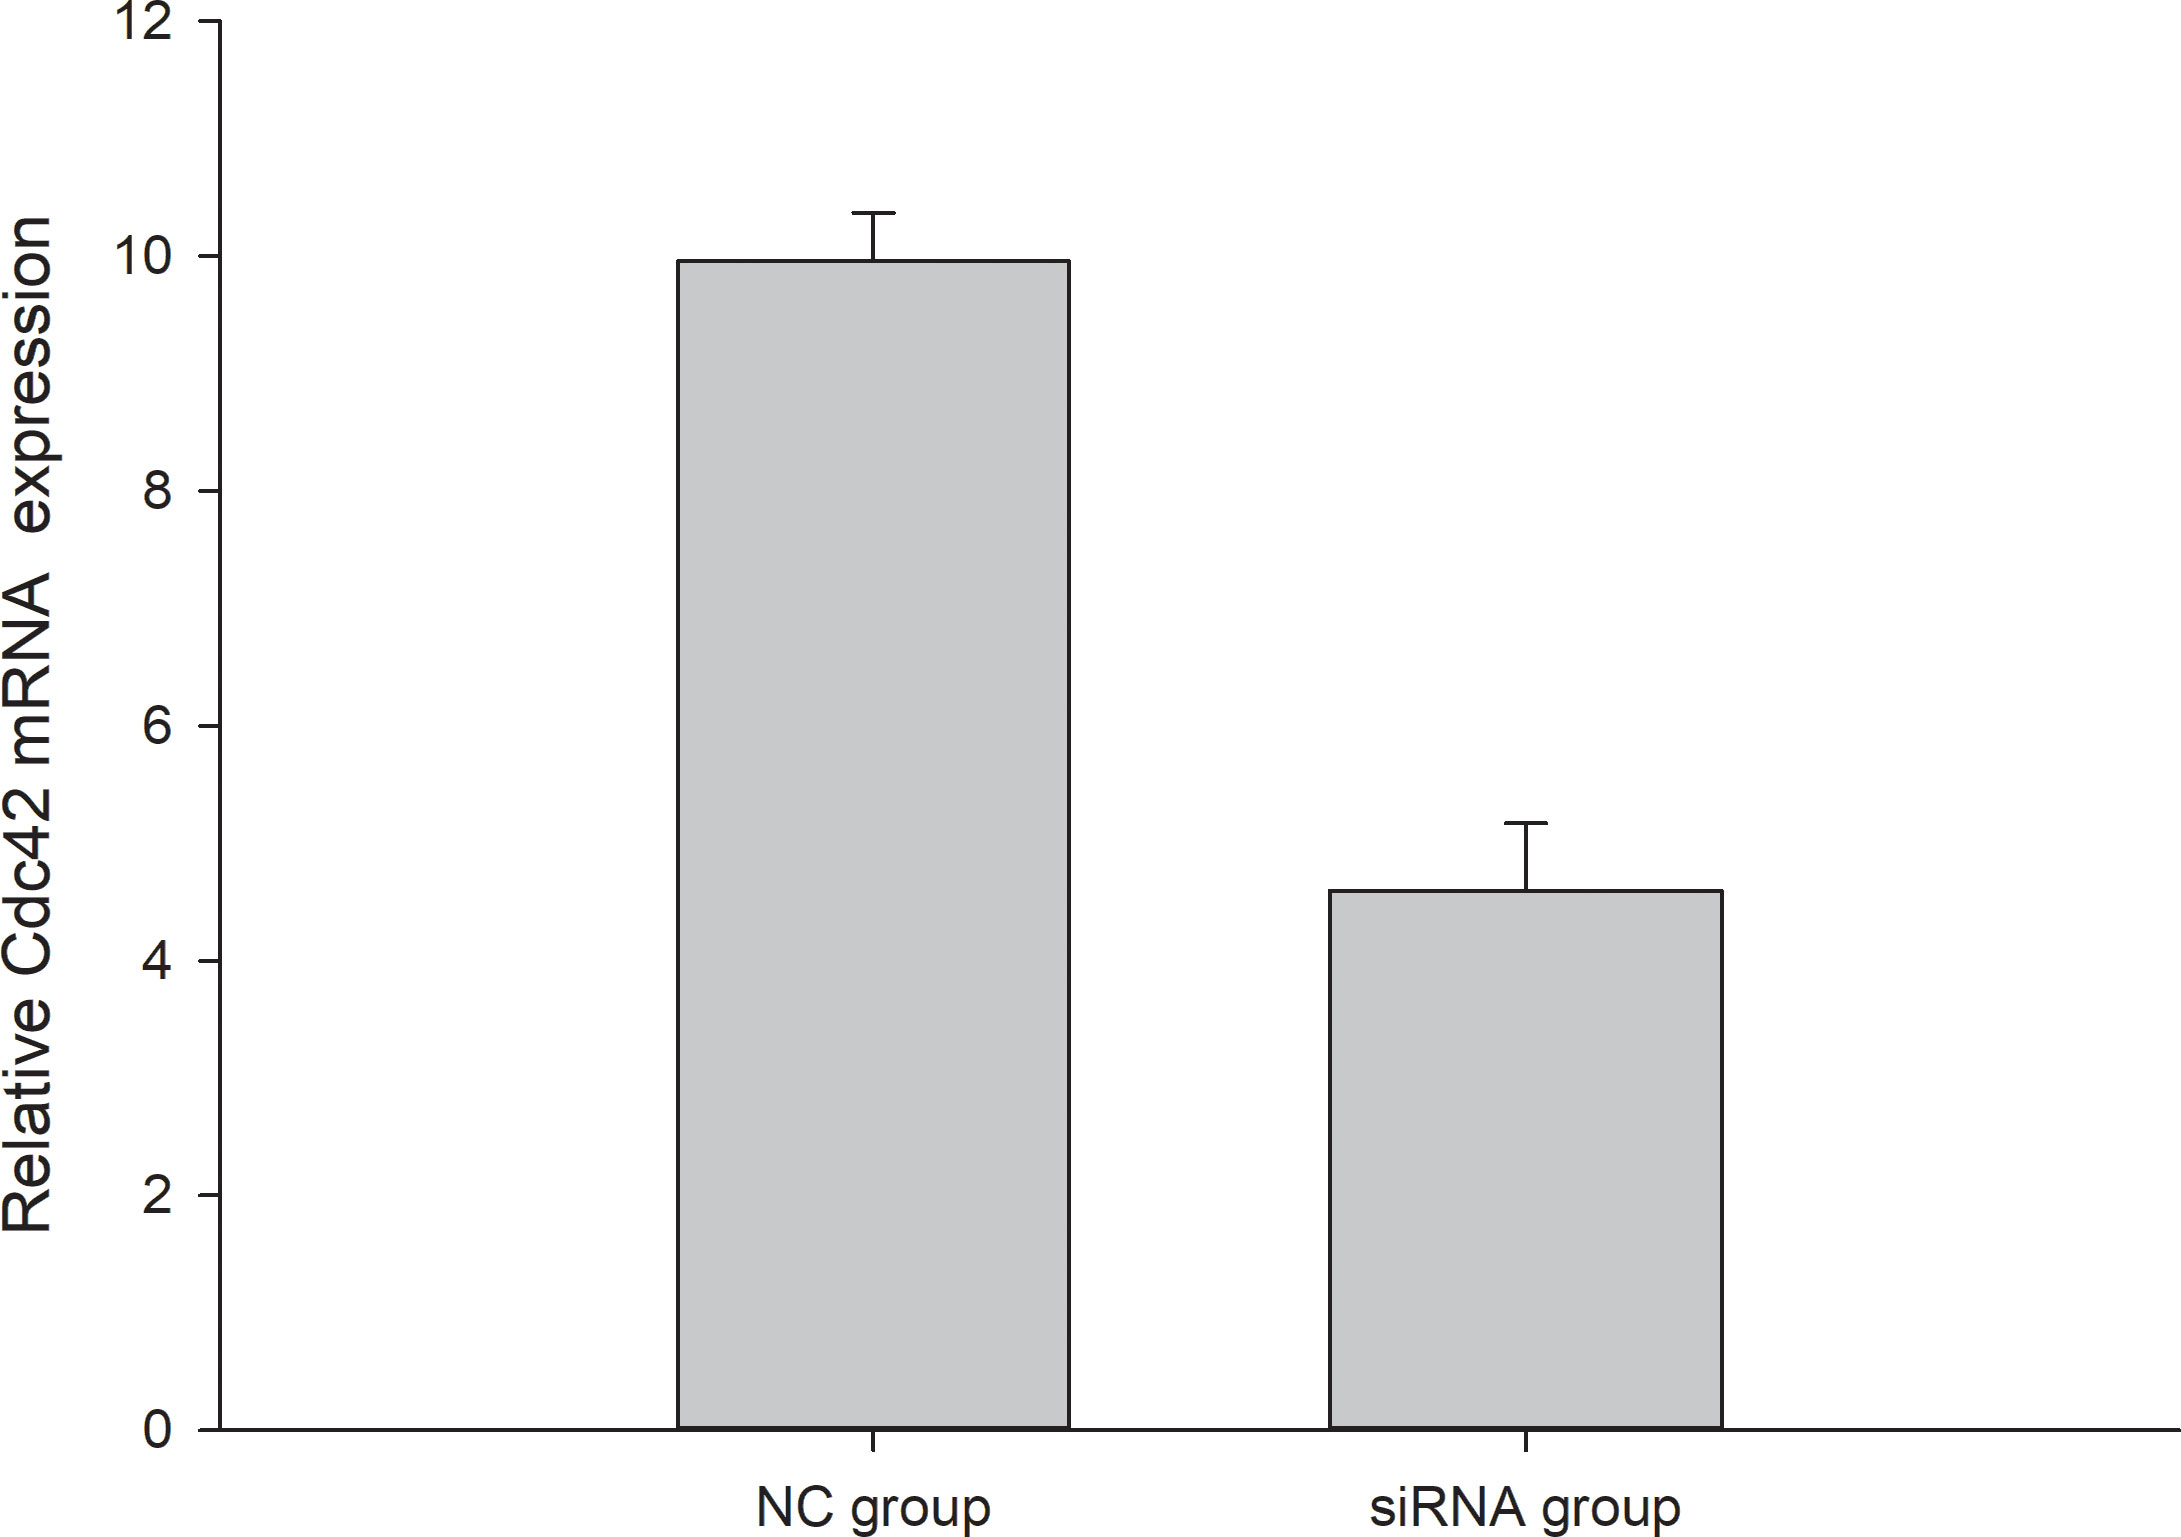
Figure 9 The expression of Cdc42 in NC and transfected Drosha-siRNA. NC: Drosha-siRNA-FAM-NC, The siRNA sequence is not present in the fish.
4 Discussion
Drosha is an important gene in the miRNA synthesis pathway. In this study, we obtained the full-length sequence of Drosha gene cDNA from Japanese flounder. Sequence analysis revealed that Drosha contains two adjacent RNA enzyme III structural domains (RIIIDa and RIIIDb) and one dsRBD, which belong to the RNA enzyme III family. The RIIIDa and RIIIDb structural domains can each bind a DGCR8 and perform their double-stranded RNA shearing function (Filippov et al., 2000; Wu et al., 2012).
In this study, the results of tissue differential expression analysis of the Drosha gene in Japanese flounder showed that it was expressed in all the tissues examined, but the expression differed significantly in different tissues, with significantly higher expression in both brain and muscle, followed by intestine. The results suggest that the Drosha gene may play a regulatory role in neural and muscle development. The results of differential expression analysis of Drosha gene in embryos and juveniles of Japanese flounder showed that it was expressed in all periods examined except the unfertilized egg (E1) period, but the expression varied greatly in different tissues and reached the highest point after the peak of metamorphosis (36 dph). However, it was found that the expression of Drosha was significantly decreased at 3 dph. It is speculated that a large amount of DROSHA protein is stored in the E2 phase, and the yolk is completely absorbed to provide nutrients at this time (Miwa, 1987), and there is no need to synthesize a large amount of mature miRNA. There is no relevant research so far, and the specific reasons need to be further explored. In a word, the results suggest that the Drosha gene may play a regulatory role in the development of metamorphosis in Japanese flounder.
Thyroid hormone induced the metamorphosis, while thiourea inhibits the metamorphosis of Japanese flounder (Inui and Miwa, 1985). The Drosha enzyme plays a regulatory role in the metamorphosis of flounder, so we designed TH and TU experiments, and further explore the mechanism of TH and TU regulating the metamorphosis of Japanese flounder. The results showed that the peak expression of Drosha gene in TH-treated group was advanced to day 23, compared with the peak expression of Drosha gene in control group on day 36. This result is consistent with TH promoting the metamorphosis of Japanese flounder. Thyroid hormone (TH) promotes the development of symmetrical larvae into asymmetric benthic larvae in pelagic fish. One eye wanders to the other on the other side of the head (Campinho et al., 2018). In all teleost studies to date, thyroid hormone (TH) promotes metamorphosis. TH is a necessary and a sufficient factor for this developmental change (Campinho, 2019).
As shown in the present study, there is a positive relationship between time to metamorphosis and Drosha expression. To further explore the role of Drosha, we performed siRNA knockdown experiments. Drosha is a miRNA processor (Kim et al., 2015). Figures 8A, B and Figure 9 showed the maturation of miRNAs and miRNA-targeted of Cdc42 were repressed when Drosha was knockdown. Cdc42 (cell division cycle 42) is the target gene of miR17 (Zhang et al., 2016), and regulates cell cycle. This is consistent with previous findings that knockdown of the Drosha gene in vascular smooth muscle cells decreases the proliferation of vascular smooth muscle cells (Fan et al., 2013). In Japanese flounder, miRNAs have been reported to regulate metamorphosis development (Li et al., 2020).
5 Conclusions
The mechanisms underlying metamorphosis development in Japanese flounder remain unclear. We cloned and characterized the Drosha gene in Japanese flounder for the first time and explored the role of Drosha in early development and metamorphosis in Japanese flounder. Our research shows that Drosha is highly expressed during the metamorphosis stage.
In this research, T3 has been shown to have a positive regulatory effect on Drosha expression in Japanese flounder during metamorphosis, which this mechanism is consistent with the T3-induced metamorphosis. The results suggest that T3-induced metamorphosis of Japanese flounder is accelerated upon regulation of miRNAs by Drosha. We concluded that one of the developmental mechanisms of flounder metamorphosis may be regulated by the T3-Drosha-miRNA signaling pathway. However, further studies are needed to confirm the findings.
Data availability statement
The original contributions presented in the study are included in the article/Supplementary Material. Further inquiries can be directed to the corresponding authors.
Ethics statement
The animal study was reviewed and approved by The Shanghai Ocean University Review Committee.
Author contributions
ZH:Conceptualization, Methodology, Software, Investigation, Formal Analysis, Writing - Original Draft. XZ: Data Curation, Writing - Original Draft. XJ: Resources, Supervision. WZ: Software, Validation. SZ: Conceptualization, Funding Acquisition, Resources, Supervision. All authors contributed to the article and approved the submitted version.
Conflict of interest
The authors declare that the research was conducted in the absence of any commercial or financial relationships that could be construed as a potential conflict of interest.
Publisher’s note
All claims expressed in this article are solely those of the authors and do not necessarily represent those of their affiliated organizations, or those of the publisher, the editors and the reviewers. Any product that may be evaluated in this article, or claim that may be made by its manufacturer, is not guaranteed or endorsed by the publisher.
Supplementary material
The Supplementary Material for this article can be found online at: https://www.frontiersin.org/articles/10.3389/fmars.2022.957836/full#supplementary-material
References
Bao B., Ke Z., Xing J., Peatman E., Liu Z., Xie C., et al (2011). Proliferating cells in suborbital tissue drive eye migration in flatfish. Dev. Biol. 351 (1), 200–207. doi: 10.1016/j.ydbio.2010.12.032
Campinho M. A. (2019). Teleost metamorphosis: The role of thyroid hormone. Front. Endocrinol. 10. doi: 10.3389/fendo.2019.00383
Campinho M. A., Galay-Burgos M., Sweeney G. E., Power D. M. (2010). Coordination of deiodinase and thyroid hormone receptor expression during the larval to juvenile transition in sea bream (Sparus aurata, Linnaeus). Gen. Comp. Endocrinol. 165 (2), 181–194. doi: 10.1016/j.ygcen.2009.06.020
Campinho M. A., Silva N., Martins G. G., Anjos L., Florindo C., Roman-Padilla J., et al (2018). A thyroid hormone regulated asymmetric responsive centre is correlated with eye migration during flatfish metamorphosis. Sci. Rep. 8 (1), 12267. doi: 10.1038/s41598-018-29957-8
Chen S. L., Ren G. C., Sha Z. X., Shi C. Y. (2004). Establishment of a continuous embryonic cell line from Japanese flounder paralichthys olivaceus for virus isolation. Dis. Aquat. Organ. 60 (3), 241–246. doi: 10.3354/dao060241
Chen Q., Sato K., Yokoi H., Suzuki T. (2020). Developmental regulatory system of ocular-side-specific asymmetric pigmentation in flounder: Critical role of retinoic acid signaling. J. Exp. Zool. Part B Mol. Dev. Evol. 334 (3), 156–167. doi: 10.1002/jez.b.22934
Denli A. M., Tops B. B., Plasterk R. H., Ketting R. F., Hannon G. J. (2004). Processing of primary microRNAs by the microprocessor complex. Nature 432 (7014), 231–235. doi: 10.1038/nature03049
Fan P., Chen Z., Tian P., Liu W., Jiao Y., Xue Y., et al (2013). miRNA biogenesis enzyme drosha is required for vascular smooth muscle cell survival. PloS One 8 (4), e60888. doi: 10.1371/journal.pone.0060888
Filippov V., Solovyev V., Filippova M., Gill S. S. (2000). A novel type of RNase III family proteins in eukaryotes. Gene 245 (1), 213–221. doi: 10.1016/S0378-1119(99)00571-5
Fu Y., Shi Z., Wu M., Zhang J., Jia L., Chen X. (2011). Identifification and differential expression of microRNAs during metamorphosis of the Japanese flJapanese flounder (Paralichthys olivaceus). PloS One 6, e22957. doi: 10.1371/journal.pone.0022957
Gawantka V., Pollet N., Delius H., Vingron M., Pfister R., Nitsch R., et al (1998). Gene expression screening in xenopus identifies molecular pathways, predicts gene function and provides a global view of embryonic patterning. Mech. Dev. 77 (2), 95–141. doi: 10.1016/S0925-4773(98)00115-4
Ha M., Kim V. N. (2014). Regulation of microRNA biogenesis. Nat. Rev. Mol. Cell Biol. 15 (8), 509–524. doi: 10.1038/nrm3838
Han J., Lee Y., Yeom K. H., Nam J. W., Heo I., Rhee J. K., et al (2006). Molecular basis for the recognition of primary microRNAs by the drosha-DGCR8 complex. Cell 125 (5), 887–901. doi: 10.1016/j.cell.2006.03.043
Hatfield S. D., Shcherbata H. R., Fischer K. A., Nakahara K., Carthew R. W., Ruohola-Baker H. (2005). Stem cell division is regulated by the microRNA pathway. Nature 435 (7044), 974–978. doi: 10.1038/nature03816
Hoke K. L., Evans B. I., Fernald R. D. (2006). Remodeling of the cone photoreceptor mosaic during metamorphosis of flounder (Pseudopleuronectes americanus). Brain Behav. Evol. 68 (4), 241–254. doi: 10.1159/000094705
Inui Y., Miwa S. (1985). Thyroid hormone induces metamorphosis of flounder larvae. Gen. Comp. Endocrinol. 60 (3), 450–454. doi: 10.1016/0016-6480(85)90080-2
Jeong G., Lim Y. H., Kim Y. K. (2016). Precise mapping of the transcription start sites of human microRNAs using drosha knockout cells. BMC Genomics 17 (1), 908. doi: 10.1186/s12864-016-3252-7
Kim Y., Kang Y. S., Lee N. Y., Kim K. Y., Hwang Y. J., Kim H. W., et al (2015). Uvrag targeting by Mir125a and Mir351 modulates autophagy associated with Ewsr1 deficiency. Autophagy 11 (5), 796–811. doi: 10.1080/15548627.2015.1035503
Kwon S. C., Nguyen T. A., Choi Y. G., Jo M. H., Hohng S., Kim V. N., et al (2016). Structure of human drosha. Cell 164, 81–90. doi: 10.1016/j.cell.2015.12.019
Lee Y., Han J., Yeom K. H., Jin H., Kim V. N. (2006). Drosha in primary microRNA processing. Cold Spring Harbor Symp. Quantitative Biol. 71, 51–57. doi: 10.1101/sqb.2006.71.041
Li X., Hu H., Li R., Wang Z., Qi J., Wang Z. (2020). The role of miR-92 in regulating early development and metamorphosis of Japanese flounder paralichthys olivaceus. Genes Genet. Syst. 95 (1), 1–10. doi: 10.1266/ggs.18-00047
Luhur A., Chawla G., Wu Y. C., Li J., Sokol N. S. (2014). Drosha-independent DGCR8/Pasha pathway regulates neuronal morphogenesis. Proc. Natl. Acad. Sci. United States America 111 (4), 1421–1426. doi: 10.1073/pnas.1318445111
Manchado M., Infante C., Asensio E., Planas J. V., Cañavate J. P. (2008). Thyroid hormones down-regulate thyrotropin beta subunit and thyroglobulin during metamorphosis in the flatfish Senegalese sole (Solea senegalensis kaup). Gen. Comp. Endocrinol. 155 (2), 447–455. doi: 10.1016/j.ygcen.2007.07.011
Miwa S. (1987). Histological changes in the pituitary-thyroid axis during spontaneous and artificially-induced metamorphosis of larvae of the flounder paralichthys olivaceus. Cell Tissue Res. 249 (1), 117–123. doi: 10.1007/BF00215425
Miwa S., Inui Y. (1987). Effects of various doses of thyroxine and triiodothyronine on the metamorphosis of flounder (Paralichthys olivaceus). Gen. Comp. Endocrinol. 67 (3), 356–363. doi: 10.1016/0016-6480(87)90190-0
Mullur R., Liu Y. Y., Brent G. A. (2014). Thyroid hormone regulation of metabolism. Physiol. Rev. 94 (2), 355–382. doi: 10.1152/physrev.00030.2013
O’Brien J., Hayder H., Zayed Y., Peng C. (2018). Overview of microrna biogenesis, mechanisms of actions,and circulation. Front. Endocrinol. 9. doi: 10.3389/fendo.2018.00402
Okada C., Yamashita E., Lee S. J., Shibata S., Katahira J., Nakagawa A., et al (2009). A high-resolution structure of the pre-microRNA nuclear export machinery. Sci. (New York N.Y.) 326 (5957), 1275–1279. doi: 10.1126/science.1178705
Policansky D., Sieswerda P. (1979). Early life history of the starry flounder, platichthys stellatus, reared through metamorphosis in the laboratory. Trans. Am. Fish. Soc. 108, 326–327. doi: 10.1577/1548-8659(1979)108<326:ELHOTS>2.0.CO;2
Power D. M., Einarsdóttir I. E., Pittman K., Sweeney G. E., Hildahl J., Campinho M. A., et al (2008). The molecular and endocrine basis of flatfish metamorphosis. Rev. Fish. Sci. 16:sup1, 95–111. doi: 10.1080/10641260802325377
Subramanian B., Gao S., Lercher M. J., Hu S., Chen W. H. (2019). Evolview v3: a webserver for visualization, annotation, and management of phylogenetic trees. Nucleic Acids Res. 47 (W1), W270–W275. doi: 10.1093/nar/gkz357
Togawa M., Endo Y., Suzuki N., Yokoi H., Suzuki T. (2018). Identification of Sox10-positive cells at the dorsal fin base of juvenile flounder that are correlated with blind-side skin ectopic pigmentation. J. Exp. Zool. Part B Mol. Dev. Evol. 330 (8), 427–437. doi: 10.1002/jez.b.22842
Wu Q., Song R., Ortogero N., Zheng H., Evanoff R., Small C. L., et al (2012). The RNase III enzyme drosha is essential for microRNA production and spermatogenesis. J. Biol. Chem. 287 (30), 25173–25190. doi: 10.1074/jbc.M112.362053
Zhang H., Fu Y., Shi Z., Su Y., Zhang J. (2016). miR-17 is involved in Japanese flounder (Paralichthys olivaceus) development by targeting the Cdc42 mRNA. Comp. Biochem. Physiol. Part B Biochem. Mol. Biol. 191, 163–170. doi: 10.1016/j.cbpb.2015.10.005
Keywords: Drosha, metamorphosis, thyroid hormone (TH), siRNA, Japanese flounder (Paralichthys olivaceus)
Citation: Zhang H, Xu Z, Xu J, Wei Z and Shi Z (2022) The differential expression and effects of Drosha on metamorphosis of Japanese flounder (paralichthys olivaceus). Front. Mar. Sci. 9:957836. doi: 10.3389/fmars.2022.957836
Received: 31 May 2022; Accepted: 18 July 2022;
Published: 22 August 2022.
Edited by:
Rebecca Metzler, Colgate University, United StatesReviewed by:
Yongshuang Xiao, Institute of Oceanology, Chinese Academy of Sciences (CAS), ChinaXiuzhen Sheng, Ocean University of China, China
Copyright © 2022 Zhang, Xu, Xu, Wei and Shi. This is an open-access article distributed under the terms of the Creative Commons Attribution License (CC BY). The use, distribution or reproduction in other forums is permitted, provided the original author(s) and the copyright owner(s) are credited and that the original publication in this journal is cited, in accordance with accepted academic practice. No use, distribution or reproduction is permitted which does not comply with these terms.
*Correspondence: Hongmei Zhang, emhhbmdob25nbWVpQGR6dS5lZHUuY24=; Zhiyi Shi, enlzaGlAc2hvdS5lZHUuY24=