 Kelly S. Boyle
 Crystal L. Hightower
 T. Reid Nelson
 Sean P. Powers
95% of researchers rate our articles as excellent or good
Learn more about the work of our research integrity team to safeguard the quality of each article we publish.
Find out more
ORIGINAL RESEARCH article
Front. Mar. Sci. , 30 September 2022
Sec. Marine Ecosystem Ecology
Volume 9 - 2022 | https://doi.org/10.3389/fmars.2022.954974
This article is part of the Research Topic Seafloor Heterogeneity: Artificial Structures and Marine Ecosystem Dynamics - Recent Advances View all 16 articles
Passive acoustic monitoring (PAM) in a variety of marine habitats has revealed distinct spatial and temporal variation of fish sounds that are predicted to vary in association with species composition and abundance, as well as diel and seasonal influences. Reefs in the Alabama Artificial Reef Zone (AARZ) in the northern Gulf of Mexico (nGOM) have an associated fish fauna composed of warm-temperate and tropical reef associated species. AARZ reefs are made of different structures (e.g. bridge rubble, concrete pyramids, etc.) and as a result, their fish species composition is predicted to vary. We used PAM to describe fish sounds on 18 shallow slope (20-33 m) AARZ reefs in 2017 and 2018. We detected calls from unknown sources, as well as sounds from leopard toadfish Opsanus pardus, cocoa damselfish Stegastes variabilis, and cusk-eels (Ophidiidae). We developed semi-automated screening methods to detect specific sound types and described diel and spatial patterns. Sound detection rates varied widely among reefs, but not by reef type. Number of sound types increased with species richness, but detection rates of specific sounds differed on reefs with similar species composition. Our results indicate that many frequently occurring sounds may not be associated with visually conspicuous fishes. Further research is needed to determine source species and associated behavior for common sounds in these habitats. Soundscape variability among nGOM artificial reefs may be a consideration for management, as biological sound can provide an acoustic cue for reef location by some larval and adult fish species.
Many teleost fish produce sounds for communication (Amorim, 2006; Fine and Parmentier, 2015). Such sounds are often associated with specific behaviors like courtship, spawning, parental care, and territoriality (Myrberg, 1981; Ladich, 2004). In addition, fish sounds that are emitted frequently for some species are hypothesized to be contact calls (i.e., a group cohesion cue that facilitates the maintenance of schools and shoals) (Radford et al., 2015), and detection of such sounds may provide an indication of the presence of such fish in a specific area. Fish sounds contribute to the overall soundscape in many habitats and because sounds are distinctive among species, they may be associated with specific behaviors and activities (Tricas and Boyle, 2014; Mueller et al., 2020; Tricas and Boyle, 2021). As a result, soundscape recordings have the potential to reveal patterns associated with fish species presence and abundance, and to indicate the potential behavior (e.g., spawning, nesting) of some species (Luczkovich et al., 1999; Fine and Thorson, 2008).
Fish and Mowbray (1970) described and documented sounds from many western Atlantic fish species. This effort greatly increased the awareness of the importance of sound to many marine fishes. The amount of data available from this effort for some fish species is not extensive and sometimes limited to sounds elicited from manual or electrical stimulation, yet these first observations indicate the potential for the role of sound in communication for a variety of species. Sound production for some fish species is known only from certain behavioral contexts (Boyle and Tricas, 2011; Tricas and Boyle, 2014). Thus, there may be many additional vocal fish species for which sound production has yet to be observed. Passive acoustic monitoring [PAM] has the potential to reveal new sound types and to show when and where different sounds occur in the field.
PAM has been used in a variety of north American marine temperate habitats to test for temporal and spatial variation of biological sound (Wall et al., 2012; Wall et al., 2013; Van Hoeck et al., 2020; Butler et al., 2021). Recently, PAM was used to document soundscapes in the eastern Gulf of Mexico (Wall et al., 2012; Wall et al., 2013). Soundscapes of temperate natural and artificial reef communities were also recently described on two natural and two artificial reefs in North Carolina (Van Hoeck et al., 2020). These studies revealed a variety of distinctive sound types that varied temporally and spatially and were attributed to fishes but in some cases from unknown source species.
The Alabama Artificial Reef Zone is a large (>2600 km2) area of permitted and pre-permitted artificial reefs off coastal Alabama (Powers et al., 2018). Many artificial reefs in this system form relatively small reef structures: concrete and steel pyramids, re-purposed poultry transport cages (‘chicken coops’), bridge rubble, and sunken M1 U.S. Army tanks (Minton and Heath, 1998; Jaxion-Harm and Szedlmayer, 2015). These relatively small hard-structure habitats are separated by larger expanses of soft-bottom habitat and each may have a limited resident fish fauna. Thus, these artificial reefs present an opportunity to examine soundscape characteristics associated with different reefs and their fish assemblages.
Overall, the purpose of our current study was to lay the foundation for future utility of passive acoustic monitoring of artificial reefs in the northern Gulf of Mexico to document changes in fish abundance, species composition, and behavior. Therefore, the goals of our study were to (1) describe the major types of observed biological sounds on shallow slope 20-33 m artificial reefs off coastal Alabama, (2) test for temporal patterns of sound occurrence over diel cycles, (3) test for associations of sound types with observed species, (4) test for an association between observed fish species diversity and diversity of sounds, and (5) to determine if soundscapes differed among artificial reefs and reef types. To achieve these goals, we developed and tested semi-automated sound detection methods to locate sounds in large acoustic datasets.
PAM devices used in this study were three ‘SNAP recorders’ (Loggerhead Instruments, www.loggerhead.com, Sarasota, FL). Recordings were sampled at 44.1 kHz and stored as.wav format files. In 2017 (31 May – 16 August), the SNAP recorders were programmed for continuous recording stored as separated five-minute duration.wav files, which allowed for up to eight-day continuous recordings: a total of 2252.75 hours from 51 days. In 2018 (25 June – 6 August), the SNAP recorders were programmed for a duty cycle of 60 s recordings every five minutes. This duty cycle allowed for up to 40 days of recording. Scuba divers deployed recorders, which were placed on reefs by means of a ratchet strap and cable ties tied to the reef or immediately adjacent to the reef on a sand screw (<3 m away). The hydrophone end of the recorder was oriented opposite of the sea floor. Sites in 2017 included two bridge reefs (Br1, recorded 30 May – 07 June and Br2 from 10-17 July), two chicken coops (Cp2 from 10-18 July and Cp3 from 18-26 June), seven pyramid modules (Py3 from 08-13 August, Py4 from 01-05 August, Py5 from 01-08 August, Py6 from 10-16 July, Py7 from 18-26 June, Py8 from 18-23 June, and Py9 from 30 May to 07 June), and three M1 army tank reefs (Tk1 from 30 May to 07 June, Tk2 from 18-22 July, and Tk3 from 8 -16 August) (Figure 1). In 2018, we recorded from one chicken coop (Cp1 from 16-22 July), two pyramid modules (Py1 from 25 – 30 June and Py2 from 25 June to 06 August), and one M1 army tank (Tk4 from 25 June to 06 August) (Figure 1).
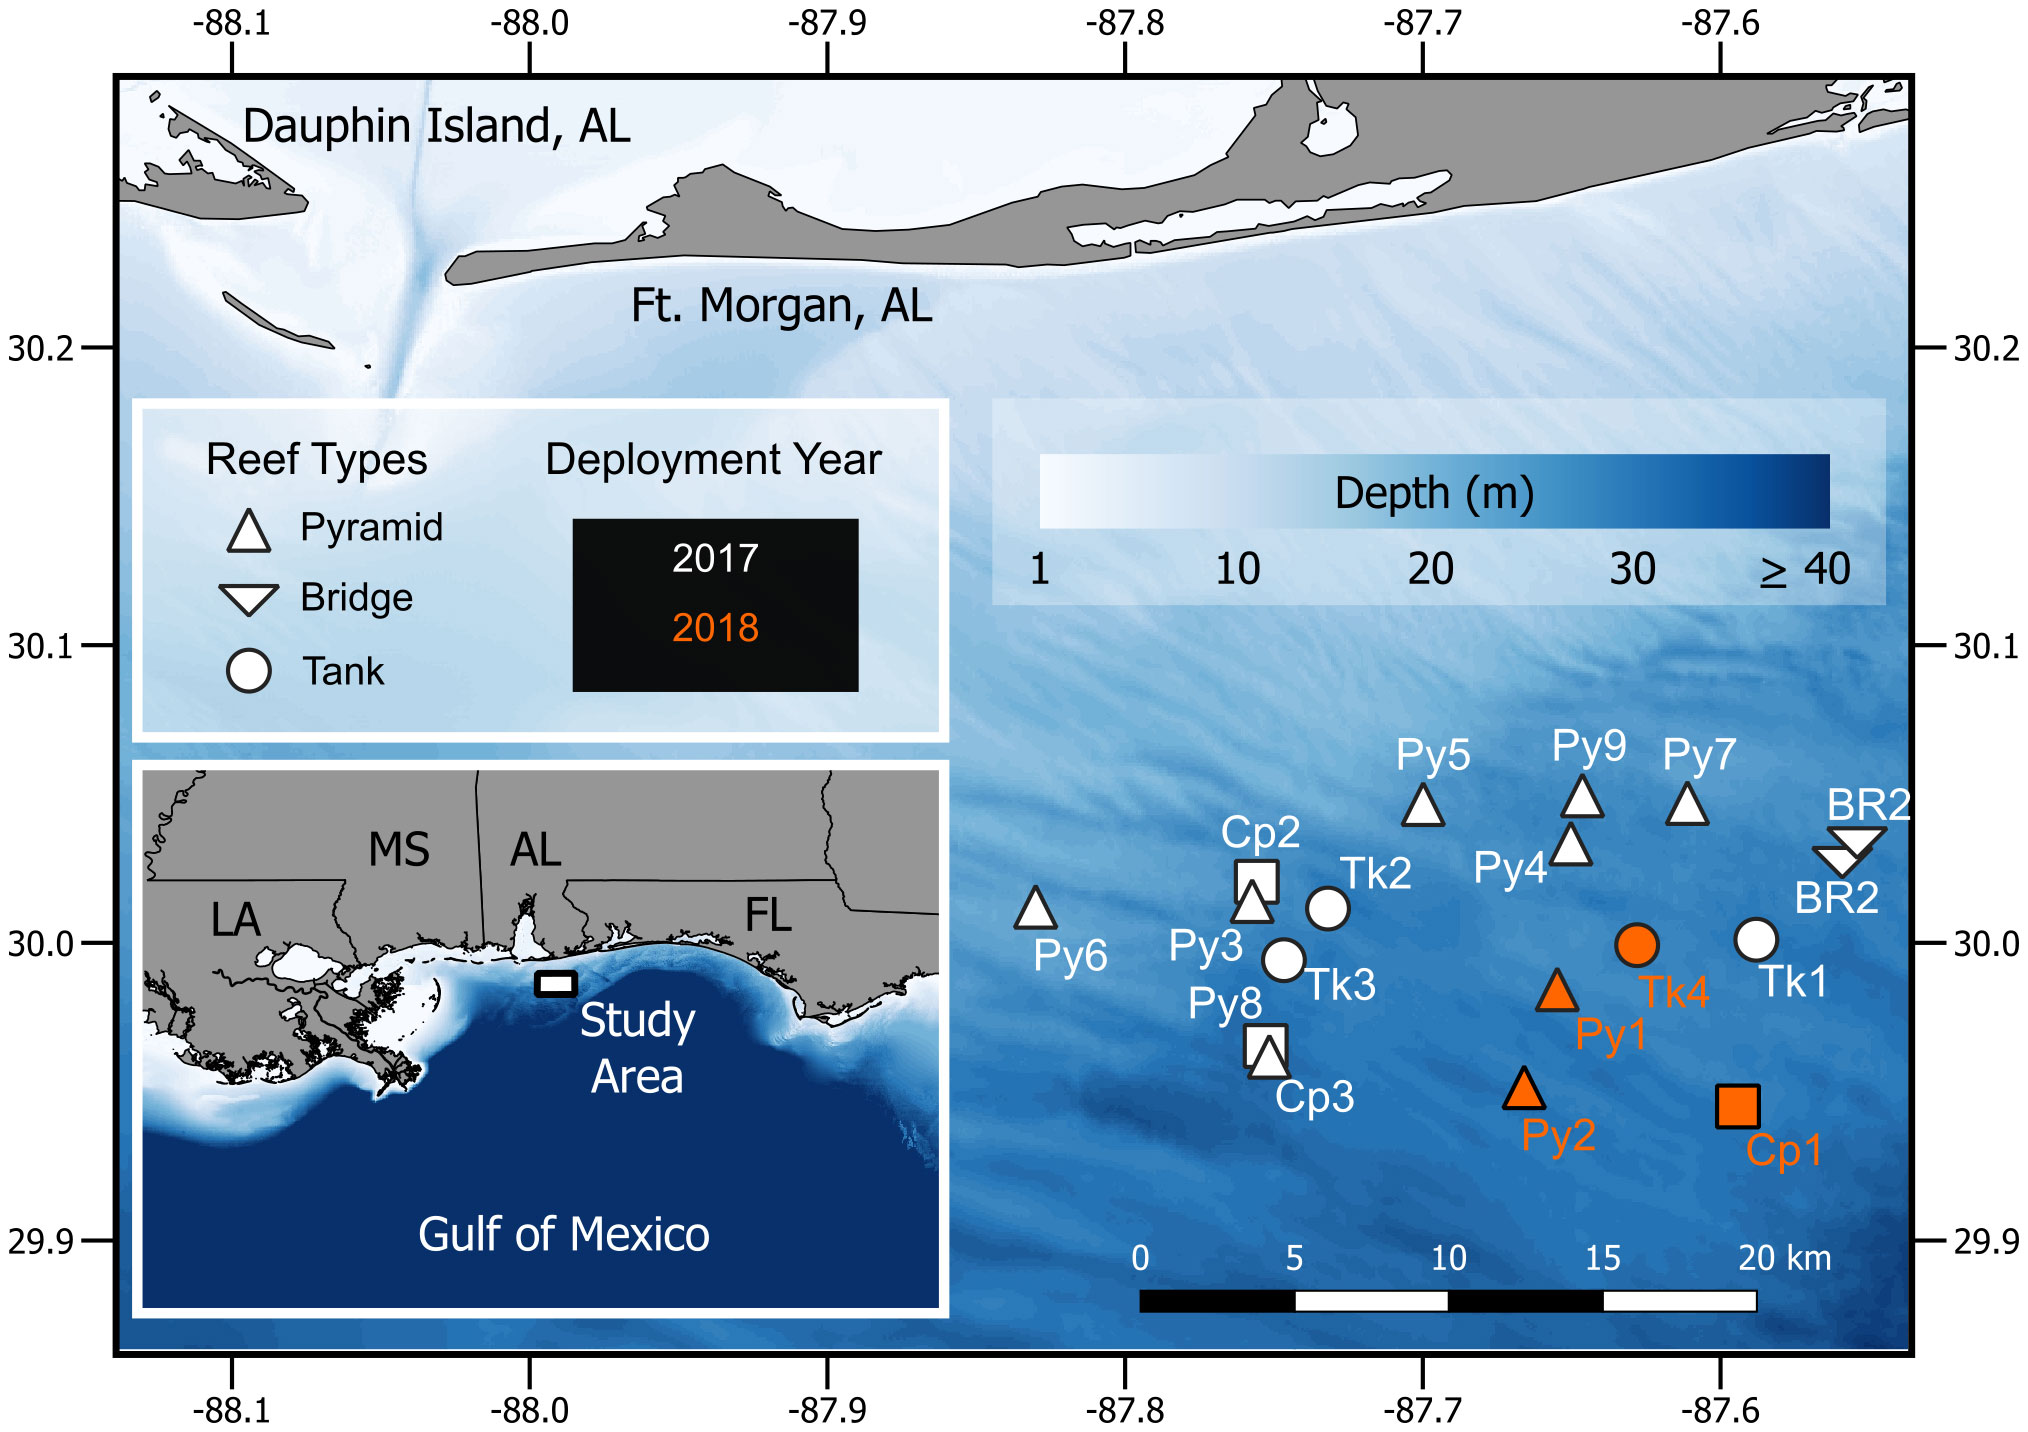
Figure 1 Alabama artificial reef sites where passive acoustic monitoring devices were deployed in 2017 (white) and 2018 (orange).
Video was taken during deployment and recovery dives using a GoPro Hero 3 camera. Video included the attachment or detachment of the recorder, a swim around the reef structure and examination of enclosed spaces. Video durations ranged from 4.5 to 17.4 minutes (10.1 ± 3.5 mean ± SD). All recovery dives took place within 59 days of the last recording. Fish species were identified from video frames and the local abundance of each species was estimated by taking the maximum number of individuals (MAXNO) of a species visible within a single video frame (Ellis and Demartini, 1995; Reeves et al., 2018). This conservative approach was chosen so that fish would not be repeatedly counted. For each reef, MAXNO values were averaged between the deployment and recovery dive for all identifiable species. Dense schools of small forage fishes, possibly round scad, Decapterus punctatus, were estimated to the nearest 100 individuals. For each reef, an average relative abundance was taken by averaging the MAXNO values from deployment and recovery videos at each reef. On some deployments, divers removed invasive red lionfish during deployments and recoveries. On the occasions when lionfish were removed during deployment dives, we estimated lionfish relative abundance from recovery dive videos only because lionfish observed in deployment videos may have been subsequently speared. On recovery dives when lionfish were speared, it was possible to count all speared lionfish observed on video and these numbers were used instead of the MAXNO value.
Similarity in species composition among reefs was assessed using Bray-Curtis (dis)similarity of presence-absence values using the package ‘vegan’ (Oksanen et al., 2020) in R (R Core Team, 2021). Species predicted to be transient near artificial reefs were not included in this analysis of species composition (Table 1). Two-dimensional non-metric multidimensional scaling (nMDS) plots were used to assess the pattern of reef fish composition similarity among reefs. In addition, we calculated species richness of reef fishes for each reef, excluding species assumed to be transient as described above.
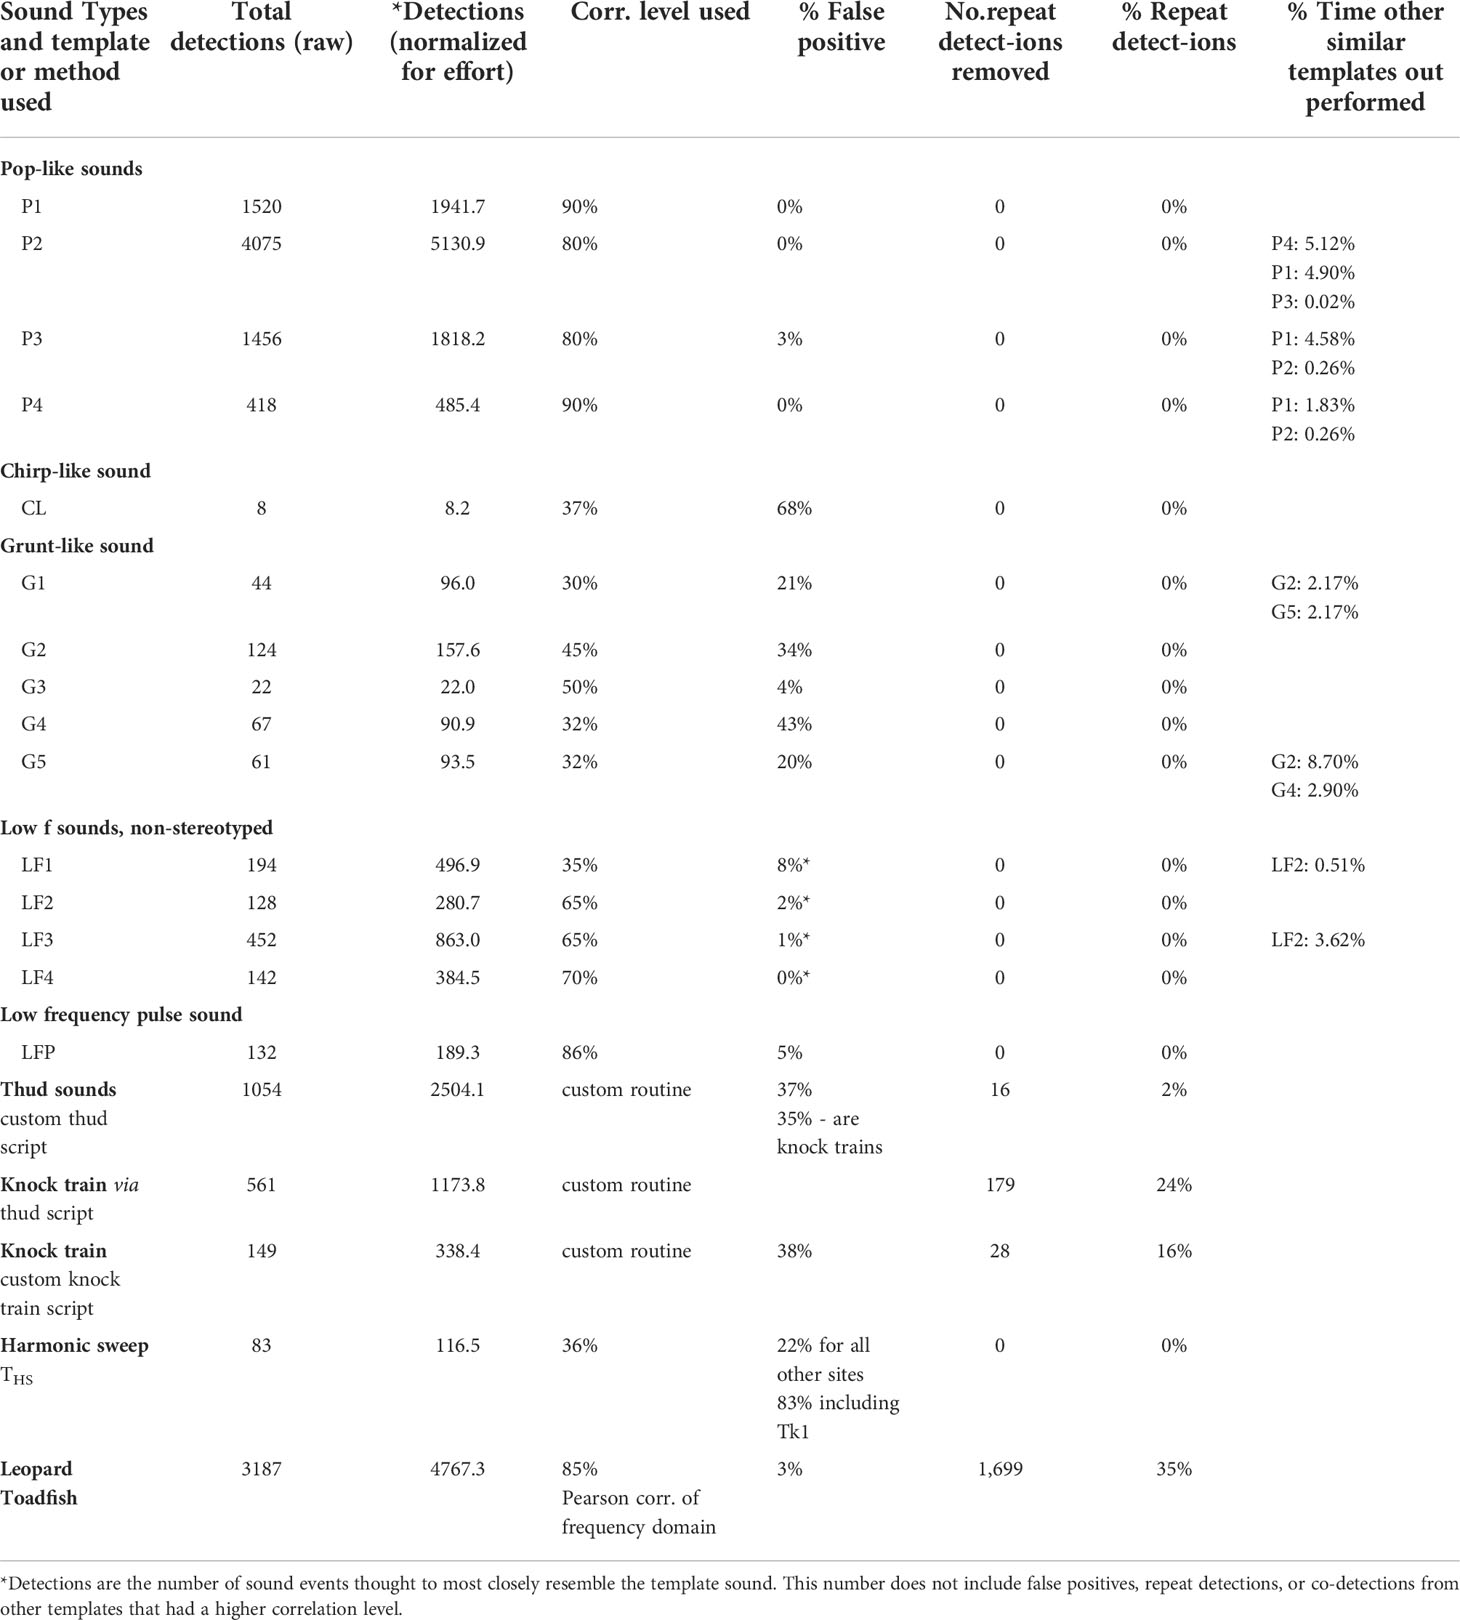
Table 1 Sound types and detection method, number of detections, normalized detections, correlation level used, false positive rate, repeat detections, repeat detection rate, and performance relative to similar detection methods.
Raw sound data from reefs were examined aurally and with spectrograms in Adobe Audition v. 3.0. Sound types were examined qualitatively and described based on the waveform of sounds, train like features for sounds that had repeating pulses or other elements, and the spectral qualities of sounds. Several sound types have been described from previous research, including leopard toadfish calls (Wall et al., 2012; Wall et al., 2013), harmonic sounds (‘365 Hz Harmonic’ sound of Wall et al., 2012; Wall et al., 2013), and cusk-eel sounds (Mann et al., 1997; Kever et al., 2015; Mooney et al., 2016).
We attempted to use semi-automated screening methods to detect sound types that we characterized from raw data. For each sound type, we first tried to use a time domain cross correlation (TDXC) technique. For each attempted sound type screening, a single representative pulse from train like sounds that have silent interpulse intervals, or a representative single sound from non-train like sounds was used as a template. Silence (0.25 s duration) was added before and after the sound template and a custom Matlab routine was used to screen through the directory of raw sound data from each artificial reef. Each raw sound data file (5 min files in 2017, 1 min files in 2018) was divided into segments of the length of the sound template and the maximum cross correlation of each segment with the sound template was calculated using the XCORR function. Values were scaled relative to the autocorrelation value of the template (between -1 and 1). Sound phase was then ignored by taking the absolute value of the correlation. Thus, correlation values varied between 0 and 1, with 0 being the most dissimilar and 1 being an identical waveform (100% correlation) or identical inverted waveform. We qualitatively tested these techniques for different sounds by examining screening performance against sound files that were aurally screened to look for false positives and false negatives. We then chose a correlation threshold value for each screened sound with the goal of high reliability in avoiding false positives and to also detect a substantial number of sound events. Automatic detections were predicted to provide diel, temporal, and spatial patterns of sound production, even if they underestimate the absolute number of total sound events. Thus, absolute numbers of detections from this method are not directly comparable among sounds because of differences in the efficacy of the technique and the arbitrary choice of threshold values. However, objective comparisons of relative occurrence across diel cycles, days, and among reef locations within a sound type are possible because the same semi-automatic scanning technique was used within comparisons of the same sound type.
For most sound types scanned by TDXC, we aurally screened all putative hits in order to identify false positives. For several sound types, for which there were many putative detections we randomly subsampled screening of false positives. In cases when all putative detections were not aurally screened, we indicate the number of subsampled screens in the results. TDXC scanning was not effective for some sound types, and in these cases, we created custom alternative scanning routines that are detailed in the results.
For several kinds of sound types (pop sounds, grunt-like sounds, low frequency), we created multiple templates from different sounds and scanned them independently. This was done to capture more potential variation and because we were open to the possibility that these templates were similar, but from potentially different sources that would show differences in temporal and spatial abundance. Because the templates of these sounds were similar, it was not possible to identify potential co-detections with other similar templates from aural scanning (as is possible with other false positives). Thus, we identified all cases where different templates detected the same sound.
Before analyzing diel, temporal, and spatial patterns of detected sounds, we removed any detected false positives and only included sound events that were co-detected by multiple templates with the sound template type that had the highest TDXC threshold (i.e., detections were not double counted as multiple sound types). We report the rate of false positives (% of total putative detections or total subsampled putative detections that were aurally screened) and the rate of co-detections for all templates (% of all putative detections). For each sound type, we calculated the mean hourly detection rate among reefs over the diel cycle. In addition, we calculated the average daily sound detection rate for each reef and sound type. For mean hourly detection rate, estimated among reefs, we report the estimated standard error (SE) and for daily detection rates for each reef we report the standard deviation (SD). Sounds for figures were plotted from.wav files (sampling rate 4kHz) with oscillograms and spectrograms using the ‘spectro’ function in the ‘seewave’ package in R (Sueur, 2018; Sueur et al., 2018) with a Hanning window, length 128 samples, 75% overlap.
To qualitatively ascertain the co-occurrence of sound types with fish species, we calculated Pearson correlation values for presence/absence data of fish sounds on reefs and presence/absence of fish species on reefs from video data. We then reported the fish species with the greatest correlation. To test for an overall association between daily fish sound emission similarity among reefs and reef similarity based on fish composition, we used a BIOENV procedure and Mantel test. To calculate fish sound similarity among reefs, we used the daily sound detection rate for each sound type. We used daily detections of knock trains calculated from the thud detection script and we used the average daily detection rate for similar sound types (see Results): pops (average of P1, P2, P3, P4), grunts (average of G1, G2, G3, G4, G5), and non-intentional low frequency sounds (average LF1, LF2, LF3, LF4).
We then conducted a BIOENV test to identify the fish sound(s) with the greatest association with reef similarity in fish species composition. Fish sound similarity among reefs was assessed using Euclidean distance and fish species composition was assessed with Bray-Curtis dissimilarity of presence/absence data and the BIOENV procedure assessed correlation using the Spearman method. We used a Mantel permutation procedure to determine if the association between the best subset of fish sounds among reefs and fish compositions was greater than would be expected by chance (p < 0.05). These procedures were conducted with the R package vegan (Oksanen et al., 2020).
The diversity of call types (call richness) at each reef was estimated by counting the number of call types examined in the study at each reef. Pop-like sounds, detected with templates P1, P2, P3, and P4, were assumed to be the same type of call and were considered one call type. We tested for an association between call type diversity and fish species richness among reefs using Pearson correlation tests.
We examined spatial and temporal patterns of overall (root mean square sound pressure level [SPLRMS]) and spectrum level noise values (dB re: 1µPa/Hz2) at specific frequencies (200, 800, 1200, and 5000 Hz), which were chosen because they represent peaks of low frequency fish sound (200 Hz), pop sounds (800 Hz), cusk-eel chatter (1200 Hz), and evening biophonic tonal noise (5000 Hz). For each sound recording.wav file, we estimated SPLRMS levels in ten second intervals using the ‘rms’ function in the ‘seewave’ package in R (Sueur, 2018; Sueur et al., 2018) and used the reported calibration of each snap recorder hydrophone and gain to calculate SPLRMS dB re: 1µPa. We then calculated the average SPL over five minutes for the 2017 data or over one minute for 2018 (i.e., the average for the full.wav file). In addition, because intense, non-biophonic noise can occur for brief periods of time, we calculated the median and 95th percentiles of SPLRMS noise levels for day and night-time hours for each reef and an average of these values among all reefs. We calculated spectrum level noise values in one-minute intervals by using the full.wav file for data from 2018 and dividing.wav files into one-minute intervals in 2017. We used the ‘meanspec’ function from the ‘seewave’ package (Sueur et al., 2018) and then extracted values for the specific frequencies described above.
We tested for among-reef correlations between SPLRMS (day and night, median and 95th percentiles) fish species richness. In addition, because vessels can contribute anthropogenic noise to the soundscape, we tested for correlations between idling boat detections, which were obtained from our study on fishing effort from vessel sounds using the same PAM recordings (Boyle et al., 2022), and SPLRMS (day and night, median and 95th percentiles). We used Pearson correlation tests and the average daily boat detection rate for these analyses.
Several sound types were identified by aural screening and used to produce semi-automated scanning routines to compare diel, temporal, and spatial patterns. Pop-like sounds with a peak frequency between 500 and 1000 Hz occurred in series with irregular interpulse intervals (Figures 2A, B, S1). Four pop-like templates were used to scan for pops using TDXC (Table 1). These templates were made from four individual pops with a duration (mean ± SD) of 24 ± 6.8 ms and peak frequency of 681 + 87 Hz. This method was highly effective for finding pop events in raw recording data and because of the high number of putative detections, we randomly subsampled aural screening of putative detections: 65 aural screenings – P1, 70 – P2, 60 – P3, and 44 – P4. False positive rates for TDXC of pop like sounds at the chosen thresholds were low ¾ 3% (Table 1). Similarity in the pop like templates resulted in co-detection of some sounds between some templates of up to 5% of putative detections (Table 1).
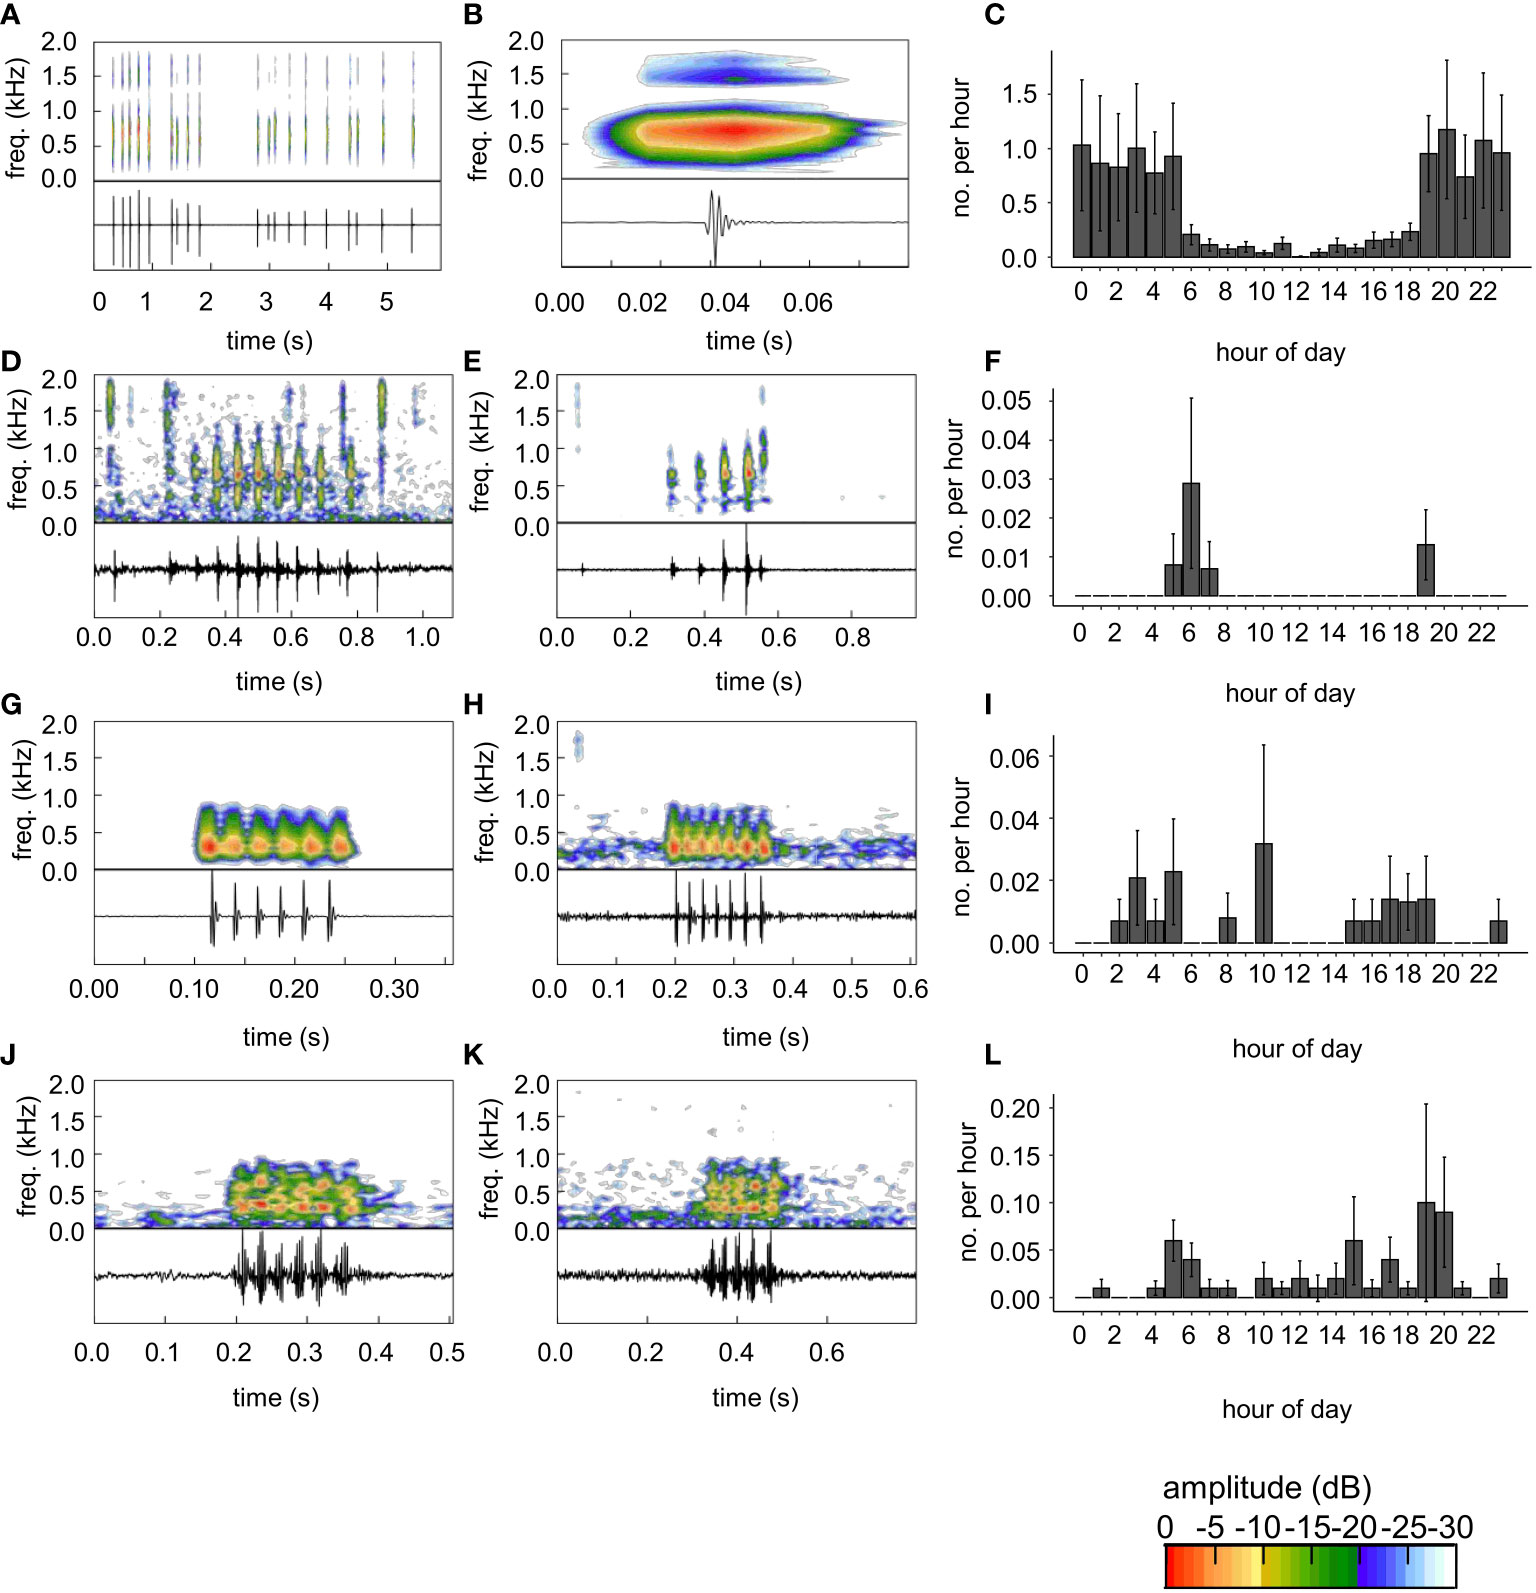
Figure 2 Sound types and diel cycles of sounds automatically detected. Oscillograms and spectrograms of sounds are shown for each sound. (A) Pop-sounds and (B) close-up view of a single pop, which was the first of the series shown in (A). (B) The pop in (B) was used to create template P1 to automatically detect pop sounds. (C) Diel detection rate from template P1. (D, E) Damselfish chirp-like sounds (F) and diel detection rates chirp-like sounds detected by template CL. (G) Grunt-like sound used as template G3. (H) Grunt-like sound detected by template G3. (I) Diel detection rate of sounds using template G3. (J) Grunt-chirp like sound used as template G4. (K) Grunt-chirp like sound detected by template LFP. (L) Diel detection rate of sounds using template G4 as a template. Diel detection rates (C, F, I, L) are the mean ± SE hourly detection rate among all reefs (2017 and 2018) from each template. Note differences in time scales for sound figure panels. Color scale bar shows relative amplitude (dB) of frequencies depicted on the spectrogram.
Pop sounds were far more common in evening hours (Figures 2C , S1). For detections with all pop templates, there was a strong peak associated in most cases around 20h (Figures 2C, S1). There were also high levels of detections in early morning hours before sunrise, particularly for detections using P1 (Figure 2C), to a lesser degree for P2 and P3 (Figure S1C, F), but not for P4 (Figure S1I).
A chirp-like sound, similar to previous descriptions of damselfish chirps (Steinberg et al., 1965; Myrberg et al., 1993), with repeating pulse units, usually not separated by complete silence, was observed among artificial reef sound recordings (Figures 2D, E). This sound had a duration of 0.578 s, peak frequency of 645 Hz, and a pulse rate of 15.6 pulses s-1. A template (CL) of this sound was created and used to screen reefs for similar sounds. Detection rates of this sound were modest and occurred in crepuscular, early-morning and late-afternoon hours, with the highest peak in the morning (Figure 2F).
Five templates of grunt-like sounds were created. These sounds were somewhat similar to the chirp-like sound described above, with repeating pulse units and little-to-no silence during the interpulse interval (Figures 2G, H, J, K, S2). These sounds ranged from 0.130-0.250 s duration (mean ± SD: 0.175 + 0.047), peak frequency from 270-539 Hz (mean ± SD: 270-539 Hz), and pulse rate from 32.0-43.0 pulses s-1 (mean ± SD: 36.1 ± 4.6 pulses s-1). These templates varied in effectiveness and thus different threshold values for TDXC were used (Table 1). We aurally screened all putative detections except for template G2 at the Br1 site which had many putative detections and we screened a subsample (n=19, n=32 for all sites). Detection rates for these sounds were far more modest than for pop sounds and false positive rates were high for all grunt-like sound templates except G5 (Table 1). There was some co-detection of grunt-like sounds among templates, with G3 being the only grunt-like template that did not share co-detections with other templates (Table 1).
Unlike what was observed for pop sounds, detections of grunt-like sounds varied over the diel cycle depending on the template (Figures 2I, L, S2C, F, I). Thus, it is possible these template sounds represent different kinds of sounds or at least tend to detect different kinds of sounds. Template G4 and G5 had similar times of peak activity to CL but showed additional activity mainly during diurnal hours (Figures 2L, S2I).
Several occurrences of low frequency sounds were observed while aural screening raw data (Figures 3, S3). Templates were made from five low frequency sound events: LF1 (Figure 3A), LF2 (Figure S3A), LF3 (Figure S3D), LF4 (Figure 3D), and LFP (Figure 3G). Four of these low frequency sounds (LF1, LF2, LF3, and LF4) did not appear very stereotyped based on a lack of observed sounds with similar waveforms from aural screening of raw data (Figures 3, S3). These four non-stereotyped sounds ranged from 0.050 to 0.731 s duration (mean ± SD 0.2834 ± 0.304 s) and 121 to 168 Hz peak frequency (mean ± SD 142 + 21 Hz). TDXC screening with templates from these sounds found a wide array of low frequency sounds that varied in waveform shape and duration. Thus, we used these four templates to find generic low frequency sounds, which may be non-intentional sounds from fish. Correlation levels chosen were varied based on the number of putative detections (Table 1). LF1 had fewer putative detections and thus a lower threshold was used and all putative detections were aurally screened. For templates LF2, LF3, and LF4, even at a higher threshold, there were many putative detections and we thus subsampled aural screening: LF2 – 95 sounds screened, LF3 – 80 sounds screened, LF4 – 55 sounds screened. False positives (Table 1) for these generic low frequency sounds tended to be from boats and recognized fish sound types. The LF2 template detected some of the same sounds as the LF1 and LF3 templates, but at higher correlations (Table 1).
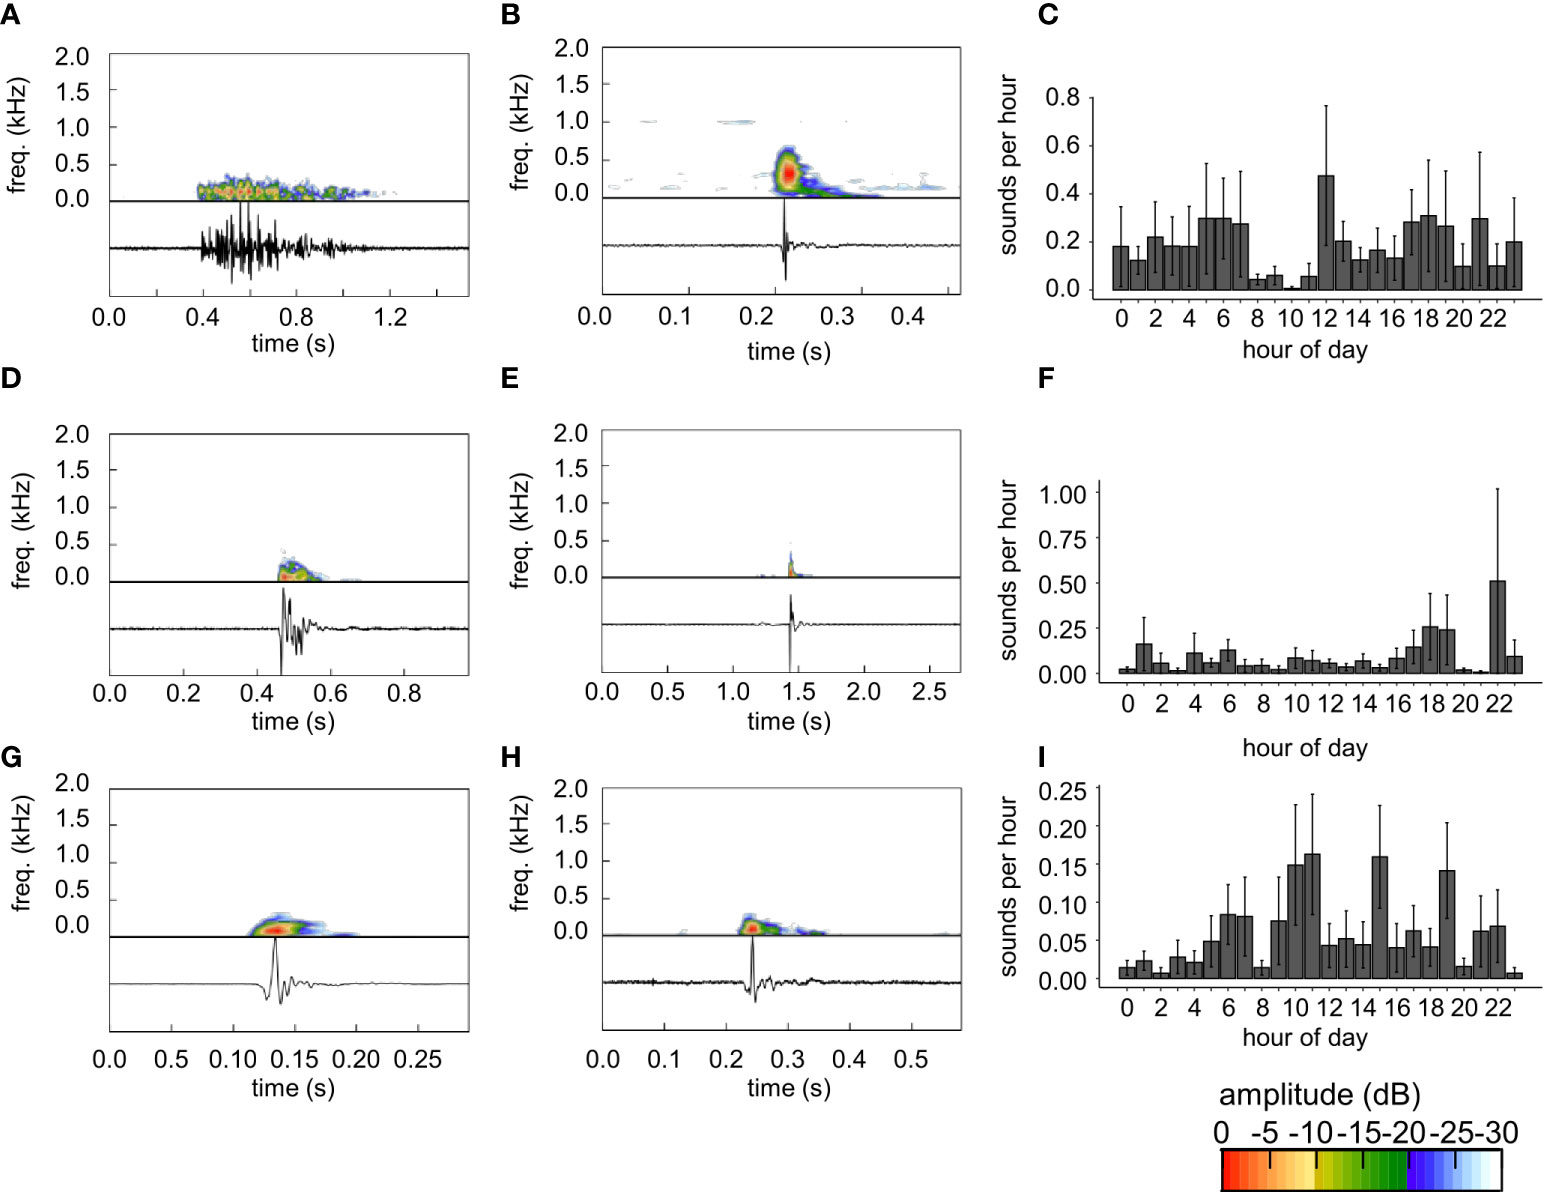
Figure 3 (A, B, D, E, G, H) Low frequency sounds and (C, F, I) diel detection rates of low frequency sounds. Oscillograms and spectrograms of sounds are shown in the panels in the left and middle columns. Low frequency sounds used as templates: (A) LF1, (D) LF4, (G) LFP. Low-frequency sounds detected by (B) LF1, (E) LF4, and (H) LFP. Note low frequency sounds in (A) and (D) do not appear to be a common stereotyped sound and (B, E) sounds with the highest detections are not similar sounds. In contrast, (G) template 27 detects similar, (H) stereotyped low frequency pulses. Diel detections (mean hourly detections ± SE) from (C) template LF1, (F) LF4, and (I) LFP. Diel detection rates (C, F, I) are the mean ± SE hourly detection rate among all reefs (2017 and 2018) from each template. Note differences in time scales for sound figure panels. Color scale bar shows relative amplitude (dB) of frequencies depicted on the spectrogram.
The low frequency pulse used to produce template LFP appeared stereotyped (Figures 3G, H). Some pulses detected by LFP had opposite polarity to the examples shown in Figures 3J, N, but all were characterized by a lower amplitude half cycle (negative in Figures 3G, H), immediately followed by a higher amplitude half cycle (positive in Figures 3G, H). The sound used to produce template LFP had a duration of 0.136 s and peak frequency of 74 Hz. At a chosen threshold of 86%, TDXC with template LFP showed a relatively low rate of false positives (Table 1).
Most non-stereotyped sounds occurred with similar frequency across all hours of the day, with a decrease at 8h (Figures 3C, S3C, F), decreasing the signal-noise ratio and potentially making detection more difficult. The non-stereotyped low frequency template LF4 tended to have the most detections at 22h (Figure 3F). The stereotyped low frequency pulse LFP had the highest levels of detections during diurnal hours (Figure 3I).
Thud like sounds that occurred in trains (Figures 4A, B) were observed in aural screening of raw data. These sounds (Figures 4A, B) had a peak frequency (mean ± SD) of 162 ± 14 Hz and a pulse rate of 5.1 ± 1.4 pulses s-1. Initial attempts to automatically detect these sounds using TDXC proved difficult because of many false positives and false negatives. One of the suspected challenges was the variable interpulse interval of this sound type. An initial template attempt with a single thud pulse detected many single sound events that were suspected to be of various different sound types and non-intentional sounds. Thus, we created a custom routine to detect these thud trains. The detection routine examined two seconds of raw data at a time and used a single thud with 40 ms of silence before and after as a template. The thud train from which the pulse template was created is shown in Figure 4A. The criteria for detection required six cases with a TDXC threshold of 50% within the two-second scanned portion. This routine detected many thud train sounds, but also had a high number of false positives (Table 1). Most of the false positives were detections of knock train sounds (described below). In addition, this method sometimes detected portions of the same sound train twice (Table 1). Thud sounds were detected at all hours of the day, but highest activity occurred from hour 19 to23 (Figure 4C).
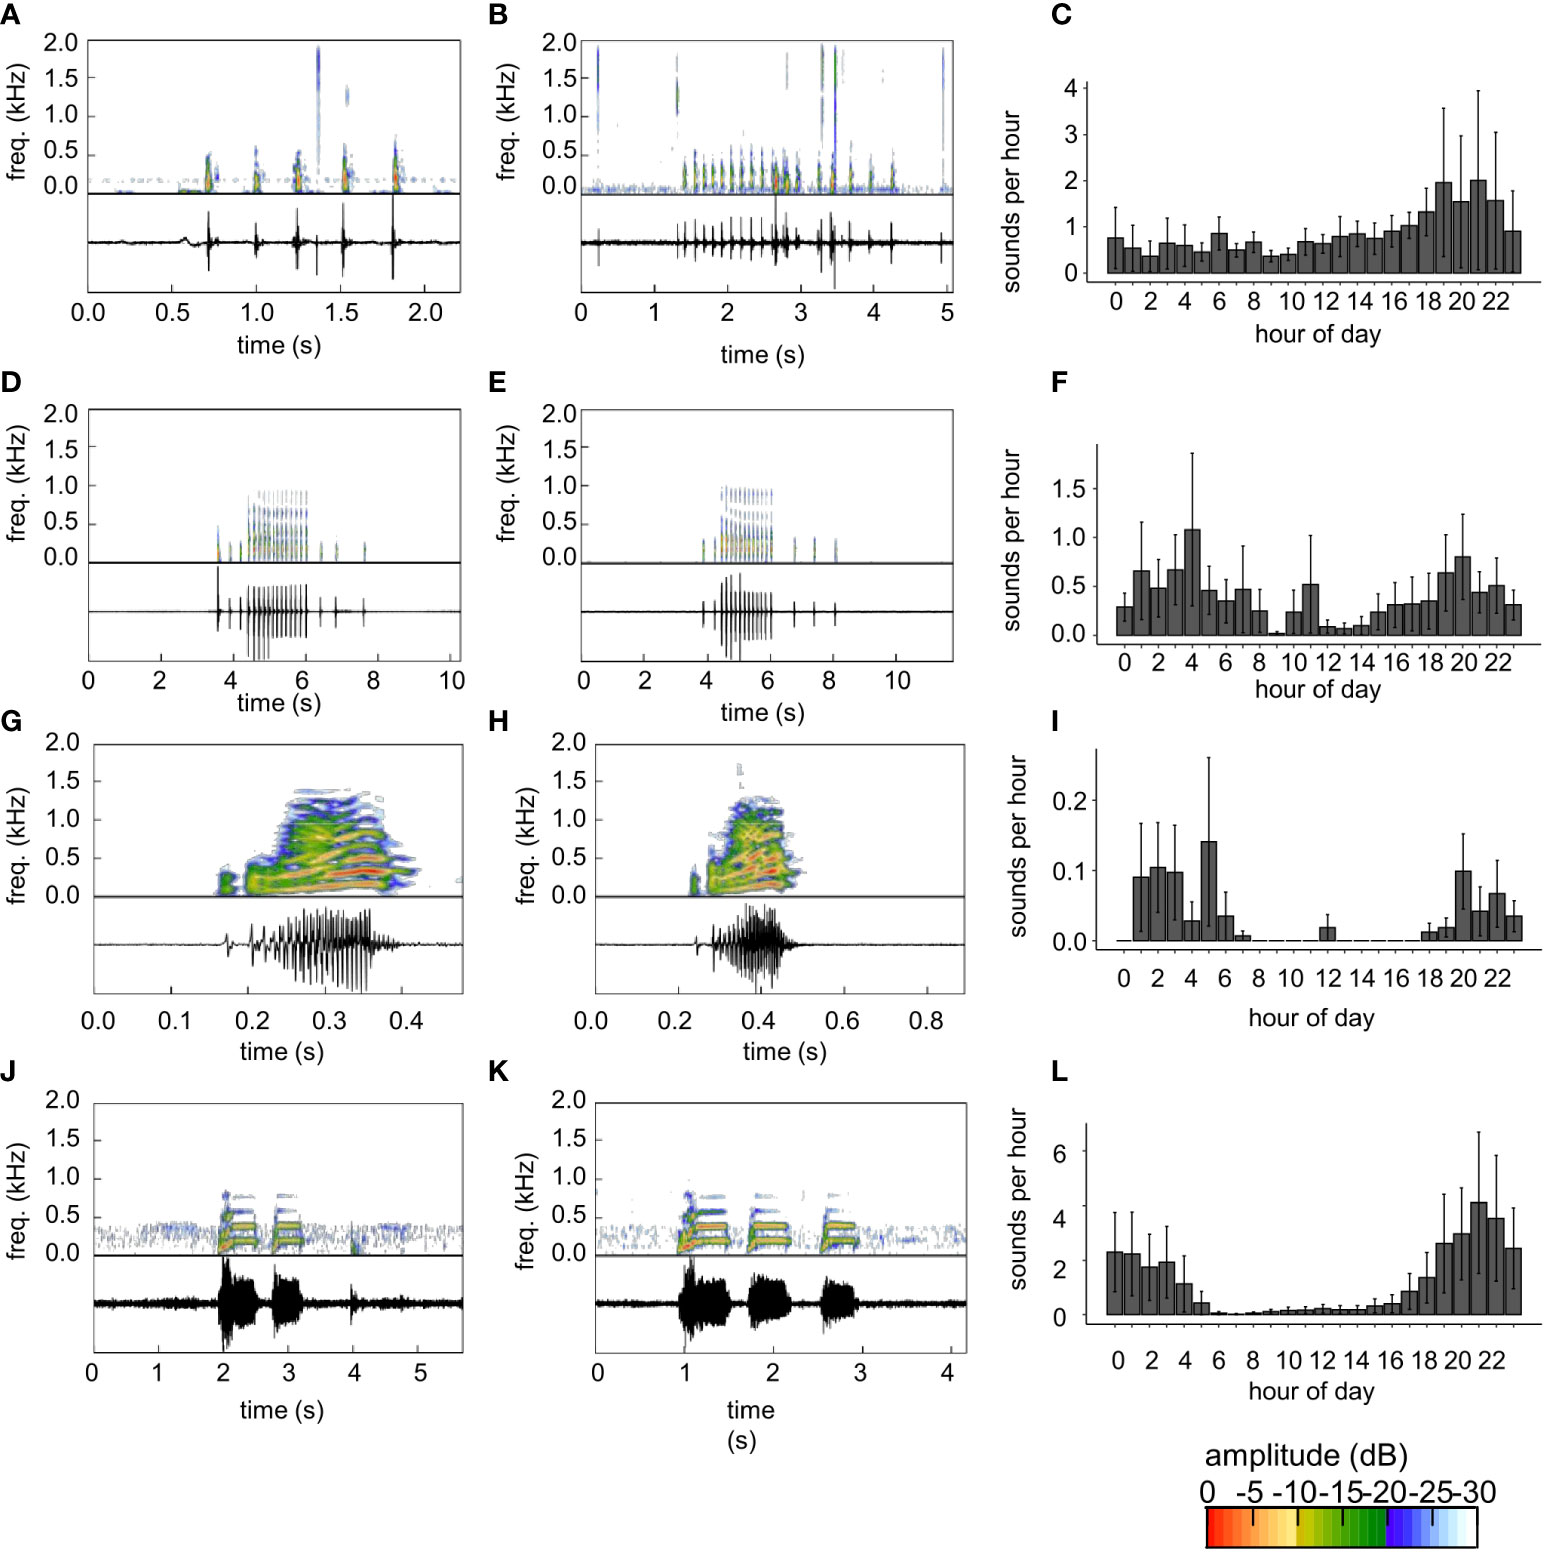
Figure 4 (A, B) Thud sounds, (D, E) knock train sounds, (G, H) harmonic sounds, (J, K) toadfish boatwhistles, and (C, F, I, L) diel detection of rates these sound types. Oscillograms and spectrograms of sounds are shown in the panels in the left and middle columns. A custom detection routine was used to detect thud sounds. The highest and second highest correlations with this routine are shown in (A, B), respectively. (D, E) Knock-trains were also detected by the thud train routine. Harmonic sounds were detected with a template produced from the sound shown in (G) and an example detection is shown in (H) Toadfish boatwhistles were detected with a custom routine with a template in the frequency domain. Toadfish detections with the highest correlation are shown in J and (K) Diel detection rates (C, F, I, L) are the mean ± SE hourly detection rate among all reefs (2017 and 2018) from each template. Color scale bar shows relative amplitude (dB) of frequencies depicted on the spectrogram.
Knock train sounds were observed that have a characteristic, stereotyped train of knock-like sounds in which some of the knocks, typically within the middle of a call, have a higher frequency component that extends from about 500-1000 Hz (Figures 4D, E, S4A, B, D, E). These sounds (Figures 4D, E) had an overall pulse rate (mean ± SD) of 4.3 ± 0.5 pulses s-1, with a higher pulse rate of 7.5 ± 0.3 pulses s-1 during the higher frequency component in the center of the call. In these calls, lower frequency pulses had a peak frequency of 172 ± 5.5 pulses s-1, while higher frequency pulses in the center of the call had a peak frequency of 240 ± 91 pulses s-1. This higher frequency component, which occurs in rapid succession, distinguishes these knocks from thud train sounds (Figures 4D, E). Many knock train sounds were accidentally detected by the thud sound detection routine as false positives (Table 1). In addition, a large percentage of the accidental detections were of a different portion of the same knock train (double detections) (Table 1). We also attempted to screen for thud train sounds directly (on purpose) using TDXC with one or several knocks from a train. Initial attempts were ineffective because of high false negatives and false positives. Thus, we created a custom routine that scanned a one second sound portion using a single knock as a template with 40 ms of silence before and after the knock. The routine calculated TDXC values of the template within the one second screened portion and criteria for detection was a minimum of five correlations of 50% or more within that period. This custom routine was moderately effective at detecting knock trains, but also had a high false positive rate and moderate rate of double detections (Table 1). Surprisingly, the rate of knock-train detection was higher using the thud sound routine (as an accidental by-product) than it was for our knock train routine (Table 1). Eighty-two knock trains were detected by both methods. Both methods of semi-automated detection indicated increased knock train activity during nocturnal hours, with a pre-dawn peak at 4h, peaks near sunset (20h) and sustained activity throughout the evening (Figures 4F, S4C).
Brief sounds with continuous oscillation, a harmonic structure, and slight frequency modulation were observed in aural screening of raw data. These sounds, which we termed harmonic sounds (Figures 4G, H) are similar to the ‘365 Hz Harmonic sound’ of Wall et al. (2012, 2013). This sound (Figures 4G, H) had a duration of 0.205 s and peak frequency of 293 Hz. We screened for harmonic sounds with TDXC. All putative detections were screened aurally, except for Tk1, which had a high number of putative detections (n=368) that appeared to all be false positives with leopard toadfish boatwhistle sounds. Thus, we randomly screened a portion (n=138) of these sounds at Tk1, all of which were leopard toadfish calls and it was assumed that no harmonic sounds were detected at that site. False positives were modestly high among most sites, but appeared exceptionally high when Tk1 was included (Table 1). All Tk1 putative detections, based on subsampled aural screening, were assumed to be false positives from leopard toadfish and these high levels of false positives substantially increase the estimated false positive rate (Table 1). Harmonic sounds were detected mainly during evening and crepuscular hours with a peak at 5h (Figure 4I).
Aural screening of raw data indicated many leopard toadfish boatwhistle sounds (Figures 4J, K). These sounds were very similar to descriptions in Wall et al. (2012, 2013) and the generation of a boatwhistle sound occurred once while a leopard toadfish was visually observed on a deployment dive at site (Tk 4). TDXC of the tonal boatwhistle sounds from leopard toadfish was not very effective because of false positives that were often associated with tonal sounds of running boats and false negatives. Thus, we produced a custom routine with trial and error to improve efficacy. We made a template file from the central portion of a single toadfish boatwhistle, which often occurred in threes; the portion after the beginning part of the boatwhistle which tends to increase and vary in amplitude and has frequency modulation. This tonal portion of the boatwhistle was 182 ms long, had a dominant frequency of 188 Hz, a higher intensity harmonic at 396 Hz and additional harmonics at 563, 750, 945, and 1130 Hz. No silent portion was used in construction of the template and the routine used the frequency domain to identify putative toadfish boatwhistles. The routine divided raw sound data into 182 ms intervals and calculated a power spectrum (1024 pt FFT, Hanning window) of the screened portion of the sound and the template boatwhistle. The similarity of the two power spectra were compared with a Pearson correlation and 85% correlation was used as a threshold. This method was highly effective, with over 3,000 detections, and large variation among sites and time periods when detections and putative detections occurred (Table 1). Thus, we aurally screened putative detections from all sites except Br1 and Tk1, which had very high numbers of putative detections. We randomly subsampled 560 putative detections at Br1 and 25 putative detections at Tk1. False positive rates from this screening routine were low (Table 1) and were mainly from boat noise. The leopard toadfish boatwhistle scanning routine was subject to a high rate of repeat detections of the same boatwhistle call series (Table 1). Because aural screening of putative detections of Br1 and Tk1 were subsampled, we automatically considered any putative detections occurring within three consecutive seconds to be repeat detections.Leopard toadfish boatwhistles were detected at all hours and showed a strongly nocturnal bias (Figure 4L). Leopard toadfish boatwhistle sounds peaked at 21h, began to drop off sharply at 4 and 5h and remained low until about 17h (Figure 4L).
Daily detections of pop-like sounds varied greatly among reefs (Figures 5A, B, S5). The Br1 site, for example, had an average of over 100 detections for templates P1, P2, and P3, while some sites had no detections (Figures 5A, B, S5). Pop-like sounds were detected on all reef types and showed high abundance on Br1, Cp1, and Tk1 (Figures 5A, B, S5). A distinct association between fish composition and abundance at reefs and pop-like sound detection was not apparent. Several sites, Br1, Tk1, Tk3, and Cp2, showed similar fish species composition and had high average pop-like sound detections for multiple templates (Figures 5A, B, S5). However, the Cp1 coop reef was very similar to these reefs in terms of fish species composition but had no pop sound detections (Figures 5A, B and S5). Notably, Cp1 recordings were from 2018 when very few pop-like sounds were detected. Also, most but not all reefs with high detections in 2017 were recorded from late May to early July, while most reefs recorded in late July and August had lower pop sound rates.
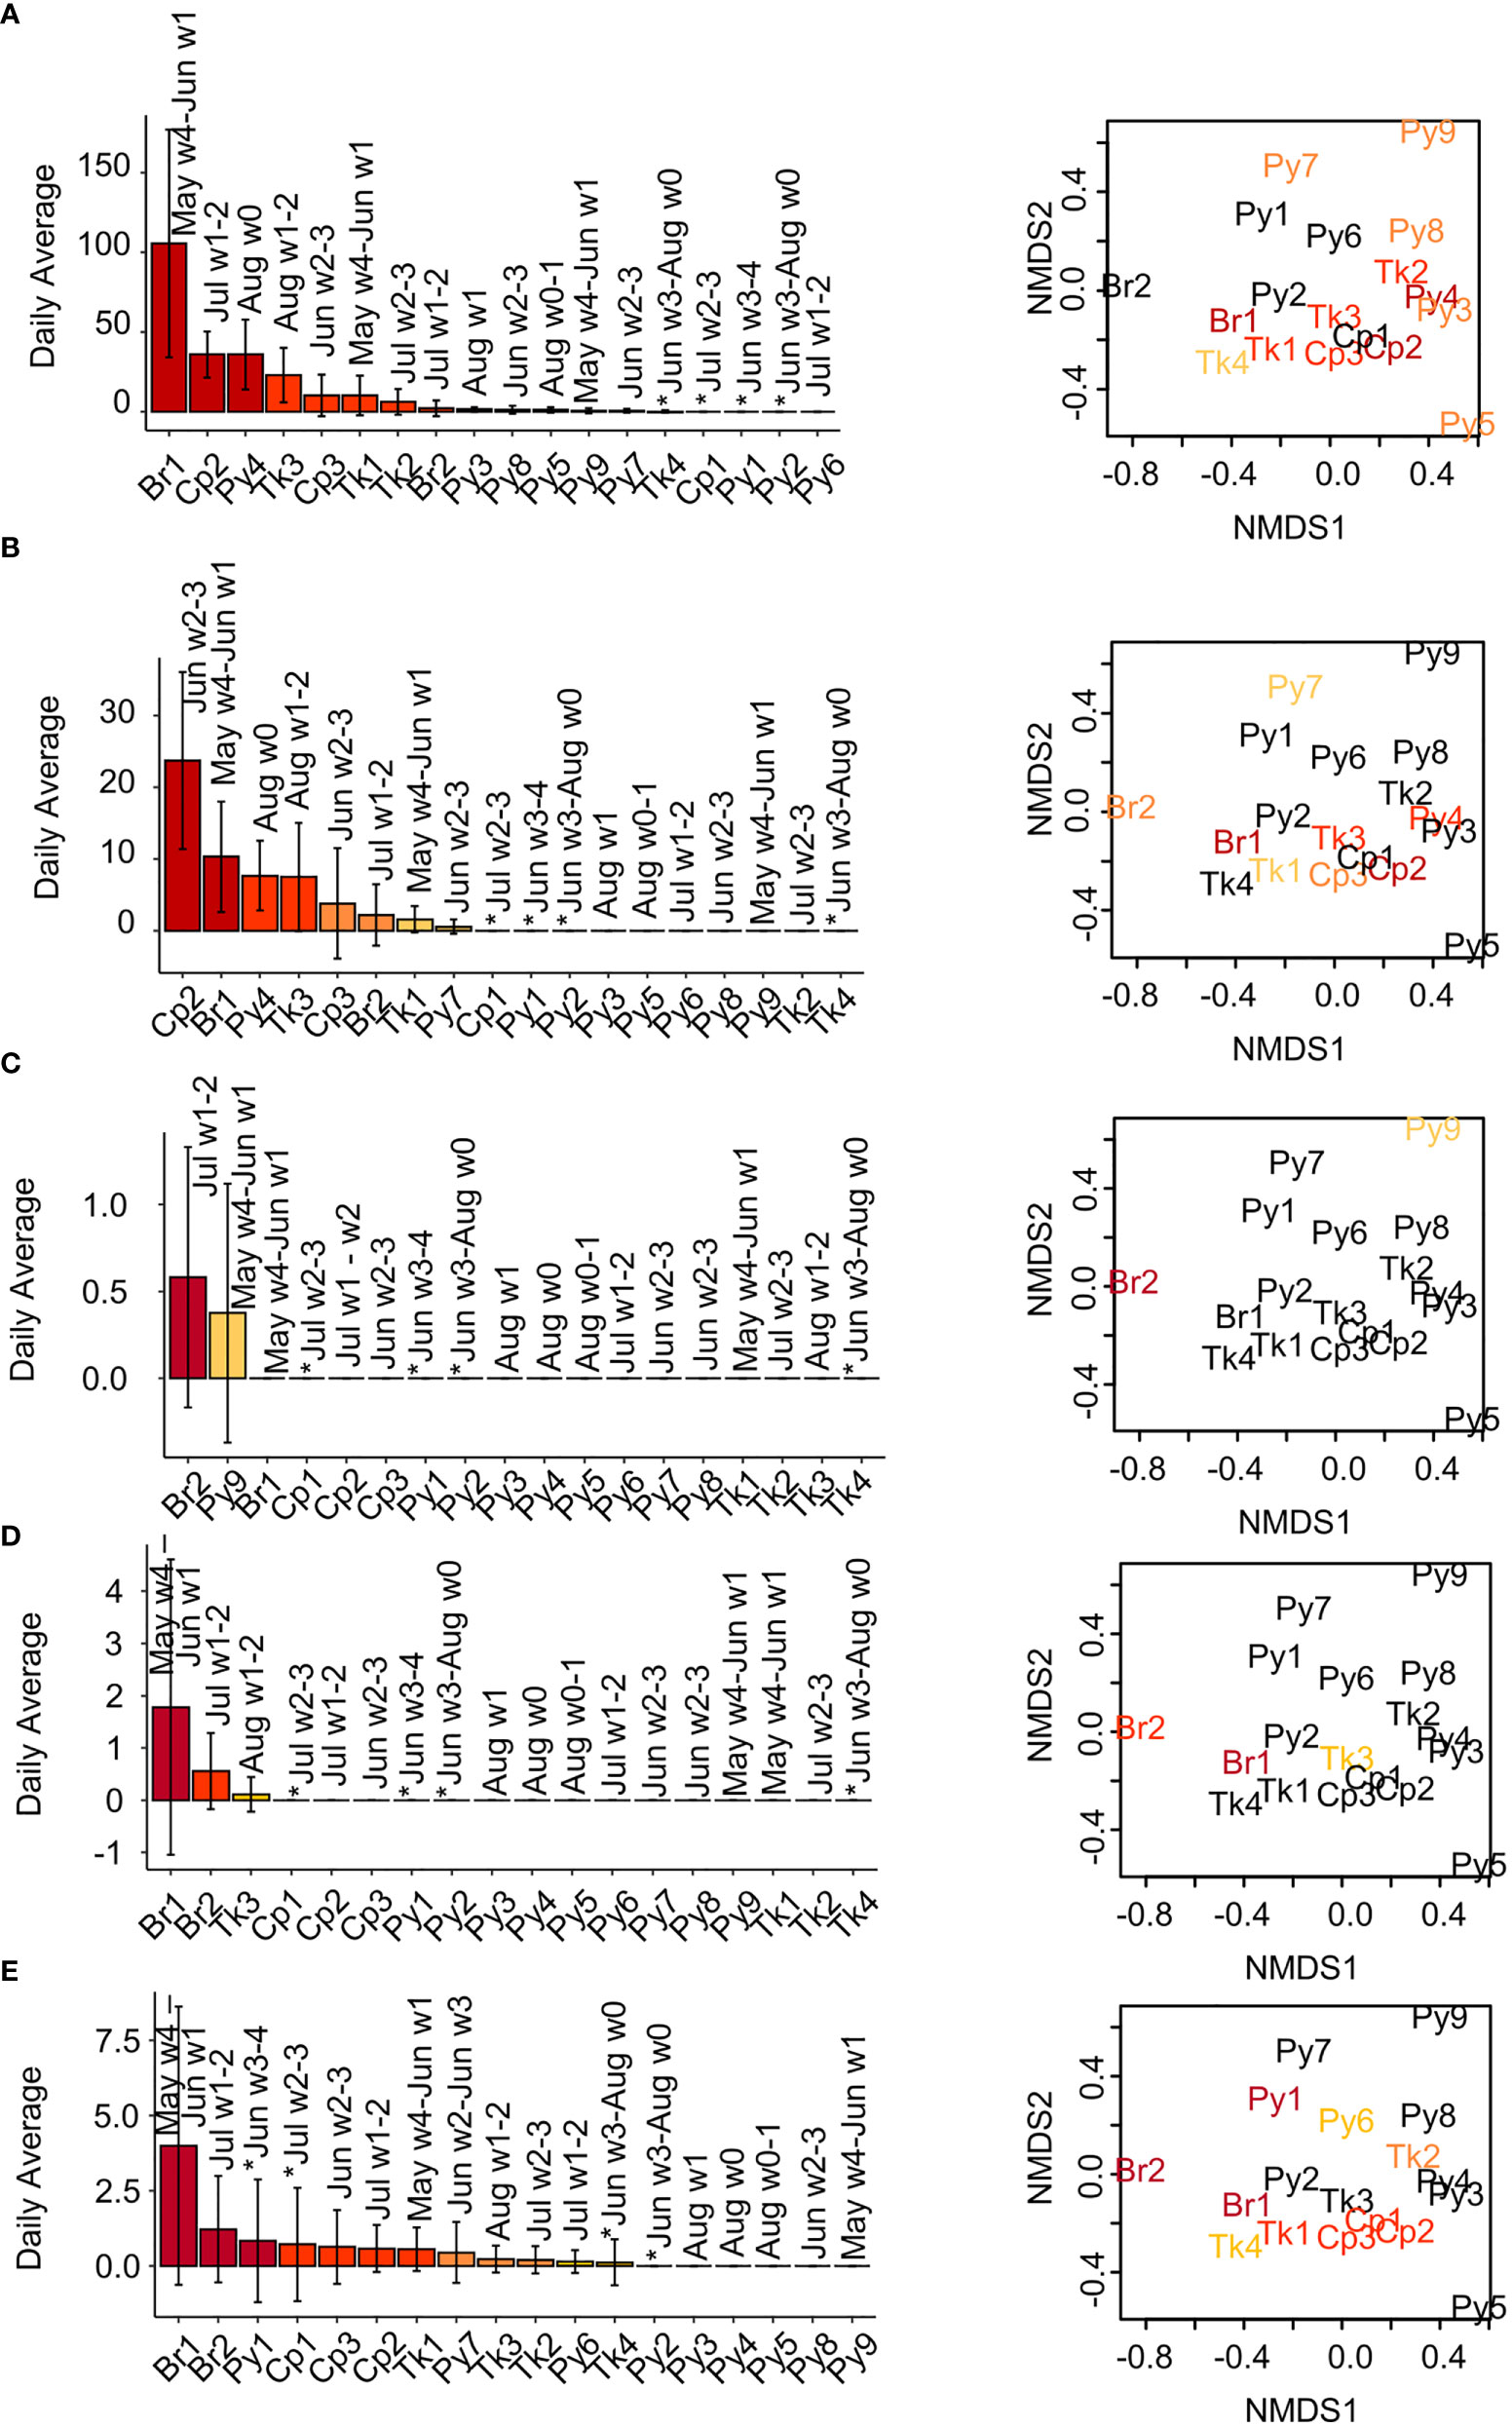
Figure 5 Daily call rates (average ± SD) among reefs and call rate associations with fish species abundance and composition. (A, B) Pop-like, (C) chirp, and (D, E) grunt sound call rates. Calls detected by templates (A) P1, (B) P4, (C) CL, (D) G3, and (E) G4. Month and week number (1-4) of the month the reef is sampled are indicated above the bars. Reefs sampled in 2018 are indicated on the month of sampling with an asterisk. nMDS plots of (dis)similarity of fish species presence/absence among reefs based are shown right (stress = 0.166), with reef abbreviations in colors indicating reefs in which this sound type was detected. Plots are repeated for each row (sound type) with colors assigned for that sound type. Colored bars and text from dark red to yellow indicate the relative call rates among reefs with > 0 calls, from high to low. Dark red = call rates in 100-75th percentile, red-orange = call rates from 50-74.9th percentile, orange = call rates from 25-49.9th percentile, yellow = call rates from 0-24.9th percentile, black = no calls detected on that reef.
Chirp-like sounds detected by template CL were observed on only two reefs, Br2 and Py9 (Figure 5C). This sound type appears similar to previously described damselfish chirps (Steinberg et al., 1965; Myrberg et al., 1993), occurred within diurnal hours as would be predicted from damselfish sounds (Steinberg et al., 1965), and was detected on reefs where cocoa damselfish were observed (Table 2) near the PAM recorder. Notably, however, though damselfish are the suspected sound source, their contribution to the composition and abundance of fishes observed from video at these two sites is low, and the sites are relatively divergent in terms of overall fish composition (Figure 5C nMDS plots) despite sharing these sound types.
Daily detections of grunt-like sounds (templates G1, G2, G3, G4, and G5) (Figures 5D, E, S6) varied by template, with some template sources detected on more reefs. For all these sound types, however, the Br1 site had the most detections. For these five sounds, some of the associated reefs show evidence of similarity in fish abundance and composition, as evidenced by clustering of some reefs with detections on the nMDS plots, but also detections on some dissimilar reefs (Figures 5D, E, S6).
Non-stereotyped low frequency sound events were detected on most reefs (Figures 6A, B, S7). These non-stereotyped low frequency sounds were never detected on Cp1 reef and only some templates were detected on Py2, Py3, Py8, and Cp3 (Figures 6A, B, S7). These low frequency sound events were associated with reefs with disparate patterns of fish composition (Figures 6A, B, S7). Stereotyped low-frequency pulses from LFP were detected on 11 different reefs, but were most common among reefs with similar species composition (Figure 6C).
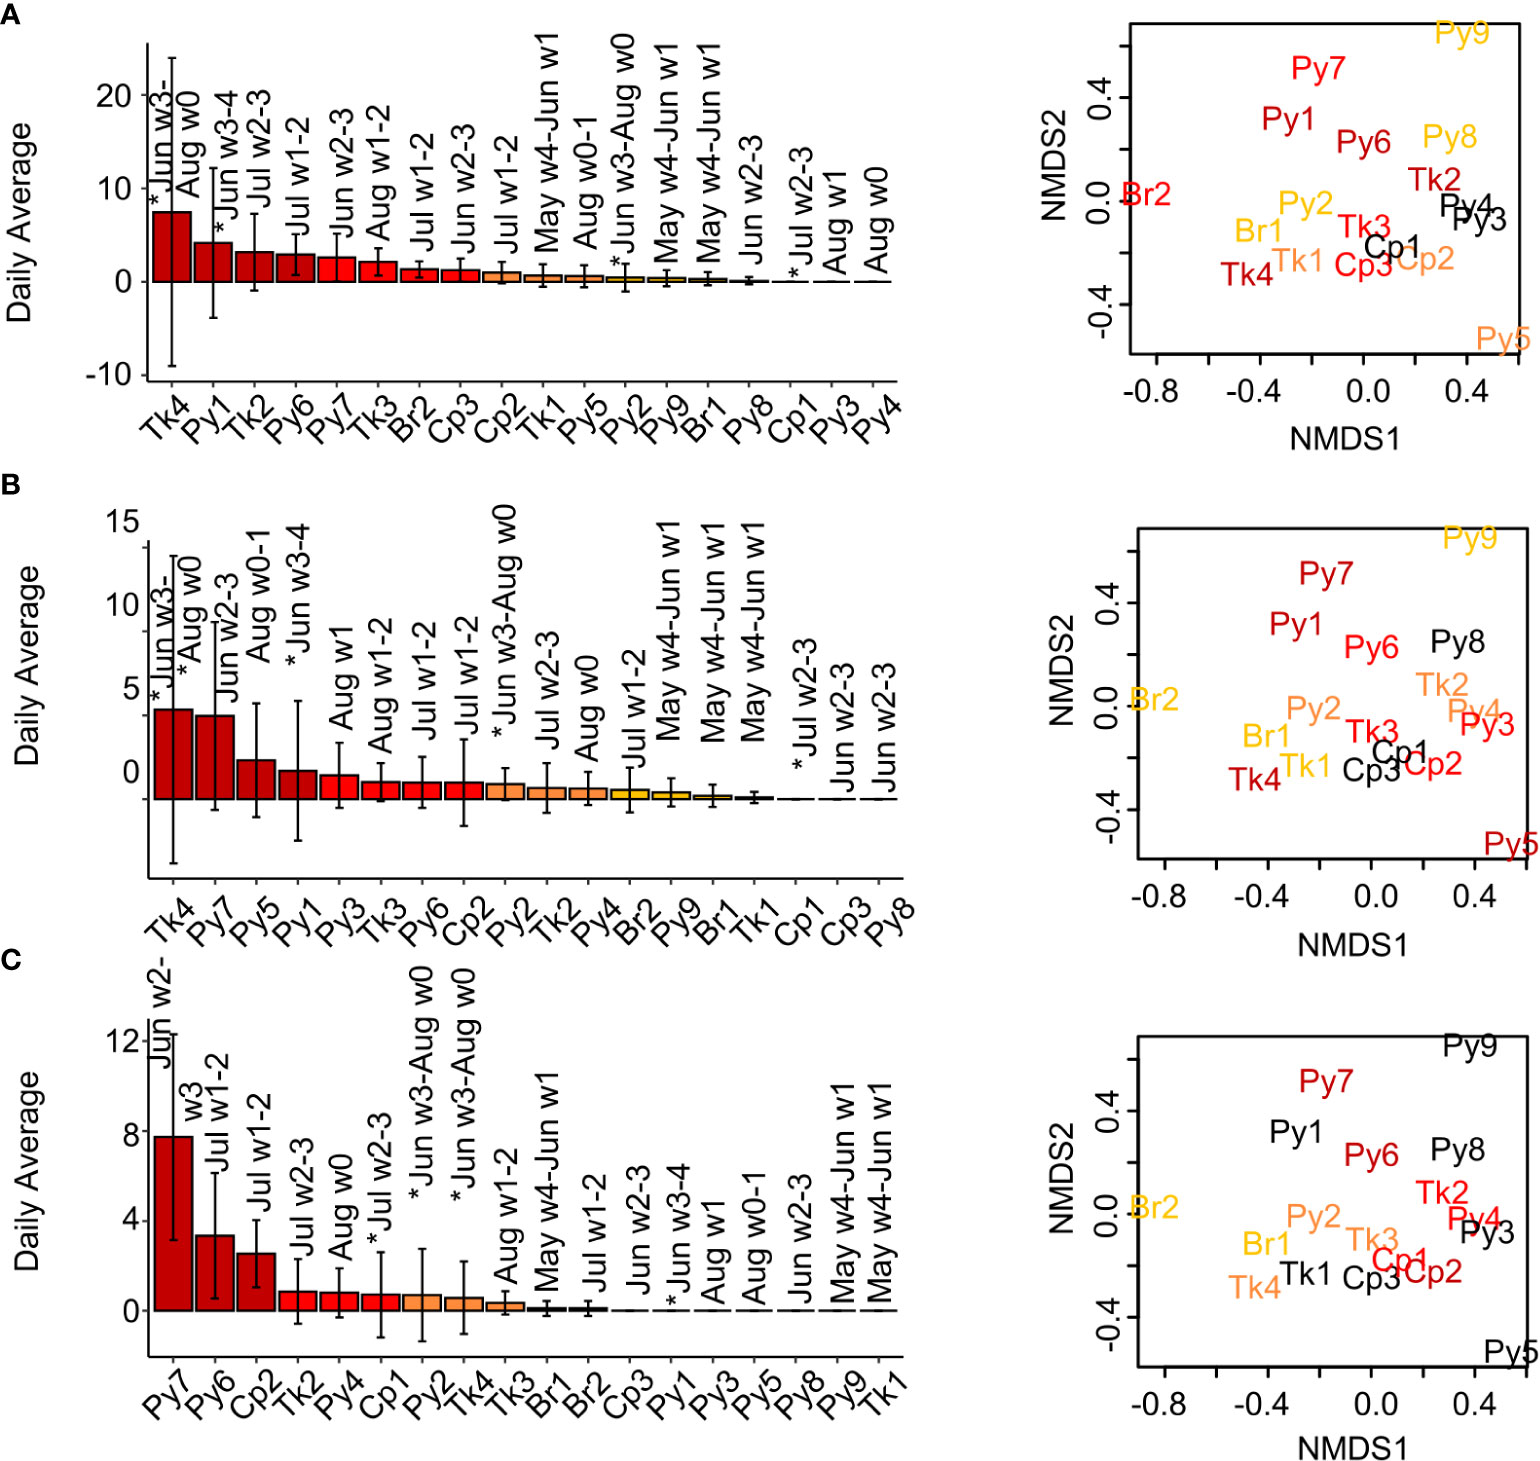
Figure 6 Daily low-frequency sound rates (average ± SD) among reefs and sound rate associations with fish species abundance and composition. Sounds detected by templates (A) LF1, (B) LF4, and (C) LFP. Month and week number (1-4) of the month the reef is sampled are indicated above the bars. Reefs sampled in 2018 are indicated on the month of sampling with an asterisk. nMDS plots of (dis)similarity of fish species presence/absence among reefs based are shown right (stress = 0.166), with reef abbreviations in colors indicating reefs in which this sound type was detected. Plots are repeated for each row (sound type) with colors assigned for that sound type. Colored bars and text from dark red to yellow indicate the relative call rates among reefs with > 0 calls, from high to low. Dark red = call rates in 100-75th percentile, red-orange = call rates from 50-74.9th percentile, orange = call rates from 25-49.9th percentile, yellow = call rates from 0-24.9th percentile, black = no calls detected on that reef.
Thud train sounds were detected on all reefs (Figure 7A). Reefs with the highest average daily detections tended to have similar patterns of fish abundance (Figure 7C, left nMDS plot) and presence/absence (Figure 7C, right nMDS plot).
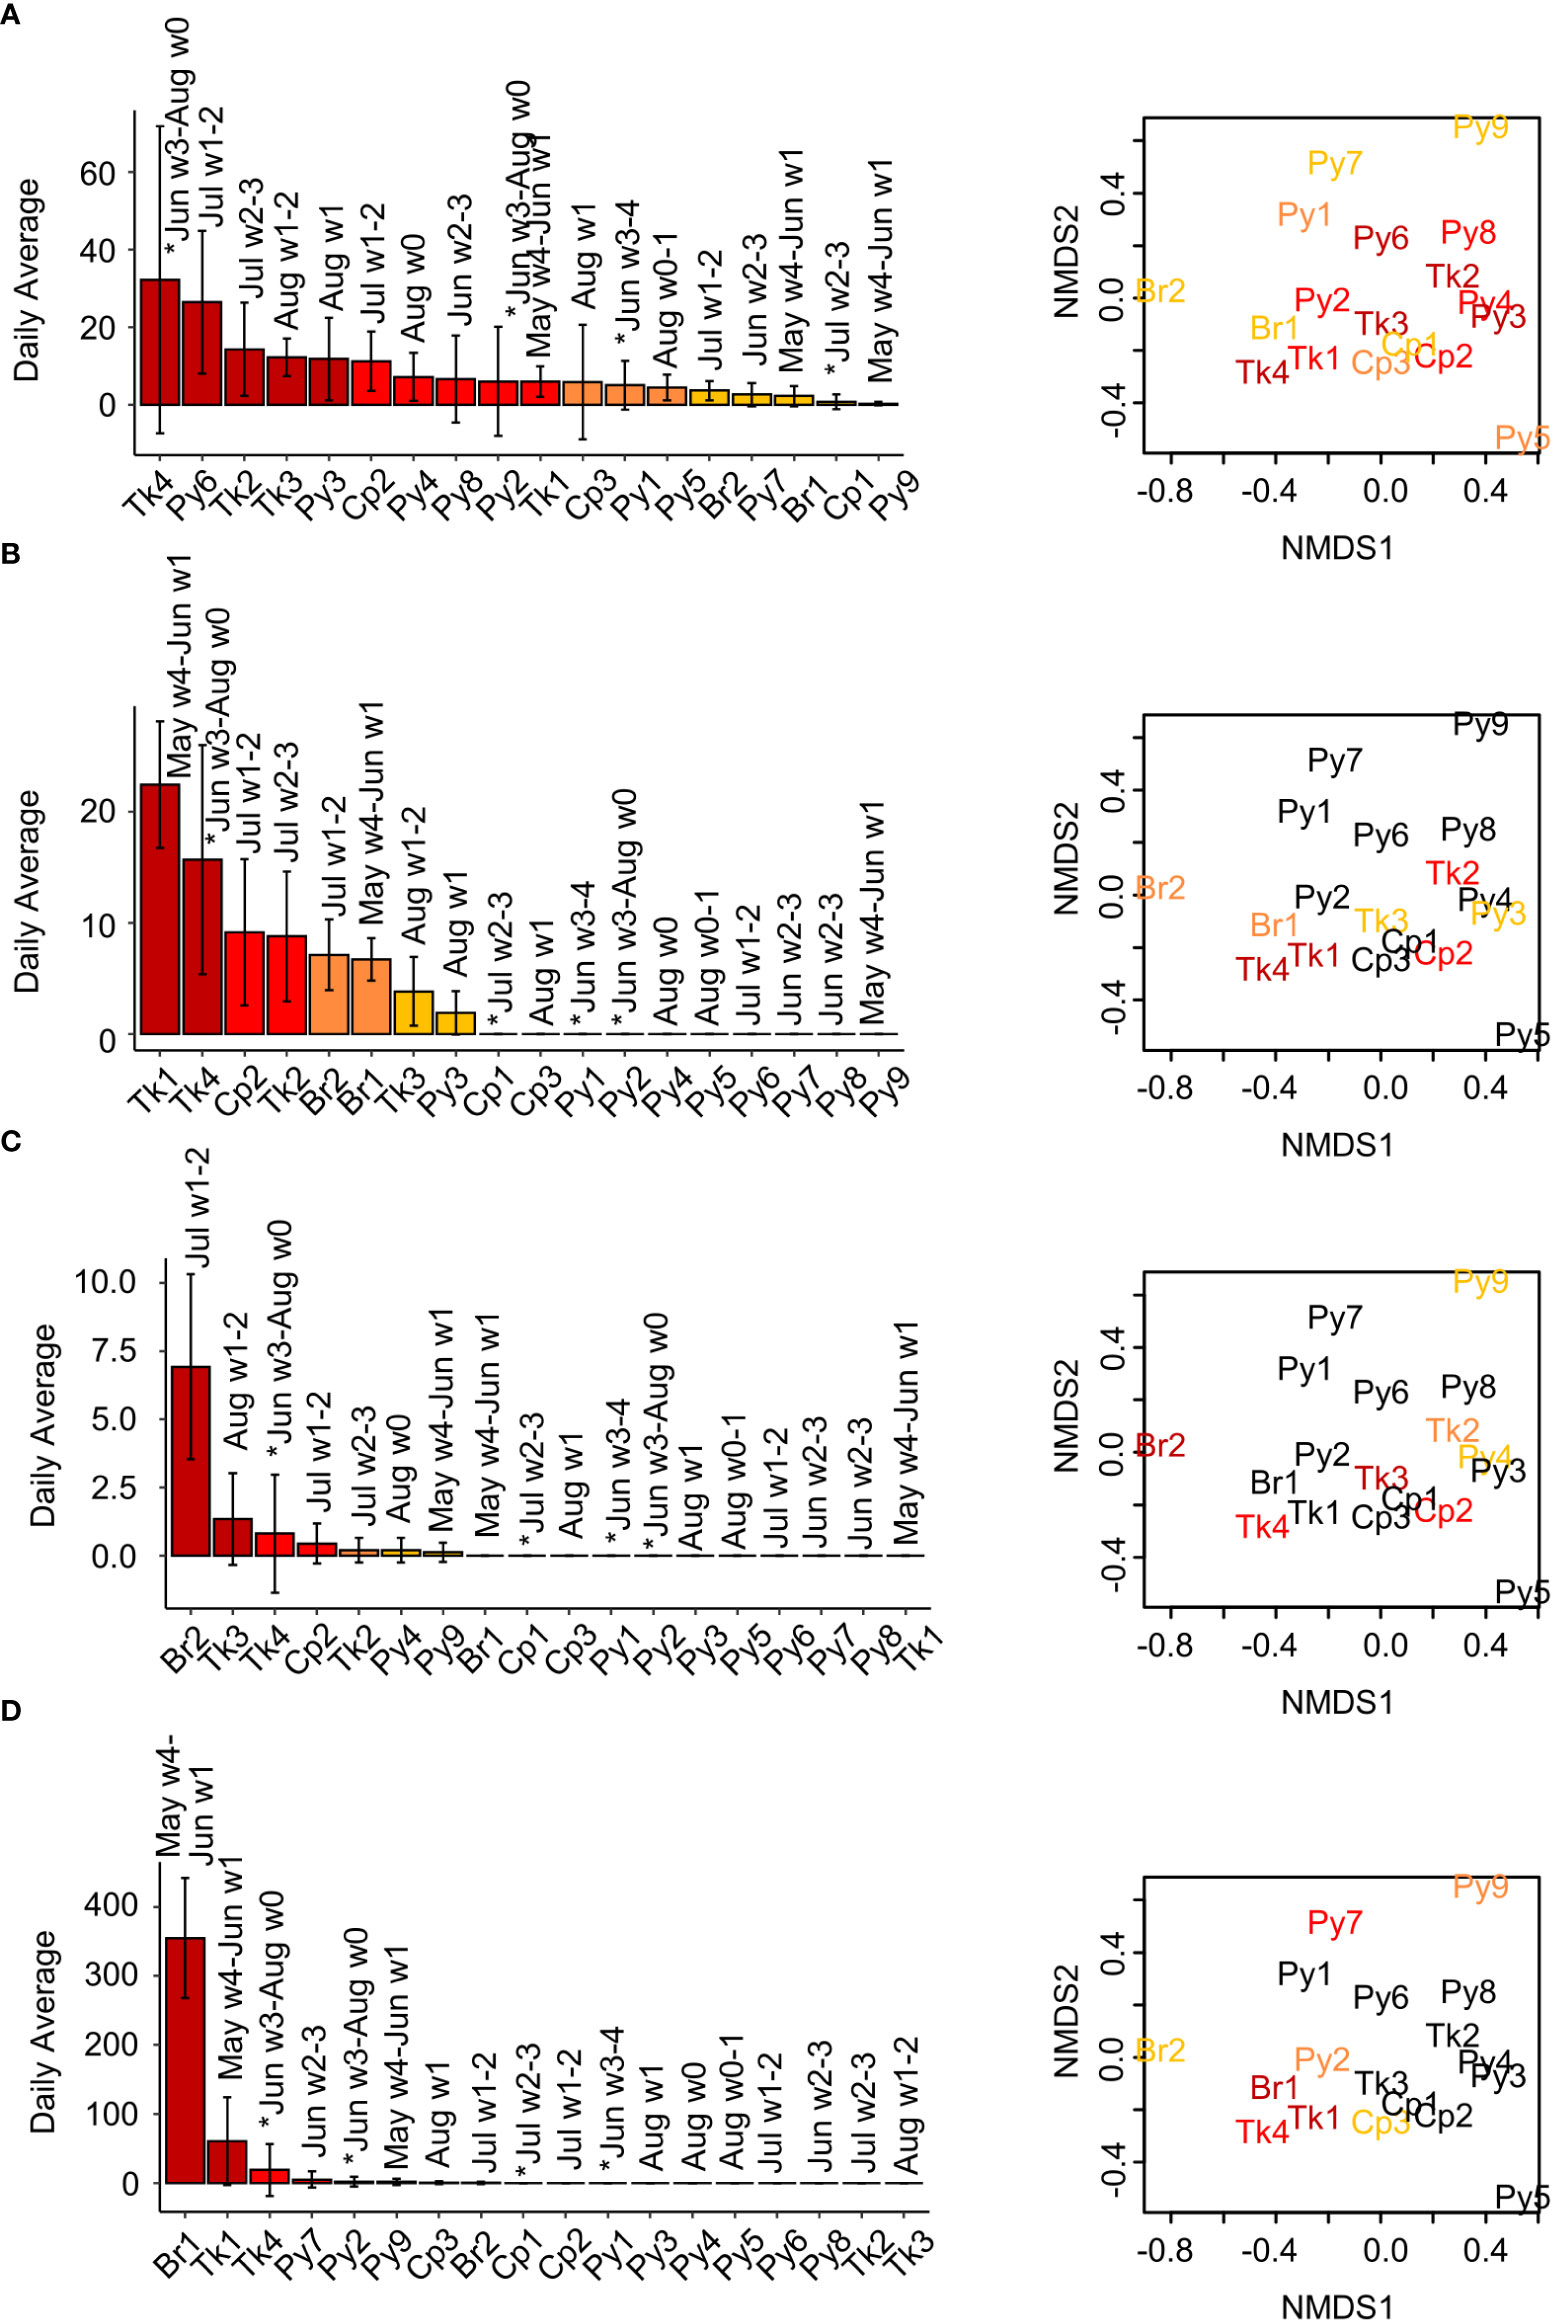
Figure 7 Daily call rates (average ± SD) among reefs and call rate associations with fish species abundance and composition. (A) Thud sound, (B) knock-train sound, (C) Harmonic sound, and (D) leopard toadfish boatwhistle call rates. (B) Daily averages of knock-trains come from accidental detections using a custom routine intended to detect thud sounds. Month and week number (1-4) of the month the reef is sampled are indicated above the bars. Reefs sampled in 2018 are indicated on the month of sampling with an asterisk. nMDS plots of (dis)similarity of fish species presence/absence among reefs based are shown right (stress = 0.166), with reef abbreviations in colors indicating reefs in which this sound type was detected. Plots are repeated for each row (sound type) with colors assigned for that sound type. Colored bars and text from dark red to yellow indicate the relative call rates among reefs with > 0 calls, from high to low. Dark red = call rates in 100-75th percentile, red-orange = call rates from 50-74.9th percentile, orange = call rates from 25-49.9th percentile, yellow = call rates from 0-24.9th percentile, black = no calls detected on that reef.
Knock train sounds were not detected on all reefs (Figure 7B and S8). Both knock train detection methods detected similar relative occurrences among reefs, though accidental detections from the thud train detection routine localized a greater absolute number of events (as described previously). Knock-trains were detected on all tank and bridge reefs sampled, but just one coop (Cp2) and one pyramid (Py3). Knock-train detection occurred on reefs with variability in (dis)similarity of fish abundance patterns (Figure 7B, S8: left nMDS panels). Reefs with knock trains, however, were similar in terms of presence/absence, moderate to low scores on nMDS axis 2 (Figures 7B, S8: right nMDS panels). However, some reefs with similar fish composition lacked knock-train detections: Cp1, Cp3, Py2, and Py4 (Figures 7B, S8).
Harmonic sounds were detected on all reef types, but only on seven reefs (Figure 7C). Reefs where harmonic sounds were detected were not very similar in terms of fish abundance or presence/absence (Figure 7C).
Leopard toadfish boatwhistle sounds were detected on all reef types and eight reefs (Figure 7D). Detection rates among reefs were quite variable, with far more detections on Br1 (Figure 7D). In addition, there were relatively high detections on Tk1 and Tk4 (Figure 7D). Some of the detections on recordings from other reefs appeared to be much lower amplitude, and perhaps were detections of reefs from a great distance. Detections of leopard toadfish boatwhistle sounds were higher early in the summer (May and June) (Figure 7D). Leopard toadfish boatwhistles were detected on reefs that varied in terms of fish species abundance and composition (Figure 7D). This observation demonstrates that this common sound, which averaged over 300 occurrences per day on Br1, comes from a source that was rarely observed (only one time at Tk4, Table 2) and thus does not directly contribute to patterns of fish composition and abundance (unless there are associations of leopard toadfish presence with other fish species that are not cryptic). The single leopard toadfish video observation in this study was accompanied by a typical boatwhistle which confirmed the source sound type hypothesized by Wall et al. (2012, 2013).
Thirty-six fish species were observed among reefs over the course of the study (Table 3). The top ten most abundant species (most-to-least) based on MaxNO relative abundance estimates were forage fishes (like round scad), red snapper, tomtate, lionfish, gray triggerfish, greater amberjack, Atlantic spadefish, regal damselfish, whitespotted soapfish, and cubbyu (Table 3). The relative abundance and occurrence of species, however, was variable among reefs (Table 2). The top nine most frequently observed fish species based on presence absence were red snapper, lionfish, gray triggerfish, tomtate, whitespotted soapfish, cubbyu, greater amberjack, gray snapper, and forage fish. After those species, Atlantic spadefish, blue angelfish, cocoa damselfish, and sheepshead were all observed with equal frequency.
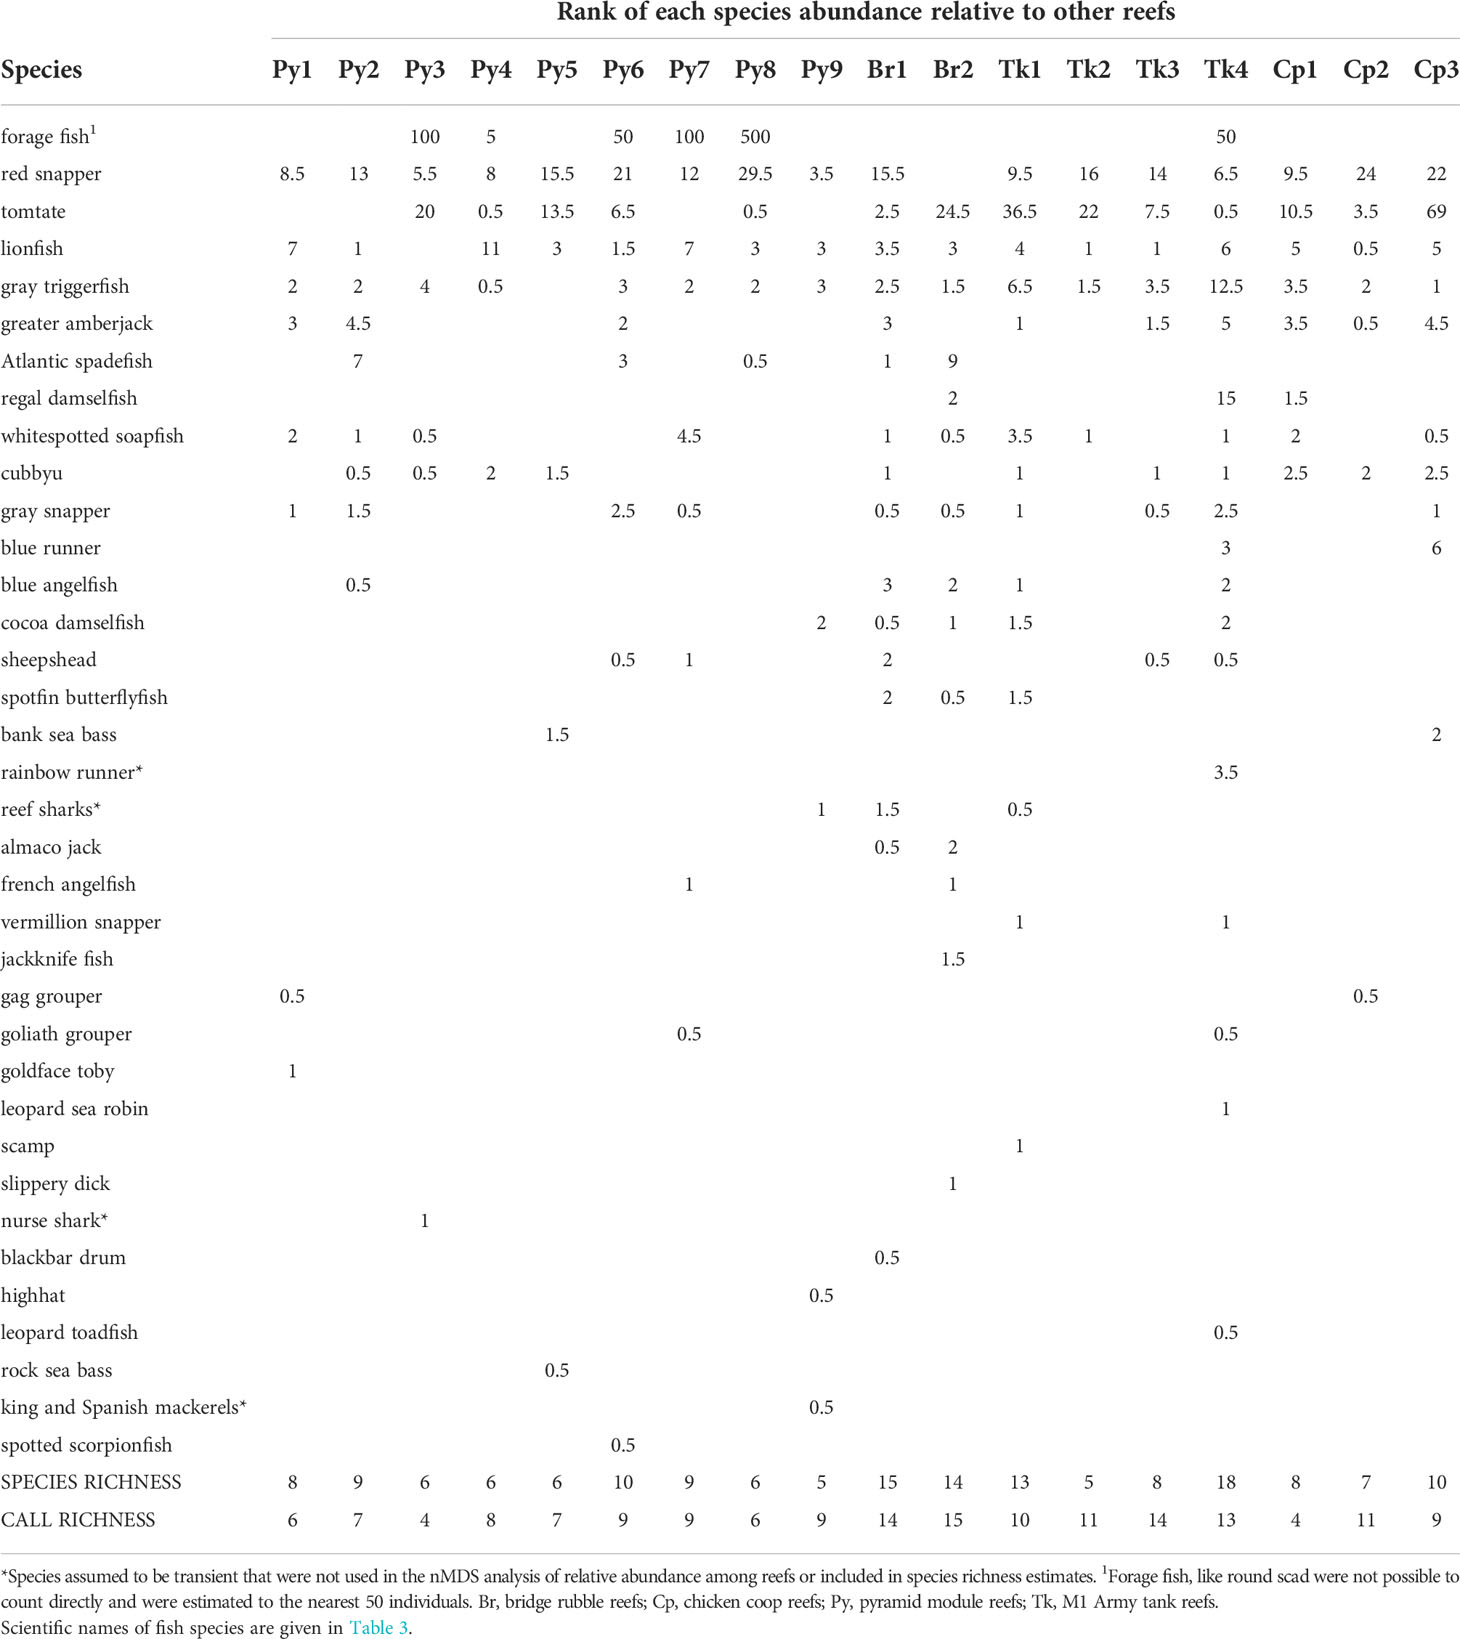
Table 2 Fish abundance on reefs (MAXNO, maximum number of fish observed in a single video frame, ranked from highest estimated relative abundance 1, to lowest), fish species richness, fish species diversity, fish sound call richness, and fish sound call diversity.
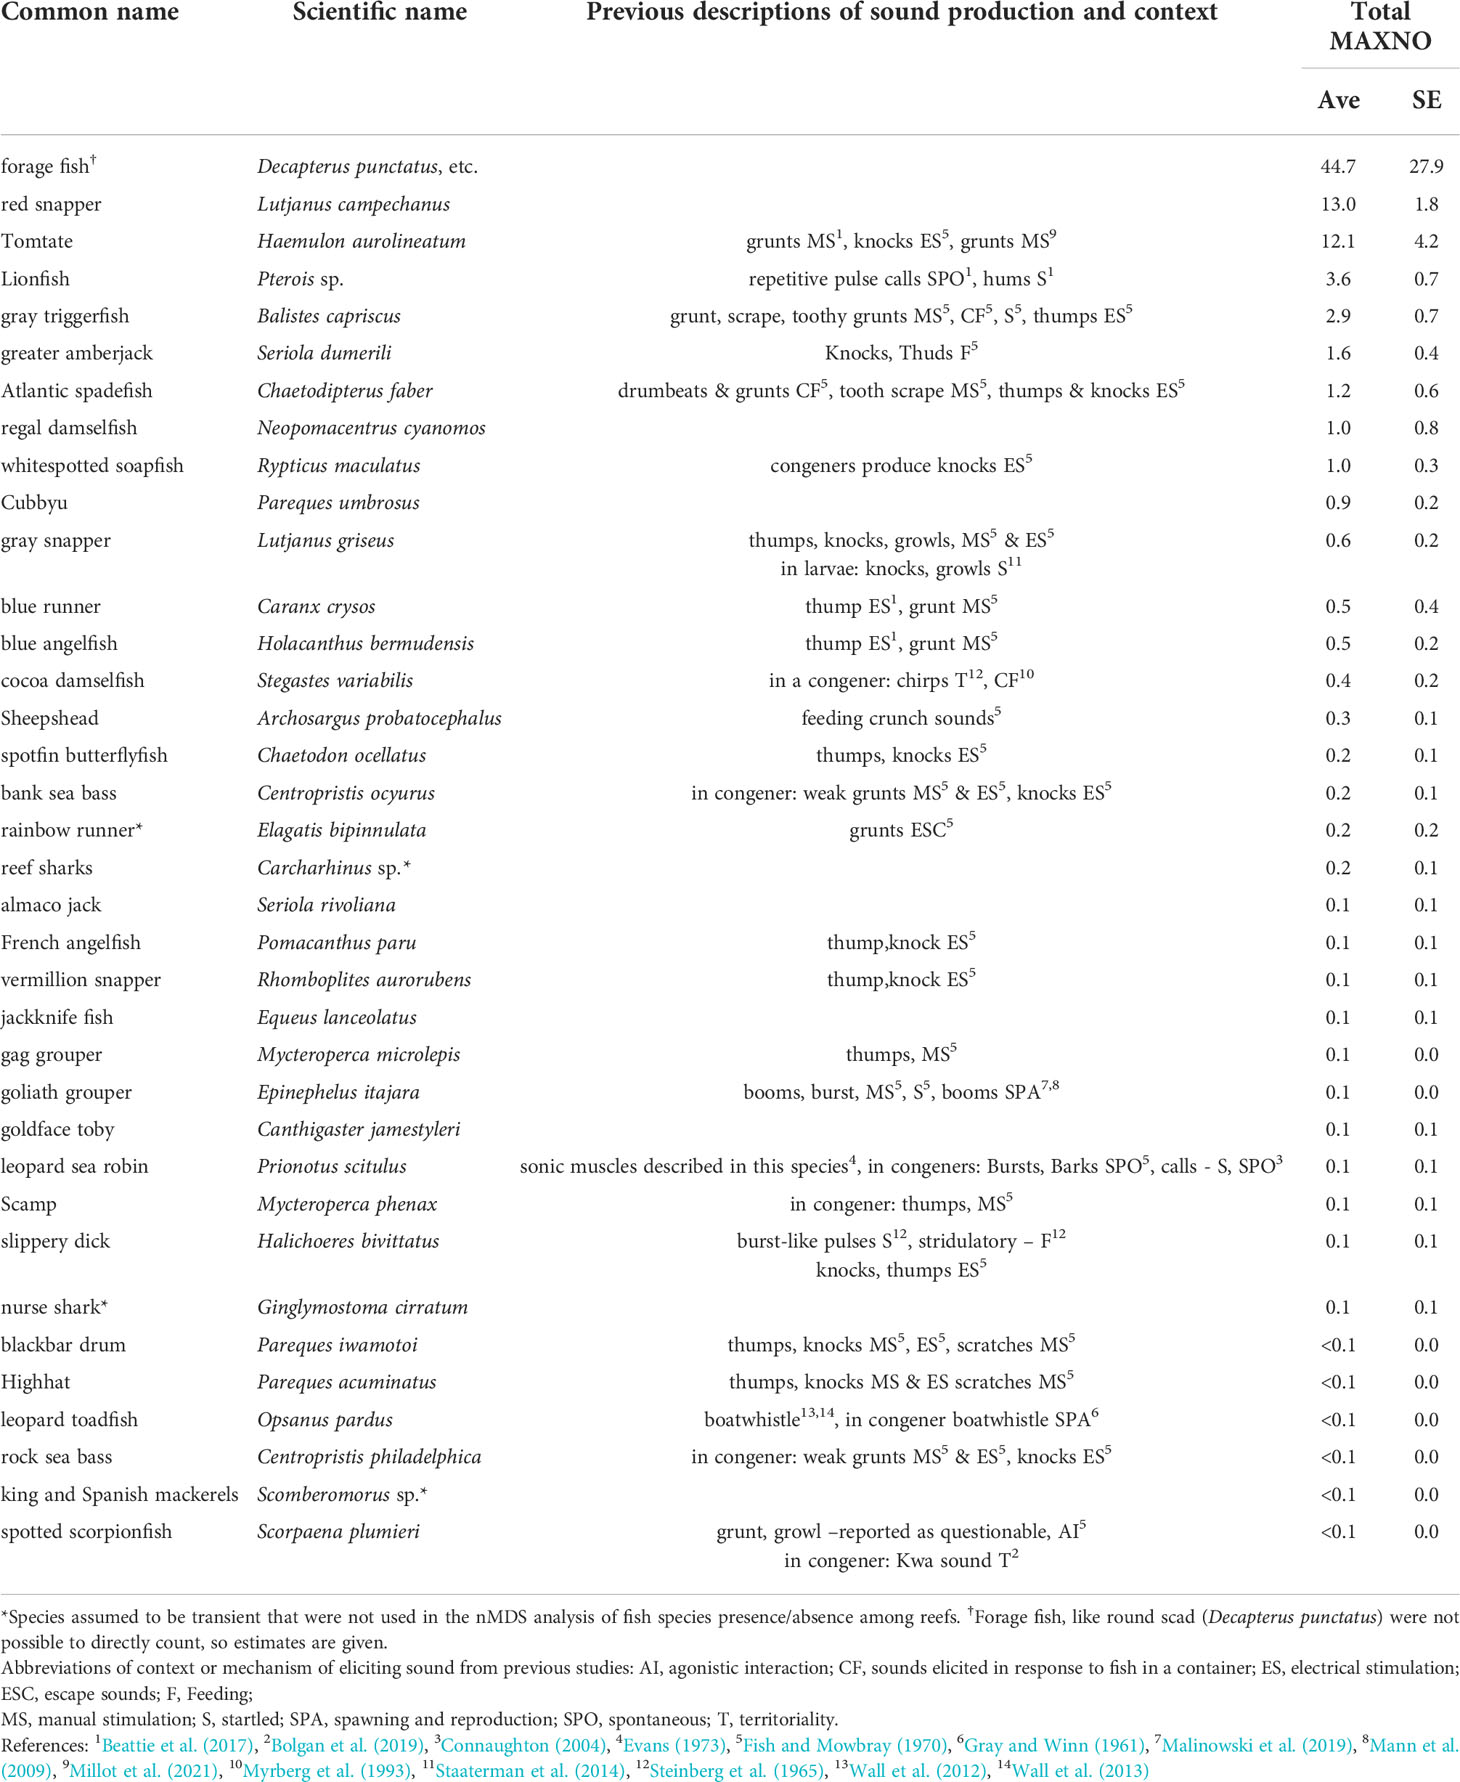
Table 3 Fish species estimated relative abundance (MAXNO, maximum number of fish observed in a single video frame) among artificial reef sites.
Correlations between sound detection rates among reefs and species presence do not appear to indicate the source of sounds (Table 4). For example, for some sound types in which multiple templates were used for detections (pop-like sounds, grunt-like sounds), templates differed in which species had the highest correlation with detections (Table 4). For known sound types, chirp-like damselfish sounds and leopard toadfish boatwhistles, detections were correlated with other species (Table 4). Thus, caution is needed when considering fish species presence from video for generating sound source species hypotheses. Such an association in this case is either from chance or because blue angelfish and cocoa damselfish were often observed on structurally complex artificial reefs that also had leopard toadfish. Low-frequency, non-stereotyped sound templates had highest associations with six different species (Table 4), but because the templates produced from sounds that showed low repeatability, they were not expected to be associated with a single source species. Because thud train sounds were present on all reefs, correlation analysis between the presence/absence data of sounds and fish was not possible. The highest number of thud trains was observed at Tk4, which had a high number of gray triggerfish observed. The site with the second highest gray triggerfish observed, Tk1, however, did not have exceptionally high numbers of thuds and thus it is not clear that this is an obvious candidate for this sound type.
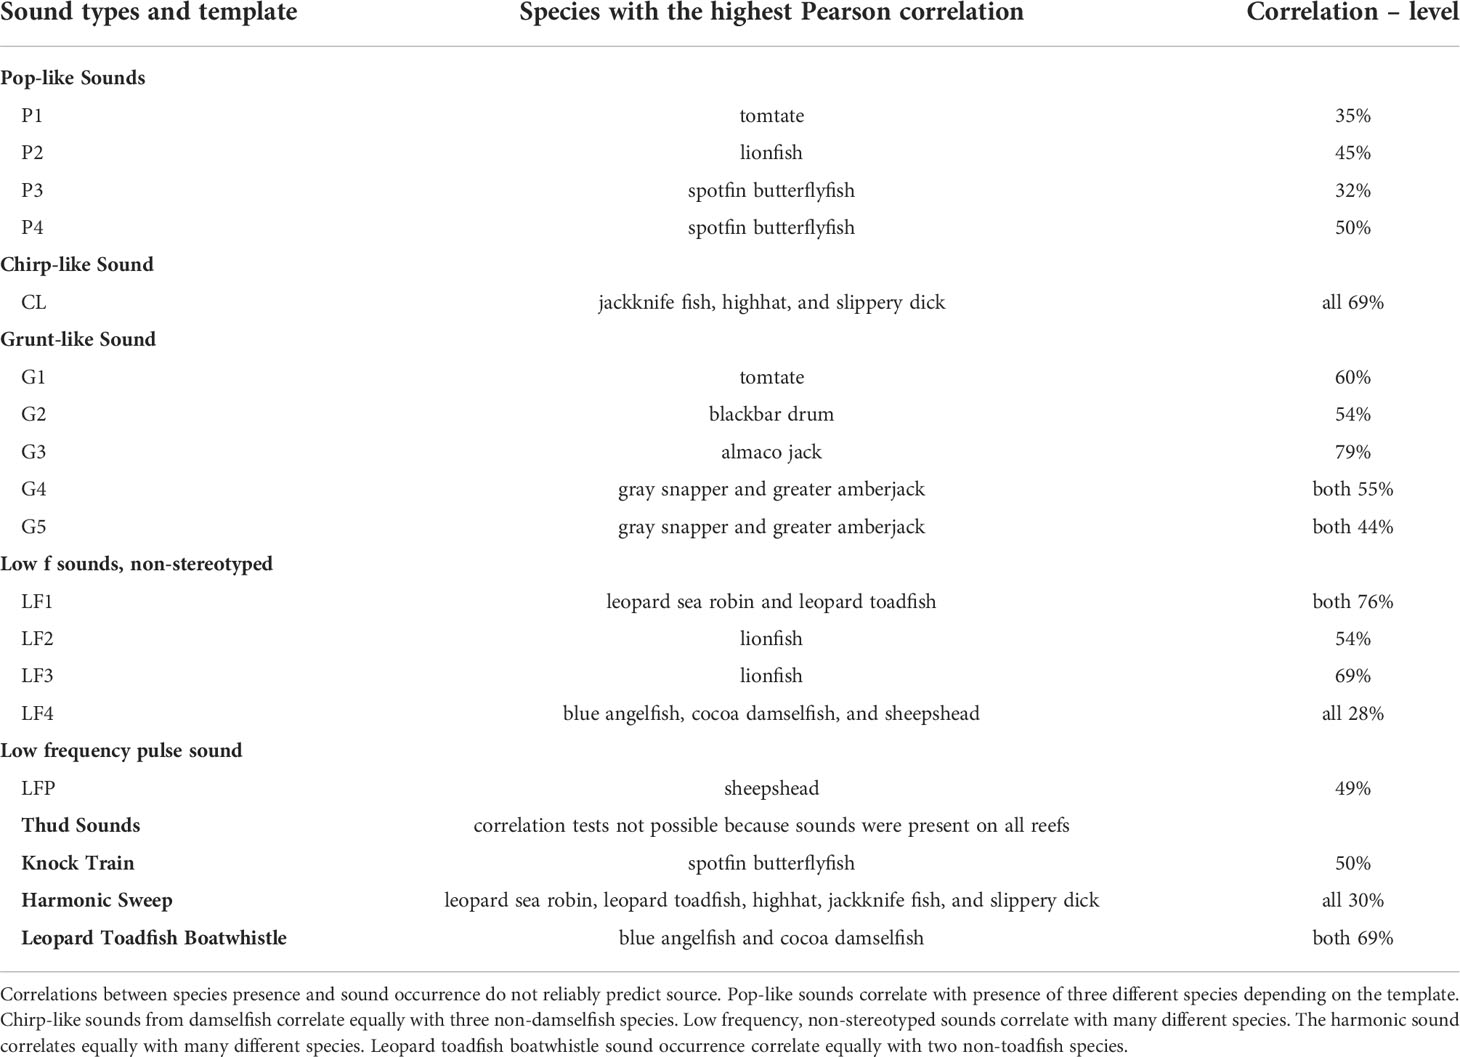
Table 4 Associations between sound types among reefs and species presence (Pearson correlation).
The BIOENV procedure indicated that non-stereotyped, low-frequency sounds were the sound type most associated with fish composition among reefs (Mantel correlation r = 0.233, permutation test P = 0.035).
Among reefs, fish species richness and call type richness (Table 2) were positively correlated (r = 0.59, t = 2.93, df = 16, p = 0.010). Shannon-Wiener indices of species and call diversity among reefs, however, did not correlate greater than would be expected by chance (r = 0.25, t = 1.05, df = 16, p = 0.312).
Longer-term deployments of recorders at two reefs in 2018 provided the opportunity to examine temporal changes in call occurrence for several calls at two sites (Figure 8). These observations indicate variation in temporal patterns of call detection at sites. Over the 43-day period, leopard toadfish calls varied considerably, with detections at Tk4 peaking in early July, then ceasing until late July when they were detected sporadically on one day and then in a three-day cluster from 28-30 July (Figure 8A). Notably, leopard toadfish call detection was much lower over the same period at Py2, but also followed a different pattern with detections peaking on the 25 June deployment date, with little activity until a slight increase after the peak of leopard toadfish activity was observed at Tk4 (Figures 8A, B). In addition, there were few detections of sounds at the Py2 site in comparison to Tk4, and the sound intensity of leopard toadfish sounds at Py2 indicate that the fish may have been located at a distance from the reef. Peak activity of leopard toadfish calls at either site did not follow a lunar pattern (Figures 8A, B). Knock trains at Tk4 showed a relatively steady rate of detection over the 43-day period, with no obvious lunar periodicity (Figure 8C). Harmonic sounds at Tk4 showed only a few sporadic detections from July to August (Figure 8D). Thud sounds were detected throughout the 43 day period at Tk4 (Figure 8E), but with much greater frequency around the last quarter moon in the beginning of July, over roughly the same period as when leopard toadfish calls were most abundant at that site (Figure 8A). Thud sounds, however, did not occur with high frequency in early August with the next last quarter moon (Figure 8E) and, at Py2, thud sounds were less frequent and peaked before the new moon on 11 July (Figure 8F).
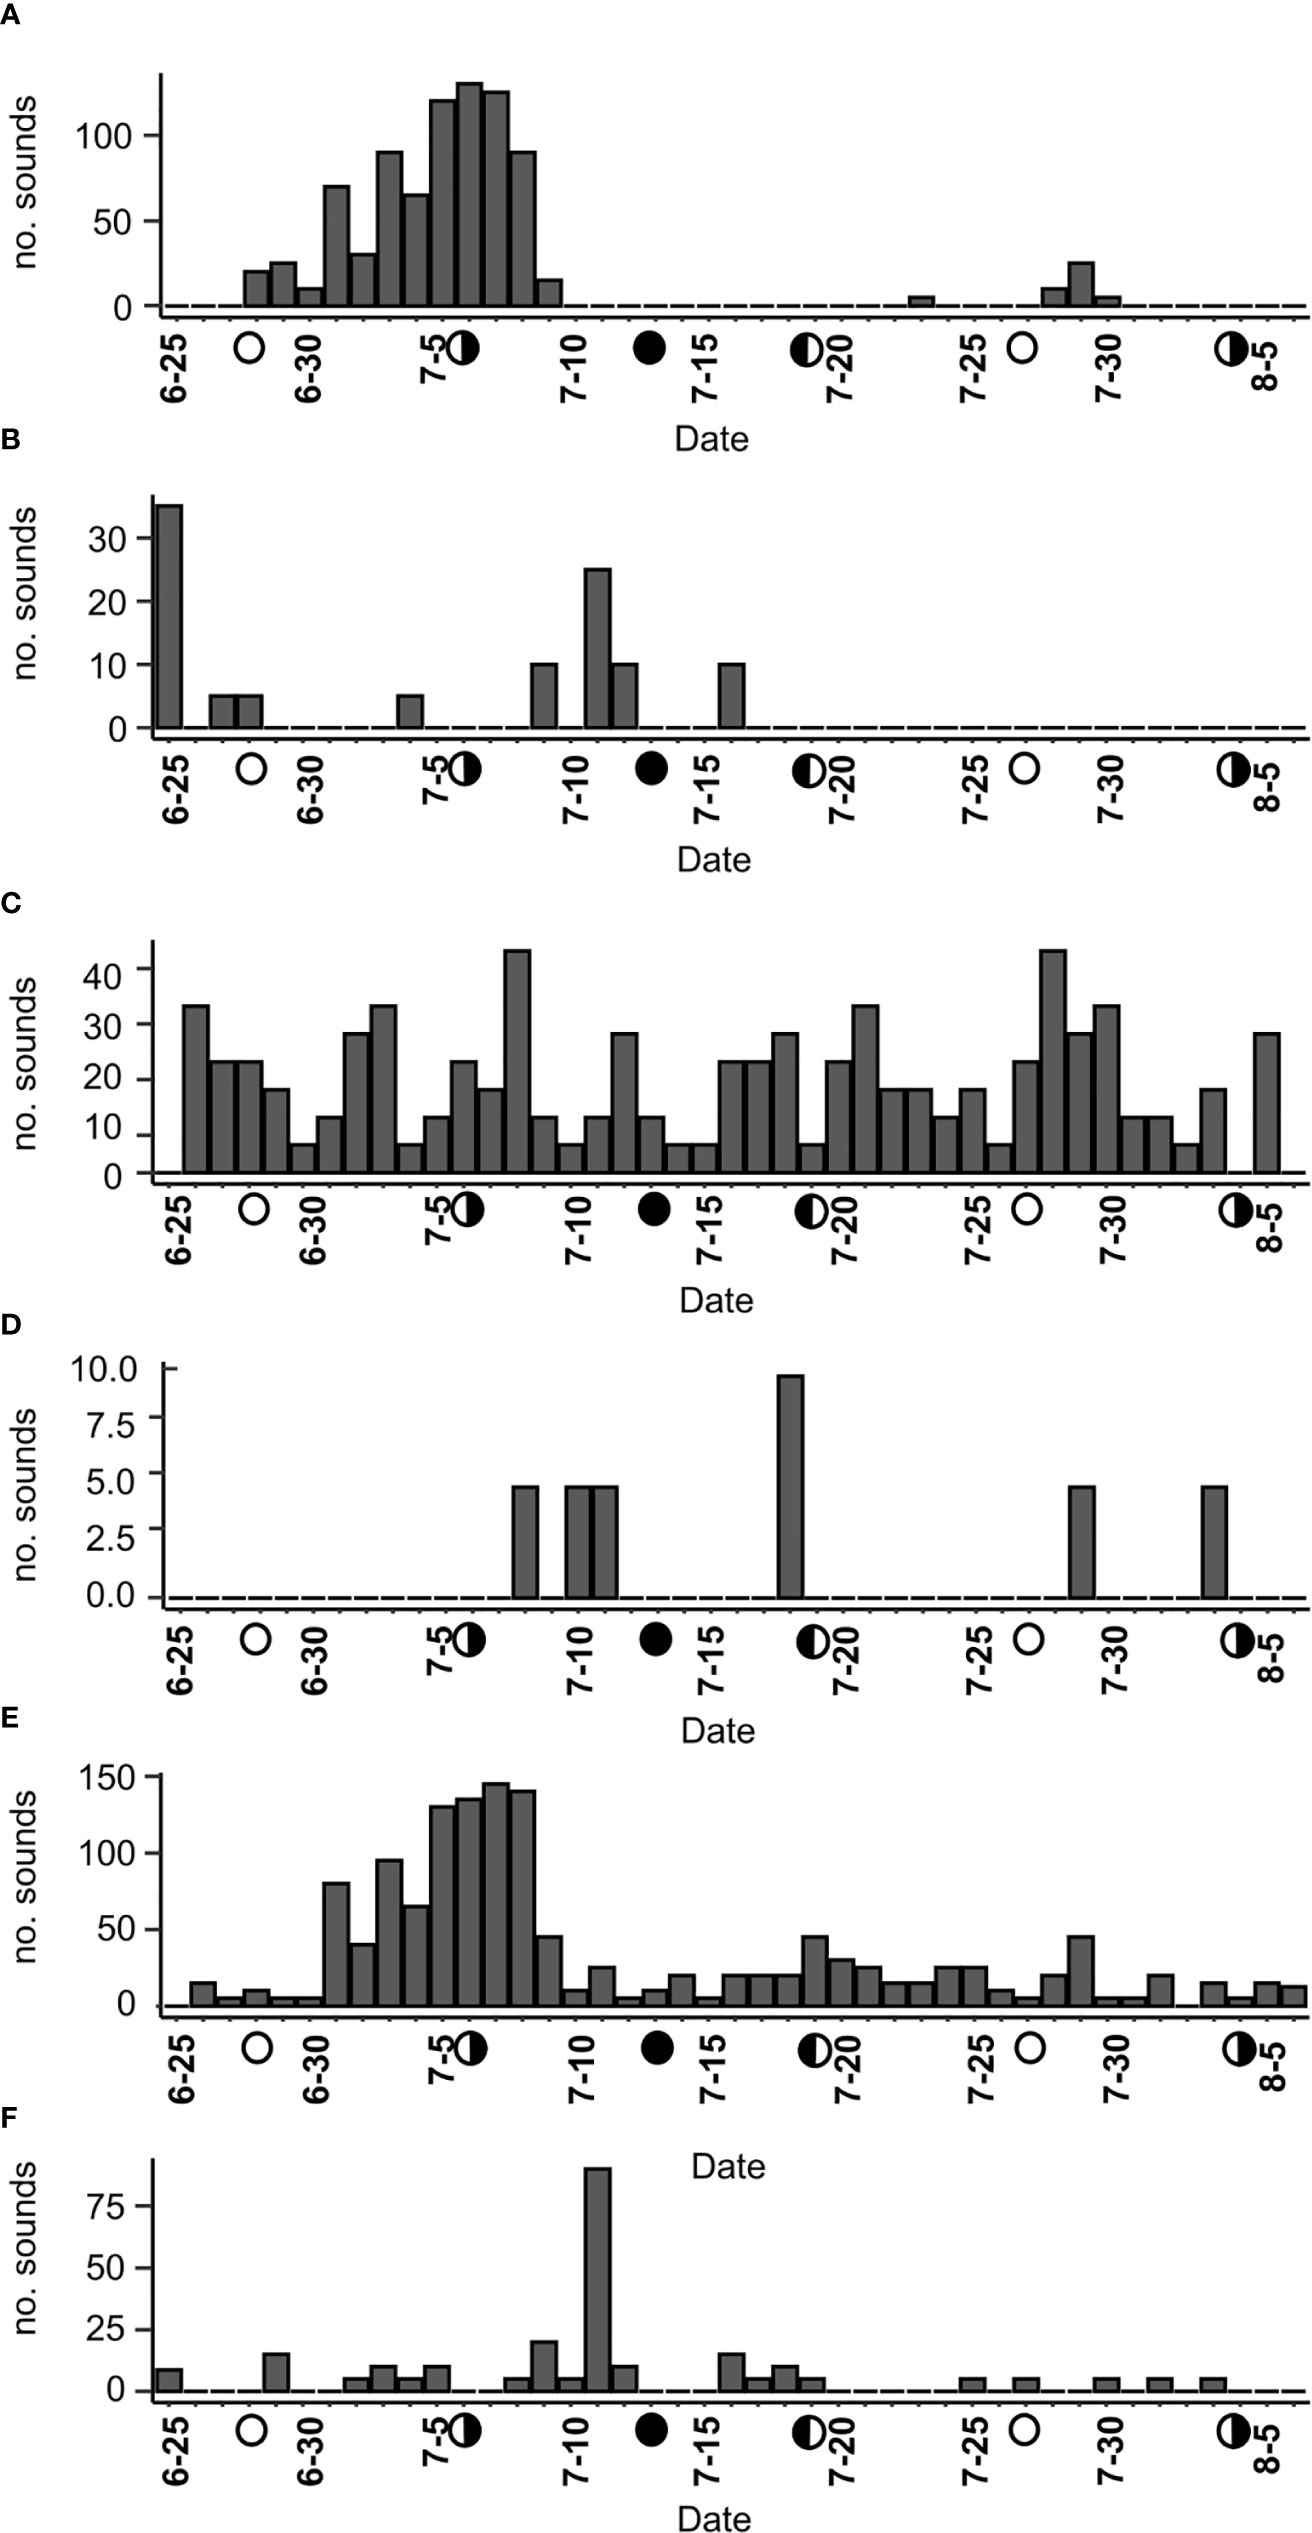
Figure 8 Longer term daily sound events from two sites in 2018. (A) Leopard toadfish boatwhistles from Tk4, (B) leopard toadfish from (Py2), (C) knock trains from Tk4, (D) Harmonic sounds from Tk4, (E) thud sounds from Tk4, and (F) thud sounds from Py2. Detections are adjusted for duty cycle and incomplete days on deployment. Lunar phase is shown with symbols on X-axes.
Sound pressure levels at reefs were highest in the evening, with a peak that tended to occur just after dusk (Figure 9; Table S1). On average, the median SPL levels in the day were approximately three dB below evening median SPL levels (Table S1). SPL levels among reefs varied by over 20 dB (Table S1). Notably, SPL levels were highest in 2018 with all four reefs (Tk4, Py2, Py1, Cp1) being higher than all reefs recorded in 2017 (Figure 9; Table S1). Sites Py8 and Br2 in 2017, also had high SPL levels (Figure 9; Table S1). Intense SPL is evident on 20 June 2017, especially at Py8, where rain and thunder could be heard on evening recordings. Intense rain also occurred at Py4 and Py5 on 03 August 2017 (Figures 9, S9–12). High frequency, 5000 Hz, was typically higher in intensity than lower frequencies at night, as evidenced from median PSD values (Figure S12). A 5000 Hz band of evening noise was evident and similar to the 6 kHz sound observed in the northern Gulf of Mexico (Wall et al., 2013).
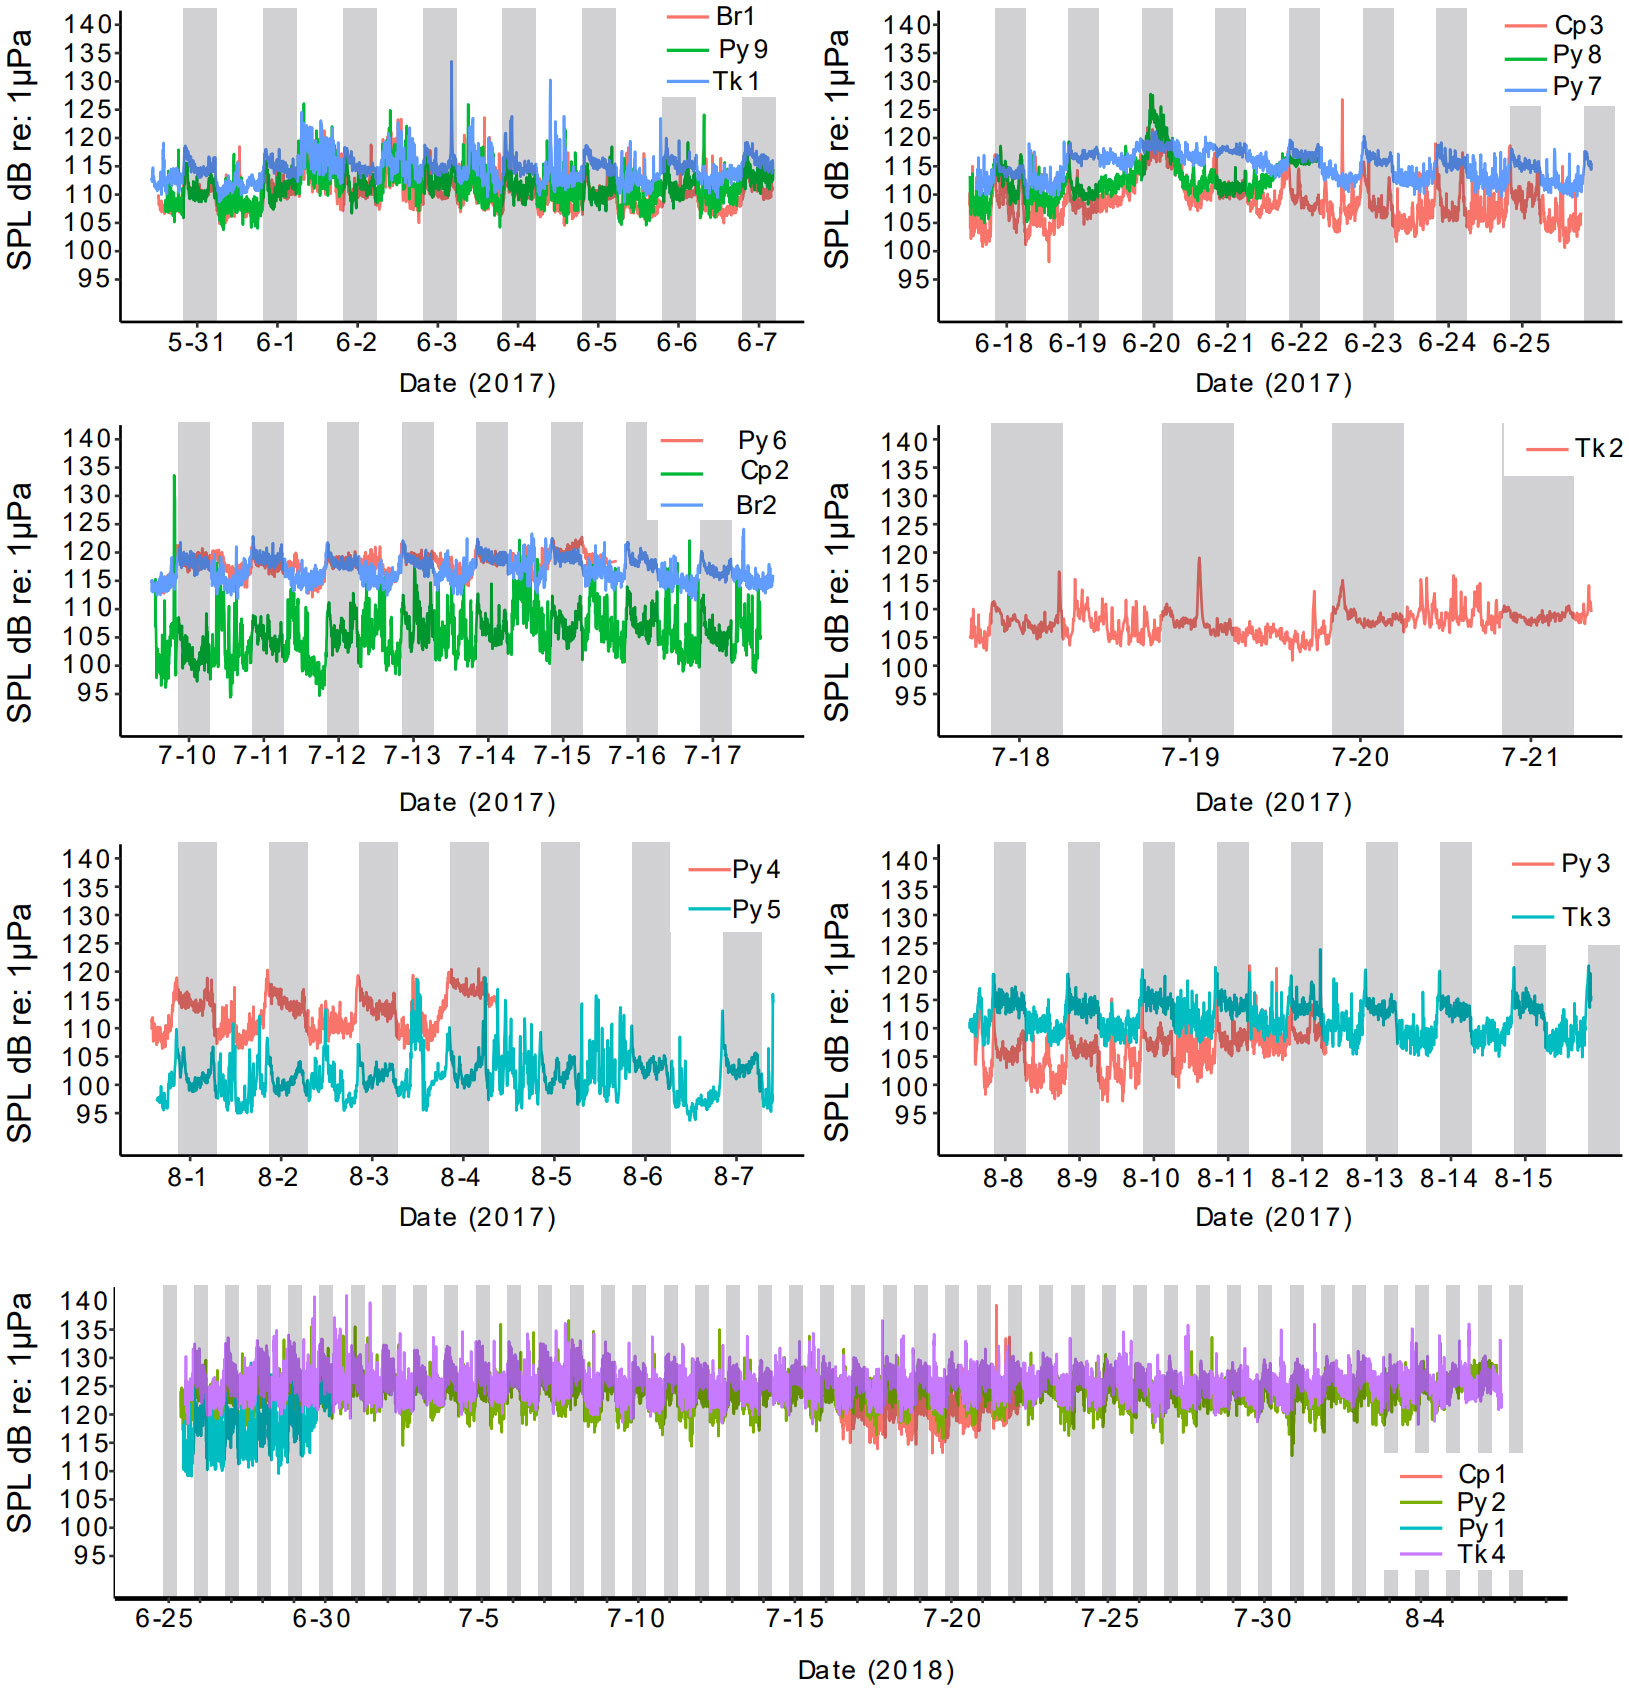
Figure 9 Sound intensity (SPLRMS dB re 1µPa) over time at artificial reef study sites. Reefs recorded during the same period are shown on the same subplot. Gray bars indicate evening hours.
Day and night-time SPLRMS levels were positively correlated with fish species richness, except for night-time SPLRMS 95th percentile values, (Table 5). Vessel presence was also positively correlated with day and night-time SPLRMS values.
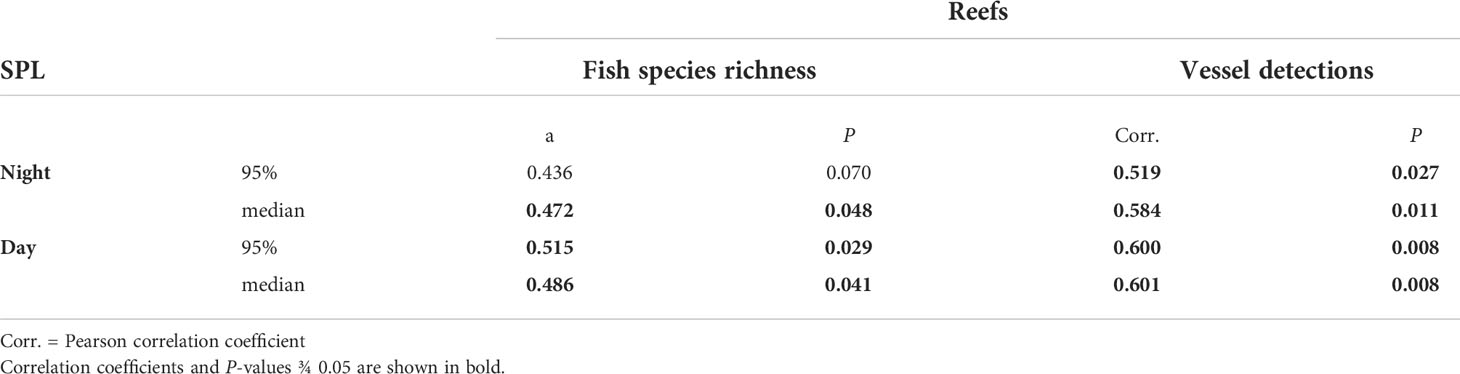
Table 5 Pearson correlation tests between SPLRMS (median and 95th percentiles) and fish species richness among reefs and between SPLRMS and vessel presence [daily detections of idling boats among reefs from Boyle et al. (2022)] among reefs.
Chatter of sounds that appeared similar to cusk-eels (Mann et al., 1997; Kever et al., 2015; Mooney et al., 2016) was evident in the evenings from 01 August 2017 to 15 August 2017, with a strong peak at dusk and continued activity from PSD values of 1200 Hz. We were not successful using TDXC detection algorithms for choruses of this sound type (Figure 10A). In the evening, initial isolated calls quickly appear to form complex choruses (Figure 10B) from multiple sounds. These sounds were evident at sites Py4, Py5, Py3, Tk3 and especially intense at Py3 and Tk3 (Figure S11).
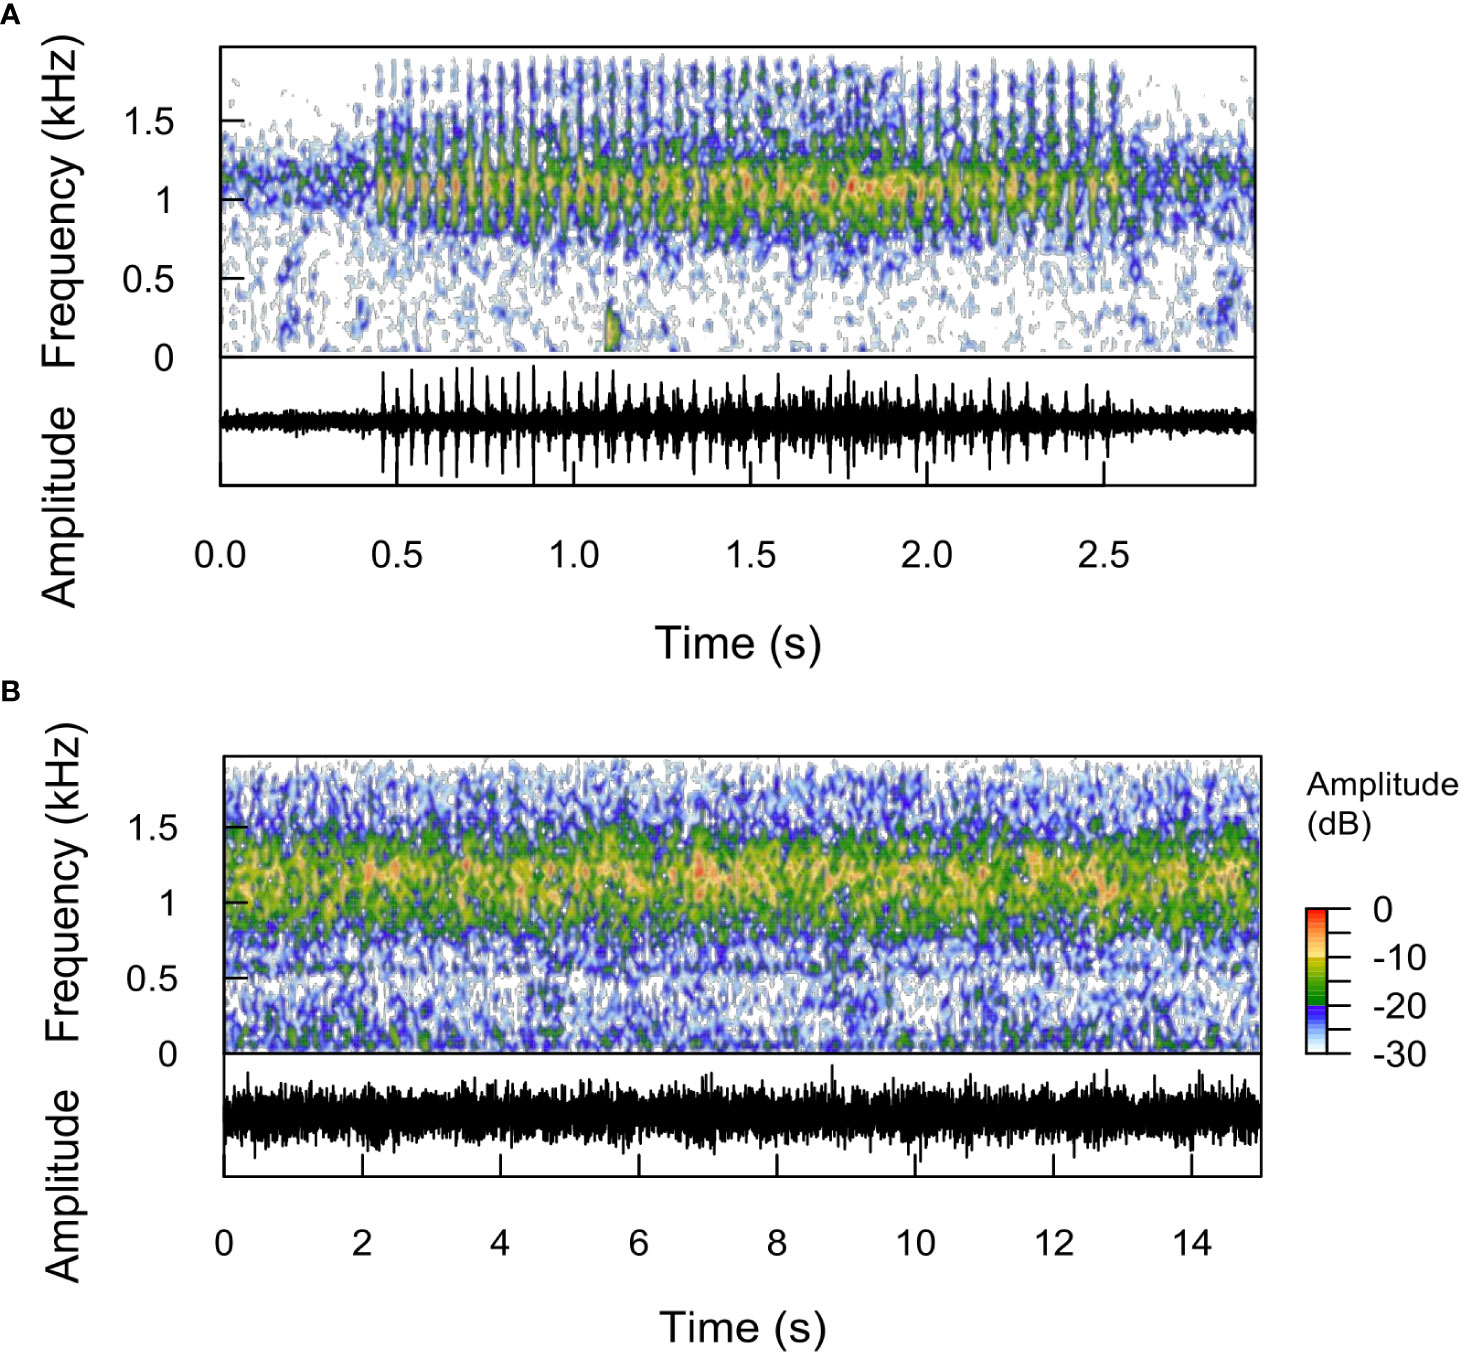
Figure 10 Putative cusk-eel (A) chatter calls and (B) chorus. Spectrogram and corresponding oscillograms are shown. Putative cusk-eel chatter sounds have many high frequency pulses (~25 per second). (A) Two putative calls, overlapping and in succession. At ca. 1.9 s, the second call, with lower pulse amplitudes and pulses that do not extend as high in frequency are evident. After sunset, (A) isolated calls quickly begin to overlap in time and form a (B) chorus with most energy concentrated between 900-1500 Hz. Chorus intensity began to wane at ca. 22h.
Our study described complex biological soundscapes on artificial reefs in the nGOM during late spring and summer. Sounds include stereotyped signals and non-distinctive low-frequency sounds that vary over the diel cycle. Rates of sound detection varied among artificial reefs, which is predicted to be related in part to differences in the composition and abundance of soniferous fishes. We observed a positive correlation between the number of sound types detected among reefs and observed fish species richness. For sound types from both known and unknown sources, however, attempting to identify sound source species based on the co-occurrence between species and sounds among reefs was not reliable. Some of the observed sounds are consistent with previous descriptions of sounds (leopard toadfish, damselfish Stegastes spp., and cusk-eels [Ophidiidae]), however, the sources for many of the sounds that were common on some reefs remain unknown.
Several stereotyped sound types observed in this study showed strong nocturnal biases: pops, knock trains, harmonic sounds, leopard toadfish boatwhistle sounds, and putative cusk-eel chatter sounds. Oyster toadfish (Opsanus tau) in Maryland, U.S.A. also showed peak activities prior to sunrise and after sunset (Ricci et al., 2017), however, leopard toadfish detections in this study showed a stronger nocturnal bias. Toadfish grunt sounds were not observed in this study. Grunt sounds have been attributed to agonistic behavior and unknown contexts based on spontaneous occurrences in oyster toadfish (Gray and Winn, 1961; Maruska and Mensinger, 2009). In gulf toadfish (O. beta), grunts have been interpreted as an agonistic call and can also occur at the beginning of a boatwhistle (Thorson and Fine, 2002). In a previous study, initial grunts at the beginning of boatwhistles were observed for O. beta but not O. pardus (Wall et al., 2013). It is possible that grunts occurred during our study and were not identified in subsampled data or that grunt-like sounds produced by leopard toadfish are one of our presently unidentified sound types. At this time, however, grunt sound descriptions for O. pardus are lacking.
The preponderance of several unknown sound types (pops, knock trains, harmonic sounds) during evening hours suggests nocturnal behavior for the source species of these sounds. Sources of these sounds remain unknown. Thus, sound emission could be part of a nocturnal behavior of fish that are typically diurnally active or, alternatively, may occur during peak activity for nocturnal and cryptic reef fishes. Activity of cryptic fish or nocturnal fish that shelter during daytime may explain the lack of association between abundance of fish species from visual observations with sound occurrence among reefs.
Other sound types showed more diurnal affinities. Dawn and dusk peaks were evident for the chirp-like sounds (template CL) predicted from cocoa damselfish, Stegastes variabilis. Grunt sounds were hypothesized to be from one or several different source species and showed a less pronounced dawn-dusk pattern. For example, sound detections by G3 occurred in pre-dawn and dawn hours and several hours over the afternoon but also some late evening detections. Sound detections from the grunt-like template G1 occurred in all hours but showed much higher variation in the evening hours. The stereotyped low frequency pulse sound was detected most often diurnally, but occurred at all hours and continued at a relatively high rate until two hours post-sunset. Thud sounds showed a fairly unique diel pattern relative to other sound types, with similar rates of occurrence in the late evening and pre-dawn hours until late afternoon, in which sound detections increased hourly and then remained steady and high until 22h.
Lunar periodicity was not evident in our study in the available data from longer-term recordings from two sites in 2018. Sound production correlates with lunar cycles in some fish species (Schärer et al., 2014; Radford et al., 2015; Monczak et al., 2017; Caiger et al., 2020). In a South Carolina estuary, lunar phase was found to be associated with both spotted seatrout (Cynoscion nebulosus) and oyster toadfish calling behavior (Monczak et al., 2017), unlike what was observed for the congener O. pardus (leopard toadfish) in our study.
Many low frequency sounds were observed among sites appeared biological but did not show stereotypy. We expected that these brief sounds were likely from incidental activity of fishes, like movement of swimming fish, but not produced from specialized sonic organs that result in a stereotyped sound (Fine and Parmentier, 2015). To quantify the relative occurrence of these sounds, we used example low frequency sounds as non-specific templates. This approach identified other low-frequency sounds that were clearly not-identical sounds, but still appeared consistent with our prediction of incidental sounds. Non-stereotyped low-frequency sounds detected with this approach tended to occur with similar frequency at most hours of the day, with the exception of sounds detected with template LF4, which showed a notably higher detection rate at 22h. The lack of apparent diel pattern for most of these non-stereotyped sounds is not surprising, as incidental sounds are expected to occur from a variety of potential source species that may vary in times of peak activities.
Sound types occurring diurnally may be expected to be produced by fish species more likely to be observed in visual fish surveys. Damselfish chirps, however, were the only mainly diurnal sound type detected from a known source. Chirps were only observed on artificial reefs in which cocoa damselfish were observed. Because these fish were a low portion of total fish species abundance on artificial reefs, and because damselfish chirps were only detected on two of the five artificial reefs for which cocoa damselfish were observed visually, the correlation of the frequency of sound detections with this species was relatively low. Only one individual leopard toadfish was observed visually during the study, yet the leopard toadfish boatwhistle sound was observed on eight reefs. Further, average detections of leopard toadfish on one reef exceeded 300 hundred per day despite no observations of this species on this reef on deployment and recovery dives. These observations highlight that correlations between specific soundscape features and overall abundance, diversity, or composition of visually surveyed fish species may be poor because the propensity and ability to produce stereotyped sounds varies among species and nocturnal and cryptic species (e.g., leopard toadfish) may call more often than diurnal, conspicuous fishes. Further study is needed with multiple fish species abundance survey methods (e.g., Plumlee et al., 2020) in conjunction with passive acoustic surveys to determine how specific sounds correlate with source species. Further, non-reef associated sound sources, such as cusk-eel sounds may contribute to part of the overall soundscape of artificial reefs. At least some cusk-eel species are buried in soft sediment during diurnal hours and thus are unlikely to be observed by video surveys.
A goal of this study was 1) to determine if occurrence of specific fish sounds rates varied among artificial reefs and reef types and 2) to determine if differences in sound type occurrence was correlated with differences in the composition of fish species observed on artificial reefs. In our study, call richness among reefs correlated with fish species richness. In a recent study of temperate rocky reefs in the Mediterranean Sea, fish species diversity was also associated with acoustic diversity (Desiderà et al., 2019). It is possible that species richness of non-vocal conspicuous reef fishes and vocal cryptic species are correlated because of similar habitat preferences or other factors. Such an indirect association could explain observed correlations between visually observed species richness and call richness. Our results showed large differences in the rate of specific sound detections on reefs, which is predicted to be associated with variable species composition and abundance on reefs. Yet, for many sound types identified in our study, obvious correlations with fish composition as observed by visual surveys on recorder deployment and recovery dives were lacking.
Some fish sounds appeared to be more associated with reef similarity as assessed by fish species presence/absence. For example, pop-like sounds tended to be abundant at Br1, Tk1, Cp2, Cp3, and Py4 sites, which were sites with relatively similar species composition patterns. However, pop-like sounds were never detected at Cp1 and Py2 sites, which also were similar in terms of species composition. Notably, however, the Cp1 and Py2 sites were recorded in 2018 and pop sounds were rarely detected in 2018 (only at site Tk4). The reefs with the highest pop sound rates varied depending on which template (P1, P2, P3, P4) was used for screening. As a result, despite being similar sounds that we predict are from the same source(s), different fish species had the highest associations with these sounds. Thus, correlating fish species presence and sound occurrence among reefs does not seem like a reliable method for determining potential sound sources among these artificial reefs. Of potential candidate species, spotfin butterflyfish seem the least likely, as they are conspicuous and were not observed on most of the reefs in which pop sounds occurred. Lionfish were observed on many reefs with pop sounds and high-frequency sounds (862 Hz) have been observed in captive specimens (Beattie et al., 2017). Lionfish, however, were also present on reefs that lacked pop sounds in this study. Tomtate were observed on most reefs with pop sounds and thus could be expected to be a candidate source species for this sound. However, the relatively narrow band and stereotyped pop waveform differs from the broadband and well-documented stridulatory sound of pharyngeal teeth associated with tomtate and other haemulids (Fish and Mowbray, 1970; Bertucci et al., 2014; Millot et al., 2021). Cubbyu did not have the highest association with pop sound detection rate among reefs with any of the templates. However, cubbyu were not observed on several pyramid reefs Py6, Py7, Py8, and Py9 that tended to have low or no pop sound detections and thus this species, which is from a highly soniferous family (Sciaenidae), deserves further investigation. Sounds from cubbyu that were elicited from mechanical and electrical stimulation (Fish and Mowbray, 1970), however, do not resemble these pop sounds. These brief reported observations do not preclude the possibility of the production of other sound types in this species. It is difficult to predict the source of many common sounds on reefs, particularly those emitted at night, without observations from captive fish. Some artificial reefs may have similar species composition because of abiotic and biotic features that make them attractive or suitable for the same suite of fishes. Further, these features may be suitable for a subset of soniferous species that may not be as abundant or conspicuous as the overall fish assemblage and thus result in spurious correlations between conspicuous species and sound type diversity. Spurious associations of species composition and sound detection rate were shown in this study with leopard toadfish boatwhistles, in which some reefs with detections were similar in terms of species composition (Br1, Py2, Tk1, Tk4), but leopard toadfish were only observed on one of those reefs (Tk4). Overall, non-intentional low frequency fish sounds, which we predict could be produced by multiple species because of their non-stereotyped waveforms, had the greatest association with fish species composition among reefs. Thus, such generalized low-frequency soundscape features may still provide a useful indicator of reef fish species composition.
Longer-term recordings at two sites in 2018 demonstrated notable variation in sound detection patterns over the summer for some, but not all sounds. Leopard toadfish sound detections at Tk4 occurred mainly for a 12-day period beginning in late June and peaked on day nine. Boatwhistle calls in the related oyster toadfish (Opsanus tau) showed a period of approximately one month with increased calling activity in a study in Massachusetts (Van Wert and Mensinger, 2019). The brief period of increased detection in our study could correspond with some of the courtship and calling predicted to occur for a fish before or perhaps while nesting. In Maryland, oyster toadfish were observed spending a long time post-spawning guarding eggs (5-12 d), cling young (6-19 d), and free young (5-18 d) (Gray and Winn, 1961) and thus further study is required to determine the timing of these events in leopard toadfish and when calling occurs relative to care. Lower rates of leopard toadfish detections occurred on Py2 and mainly on different days during the same study period. Detections on Py2 seemed to be distant calls and may represent multiple fish from other reefs or off-reef locations, while detections on Tk4 were all high signal-to-noise ratio and likely from the same reef (perhaps a single fish). Thud sounds on Tk4 were detected throughout the period in which the recorder was active, but also over a remarkably similar period as leopard toadfish on the same reef. By contrast, knock train detections at the same reef remained relatively steady over the entire period. Further study is needed to determine the causes of such temporal variation, which may represent changes in behavior among fish present at a site, and such research can improve the potential utility of passive acoustics for monitoring change and ecosystem function on artificial reefs.
Most reefs tended to have higher (5-10 dB) sound pressure levels in the evening, particularly immediately after sunset, as part of the overall biophony. Intermittent boat noise at some days and sites, e.g. Cp2, Cp3, Tk2, and Py5 often exceeded evening sound pressure levels for some periods during the day. Such intense periods of anthropogenic noise deserve further consideration as a pollutant with potential negative consequences (stressor, masking communication, etc.) on artificial reefs in this area (Slabbekoorn et al., 2010; Radford et al., 2014a). Further study is needed to determine if vessel noise pollution has significant impacts on spawning behavior or other aspects (e.g., growth) of economically valuable fish species like red snapper and grouper. Anthropogenic noise has been shown to have negative impacts for several families of reef associated fishes. In Batrachoididae, boat noise interferes with communication space by masking calls (Alves et al., 2021) and experiments with simulated boat noise cause plainfin midshipman (Porichthys notatus) to respond with greater call amplitudes and shifts in fundamental frequency (Brown et al., 2021). Vessel noise appears likely to mask calls of sciaenids (Smott et al., 2018; Vieira et al., 2021). Damselfish (Pomacentridae) show behavioral responses, such as decreases in boldness and fleeing distance from predators (Holmes et al., 2017; Leduc et al., 2021), reduction in parental care behaviors (McCloskey et al., 2020) and succumb to increased predation (Simpson et al., 2016). Vessel noise is also predicted to reduce communication space for rocky-reef associated bigeyes (Pempheris adspersa) (Putland et al., 2018). A study on movement and behavior of reef fishes exposed to intense seismic survey noise in the North West Shelf of Australia, however, did not observe adverse impacts from noise (Meekan et al., 2021). The Meekan et al. (2021) study included species from families that are also well-represented on Alabama artificial reefs (Lutjanidae, Sparidae, Balistidae, Pomacentridae, Epinephelidae), but it is possible that anthropogenic noise has subtle deleterious effects that were not observed in their study, as well as potential negative impacts on acoustic communication.
Overall SPL levels at night and day were positively correlated with fish species richness on reefs. However, SPL levels were also positively correlated with vessel presence and are a source of intense sound pressure. Therefore, it is not possible to determine if SPL results from higher fish species richness or simply because more vessels were present at reefs with higher richness. In addition to vessels, storm events (e.g., 20 June 2017) were a source of intense noise from rain and thunder. These sources of noise may have some influence on the likelihood of sound detection because of decreased signal-noise. Overall levels of sound intensity among reefs appeared to vary, with some reefs at substantially lower intensities. For example, the median sound level at night at Cp2 was 13-15 dB lower than the other two reefs (Py6, Br2) that were sampled at the same time (Figures 9, S1). Notably, however, at 200 Hz at night, the differences among these reefs is far more modest, with Cp2 5dB lower than Br2 and equal to Py6. Boat noise was less prevalent in night hours and 200 Hz is within the main frequency component of many observed fish sounds in the study. Among all reefs and time points in our study, the median night time intensity at 200 Hz only varied by 10 dB (Table S1). By contrast, 800 Hz, which was near the peak frequency of many pop sounds, varied among reefs by as much as 14 dB (Table S1). However, the reef with the lowest observed evening intensity at 800 Hz, Cp2, had high rates of pop sound detections. Further reef Br1, which had modest overall evening intensity at 800 Hz also had high pop sound detections and the site with the greatest 800 Hz intensity, Py3, had very few pop sound detections. In fact, the highest median intensities at 800 Hz and 1200 Hz were observed at Py3 and Tk3 (Figures S11, S12), which were deployed concurrently and these high intensities appear to be from intense choruses of putative cusk-eel sounds that began at dusk and remained intense for approximately 2 hours after sunset. Differences in intensity at 5 kHz among reefs at night were associated with differences in intensity of a tonal like sound that occurred at 5-6kHz nightly. This sound was observed previously in the eastern Gulf of Mexico and reported by Wall et al. (2012, 2013) and referred to as the ‘6kHz sound’. The source of the sound is unknown but is hypothesized to be of biological origin and occurring beyond small, relatively isolated artificial reefs. Our approach of scanning for specific sound types, found differences in relative rates of sound occurrence among reefs that would not be evident from just analyzing intensity at specific frequency over time. Some reefs with greater intensity at frequencies that overlap specific fish sounds of interest, appear to have fewer incidents of such sounds compared to reefs that are quieter overall at these frequencies. For example, Br1 reef, which had the greatest leopard toadfish detection rate, had median evening intensities at 200 Hz (near the peak of leopard toadfish boatwhistles) that were 4 dB quieter than Py9, yet the Br1 site had an average daily detection rate of toadfish boatwhistles that was 158 times greater than the Py9 site. This observation is important because it underscores that some quantitative comparisons of power spectral density, or other soundscape features, can still miss differences in specific sounds types that may correspond to differences in fish species present or differences in the behavioral state (e.g. spawning behavior, nesting) among reefs.
Our approach using semi-automated detection appeared promising for some sound types and situations but was less effective and feasible for others. Grunt and chirp-like sounds, which have multiple pulses in rapid succession, tended to have high false positive rates with TDXC. Sounds with distinctive pulses and in-consistent interpulse intervals, like the pop-sounds tended to have low-false positive rates. Producing an effective routine to detect thud-train sounds was challenging because the individual thud pulses appeared less stereotyped than some sounds and interpulse-intervals between thuds were variable. Knock-train sounds were difficult because the number and rate of the higher frequency broadband knocks that occurred in the middle of such calls were variable. Trial and error analyses with different approaches indicated that the best detection method in the time-domain for thud sounds detected more overall knock-trains than our original method designed to detect knock-trains. Tonal toadfish boatwhistle sounds were effectively screened in the frequency domain. This approach, however, while having a low false-positive rate often detected different portions of the same call. We found that substantial aural observation of putative detections with these semi-automated methods is required to reduce false positives or sort more generic detections into specific sound types. After detailed screening putative detections, however, it is possible to make quantitative comparisons of the relative rate of occurrence of specific sound events over temporal and spatial scales because the same methods are employed throughout the study.
Our study found substantial diel and temporal variation among artificial reefs off coastal Alabama. Differences among reefs were not clearly associated with reef structure. This study confirmed that artificial reefs in this area produce a range of biological sound. Such acoustic cues are known to attract and provide settlement cues for some larval reef fishes (Leis et al., 2002; Leis et al., 2003) and could also be a potential cue for adult fishes (Simpson et al., 2008) to return to reefs or find new reef habitats in the absence of other available cues (e.g., when above current from chemical cues and in low visibility). Soundscape recordings from our study and others may also benefit habitat restoration, given that playback of healthy reefs encourages larval settlement and retention in degraded habitats (Gordon et al., 2019). However, further research is needed to determine if such acoustic cues are important for navigation to reefs by larval and adult reef fish species commonly found on Alabama artificial reefs. Some evidence indicates that the distance in which reef noise may be an effective cue is more limited than has been widely assumed (Mann et al., 2007; Raick et al., 2021). Nevertheless, acoustic cues from limited distances could help fish detect reefs in low visibility environments and differences in soundscapes among reefs observed in this study and others (Radford et al., 2014b) may be predicted to vary the attractiveness of reefs for some species (Simpson et al., 2008; Gordon et al., 2019).
We hypothesize that differences in fish sounds among reefs are related, in part to which species are present on reefs. However, our results indicate that differences among visually conspicuous fish appear to contribute little to the overall observed differences among these reefs. Research is needed to identify the source species of many of these sounds and such data will improve the utility of passive acoustic data in these systems. Further study characterizing soundscapes of reef fish communities on artificial and natural reefs in the northern Gulf of Mexico relative to soft-bottom benthic habitats will help elucidate the potential role of this system.
To take part in the Resource Identification Initiative, please use the corresponding catalog number and RRID in your current manuscript. For more information about the project and for steps on how to search for an RRID, please click here.
The original contributions presented in the study are included in the article/Supplementary Material. Further inquiries can be directed to the corresponding author.
KB, CH, TN, and SP conceived of the study. KB, CH, and TN led field efforts. KB conducted initial analyses and wrote the first draft manuscript and figures. KB, CH, TN, and SP revised the final manuscript. All authors contributed to the article and approved the submitted version.
Financial support for this study was provided by the Alabama Department of Conservation and Natural Resources, Marine Resources Division to SP.
We thank Mark Albins, Reagan Coutorie, Erin Cox, Jacob Eagleton, Tom Guoba, Matt Jargowski, Grant Lockridge, Justin McDonald, Locke Revels, Sarah Schmid, and Jonathan Wittmann for field assistance. Financial support for this study was provided by the Alabama Department of Conservation and Natural Resources, Marine Resources Division.
The authors declare that the research was conducted in the absence of any commercial or financial relationships that could be construed as a potential conflict of interest.
All claims expressed in this article are solely those of the authors and do not necessarily represent those of their affiliated organizations, or those of the publisher, the editors and the reviewers. Any product that may be evaluated in this article, or claim that may be made by its manufacturer, is not guaranteed or endorsed by the publisher.
The Supplementary Material for this article can be found online at: https://www.frontiersin.org/articles/10.3389/fmars.2022.954974/full#supplementary-material
Alves D., Vieira M., Amorim M. C. P., Fonseca P. J. (2021). Boat noise interferes with lusitanian toadfish acoustic communication. J. Exp. Biol. 224, jeb234849. doi: 10.1242/jeb.234849
Amorim M. C. P. (2006). “Diversity of sound production in fish,” in Communication in fishes. Eds. Ladich F., Collin S. P., Moller P., Kapoor B. G. (Enfield: Science Publishers), 71–104.
Beattie M., Nowacek D. P., Bogdanoff A. K., Akins L., Morris J. A. Jr. (2017). The roar of the lionfishes pterois volitans and Pterois miles. J. Fish Biol. 90, 2488–2495. doi: 10.1111/jfb.13321
Bertucci F., Ruppe L., Van Wassenbergh S., Compere P., Parmentier E. (2014). New insights into the role of the pharyngeal jaw apparatus in the sound-producing mechanism of Haemulon flavolineatum (Haemulidae). J. Exp. Biol. 217, 3862–3869. doi: 10.1242/jeb.109025
Bolgan M., Soulard J., Di Iorio L., Gervaise C., Lejeune P., Gobert S., et al. (2019). Sea Chordophones make the mysterious /Kwa/ sound: identification of the emitter of the dominant fish sound in Mediterranean seagrass meadows. J. Exp. Biol. 222, jeb196931. doi: 10.1242/jeb.196931
Boyle K. S., Hightower C. L., Nelson T. R., Powers S. P. (2022). Use of passive acoustic monitoring to estimate fishing effort on artificial reefs in Alabama during the recreational red snapper fishing season. Fish. Res. 249, 106262. doi: 10.1016/j.fishres.2022.106262
Boyle K. S., Tricas T. C. (2011). Sound production in the longnose butterflyfishes (genus Forcipiger): cranial kinematics, muscle activity and honest signals. J. Exp. Biol. 214, 3829–3842. doi: 10.1242/jeb.062554
Brown N. A. W., Halliday W. D., Balshine S., Juanes F. (2021). Low-amplitude noise elicits the Lombard effect in plainfin midshipman mating vocalizations in the wild. Anim. Behav. 181, 29–39. doi: 10.1016/j.anbehav.2021.08.025
Butler J., Pagniello C. M. L. S., Jaffe J. S., Parnell P. E., Širović A. (2021). Diel and seasonal variability in kelp forest soundscapes off the southern California coast. Front. Mar. Sci. 8. doi: 10.3389/fmars.2021.629643
Caiger P. E., Dean M. J., DeAngelis A. I., Hatch L. T., Rice A. N., Stanley J. A., et al. (2020). A decade of monitoring Atlantic cod Gadus morhua spawning aggregations in Massachusetts bay using passive acoustics. Mar. Ecol. Prog. Ser. 635, 89–103. doi: 10.3354/meps13219
Connaughton M. A. (2004). Sound generation in the searobin (Prionotus carolinus), a fish with alternate muscle contraction. J. Exp. Biol. 207, 1643–1654. doi: 10.1242/jeb.00928
Desiderà E., Guidetti P., Panzalis P., Navone A., Valentini-Poirrier C., Boissery P., et al. (2019). Acoustic fish communities: sound diversity of rocky habitats reflects fish species diversity. Mar. Ecol. Prog. Ser. 608, 183–197. doi: 10.3354/meps12812
Ellis D. M., Demartini E. E. (1995). Evaluation of a video camera technique for indexing abundances of juvenile pink snapper, Pristipomoides filamentosus, and other Hawaiian insular shelf fishes. Fish. Bull. 93, 67–77.
Evans R. R. (1973). The swimbladder and associated structures in Western Atlantic sea robins (Triglidae). Copeia 1973, 315–321. doi: 10.2307/1442970
Fine M. L., Parmentier E. (2015). “Mechanisms of fish sound production,” in Sound communication in fishes. Eds. Ladich F. (New York: Springer), 77–126.
Fine M. L., Thorson R. F. (2008). Use of passive acoustics for assessing behavioral interactions in individual toadfish. Trans. Am. Fish. Soc 137, 627–637. doi: 10.1577/T04-134.1
Fish M. P., Mowbray W. H. (1970). Sounds of Western north Atlantic fishes (Baltimore, MD: Johns Hopkins Press).
Gordon T. A. C., Radford A. N., Davidson I. K., Barnes K., McCloskey K., Nedelec S. L., et al. (2019). Acoustic enrichment can enhance fish community development on degraded coral reef habitat. Nat. Commun. 10, 5414. doi: 10.1038/s41467-019-13186-2
Gray G.-A., Winn H. E. (1961). Reproductive ecology and sound production of the toadfish, Opsanus tau. Ecology 42, 274–282. doi: 10.2307/1932079
Holmes L. J., McWilliam J., Ferrari M. C. O., McCormick M. I. (2017). Juvenile damselfish are affected but desensitize to small motor boat noise. J. Exp. Mar. Biol. Ecol. 494, 63–68. doi: 10.1016/j.jembe.2017.05.009
Jaxion-Harm J., Szedlmayer S. T. (2015). Depth and artificial reef type effects on size and distribution of red snapper in the northern gulf of Mexico. North Am. J. Fish. Manage. 35, 86–96. doi: 10.1080/02755947.2014.982332
Kever L., Boyle K. S., Parmentier E. (2015). Effects of seawater temperature on sound characteristics in Ophidion rochei (Ophidiidae). J. Fish. Biol. 87, 502–509. doi: 10.1111/jfb.12730
Ladich F. (2004). “Sound production and acoustic communication,” in The senses of fish. Eds. von der Emde G., Mogdans J., Kapoor B. G. (New Delhi: Narosa Publishing House), 210–230.
Leduc A. O. H. C., Nunes J. A. C. C., de Araújo C. B., Quadros A. L. S., Barros F., Oliveira H., et al. (2021). Land-based noise pollution impairs reef fish behavior: A case study with a Brazilian carnival. Biol. Conserv. 253, 108910. doi: 10.1016/j.biocon.2020.108910
Leis J. M., Carson-Ewart B. M., Cato D. H. (2002). Sound detection in situ by the larvae of a coral-reef damselfish (Pomacentridae). Mar. Ecol. Prog. Ser. 232, 259–268. doi: 10.3354/meps232259
Leis J. M., Carson-Ewart B. M., Hay A. C., Cato D. H. (2003). Coral-reef sounds enable nocturnal navigation by some reef-fish larvae in some places and at some times. J. Fish Biol. 63, 724–737. doi: 10.1046/j.1095-8649.2003.00182.x
Luczkovich J. J., Sprague M., Johnson S. E., Pullinger C. (1999). Delimiting spawning areas of weakfish Cynoscion regalis (Family sciaenidae) in pamlico sound, north Carolina using passive hydroacoustic surveys. Bioacoustics 10, 143–160. doi: 10.1080/09524622.1999.9753427
Malinowski C., Coleman F., Koenig C., Locascio J., Murie D. (2019). Are Atlantic goliath grouper, Epinephelus itajara, establishing more northerly spawning sites? evidence from the northeast gulf of Mexico. Bull. Mar. Sci. 95, 371–391. doi: 10.5343/bms.2018.0062
Mann D. A., Bowers-Altman J., Rountree R. A. (1997). Sounds produced by the striped cusk-eel Ophidion marginatum (Ophidiidae) during courtship and spawning. Copeia 1997, 610–612. doi: 10.2307/1447568
Mann D. A., Casper B. M., Boyle K. S., Tricas T. C. (2007). On the attraction of larval fishes to reef sounds. Mar. Ecol. Prog. Ser. 338, 307–310. doi: 10.3354/meps338307
Mann D. A., Locascio J. V., Coleman F. C., Koenig C. C. (2009). Goliath Grouper Epinephelus itajara sound production and movement patterns on aggregation sites. End. Species Res. 7, 229–236. doi: 10.3354/esr00109
Maruska K. P., Mensinger A. F. (2009). Acoustic characteristics and variations in grunt vocalizations in the oyster toadfish Opsanus tau. Environ. Biol. Fish. 84, 325–337. doi: 10.1007/s10641-009-9446-y
Meekan M. G., Speed C. W., McCauley R. D., Fisher R., Birt M. J., Currey-Randall L. M. (2021). A large-scale experiment finds no evidence that a seismic survey impacts a demersal fish fauna. Proc. Natl. Acad. Sci. 118:e2100869118. doi: 10.1073/pnas.2100869118
McCloskey K. P., Chapman K. E., Chapuis L., McCormick M. I., Radford A. N., Simpson S. D. (2020). Assessing and mitigating impacts of motorboat noise on nesting damselfish. Environ. pollut. 266, 115376. doi: 10.1016/j.envpol.2020.115376
Millot M., Bertucci F., Lecchini D., Smeets S., René-Trouillefou M., Parmentier E. (2021). Characteristics of sound production and associated pharyngeal jaws in the tomtate grunt Haemulon aurolineatum (Cuvie) in Caribbean reefs. Belg. J. Zool. 151, 43–56. doi: 10.26496/bjz.2021.84
Minton R., Heath S. (1998). Alabama’s artificial reef program: building oases in the desert. Gulf Mex. Sci. 16, 105–105. doi: 10.18785/goms.1601.14
Monczak A., Berry A., Kehrer C., Montie E. W. (2017). Long-term acoustic monitoring of fish calling provides baseline estimates of reproductive timelines in the may river estuary, southeastern USA. Mar. Ecol. Prog. Ser. 581, 1–19. doi: 10.3354/meps12322
Mooney T., Kaplan M., Izzi A., Lamoni L., Sayigh L. (2016). Temporal trends in cusk eel sound production at a proposed U.S. wind farm site. Aquat. Biol. 24, 201–210. doi: 10.3354/ab00650
Mueller C., Monczak A., Soueidan J., McKinney B., Smott S., Mills T., et al. (2020). Sound characterization and fine-scale spatial mapping of an estuarine soundscape in the southeastern USA. Mar. Ecol. Prog. Ser. 645, 1–23. doi: 10.3354/meps13373
Myrberg A. A. Jr. (1981). “Sound communication and interception in fishes,” in Hearing and sound communication in fishes. Eds. Tavolga W. N., Popper A. N., Fay R. R. (New York: Springer), 395–425.
Myrberg A. A., Ha S. J., Shamblott M. J. (1993). The sounds of bicolor damselfish (Pomacentrus partitus): Predictors of body size and a spectral basis for individual recognition and assessment. J. Acoust. Soc Am. 94, 3067–3070. doi: 10.1121/1.407267
Oksanen J., Blanchet F. G., Friendly M., Kindt R., Legendre P., McGlinn D., et al. (2020) Vegan (R package version 2.5-7). Available at: https://cran.r-project.org/package=vegan.
Plumlee J. D., Dance K. M., Dance M. A., Rooker J. R., TinHan T. C., Shipley J. B., et al. (2020). Fish assemblages associated with artificial reefs assessed using multiple gear types in the northwest gulf of Mexico. Bull. Mar. Sci. 96, 655–677. doi: 10.5343/bms.2019.0091
Powers S. P., Drymon J. M., Hightower C. L., Spearman T., Bosarge G. S., Jefferson A. (2018). Distribution and age composition of red snapper across the inner continental shelf of the north-central gulf of Mexico. Trans. Am. Fish. Soc 147, 791–805. doi: 10.1002/tafs.10081
Putland R. L., Merchant N. D., Farcas A., Radford C. A. (2018). Vessel noise cuts down communication space for vocalizing fish and marine mammals. Glob. Change Biol. 24, 1708–1721. doi: 10.1111/gcb.13996
Radford C. A., Ghazali S., Jeffs A. G., Montgomery J. C. (2015). Vocalisations of the bigeye Pempheris adspersa: characteristics, source level and active space. J. Exp. Biol. 218, 940–948. doi: 10.1242/jeb.115295
Radford A. N., Kerridge E., Simpson S. D. (2014a). Acoustic communication in a noisy world: can fish compete with anthropogenic noise? Behav. Ecol. 25, 1022–1030. doi: 10.1093/beheco/aru029
Radford C., Stanley J., Jeffs. A. (2014b). Adjacent coral reef habitats produce different underwater sound signatures. Mar. Ecol. Prog. Ser. 505, 19–28. doi: 10.3354/meps10782
Raick X., Di Iorio L., Gervaise C., Lossent J., Lecchini D., Parmentier E. (2021). From the reef to the ocean: revealing the acoustic range of the biophony of a coral reef (Moorea island, French Polynesia). J. Mar. Sci. Eng. 9, 420. doi: 10.3390/jmse9040420
R Core Team (2021). R: A language and environment for statistical computing (Vienna, Austria: R Foundation for Statistical Computing). Available at: https://www.r-project.org/.
Reeves D. B., Chesney E. J., Munnelly R. T., Baltz D. M., Marx B. D. (2018). Abundance and distribution of reef-associated fishes around small oil and gas platforms in the northern gulf of mexico’s hypoxic zone. Estuaries Coasts. 41, 1835–1847. doi: 10.1007/s12237-017-0349-4
Ricci S. W., Bohnenstiehl D. R., Eggleston D. B., Kellogg M. L., Lyon R. P. (2017). Oyster toadfish (Opsanus tau) boatwhistle call detection and patterns within a large-scale oyster restoration site. PloS One 12, e0182757. doi: 10.1371/journal.pone.0182757
Schärer M. T., Nemeth M. I., Rowell T. J., Appeldoorn R. S. (2014). Sounds associated with the reproductive behavior of the black grouper (Mycteroperca bonaci). Mar. Biol. 161, 141–147. doi: 10.1007/s00227-013-2324-3
Simpson S. D., Jeffs A., Montgomery J. C., McCauley R. D., Meekan M. G. (2008). Nocturnal relocation of adult and juvenile coral reef fishes in response to reef noise. Coral Reefs 27, 97–104. doi: 10.1007/s00338-007-0294-y
Simpson S. D., Radford A. N., Nedelec S. L., Ferrari M. C. O., Chivers D. P., McCormick M. I., et al. (2016). Anthropogenic noise increases fish mortality by predation. Nat. Commun. 7, 10544. doi: 10.1038/ncomms10544
Slabbekoorn H., Bouton N., van Opzeeland I., Coers A., ten Cate C., Popper A. N. (2010). A noisy spring: the impact of globally rising underwater sound levels on fish. Trends Ecol. Evol. 25, 419–427. doi: 10.1016/j.tree.2010.04.005
Smott S., Monczak A., Miller M. E., Montie E. W. (2018). Boat noise in an estuarine soundscape – a potential risk on the acoustic communication and reproduction of soniferous fish in the may river, south Carolina. Mar. pollut. Bull. 133, 246–260. doi: 10.1016/j.marpolbul.2018.05.016
Staaterman E., Paris C. B., Kough A. S. (2014). First evidence of fish larvae producing sounds. Biol. Lett. 10, 20140643. doi: 10.1098/rsbl.2014.0643
Steinberg J. C., Cummings W. C., Brahy B. D., MacBain (Spires) J. Y. (1965). Further bio-acoustic studies off the west coast of north bimini, Bahamas. Bull. Mar. Sci. 15, 942–963.
Sueur J. (2018). Sound analysis and synthesis with r. cham (Switzerland: Springer International Publishing).
Sueur J., Aubin T., Brown E. C., Depraetere M., Desionqueres C., Fabianek F., et al. (2018) Seewave. (R package version 3.4.6). Available at: https://cran.r-project.org/web/packages/seewave.
Thorson R. F., Fine M. L. (2002). Acoustic competition in the gulf toadfish Opsanus beta: Acoustic tagging. J. Acoust. Soc Am. 111, 2302–2307. doi: 10.1121/1.1466865
Tricas T. C., Boyle K. S. (2014). Acoustic behaviors in Hawaiian coral reef fish communities. Mar. Ecol. Prog. Ser. 511, 1–16. doi: 10.3354/meps10930
Tricas T. C., Boyle K. S. (2021). Parrotfish soundscapes: implications for coral reef management. Mar. Ecol. Prog. Ser. 666, 149–169. doi: 10.3354/meps13679
Van Hoeck R. V., Paxton A. B., Bohnenstiehl D. R., Taylor J. C., Fodrie F. J., Nowacek D. P., et al. (2020). Soundscapes of natural and artificial temperate reefs: similar temporal patterns but distinct spectral content. Mar. Ecol. Prog. Ser. 649, 35–51. doi: 10.3354/meps13434
Van Wert J. C., Mensinger A. F. (2019). Seasonal and daily patterns of the mating calls of the oyster toadfish, Opsanus tau. Biol. Bull. 236, 97–107. doi: 10.1086/701754
Vieira M., Beauchaud M., Amorim M. C. P., Fonseca P. J. (2021). Boat noise affects meagre (Argyrosomus regius) hearing and vocal behaviour. Mar. pollut. Bull. 172, 112824. doi: 10.1016/j.marpolbul.2021.112824
Wall C. C., Lembke C., Mann D. A. (2012). Shelf-scale mapping of sound production by fishes in the eastern gulf of Mexico, using autonomous glider technology. Mar. Ecol. Prog. Ser. 449, 55–64. doi: 10.3354/meps09549
Keywords: passive acoustic monitoring (PAM), reef fish, northern Gulf of Mexico, artificial reefs, fish sounds
Citation: Boyle KS, Hightower CL, Nelson TR and Powers SP (2022) Diel, temporal, and spatial patterns of biotic soundscapes among Alabama artificial reefs in late spring and summer. Front. Mar. Sci. 9:954974. doi: 10.3389/fmars.2022.954974
Received: 27 May 2022; Accepted: 07 September 2022;
Published: 30 September 2022.
Edited by:
Daniel Joseph Pondella, Occidental College, United StatesReviewed by:
Edward Mager, University of North Texas, United StatesCopyright © 2022 Boyle, Hightower, Nelson and Powers. This is an open-access article distributed under the terms of the Creative Commons Attribution License (CC BY). The use, distribution or reproduction in other forums is permitted, provided the original author(s) and the copyright owner(s) are credited and that the original publication in this journal is cited, in accordance with accepted academic practice. No use, distribution or reproduction is permitted which does not comply with these terms.
*Correspondence: Kelly S. Boyle, a3Nib3lsZUB1bm8uZWR1
†Present addresses: Kelly S. Boyle, Department of Biological Sciences, University of New Orleans, New Orleans, LA, United States
T. Reid Nelson, Potomac Environmental Research and Education Center, Department of Environmental Science and Policy, George Mason University, Fairfax, VA, United States
Disclaimer: All claims expressed in this article are solely those of the authors and do not necessarily represent those of their affiliated organizations, or those of the publisher, the editors and the reviewers. Any product that may be evaluated in this article or claim that may be made by its manufacturer is not guaranteed or endorsed by the publisher.
Research integrity at Frontiers
Learn more about the work of our research integrity team to safeguard the quality of each article we publish.