
95% of researchers rate our articles as excellent or good
Learn more about the work of our research integrity team to safeguard the quality of each article we publish.
Find out more
ORIGINAL RESEARCH article
Front. Mar. Sci. , 17 August 2022
Sec. Marine Biology
Volume 9 - 2022 | https://doi.org/10.3389/fmars.2022.952863
Climate-induced warming and increased river inflows are forcing the Baltic Sea to radical changes in the near future; organisms living in this brackish-water ecosystem are already experiencing osmotic stress, which, together with thermal stress, may have severe consequences on the ecosystem. The aim of this work was to study the combined effect of decreasing salinity and increasing temperature on reproductive success and oxidative stress in zooplankton by using a calanoid copepod Acartia sp. as a model organism. The field study was conducted during summer 2020 in the western Gulf of Finland, using three sampling sites with naturally differing salinity levels. Additionally, the copepods from these sites were experimentally exposed to ambient or 3°C elevated temperature for 72 h. The copepods derived from the deepest and the most saline sampling site suffered less oxidative damage and exhibited relatively high reproduction, while the temperature treatment itself had little effect. On the other hand, the field-based monitoring data showed otherwise; temperature increased lipid peroxidation, glutathione-s-transferase activity, or both in all three sampling sites. Meanwhile, egg production rate was negatively associated with temperature in the area with the lowest salinity. Moreover, egg production rate decreased from June to September along with increasing temperatures in the mid-salinity sampling site, while similar change occurred also in the highest-salinity site between August and September. The combined effect of salinity and sampling date on reproduction indicates the importance of even subtle salinity changes on copepods. Moreover, the data suggest that the unusually strong heatwave was responsible for increased oxidative stress during the sampling season and possibly forced a trade-off between antioxidant activity and reproductive effort.
Many organisms in brackish-water environments experience osmotic stress because the salinity is too high for fresh water species, but suboptimal for true marine species. Due to the importance of osmoregulation to all aquatic ectotherms, salinity is an important abiotic factor, especially for animals experiencing large salinity fluctuations (Bal et al., 2021). Zooplankton, especially copepods, are an excellent group for studying these abiotic effects because they encounter large variability in salinity and temperature conditions on a daily, weekly, and annual basis (Lance, 1963; Almén et al., 2014). Copepods dominate the zooplankton community in most areas in the Baltic Sea and form a crucial link between primary producers and planktivorous fish. Climate-induced warming and increased river inflows are forcing the Baltic Sea ecosystem to radical changes in the near future, making it a relevant study system for climate-related research.
The sea surface temperature (SST) in the Baltic Sea is predicted to increase by approximately 2°C–3°C by the end of the century in future climate projections (RCP4.5 and RCP8.5), while the frequency and duration of heatwaves are increasing (Meier et al., 2022). During the last 85 years, the SST has already increased by 1°C (Merkouriadi and Leppäranta, 2014) and a continuous decrease in sea surface salinity (SSS) has occurred in the Gulf of Finland (Lehmann et al., 2022). Earlier predictions have suggested a decrease in SSS (Meier et al., 2012), but recent studies have suggested uncertainty over whether the salinity will decrease due to increased precipitation and river runoff or increase due to inflow of saline water through the Danish Straits (Lehmann et al., 2022; Meier et al., 2022). Long-term effects of decreasing salinity and warming has been associated with a decrease in large calanoid copepods and increase in smaller taxa in the Baltic Sea (Mäkinen et al., 2017). Elevating temperatures are also shifting the whole plankton community towards smaller size, starting from phytoplankton and reaching to species-level decrease in the body size of adult copepods (Daufresne et al., 2009; Garzke et al., 2016). Cascading effects of changing zooplankton composition and the abundance of copepods on fish stocks are well acknowledged in the literature (Lomartire et al., 2021), and these effects have also been related to temperature and salinity changes in the Baltic Sea (Möllmann et al., 2008). Moreover, the importance of body size and the abundance of larger zooplankton taxa, such as copepods, are highlighted by size selectivity of some planktivorous fishes (Lehtiniemi et al., 2007).
Suboptimal salinity has a negative effect on egg production rate in marine copepods (Dutz and Christensen, 2018). This reduction might be related to physiological stress, which can be evaluated by measuring the oxidative status of the animals. Oxidative stress occurs during an imbalance of reactive oxygen species (ROS) production and antioxidant defense and repair capacity. The severe imbalance could lead to cellular damage (Hulbert et al., 2007; Costantini, 2010). Acute change in salinity has been shown to increase the oxidative stress of marine organisms (Lushchak, 2011), but acclimation to the new salinity may restore oxidative balance (Martínez-Alvarez et al., 2002). However, salinity is an important abiotic factor affecting oxidative status in copepods (Cailleaud et al., 2007; Glippa et al., 2018). Temperature plays an even larger role in marine ecosystems: warming enhances the metabolism in marine ectotherms, which in turn increases oxidative stress via increased oxygen consumption (Lushchak, 2011). The reduction in salinity and simultaneous increase in temperature could, thus, lead to severe stress, as osmotic tolerance may be temperature dependent in euryhaline copepod species, or vice versa (Lance, 1963; Diekmann et al., 2012; Peck et al., 2015). The combined effect of temperature and suboptimal salinity has been previously shown to decrease growth and survival and increase oxidative stress on eurythermal and euryhaline ectotherms in brackish-water ecosystems (Imsland et al., 2001; Hiebenthal et al., 2012). It also alters life-history strategies, such as longevity, body size, and reproductive strategies (Ismail et al., 2011).
At cellular level, oxidative stress is known to have a negative effect on viable egg production in calanoid copepods (Vehmaa et al., 2013; Garzke et al., 2016). Measuring lipid peroxidation (LPX) is especially relevant in marine copepods because they are rich in polyunsaturated fatty acids (PUFAs) (Støttrup et al., 1999; Persson and Vrede, 2006), which are more vulnerable to oxidative damage than the saturated fatty acids (Hulbert et al., 2007; Costantini, 2010). Antioxidants involved in glutathione metabolism, such as glutathione and glutathione-s-transferase, may assist in preventing lipid peroxidation (Halliwell and Gutteridge, 2015) and have been shown to be important to copepods in preventing oxidative damage (Vuori et al., 2015; Glippa et al., 2018; von Weissenberg et al., 2022). Moreover, effort in reproduction and antioxidant defense mechanisms are often suggested to have a trade-off, especially in stressful environments (Monaghan et al., 2009; Metcalfe and Alonso-Alvarez, 2010).
Previous studies on temperature and salinity effects on marine organisms have focused on survival, growth, and reproduction, but few have included oxidative stress response into the study design along with egg production in zooplankton. Changes in reproduction and physiological condition are connected to population size and species composition and thus have cascading effects in higher trophic levels. Therefore, the aim of this work was to study the combined effects of salinity and temperature on reproductive success and oxidative status in zooplankton. A calanoid copepod Acartia sp. was used as a model organism—it is a key zooplankton species due to its high abundance and ecological importance in the Gulf of Finland. Acartia bifilosa is the main species in the study area, but Acartia tonsa may constitute part of the community, especially during warm months (Katajisto and Viitasalo, 1998; Almén et al., 2014; Engström-Öst et al., 2015). We hypothesize that salinity above 6‰ gives the Acartia sp. higher tolerance to increased temperature, shown as improved oxidative status and reproductive performance. Furthermore, we expected to find a trade-off between reproductive output and oxidative status during environmental stress.
The study was conducted along a salinity gradient located close to Tvärminne Zoological Station in the south-western Gulf of Finland. Samples were collected at three locations monthly between June and September 2020: Storfjärden (59°52'56"N, 23°15'14''E) is a pelagic area, Hermansö (59°53'25"N, 23°16'50"E) is a freshwater-influenced narrow area between Hermansö and Ekö islands, and Längden lighthouse (59°46'48"N, 23°15'51"E) that is an offshore site outside the archipelago (Figure 1).
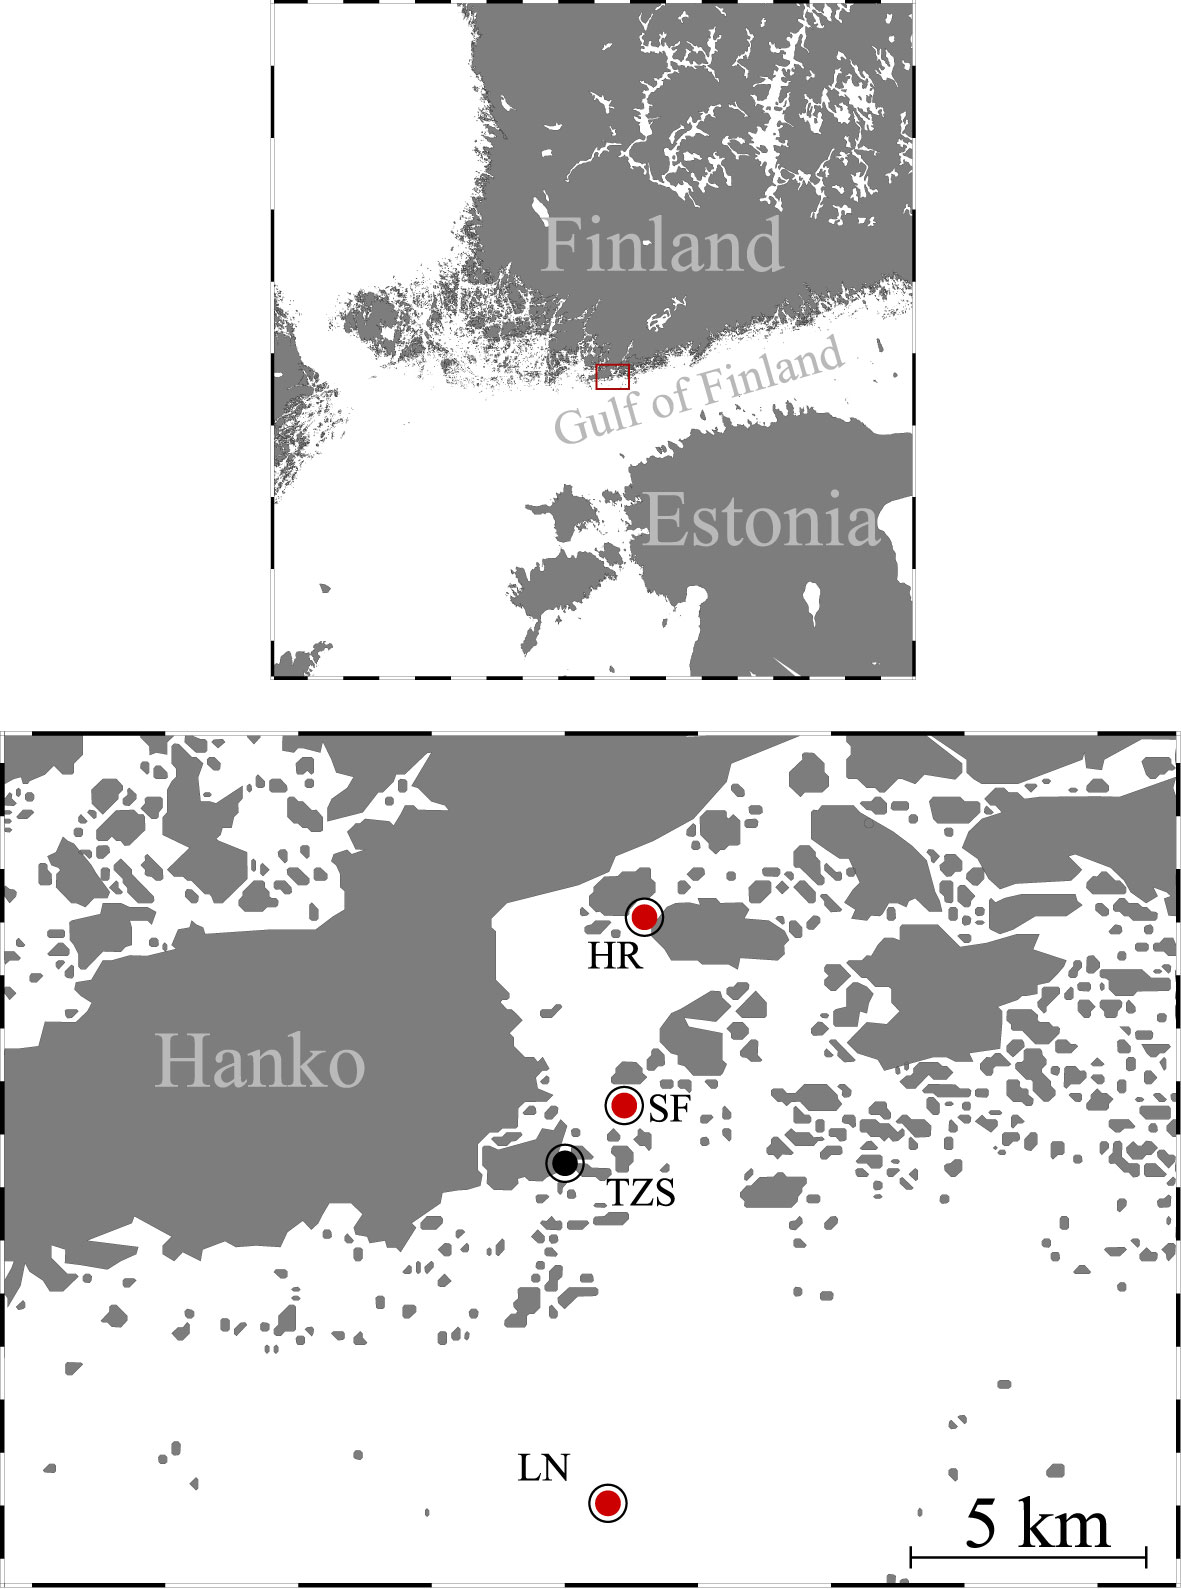
Figure 1 Map of the study area in Hanko, Finland. The red dots show the sampling sites in Hermansö (HR), Storfjärden (SF), and Längden (LN), which are close to the Tvärminne Zoological Station (TZS). Ocean Data View was used for creating the map (Schlitzer, 2016).
During each sampling occasion, we cast the MiniCTD (Valeport, serial number 29560) for temperature and conductivity data of the whole water column and measured oxygen every 5 m with YSI pro ODO oxygen sensor. We also measured salinity with CO310 Conductivity Meter at every 5 m. Water samples for chlorophyll a (Chl a) and pH were collected from 10 m using a 3-L Limnos water sampler. The chlorophyll a samples (100 ml) were filtered using 25-mm glass fiber filters (Whatman GF/C), which were submerged in 10 ml of ethanol and stored at −20°C until analysis, using a fluorescence spectrophotometer (Cary Eclipse, serial number: EL03077257). We used a 200-μm plankton net (50 cm) with a cod-end to collect zooplankton from 30 m to the surface in Storfjärden (max depth, 33 m) and Hermansö, and from 50 m to the surface in Längden (max depth, 54 m). Due to a difficult sampling environment in Hermansö, hydrography and chlorophyll samples were obtained while being attached to a seamark, where the depth was 11 m; zooplankton were sampled 20–50 m away from the seamark, where the depth was approximately 30 m. We emptied the zooplankton samples into a cooling box with seawater from a selected depth, which were 10 m in Storfjärden, 1 m in Hermansö, and 45 m in Längden, according to the representative salinity of each sampling site. In analyses of the field data, we used temperature and salinity of 10 m as a representative depth to keep the consistency between the sampling sites; the water movement in 10 m is lower than that at the surface while being within or near the productive layer throughout the summer. We also collected extra water for egg incubation from the same depth. The cooling boxes were stored in a climate chamber of the same temperature as the ambient seawater and oxygenated with an aquarium pump prior to sorting the animals. Filtered seawater (FSW) for egg production incubation was obtained by filtering ambient seawater through a 10-μm mesh and oxygenated before use.
Ten adult Acartia sp. females and two males were collected with a glass Pasteur pipette and incubated in a false bottom chamber (mesh size, 120 μm), filled with FSW, at ambient seawater temperature. The incubation was 18–24 h, after which live individuals were counted and picked for body size measurements. The eggs were separated using a 48-μm sieve. All eggs and females for body size samples were preserved in acid Lugol’s solution. In addition, 30 adult females from a fresh sample were picked, using forceps, and put into 1.5-ml plastic Eppendorf microtubes and snap-frozen in liquid nitrogen before storage at −80°C for biomarker analyses. The samples were kept on ice while sorting in order to avoid fluctuating temperature. All egg incubations and biomarker samplings were performed in triplicate.
Adult Acartia sp. (45 females and 5 males per bottle) were individually sorted using glass Pasteur pipettes and placed in triplicate 2-L glass bottles filled with 0.2-μm filtered seawater, separately for both control (12°C) and elevated temperature treatment (15°C) (Figure 2). The bottles were placed in climate chambers in either 12°C (control, hereafter C) or 15°C (temperature treatment, hereafter T). The copepods were incubated for 45–50 h and fed daily on a culture of cryptomonad Rhodomonas marina (Guillard, 1975; Vehmaa et al., 2011), with a final concentration of approximately 50,000 cells ml−1 (Santhanam and Perumal, 2012). The algal culture, enriched with F/2 medium, was grown at 16°C with salinity of approximately 6‰ in dim light with 16:8 h light:dark regime. The cell concentration of the culture was determined by using a Bürker chamber. Copepods were fed within 5 h from the start of the incubation. At the end of the experiment, adult copepods and eggs were separated using 240- and 48-μm sieves, respectively. Eggs were immediately transferred to a Petri dish and left in the climate chamber for hatching. Both eggs and nauplii were counted in the climate chamber within 10 h after the end of the incubation. Sieving was completed in the control climate chamber to avoid fluctuating temperature. Live individuals were counted, and 30 females were collected for biomarker samples in triplicate, as described earlier. After counting, the eggs were left to hatch on the same Petri dish in incubation temperature for 5 days and then preserved in acid Lugol’s solution. Eggs and hatched nauplii were re-counted afterwards for total egg production (eggs and nauplii) and hatching success (hatched nauplii/total egg production). The remaining 10 females were preserved for body size analysis. Prosome length (PL) was measured under a Leica MZ12 microscope with a Nikon DS-L3 camera. The experiment was conducted once, during 10–16 August 2020.
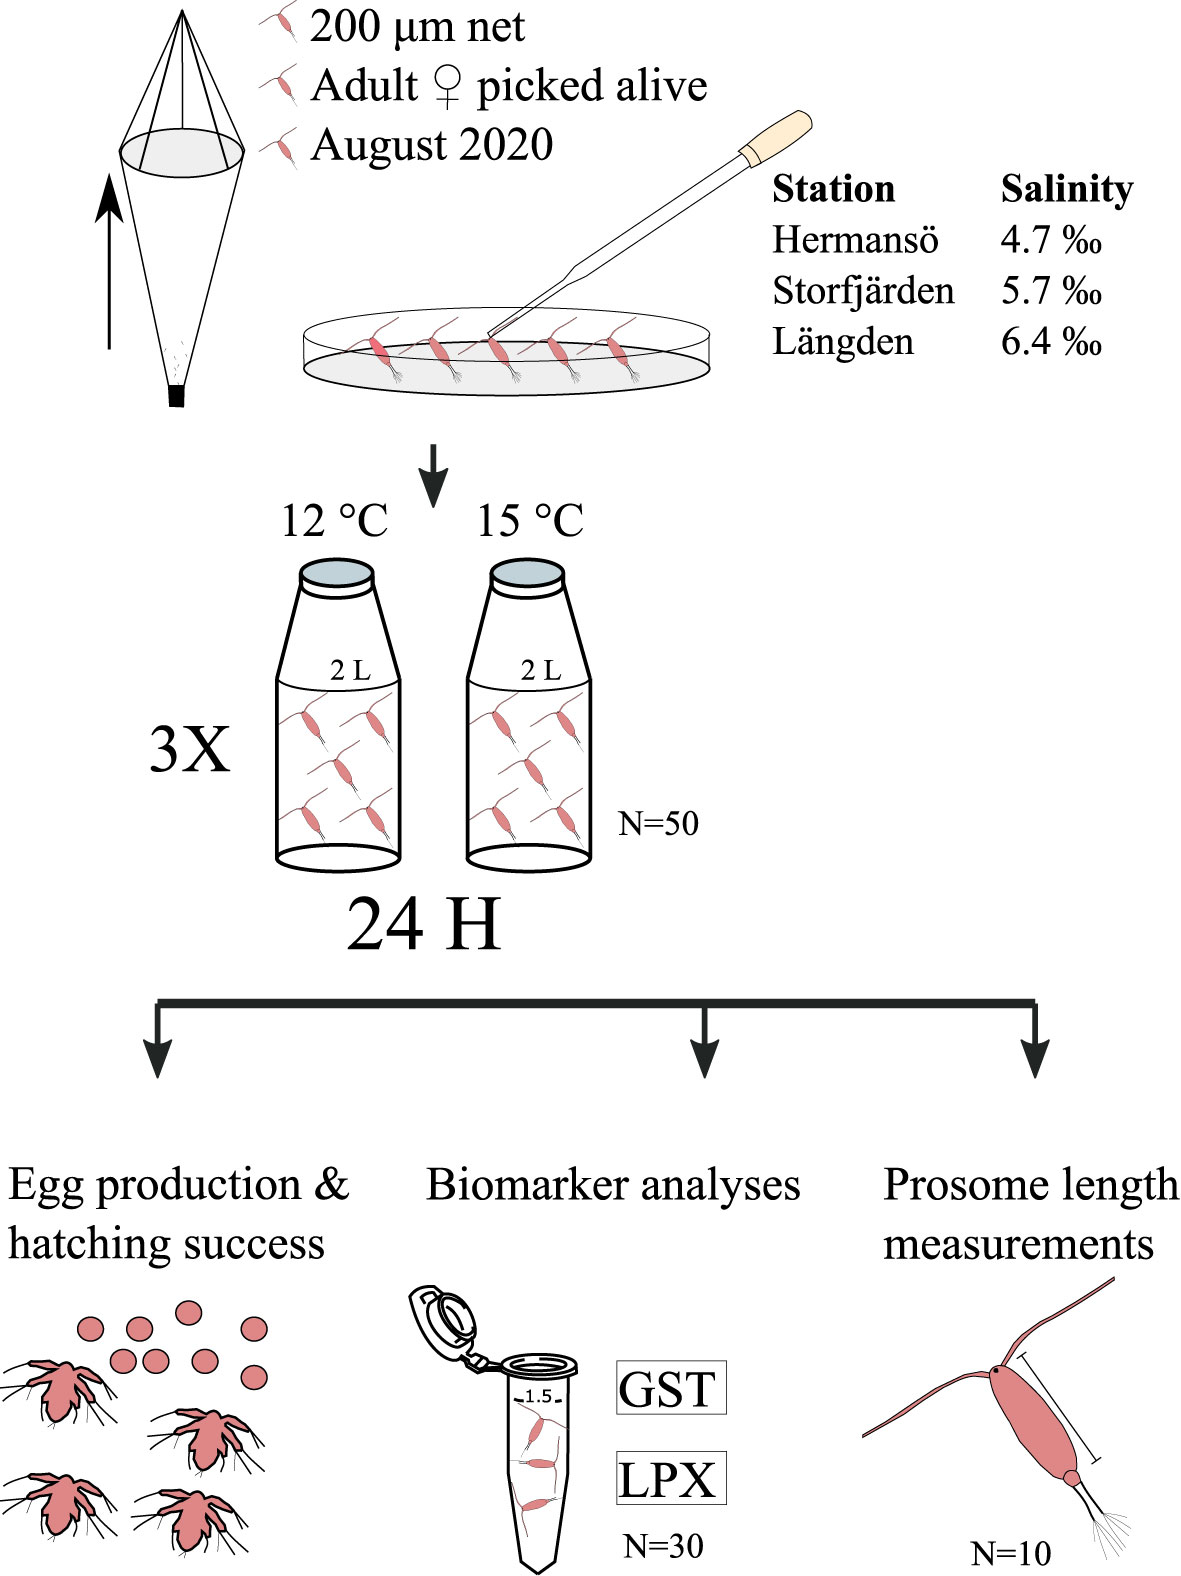
Figure 2 Experimental setup in August 2020. Adult Acartia sp. were collected from Hermansö, Storfjärden, and Längden using a 200-µm net and then picked alive under a microscope for 24-h incubation. The eggs and nauplii were counted from the sample, and 30 females were picked for biomarker analyses for GST and LPX analyses. The remaining 10–15 females were stored in acid Lugol’s solution for PL measurements.
In order to assess how Acartia sp. responded under different thermal regimes, both experimentally and in the field, the level of antioxidant defense and oxidative stress were measured. Thirty adult Acartia per sample were homogenized in 100 μl of 0.1M K2HPO4 .+.0.15.M KCl buffer (pH 7.4) using a Tissue Lyser II bead mill (Qiagen, Hilden, Germany), 3 × 2 min at 30 shakes s–1 after adding two stainless steel beads (1 mm). Thereafter, 25 and 5 μl of raw homogenate were aliquoted in new Eppendorf tubes, flash frozen in liquid nitrogen, and successively stored at −80°C for lipid peroxide (LPX) determination and bicinchoninic acid (BCA) protein assay, respectively. The rest of the homogenate was centrifuged at 10,000g at 4°C for 15 min, and supernatant was collected and aliquoted in different tubes for further assays. Residual supernatant was stored at −80°C and used as back up in case unexpected issues occurred during downstream applications. Total protein concentrations were determined using a BCA Protein Assay kit (Thermo Scientific, Rockford, IL, USA) using serial dilution of bovine serum albumin (1–6 mg ml–1) as a standard (Thermo Scientific, Rockford, IL, USA). Spectrophotometric measurements were performed at 570 nm using a Wallac EnVision 2103 Multilabel Reader (Perkin Elmer, Turku, Finland). Activity of glutathione s-transferase (GST) was determined based on the conjugation of reduced glutathione (GSH) to 1-chloro-2,4-dinitrobenzene (CDNB) according to Habig et al. (1974), with a few modifications as previously described by Vuori et al. (2015). Briefly, 3 μl of the sample (containing 0.195 mg ml–1 protein) was mixed with 47 μl of reaction mix [98% 0.1M phosphate-buffered saline (PBS) and 1% 200 mM reduced glutathione + 1% 100 mM CDNB] in a 384-well plate and absorbance was read at 340 nm for 6–13 min. Lipid peroxidation (LPX) was detected using the ferrous oxidation-xylenol orange method (FOXII) following the protocol described in Vuori and Kanerva (2018). Briefly, 25 μl of homogenates was diluted in 90 μl of methanol and incubated 10 min at RT before being centrifuged at 3,000g for 5 min. The supernatants were collected and diluted in methanol to a final volume of 100 μl for the measurements. The samples were incubated in the dark for 2 h at room temperature with 900 μl of reaction mix [one part of 2.5 mM ammonium iron (II) sulfate in 0.25 M H2SO4 + 9 parts of 0.111 mM xylenol orange in methanol] after which the absorbance was measured at wavelength of 590 nm with a Wallac EnVision 2103 Multilabel Reader (Perkin Elmer, Turku, Finland). All the samples, standards, and blanks were analyzed in triplicate. When needed, a plate control sample was analyzed to account for variability between plates. For all the assay performed, triplicates with a mean coefficient variation percentage (CV%) over 10 were discarded from the analyses.
R version 4.1.1 was used for all statistical analyses (R Core Team, 2021), and package ggplot2 was used for graphics (Wickham, 2016). Simple linear model (lm) was used in testing the relationship between egg production rate (eggs-1 day-1, later EPR) and environmental variables. Spearman’s rank sum test was used for all presented correlations, but also instead of lm when data was non-normal. Such data included field biomarkers that were tested against environmental variables. Normality was tested using a Shapiro–Wilk normality test (p > 0.05) before running any parametric tests or models that assume normality. Chl a concentration between sampling months was tested using Kruskal–Wallis test, after which a Dunn’s test was conducted using package dunn.test (Dunn, 1961; Dinno, 2017). Two-way ANOVA was used for analyzing differences in EPR, prosome length (PL ) and PL -corrected EPR (EPR divided by mean PL) between sampling sites and experimental treatments (treatment nested within sampling site). One- and two-way ANOVAs and multiple regression were used in analyzing in situ data and carried out by using aov-function in R (Chambers et al., 2017). Tukey’s honestly significant difference (HSD) was used as a post-hoc, using package broom (Robinson et al., 2020). Principal component analysis (PCA) was performed with package FactoMineR (Lê et al., 2008); missing values were handled with package missMDA (Josse and Husson, 2016).
The surface water temperature (0–5 m) in Hermansö (HR) increased gradually from 13.5°C in June to approximately 17°C in August–September (Figure 3A). The thermocline was detected at 10 m in July and at 4 m in August. No clear thermocline was observed in September, but a possible halocline was found at 2 m, probably due to either river inflow or heavy rainfall, accumulating fresh water on the surface layer. The surface salinity in HR was lowest in June: 4.5‰ at 1 m and 5.2‰ at 5 m (Figure 3B). The salinity increased in all sampling sites towards September. At highest, the salinity was 6.1‰ at 9.4 m depth in August. In Storfjärden (SF), the average surface water temperature (0–5 m) increased gradually from July (14.4°C) to September (17.1°C) (data not available for June), and in the depth range of 5–10 m (Figure 3C). In September, both the halocline and the thermocline were found from below 20 m. The temperature in 20–30 m water depth increased steeply from July (7.0°C) to September (15.7°C) when the difference between the sea floor and the surface was the smallest. Salinity in SF was always the highest in 20–30 m depth range, but salinity decreased gradually from June (6.7‰) towards September (6.1‰) in the whole water column (Figure 3D). The lowest salinity in SF was in June. In Längden (LN), the temperature in both 0–5 m and 5–10 m increased gradually from June to September (Figure 3E). The thermocline was found from 10 m in July and August. In September, thermocline was reached at 25 m and a possible halocline at 30 m. Thus, the mean temperature in 20–30 m depth range (16.2°C) was close to the temperature in 0–5 m (17.2°C). LN was the most saline sampling site with salinity at its highest in July: 6.8‰ in 20–30 m depth range, 5.4‰ in 0–5 m, and 5.5‰ in 5–10 m (Figure 3F). The difference between the upper (0–10 m) and the lower water column (20–30 m) decreased in August and September, when the salinity in the upper water column increased, and salinity in the lower water column decreased from July to September.
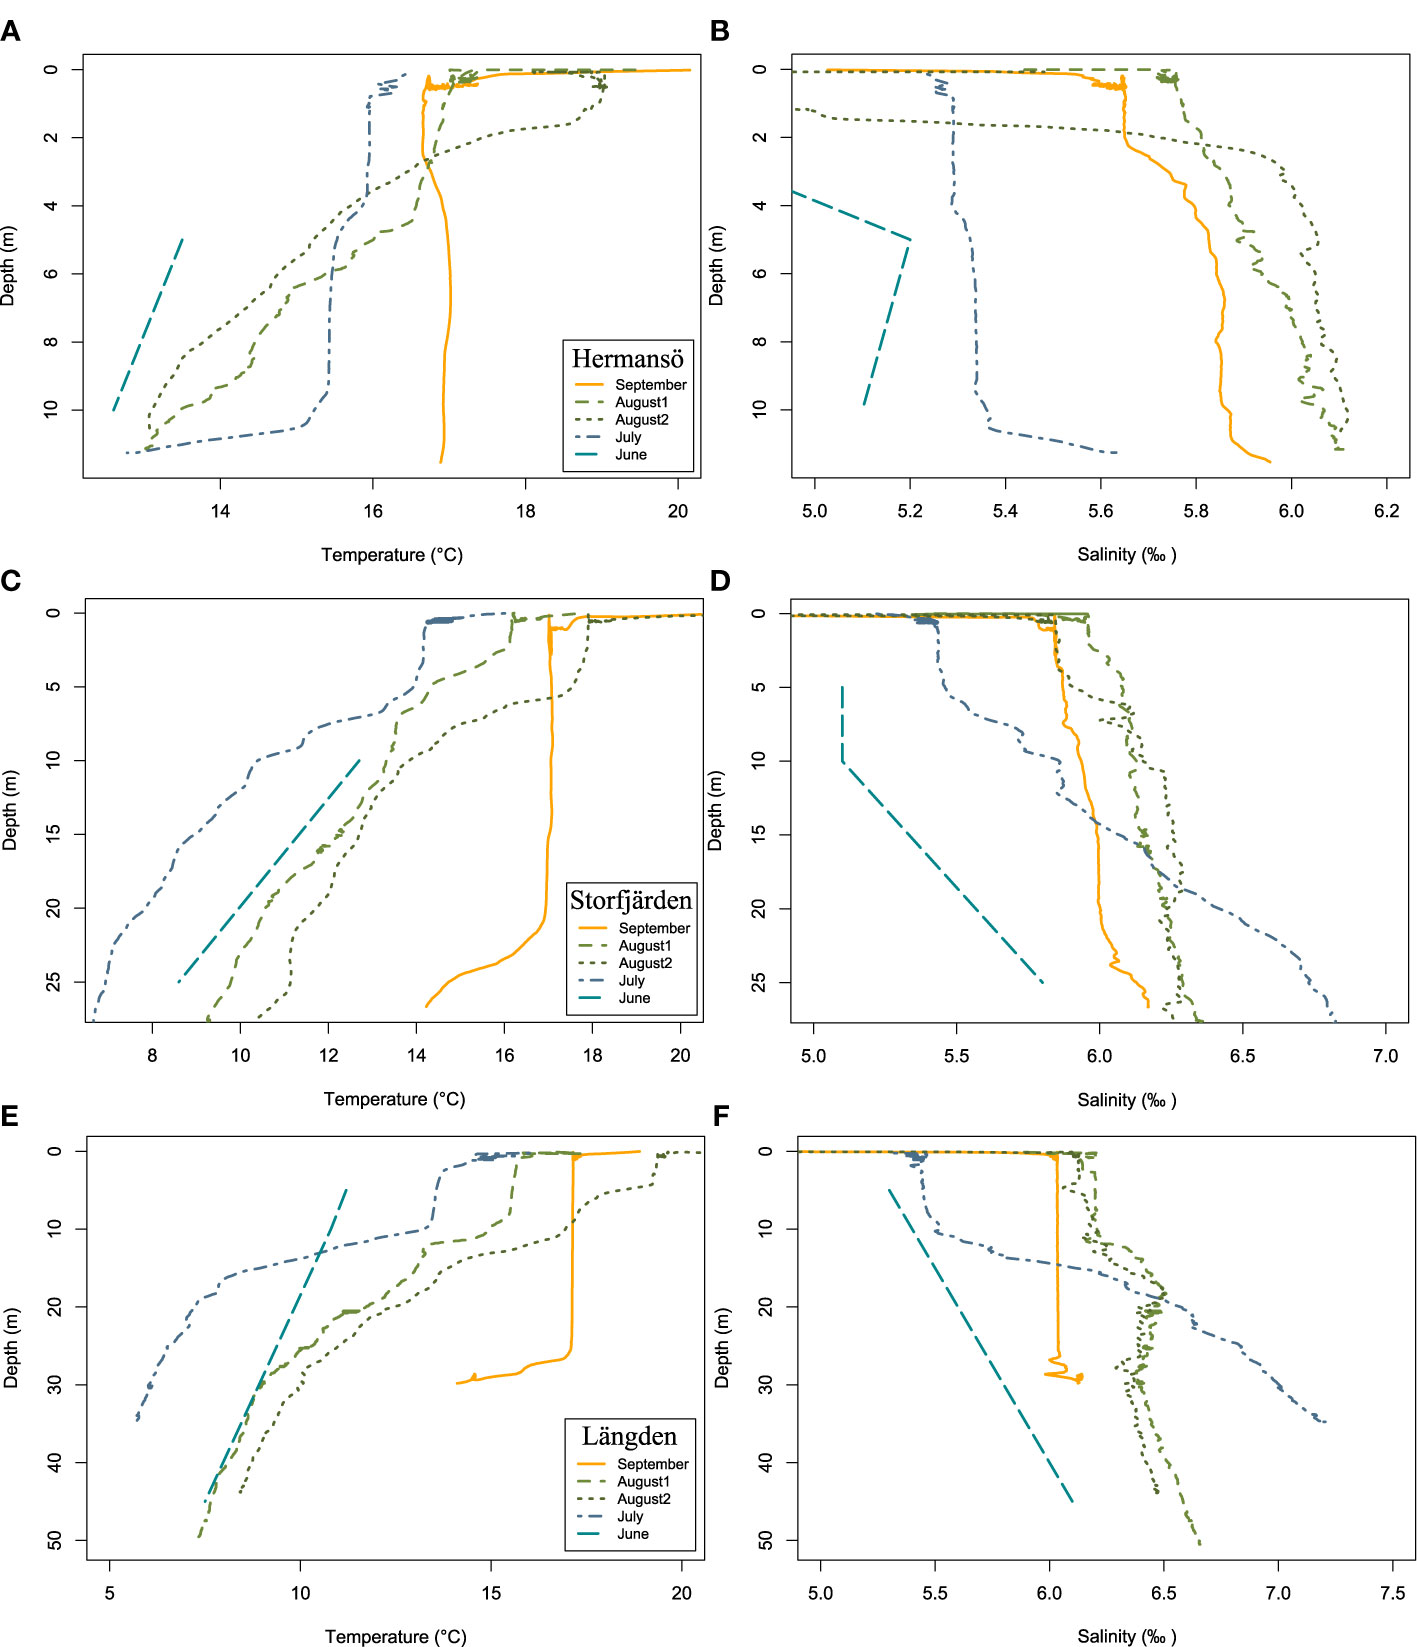
Figure 3 Temperature and salinity in (A, B) Hermansö, (C, D) Storfjärden, and (E, F) Längden. The legend shows sampling month and applies also to the salinity plot. August 2 refers to experimental sampling week.
Chlorophyll a (Chl a) peaked in June in SF and LN: Chl a concentration was 7.7 μg L–1 in LN and 4.1 μg L–1 in SF, and it decreased significantly from June to July in both sampling sites (Dunn's test, Z=−2.95 in SF and Z=−2.64 in LN, p > 0.05). Then, the assumed primary production gradually increased towards mid-August and decreased slightly in September. The succession in HR was different from the other sampling sites: Chl a concentration peaked in July (5.0 μg L–1) and was the lowest in early August (2.1 μg L–1). Chl a concentration did not have a significant effect on field EPR, GST, or LPX (Spearman’s rank correlation). The oxygen levels in the field were normoxic throughout the summer [>6 mg L–1, according to Diaz (2016)], except for LN and SF in September, when oxygen concentration was 5.4 mg L–1.
Egg production rate in HR was highest in August (3.7 eggs –1 day–1 on average), and the overall variation was 0.1–4.5 eggs –1 day–1 throughout the season (Figure 4). In SF, the highest EPR was reached in June (4.9 eggs –1 day–1 on average, maximum of 7.1 eggs –1 day–1). Reproductive output decreased gradually towards September, when the average EPR was only 0.5 eggs –1 day–1. Moreover, one-way ANOVA showed a significant decline in SF between June–August and June–September and in LN between August–September (Figure 4). The highest EPR in LN was reached in August, with an average of 3.8 eggs –1 day–1 and maximum of 4.6 eggs –1 day–1. The reproduction was at its lowest in September, when EPR decreased below 1.3 eggs –1 day–1 in all sampling sites. Linear regression (lm) showed that temperature in 10 m had a negative impact on EPR in Hermansö (est.=−0.6 ± 2.0, t=−2.8, p < 0.05), whereas salinity had a negative impact in Storfjärden (est.=−4.7 ± 1.2, t=4.0, p < 0.01) (Figure 5). Multiple regression showed that EPR was significantly affected by sampling date; the effect of salinity was almost significant (p< 0.1), but the interactive effect of date and salinity on EPR was significant (p<0.001, Table 1).
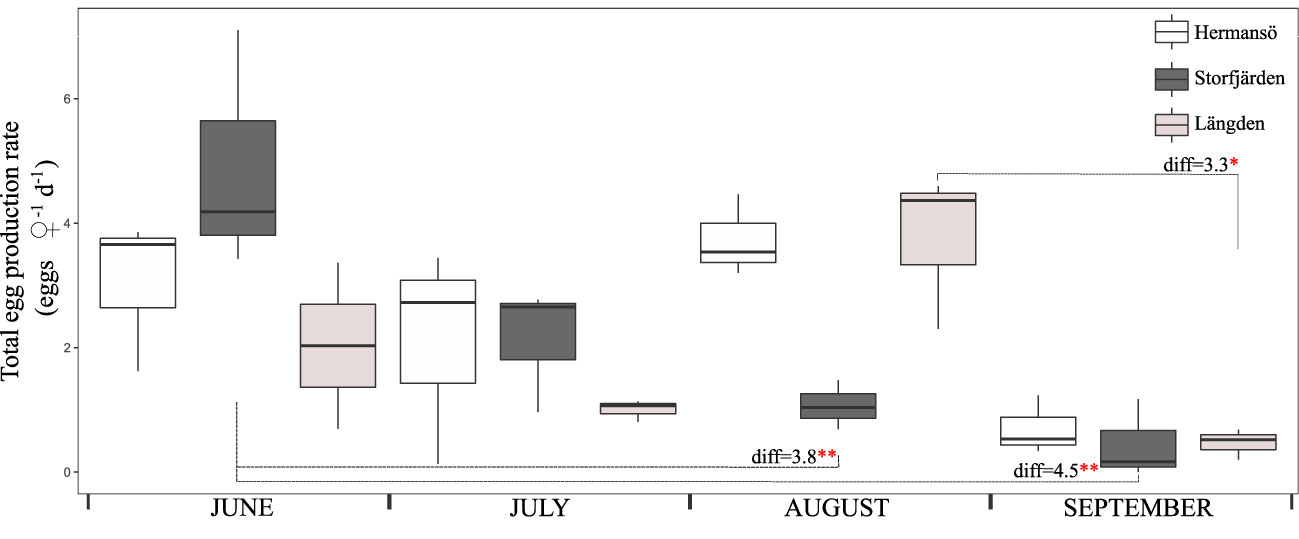
Figure 4 Field egg production rate in all sampling sites throughout the summer 2020. The boxplots show the median (horizontal line), interquartile range (IQR, the box), and minimum and maximum within 1.5 × IQR (“whiskers”). The result of one-way ANOVA is marked between sampling sites for significant differences between sampling occasions. **p < 0.01, *p < 0.05.
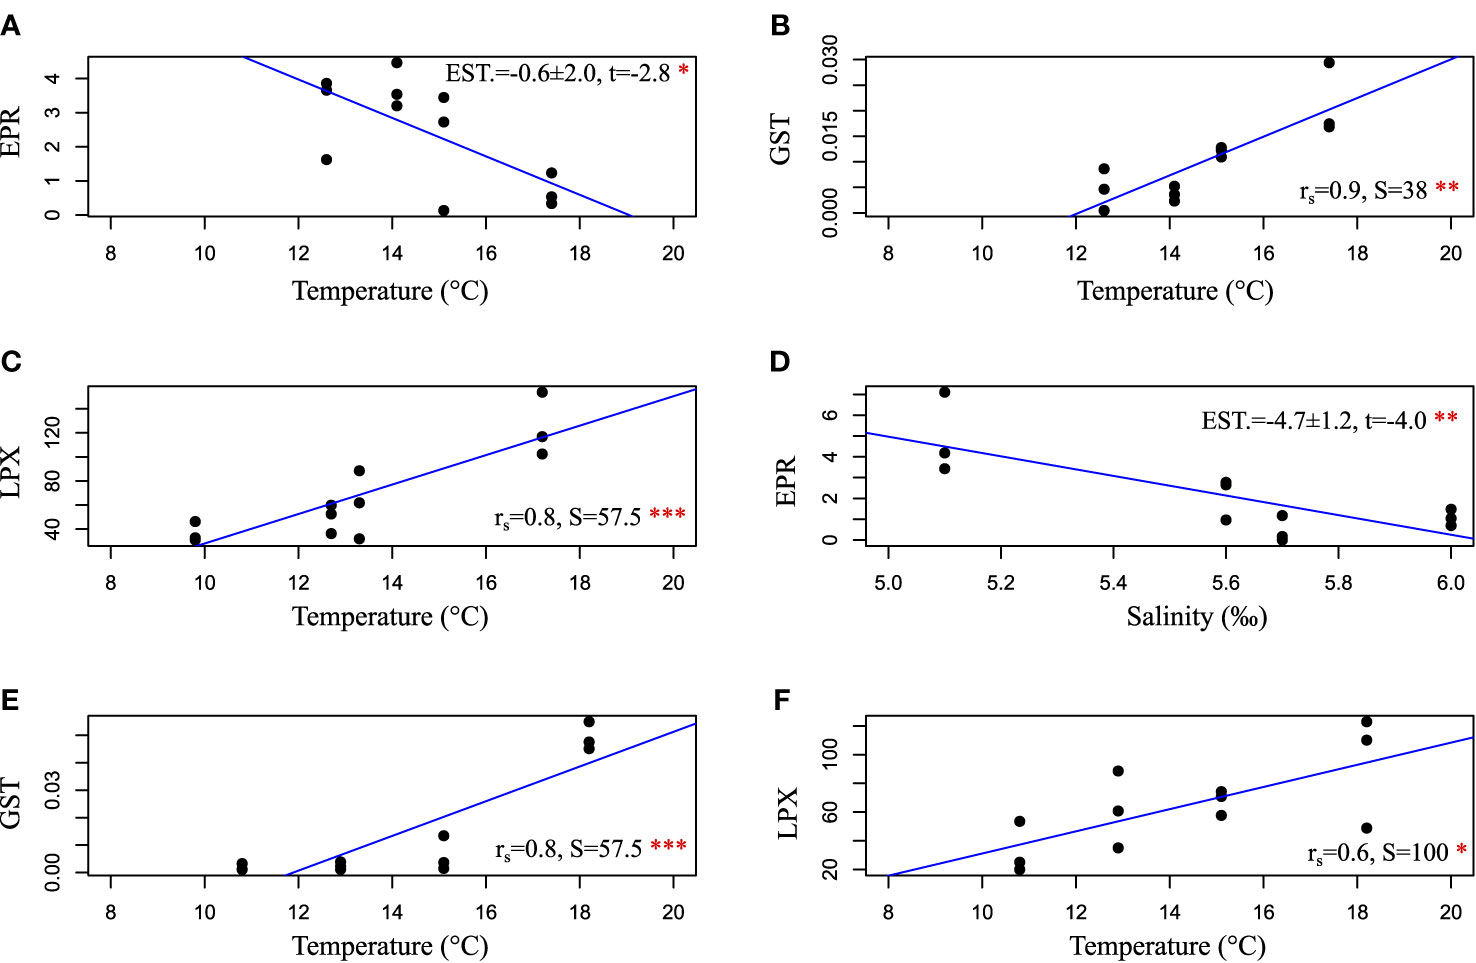
Figure 5 Figure shows significant relationships between environmental factors (salinity or temperature in 10 m) and egg production rate, LPX, and GST in the field in (A, B) Hermansö, (C, D) Storfjärden, and (E, F) Längden. Regression is shown as a blue line. Results of linear model (EPR results only) or Spearman’s rank correlation (LPX and GST results) are shown. ***p < 0.001, **p < 0.01, *p < 0.05.
LPX varied between 19 and 154 FOX mg–1 during the field season, and GST activity varied between 0.0005 and 0.0550 μmol min–1 mg–1. LPX and GST activity increased significantly from the early summer towards September in LN and SF (Figure 6). Field LPX and GST activity were positively correlated (0.44, t = 3.18, df = 43, p = 0.003). Temperature (in 10 m) increased GST activity in HR (Spearman’s rank correlation, rs =0.9, S=38, p<0.01) and LN (rs =0.8, S=57.5, p<0.001), while temperature increased LPX in SF (rs =0.8, S=57.5, p<0.001) and LN (rs =0.6, S=100, p<0.05) (Figure 5). GST activity and EPR were negatively correlated in the field (rs =−0.5, S = 9782, p < 0.01). Two-way ANOVA showed a significant effect of sampling date on LPX and GST and a significant interactive effect of date and sampling site on GST (Table 1). The same result was given when dates were replaced by temperature in 10 m in the test; date and temperature were highly correlated in the field data (rs =0.85, S= 1,235.4, p<0.001).
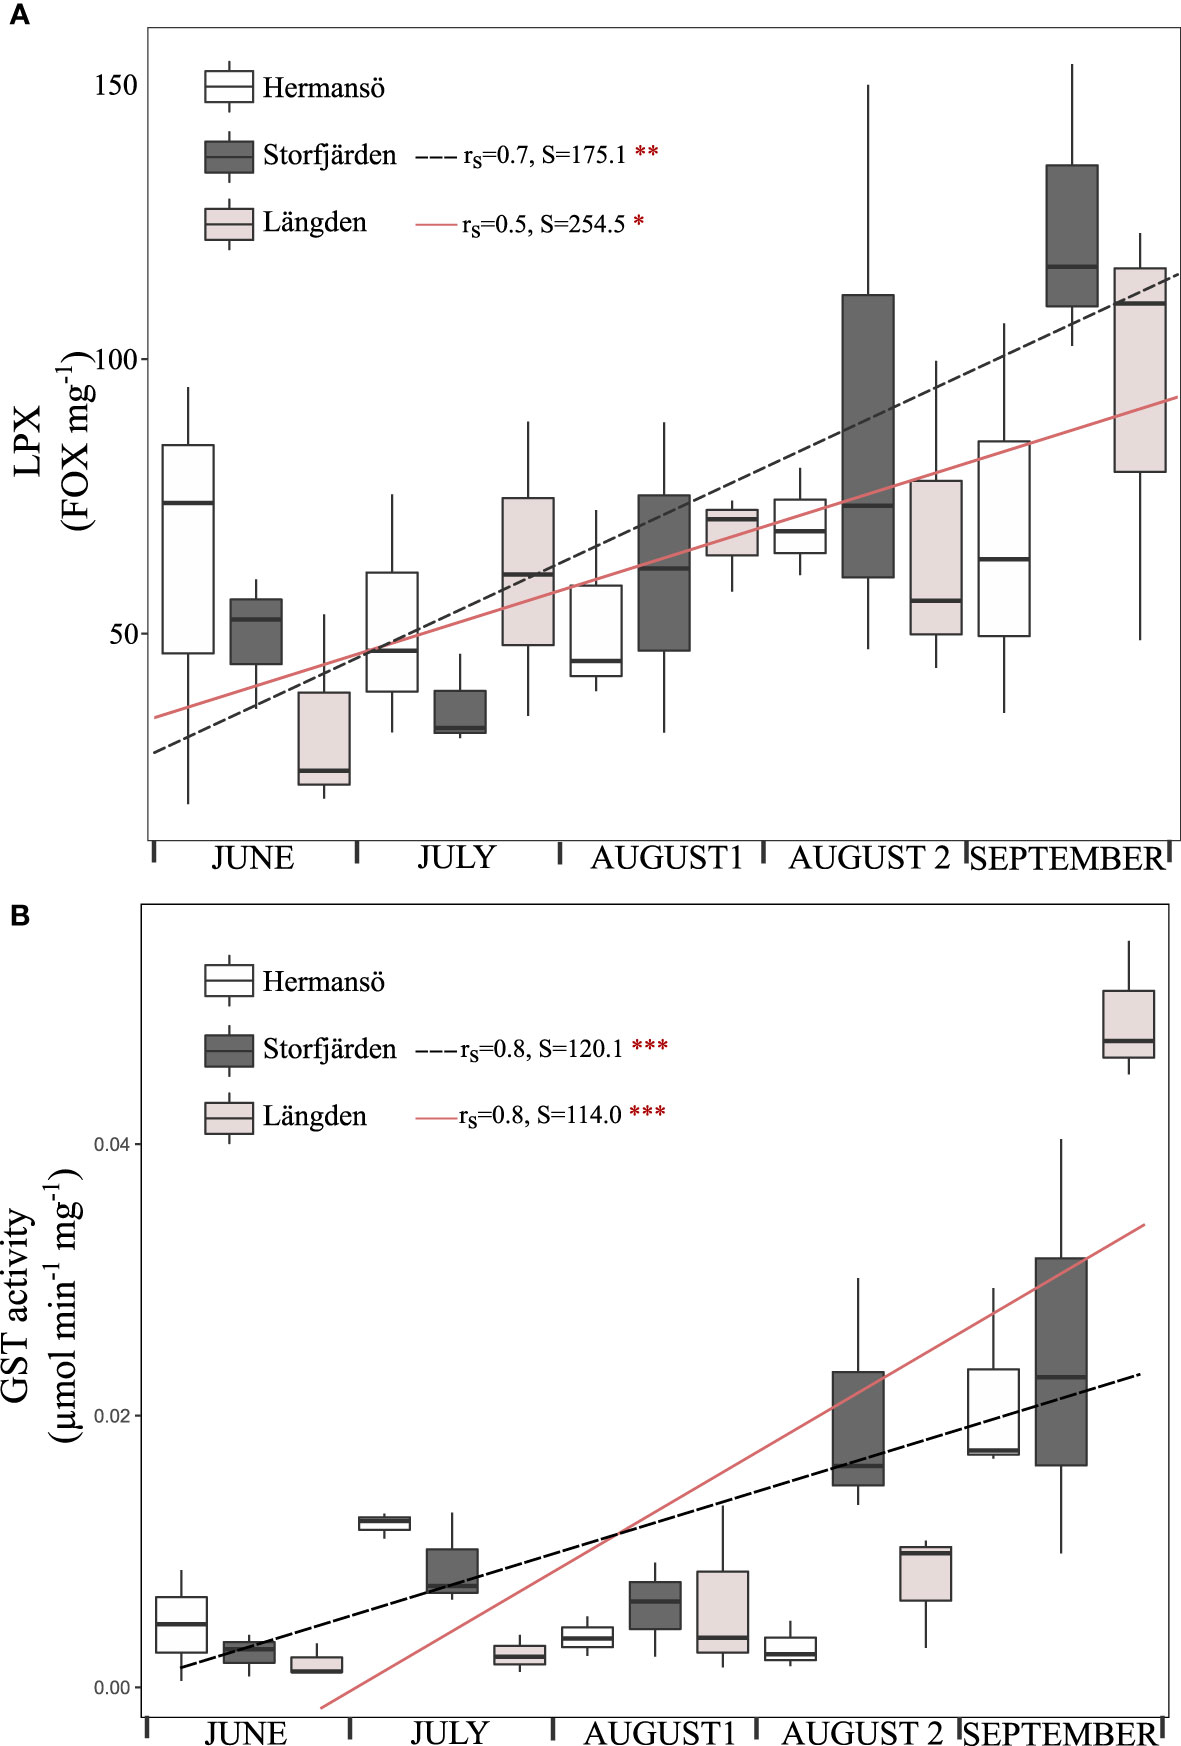
Figure 6 Lipid peroxidation (A) and GST activity (B) in the field during summer 2020. August 2 shows the field oxidative stress during the experimental week. The boxplots show the median (horizontal line), interquartile range (IQR, the box), and minimum and maximum within 1.5 × IQR (“whiskers”). Regression is shown as a dashed black (SF) and rose pink (LN) lines (X-axis: number of days since first sampling). Results of Spearman’s rank correlation are shown. ***p < 0.001, **p < 0.01, *p < 0.05.
Biological (field EPR, GST, and LPX) and environmental variables (Chl a, temperature, and salinity in 10 m) were included in principal component analysis (PCA), where the first two principal components (PC1 and PC2) explained 66% of variation (Figure 7). PC1 was negatively associated with EPR but positively on GST, LPX, and temperature (measured in 10 m); temperature was the main driver in PC1. Salinity and Chl a were associated with PC2 (Table 2A). The third component had an eigenvalue of 1 but is reported in the PCA matrix in Table 2 in order to increase the cumulative variance to 79%. The PCA loading plot visualizes how data points group according to sampling month rather than sampling site and how EPR is set to the opposing side to temperature, LPX, and GST along PC1.
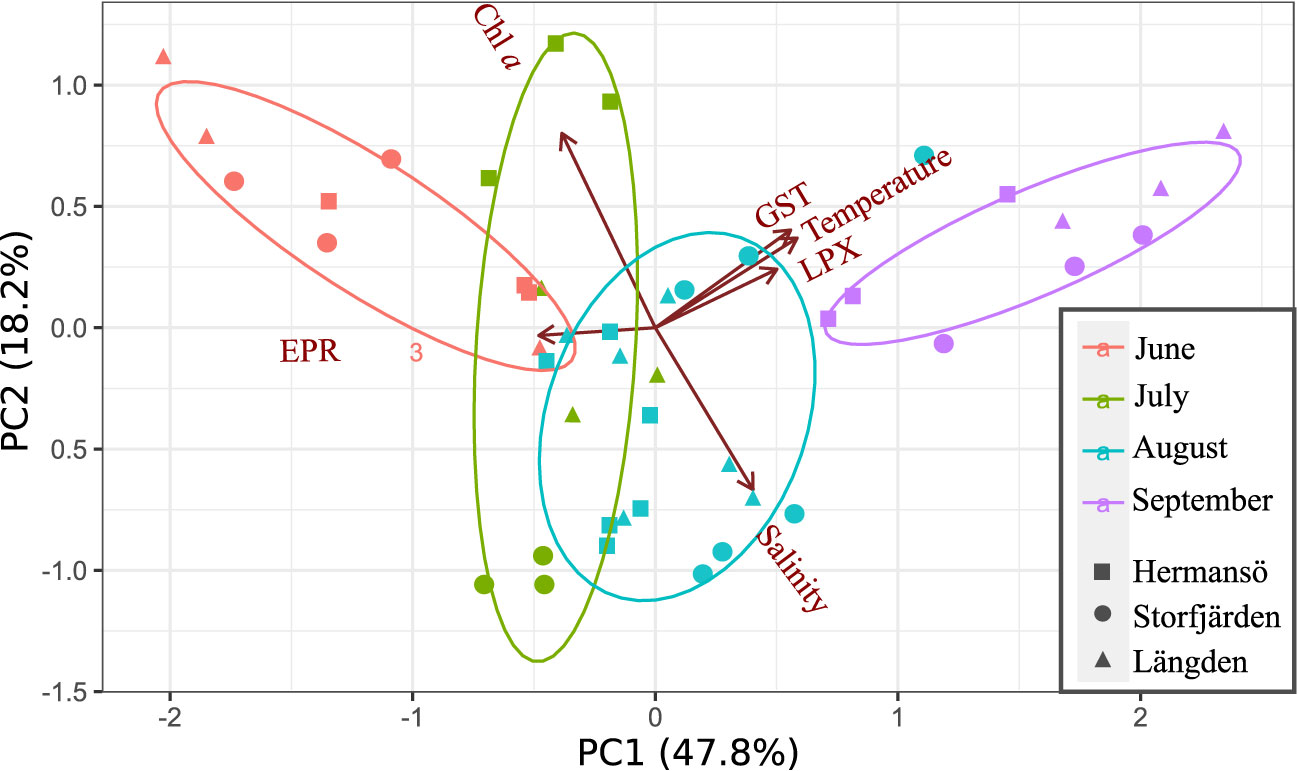
Figure 7 Loading plot of a principal component analysis (PCA) of two first principal components, PC 1 and 2. The analysis includes GST activity, LPX, and egg production with environmental variables chlorophyll a concentration and temperature and salinity in 10 m in the field. Sampling months appear in colors, and sampling sites are marked as square (HR), circle (SF), and triangle (LN).
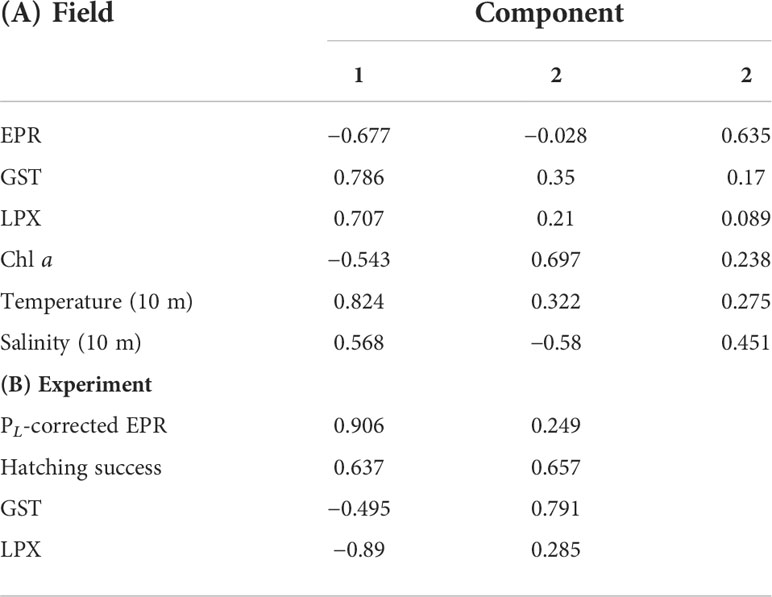
Table 2 Component matrix of first two or three principal components of a principal component analysis for (A) Figure 8 and (B) Figure 10.
Prosome length (PL ) was significantly different between all sampling sites (two-way ANOVA: df=2, sum sq= 160,727, mean sq = 80363, f= 19.2, p<0.001; Table 3; Figure 8). Females were largest in HR and smallest in SF, and the overall range in female size was 568–870 μm in the experiment. There was no statistical difference in PL between control and temperature treatments within the same sampling site. Egg production rate in copepods derived from HR was 1.13 eggs female–1 day–1 on average (control) and did not differ much from the elevated temperature treatment (1.19 eggs –1 day–1) (Table 3). In SF-derived copepods, egg production rate was 0.97 in control treatment and lower, 0.58 eggs –1 day–1 in temperature treatment, although the difference was not statistically significant. Egg production rate was the highest in LN: 2.0 eggs –1 day–1 in both control and temperature treatment (Figure 8). EPR and PL -corrected EPR were significantly higher in LN than in any other sampling site (Table 4), but temperature treatment had no effect. Egg hatching success varied between 83% and 89% in HR-derived copepods, and the mean hatching rate in control treatment (85.7%) was lower compared to both SF (87%, 72%–100% range) and LN (mean 95%, 82%–97% range), although not statistically significantly different (Figure 8). In SF, egg hatching success did not differ significantly between control (mean, 95%) and temperature treatment (mean, 90%).

Table 3 Body sizes (prosome length PL) of adult Acartia sp. copepods after egg incubation in the experiment, egg production rates (EPR), and hatching success (HC) with standard errors.
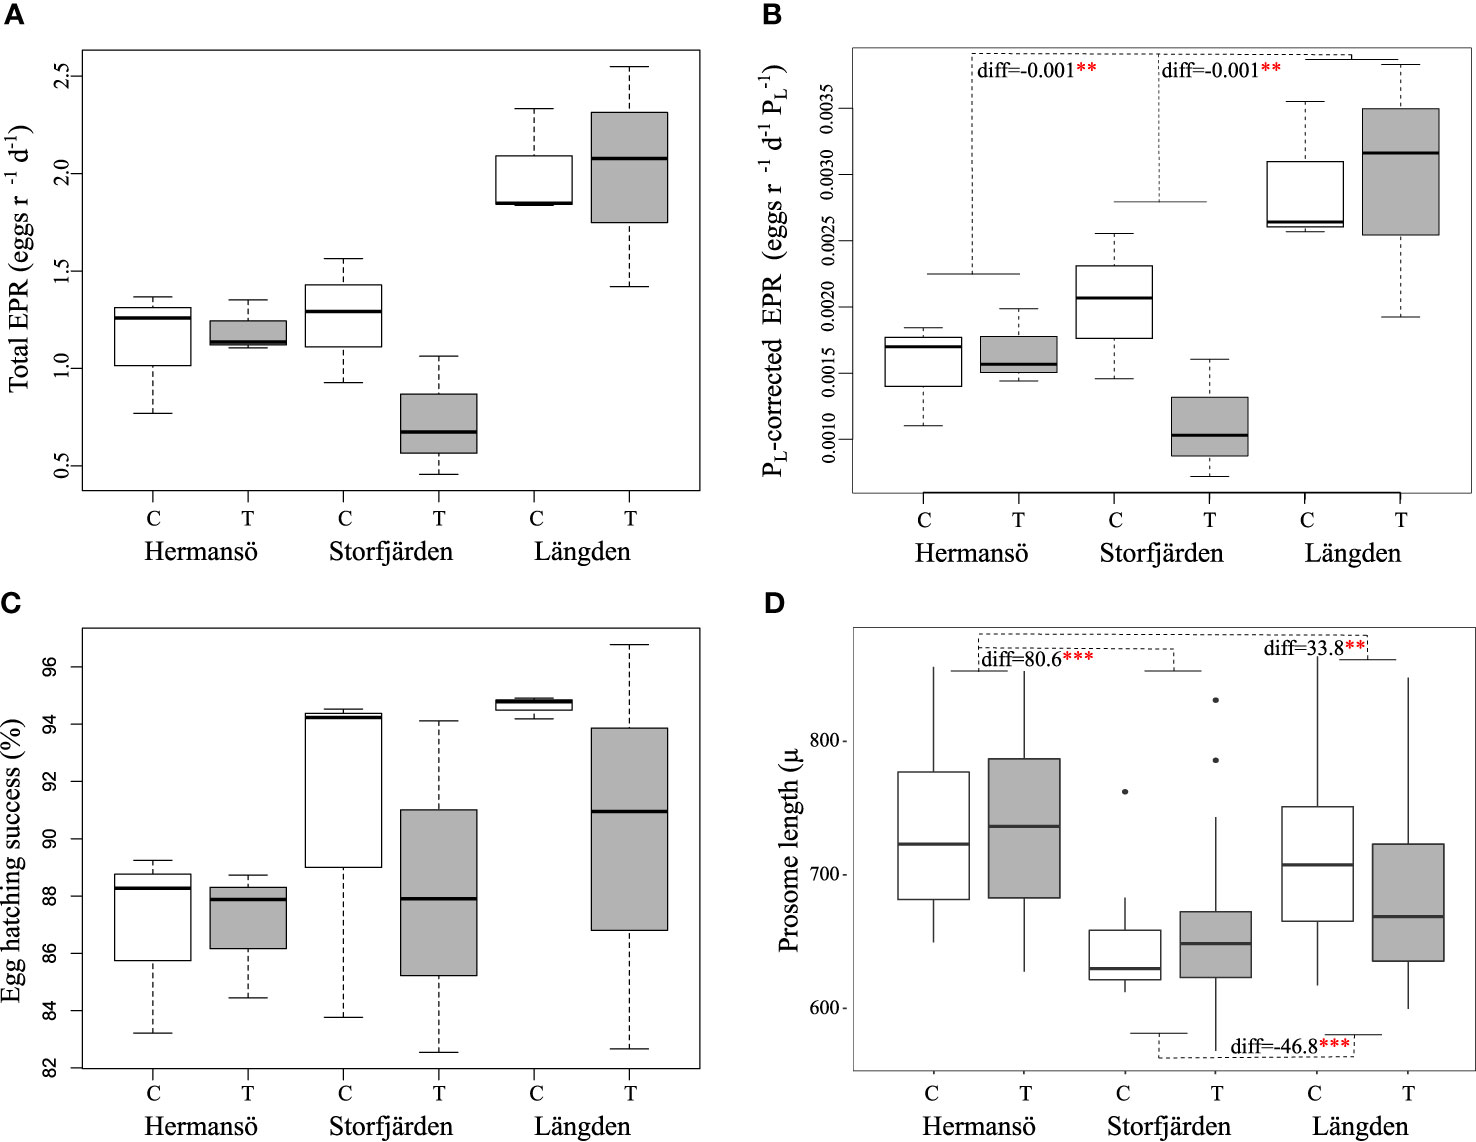
Figure 8 (A) Egg production rate, (B) PL-corrected egg production rate, (C) egg hatching success, and (D) PL in control (C) and temperature (T) treatments of the experiment. The result of one-way ANOVA is marked between sampling sites for significant differences in panels (B) and (D). ***p < 0.001, **p < 0.01, *p < 0.05.
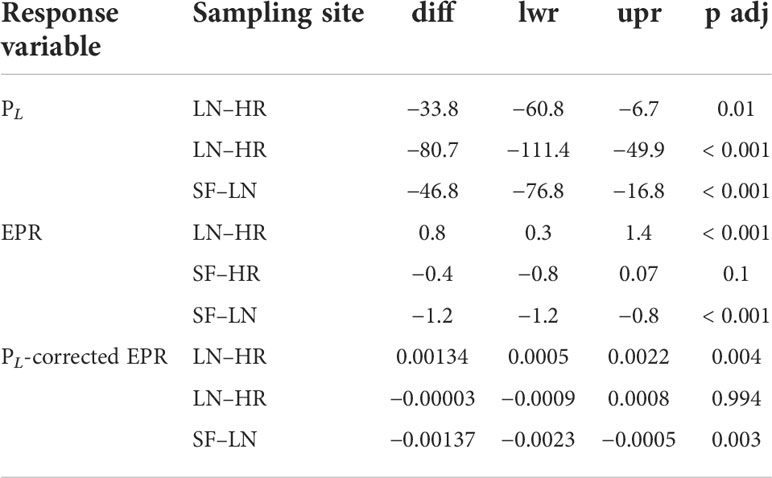
Table 4 Results of post-hoc tests after two-way ANOVA for experiment data of PL, EPR, and PL-corrected EPR.
LPX and GST activity data of the experiment are only available for SF and LN samples due to loss of HR samples. LPX in the experiment varied between 34 and 182 FOX mg–1, while GST activity was 0.003–0.037 μmol min–1 mg–1 (Table 3, Figure 9). LPX and GST correlate positively in experimental data (0.56, t = 2.44, df = 13, p-value = 0.03). GST activity and LPX measured after the experiment were not significantly different from the fresh samples from the field (tested with Kruskal–Wallis). LN-derived copepods had lower LPX in the experiment compared to copepods from SF (Figure 9A), while GST activity was not significantly different between sampling sites (Figure 9B). Temperature treatment had no effect on biomarkers. Principal component analysis of the experimental data consisted of hatching rate, PL -corrected EPR, hatching rate, GST, and LPX. Two first principal components PC1 (56.6%) and PC2 (30.0%) explained 86.6% of the total observed variation, and both components had an eigenvalue >1. PC1 was positively associated with EPR and LPX negatively, while PC2 was positively associated with hatching rate and GST activity (Table 2B). PL-corrected EPR and LPX were the main drivers in PC1, where they were on opposite sides. The loading plot shows that all LN treatments (except for L-T1), and HR, form clear clusters within the sampling site, while SF is more scattered (Figure 10). LN showed generally better oxidative status (lower LPX) and GST activity while having generally better EPR than HR.
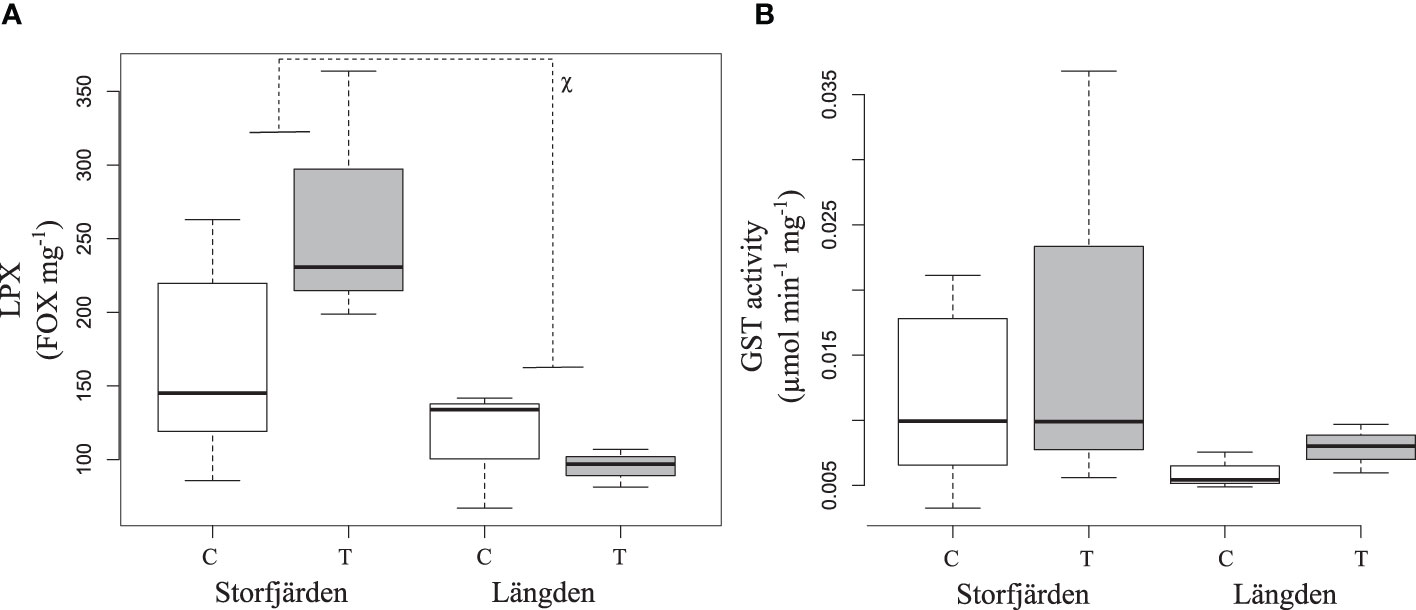
Figure 9 Lipid peroxidation (A) and GST activity (B) in the experiment conducted in August 2020. C and T refer to control and increased temperature treatment. The boxplots show the median (horizontal line), interquartile range (IQR, the box), and minimum and maximum within 1.5 × IQR (“whiskers”). The result of a Kruskal–Wallis test is marked between sampling sites for significant differences in panel (A). *p < 0.05.
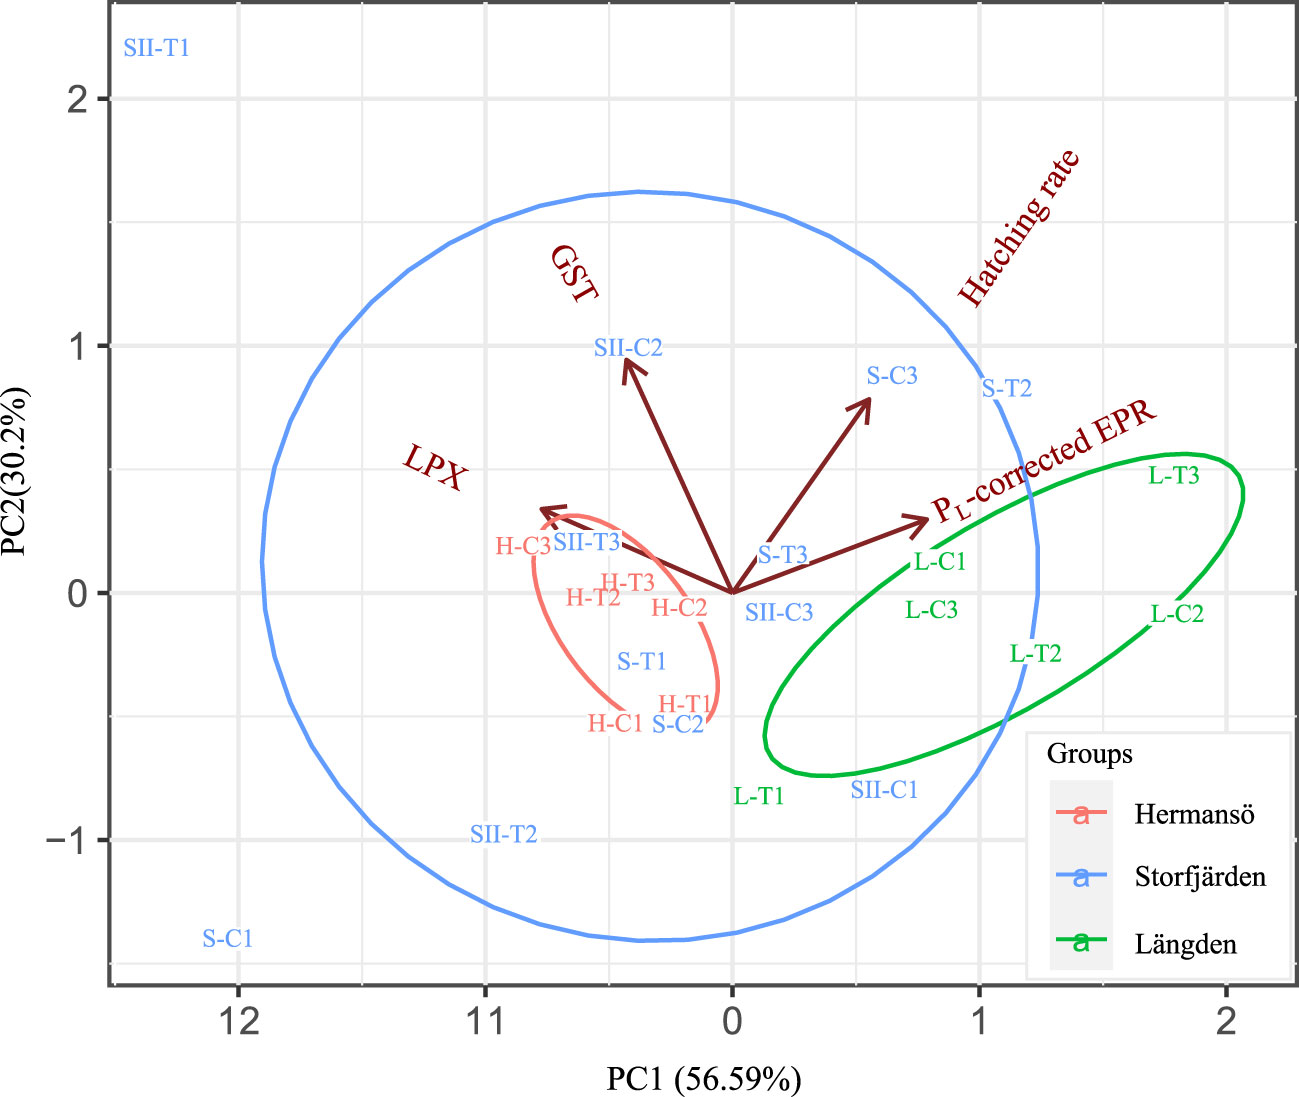
Figure 10 Loading plot of a principal component analysis (PCA) of two first principal components, PC 1 and 2. The plot shows GST activity, LPX, and PL-corrected egg production rate in the experiment. Oxidative results are included only for L- and SII-marked samples.
The prime objective of this study was to assess the possible effects of decreasing salinity, increasing temperature, or their combination on copepods in experimental setup and field-based observations. We hypothesized that copepods have weaker oxidative status and lower reproductive success in suboptimal salinity and high temperature. Indeed, a negative effect of the heatwave occurred during the sampling season, June–September 2020 in the Gulf of Finland; the field data showed that temperature increased lipid peroxidation, glutathione-s-transferase, or both in all three sampling sites, and had a negative effect on egg production in the lowest-salinity sampling site. The biomarker data suggest that the temperature-induced stress overwhelmed the antioxidant system and failed to prevent oxidative damage during the heatwave. Moreover, a trade-off between antioxidant activity and reproduction occurred—possibly fueled by the heatwave. The experimental data highlighted the importance of the sampling site, while temperature treatment had little effect on oxidative status and reproduction.
Summer 2020 was exceptionally warm, and especially the high temperatures recorded in August–September can be considered as a heatwave in all sampling sites. The temperatures in Storfjärden were much higher in summer 2020 than the mean temperatures measured during 1927–2011, in corresponding months and depths (Merkouriadi and Leppäranta, 2015). The heatwave during the sampling season may have drawn the copepods towards their upper thermal limit, which can be seen from the pattern where GST activity continuously increased with temperature, while LPX accumulated nevertheless, indicating increasing oxidative stress. The increase in GST fits well with previous findings that glutathione metabolism, including GST, responds effectively to increasing LPX in copepods (Vuori et al., 2015; Glippa et al., 2018; von Weissenberg et al., 2022). Temperature increased GST, LPX, or both in all sampling sites in this study, indicating that the oxidative status of copepods was affected by temperature, independent of the salinity level of the sampling locations. Moreover, temperature had a negative impact on EPR in Hermansö, which was the sampling site of the lowest salinity. Interestingly, our data also show a significant negative correlation between GST activity and EPR in the field, and the pattern was the most apparent in September, when GST activity was high and EPR low. It is possible that the maintenance of increasing GST activity in August–September had negative consequences on reproductive effort, a phenomenon known as trade-off (Monaghan et al., 2009). Thermal stress causes increased oxidative stress, which again can both constrain and stimulate reproduction (Metcalfe and Alonso-Alvarez, 2010) of the copepod population. If heatwaves increase in frequency, magnitude, and length in the future, as predicted by Meier et al. (2022), the potential trade-off between reproduction and oxidative status may cause decreased condition and fecundity of the copepod community (Vehmaa et al., 2013; von Weissenberg et al., 2022).
Diel vertical migration is a common behavior for A. bifilosa to avoid visual predation during the day but allows feeding near the surface at night (Almén et al., 2014). This behavior possibly protects copepods from the heatwave, at least during part of the day, if the site is deep enough to offer cool water. However, thermocline was reached in deep water layers (relative to maximum depth) in all sampling sites in September—in Storfjärden, the temperature was approximately 16°C in 20–30 m, compared to 8°C–11°C in previous years (Merkouriadi and Leppäranta, 2015). Längden is twice as deep as Storfjärden and Hermansö, which may be a refuge for copepods avoiding heat, although migration to near-surface water layer is essential in order to feed.
Egg production rate in September was very low in all sampling sites, especially when comparing to previous months. Low EPR in September is unlikely to be caused by seasonality itself because Acartia sp. usually continue to reproduce in autumn, and they do not produce diapause eggs in the Gulf of Finland (Katajisto, 2003). Therefore, our results suggest that the very low egg production rates in September were caused by a heatwave. In addition to temperature, low food availability could have affected reproductive output. Chlorophyll a concentration suggests that the phytoplankton bloom was strongest in June. In contrast, Chl a concentration was only 1.8–2.9 μg L–1 in September. A. bifilosa is well adapted to variations in food availability and is able to maintain substantial reproduction even at 5 μg L–1 (Koski and Kuosa, 1999). Although EPR is enhanced in higher concentrations, at least up to 24 μg L–1 (Koski and Kuosa, 1999). Moreover, we cannot exclude a possibility of low food quality in the field, since we do not have data of phytoplankton community. High abundances of cyanobacteria, such as Nodularia sp., have negative consequences for Acartia sp. populations (Engström-Öst et al., 2015)—cyanobacteria blooms are typical in the late summer, when the surface water temperature is high (Kanoshina et al., 2003). Although some positive effects of feeding on Nodularia sp. have also been suggested on copepod reproduction and oxidative status (Hogfors et al., 2014), low food quality may have enhanced the negative effects of the heatwave (von Weissenberg et al., 2022).
We found a significant combined effect of salinity and sampling date on egg production rate in this study. Since sampling date and temperature had a strong, positive correlation, the found interaction may indirectly refer to the combined effect of temperature and salinity. The uppermost layer in the water column was probably affected by fresh water from rainfall in early summer because salinity increased in all sampling sites towards September. Salinity and sampling date showed a positive effect on GST activity. This finding highlights that rather subtle salinity differences are affecting antioxidant activity in copepods, supported by a previous study by Glippa et al. (2018). Our results showed a negative salinity effect on EPR in Storfjärden, while we expected the opposite. The highest salinity (in 10 m) occurred in August and September, where the high temperature coincided, although temperature was not significant in SF. However, seasonality may partly explain the difference, as sampling month in general was more important to EPR than sampling site, possibly due to temperature and food conditions as discussed in Section 4.1. Acclimation may also have played a role: it takes at least 16 days to develop from egg to adult (Yoon et al., 1998), whereas salinity changes of over 0.5‰ are possible to occur even in 1–2 weeks in Storfjärden (von Weissenberg et al., 2022). Thus, adult copepods may experience different salinity conditions than where they were developed; acclimation to salinity is more effective during development than as an adult (Lee and Petersen, 2003). Although Acartia sp. are known to retain reproductive success even after larger salinity changes (Calliari et al., 2006), reproduction of Acartia sp. can be significantly affected by salinity (Peck et al., 2015). The salinity in our study area is lower than that preferred by the study organism Acartia sp., but the range of salinity that they can tolerate is remarkably wide, 2‰–33‰ in A. tonsa and 4‰–33‰ in A. bifilosa (Viitasalo et al., 1994; Chinnery and Williams, 2004; Holste and Peck, 2006; Dutz and Christensen, 2018). Nevertheless, our data show that even subtle changes in salinity affects the reproduction and oxidative status Acartia sp., which, together with increasing temperature, may have long-term consequences on copepod communities. There are three species of Acartia present in the Gulf of Finland: A. bifilosa, A. tonsa, and Acartia longiremis. A. bifilosa have been the most common in the area of Tvärminne archipelago (Viitasalo, 1992; Hogfors et al., 2014), but A. tonsa have also been present in late summer, when the temperatures are higher (Katajisto and Viitasalo, 1998). It is possible that both species were present, although we assume that A. bifilosa were still the predominating species. A. tonsa is an alien species with tropical origin and prefers higher temperatures than cold-adapted A. bifilosa (Chinnery and Williams, 2004; Diekmann et al., 2012; Leppäkoski et al., 2013). Moreover, it is larger and has higher reproduction rate (Koski and Kuosa, 1999; Holste and Peck, 2006). These traits make increasing water temperatures beneficial for A. tonsa.
Calanoid copepod Acartia sp. in the Gulf of Finland suffered from a heatwave in late summer, which was shown as accumulating lipid peroxidation, in spite of increased activity of an antioxidant glutathione-s-transferase. The strong positive correlation between LPX and GST activity shows that glutathione metabolism had a strong response to increasing environmental stress but was unable to prevent oxidative damage from escalating during the heatwave. Moreover, our data suggest a trade-off between antioxidant activity and reproduction. Sampling date was more important than sampling site for reproduction and oxidative status in the field, but the experiment conducted in August showed that the copepods derived from Längden (deepest and most saline site) had lower oxidative stress and significantly higher egg production rate than the copepods from other sampling sites. A significant combined effect of salinity and sampling date on reproduction was found, highlighting the importance of salinity changes even in species with wide tolerance to salinity variations.
The original contributions presented in the study are included in the article/Supplementary Material. Further inquiries can be directed to the corresponding author.
JE-Ö and EW contributed to the conception and the design of the study. The field work was carried out by EW and JE-Ö, and the laboratory work (biomarkers) was performed by GM and T-MU in supervision of KA. EW organized the database, ran the statistical analyses, and prepared the first draft of the manuscript. GM and T-MU wrote the method section of biomarkers of the manuscript. All authors contributed to the preparation and the revision of the manuscript, and commented, and approved the submitted version.
This work was supported by Onni Talaan säätiö, Svenska kulturfonden (nr. 157571), Kone foundation.
We thank Tvärminne Zoological Station (University of Helsinki) and the Laboratory of Animal Physiology (University of Turku) for great research facilities, and Minna Kohonen, Janina Osanen, and Sara Karvo for assistance in the field and laboratory. We thank Anna Jansson for discussions and for help with planning.
The authors declare that the research was conducted in the absence of any commercial or financial relationships that could be construed as a potential conflict of interest.
All claims expressed in this article are solely those of the authors and do not necessarily represent those of their affiliated organizations, or those of the publisher, the editors and the reviewers. Any product that may be evaluated in this article, or claim that may be made by its manufacturer, is not guaranteed or endorsed by the publisher.
The Supplementary Material for this article can be found online at: https://www.frontiersin.org/articles/10.3389/fmars.2022.952863/full#supplementary-material
Almén A. K., Vehmaa A., Brutemark A., Engström-Öst J. (2014). Coping with climate change? copepods experience drastic variations in their physicochemical environment on a diurnal basis. J. Exp. Mar. Biol. Ecol. 460, 120–128. doi: 10.1016/j.jembe.2014.07.001
Bal A., Panda F., Pati S. G., Das K., Agrawal P. K., Paital B. (2021). Modulation of physiological oxidative stress and antioxidant status by abiotic factors especially salinity in aquatic organisms. Comp. Biochem. Physiol. Part C: Toxicol. Pharmacol. 241, 108971. doi: 10.1016/j.cbpc.2020.108971
Cailleaud K., Maillet G., Budzinski H., Souissi S., Forget-Leray J. (2007). Effects of salinity and temperature on the expression of enzymatic biomarkers in eurytemora affinis (Calanoida: Copepoda). Comp. Biochem. Physiol. - A Mol. Integr. Physiol. 147, 841–849. doi: 10.1016/j.cbpa.2006.09.012
Calliari D., Andersen C. M., Thor P., Gorokhova E., Tiselius P. (2006). Salinity modulates the energy balance and reproductive success of co-occurring copepods acartia tonsa and a. clausi in different ways. Mar. Ecol. Prog. Ser. 312, 177–188. doi: 10.3354/meps312177
Chambers J. M., Freeny A. E., Heiberger R. M. (2017). “Analysis of variance; designed experiments,” in Statistical models in s (New York: Routledge), 145–193.
Chinnery F. E., Williams J. A. (2004). The influence of temperature and salinity on acartia (Copepoda: Calanoida) nauplii survival. Mar. Biol. 145, 733–738. doi: 10.1007/s00227-004-1354-2
Costantini D. (2010). Redox physiology in animal function: The struggle of living in an oxidant environment. Curr. Zool. 56, 687–702. doi: 10.1093/czoolo/56.6.687
Daufresne M., Lengfellner K., Sommer U. (2009). Global warming benefits the small in aquatic ecosystems. Proc. Natl. Acad. Sci. United States America 106, 12788–12793. doi: 10.1073/pnas.0902080106
Diaz R. J. (2016). Anoxia, hypoxia, and dead zones BT - encyclopedia of estuaries (Dordrecht: Springer Netherlands), 19–29. doi: 10.1007/978-94-017-8801-4_82
Diekmann A. B. S., Clemmesen C., St. John M. A., Paulsen M., Peck M. A. (2012). Environmental cues and constraints affecting the seasonality of dominant calanoid copepods in brackish, coastal waters: A case study of acartia, temora and eurytemora species in the south-west Baltic. Mar. Biol. 159, 2399–2414. doi: 10.1007/s00227-012-1955-0
Dinno A. (2017). Dunn.test: Dunn’s test of multiple comparisons using rank sums. Available at: https://CRAN.R-project.org/package=dunn.test>
Dunn O. J. (1961). Multiple comparisons among means. J. Am. Stat. Assoc. 56:52-64. doi: 10.1080/01621459.1961.10482090
Dutz J., Christensen A. M. (2018). Broad plasticity in the salinity tolerance of a marine copepod species, acartia longiremis, in the Baltic Sea. J. Plankton Res. 40, 342–355. doi: 10.1093/plankt/fby013
Engström-Öst J., Brutemark A., Vehmaa A., Motwani N. H., Katajisto T. (2015). Consequences of a cyanobacteria bloom for copepod reproduction, mortality and sex ratio. J. Plankton Res. 37, 388–398. doi: 10.1093/plankt/fbv004
Garzke J., Hansen T., Ismar S. M., Sommer U. (2016). Combined effects of ocean warming and acidification on copepod abundance, body size and fatty acid content. PloS One 11, 1–22. doi: 10.1371/journal.pone.0155952
Glippa O., Engström-Öst J., Kanerva M., Rein A., Vuori K. (2018). Oxidative stress and antioxidant defense responses in acartia copepods in relation to environmental factors. PloS One 13, 1–15. doi: 10.1371/journal.pone.0195981
Guillard R. R. L. (1975). “Culture of phytoplankton for feeding marine invertebrates,” in Culture of marine invertebrate animals (Boston: Springer), 29–60.
Habig W. H., Pabst M. J., Jakoby W. B. (1974). Glutathione s-transferases: the first enzymatic step in mercapturic acid formation. J. Biol. Chem. 249, 7130–7139. doi: 10.1016/S0021-9258(19)42083-8
Halliwell B., Gutteridge J. M. C. (2015). Free radicals in biology and medicine (Oxford, UK: Oxford University Press).
Hiebenthal C., Philipp E. E. R., Eisenhauer A., Wahl M. (2012). Interactive effects of temperature and salinity on shell formation and general condition in Baltic Sea mytilus edulis and arctica islandica. Aquat. Biol. 14, 289–298. doi: 10.3354/ab00405
Hogfors H., Motwani N. H., Hajdu S., El-Shehawy R., Holmborn T., Vehmaa A., et al. (2014). Bloom-forming cyanobacteria support copepod reproduction and development in the Baltic Sea. PloS One 9, e112692. doi: 10.1371/journal.pone.0112692
Holste L., Peck M. A. (2006). The effects of temperature and salinity on egg production and hatching success of Baltic acartia tonsa (Copepoda: Calanoida): A laboratory investigation. Mar. Biol. 148, 1061–1070. doi: 10.1007/s00227-005-0132-0
Hulbert A. J., Pamplona R., Buffenstein R., Buttemer W. A. (2007). Life and death: Metabolic rate, membrane composition, and life span of animals. Physiol. Rev. 87, 1175–1213. doi: 10.1152/physrev.00047.2006
Imsland A. K., Foss A., Gunnarsson S., Berntssen M. H. G., FitzGerald R., Bonga S. W., et al. (2001). The interaction of temperature and salinity on growth and food conversion in juvenile turbot (Scophthalmus maximus). Aquaculture 198, 353–367. doi: 10.1016/S0044-8486(01)00507-5
Ismail H. N., Qin J. G., Seuront L. (2011). Regulation of life history in the brackish cladoceran, daphniopsis australis (Sergeev and williams 1985) by temperature and salinity. J. Plankton Res. 33, 763–777. doi: 10.1093/plankt/fbq145
Josse J., Husson F. (2016). missMDA: a package for handling missing values in multivariate data analysis. J. Stat. Software 70, 1–31. doi: 10.18637/jss.v070.i01
Kanoshina I., Lips U., Leppänen J.-M. (2003). The influence of weather conditions (temperature and wind) on cyanobacterial bloom development in the gulf of Finland (Baltic Sea). Harmful Algae 2, 29–41. doi: 10.1016/S1568-9883(02)00085-9
Katajisto T. (2003). Development of acartia bifilosa (Copepoda: Calanoida) eggs in the northern Baltic Sea with specialreference to dormancy. J. Plankton Res. 25, 357–364. doi: 10.1093/plankt/25.4.357
Katajisto T., Viitasalo M. (1998). Seasonal occurrence and hatching of calanoid eggs in sediments of the northern Baltic Sea. Mar. Ecol. Prog. Ser. 163, 133–143. doi: 10.3354/meps163133
Koski M., Kuosa H. (1999). The effect of temperature, food concentration and female size on the egg production of the planktonic copepod acartia bifilosa. J. Plankton Res. 21, 1779–1789. doi: 10.1093/plankt/21.9
Lance J. (1963). The salinity tolerance of some estuarine planktonic copepods. Limnol. Oceanogr. 8, 440–449. doi: 10.4319/lo.1963.8.4.0440
Lee C. E., Petersen C. H. (2003). Effects of developmental acclimation on adult salinity tolerance in the freshwater-invading copepod eurytemora affinis. Physiol. Biochem. Zool. 76, 296–301. doi: 10.1086/375433
Lehmann A., Myrberg K., Post P., Chubarenko I., Dailidiene I., Hinrichsen H.-H., et al. (2022). Salinity dynamics of the Baltic Sea. Earth Syst. Dynam. 13, 373–392. doi: 10.5194/esd-13-373-2022
Lehtiniemi M., Hakala T., Saesmaa S., Viitasalo M. (2007). Prey selection by the larvae of three species of littoral fishes on natural zooplankton assemblages. Aquat. Ecol. 41, 85–94. doi: 10.1007/s10452-006-9042-6
Lê S., Josse J., Husson F. (2008). FactoMineR: an r package for multivariate analysis. J. Stat. software 25, 1–18. doi: 10.18637/jss.v025.i01
Leppäkoski E., Gollasch S., Olenin S. (2013). Invasive aquatic species of europe. distribution, impacts and management (Berlin: Springer Science & Business Media).
Lomartire S., Marques J. C., Gonçalves A. M. M. (2021). The key role of zooplankton in ecosystem services: A perspective of interaction between zooplankton and fish recruitment. Ecol. Indic. 129, 107867. doi: 10.1016/j.ecolind.2021.107867
Lushchak V. I. (2011). Environmentally induced oxidative stress in aquatic animals. Aquat. Toxicol. 101, 13–30. doi: 10.1016/j.aquatox.2010.10.006
Mäkinen K., Vuorinen I., Hänninen J. (2017). Climate-induced hydrography change favours small-bodied zooplankton in a coastal ecosystem. Hydrobiologia 792, 83–96. doi: 10.1007/s10750-016-3046-6
Martínez-Alvarez R. M., Hidalgo M. C., Domezain A., Morales A. E., García-Gallego M., Sanz A. (2002). Physiological changes of sturgeon acipenser naccarii caused by increasing environmental salinity. J. Exp. Biol. 205, 3699–3706. doi: 10.1242/jeb.205.23.3699
Meier H. E., Andersson H. C., Arheimer B., Blenckner T., Chubarenko B., Donnelly C., et al. (2012). Comparing reconstructed past variations and future projections of the Baltic Sea ecosystem - first results from multi-model ensemble simulations. Environ. Res. Lett. 7, 034005. doi: 10.1088/1748-9326/7/3/034005
Meier H. E. M., Dieterich C., Gröger M., Dutheil C., Börgel F., Safonova K., et al. (2022). Oceanographic regional climate projections for the Baltic Sea until 2100. Earth Syst. Dynam. 13, 159–199. doi: 10.5194/esd-13-159-2022
Merkouriadi I., Leppäranta M. (2014). Long-term analysis of hydrography and sea-ice data in Tvärminne, Gulf of Finland, Baltic Sea. Climatic Change 124, 849–859. doi: 10.1007/s10584-014-1130-3
Merkouriadi I., Leppäranta M. (2015). Influence of sea ice on the seasonal variability of hydrography and heat content in Tvärminne, Gulf of Finland. Ann. Glaciol. 56, 274–284. doi: 10.3189/2015AoG69A003
Metcalfe N. B., Alonso-Alvarez C. (2010). Oxidative stress as a life-history constraint: The role of reactive oxygen species in shaping phenotypes from conception to death. Funct. Ecol. 24, 984–996. doi: 10.1111/j.1365-2435.2010.01750.x
Möllmann C., Müller-Karulis B., Kornilovs G., St John M. A. (2008). Effects of climate and overfishing on zooplankton dynamics and ecosystem structure: regime shifts, trophic cascade, and feedback loops in a simple ecosystem. ICES J. Mar. Sci. 65, 302–310. doi: 10.1093/icesjms/fsm197
Monaghan P., Metcalfe N. B., Torres R. (2009). Oxidative stress as a mediator of life history trade-offs: mechanisms, measurements and interpretation. Ecol. Lett. 12, 75–92. doi: 10.1111/j.1461-0248.2008.01258.x
Peck N., Peters J., Diekmann R., Laakmann S., Renz J. (2015). Interactive effects of temperature and salinity on population dynamics of the calanoid copepod acartia tonsa. J. Plankton Res. 37, 197–210. doi: 10.1093/plankt/fbu093
Persson J., Vrede T. (2006). Polyunsaturated fatty acids in zooplankton: Variation due to taxonomy and trophic position. Freshw. Biol. 51, 887–900. doi: 10.1111/j.1365-2427.2006.01540.x
R Core Team (2021). R: A language and environment for statistical computing. Vienna, Austria: R Foundation for Statistical Computing
Robinson D., Hayes A., Couch S. (2020). Broom: Convert statistical objects into tidy tibbles. Available at: https://CRAN.R-project.org/package=broom.
Santhanam P., Perumal P. (2012). Evaluation of the marine copepod oithona rigida giesbrecht as live feed for larviculture of Asian seabass lates calcarifer Bloch with special reference to nutritional value. Indian J. Fish. 59, 127–134.
Schlitzer R. (2016). Ocean data view. Available at: http://odv.awi.de
Støttrup J. G., Bell J. G., Sargent J. R. (1999). The fate of lipids during development and cold-storage of eggs in the laboratory-reared calanoid copepod, acartia tonsa Dana, and in response to different algal diets. Aquaculture 176, 257–269. doi: 10.1016/S0044-8486(99)00062-9
Vehmaa A., Hogfors H., Gorokhova E., Brutemark A., Holmborn T., Engström-Öst J. (2013). Projected marine climate change: Effects on copepod oxidative status and reproduction. Ecol. Evol. 3, 4548–4557. doi: 10.1002/ece3.839
Vehmaa A., Larsson P., Vidoudez C., Pohnert G., Reinikainen M., Engström-Öst J. (2011). How will increased dinoflagellate:diatom ratios affect copepod egg production? - a case study from the Baltic Sea. J. Exp. Mar. Biol. Ecol. 401, 134–140. doi: 10.1016/j.jembe.2011.01.020
Viitasalo M. (1992). Mesozooplankton of the gulf of finland and northern Baltic proper a review of monitoring data. Ophelia 35, 147–168. doi: 10.1080/00785326.1992.10429976
Viitasalo M., Katajisto T., Vuorinen I. (1994). Seasonal dynamics of acartia bifilosa and eurytemora affinis (Copepoda: Calanoida) in relation to abiotic factors in the northern Baltic Sea BT - ecology and morphology of copepods (Dordrecht: Springer Netherlands), 415–422.
von Weissenberg E., Jansson A., Vuori K. A., Engström-Öst J. (2022). Copepod reproductive effort and oxidative status as responses to warming in the marine environment. Ecol. Evol. 12, e8594. doi: 10.1002/ece3.8594
Vuori K., Kanerva M. (2018). Lipid peroxidation (LPX) assay for zooplankton homogenates. (Berkeley, USA: Protocols.io) 6–8. doi: 10.17504/protocols.io.m4vc8w6
Vuori K. A., Lehtonen K. K., Kanerva M., Peltonen H., Nikinmaa M., Berezina N. A., et al. (2015). Oxidative stress biomarkers in the copepod limnocalanus macrurus from the northern Baltic Sea: Effects of hydrographic factors and chemical contamination. Mar. Ecol. Prog. Ser. 538, 131–144. doi: 10.3354/meps11471
Keywords: climate change, zooplankton, marine ecology, salinity, lipid peroxidation (LPX), glutathione, heatwave, egg production
Citation: von Weissenberg E, Mottola G, Uurasmaa T-M, Anttila K and Engström-Öst J (2022) Combined effect of salinity and temperature on copepod reproduction and oxidative stress in brackish-water environment. Front. Mar. Sci. 9:952863. doi: 10.3389/fmars.2022.952863
Received: 25 May 2022; Accepted: 25 July 2022;
Published: 17 August 2022.
Edited by:
Ram Kumar, Central University of Bihar, IndiaReviewed by:
Raunak Dhanker, GD Goenka University, IndiaCopyright © 2022 von Weissenberg, Mottola, Uurasmaa, Anttila and Engström-Öst. This is an open-access article distributed under the terms of the Creative Commons Attribution License (CC BY). The use, distribution or reproduction in other forums is permitted, provided the original author(s) and the copyright owner(s) are credited and that the original publication in this journal is cited, in accordance with accepted academic practice. No use, distribution or reproduction is permitted which does not comply with these terms.
*Correspondence: Ella von Weissenberg, ZWxsYS52b253ZWlzc2VuYmVyZ0BoZWxzaW5raS5maQ==
Disclaimer: All claims expressed in this article are solely those of the authors and do not necessarily represent those of their affiliated organizations, or those of the publisher, the editors and the reviewers. Any product that may be evaluated in this article or claim that may be made by its manufacturer is not guaranteed or endorsed by the publisher.
Research integrity at Frontiers

Learn more about the work of our research integrity team to safeguard the quality of each article we publish.