 David González-Santana
 Juana Magdalena Santana-Casiano
 Aridane G. González
 Melchor González-Dávila
95% of researchers rate our articles as excellent or good
Learn more about the work of our research integrity team to safeguard the quality of each article we publish.
Find out more
ORIGINAL RESEARCH article
Front. Mar. Sci. , 22 August 2022
Sec. Marine Biogeochemistry
Volume 9 - 2022 | https://doi.org/10.3389/fmars.2022.952203
Lava flows from the 2021 volcanic eruption in La Palma, Canary Islands, reached the shoreline during three events on September 28th, November 10th, and November 22nd, strongly affecting the seawater properties as they interacted with the seawater. The evolution of surface and water column physicochemical properties (temperature, salinity, carbonate system variables, and dissolved oxygen) was characterized during 13 visits to the frontal zone of the newly formed deltas. A large volume of hot (50°C measured on November 12th) and high salinity seawater promoted pH values in the frontal zone of 7.0 with important decreases in alkalinity, ΔAT, and total dissolved inorganic carbon, ΔCT, that reached 566 and 272 µmol kg−1, respectively. The addition of acids generated during the lava–seawater interaction (44.4 mmol), together with those used in the titration of carbonate alkalinity (796 ± 72 mmol) plus acids used in metal dissolution (21 mmol), was estimated with an average added proton concentration of 0.31 µmol kg−1 of seawater in the affected 2.7 · 106 m3 for November 12th. During this event, the decrease in pH and the increase in temperature increased the partial pressure of CO2, outgassing 2 tons of CO2, 40 times the daily emitted CO2 for this area under non-eruptive conditions. One month after the eruption, the studied physicochemical properties of the seawater close to the new deltas returned to the usual non-eruptive normal values, which include the presence of low salinity, low pH, and high CO2 gas diffusive emissions through submarine groundwater discharges observed between the formed deltas. The new mineral-rich deltas and the increase in solubility due to the low pH conditions contributed to the recovery of the affected area.
The interaction between lava and seawater has received significant interest, since multiple reactions can take place which act as sources or sinks of elements, consequently changing the chemical properties of the surrounding seawater (e.g., De Ronde et al., 2001; Mason et al., 2021). The lava source can be submarine or subaerial volcanism. In submarine volcanism, all the volcanic components (e.g., lava, hydrothermal fluids, and gases) are directly injected into the seawater, generating plumes that distribute according to their buoyancy and marine currents. In these plumes, different reactions occur as the hydrothermal fluids mix with the surrounding seawater (Sansone et al., 1991; Resing et al., 2009; Santana-Casiano et al., 2013; Santana-González et al., 2017; González-Santana et al., 2020; González-Santana et al., 2021). If volcanic emissions take place in shallow areas, gas interchange with the atmosphere can also occur. However, when the lava originates from a subaerial volcano, degassing and solidification reactions occur before the lava reaches the coastal area and reacts with the seawater. These reactions are influenced by the time taken for the lava flows to travel from the emission area (Olafsson, 1975; Sansone and Resing, 1995; Gíslason et al., 2002; Resing and Sansone, 2002; De Ronde et al., 2007).
The volcanic islands of the Canary archipelago (Spain) (Figure 1A) have experienced a variety of volcanic activities within the last 10 years (Longpré and Felpeto, 2021). During October 2011, a shallow submarine volcano eruption occurred south of El Hierro island, producing an important episode of ocean acidification (Santana-Casiano et al., 2013). The subsequent hydrothermal activity acted as a source of nutrients that contributed to the fertilization and regeneration of the area (Langmann et al., 2010; Santana-Casiano et al., 2013; González-Vega et al., 2020). The most recent volcanic episode in the Canary Islands, at La Palma island (IGN, 2021; Román et al., 2022), was subaerial and started on 19th September 2021 (Figure 1B).
La Palma has been volcanically active for at least the past 4 Ma. Its youngest volcanic rift, located on the southern section of the island, and known as the Cumbre Vieja edifice, has been the most active in the last 500 years (Figure 1C). The last two events were the San Juan Eruption in 1949 and the Teneguía eruption in 1971. During the 2017–2018 period, a magmatic intrusion is proposed to have stalled at ~25 km depth (Torres-González et al., 2020; Fernández et al., 2021). After intense seismic and ground deformation events on 11th September 2021 (IGME et al., 2021; Longpré, 2021), a new eruption began on September 19th on Cumbre Vieja, in the area known as Cabeza de Vaca. The volcano was later named the Tajogaite Volcano in July 2022 (Figures 1C, D). This eruption is considered the most damaging eruption in the history of La Palma. It was characterized by high explosiveness with violent Strombolian explosions, ash-rich eruption columns, high levels of sulfur dioxide (SO2) in the atmosphere with fluxes of more than 30,000 tons day−1 during the first week, and the destruction of arable land and infrastructure as lava flows made their way to the sea (Albertos et al., 2022; Hayer et al., 2022).
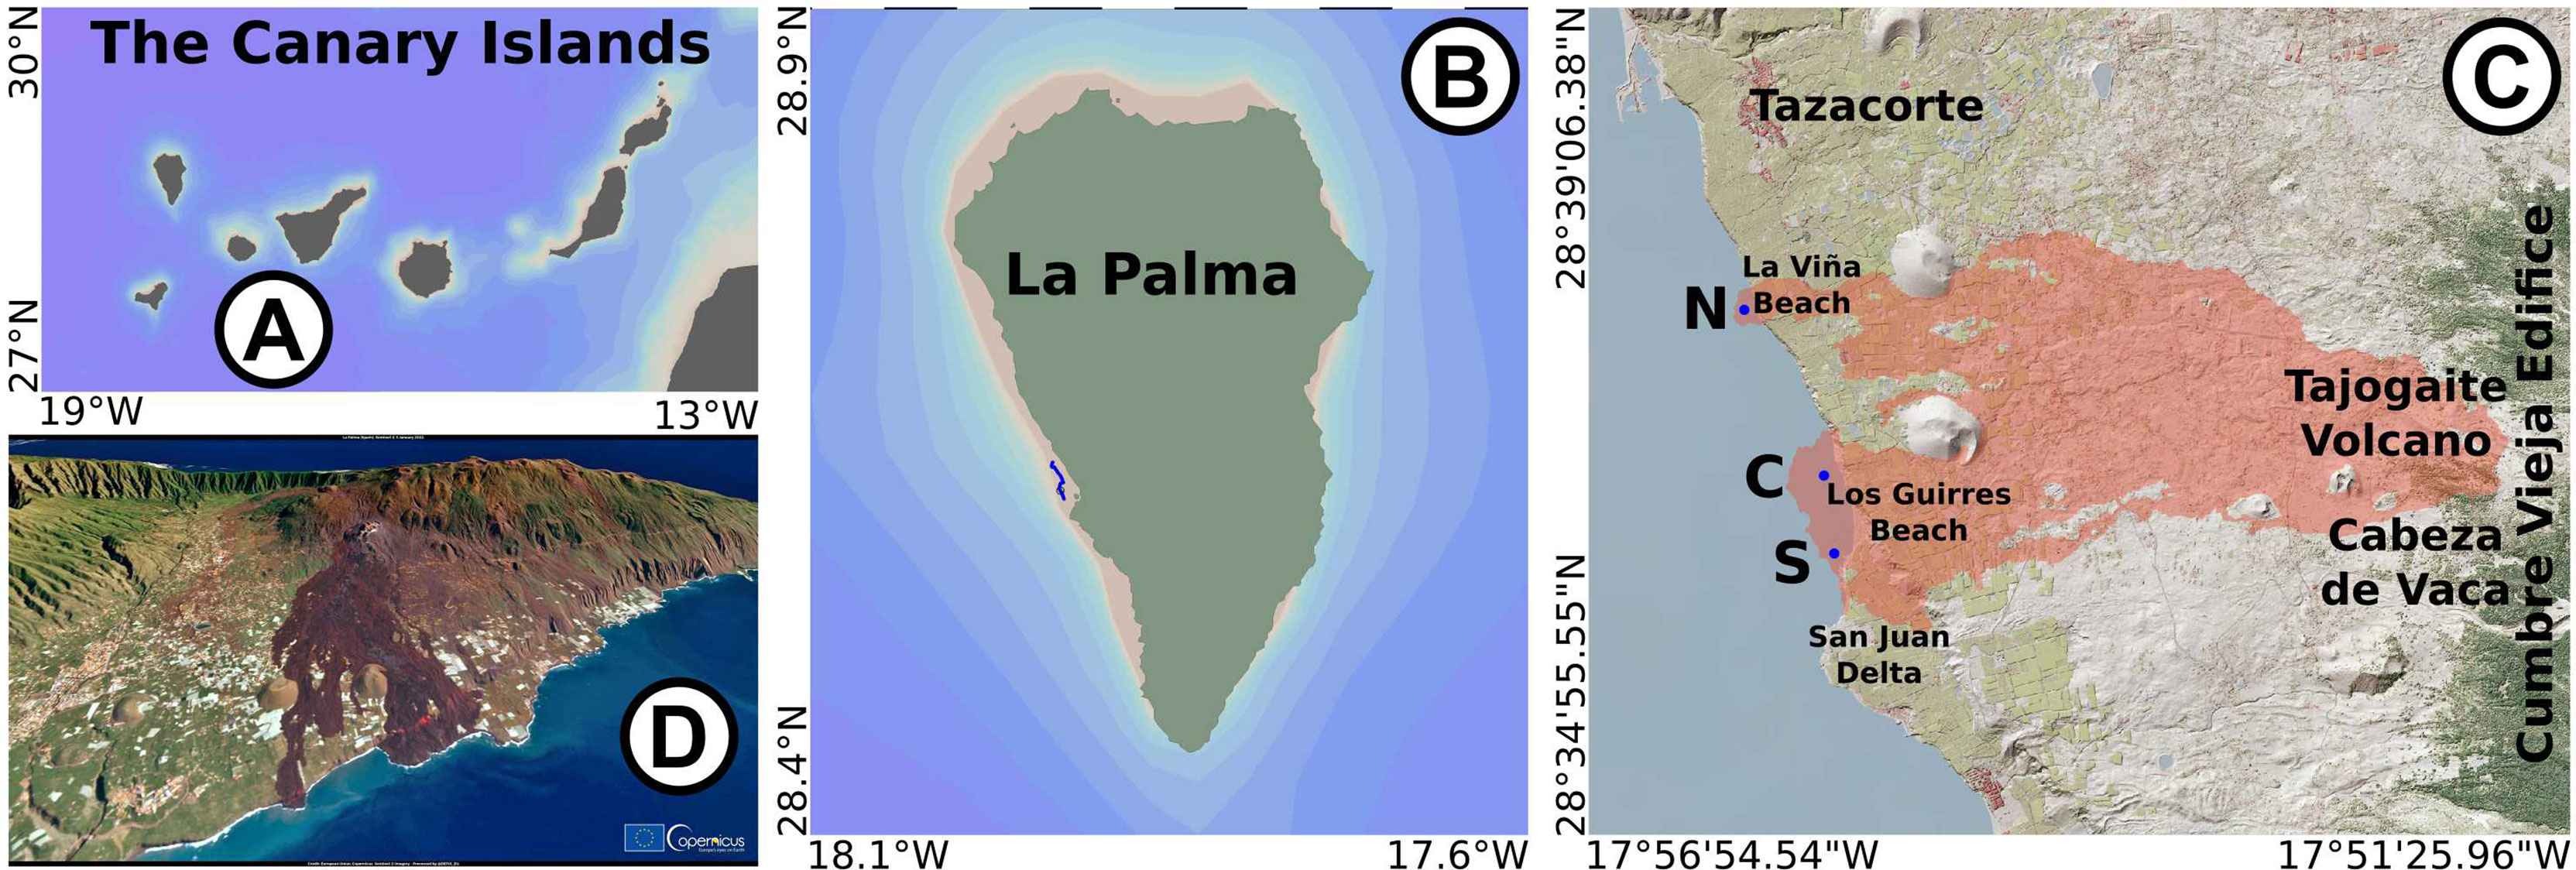
Figure 1 Map of the Canary Islands (A), the volcanic island of La Palma (B) (Ocean Data View images, Schlitzer, 2021), with indication of (C) the inland area affected by the 2021 eruption and the two formed deltas (IGME et al., 2021). The southern delta was formed after lava arriving on September 28th and November 10th, while the northern delta was formed after November 22nd. North (N), center (C), and south (S) correspond with the locations of the pre-lava arrival stations. (D) 3D visualization of the new landscape (European Union, Copernicus Sentinel-2 imagery).
The Tajogaite Volcano produced lava flows and tephra of basanite to tephrite composition over 85 days of eruptive activity (Pankhurst et al., 2022). It became the longest volcanic eruption in the historical record of the Cumbre Vieja edifice, where the first known eruption dates back to 1585. The lava flowed down a shallow incline as surface flows which widened toward the coast as well as in lava tubes until reaching the proximities of a coastal cliff area 7 km away from the eruptive vents (Figure 1D). Along this area, volcanic ash, volatile nutrients, soluble metallic salts, and gases rich in SO2 (Albertos et al., 2022) were vented to the atmosphere and stratosphere. After several days of lava flowing on land, it finally descended the coastal cliffs and fell about 100 m to reach the ocean. The falls of lava, with temperatures between 1,000°C and 1,200°C (CSIC, 2021), accumulated at the base of the cliff and came into contact with the relatively cold (22°C–25°C) seawater.
Lava provides a high-temperature heat source in a dynamic lava–seawater interface. Due to the relatively low magma thermal conductivity (~1 W m−1 K−1; Büttner et al., 1998; Büttner et al., 2000; Ebert et al., 2002) and its low convection due to its high viscosity, the heat flux from the lava–seawater interface to the seawater exceeds that from the lava to the interface. Therefore, the lava solidifies as the temperature at the hot side of the interface drops rapidly. The cooling front migrates into the lava since the thermal conductivity of quenched melt is more than twice that of its liquid state (Wohletz et al., 2013). When a certain thickness has solidified, the thermal granulation caused by the 1%–3% decrease in volume at the glass transition temperature leads to fragmentation of the lava into relatively coarse particles and to an exponential increase of the interfacial area between lava and water. The result is a combination of expanded quenched lava fragments, high-pressure water and steam, and the formation of a new delta or peninsula (Di Traglia et al., 2018; Zhao et al., 2020). The lava overheats the seawater in the vicinity affecting the hydrographic properties (Sansone and Resing, 1995; Resing and Sansone, 1999; Caballero et al., 2022; Román et al., 2022), increasing turbidity and forming colored plumes (Coca et al., 2014; Eugenio et al., 2014; Caballero et al., 2022). The cloud of noxious gases, glass particles, and a lava haze known as “laze” was reported at the initial stages of the delta formation.
This work investigates the effect of the lava–seawater interaction on the carbon dioxide (CO2) system during the eruption of the Tajogaite Volcano (La Palma, the Canary Islands, Spain) which started on the 19th of September 2021 at 14:10 (GMT). Multiple lava flows were produced during the 4 months of the eruption, but only three reached the ocean, on September 28th, November 10th, and November 22nd. The effects produced by the interaction between lava and seawater during these three episodes were studied and compared with the previous seawater conditions in the area and the conditions after the lava emissions, as a model for other seawater–lava interaction processes.
A total of 13 visits to the affected coastal area of Tazacorte (La Palma, Spain) were carried out (Tables 1 and S1). The first one took place on 22nd September 2021, 3 days after the inland eruption began and 5 days before the lava reached the ocean for the first time. The last visit was performed on 11th January 2022, more than 7 weeks after the lava reached the ocean for the third time and 1 month after the eruption was considered to have finished. Three vessels were used for sampling close to the lava delta in the coastal waters. The Salvamar Alphard, a 21-m boat from the Spanish Salvamento Marítimo, was used until 8th October 2021. After this date, a 25-m ship “Pico Teide” and a 7-m zodiac rubber boat, from the Spanish Guardia Civil, were employed. Due to size limitations, an AAQ-Rinko™ (JFE Advantech Co. Hyogo, Japan) water profiler with a recording speed of 0.5 m s−1 equipped with conductivity, temperature, depth, chlorophyll, turbidity, dissolved oxygen (DO), and pH sensors with a 50-m cable capacity was used to continuously record the physicochemical properties of the seawater.
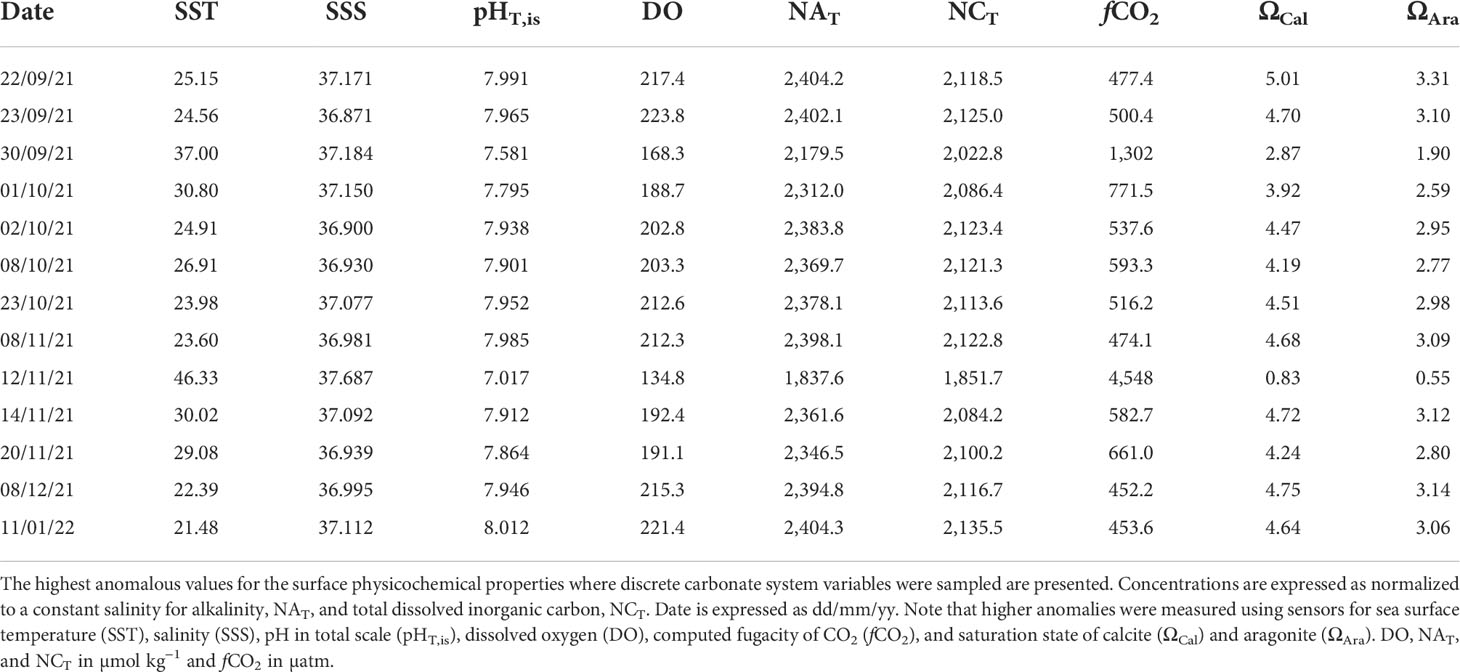
Table 1 Summary of visits to the coastal areas affected by the lava during the La Palma 2021 eruption.
Discrete sampling was carried out using both a 5-L Niskin bottle for water profiles and by hand at a 30-cm depth. The Niskin bottle was coupled with an SBE37 SMP (Sea Bird Electronics, Bellevue, WA, USA) for continuous recording of temperature, salinity, and pressure. Sampling for total alkalinity (AT) and total dissolved inorganic carbon (CT) and for selected DO samples for sensor calibration purposes was carried out by overfilling 500-ml bottles for AT and CT and 100-ml bottles for DO (volume calibrated to ±0.01 ml). Before sampling, the glass borosilicate bottles were rinsed three times. During hand sampling, the glass bottles were introduced with the neck of the bottle facing downwards to avoid seawater being sampled out of the selected depth. The bottle was inverted at the location of the AAQ sensor.
The AAQ profiler was calibrated before sampling with solutions provided by the commercial factory and also with external standards for salinity and pH. For salinity, IAPSO standard seawater (batch P164) was used providing salinity values better than ±0.005 (n = 9). When the AAQ profiler and the SBE37 sensor were used together, temperature and salinity sensors agreed within ±0.04°C in temperature and 0.007 in salinity. For pH, a TRIS-artificial seawater standard (Millero, 1986) was prepared. Repeat measurements (on average n = 7 for the different study days) of the Tris buffer standard were better than ±0.003 pH units with accuracy against the theoretical Tris buffer value of ±0.006 units. The pH sensor was calibrated in total scale and measured at in-situ temperature and salinity seawater conditions, pHT,is. The DO sensor response was factory calibrated. However, to check for accuracy, discrete samples were sampled for oxygen determination in the laboratory during three visits (October 1st, November 12th, December 8th, Table 1). Moreover, every time the sensor was used, samples from a tank in the laboratory where the sensor was immersed before and after the trip were sampled in triplicate for oxygen. In all cases, the oxygen samples were analyzed after 6–8 h (in a land-based laboratory on La Palma), based on the method proposed by Winkler (modified by Strickland and Parsons, 1972) using an automated titration system with potentiometric endpoint detection (Titrino 848, Metrohm™, Metrohm AG, Herisau Switzerland). The reproducibility of the lab determinations was in all cases <0.3 μmol kg−1 (~0.1%). When DO concentrations from the sensor (DOS) were plotted against those from discrete (DOM) samples (data not shown), the concentrations (in the range of 150–240 µmol kg−1) were fitted to Equation 1, which was applied to the sensor data.
where n = 32, r2 = 0.994, and the standard error of the estimate was 0.82 µmol kg−1.
The seawater from the 500-ml borosilicate glass bottles sampled in each volcano visit (between 6 and 8 surface samples each and 3–4 in deeper waters in the cruises until October 8th), which had been poisoned with HgCl2 and sealed with ground glass stoppers, was analyzed for AT and CT. A full set of samples were analyzed on their sampling day by potentiometric titration at the land-based laboratory using a system similar to that described in Millero et al. (1993), herein called the manual titrator. The system uses a Titrino 719 (Metrohm™) for the precise delivery of HCl (0.1 M in 0.6 M NaCl solution) and an mV reading of about 25 points for a typical titration. A total of 12 bottles sampled until October 8th were transported to the university laboratories and analyzed 48–72 h after collection in a VINDTA 3C system (Marianda™, Marine Analytics and data, Kiel, Germany) to calibrate and check the manual titration system accuracy. Both systems were also calibrated with certified reference materials (CRMs) for AT and CT measurements (batch #163) provided by Dickson’s facilities at the University of San Diego. The reproducibility of the titration systems was ±1.8 and 2 µmol kg−1 for AT determined in the VINDTA and manual titrator, respectively. The analytical accuracy for both CT and AT using CRM analyses in the VINDTA was better than ±1.5 µmol kg−1 for each variable. Due to the non-Nernstian behavior of the electrodes (Millero et al., 1993), the titration values of CT were about 6 ± 2 μmol kg−1 higher than the certified one. This offset in CT (factor of 1.003) was applied to all CT samples. When the CT titrator values for the CRMs were corrected with this factor, values were accurate to ±2.3 µmol kg−1.
A pCO2 CV ProOceanus™(Pro-Oceanus Systems Incorporated, Bridgewater, Nova Scotia, Canada) sensor was used for the continuous recording of pCO2 on September 23rd coupled with an SBE37 SMP for water column profiles. A speed of 2 m min−1 was used to allow for equilibration. The system was used again on December 8th and January 11th, but on those days, the sensor was attached to a floating buoy with the seawater intake at a depth of 0.8 m together with the AAQ Rinko sensor and slowly moved along the coast at a distance of about 5–10 m from the formed deltas. Atmospheric pCO2 was determined on December 8th by pumping atmospheric air until equilibration. A value of 405 ± 3 µatm was recorded.
The remaining seawater CO2–carbonate system parameters (pCO2 when it was not measured, carbonate saturation state as calcite, Ωcalcite, and aragonite, Ωaragonite, in seawater) for each sample were calculated using the Excel program CO2SYSv2.5 (Pierrot et al., 2006). Carbonic acid dissociation constants by Lueker et al. (2000), the bisulfate dissociation constant by Dickson (1990), and the total boron to salinity ratio by Lee et al. (2010) were used for the computation.
Surface and vertical distribution of the physicochemical variables were plotted using the Ocean Data View program (ODV) and the DIVA gridding tool (Schlitzer, 2021).
Lava reached the western La Palma coastal waters of Tazacorte at the location of Los Guirres Beach (Figure 1C) on three occasions, during the eruption that began on September 19th, producing three important lava–seawater interaction events in the frontal zone.
The affected area was a shoreline located below a cliff region (Figure 1D) with heights ranging between 80 and 100 m with a sandy beach in the southern part included in a Special Conservation Zone. The narrow coastal area was located about 7 km from the Cabeza de Vaca site where the eruptive vents opened. According to the bathymetry of the area (REDMIC, 2022), a soft slope (3°) was observed along the shoreline in the first 500 m, where the 25-m isobath was located. The 50-m isobath was located 650 m (northern) to 750 m (southern) away from the coast. At depths greater than 50 m, the isobaths were compressed in the northern sector where the 100-m isobath was found 780 m away from the coastline. In the northern part, several canyons were observed that converged at a depth of 350 m, 1.2 km away from the coastline.
The first event occurred on 27th September 2021 at 23:00 h (GMT), when a 700-m-wide lava flow fell from a 100-m-high cliff onto the beach area. The lava reached the sea on September 28th, producing large steam clouds. The process lasted for about 5 days with notable inputs of lava covering a frontal area of 830 m and a maximum distance of ~500 m into the sea (Figure 1C, formed delta above station C). Solidified lava heights reached 30 m above sea level in the more inland sector. Furthermore, the comparison of bathymetries shows that the lava covered and emerged from the sea in the area shallower than the previously measured 20–25-m isobaths.
The second event took place on 10th November 2021 at 01:45 h (GMT) when a new lava front fell in the southern part of Los Guirres Beach (Figure 1C) reaching the sea and filling the area between the first formed delta and that formed during the 1949 San Juan eruption (Figure 1C, formed delta above station S). Emerged lava reached the location of the 20-m isobath in the northern part and the 15-m isobath in the southernmost part. After 4 days, the inland lava migrated south affecting the San Juan delta area. The new delta covered an area of about 44 ha (ha = 104 m2) and extended for 1.2 km in length and 500 m at its widest part.
The third event occurred at noon on 22nd November 2021 when a third lava flow reached the cliff 1.3 km north of the first delta (Figure 1C, formed delta above station N). The lava fell on the coast at la Viña Beach area, with the subaerial part covering 320 m of shoreline and extending 190 m into the sea (9 ha), out to the previous location of the 7–8-m isobath.
On 11th January 2022, about 10 m beyond the area covered subaerially by the two deltas, the measured bottom depths were less than 6 m, indicating that lava had extended further than observed subaerially, especially for the southern delta. At the same time, a significant amount of black sand had accumulated in the area, from outside (old sand and/or deposition of new volcanic ash) and/or from erosion of the new deltas, as the depth of the new shoreline at a distance of 10 m had decreased from about 10 to 6 m between 8th December 2021 and 11th January 2022.
Before the arrival of the lava to the ocean, the potentially affected area was sampled on 22nd and 23rd September 2021, at the north (N), center (C), and south (S) locations (Figure 1C). After the eruption ended on 13th December 2021, another visit was undertaken on 11th January 2022 to study the new conditions.
The distribution of sea surface properties between sites north and south of the studied area varied between September 22nd and 23rd. On September 22nd, the seawater was cooler (0.05°C) and fresher (0.15) and had a lower pH (0.02) in the north compared to the south part (1.5 km long coastal line) (Figure S1). For the CO2 parameters (Table S1), the discrete samples of surface seawater presented AT of 2,406.6 µmol kg−1 to the north and 2,414.4 ± 0.4 µmol kg−1 to the center–south, with an average alkalinity normalized to a constant salinity of 37 (NXT = XT/Sal·37 to remove evaporation and dilution effects, where XT refers both to AT or CT) of 2,404.2 ± 1.5 µmol kg−1. The CT concentrations were 2,119.6 ± 1.5 µmol kg−1, with an NCT of 2,118.5 µmol kg−1 to the north and 2,109.9 ± 0.7 µmol kg−1 to the south (Tables 1 and S1). The computed saturation state for calcite (ΩCal) and aragonite (ΩAra) presented values of 4.97 ± 0.06 and 3.29 ± 0.04, respectively.
On September 23rd (Figure S2), a change in the wind direction and stress from north to south, an increase in average wind speeds from 5 to 8 m s−1, and tidal effects affected the latitudinal gradients along the coast (https://metrics.grafcan.es/). A station located 1.5 km away from the coast was used as a reference. This station presented a pH of 7.965 at the surface, with a temperature of 24.56°C, salinity of 36.871, DO of 225 µmol kg−1, NAT of 2,402.1 µmol kg−1 and NCT of 2,125.0 µmol kg−1, ΩCal of 4.70, and ΩAra of 3.10 (Tables 1 and S1). The average surface temperature at the three coastal locations was 24.95°C ± 0.05°C (well mixed in the first 6–10-m water column). DO concentrations of 218 ± 5 µmol kg−1 with an average salinity of 37.18 ± 0.1 in the north part decreased to 37.05 at the surface in the southern section. For the surface pHT,is, values of 7.88 ± 0.1 were measured in the two southern stations, decreasing to 7.76–7.80 toward the north, which were lower than those at the reference station. This demonstrated the high variability in conditions of the coastal area of La Palma. Profiles of pCO2 were recorded. At the reference station (Figure S2E), pCO2 decreased from 447 µatm at the surface to 430 µatm at 20 m water depth. In the more acidic coastal waters, the pCO2 in the water column ranged from surface values of 453 µatm at the south to 465 µatm to the north and about 445 µatm at the bottom (~15 m).
Four months later, on January 11th, the sea surface values were measured all along the new shoreline. The sea surface temperature (SST; Figure 2A) decreased to 21.2°C in the southern delta. A slight temperature increase reaching 21.8°C was measured with the presence of a white plume that was still visible at the location where the lava arrived on November 10th. The north delta presented a lower temperature (20.9°C) that increased to 21.1°C at 1.5 km from the coast. The NAT of the surface waters (discrete samples) presented a value similar to that measured in September (2,404 ± 0.6 µmol kg−1), while the NCT increased by 21 to 2,135 ± 2.0 µmol kg−1, and ΩCal and ΩAra decreased to 4.64 ± 0.03 and 3.06 ± 0.02, respectively, according to the seasonal variation observed at the ESTOC site in the Canary Islands (González-Dávila et al., 2010). From September to January, the temperature had decreased from 25°C to 21°C, the pHT,is increased from 7.96 to 8.02, and the pCO2 decreased from ~450 to ~400 µatm. The range of seasonal variation is consistent with that measured at the oceanic ESTOC site, which has a lower SST (~1°C).
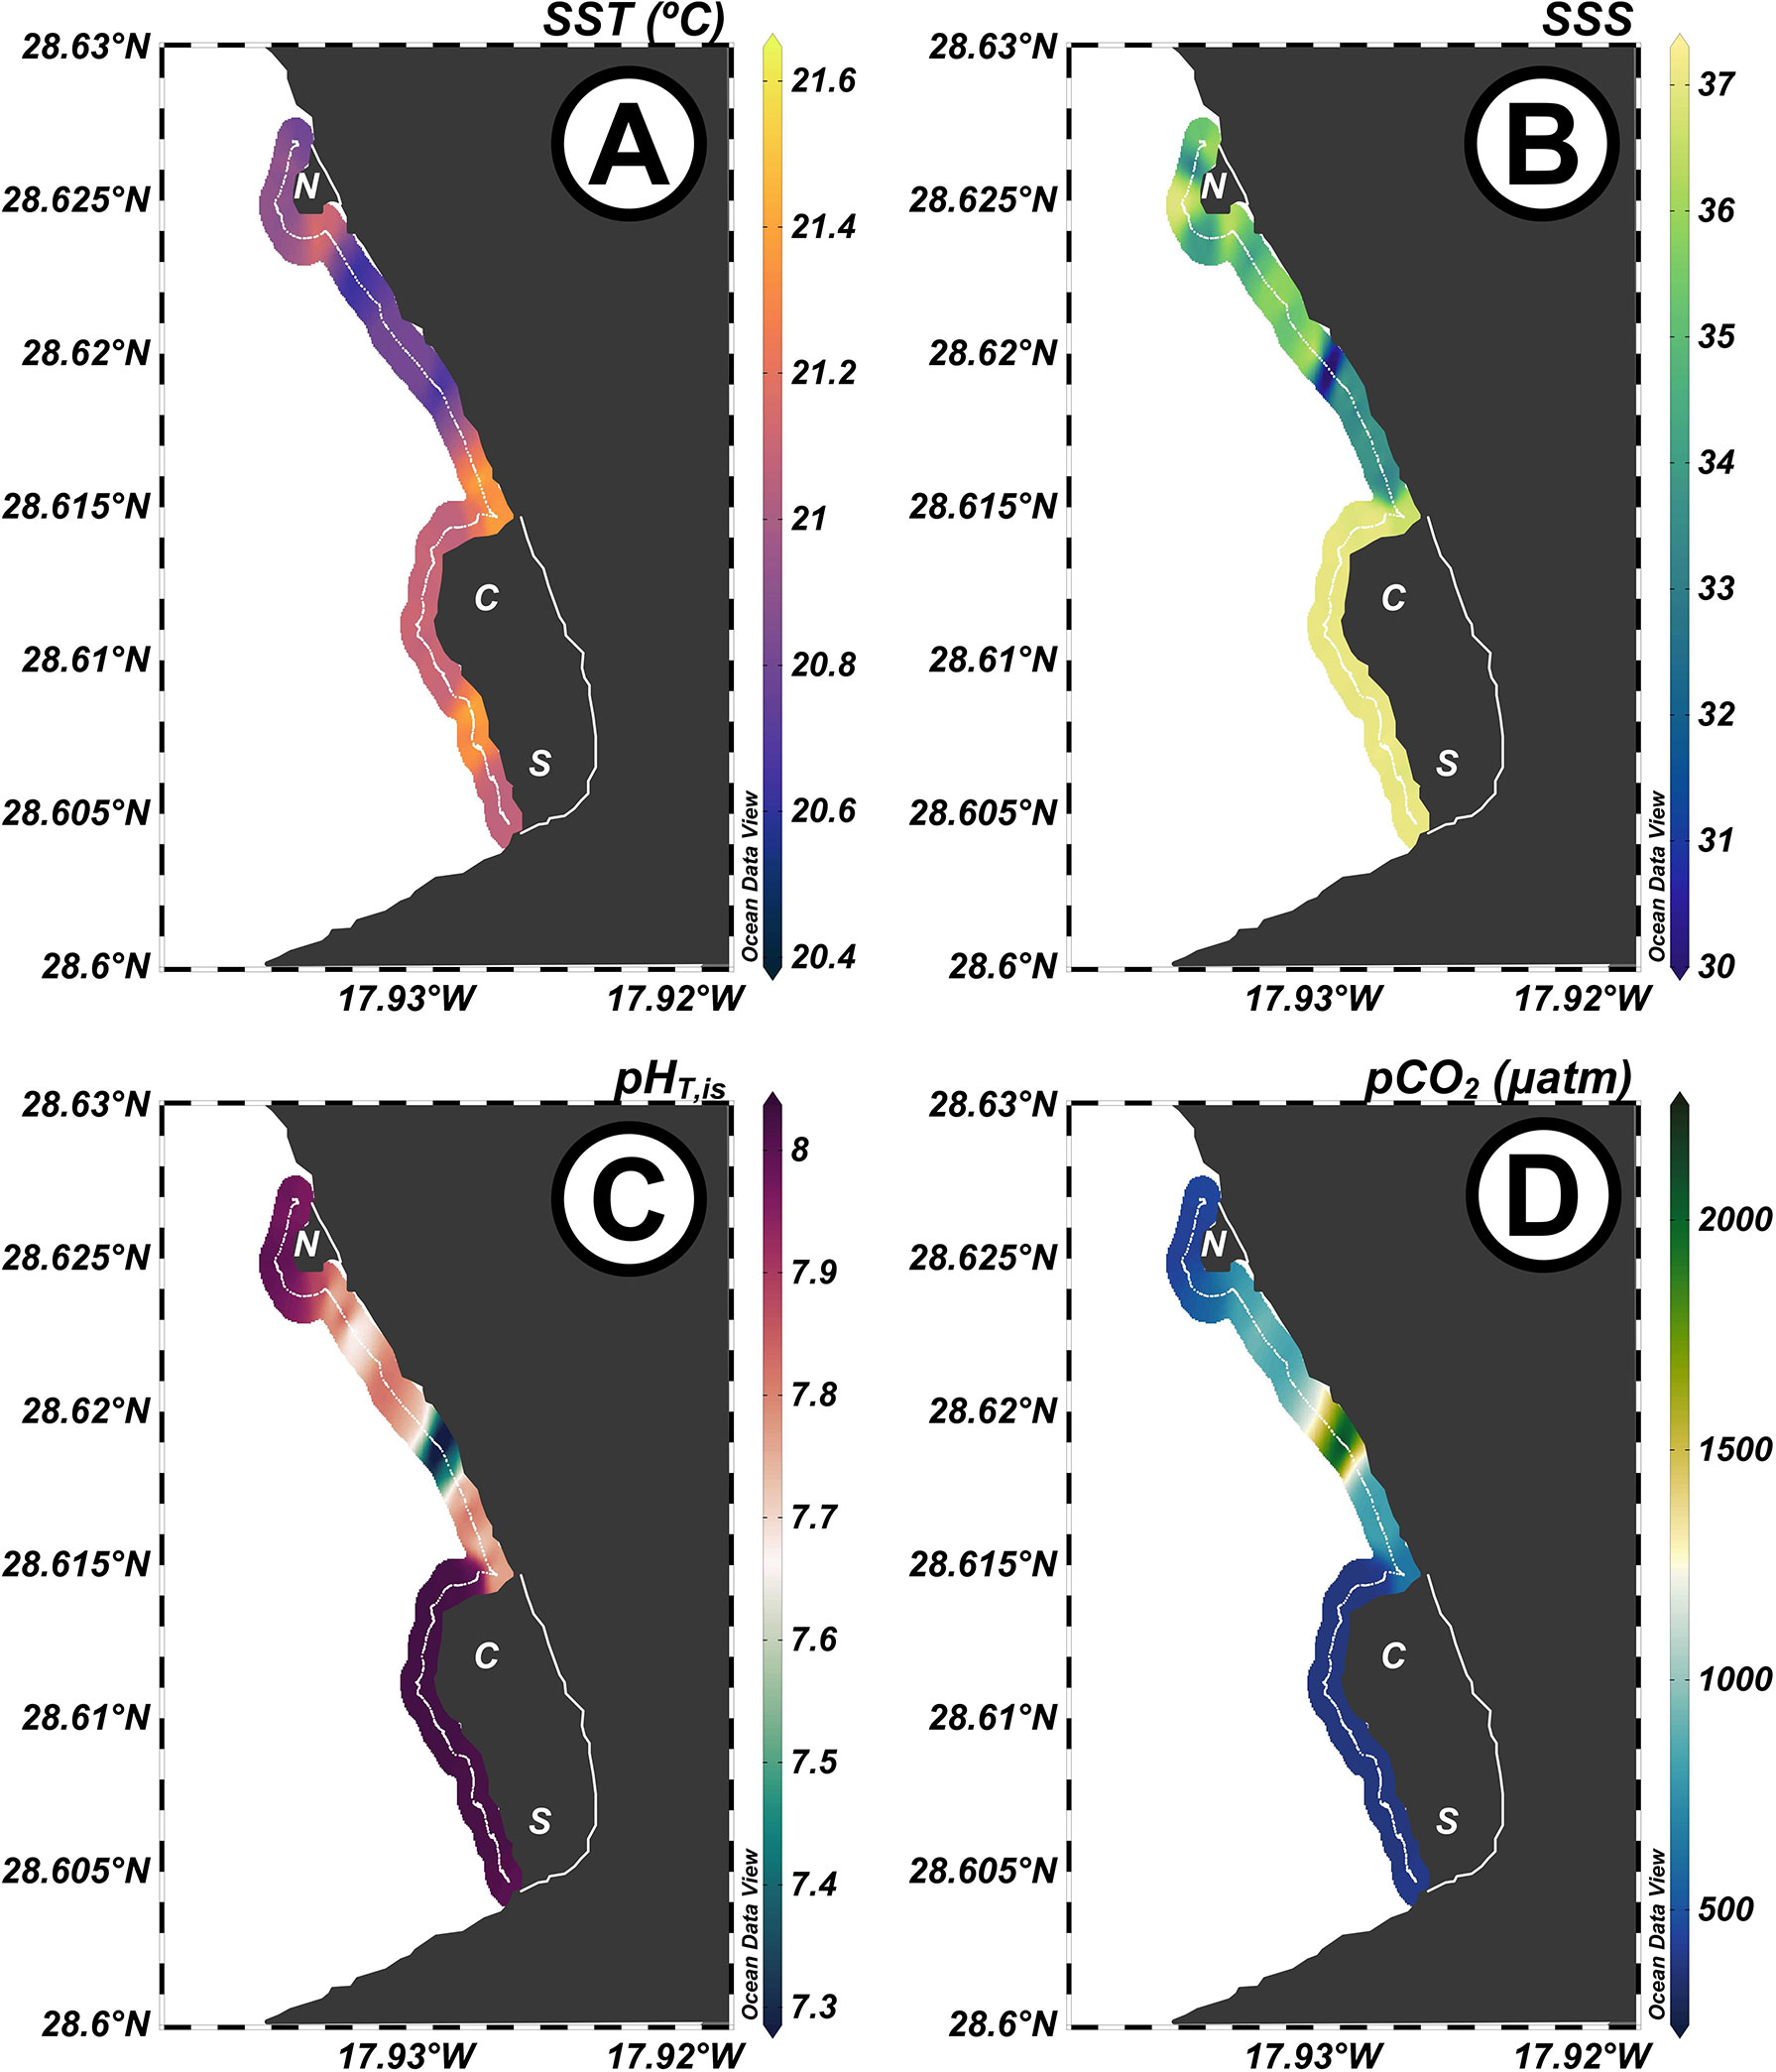
Figure 2 Surface distribution of (A) temperature (SST, °C), (B) salinity (SSS), (C) pH in total scale at in-situ conditions (pHT,is), and (D) partial pressure of CO2 (pCO2, µatm) along the new shoreline with the two new formed deltas (approximated shape) in the coast of Tazacorte, La Palma during 11th January 2022, 1 month after the emission of lava finalized. North (N), center (C), and south (S) correspond with the locations of the pre-lava arrival stations.
However, between both deltas and close to the coast (10 m), the conditions were different for the measured surface waters. The temperature (Figure 2A) was lower, with values of 20.5°C. The sea surface salinity (SSS) also presented a marked north to south gradient (Figure 2B) with values as low as 30 at 28.62°N between the north and south deltas. The pH values were 8.01–8.02 in the south delta, decreasing toward the north with minimum values of 7.4 at 28.62°N (Figure 2C). There were no discrete samples for AT and CT between deltas. However, a sample taken at the southern part of the north delta presented values of both NAT and NCT that were 12 and 30 µmol kg−1 higher than those measured in the south delta. Higher values were also measured in a surface sample taken 500 m away from the northern delta, in open waters (2,418 and 2,141 µmol kg−1, respectively). These anomalous values indicated the presence of a significant supply of water with low salinity, low pH, and high CO2 and inorganic carbon. These results were not related to the lava but to diffusive CO2 gas emissions through submarine groundwater discharges (SGDs) in marine shallow areas that acidify the surrounding waters (Hall-Spencer et al., 2008). The presence of SGDs in other parts of La Palma island has been described previously (González-Delgado et al., 2021).
The pCO2 surface distribution (Figure 2D) presented concentrations of 395 ± 2 µatm all around the southern delta that increased to 2,150 µatm at 28.62°N. The pCO2 then decreased toward the north delta, reaching 500 µatm in the southern section of the delta and further decreasing to 430–440 µatm in the central–northern portion. Values over 5,000 µatm have been observed south of Tazacorte (~30 km south), in Fuencaliente, where the Teneguía Volcano is located. This high source is strongly affected by the tidal cycle (González-Delgado et al., 2021). Therefore, the observed variability in parameters, together with changes in both wind direction and speed, and the tidal cycle spreading this SGD, could explain the observed concentration changes between 22nd and 23rd September.
Figure 3 depicts the evolution of sea surface (0.3 m deep) properties for the studied period at a distance between 10 and 20 m from the lava front, with an indication of the 3 days when lava started to arrive at the sea (data under C, S, and N in Figures 3B–G). Two days after the first lava event (September 28th, marked as C since it affected station C, Figure 1C) and while the reddish lava interaction with the sea was still visible in some locations, the maximum measured surface temperature was 37.5°C, salinity increased by 0.5, while pHT,is decreased by 0.45 to minimum values of 7.5 and the DO concentration decreased to 170 µmol kg−1 (Figures 3B–E, respectively). The changes of SST and SSS on gas solubility and carbonate dissociation constants explained 80% of the DO loss and a decrease of 0.2 pH units. The pH decrease was related to the presence of reduced species in the lava that were oxidized by oxygen (the apparent oxygen utilization, AOU, increased from −6 to +5 µmol kg−1 in the surrounding water) and the addition and formation of strong acids that decreased the pH.
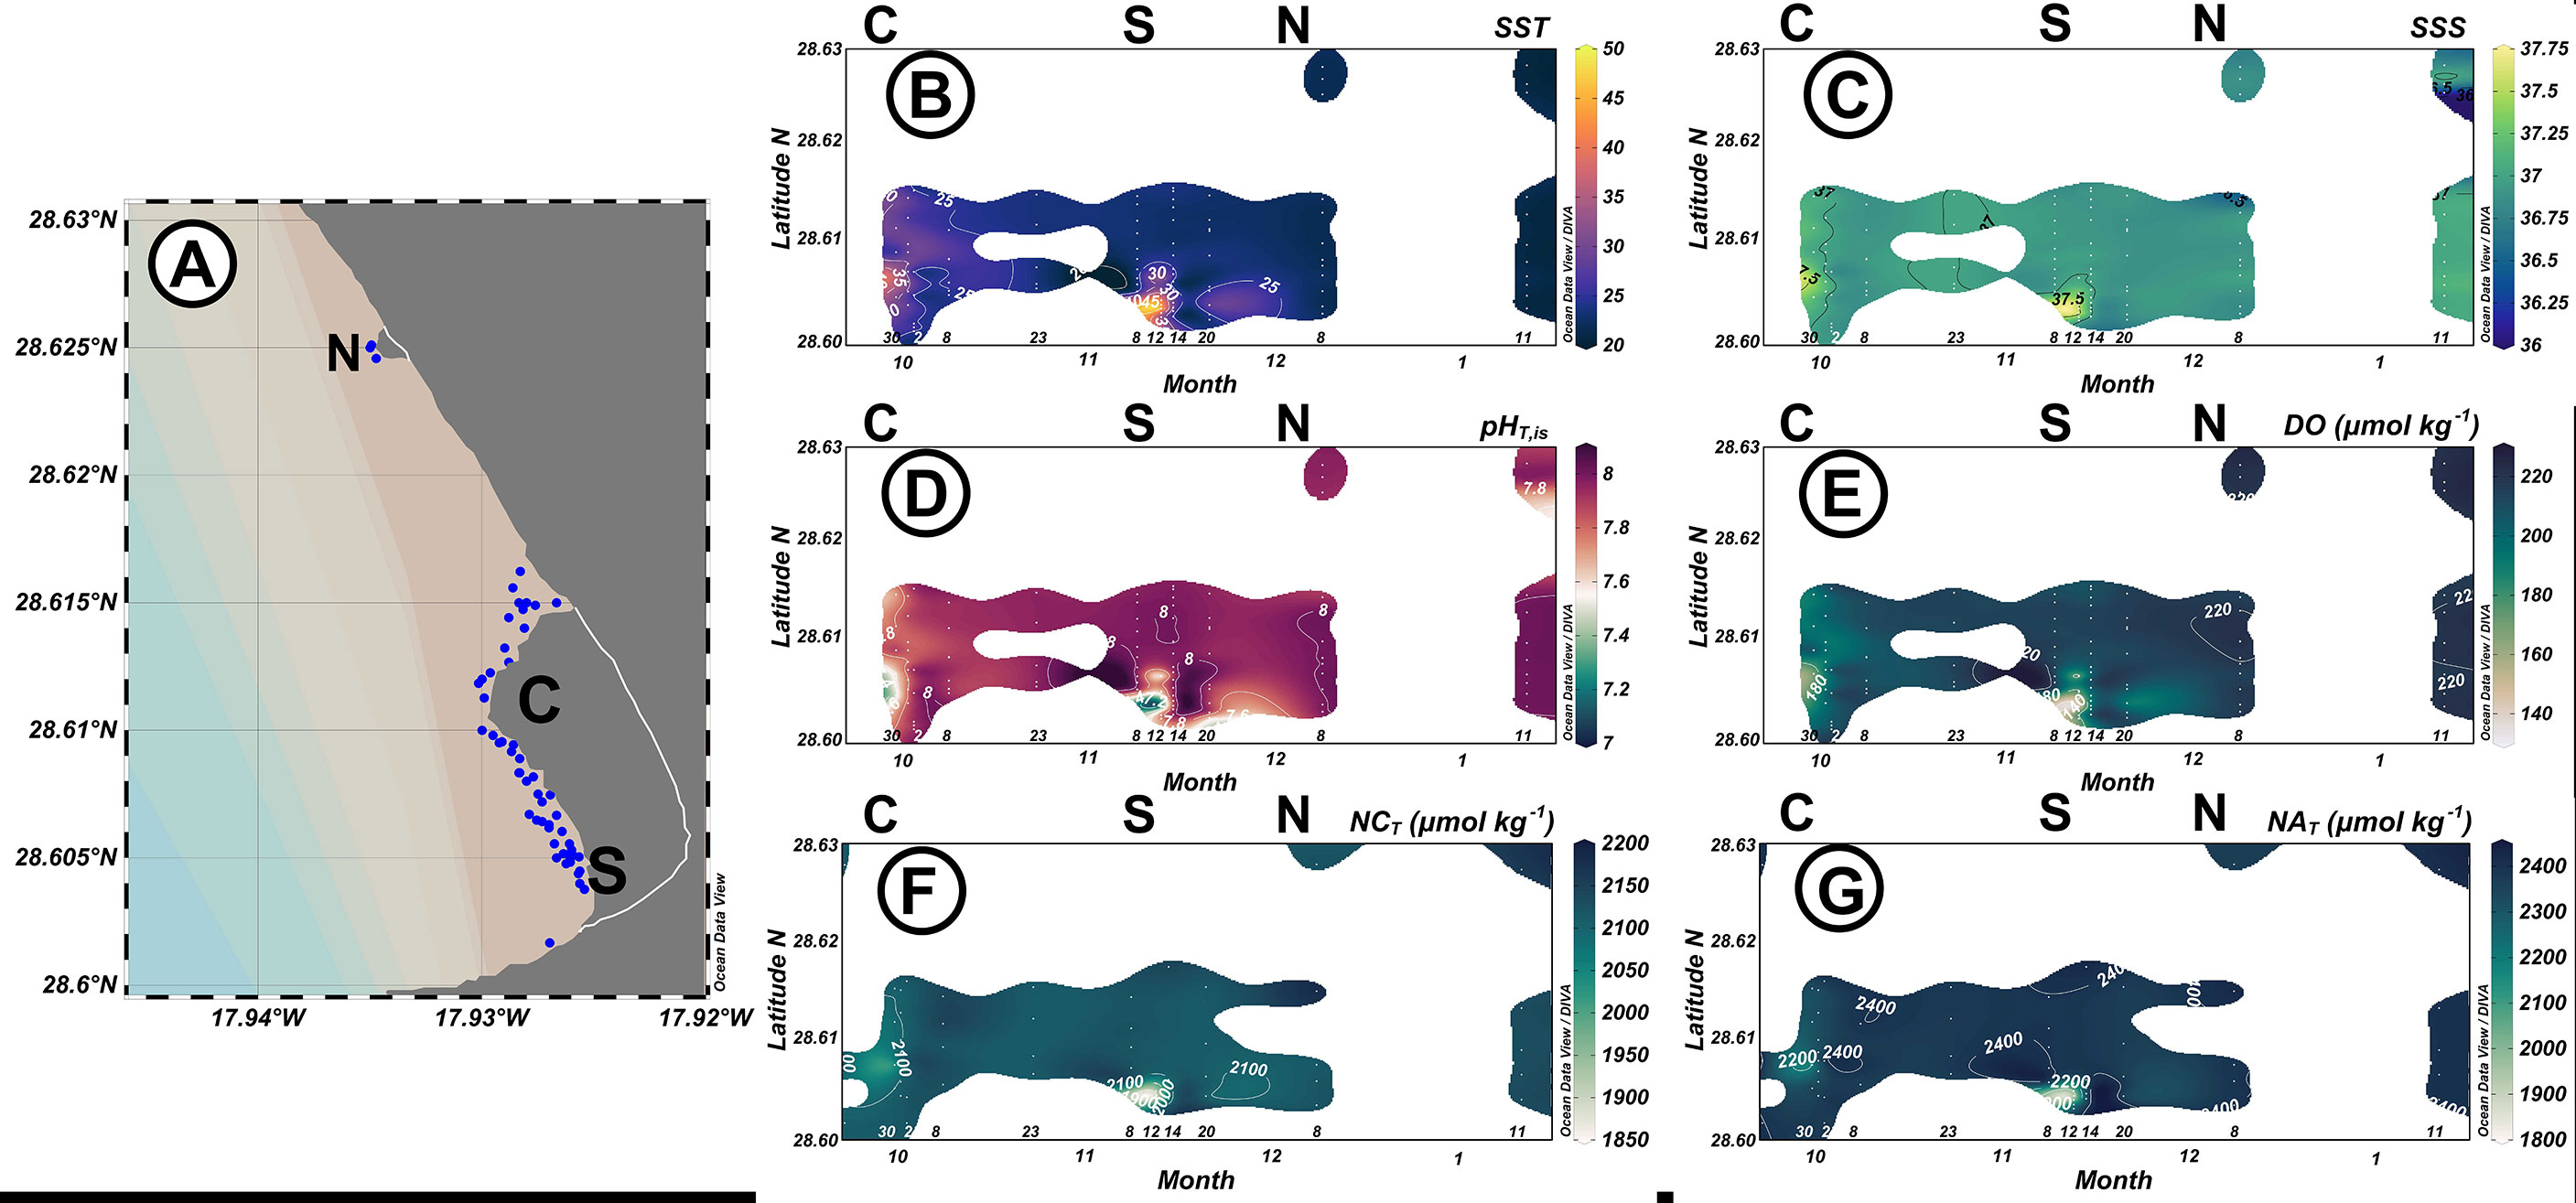
Figure 3 (A) Map of the coast of Tazacorte with the newly gained shoreline delimited with the white line. Blue dots correspond to the sampling stations. North (N), center (C), and south (S) correspond with the locations of the pre-lava arrival stations. Surface seawater properties of (B) temperature (SST in °C), (C) salinity (SSS), (D) pH in total scale at in-situ conditions (pHT,is), (E) dissolved oxygen concentration (DO, µmol kg−1), (F) normalized to a constant salinity of 37 CT (NCT, µmol kg−1), and (G) normalized to a constant salinity of 37 AT, (NAT, µmol kg−1) from 22nd September 2021 to 11th January 2022 at a distance of 15–25 m from the two formed deltas at the coast of Tazacorte, La Palma. C, S, and N correspond to the arrival of lava to the respective originally sampled stations at those dates.
Figures 3F, G show how the lava–seawater interaction produced a decrease in both surface NAT and NCT. The NCT decreased by 90 µmol kg−1, while the NAT decreased by 224 µmol kg−1, reaching 2,180 µmol kg−1 (Table S1). These results indicate that the effect is not only due to strong acid addition but also due to the loss of carbonate species by titration of carbonate alkalinity. These processes together with silicate and phosphate precipitation with metals from the lava affected the AT. The corresponding ΩCal and ΩAra decreased by 42% to values of 2.87 and 1.90, respectively (Table 1). The following day, on October 1st, the maximum recorded temperature was 30°C and the pH was 7.79 (55% of the total change was explained by the SST increase). Román et al. (2022) only presented surface data (n = 7) for this sampling day. The reported pHT (from 7.2 to 7.9) and AT (from 1,995 to 2,311 µmol kg−1), which were lower than those in unaffected seawater (7.95 and 2,403 µmol kg−1, respectively), were in the same range than those presented here.
On November 12th, 2 days after the second lava event (S location in Figure 3), extreme conditions were observed. At a distance of 25 m from the lava front, where there was intense fume emission and laze formation, the SST was in the 45°C–50°C range (Figure 3B) with salinities of 37.7 (Figure 3C). The lowest measured pHT,is was 7.02 (Figure 3D), with a DO of 145 µmol kg−1 (Figure 3E). Forty percent of the pH decrease was due to SST increase. Of the 70 µmol kg−1 DO decrease, about 60 µmol kg−1 was due to changes in gas solubility, with the remaining 10 µmol kg−1 corresponding to the AOU change. The lowest NAT and NCT were measured in waters that were at 46.3°C, with concentrations of 1,837 and 1,852 µmol kg−1, respectively (Figures 3F, G, Table S1). This meant that there was a decrease of 566 µmol kg−1 in NAT and 272 µmol kg−1 in NCT. Under these low pH and CT concentrations, ΩCal and ΩAra decreased in the frontal zone by over 90% to indexes below 0.8 and 0.5, respectively, further decreasing to values close to zero at the hottest stations. The third event took place from November 22nd to November 24th. The lava reached the coast 1.3 km north of the previous delta (location N in Figure 3), forming a new separate ~9-ha delta. The site was visited 2 weeks later. The seawater conditions did not present any anomalous values (Figures 3B–G).
The water column properties close to the frontal zone were also affected, as shown in Figures 4C, E for September 30th and in Figures 5B, C, E, G for November 12th. In November, the seawater 20–25 m away from the frontal zone presented temperatures reaching 50°C in the top meter of the water column (Figure 5B). Due to the loss of density, the affected seawater moved upwards and displaced outwards toward the ocean as a 4–6-m deep filament of anomalous values. This filament was observed in the first meter of the water column as far as 1.5 km from the coast (Figures 5D, F). The same behavior but with a much lower temperature and affected area was observed on September 30th (Figures 4B, D). The presence of steam was observed in many places at distances of a few meters to 10 m inland of the frontal zone of the new deltas when the lava was not falling down the cliff or was falling on previously formed terrain. However, during those periods, the anomalies in the seawater were strongly limited to the first few tens of centimeters of the water column and at distances of<15 m.
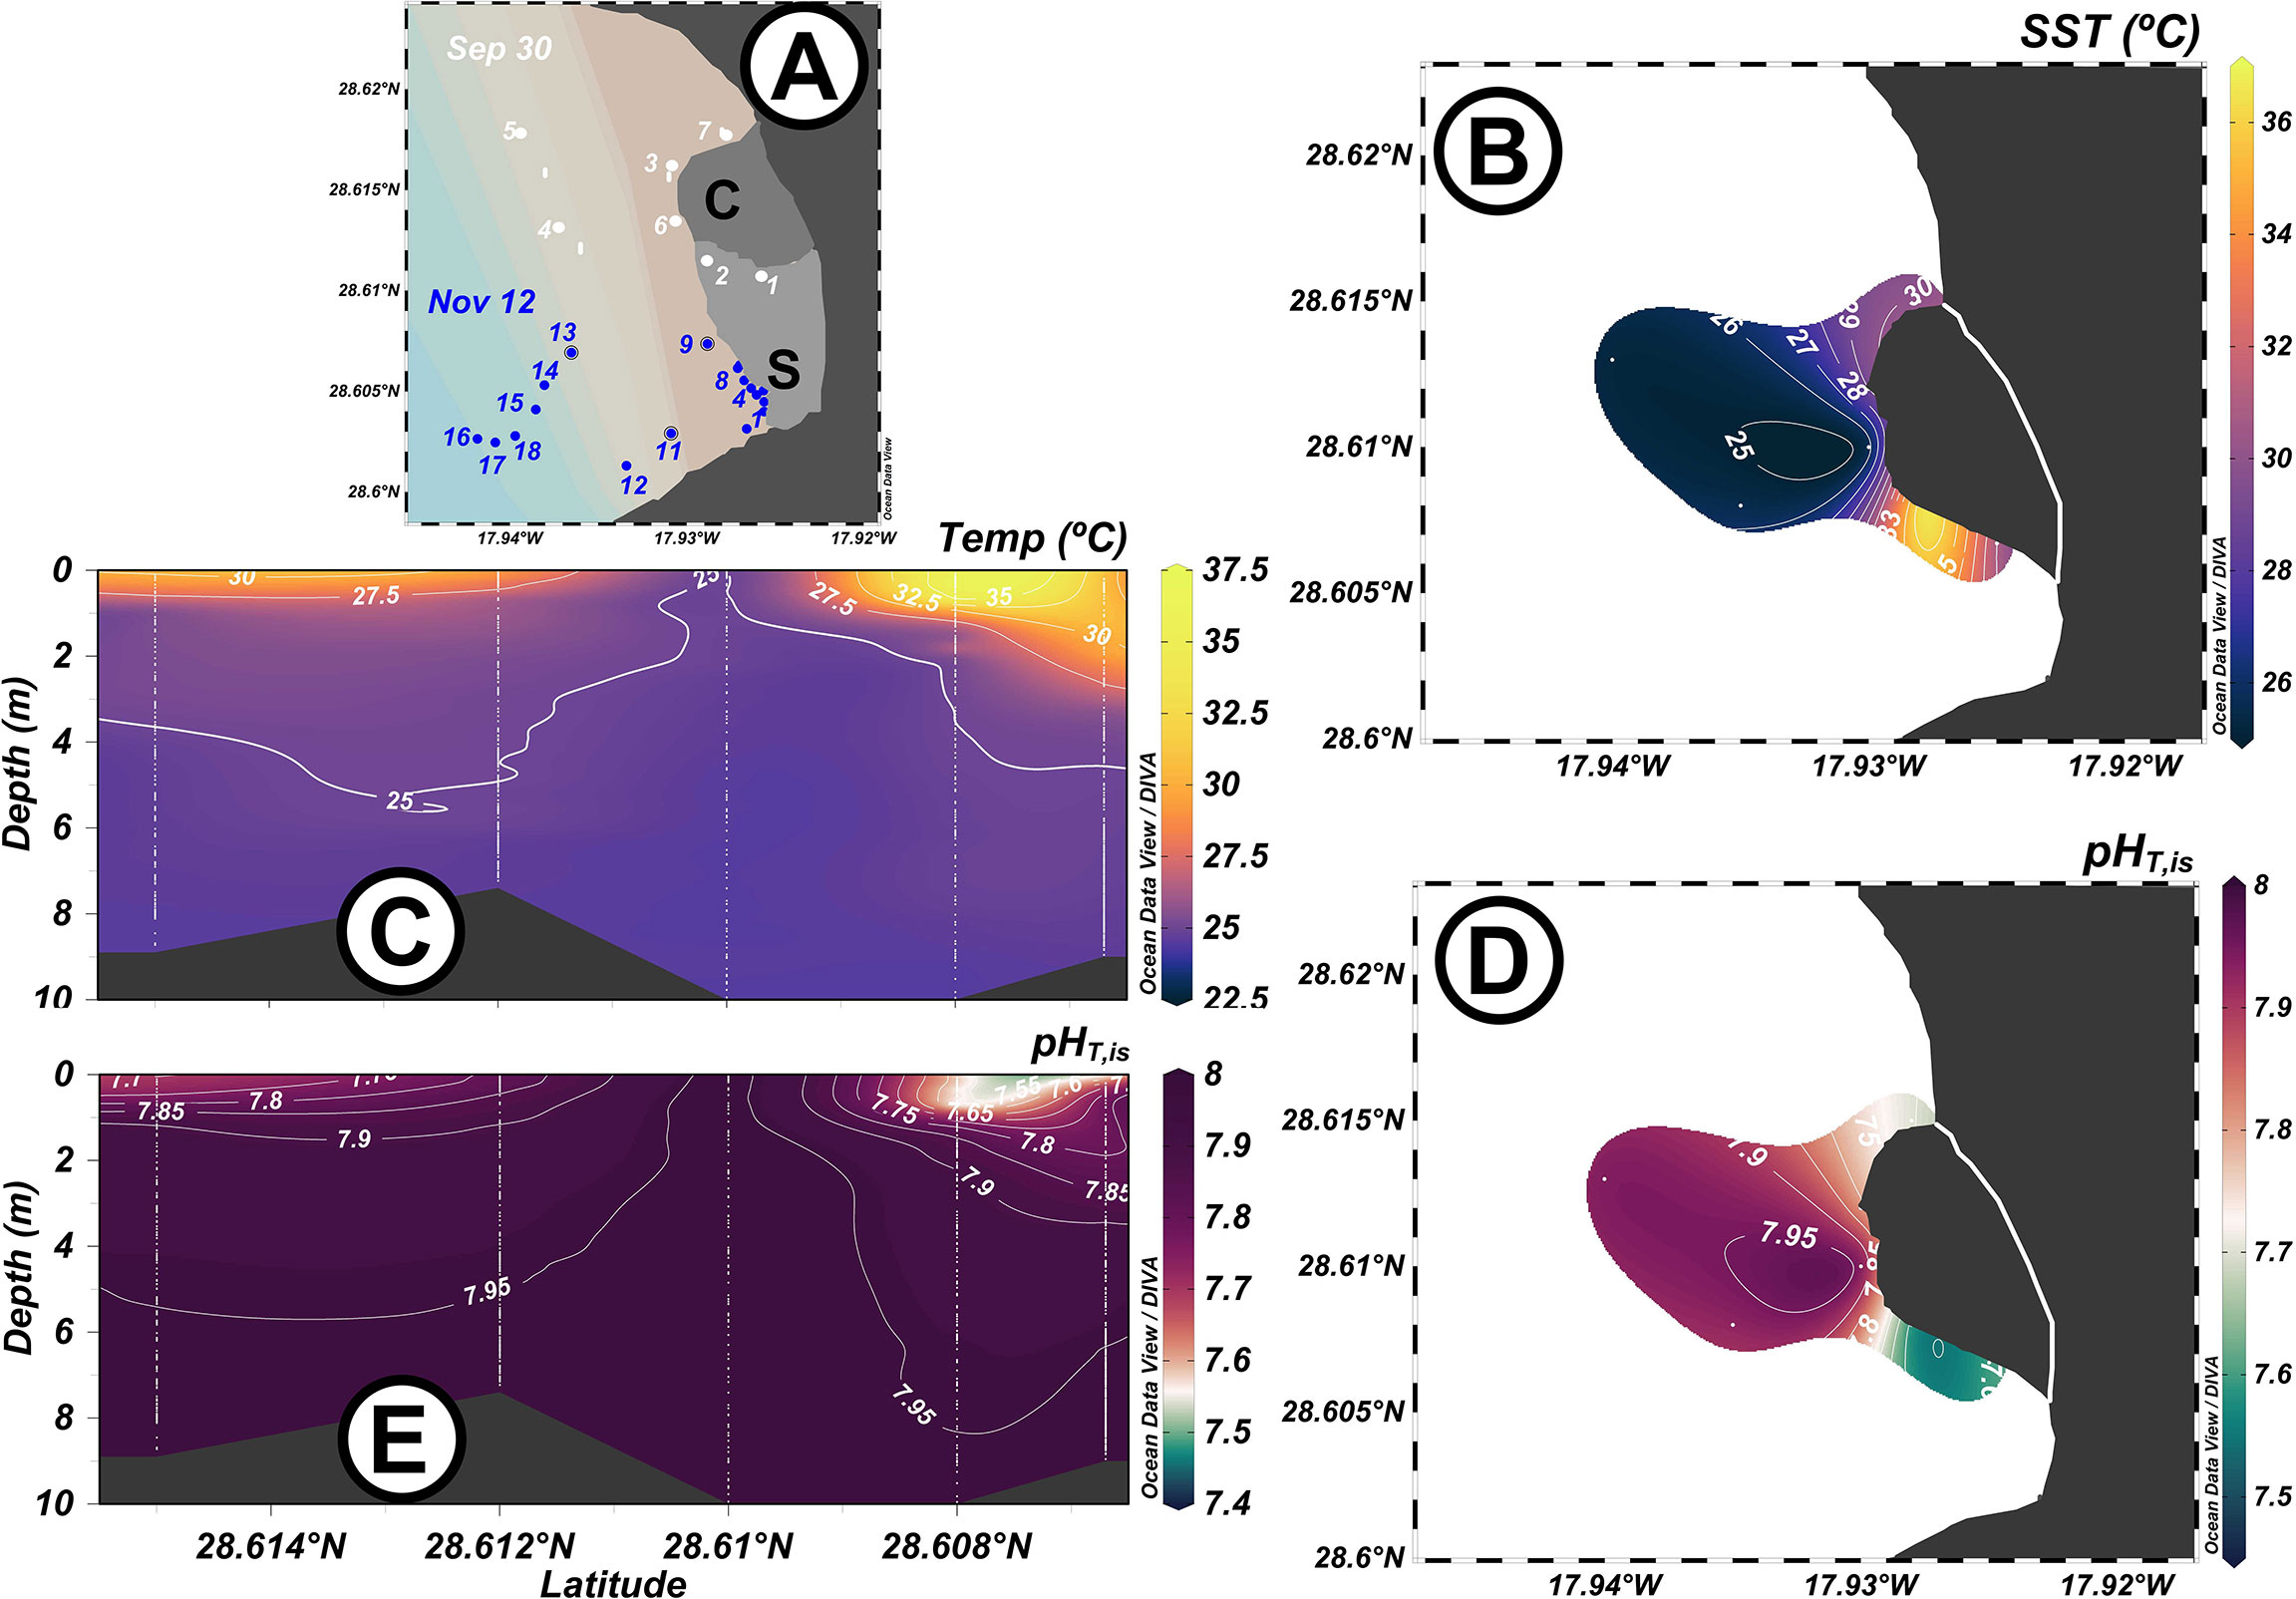
Figure 4 (A) Map of the sampling stations at the south delta covering original station C (Figure 1C) visited during September 30th (white dots). Sampling stations during November 12th (dark blue dots) are also included. Surface (B, D) and vertical (C, E) plots of temperature (Temp, B, C) and pHT,is (D, E) along the first formed delta.
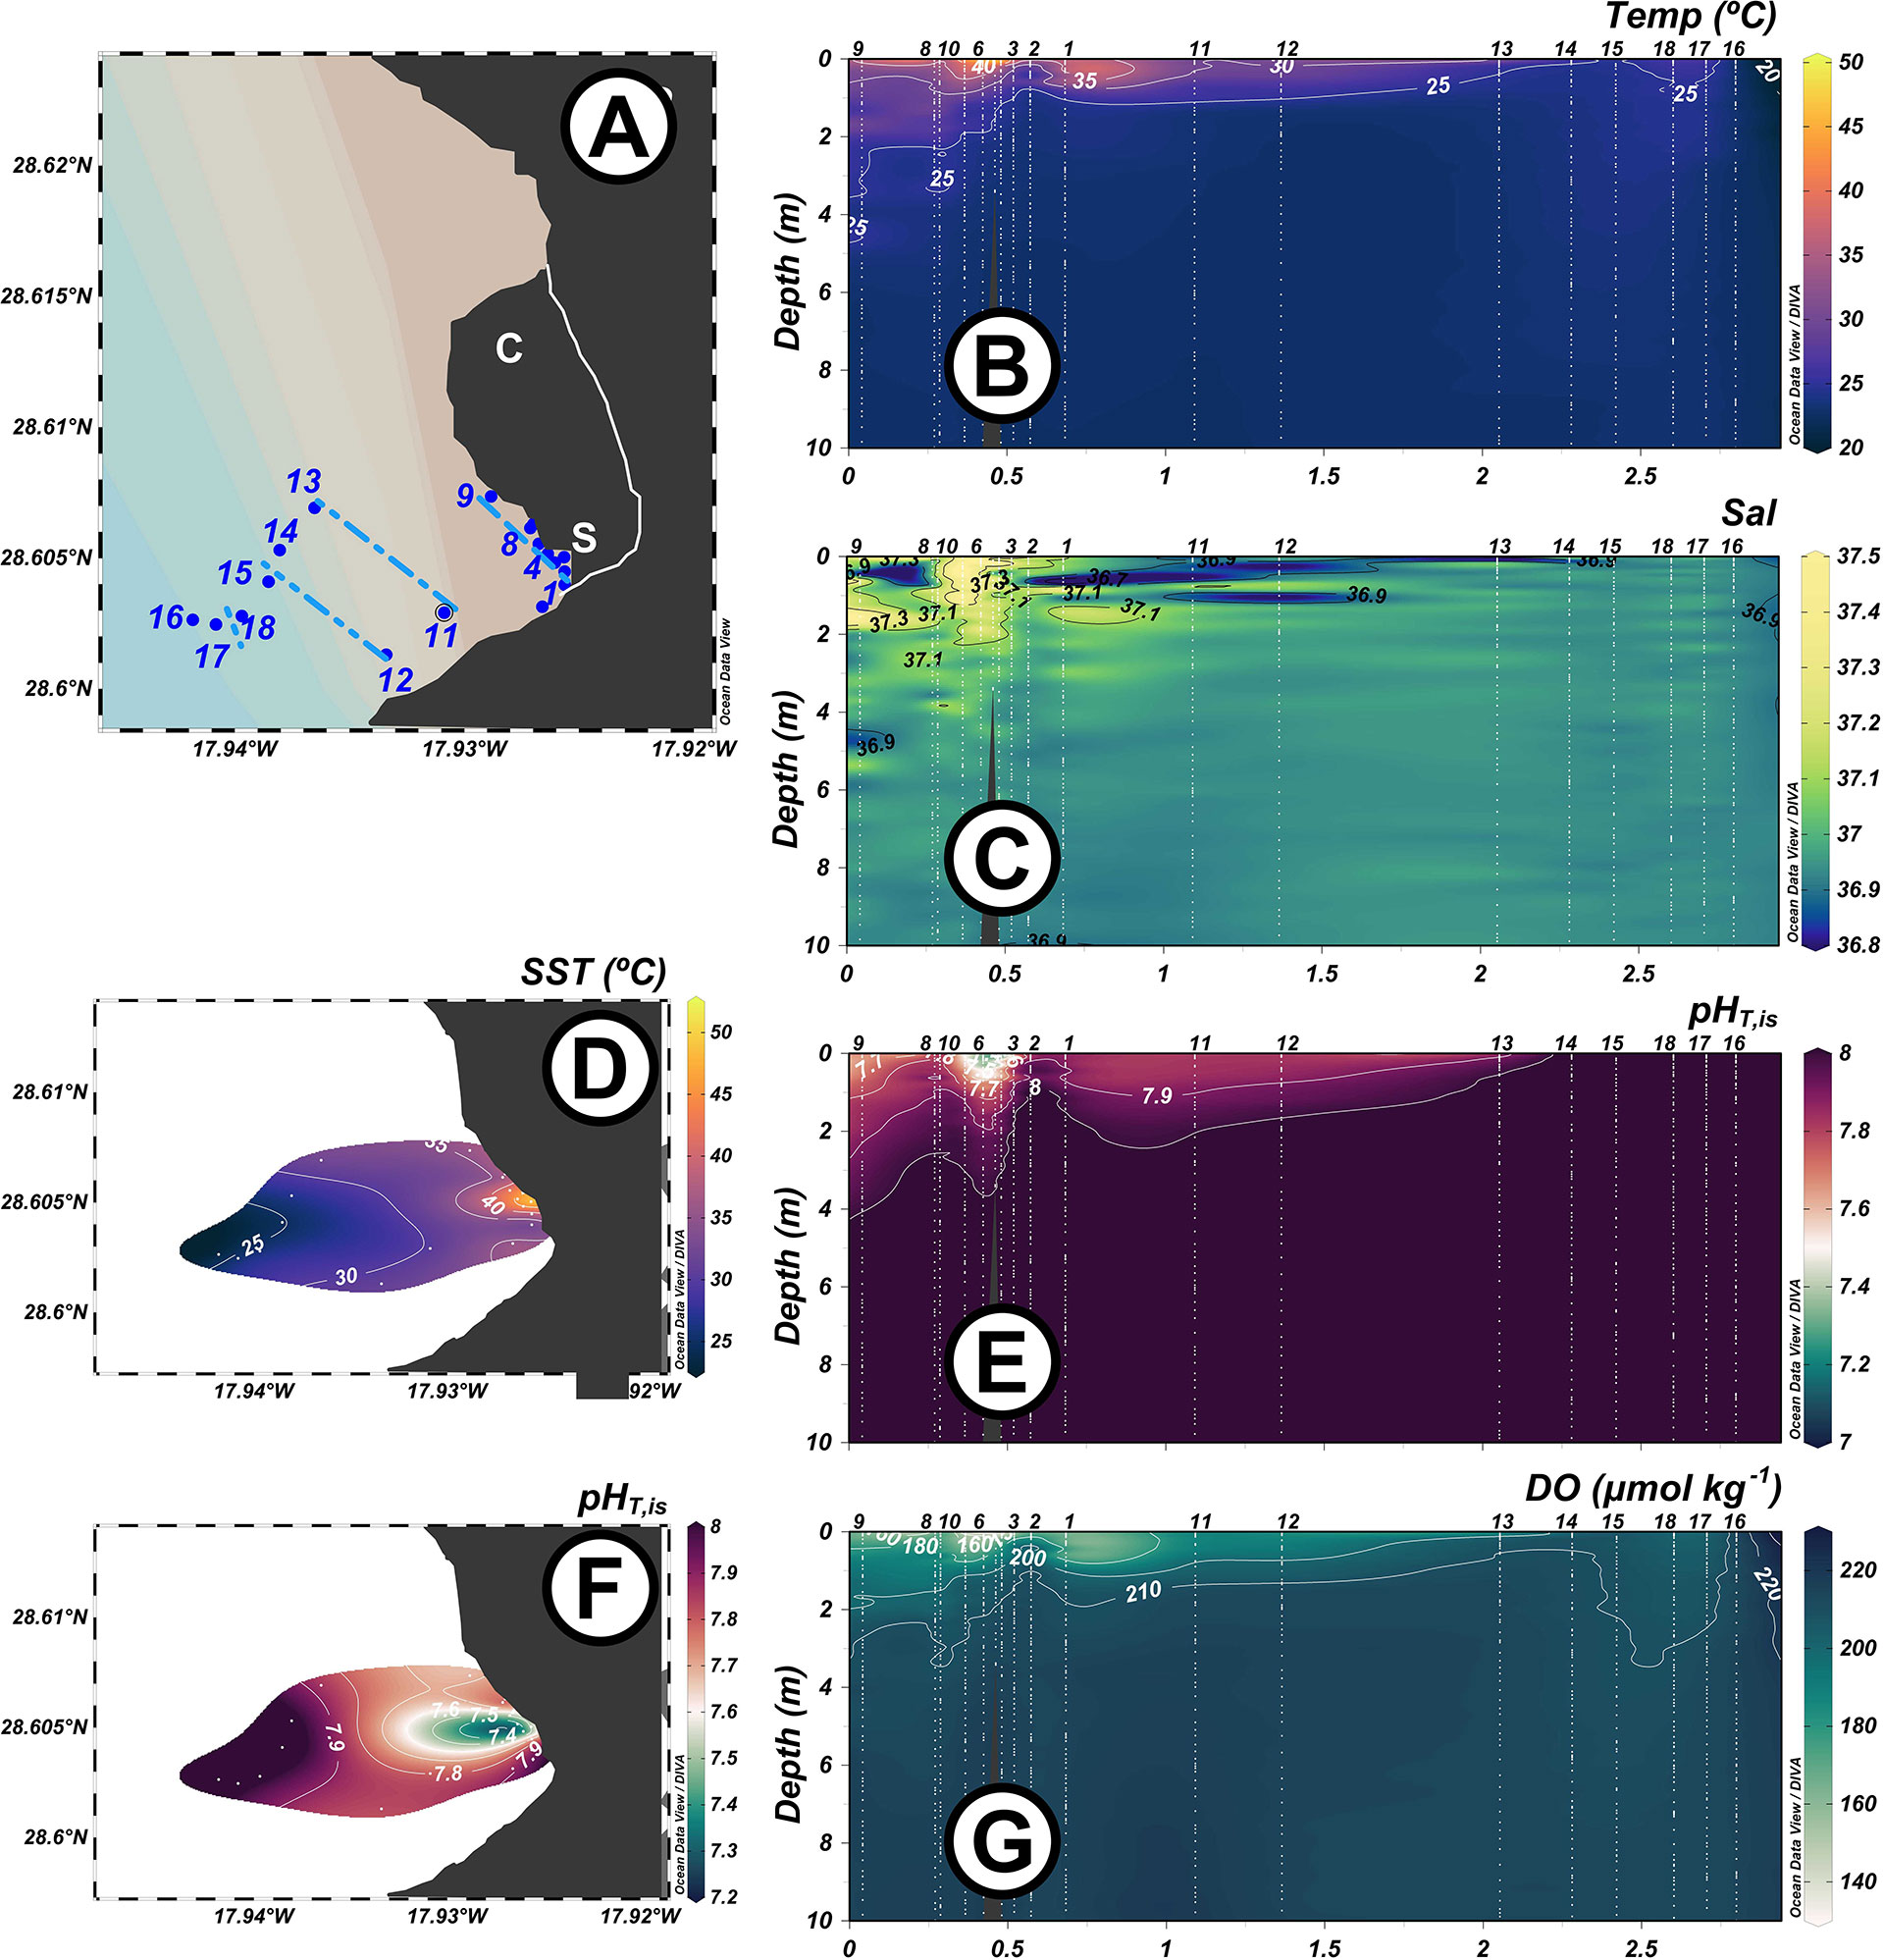
Figure 5 (A) Map of the sampling stations at the south delta during November 12th (dark blue dots), 2 days after the second lava–seawater event took place. Dotted lines represent transects considered in the proton balance calculation. Vertical distributions of temperature Temp, (B), salinity Sal, (C), pH in total scale pHT,is, (E), and dissolved oxygen DO, (G) along the frontal section (stations 1–9) and along the surrounding waters (stations 10–18) and surface plots of temperature SST, (D) and pHT,is (F).
When observable incandescent lava reached the lava–seawater interface, laze formed, steam columns appeared, and the pH decreased by 0.9 units to values of 7.01 within the first meters away from the coast. There was a low or no effect below 6 m depths in the water column (Figures 5B–G). Anomalous values were also measured along the filaments around the delta with values that decreased with depth and with distance from the new shoreline (Figures 5B–G). When the deltas were visited later than 2–3 days after the lava stopped feeding the frontal part of the deltas, there were only slight temperature increases in very localized points, as observed on November 20th (Figure 3, Table 1). When there were low pH anomalies (<0.02 units for samples out of the affected area) within the first 25 m of the new shoreline, NAT and NCT presented concentrations (n = 28) of 2,400.4 ± 3.5 and 2,114.8 ± 4.0 µmol kg−1, respectively. Samples inside the affected area with anomalous temperature and pH values always presented reduced NAT and NCT (Tables 1 and S1).
For all the measured Tajogaite Volcano eruption samples (Figures 4, 5, Table S1), seawater–lava interactions were followed by a notable decrease in pHT. This could be a result of the release of magmatic volatiles and water–rock reactions, changing the AT and CT. A portion of the magmatic acidic volatiles (CO2, SO2, HCl, HF, HBr) that remained within the lava as it flowed toward the ocean was released when it reached the seawater. These volatiles exsolved from the lava, mixing with the water vapor, but also affected the seawater pH. Thermodynamic calculation by Symonds et al. (2001) in volcanic systems for SO2 gas reacting in seawater indicated the production of both hydrogen sulfide (H2S) and sulfuric acid (Eqs. 2 and 3).
There are two known possible processes that produce HCl. Previous studies at Kilauea Volcano, Hawaii (Resing and Sansone, 1999), considered the results from the NaCl–KCl–H2O–quartz system at 600°C (Fournier and Thompson, 1993) and indicated that the primary water–rock reaction responsible for HCl formation could be Na metasomatism. Similarly, Mg metasomatism, including various aluminum-rich silicates to form albite (Eq. 4), could also be possible. In the eruption within Vatnajökull Glacier, Iceland (Gíslason et al., 2002), waters were also found to be supersaturated with albite and produced HCl.
For the La Palma eruption, there are no results that could indicate which of these mechanisms is the most likely, even though a transition to increasing MgO content and less viscous lava flows was observed throughout the eruption (Scarrow et al., 2022). Moreover, analyses of volcanic ash leachates indicated that the most abundant components were for anions and Na+ for cations (Rodríguez et al., 2022).
Together with an ocean acidification process in the lava–seawater interface and surface waters, all samples presented a decrease in both AT and CT and an increase in pCO2 that correlated with the increase in temperature (Figure 6). The decrease in both AT and CT distinguished this process from the ocean acidification process due to anthropogenic CO2 uptake into the ocean, where surface AT does not change while CT increases. These same decreases have also been reported at Kilauea (Sansone and Resing, 1995; Resing and Sansone, 1999). There was no linear relationship with temperature (Figure 6), indicating that thermal conditions at the seawater–lava interface are important in the mobilization of species. However, it should be deduced that all the processes would be amplified when the lava front advanced into the sea, continually exposing new surfaces to seawater intrusion (Olafsson, 1975). In La Palma, when the temperature increased to over 46°C, the pH values strongly decreased over the expected temperature dependence (~−0.016 pH °C−1, dashed line in Figure 6) (Takahashi et al., 1993). The addition of acids from the lava further contributed to the decrease of pH in addition to the effect from the change in the temperature, all of which reduced the AT. If the change in temperature was the only process affecting acidity, when the pH of the seawater of 8.0 at 25°C decreased to pH 7.0 at 46°C (Figure 5), the NAT should have decreased from 2,404 to 2,097 µmol kg−1. However, the measured NAT was 1,837 µmol kg−1 (~260 µmol kg−1 lower). Even though the CT also decreased, the increase in acidity due to magmatic CO2 addition cannot be dismissed. Similarly, Burton et al. (2022) found CO2-rich emissions during the explosive and effusive activities from the mafic alkali-rich magma which forms the Canary Islands. The addition of magmatic CO2 has been observed at other submarine eruptions in the Canary Islands or eruptions reaching the sea (Cheminée et al., 1991; Gíslason et al., 2002; Hall-Spencer et al., 2008; Santana-Casiano et al., 2013).
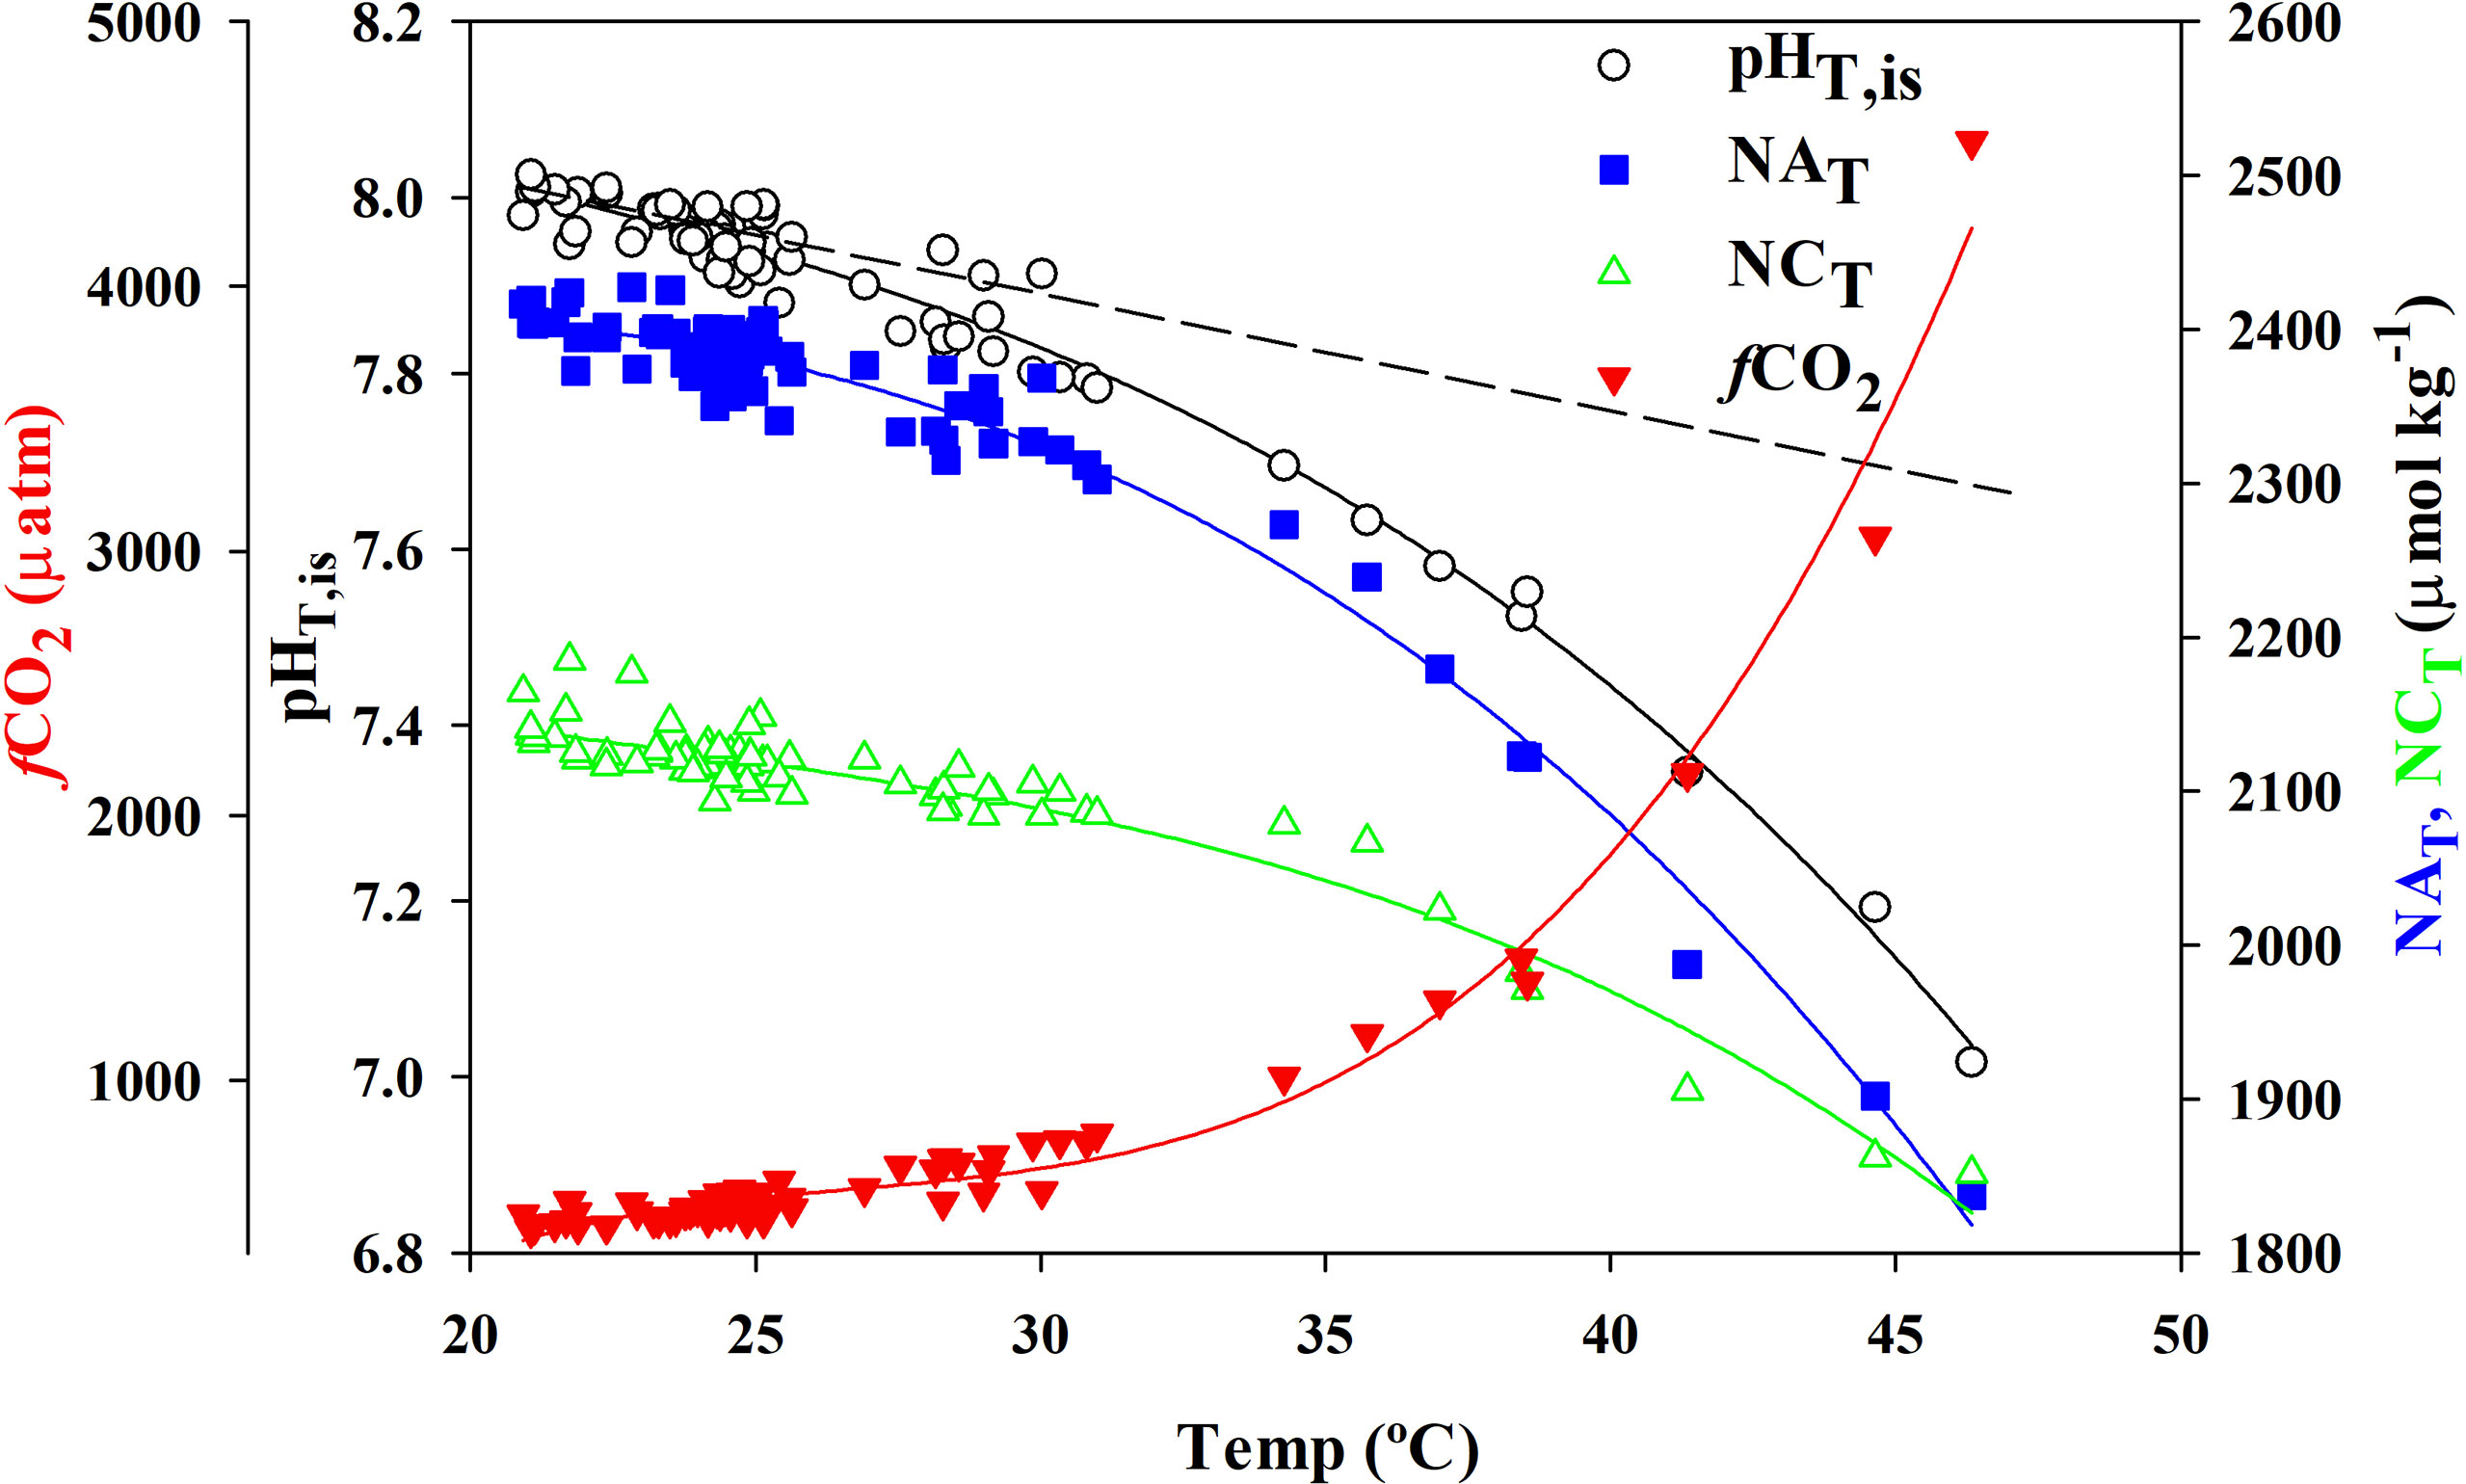
Figure 6 Relationship with temperature for pHT,is (black open dots), normalized to a constant salinity of 37 for AT (NAT, blue squares) and CT (NCT, green open triangles), and fCO2 (red triangles). Lines represent the third-degree polynomial fitting of the data. The black dashed line is the expected pH dependence with temperature (Takahashi et al., 1993).
The highest NCT decrease was 272 µmol kg−1, which is only 12 µmol kg−1 higher than the remaining NAT. This indicated that carbonate alkalinity had been titrated by the magmatic acidity and converted into CO2. This process is especially relevant in coastal waters where the high turbulence in the ocean–atmosphere interface could release the CO2. The 1:1 NAT:NCT ratio indicated that due to the observed pH, most of the carbon species existed as . However, CO2 could also solubilize in the seawater and, together with magmatic CO2 addition, could contribute to the pH decrease and to an increase in CT. This could explain the small net increase in NCT observed after carbonate alkalinity titration.
As water evaporates in contact with the lava, major ions in seawater will be enriched. This would be proportional to the increase in salinity together with the increase in silicate (Olafsson, 1975) and other metals (e.g., Fe3+, Al3+) dissolved from the lava under the presence of acids used to liberate cations from the basalt (Resing and Sansone, 1999). Those metals can also precipitate as carbonate, phosphate, silicate, and sulfur salts, removing AT and CT. Also, calcium carbonate can be thermally decomposed at temperatures above 750°C releasing oxides and CO2 into the seawater (Karunadasa et al., 2019). Therefore, a balance for the total acid added to the seawater by the lava is difficult to establish. Moreover, the carbonate variable measurements were performed at least 10–15 m away from the lava–seawater interface, and therefore, they were diluted by the ambient seawater that is displaced both by currents and by convective cells formed in the frontal areas.
Taking all these factors into consideration, the amount of acid injected ( ) into the lava–seawater interface during November 12th can be computed. The calculation should consider the amount of acid needed to produce the observed decrease in pH ( ) in the coastal water column (Figure 5E) close to the front and along the plume (Figures 5E, F). The total amount of protons should also include those required to titrate the AT of the seawater ( ) by the magmatic acidity (Figures 3G, 6) decreasing the NAT from those initially measured of 2,404.4 ± 1.5 µmol kg−1 to the observed one (Eq. 5),
where represents the protons unbalanced due to protons used to react with the basaltic rocks liberating cations.
To compute the different variables (supplementary), the temperature effect on pH was first accounted for. The average pH value for the 6–10-m water column before the arrival of the lava of 7.995 ± 0.008 (proton concentration expressed in µmol kg−1) at 25°C was converted to mol m−3 and computed at the in-situ temperature with the fixed NAT of 2,404.4 µmol kg−1. The initial proton concentration at the final temperature was then subtracted from the measured pH under the same in-situ conditions. The protons in the solution were integrated along the water column where pH was lower than that at the reference pH (first 5–7 m, Figure 5E), along the frontal zone (620 m) and at the distance from the shore to the unaffected location recorded on November 12th (~1,300 m) using four different sections (Figure 5A). The integration of the data provided a concentration of 44.4 mmol in solution (Figure S3).
The experimental temperature to NAT relationship (Figure 6) and the corresponding error of the estimate was applied to the profile data to compute AT values for each station. The pH was computed both at the in-situ temperature and fixed salinity of 37 for the reference station with fixed NAT and NCT (2,404.4 and 2,112.8 µmol kg−1, respectively) and at the fixed NCT and computed profile NAT. The differences in proton concentration and the integration for the area (Figure S4) provided an additional concentration of 796 ± 72 mmol. The term would require the measurement of liberated cations from the basalt by acids into the seawater, especially Fe3+ and Al3+. The Fe-hydroxy precipitation in contact with seawater as the pH increased over 7 is favored over the soluble species at lower pH. The precipitation makes the mobility of Fe low in the frontal zone which makes it difficult to get a realistic value of the generated concentrations at a long distance from the frontal zone. The formation of amorphous Al(OH)3 or precipitation of Al-bearing phases can produce a low enrichment factor for Al (Gíslason et al., 2002). No seawater concentrations for those elements are available during the La Palma volcanic eruption. However, assuming a similar distribution of Fe and Al to the Fe solution in the El Hierro Tagoro Volcano (Santana-Casiano et al., 2013) and the three protons used for each dissolved Fe and Al, they could account for ~21 mmol of additional protons (Figure S5). Consequently, important amounts of acids were produced when the lava was interacting with the seawater to distribute a total of 860 mmol of H+ along the studied frontal zone, in an area of 0.9 km2 with a depth of 6 m at the front that reduced to a few tens of centimeters at a distance of 1,300 m. The average added H+ concentration to the seawater by the lava was 0.31 µmol kg−1, which would produce an average pH of 6.5 in 2.7 · 106 m3 of water without AT, but in seawater, the resulting average pH was close to 7.6. This acid addition was being produced when the area was sampled 2 days after the lava arrived to the sea. This value should be applied, with the assumptions considered, for the day of the observation and is expected to be greater for the day the lava just arrived to the sea and when a larger surface was exposed to the seawater.
Even when the data indicated no or very low CO2 addition to the seawater, the decrease in pH and the increase in temperature produced an increase in fCO2. fCO2 reached over 4,500 µatm at the warmest station, St. 4, on 12th November 2021 (Figure 4). Considering the relationship between fCO2 and SST (Figure 6) and averaging the values for the area (0.9 km2), fCO2 for the affected seawater was ~930 µatm. When considering an atmospheric fCO2 of 405 µatm with an average wind speed of 7 m s−1, the flux of CO2 computed for the area was 2 tons of CO2 on November 12th. Without the eruption, the area at this time of the year with a computed fCO2 (AT, CT) of 419 µatm and under the same conditions would outgas 50 kg of CO2 on that same day. Therefore, the emissions of the area increased by a factor of 40, compared to the daily emitted CO2 under non-eruptive conditions.
The 2021 eruption in La Palma produced an ~200-m-high volcanic cone and covered more than 1,200 ha, where ~50 ha was gained to the sea in the form of two lava deltas. These new oceanic formations were built over three events lasting 2–5 days. The deltas formed 7 km away from the lava emission site, enabling lava–air gas exchange before the lava interacted with the seawater. The seawater analysis along the new shoreline and at different transects during 13 visits showed pools of heated seawater that reached 50°C and salinities that increased by 0.75. The seawater pH 10–15 m from the lava–seawater interface was 1 unit below that of the surrounding seawater. The anomaly spread within the top 5–10 m of the water column and at distances of more than 1,000 m in the top centimeters. The decrease in density favored the formation of a surface layer of affected seawater that extended over 0.9 km2. The decrease in pH together with lower concentrations in both AT and CT was due to the addition of acids coming from both acidic–magmatic volatiles, especially from the SO2-rich magma and from metasomatism. Even considering that eruptions in oceanic islands with mafic alkali-rich magmas, as is the case for the Canaries, produce high CO2 emissions, CT levels in surface waters during this eruption did not increase. Contrarily, a maximum decrease in the NCT of 272 µmol kg−1 was recorded. Moreover, the addition of residual CO2 from the lava gases together with CO2 produced from the titration of carbonate alkalinity, which could increase the CT and decrease the pH, cannot be dismissed. Consequently, the highest NCT decrease was 272 µmol kg−1, only 12 µmol kg−1 higher than the decrease in NAT by the acid titration.
A balance for the total acid needed to produce the observed decrease in pH and AT together with the acid used in dissolving metals from the basaltic rocks was estimated to be 0.31 µmol kg−1 of seawater for a total of 2.7 · 106 m3 with a surface area of 0.9 km2 recorded on November 12th, 2 days after the second ocean lava entry event took place.
One month after the eruption was declared finished, and even during the eruptive phase when the lava was not reaching the seawater interface, the coastal waters of Tazacorte rapidly reverted to their previous physicochemical conditions. Multiple factors will contribute to a fast recovery of the affected oceanic area. The formation of new mineral-rich deltas and the special characteristics of the coastal areas in the south part of La Palma (low salinity, low pH, and high CO2 gas diffusive emissions through submarine groundwater discharges) will favor the solubilization of essential minerals.
The original contributions presented in the study are included in the article/Supplementary Material. Further inquiries can be directed to the corresponding author.
Fieldwork and analysis were carried out by all the authors. DG-S and MG-D wrote the original draft. JMS-C and AG provided input on the manuscript. All authors participated in the interpretation of the data. All authors contributed to the article and approved the submitted version.
This research was funded by the Ministerio de Ciencia del Gobierno de España and by the Gobierno de Canarias and the Loro Parque Foundation though the CanBIO-CanOA project.
We would like to thank the Canary Islands Emergency Volcanic Plan (PEVOLCA) and its director (Miguel Ángel Morcuende) for the facilities provided for this study. We also thank the Salvamento Maritimo en Canarias and the Salvamar Alphard crew for the means provided for the study. Special thanks go to the Spanish Guardia Civil, its marine group, and GEAS for their effort and dedication, providing us with two ships and crew, the “Pico Teide” and zodiac for sampling and ROV work, particularly to Captain Roberto Durán González for providing all the necessary resources. Thanks also to the Capitanía Marítima de Santa Cruz de Tenerife and the Regional and National Governments for the permission for sampling inside the exclusion zone. We would like also to thank Estudios Ambientales y Oceanografía (ECOS) for providing the AAQ sonde and for the ROV images. This research is part of the activities of the Observatorio Marino de Cambio Climático (OMACC) del Faro de Fuencaliente de La Palma.
The authors declare that the research was conducted in the absence of any commercial or financial relationships that could be construed as a potential conflict of interest.
All claims expressed in this article are solely those of the authors and do not necessarily represent those of their affiliated organizations, or those of the publisher, the editors and the reviewers. Any product that may be evaluated in this article, or claim that may be made by its manufacturer, is not guaranteed or endorsed by the publisher.
The Supplementary Material for this article can be found online at: https://www.frontiersin.org/articles/10.3389/fmars.2022.952203/full#supplementary-material
Albertos V. T., Recio G., Alonso M., Amonte C., Rodríguez F., Rodríguez C., et al. (2022). Sulphur dioxide (SO2) emissions by means of miniDOAS measurements during the 2021 eruption of cumbre vieja volcano (La Palma, Canary Islands: EGU General Assembly 2022). EGU22-5603.
Burton M., Aiuppa A., Asensio-Ramos M., La Spina A., Allard P., Liu E., et al. (2022). CO2-rich emissions from alkalic magmatism in the canary islands (Spain: EGU General Assembly 2022). EGU22-5629.
Büttner R., Zimanowski B., Blumm J., Hagemann L. (1998). Thermal conductivity of a volcanic rock material (olivine-melilitite) in the temperature range between 288 and 1470 K. J. Volcanol. Geotherm. Res. 80, 293–302. doi: 10.1016/S0377-0273(97)00050-4
Büttner R., Zimanowski B., Lenk C., Koopmann A., Lorenz V. (2000). Determination of thermal conductivity of natural silicate melts. Appl. Phys. Lett. 77, 1810. doi: 10.1063/1.1311815
Caballero I., Román A., Tovar-Sánchez A., Navarro G. (2022). Water quality monitoring with sentinel-2 and landsat-8 satellites during the 2021 volcanic eruption in la palma (Canary islands). Sci. Total. Environ. 822, 153433. doi: 10.1016/J.SCITOTENV.2022.153433
Cheminée J. L., Stoffers P., McMurtry G., Richnow H., Puteanus D., Sedwick P. (1991). Gas-rich submarine exhalations during the 1989 eruption of macdonald seamount. Earth Planet. Sci. Lett. 107, 318–327. doi: 10.1016/0012-821X(91)90079-W
Coca J., Ohde T., Redondo A., García-Weil L., Santana-Casiano J. M., González-Dávila M., et al. (2014). Remote sensing of the El hierro submarine volcanic eruption plume. Int. J. Remote Sens. 35, 6573–6598. doi: 10.1080/01431161.2014.960613
CSIC (2021) Mapa erupción la palma (IGME-CSIC). Available at: https://info.igme.es/visor/?Configuracion=Enjambre-Terremotos-La-Palma&Extension=-17.93,28.57,-17.82,28.65,4326 (Accessed March 28, 2022).
De Ronde C. E. J., Baker E. T., Massoth G. J., Lupton J. E., Wright I. C., Feely R. A., et al. (2001). Intra-oceanic subduction-related hydrothermal venting, kermadec volcanic arc, new Zealand. Earth Planet. Sci. Lett. 193, 359–369. doi: 10.1016/S0012-821X(01)00534-9
De Ronde C. E. J., Baker E. T., Massoth G. J., Lupton J. E., Wright I. C., Sparks R. J., et al. (2007). Submarine hydrothermal activity along the mid-kermadec arc, new Zealand: Large-scale effects on venting. Geochem. Geophys. Geosyst. 8, Q07007. doi: 10.1029/2006GC001495
Dickson A. G. (1990). Standard potential of the reaction: AgCl(s) + 12H2(g) = ag(s) + HCl(aq), and and the standard acidity constant of the ion HSO4– in synthetic sea water from 273.15 to 318.15 K. J. Chem. Thermodyn. 22, 113–127. doi: 10.1016/0021-9614(90)90074-Z
Di Traglia F., Nolesini T., Solari L., Ciampalini A., Frodella W., Steri D., et al. (2018). Lava delta deformation as a proxy for submarine slope instability. Earth Planet. Sci. Lett. 488, 46–58. doi: 10.1016/J.EPSL.2018.01.038
Ebert H.-P., Hemberger F., Fricke J., Buttner R., Bez S., Zimanowski B. (2002). Thermophysical properties of a volcanic rock material. High Temp. Press 34, 561–568. doi: 10.1068/htjr058
Eugenio F., Martin J. H., Marcello J., Fraile-Nuez E. (2014). Environmental monitoring of El hierro island submarine volcano, by combining low and high resolution satellite imagery. Int. J. Appl. Earth Obs. Geoinf. 29, 53–66. doi: 10.1016/J.JAG.2013.12.009
Fernández J., Escayo J., Hu Z., Camacho A. G., Samsonov S. V., Prieto J. F., et al. (2021). Detection of volcanic unrest onset in la palma, canary islands, evolution and implications. Sci. Rep. 11, 2540. doi: 10.1038/S41598-021-82292-3
Fournier R. O., Thompson J. M. (1993). Composition of steam in the system NaCl-KCl-H2O-quartz at 600°C. Geochim. Cosmochim. Acta 57, 4365–4375. doi: 10.1016/0016-7037(93)90488-I
Gíslason S. R., Snorrason Á., Kristmannsdóttir H. K., Sveinbjörnsdóttir Á. E., Torsander P., Ólafsson J., et al. (2002). Effects of volcanic eruptions on the CO2 content of the atmosphere and the oceans: the 1996 eruption and flood within the vatnajökull glacier, Iceland. Chem. Geol. 190, 181–205. doi: 10.1016/S0009-2541(02)00116-X
González-Dávila M., Santana-Casiano J. M., Rueda M. J., Llinás O. (2010). The water column distribution of carbonate system variables at the ESTOC site from 1995 to 2004. Biogeosciences 7, 3067–3081. doi: 10.5194/BG-7-3067-2010
González-Delgado S., González-Santana D., Santana-Casiano J. M., González-Dávila M., Hernández C. A., Sangil C., et al. (2021). Chemical characterization of the punta de fuencaliente CO2-enriched system (La palma, NE Atlantic ocean): A new natural laboratory for ocean acidification studies. Biogeosciences 18, 1673–1687. doi: 10.5194/BG-18-1673-2021
González-Santana D., González-Dávila M., Lohan M. C., Artigue L., Planquette H., Sarthou G., et al. (2021). Variability in iron (II) oxidation kinetics across diverse hydrothermal sites on the northern mid Atlantic ridge. Geochim. Cosmochim. Acta 297, 143–157. doi: 10.1016/j.gca.2021.01.013
González-Santana D., Planquette H., Cheize M., Whitby H., Gourain A., Holmes T. M., et al. (2020). Processes driving iron and manganese dispersal from the tag hydrothermal plume (mid-atlantic ridge): results from a geotraces process study. Front. Mar. Sci. 7. doi: 10.3389/fmars.2020.00568
González-Vega A., Fraile-Nuez E., Santana-Casiano J. M., González-Dávila M., Escánez-Pérez J., Gómez-Ballesteros M., et al. (2020). Significant release of dissolved inorganic nutrients from the shallow submarine volcano tagoro (canary islands) based on seven-year monitoring. Front. Mar. Sci. 6. doi: 10.3389/FMARS.2019.00829/BIBTEX
Hall-Spencer J. M., Rodolfo-Metalpa R., Martin S., Ransome E., Fine M., Turner S. M., et al. (2008). Volcanic carbon dioxide vents show ecosystem effects of ocean acidification. Nature 454, 96–99. doi: 10.1038/nature07051
Hayer C., Barrancos J., Burton M., Rodríguez F., Esse B., Hernández P. A., et al. (2022). From up above to down below: Comparison of satellite- and ground-based observations of SO2 emissions from the 2021 eruption of cumbre vieja (La Palma: EGU22-12201 (EGU General Assembly 2022).
IGME, IGN, PEVOLCA, Copernicus, ERCC (2021) Seguimiento de la erupción. Available at: https://info.igme.es/eventos/Erupcion-volcanica-la-palma/seguimiento-erupcion (Accessed March 28, 2022).
IGN (2021) Noticias e informe mensual de vigilancia volcánica. Available at: https://www.ign.es/web/resources/volcanologia/html/CA_noticias_2021.html%0A (Accessed July 31, 2022).
Karunadasa K. S. P., Manoratne C. H., Pitawala H. M. T. G. A., Rajapakse R. M. G. (2019). Thermal decomposition of calcium carbonate (calcite polymorph) as examined by in-situ high-temperature X-ray powder diffraction. J. Phys. Chem. Solids. 134, 21–28. doi: 10.1016/J.JPCS.2019.05.023
Langmann B., Zakšek K., Hort M., Duggen S. (2010). Volcanic ash as fertiliser for the surface ocean. Atmos. Chem. Phys. 10, 3891–3899. doi: 10.5194/ACP-10-3891-2010
Lee K., Kim T.-W., Byrne R. H., Millero F. J., Feely R. A., Liu Y.-M. (2010). The universal ratio of boron to chlorinity for the north pacific and north Atlantic oceans. Geochim. Cosmochim. Acta 74, 1801–1811. doi: 10.1016/j.gca.2009.12.027
Longpré M. A. (2021). Reactivation of cumbre vieja volcano. Science 80 374, 1197–1198. doi: 10.1126/SCIENCE.ABM9423
Longpré M. A., Felpeto A. (2021). Historical volcanism in the canary islands; part 1: A review of precursory and eruptive activity, eruption parameter estimates, and implications for hazard assessment. J. Volcanol. Geotherm. Res. 419, 107363. doi: 10.1016/J.JVOLGEORES.2021.107363
Lueker T. J., Dickson A. G., Keeling C. D. (2000). Ocean pCO2 calculated from dissolved inorganic carbon, alkalinity, and equations for K1 and K2: validation based on laboratory measurements of CO2 in gas and seawater at equilibrium. Mar. Chem. 70, 105–119. doi: 10.1016/S0304-4203(00)00022-0
Mason E., Wieser P. E., Liu E. J., Edmonds M., Ilyinskaya E., Whitty R. C. W., et al. (2021). Volatile metal emissions from volcanic degassing and lava–seawater interactions at kīlauea volcano, hawai’i. commun. Earth Environ. 21 2, 1–16. doi: 10.1038/s43247-021-00145-3
Millero F. J. (1986). The pH of estuarine waters. Limnol. Oceanogr. 31, 839–847. doi: 10.4319/lo.1986.31.4.0839
Millero F. J., Zhang J. Z., Lee K., Campbell D. M. (1993). Titration alkalinity of seawater. Mar. Chem. 44, 153–165. doi: 10.1016/0304-4203(93)90200-8
Olafsson J. (1975). Volcanic influence on seawater at heimaey. Nature 255, 138–141. doi: 10.1038/255138a0
Pankhurst M. J., Scarrow J. H., Barbee O. A., Hickey J., Coldwell B. C., Rollinson G. K., et al. (2022). Rapid response petrology for the opening eruptive phase of the 2021 cumbre vieja eruption, la palma, canary islands. Volcanica 5, 1–10. doi: 10.30909/VOL.05.01.0110
Pierrot D. E., Lewis E., Wallace D. W. R. (2006). MS excel program developed for CO2 system calculations (Carbon Dioxide Information Analysis Center, Oak Ridge National Laboratory, US Department of Energy). (USA: Tennessee).
REDMIC (2022) Repositorio de datos marinos integrados de canarias. Available at: https://en.redmic.es/atlas (Accessed March 26, 2022).
Resing J. A., Baker E. T., Lupton J. E., Walker S. L., Butterfield D. A., Massoth G. J., et al. (2009). Chemistry of hydrothermal plumes above submarine volcanoes of the Mariana arc. Geochem. Geophys. Geosyst. 10, Q02009. doi: 10.1029/2008GC002141
Resing J. A., Sansone F. J. (1999). The chemistry of lava–seawater interactions: the generation of acidity. Geochim. Cosmochim. Acta 63, 2183–2198. doi: 10.1016/S0016-7037(99)00193-3
Resing J. A., Sansone F. J. (2002). The chemistry of lava-seawater interactions II: the elemental signature. Geochim. Cosmochim. Acta 66, 1925–1941. doi: 10.1016/S0016-7037(01)00897-3
Rodríguez F., Pérez N. M., Amonte C., Martín-Lorenzo A., Melián G. V., Coldwell B. C., et al. (2022). Geochemistry of ash leachates during the 2021 eruption of cumbre vieja volcano, la palma, canary islands (EGU22-9629) (EGU: General Assembly 2022). Available at: https://DOI.org/10.5194/egusphere-EGU22-9629
Román A., Tovar-Sánchez A., Roque-Atienza D., Huertas I. E., Caballero I., Fraile-Nuez E., et al. (2022). Unmanned aerial vehicles (UAVs) as a tool for hazard assessment: The 2021 eruption of cumbre vieja volcano, la palma island (Spain). Sci. Total. Environ. 843, 157092. doi: 10.1016/j.scitotenv.2022.157092
Sansone F. J., Resing J. A. (1995). Hydrography and geochemistry of sea surface hydrothermal plumes resulting from Hawaiian coastal volcanism. J. Geophys. Res. Ocean. 100, 13555–13569. doi: 10.1029/95JC01120
Sansone F. J., Resing J. A., Tribble G. W., Sedwick P. N., Kelly K. M., Hon K. (1991). Lava-seawater interactions at shallow-water submarine lava flows. Geophys. Res. Lett. 18, 1731–1734. doi: 10.1029/91GL01279
Santana-Casiano J. M., González-Dávila M., Fraile-Nuez E., de Armas D., González A. G., Domínguez-Yanes J. F., et al. (2013). The natural ocean acidification and fertilization event caused by the submarine eruption of El hierro. Sci. Rep. 3, 1140. doi: 10.1038/srep01140
Santana-González C., Santana-Casiano J. M., González-Dávila M., Fraile-Nuez E. (2017). Emissions of Fe(II) and its kinetic of oxidation at tagoro submarine volcano, El hierro. Mar. Chem. 195, 129–137. doi: 10.1016/j.marchem.2017.02.001
Scarrow J. H., Chamberlain K. J., Pankhurst M. J., Barbee O. A., Coldwell B. C., Hickey J., et al. (2022). Time series compositional insights into magmatic evolution during the 2021 cumbre vieja eruption (La Palma, Canary Islands, Spain: EGU22-9557 (EGU General Assembly 2022). https://DOI.org/10.5194/egusphere-EGU22-9557
Schlitzer R. (2021) Ocean data view. Available at: https://odv.awi.de.
Strickland J. D. H., Parsons T. R. (1972). A practical handbook of seawater analysis. 2nd ed. Ottawa, Canada: Fisheries Research Board of Canada doi:10.25607/OBP-1791
Symonds R. B., Gerlach T. M., Reed M. H. (2001). Magmatic gas scrubbing: implications for volcano monitoring. J. Volcanol. Geotherm. Res. 108, 303–341. doi: 10.1016/S0377-0273(00)00292-4
Takahashi T., Olafsson J., Goddard J. G., Chipman D. W., Sutherland S. C. (1993). Seasonal variation of CO2 and nutrients in the high-latitude surface oceans: A comparative study. Global Biogeochem. Cycles. 7, 843–878. doi: 10.1029/93GB02263
Torres-González P. A., Luengo-Oroz N., Lamolda H., D’Alessandro W., Albert H., Iribarren I., et al. (2020). Unrest signals after 46 years of quiescence at cumbre vieja, la palma, canary islands. J. Volcanol. Geotherm. Res. 392, 106757. doi: 10.1016/J.JVOLGEORES.2019.106757
Wohletz K., Zimanowski B., Buttner R. (2013). “Magma-water interactions. Modeling volcanic processes: the physics and mathematics of volcanism,” Eds. Fagents S. A., Gregg T. K. P., Lopes R. M. C. (Cambridge: University Press), 230–257. doi:10.1017/CBO9781139021562.011
Keywords: lava–seawater interaction, carbonate system, alkalinity, acidification, carbon dioxide
Citation: González-Santana D, Santana-Casiano JM, González AG and González-Dávila M (2022) Coastal carbonate system variability along an active lava–seawater interface. Front. Mar. Sci. 9:952203. doi: 10.3389/fmars.2022.952203
Received: 24 May 2022; Accepted: 01 August 2022;
Published: 22 August 2022.
Edited by:
Marta Álvarez, Spanish Institute of Oceanography (IEO), SpainReviewed by:
Maribel I. García-Ibáñez, Institut de Ciències del Mar (CSIC), SpainCopyright © 2022 González-Santana, Santana-Casiano, González and González-Dávila. This is an open-access article distributed under the terms of the Creative Commons Attribution License (CC BY). The use, distribution or reproduction in other forums is permitted, provided the original author(s) and the copyright owner(s) are credited and that the original publication in this journal is cited, in accordance with accepted academic practice. No use, distribution or reproduction is permitted which does not comply with these terms.
*Correspondence: Melchor González-Dávila, TWVsY2hvci5nb256YWxlekB1bHBnYy5lcw==
Disclaimer: All claims expressed in this article are solely those of the authors and do not necessarily represent those of their affiliated organizations, or those of the publisher, the editors and the reviewers. Any product that may be evaluated in this article or claim that may be made by its manufacturer is not guaranteed or endorsed by the publisher.
Research integrity at Frontiers
Learn more about the work of our research integrity team to safeguard the quality of each article we publish.