 Ruolin Li
 Yu Guo
 Ankai Zhang1
 Shuo Zhang
 Chuanxin Qin
- 1South China Sea Fisheries Research Institute, Chinese Academy of Fishery Sciences, Guangzhou, China
- 2College of Marine Sciences, Shanghai Ocean University, Shanghai, China
- 3Scientific Observation and Experimental Station of South China Sea Fishery Resources & Environment, Ministry of Agriculture and Rural Affair, Guangzhou, China
- 4National Agricultural Experimental Station for Fishery Resources and Environment Dapeng, Shenzhen, China
- 5Key Laboratory of Marine Ranching, Ministry of Agriculture and Rural Affairs, Guangzhou, China
With the continuous development of ports, ship transportation, resource extraction and artificial habitat deployment, an increasing number of artificial structures have created new usable spaces for marine organisms, and the biological communities living on their surfaces have undergone ecological succession. However, related studies have ignored ecological functions, interspecific relationships, and stability in different successional stages. Based on traditional taxonomy, this study applied functional diversity, niche overlap and niche breadth indexes to compare the attached organisms on artificial reefs (ARs) with different construction times in Bailong Pearl Bay, Fangchenggang City, Guangxi Zhuang Autonomous Region, China. The change trends of richness, habitat resource supply, resource utilization degree and efficiency, and interspecific relationships during the succession process were analysed. The results indicated that richness increased with functional diversity. While the number of species increased, the attached organisms showed different functional characteristics, and the number of species with identical traits decreased. The attached community in the later stage of development had a higher degree of utilization of ecological space, more comprehensive and efficient utilization of effective resources, a stronger degree of complementarity of organismal niches, and weaker interspecific competition. In the early stage of the developmental process, the attached community was affected by more environmental factors and had very significant correlations with those factors. The combination of the niche overlap index and the niche breadth index indicated that the resource supply supporting the survival and development of the attached organisms on the ARs with earlier construction times may be greater. The decrease in the number of biomarkers, the similarity of biomarkers belonging to the same family, and the similarity of dominance alternation all indicated that during the process of long-term development and community succession, the organisms attached to the various parts of the ARs tended to become more similar.
1 Introduction
Ecological succession is defined in general as the perturbation of a specific area leading to changes in the habitat and community, occurring either naturally or by human action (Vaz-Pinto et al., 2014; Uribe et al., 2015; Herbert et al., 2017). Odum (1971) comprehensively summarized the change trends of structural and functional characteristics during ecosystem development, including community energetics, community structure, life history, nutrient cycling, selection pressure, and homeostasis. Through comparisons of the ecosystem development period and mature period, it was found that the ecosystem succession process tends to become more complex in structure, with increased species diversity, better functions and greater stability. A number of studies on the succession process of terrestrial ecosystems have confirmed the above conclusions. For example, in an investigation of the secondary succession of subtropical forests in China, it was found that the vegetation richness in the middle and late successional stages was significantly higher than that in the early successional stage, and bacterial community diversity showed an upwards trend from early to mid-late succession (Shang et al., 2021). The prokaryotic and fungal community compositions in the soil changed greatly in the early stage but tended to be consistent in the later stage (Liu et al., 2021). The vegetation characteristics of different successional stages on the Loess Plateau are consistent with farmland, grassland, shrub forest, pioneer forest and climax communities. While soil enzyme activity increased with the secondary succession process, soil organic carbon, soil total nitrogen, water-organic carbon, and soil available and nitrate concentrations also showed an upwards trend (Wu et al., 2020). In addition, the succession process of terrestrial ecosystems was accompanied by a transition from r-strategists to K-strategists (Zhou et al., 2017), and the degree of group differentiation also increased with the succession process (Hahn et al., 2016).
Compared with land, the ocean has remained chemically and biologically stable for a long time, but with the continuous development of ports, ship transportation, resource extraction and artificial habitat deployment, an increasing number of artificial structures have created new usable space for marine organisms, and the biological community inhabiting their surface appears to have experienced ecological succession (Vicente et al., 2021). The sessile, attached or free-living organisms that inhabit the surface of objects in the marine environment are called marine attached organisms (Lin et al., 2020). Research from the perspective of marine economic development regards attached organisms as fouling organisms, focuses on the mechanism of biological pollution, and aims to derive effective strategies for preventing and controlling biological pollution on specific surfaces in the marine environment (Iljin et al., 2013; Yen et al., 2013; Tao et al., 2021). However, from the perspective of ecological research, marine attached organisms are an important part of the marine ecosystem. The attached community not only provides a food source for organisms at high trophic levels (Lin et al., 2018) but also increases microspatial complexity (Jaubet et al., 2013; Lavender et al., 2017), providing shelter and breeding sites for a variety of swimming organisms (Machado et al., 2019) and allowing them to colonize and grow (Antoniadou et al., 2010; Birdsey et al., 2012). Studies on the succession trend of attached communities in specific sea areas usually use hanging boards of different materials as biological attachment bases, such as PVC boards (Lezzi et al., 2018; Vicente et al., 2021), ceramic boards (Uribe et al., 2015), acrylic boards (Abed et al., 2019), and silicate concrete boards (Zhan et al., 2021). For artificial structures actually deployed in seawater, visual and photographic methods are usually used to identify, record and analyse the attached organisms (Fariñas-Franco and Roberts, 2014; Higgins et al., 2019; Toledo et al., 2020). Parameters such as dominant species, biomass, coverage rate and traditional taxonomic diversity indexes (Shannon index, richness index, evenness index, etc.) are commonly used as indicators to measure differences in the attached community between different successional stages. Vicente et al. (2021) found that structures formed by sessile organisms tended to become more complex with succession, leading to increases in abundance and biomass and changes in the composition of associated free-living communities. Abed et al. (2019) investigated the attached community on acrylic boards in the coastal waters of the Sultanate of Oman in the early stage of succession and found that the total biomass, coverage rate and bacterial counts of large attached organisms increased significantly over time. Bacterial communities underwent successional shifts in their structure, with Alphaproteobacteria and Flavobacteriia as pioneer primary colonizers and Actinobacteria and Planctomycetia as secondary colonizers. Fariñas-Franco and Roberts (2014) studied the attached community on artificial reefs (ARs) and found that the Shannon index, richness index and evenness index all increased with increasing time since construction. The limited ecological significance of the above indicators prevents full analysis of the ecological succession process. Existing studies focus only on the structure and composition of biological communities and ignore ecological functions, interspecific relationships, and stability in different successional stages.
ARs are artificial habitats that have been scientifically selected and placed on the seabed. They simulate rock or natural coral reefs by adding complex topography to flat and featureless ocean bottoms to optimize the ecological environment and protect and increase marine fishery resources. The attached community inhabiting the surface of ARs directly affects the ecological effect of the AR area (Zhou et al., 2010). In this study, we took ARs in Bailong Pearl Bay, Fangchenggang City, Guangxi Zhuang Autonomous Region, China, as an example. Based on traditional biological indicators, we applied the functional diversity index, niche overlap index, niche breadth index and biomarkers to analyse the change trends of richness, habitat resource supply, resource utilization degree and efficiency, and interspecific relationships during the succession process of the attached community to provide basic scientific data and a theoretical reference for research on the structure and function of artificial habitat ecosystems.
2 Materials and methods
2.1 Sampling and environmental measurements
Based on the lateral scan results of the reef space completed in November 2019 and December 2020, two investigation areas were set up in Bailong Pearl Bay, Fangchenggang City, Guangxi Zhuang Autonomous Region (O, constructed in 2016; N, constructed in 2020). Three sampling sites were randomly selected in each of the two investigation areas in March and April 2021. The locations of the sampling sites and the reef type (3.6 m×3.6 m×5.5 m) are shown in Figure 1 and Figure 2. Locally employed divers collected the attached organisms on the upper (0.5 m from the top of the ARs, O-ARU and N-ARU), middle (halfway point of the ARs, O-ARM and N-ARM) and lower (0.5 m from the bottom of the ARs, O-ARB and N-ARB) parts of each reef. The sampling area of a single quadrat was 25 cm×25 cm. The obtained samples were kept in sealed bags and brought back to the laboratory on the same day for species identification, individual counting and weighing.
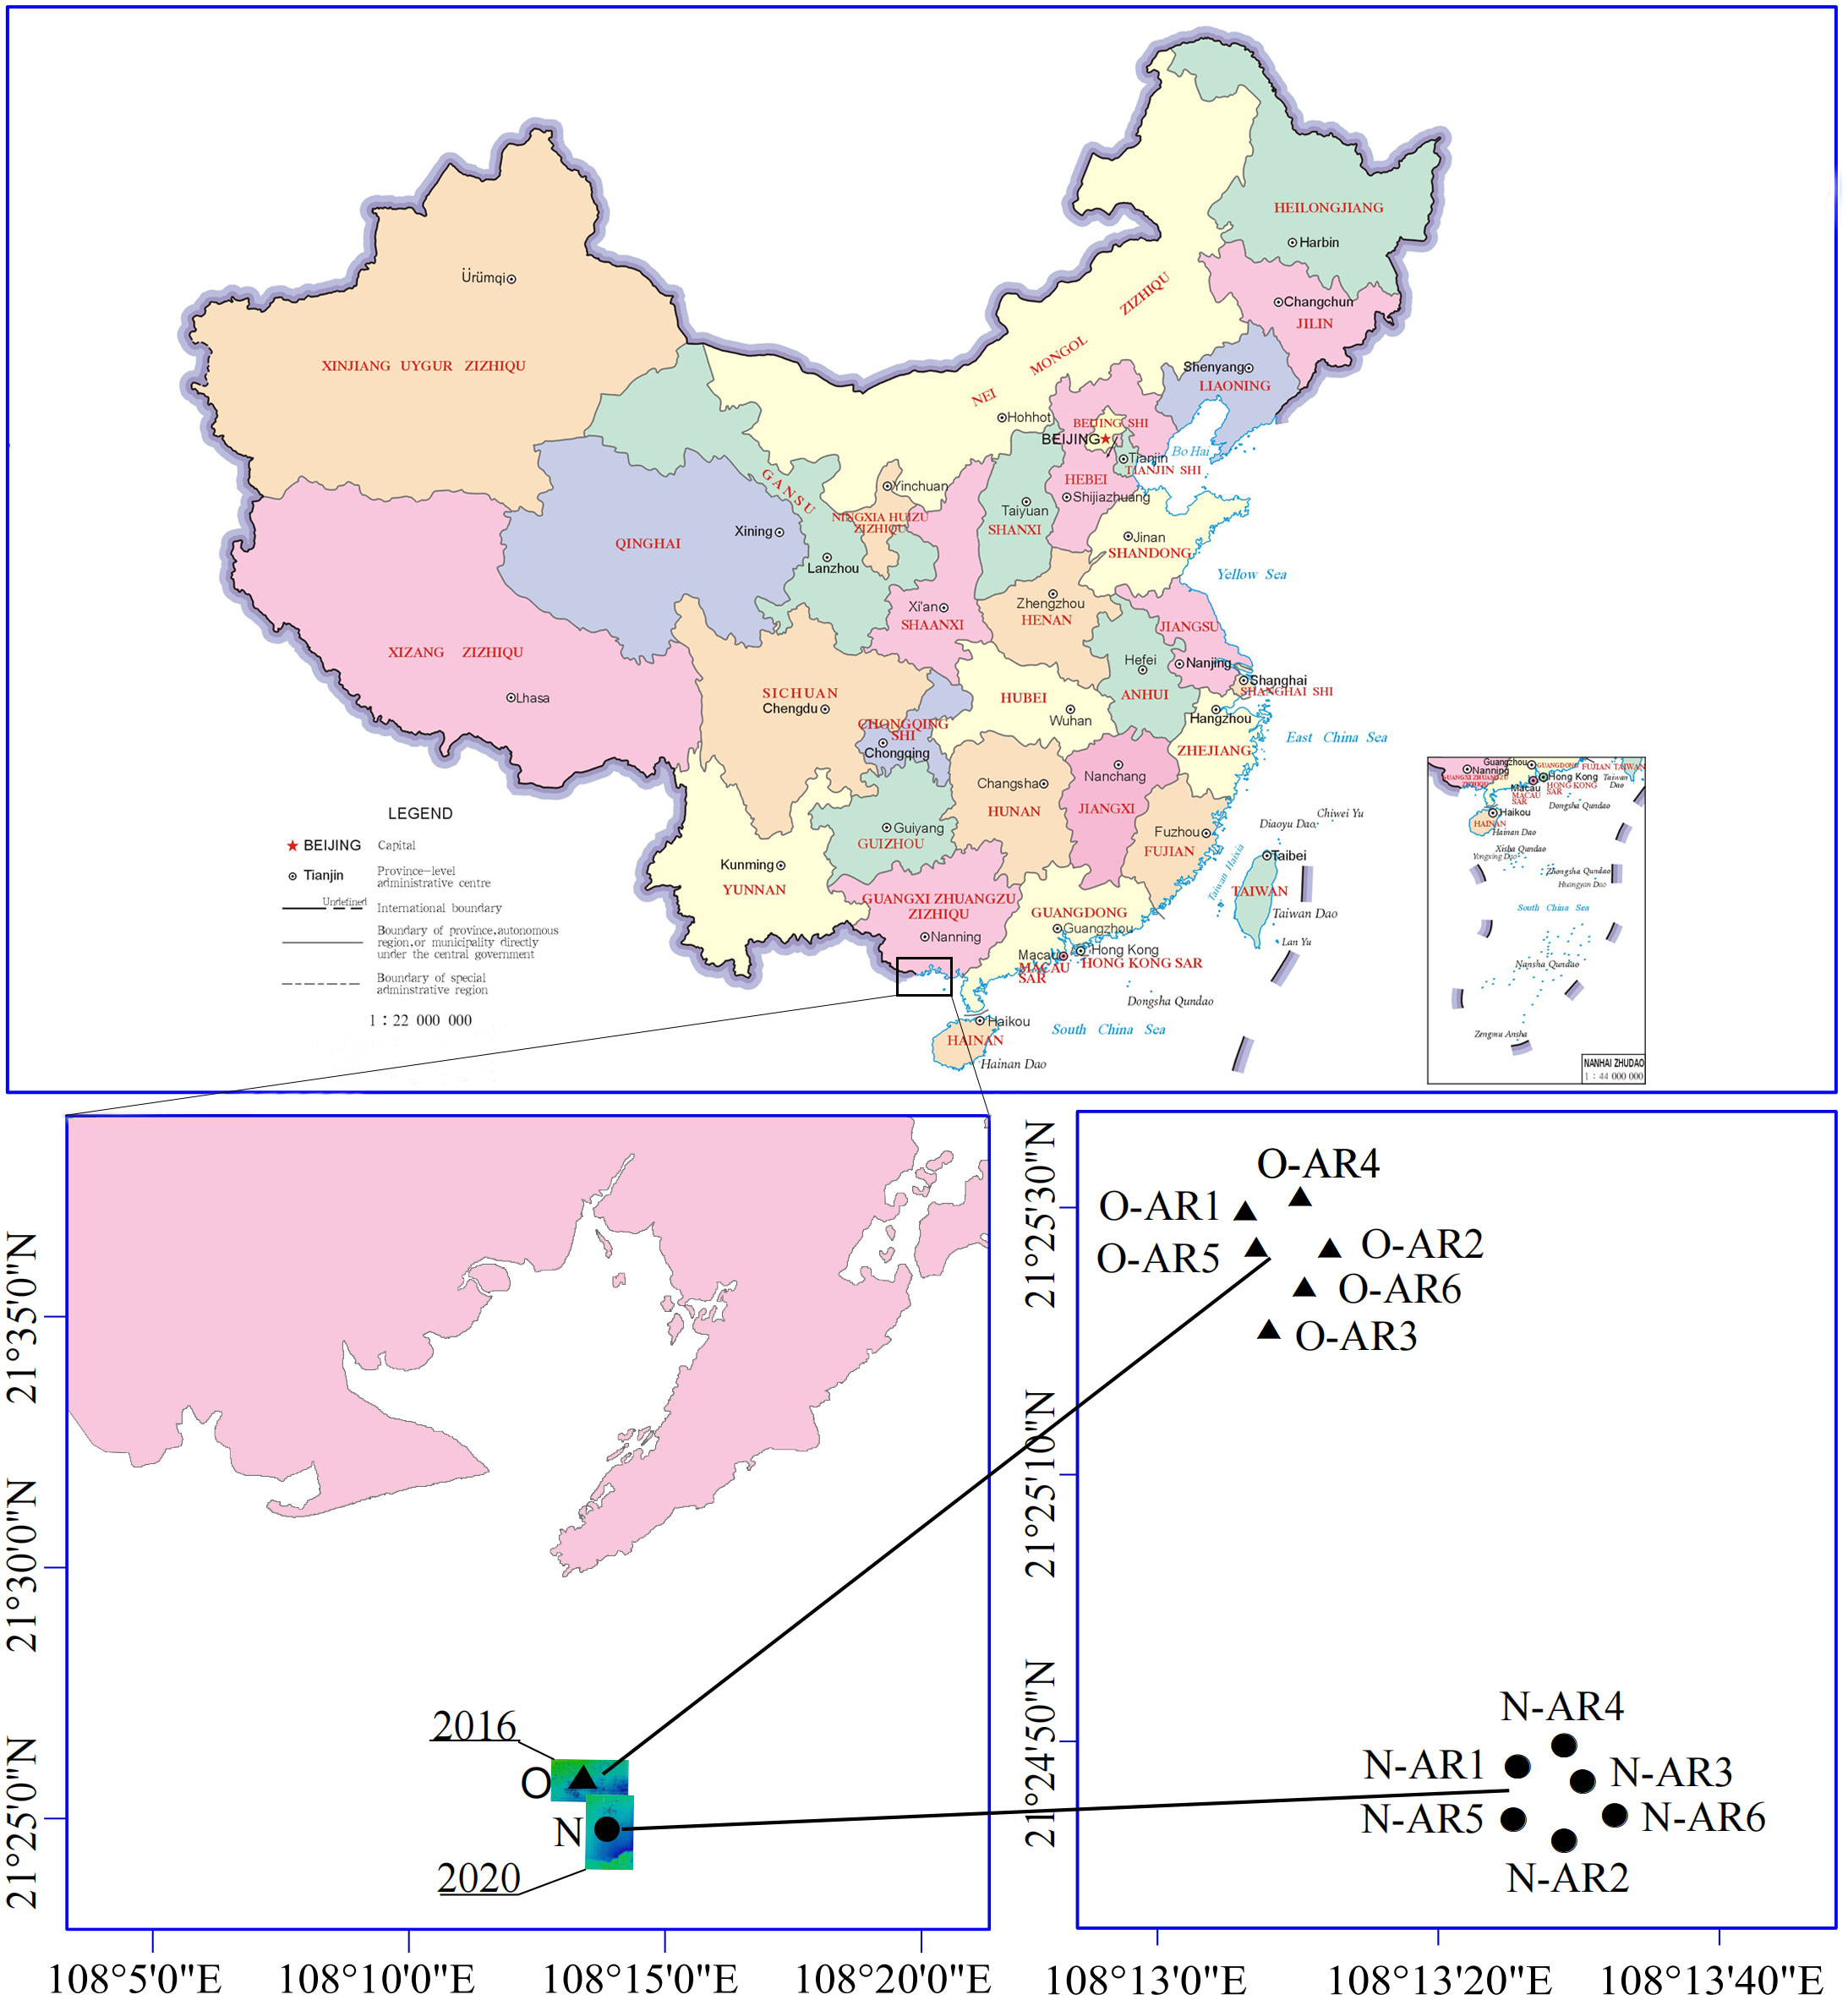
Figure 1 Sampling sites in Bailong Pearl Bay, Fangchenggang City, Guangxi Zhuang Autonomous Region, China: N-ARs (constructed in 2020) and O-ARs (constructed in 2016). Different shapes (circles and triangles) represent ARs with different construction times.

Figure 2 Types of ARs (3.6 m×3.6 m×5.5 m) from which attached organisms were collected.
Water environmental data such as seawater temperature (T), salinity (Sal), pH and dissolved oxygen (DO) were measured on-site using a YSI water quality instrument (YSI, USA). For each AR, 1000 ml adjacent seawater was collected for measurement of water quality parameters, including active phosphate ( ), nitrite ( ), nitrate ( ), ammonium ( ), total nitrogen (TN) and total phosphorus (TP).
2.2 Biological trait selection and assignment
Five biological traits (divided into 18 types) were used to describe the functional properties of the attached community on the outer surface of ARs. The selected traits are known to influence ecosystem functioning, including morphology (physical flexibility), life history (life span), and behaviour (mobility, activity and feeding). The biological traits used in this study and their links to ecosystem function are listed in Table 1 (Li, 2019). Based on relevant books (Zhang and Qi, 1961; Xu et al., 2008), references (Li, 2019) and online database (WoRMS), the morphology of each species in the species × characteristic data matrix was assigned. When information on some functional characteristics of a species was lacking, a reference was made to the functional characteristic values at the genus or family level.
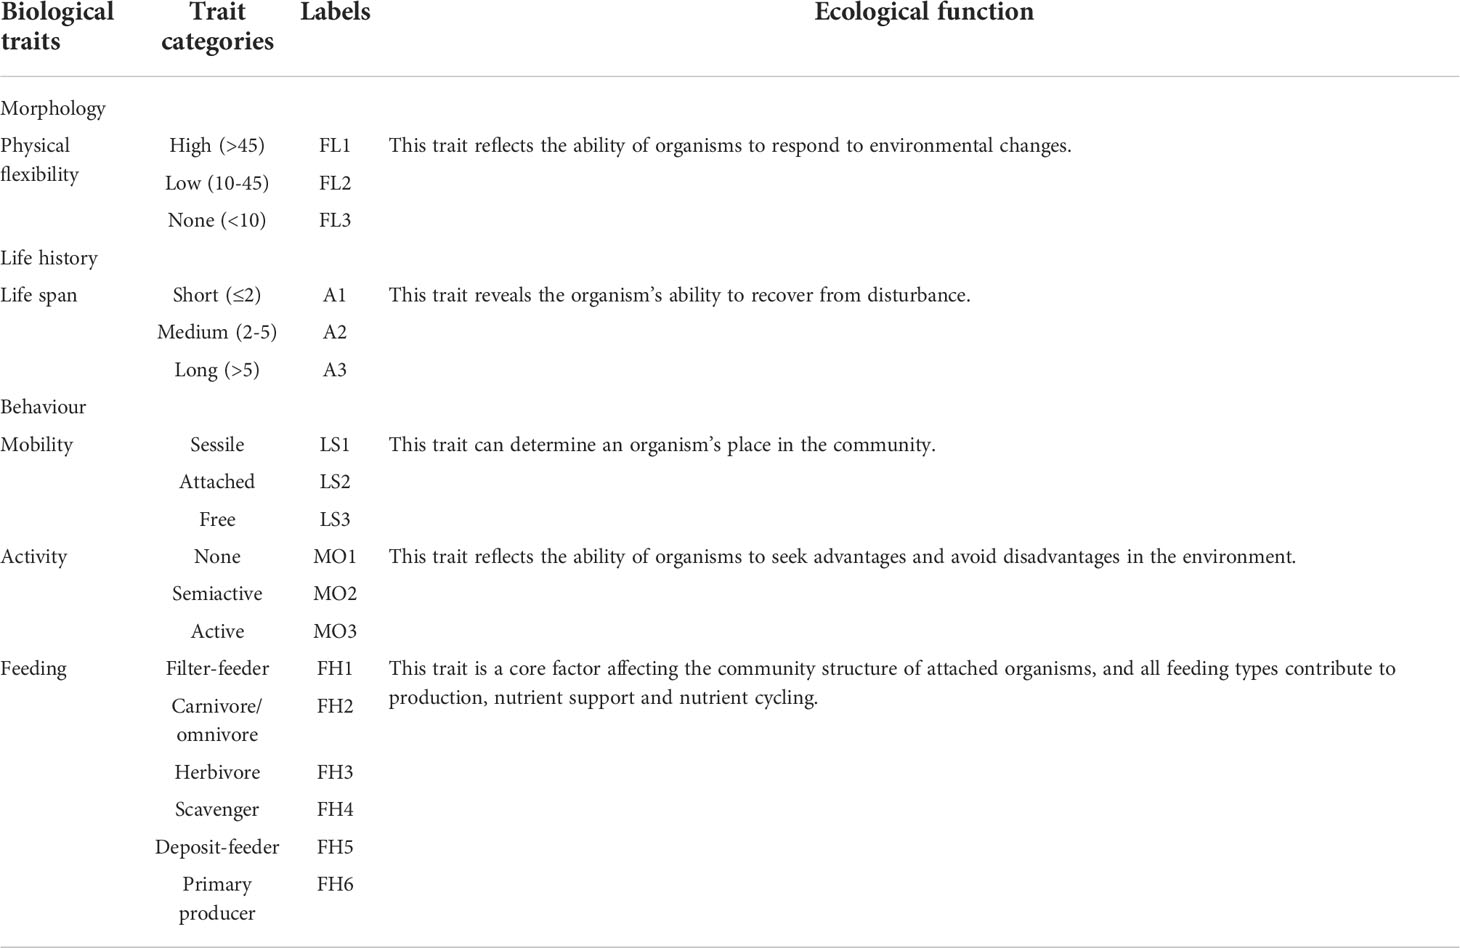
Table 1 The biological characteristics and morphology of attached organisms.
In this study, to avoid bias between different traits, the affinity score for each trait was normalized so that the sum equalled 1 (Linden et al., 2012). For a species with only one form of a biological characteristic, a value of 0 or 1 was assigned. For example, Centroceras clavulatum is a primary producer in terms of feeding habit, and it was assigned a value of 1 in the FH6 column, while the other columns were assigned a value of 0. For species with multiple morphologies for a biological trait, fuzzy coding was used to assign values (Chevenet et al., 1994). For example, Portunus pubescens is both a carnivore and a scavenger, so the values in the FH2 and FH4 columns were 0.5 and 0.5, respectively.
2.3 Indicator selection and statistical analysis
2.3.1 Community composition
In order to comprehensively reflect the differences in community composition between samples, we performed hierarchical clustering based on the Bray-Curtis dissimilarity to obtain a clustering tree of species composition, and then combined it with the relative abundance stacked column chart (at the phylum level). Two-way ANOVA was performed on the number of individuals of attached phyla at each sampling location on the ARs with different construction times. To explore the relationship between phylum abundance and multiple influencing factors (construction time, depth, T, Sal, DO, pH, , , , , TN and TP), we also performed redundancy analysis (RDA) based on Bray-Curtis dissimilarity. The P-values (Table S1) were obtained using the anova function of the vegan R package.
To assess possible differences among attached communities and test for significance, we ran the multivariate analysis of variance with 999 permutations (PERMANOVA) using the adonis function of the vegan R package based on Bray-Curtis dissimilarity.
2.3.2 α-Diversity
We used the α-diversity to analyse and compare the degree of species diversity within the attached communities. The α-diversity indexes of attached organisms on different parts of the ARs were calculated according to species abundance using the vegan R package, including the species richness index (S), Shannon index (H′), Simpson index (D), evenness index (J), Chao1 index and abundance-based coverage estimator (ACE). The calculation formula of each index is different, and it can provide different information, all of which have advantages. The species richness index is the sum of the number of species with abundance greater than 0 in the community. Shannon’s index reflects the uncertainty of which species we can predict randomly selected individuals in the community. The Simpson index represents the probability that two randomly selected individuals in a community belong to the same species. The Chao1 index is sensitive to rare species, and the ACE index can avoid low abundance species being ignored.
Boxplots of α-diversity indexes were drawn using the ggplot2 R package. The data in each group were tested for normality and homogeneity of variances, multiple comparisons (Tukey’s honest significance difference (HSD) test) were performed, and the differences between groups were marked with different lowercase letters in the boxplot.
2.3.3 Functional diversity
Ecosystem function depends not only on the number of species but also on the functional characteristics that species possess (Diaz and Cabido, 2001; Coleman and Williams, 2002). Biodiversity depends on the difference in functional characteristics between species (characteristics closely related to ecosystem function) within the community; that is, functional diversity has a substantial impact on ecosystem function. Therefore, functional diversity is a key factor linking biodiversity and ecosystem functions, which can more clearly reflect the degree of resource complementarity among the species in a community (Jiang and Zhang, 2010). Similar to α-diversity, functional diversity is roughly divided into three categories: richness, evenness, and variation. These indexes not only reflect different aspects of functions but also directly quantify functions. The functional richness index reflects the utilization degree of ecological space, and the functional evenness index is used to describe the utilization degree and efficiency of the effective resources of the community. The niche differentiation and resource competition degree of organisms in the community are characterized by the functional divergence index (Shuai et al., 2017), and the ecological significance of Rao’s quadratic entropy index is between those of functional richness and the functional divergence index (Chen, 2017).
In order to deeply analyse the differences between the attached communities in terms of their ecological niche and resource utilization, we calculated various functional diversity indexes. Based on the assigned traits and species abundance, the FD R package was used to calculate the functional diversity of attached organisms on different parts of the ARs, including the number of single-function species (sing.sp), the functional richness index (FRic), the functional evenness index (FEve), the functional divergence index (FDiv), the functional dispersion index (FDis) and Rao’s quadratic entropy index (RaoQ). The functional redundancy index was the ratio of FDiv to H′ (FD/H′). Boxplots of functional diversity indexes were drawn using the ggplot2 R package. The data in each group were tested for normality and homogeneity of variances, multiple comparisons (Tukey’s honestly significant difference (HSD) test) were performed, and the differences between groups were marked with different lowercase letters in the boxplot.
2.3.4 Niche characteristics and environmental factors
The ecological niche includes not only the physical space occupied by an organism but also its functional role in the community and its location along the environmental gradients of temperature, humidity, pH, soil and other living conditions. The most frequently quantified dimensions are niche breadth and niche overlap. Niche overlap occurs when two species (or other biological units) use the same resources or resemble each other in terms of other environmental factors (food, space, etc.). Niche breadth refers to the sum of the various resources utilized by a population (or other biological unit) in a community.
To further explain the differences in interspecific relationships between the attached communities of N-ARs and O-ARs, we calculated Levin’s niche overlap index between pairs of species using the Spaa R package and visualized the relationships of species pairs using network graphs (only the relationship pairs with a niche overlap index greater than 0.5 are presented). Each serial number in network graphs represents a species (Table S2 and Table S3), and the type of line connecting the two serial numbers (reflected in the legend) represents the range of the niche overlap index. Levin’s niche breadth index was also calculated with the permutation method of the EcolUtils R package for 1000 random rearrangements of the occurrence frequency of species, and the null distribution of the niche breadth index for these species was calculated. Generalist species have a broader fundamental niche than specialist species (Wilson and Hayek, 2015). Species whose actual niche breadth index exceeds the upper limit of the 95% confidence interval of the null distribution are defined as generalist species, those with an index below the lower limit of the 95% confidence interval are defined as specialist species, and those with an index falling within the 95% confidence interval are defined as neutral taxa (Wu et al., 2017).
To assess the potential impact of environmental factors on attached organisms, the psych, reshape2 and ggplot2 R packages were used to calculate the Spearman correlation coefficients for each environmental factor and the abundance of each species and to visualize the correlation coefficient matrix as a heatmap.
2.3.5 Biomarkers and dominant species
Linear discriminant analysis (LDA) effect size (LEfSe) (Segata et al., 2011) can identify biomarkers with significant differences between different groups. LEfSe emphasizes statistical significance, biological consistency, and effect relevance. It first robustly identifies taxa that are significantly different among groups. Then, it investigates biological consistency using a set of pairwise tests among subgroups. Finally, it uses LDA to estimate the effect size of each selected taxon. To explore possible differences between biomarkers on the ARs with different construction times, we performed LEfSe analysis of attached organisms at each sampling location on the ARs using the online tool LEfSe (https://www.bioincloud.tech). The threshold of the P-value in the Kruskal-Wallis test among groups was 0.05. Only those taxa with a log LDA score >2 (more than four orders of magnitude) were considered in this study.
In order to compare the changes of dominant species in the attached communities on the ARs with different construction times, we used Excel 2016 to calculate the dominance (Y) of each species. It was stipulated that when Y≥0.02, the species is the dominant species.
2.3.6 Software and calculation formulas
Data analysis and graphical visualization, except for abundance, dominance and LEfSe, were performed in R software (v3.6.2). The Shannon index (H′) (Shannon, 1948), Simpson index (D) (Simpson, 1949), Chao1 index (Chao, 1984), richness index (S), evenness index (J) (Shannon, 1948), ACE (Chao and Yang, 1993), functional richness index (FRic) (Mason et al., 2005; Shuai et al., 2017), functional evenness index (FEve) (Mason et al., 2005), functional divergence index (FDiv) (Mason et al., 2005), Rao’s quadratic entropy index (RaoQ) (Rao, 1982), niche breadth index (Bi) (Levins, 1968), niche overlap index (Oik) (Levins, 1968) and dominance (Y) are calculated as follows:
In the above formulas, n is the total number of species with a number of individuals (abundance) greater than 0. Usually, n = 10 is used as the abundance threshold for distinguishing abundant and rare species. Sabund is the number of abundant species (abundance greater than 10). Srare is the number of rare species (abundance less than or equal to 10). F1 is the number of species represented by only 1 individual. is the estimated coefficient of variation of rare species. Fi is the number of species represented by i individuals.
In the above formula, SFic refers to the niche occupied by species in the community; Rc is the absolute value of the characteristic; S is the number of species; Pi is the relative abundance of species i; Ci is the value of the i-th functional characteristic; Ai is the abundance ratio of the i-th functional feature; ln x is the natural logarithm of the species characteristic value; pi and pj are the relative abundances of species i and j, respectively; and dij is the dissimilarity of species i and j.
In the above formula, Bi is the niche breadth of species i; Pij is the proportion of species i at a given site j; Pkj is the proportion of species k at a given site j; r is the number of sites; and Oik represents the overlap index between the resource utilization curve of species i and the resource utilization curve of species k.
In the formula, ni is the number of individuals of the i-th species. N is the total number of individuals. fi is the occurrence frequency of the i-th species.
3 Results
3.1 Community composition
In this study, 59 species of 8 phyla of attached organisms were identified, including Mollusca, Arthropoda, Echinodermata, Chordata, Cnidaria, Porifera, Bryozoa and Rhodophyta, among which Mollusca was represented by the most species (36), accounting for approximately 61.02% of the total species. The order of species numbers from high to low was Mollusca > Arthropoda > Echinoderm > Porifera = Chordata > Cnidaria = Bryozoa = Rhodophyta.
The composition of the attached community was significantly different between the N-ARs and O-ARs, and the numbers of phyla and species of attached organisms at each sampling location on the O-ARs were greater than those on the N-ARs. As shown in Figure 3, hierarchical clustering based on the Bray-Curtis dissimilarity divided the samples into two categories. The first category included O-ARU, O-ARM and N-ARB, and the second category included N-ARU, N-ARM and O-ARB. The phyla with the highest relative abundance differed between the two categories of samples. The dominant phylum of each sample in the first category was Arthropoda or Chordata, and the dominant phylum of each sample in the second category was Mollusca.
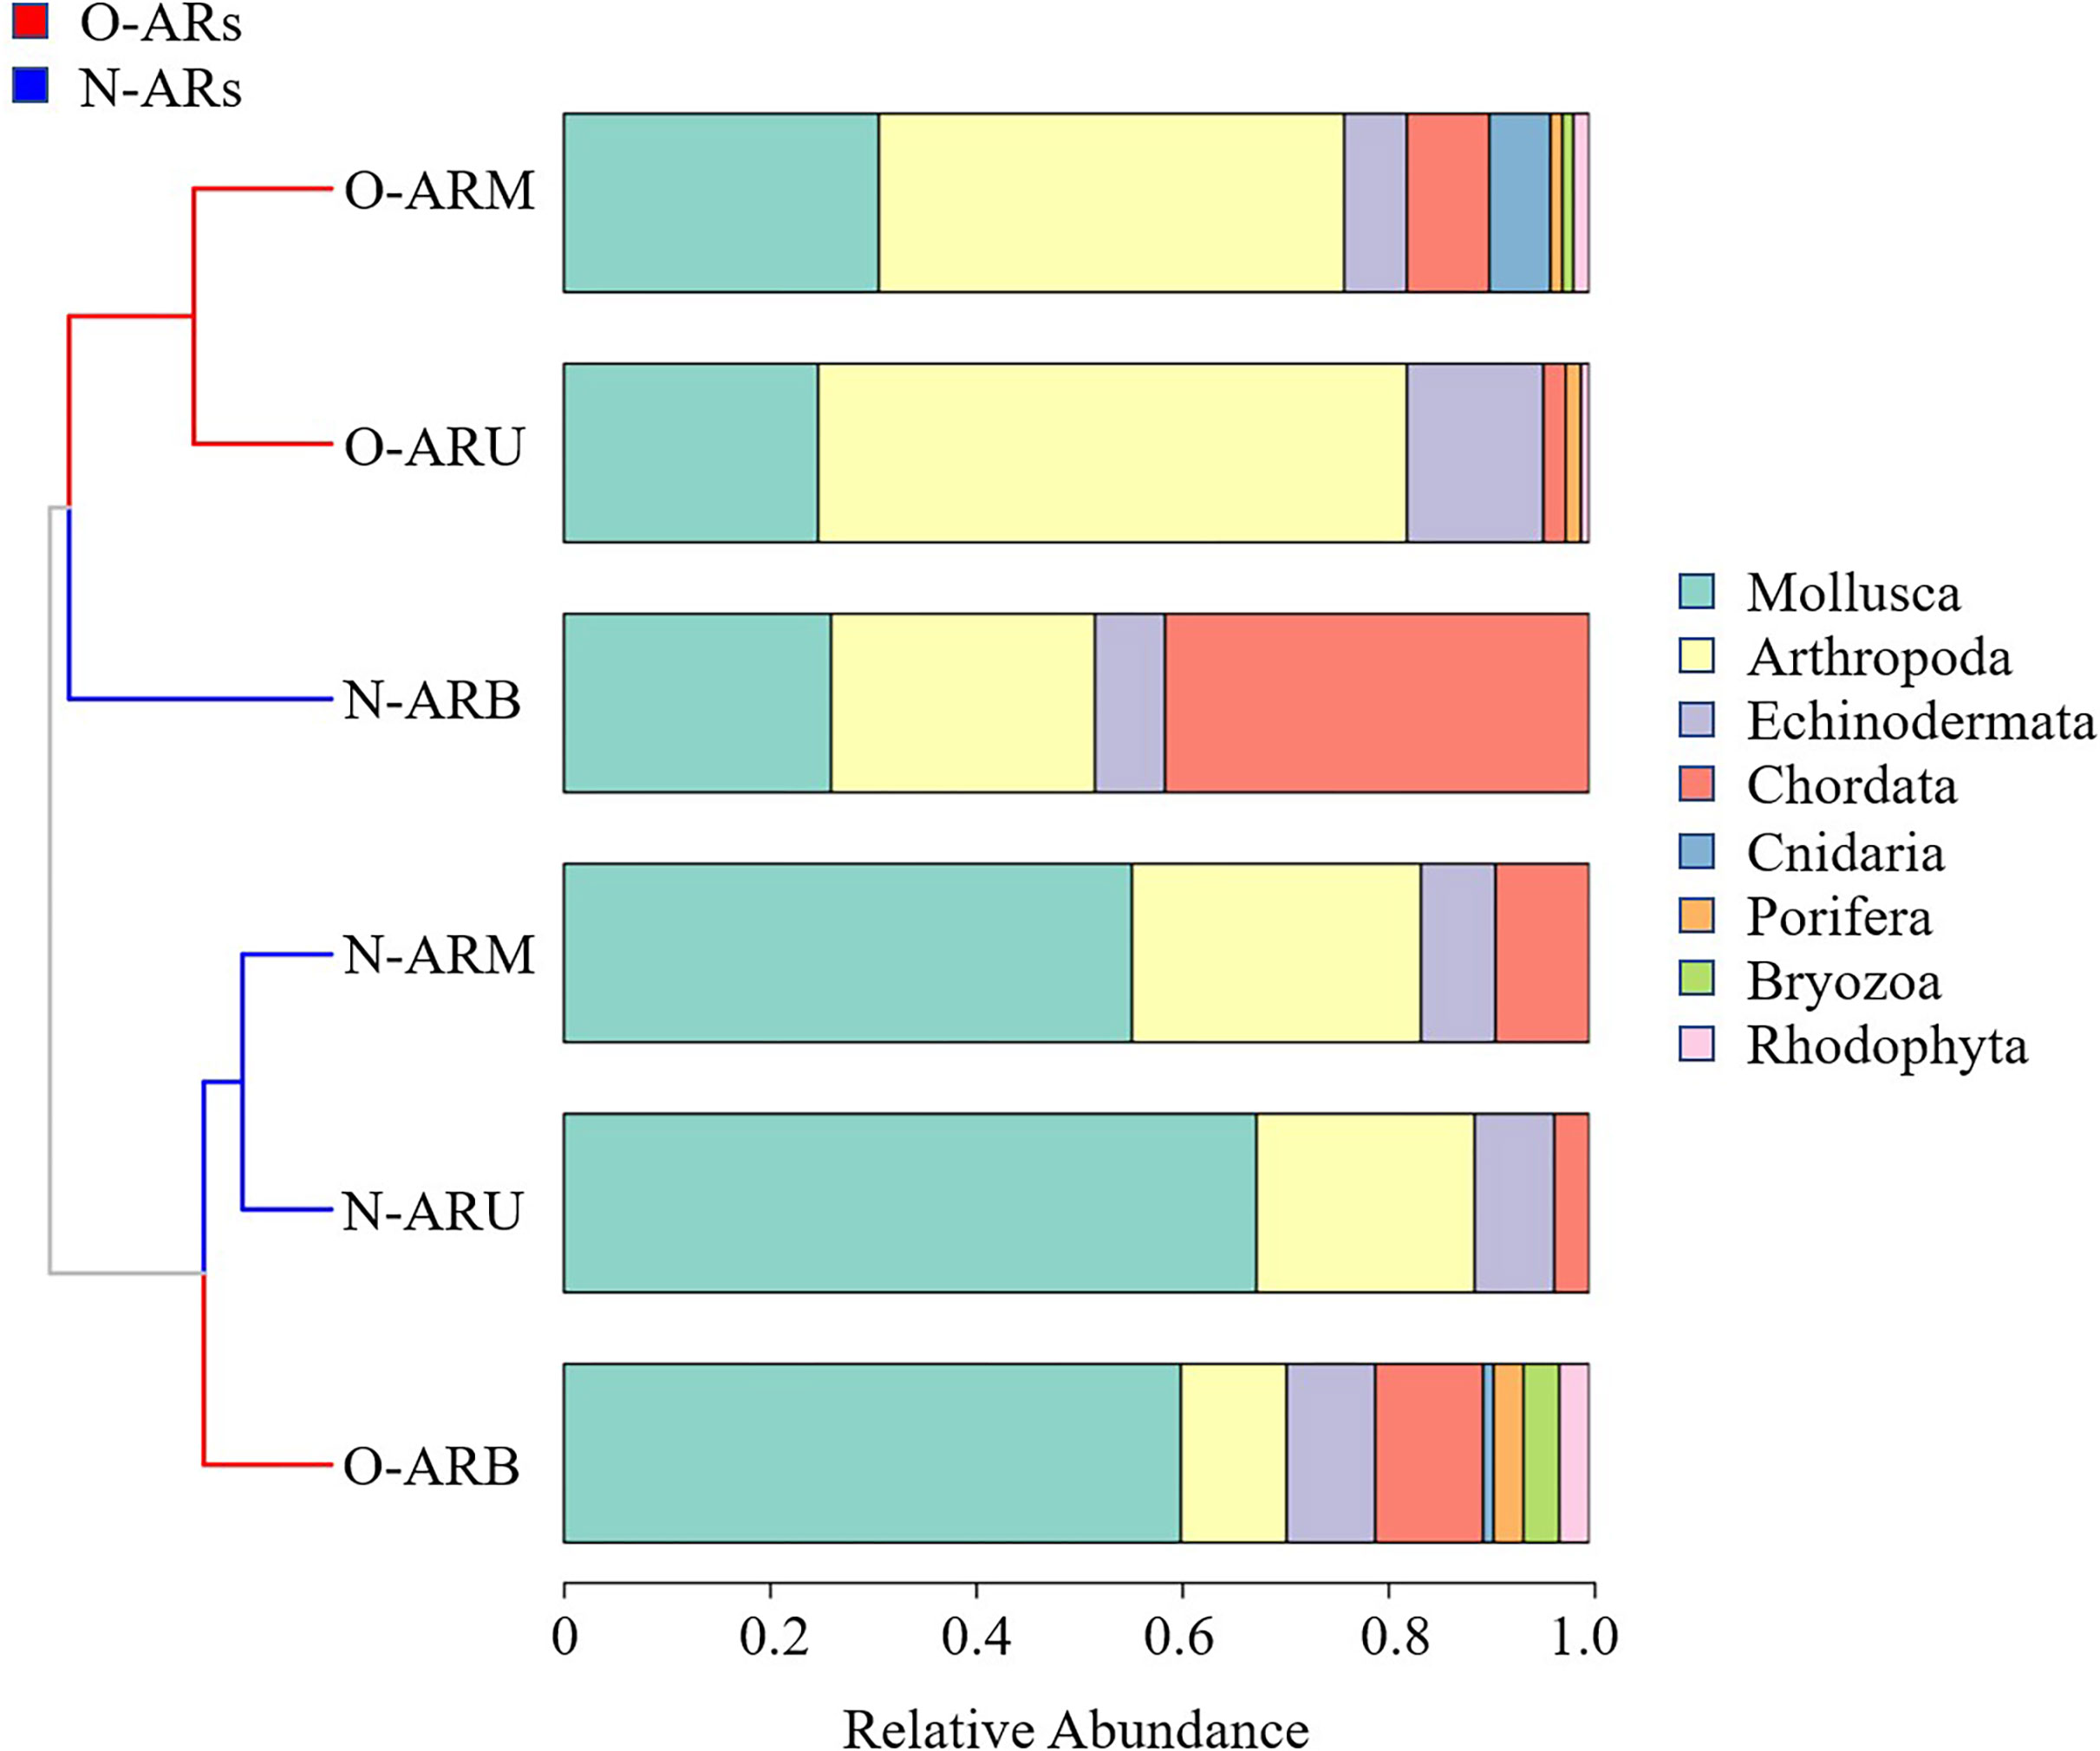
Figure 3 Analysis of the composition of attached organisms at each sampling location on the ARs with different construction times. The two colours of the cluster tree branches indicate that hierarchical clustering based on the Bray-Curtis dissimilarity divides the samples into two categories. Different colours in the histogram represent different phylum. The area size of the colour represents the relative abundance of its corresponding phylum.
As shown in Table 2, it had a very significant impact on Mollusca (P<0.01) and a significant effect on Arthropoda when the AR part was used as the source of variation (P<0.05). When construction time was used as the source of variation, it had significant effects on Mollusca, Porifera, Bryozoa and Rhodophyta (P<0.05) and a very significant effect on Arthropoda (P<0.01). The interaction of the two sources of variation had a very significant effect on Mollusca (P<0.01). The extremely significant correlation between construction time and depth and the difference in abundance of various phyla were also reflected in the redundancy analysis (Figure 4, P=0.0035). In addition to the above two variables, the difference was also related to depth, and (P<0.05).
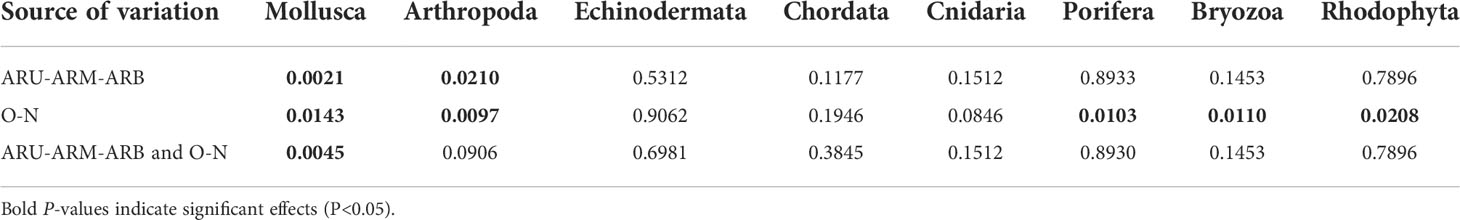
Table 2 Two-way ANOVA for the number of individuals of attached phyla at each sampling location.
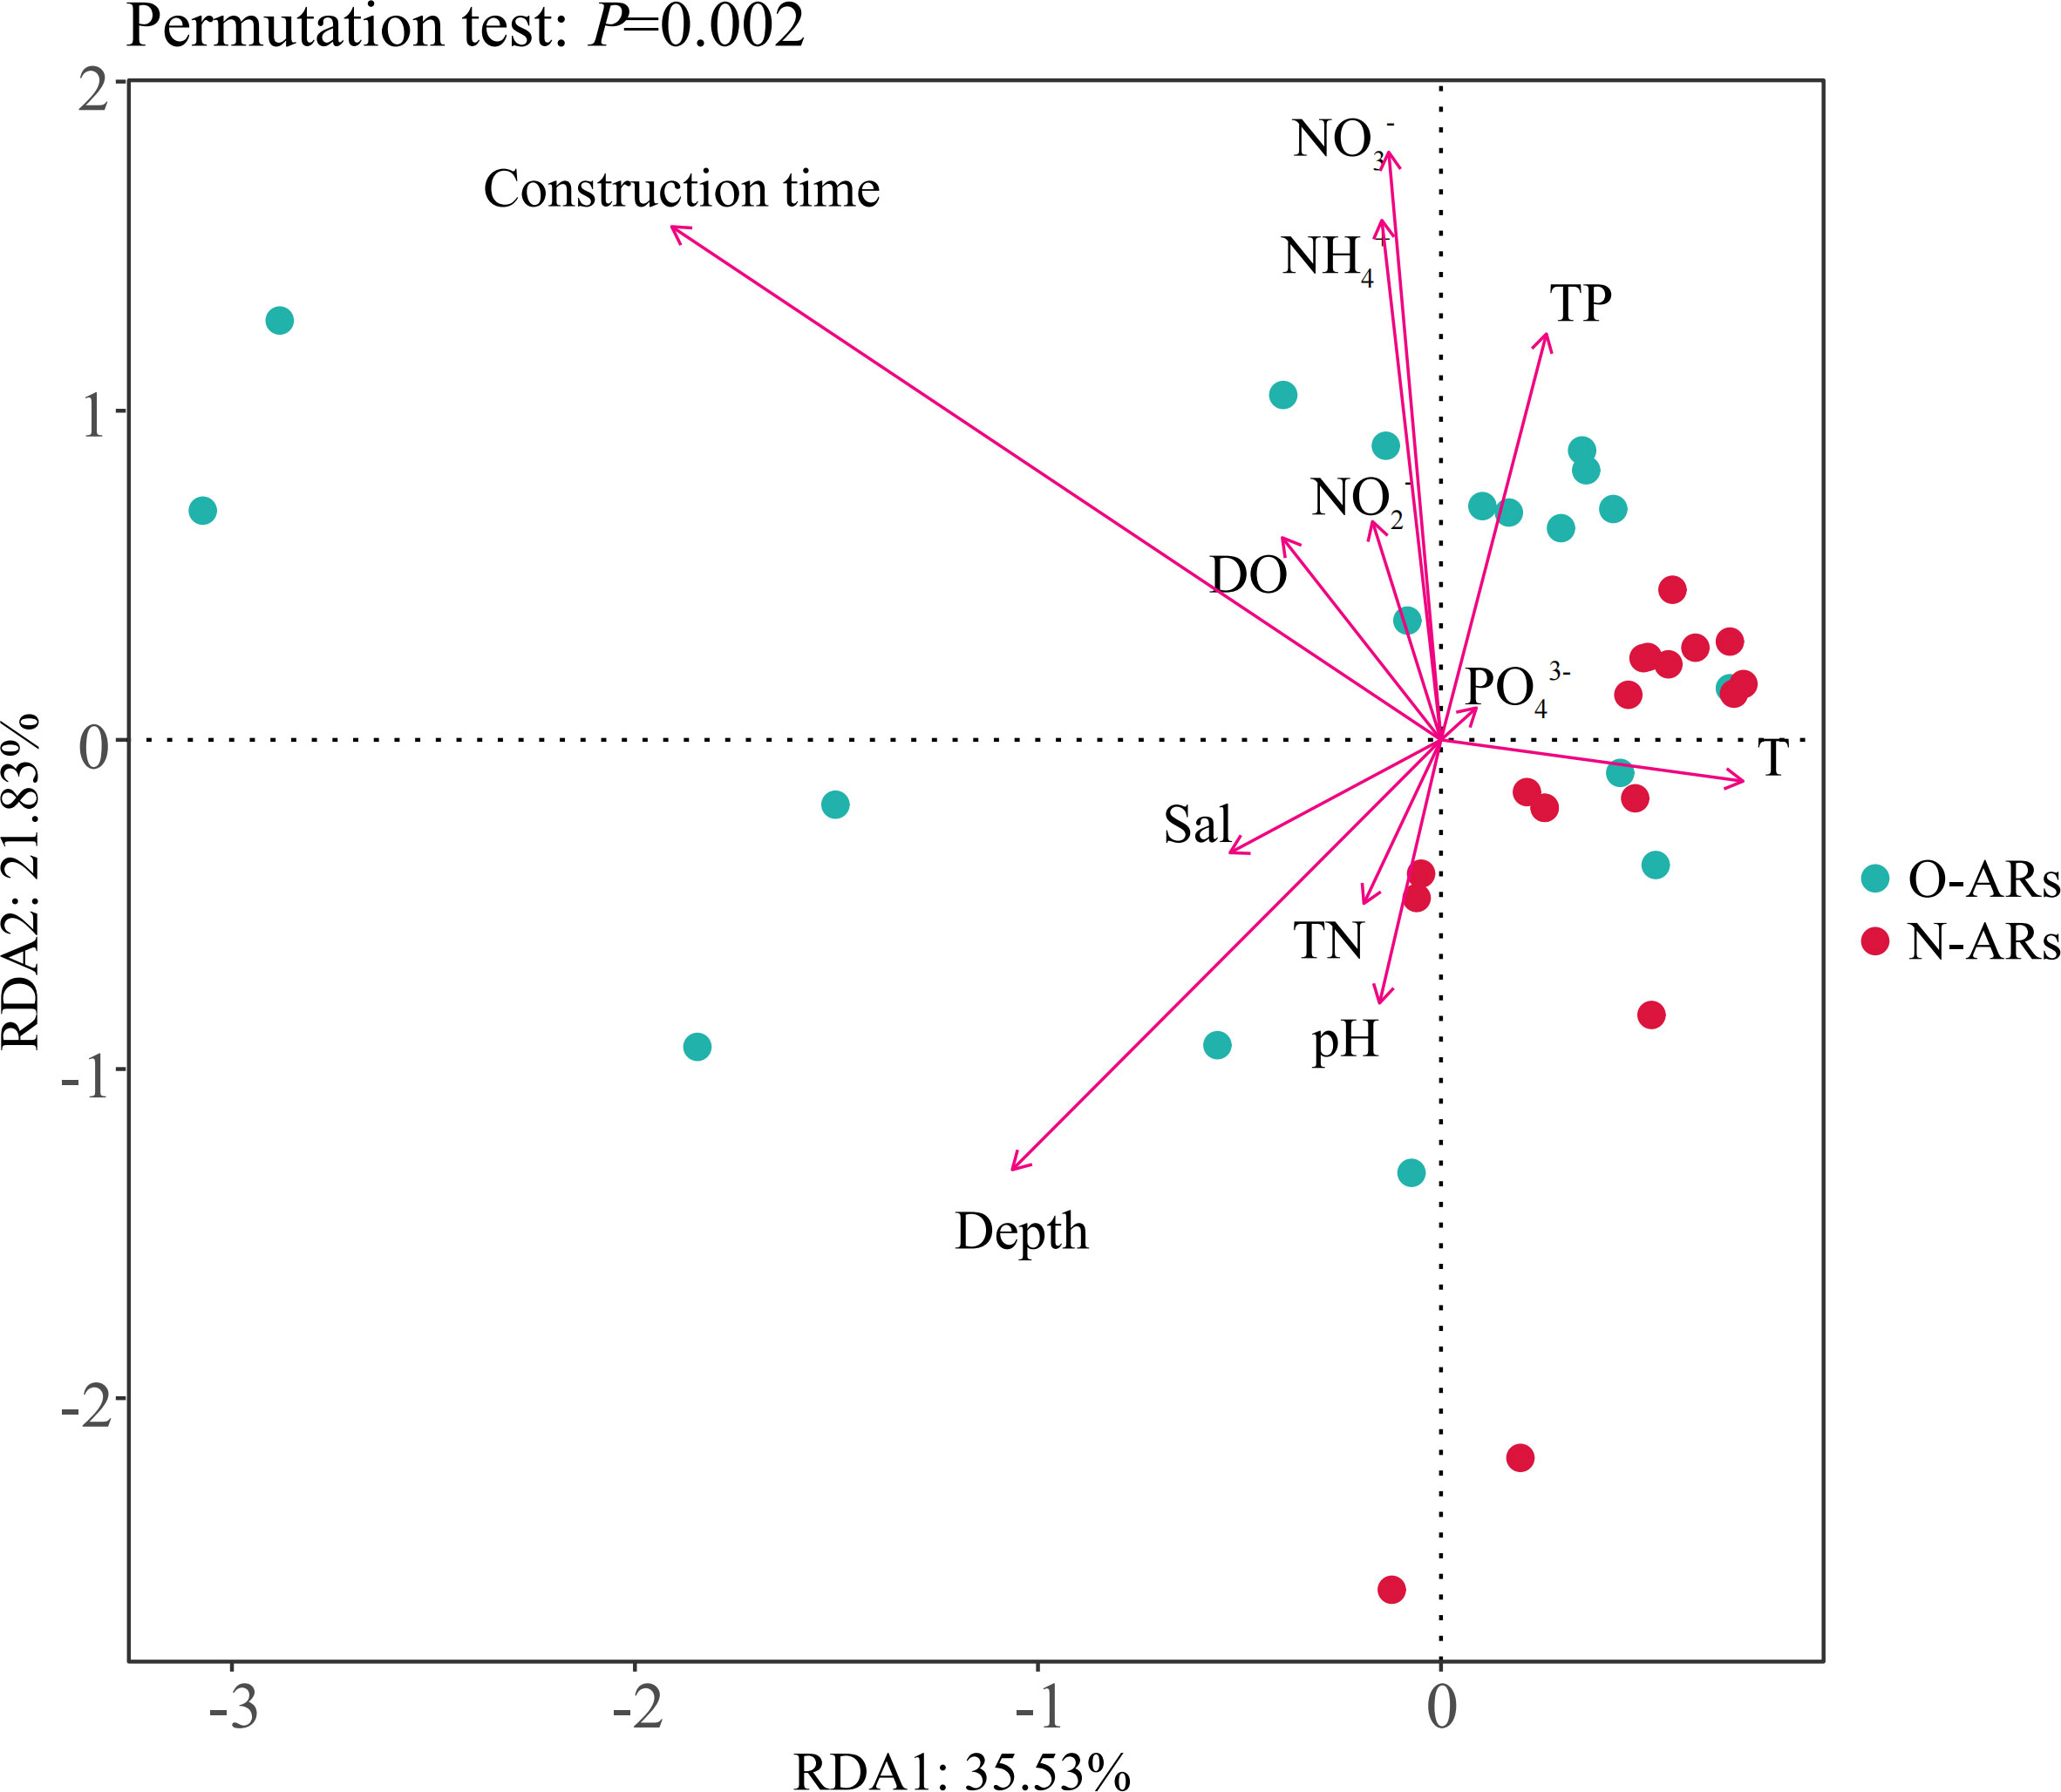
Figure 4 Redundancy analysis (RDA) based on the Bray-Curtis dissimilarity. Dots represent samples; different colours represent the ARs with different construction times; arrows represent environmental factors; the angles between environmental factors represent positive and negative correlations between environmental factors (acute angle: positive correlation; obtuse angle: negative correlation; right angle: no correlation); and the closer the projection points and arrows are, the closer the relationship between the sample and the environmental factor is.
3.2 Community structure
The results in Table 3 revealed that different parts of the ARs with the same construction time showed significant differences in the attached communities structure between O-ARU and O-ARB and between N-ARU and N-ARB (P<0.05). In the comparison of the same parts with different construction times, the attached communities at the upper, middle and lower parts all changed due to construction time. There was an extremely significant difference between N-ARs and O-ARs in the upper and middle parts (P<0.01) and a significant difference in the lower part (P<0.05). In addition, a large difference was also revealed by the pairwise comparison of different parts of N-ARs and O-ARs. Except in the O-ARM and N-ARB comparison and O-ARU and N-ARB comparison, the pairs showed extremely significant differences (P<0.01).

Table 3 PERMANOVA test for differences in sampling location and construction time.
3.3 α-Diversity
The α-diversity of the attached communities showed significant differences among ARs with different construction times (P<0.05), and the indexes of the O-ARs were generally larger than those of the N-ARs (Figure 5). When comparing the same parts, the richness, Shannon, Chao1 and ACE values of O-ARB were significantly higher than those of N-ARB (P<0.01), and the Chao1 and ACE values of O-ARM were significantly higher than those of N-ARM (P<0.05). There were no significant differences in the Simpson and Pielou indexes between N-ARs and O-ARs (P>0.05). In addition, there were no significant differences in α-diversity between the upper, middle and lower parts of N-ARs and O-ARs in the comparison of different parts of the ARs with the same construction time (P>0.05). From the upper to the lower part, the richness, Chao1 and ACE values first increased and then decreased on O-ARs but decreased on N-ARs. The Shannon, Simpson and Pielou indexes showed an increasing trend on O-ARs but first increased and then decreased on N-ARs.
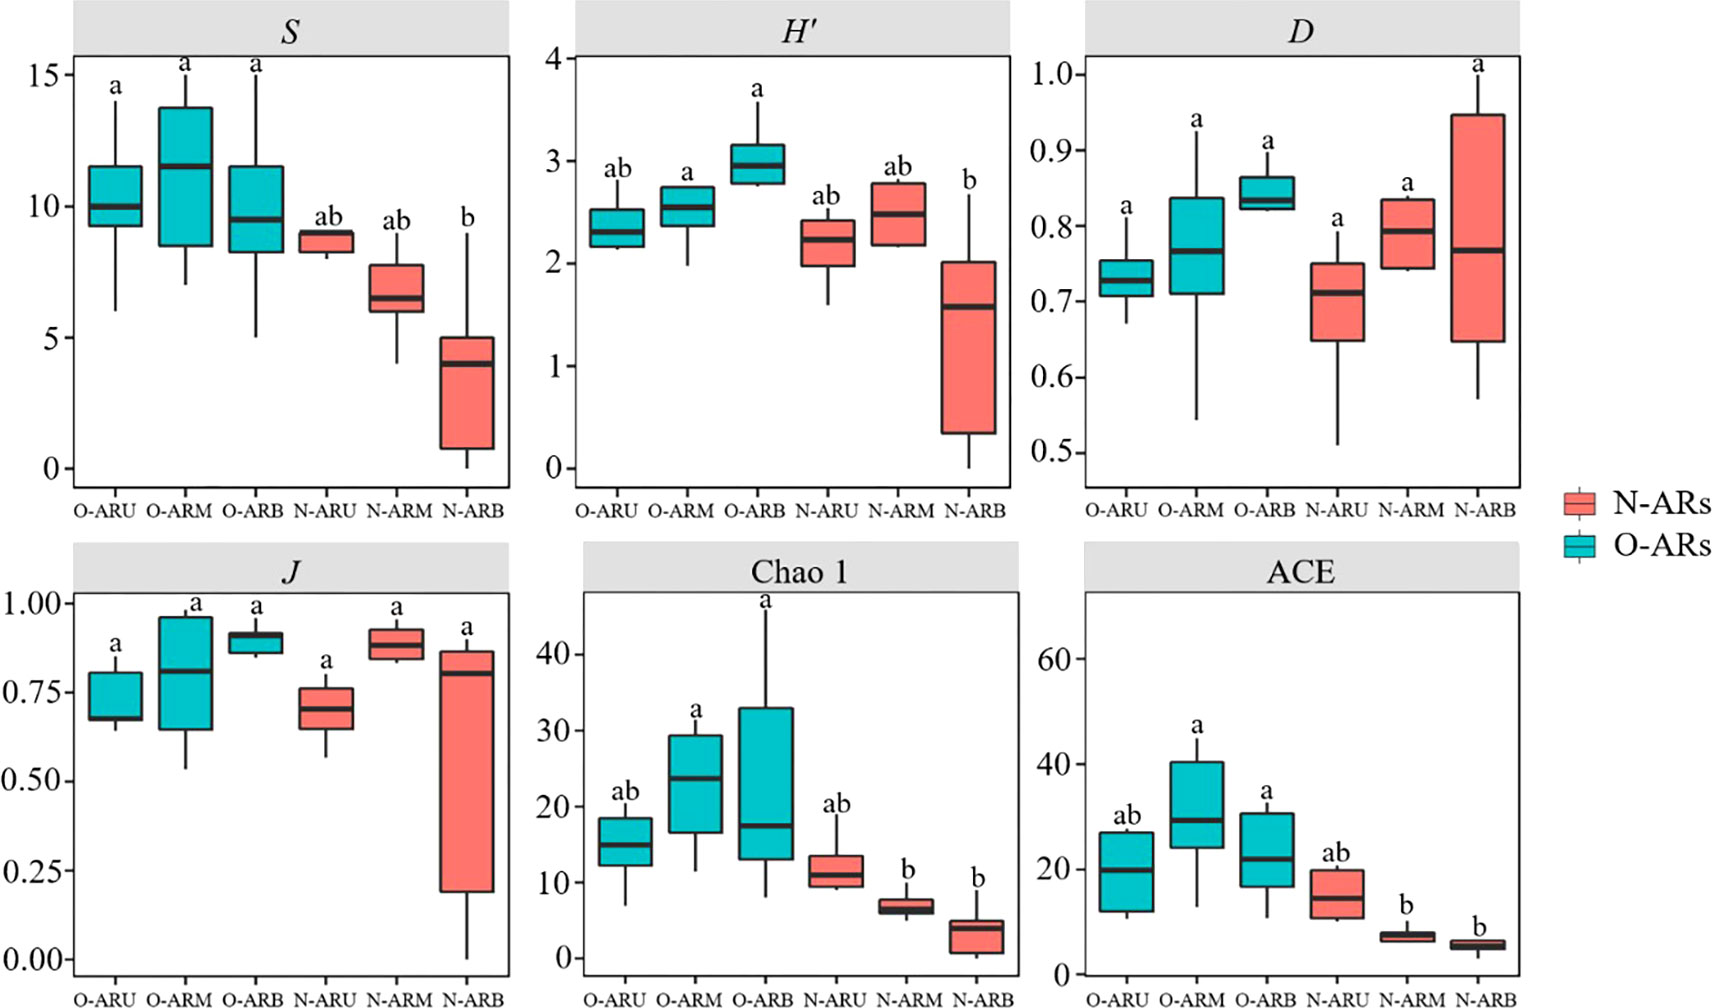
Figure 5 α-Diversity analysis of attached communities at each sampling location on the ARs with different construction times: species richness index (S), Shannon index (H′), Simpson index (D), evenness index (J), Chao1 index and abundance-based coverage estimator (ACE). Different letters (a,b) above the bars indicate significant differences between sampling locations.
3.4 Functional diversity
The functional diversity indexes of attached organisms showed significant differences between the middle and lower parts of the N-ARs and O-ARs (Figure 6, P<0.05). The number of single-function species and functional evenness index of O-ARB were significantly higher than those of N-ARB (P<0.01), and the functional richness, functional divergence and Rao’s quadratic entropy index of O-ARB were significantly higher than those of N-ARB (P<0.05). The functional richness index of O-ARM was significantly higher than that of N-ARM (P<0.05). There were no significant differences in the functional dispersion index between the same sampling parts of the ARs with different construction times (P>0.05). Except for the functional redundancy index, the functional diversity indexes of the attached community on the O-ARs were generally greater than those on the N-ARs.
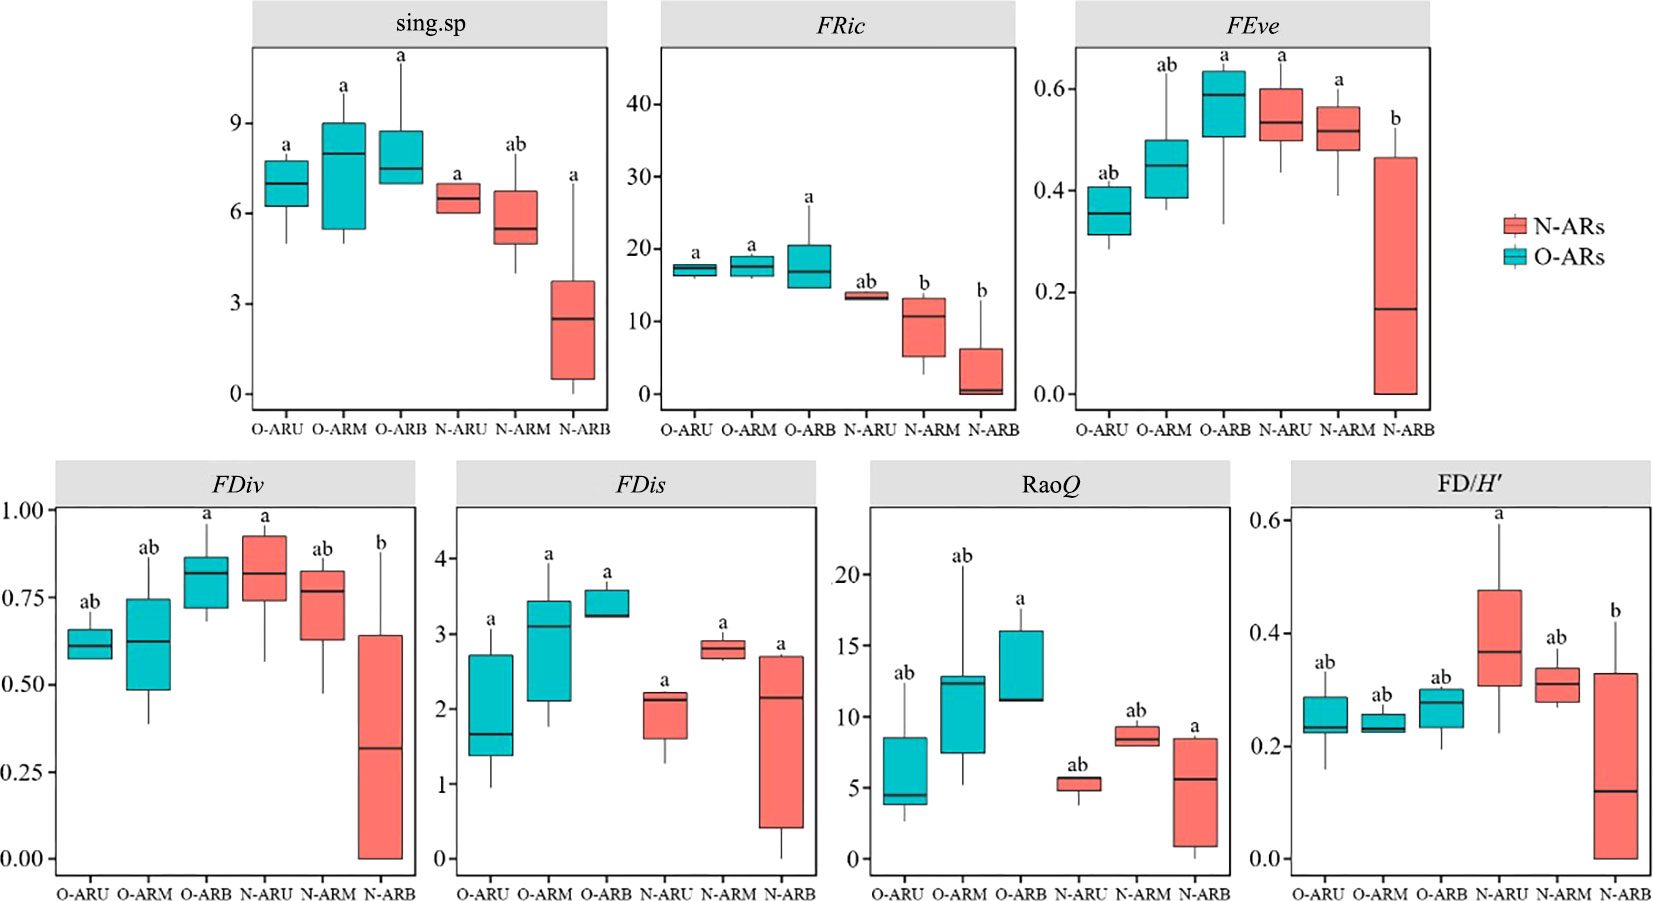
Figure 6 Functional diversity analysis of attached communities at each sampling location on the ARs with different construction times: the number of single-function species (sing.sp), the functional richness index (FRic), the functional evenness index (FEve), the functional divergence index (FDiv), the functional dispersion index (FDis), Rao’s quadratic entropy index (RaoQ) and the functional redundancy index (FD/H′). Different letters (a,b) above the bars indicate significant differences between sampling locations.
In the comparison of different parts of the ARs, there were no significant differences in the functional diversity indexes between the upper, middle and lower parts of the O-ARs (P>0.05), but there were differences among the parts of the N-ARs. The number of single-function species, functional divergence index and functional redundancy index of N-ARU were significantly greater than those of N-ARB (P<0.05), and the functional evenness index was extremely significantly greater than that of N-ARB (P<0.01). The functional evenness index of N-ARM was greater than that of N-ARB (P<0.05).
From the upper to lower parts, the functional diversity of N-ARs showed a decreasing trend, except for the functional dispersion index, which first increased and then decreased. Moreover, all the values were the smallest for N-ARB. The number of single-function species, functional evenness, functional divergence, functional dispersion and Rao’s quadratic entropy of O-ARs all showed upwards trends. The functional redundancy index showed a trend of first decreasing and then increasing. All the values were the highest for O-ARB. The functional richness index showed a trend of increasing first and then decreasing, with the weakest trend observed for O-ARB.
3.5 Niche overlap index and niche breadth
The results (Figure 7) indicated that the frequency of relationship pairs with a niche overlap coefficient of attached organisms greater than 0.5 on the O-ARs (11.39%) was greater than that on the N-ARs (11.05%). The overall niche breadth index of the O-ARs was smaller than that of the N-ARs (Figure 8). The average niche breadth of the community on the O-ARs was 2.92, compared to 4.10 on the N-ARs. Specialist species were found on the ARs with different construction times, and generalist species were also found on the O-ARs. On the O-ARs, the percentage of generalist species was 5.66%, the percentage of specialist species (7.55%) was slightly higher than that on the N-ARs (5.00%), and the percentage of neutral taxa (86.79%) was lower than that on the N-ARs (95%).
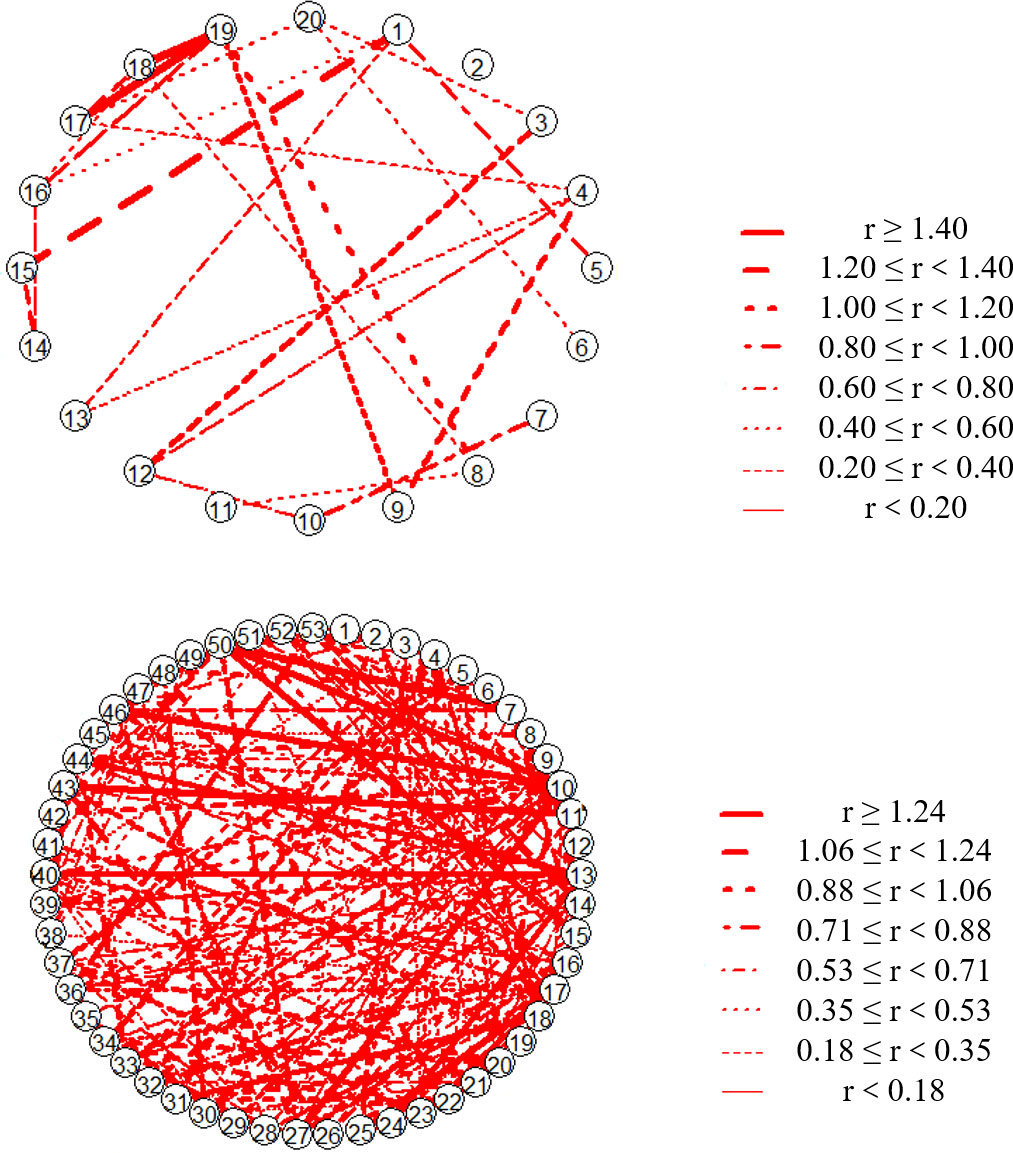
Figure 7 Coefficient of niche overlap among species on the O-ARs (below) and N-ARs (above) (only relationships with values greater than 0.5 are shown). Each serial number in network graphs represents a species (Table S2 and Table S3), and the type of line connecting the two serial numbers represents the range of the niche overlap index.
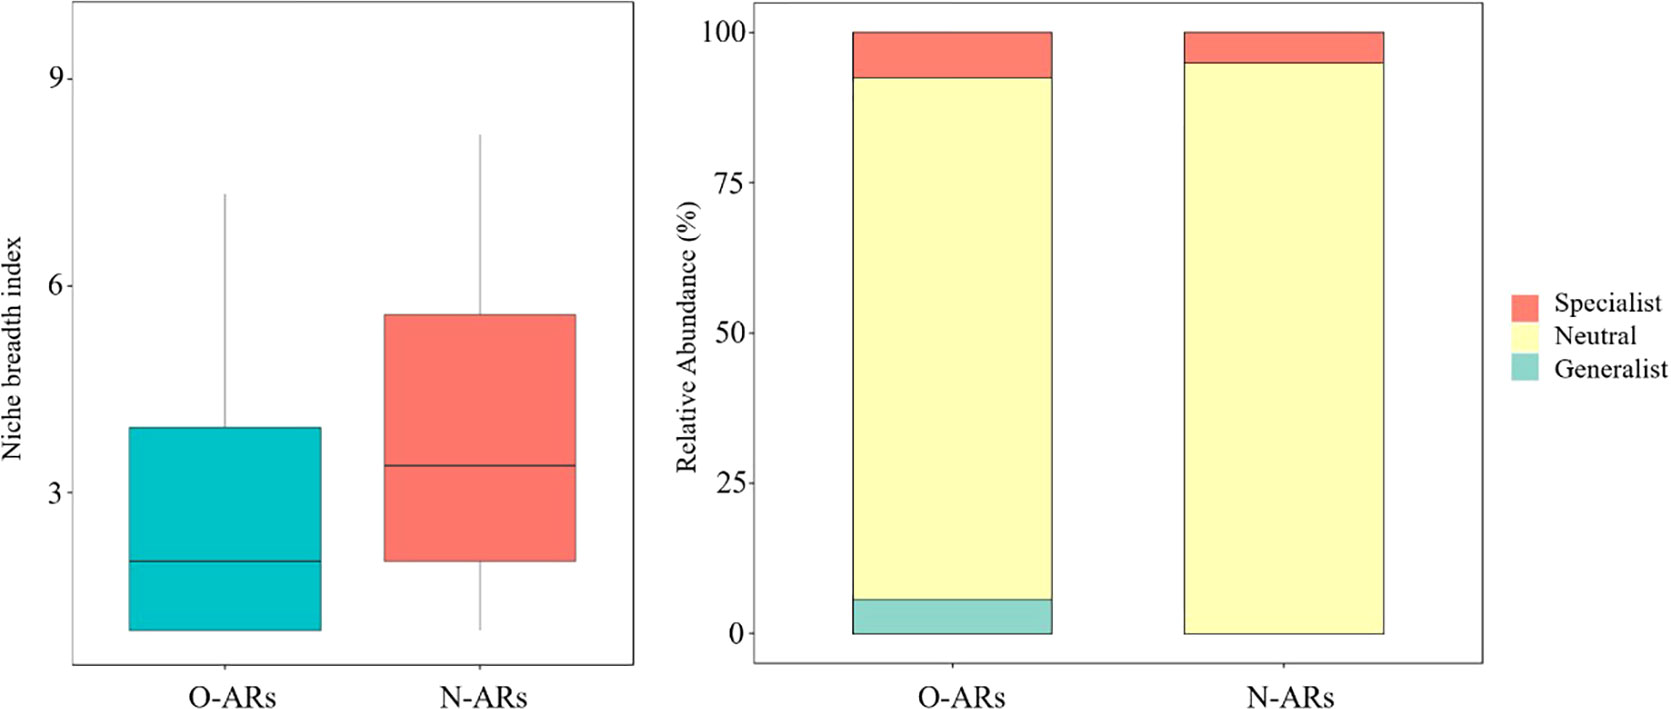
Figure 8 Coefficient of niche breadth (left) and species specialization (right). The area sizes of different colours in the right figure represent the relative abundance of different taxa (specialist species, generalist species and neutral taxa).
3.6 Environmental drivers
The heatmaps (Figure 9 and Figure 10) and P-values (Table S4 and Table S5) showing the correlations between environmental factors and phylum abundances indicated that the phyla affected by environmental factors were different between N-ARs and O-ARs. The environmental factors significantly correlated with phyla were different, and the degree of correlation varied widely. On the outer surface of O-ARs, TP had a very significant positive correlation with Rhodophyta (P<0.01) and a significant negative correlation with Cnidaria (P<0.05). had a very significant positive correlation with Rhodophyta (P<0.01), and and had a significant positive correlation with Rhodophyta (P<0.05). On the outer surface of the N-ARs, all environmental factors except DO were correlated with either Arthropoda or Chordata. Sal, pH, TN, , , T and were significantly correlated with Arthropoda and Chordata to varying degrees, and Chordata was also significantly negatively correlated with and TP (P<0.05).
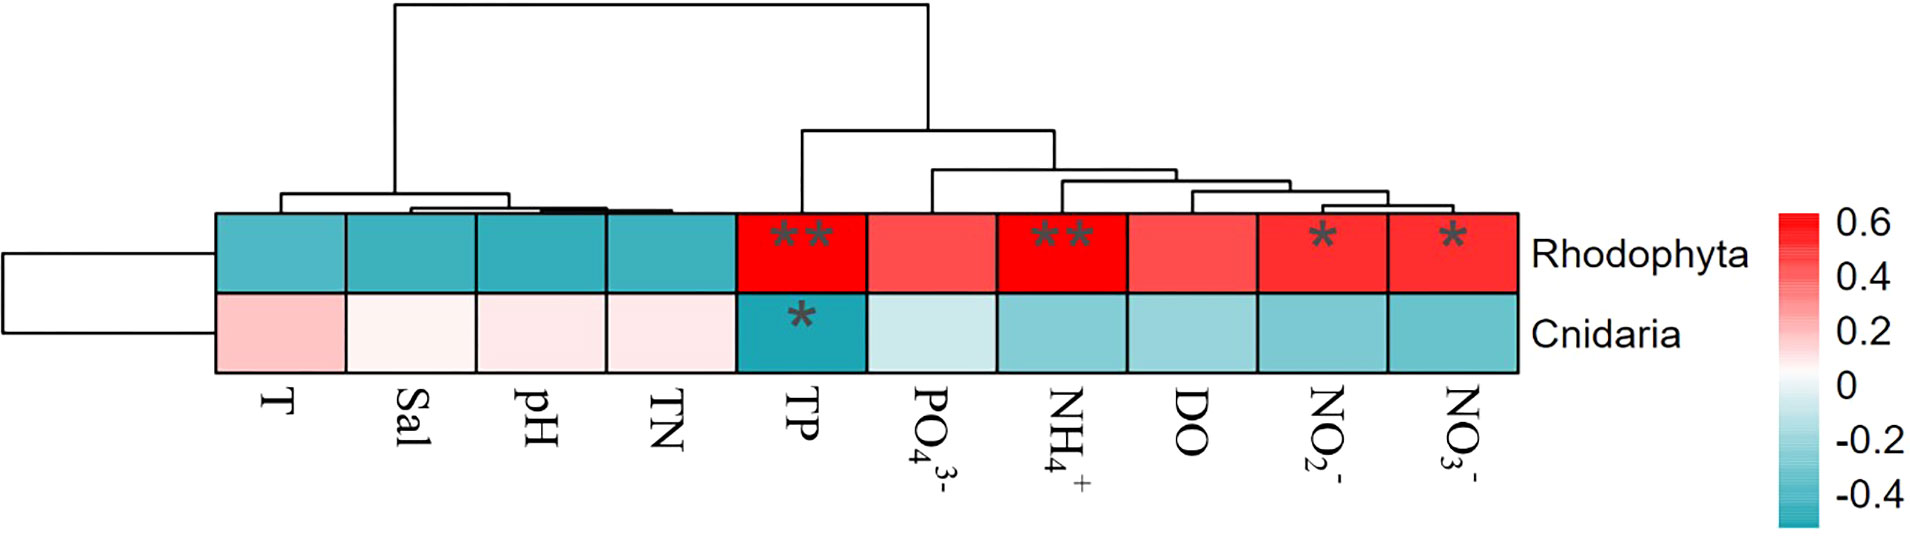
Figure 9 Correlation analysis between attached phyla and environmental factors (O-ARs). Colours represent positive and negative correlations (red represents positive correlation; blue represents negative correlation). Asterisks indicate significant correlations (**P< 0.01; and *P< 0.05). Environmental codes are as follows: temperature (T), salinity (Sal), dissolved oxygen (DO), active phosphate ( ), nitrite ( ), nitrate ( ), ammonium ( ), total nitrogen (TN) and total phosphorus (TP).
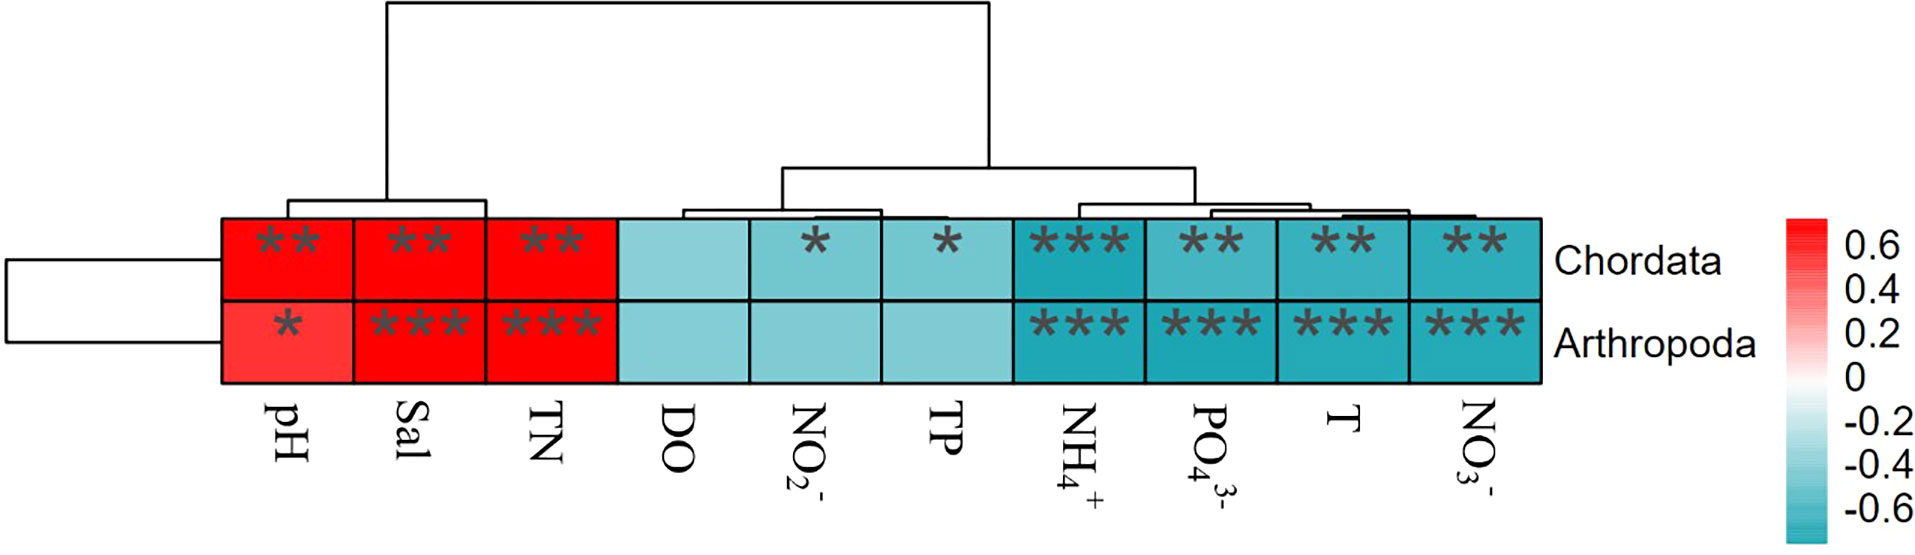
Figure 10 Correlation analysis between attached organisms and environmental factors (N-ARs). Colours represent positive and negative correlations (red represents positive correlation; blue represents negative correlation). Asterisks indicate significant correlations (***P< 0.001; **P< 0.01; and *P< 0.05). Environmental codes are as follows: temperature (T), salinity (Sal), dissolved oxygen (DO), active phosphate ( ), nitrite ( ), nitrate ( ), ammonium ( ), total nitrogen (TN) and total phosphorus (TP).
3.7 Biomarkers and dominant species
At the genus level, there was only one biomarker on the O-ARs (Parahyotissa), while there were five biomarkers on the N-ARs (Scapharca, Saccostrea, Perna, Hyotissa and Lasaea) (Figure 11). Thus, construction time plays an important role in the distribution pattern of attached organisms.
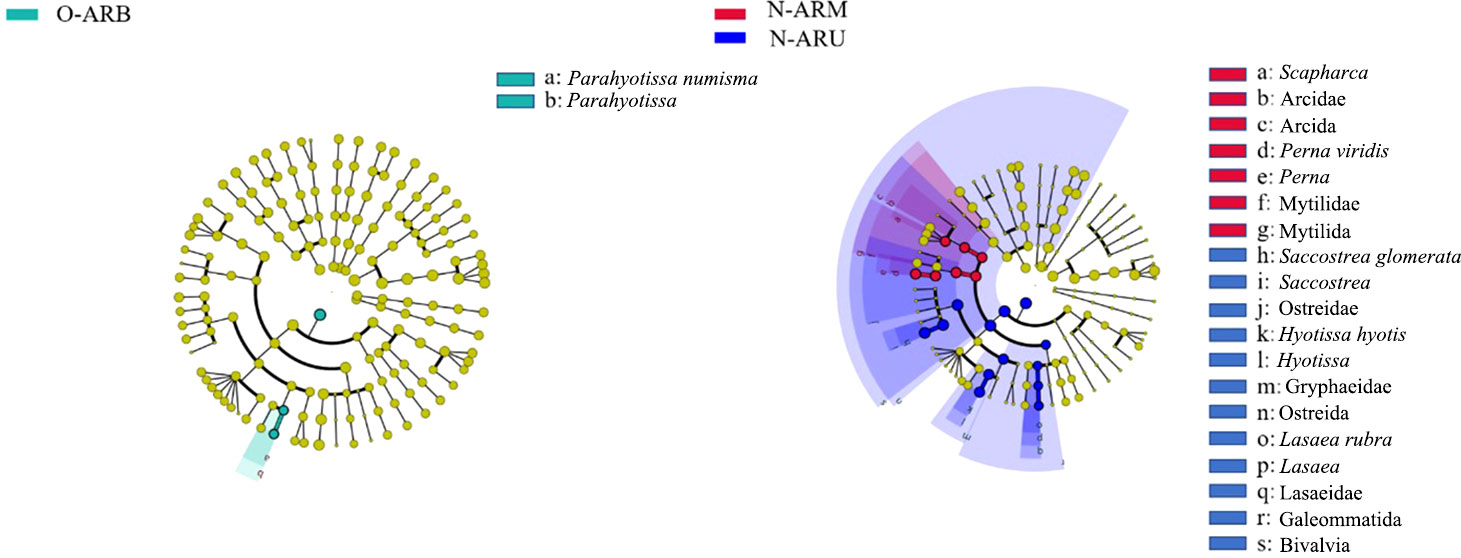
Figure 11 LEfSe results for the attached communities on the O-ARs and N-ARs. Nodes from inside to outside represent phylum, class, order, family, genus, and species. Biomarkers are represented by different colours, and yellow nodes represent taxa that do not play a significant role at each sampling location. The name of the taxa represented by the letters is shown in the legend on the right.
The dominant species of attached organisms on the N-ARs were Balanus amphitrite, Anadara indica, Perna viridis, Saccostrea glomerata, Hyotissa hyotis, Herdmania momus, Styela plicata and Ophiactis savignyi, which represent four phyla (Table 4). Saccostrea glomerata on the upper part of the N-ARs had the highest dominance among the dominant species. Balanus amphitrite in the middle of the N-ARs and Herdmania momus and Balanus amphitrite in the lower part of the N-ARs had higher dominance than other taxa. Balanus amphitrite, Balanus amaryllis and Chama asperella were dominant species on all parts of the surface of the O-ARs. The dominant species of organisms attached to the lower part of the O-ARs were relatively rich, including Balanus amphitrite, Balanus amaryllis, Chama asperella, Scapharca kagoshimensis, Thais echinata, Herdmania momus, Styela plicata and Colochirus quadrangularis. Compared with those on the lower part of the O-ARs, the dominant species on the upper and middle parts were more similar, including only species belonging to the Balanus and Chama asperella. The species belonging to the Balanus were absolutely dominant. Overall, the dominant species on the N-ARs were more abundant than those on the O-ARs. Balanus amphitrite was the dominant species at each sampling location.
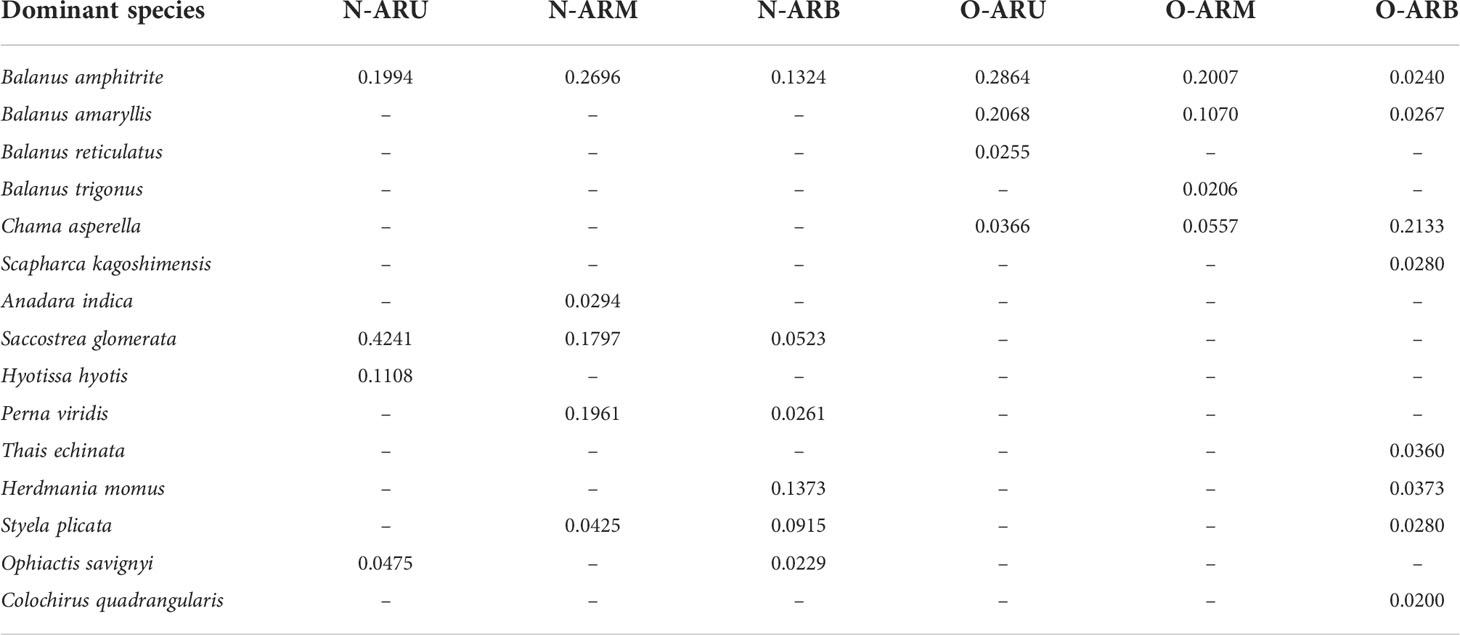
Table 4 Dominance of attached dominant species at each sampling location.
4 Discussion
4.1 The close link between the α-diversity and functional diversity of attached organisms on ARs
Biodiversity is often used to evaluate the status and change trend of various communities in an ecosystem. However, species vary greatly in their physiological, ecological and morphological characteristics, and it is difficult for simple biodiversity indicators to truly reflect the important role of species characteristics in ecosystem processes. In a study of benthic invertebrates in the southern North Sea and the eastern English Channel, Bremner et al. (2003) compared the results of relative taxon composition analysis, trophic group analysis, and biological trait analysis. By comparing the amounts of variation explained by the axes in PCA, it was found that there may be trends in the ecological functions of the entire benthic community that cannot be revealed by using only the relative taxon composition method. Analysis based on biological traits emphasizes small-scale heterogeneity, which can provide more ecological function information, reveal different relationships between combinations, and have the potential to describe the functional diversity of marine systems. In freshwater ecosystems, studies have also used functional characteristics to reflect the level of biome response to disturbance (Townsend and Hildrew, 1994; Charvet et al., 2000). Our study combined traditional α-diversity and functional diversity and found that the ecological implications of the two complemented each other when explaining the impact of construction time on the attached community.
α-Diversity showed significant differences between N-ARs and O-ARs (P<0.05). The α-diversity indexes of attached organisms on the O-ARs were larger than those of attached organisms on the N-ARs, indicating that species richness (especially in the middle and lower parts) increased with increasing time since construction. The Shannon index and evenness index are two indicators used to characterize community stability. In general, the higher the Shannon index and evenness index of a community are, the more stable and mature the ecosystem to which the community belongs (Li et al., 2017). Although the above two indexes of the O-ARs were generally larger than those of the N-ARs, there was no significant difference between the same parts (P>0.05). This showed that the stability and maturity of the two communities under different construction times differed only slightly. In this paper, functional diversity was used to deeply analyse the differences between the communities attached to N-ARs and O-ARs in terms of their ecological niche and resource utilization. The functional diversity showed significant differences between the middle and lower parts of the N-ARs and O-ARs (P<0.05). The parts with differences in each index were consistent with those identified using α-diversity and were most commonly the lower part. Except for the functional redundancy index, the functional diversity indexes of the attached community on the O-ARs were larger than those on the N-ARs. Based on the ecological significance of functional diversity, even though the stability and maturity were similar to those on the N-ARs, the communities attached to the O-ARs had a higher degree of utilization of ecological space, more comprehensive and efficient utilization of effective resources, a stronger degree of complementarity of organismal niches, and weaker interspecific competition. In addition, the ratio of functional diversity to the Shannon index was used as the functional redundancy index in this study. As the index decreases, the number of species exhibiting the same trait increases. The functional redundancy index of the attached community on the N-ARs was larger than that of the attached community on the O-ARs, indicating that species richness and functional diversity increased together with a gradual increase in the time since construction. While the number of species increased, those species exhibited different functional characteristics, and the number of species with identical traits decreased.
4.2 The supply of available resources is more abundant in the later successional stage of the attached community on ARs
Usually, the ecological niches of two species only partially overlap; that is, some resources are used jointly, while other parts are used independently. Although competition due to overlapping niches is often referred to as competition for resources, in reality, overlapping niches do not necessarily lead to competition unless the supply of shared resources is insufficient. In this study, the species in the attached communities under different construction times were paired, and the niche overlap indexes of all pairs were calculated. The ratio of the number of pairs with a niche overlap index greater than 0.5 on the O-ARs was greater than that on the N-ARs. Combined with the conclusions represented by functional diversity, these findings suggested that ARs with longer times since construction had more available resources to support the survival and development of attached organisms, such that even though there was a high degree of niche overlap, interspecific competition was still weak. Li et al. (2013) pointed out that attached organisms can change the surface structure of the attachment base, increase the degree of spatial heterogeneity, and expand the surface area of the attachment base. Li et al. (1991) found that with increasing time since construction, multiple smaller individuals on the proliferation reefs often attached to larger oysters. This phenomenon reflected the species’ full use of the expanded physical space.
In the case of fewer available resources, the niche breadth is generally increased to allow the population to obtain sufficient resources. In an environment with abundant available resources, selective utilization of resources and narrowing of the niche breadth occur. The average niche breadth index of the attached community on the O-ARs was smaller than that of the community on the N-ARs, indicating that the community selectively used the N-ARs in the face of a living environment with a sufficient supply of effective resources. There was a causal relationship between the niche overlap index and the conclusion inferred on the basis of the breadth index. Generalist species have a wide ecological niche and strong competitiveness. Specialist species have a narrow niche and are at a disadvantage in resource competition (Zhang, 2004). Specialist species were found on ARs with different construction times, and generalist species were also found on O-ARs. The proportion of specialist species on O-ARs was slightly higher than that on N-ARs. At the level of shared species, Chama asperella and Herdmania momus changed from neutral to generalist, and Scapharca kagoshimensis changed from specialist to neutral. The results showed that during ecological succession, some species tended to show strong competitiveness, and the ecological niches of these species were broadened without declines or replacement due to increasingly fierce competition for resources.
4.3 The community attached to ARs is more susceptible to external environmental factors in the early stage of succession
The structural composition of the marine attached community will be affected by factors such as temperature, pH, depth, salinity, construction time, and attachment base materials (Huang et al., 2006; Nair, 2011; Li et al., 2017; Guo et al., 2020). In this study, the α-diversity indexes, the number of individuals and the number of phyla all increased with increasing construction time. This result was highly consistent with studies in other sea areas. For example, in a study of the sea area of Xuejia Island, Qingdao city, Shandong Province, it was found that with increasing time since construction, the average biomass and the number of species on ARs of five different cement types increased, and the dominant species also changed (Li et al., 2017). A survey by Dashentang in Tianjin showed that the impact of time series on the attached organisms of ARs was obvious in the early stage of construction. Although the impact was significantly weakened in the later stage, the biodiversity still gradually increased (Guo et al., 2020). In the early stage of the developmental process, the phyla affected by environmental factors accounted for a larger proportion of all phyla, were influenced by more environmental factors, and showed very significant correlations with those factors. This result indicated that ARs were more susceptible to external environmental factors during development and had a weaker ability to resist external disturbances and maintain their structures and functions.
4.4 The organisms attached to various parts of ARs tend to be similar
Depth is an important variable in determining patterns of marine community structure (Nair, 2011; Wu et al., 2017). We applied the LEfSe technique to compare and analyse different parts of ARs with different construction times and found that there were more biomarkers with significant differences in abundance between parts on N-ARs than on O-ARs. At the family level, O-ARs and N-ARs were consistent across Gryphaeidae. At the same time, there were similarities in the succession process of attached organisms on ARs. The dominant species on the upper and middle parts of the N-ARs were diverse. In the same parts of the O-ARs, only one species (Chama asperella) belonged to Mollusca, and the other four belonged to Balanidae (Arthropoda). The above results not only explained the fact that Arthropoda accounted for the largest proportion of the relative abundance of various phyla on O-ARs but also explained that during the long-term development of the system and the process of community succession, the species belonging to Balanidae were always members of the stable community on the ARs. Species belonging to Balanidae, often referred to as fouling organisms, are found in most disturbed waters, including Muara Port in Brunei, Songkhla Port in Thailand, and Balaclava Bay (Black Sea) (Shalaeva and Lisitskaya, 2004; Jolkifli and Wahab, 2018; Phuttapreecha et al., 2018). Barnacles are usually the predominant fouling group; they are small and settle in proportion to time (Su et al., 2008; Jolkifli and Wahab, 2018). In an investigation of Balaclava Bay, it was found that the relative abundance of Balanus improvisus was always high and that the species was mainly distributed on the artificial matrix in the innermost part of the bay (Shalaeva and Lisitskaya, 2004). The above results are consistent with the change trend of barnacles in this study due to the time of construction. Studies on the impact of some fouling organisms on aquaculture species have shown that fouling organisms have little effect on the nutrient utilization of bivalves and can even cause an increase in some nutrients, thereby stimulating an increase in phytoplankton in the surrounding waters. Fouling organisms can provide a more abundant food source for bivalves that are also filter feeders (Leblanc et al., 2003). Based on this conclusion, it was likely that the positive effects of barnacles had created living conditions that can maintain the coexistence of various species, such that the number of attached organisms had not decreased due to competition for available space by barnacles.
5 Conclusions
Traditional taxonomic diversity was combined with functional diversity in this study, revealing that the species richness of the attached community increased along with functional diversity as the time since construction increased. While the number of species increased, the attached organisms showed different functional characteristics, and the number of species with identical traits decreased. The attached community in the later stage of development had a higher degree of utilization of ecological space, more comprehensive and efficient utilization of effective resources, a stronger degree of complementarity of organismal niches, and weaker interspecific competition. In the early stage of the developmental process, the attached community was affected by more environmental factors and very significantly correlated with them and had a weaker ability to resist external disturbances and maintain its structure and functions. The combination of the niche overlap index and the niche breadth index indicated that the resource supply supporting the survival and development of the attached organisms on the ARs with a long time since construction may be more abundant, and the organisms may selectively use it. The decrease in the number of biomarkers, the similarity of biomarkers belonging to the same family, and the similarity of dominance alternation all indicated that during the process of long-term development and community succession, the organisms attached to the various parts of ARs tended to become similar. The species belonging to Balanidae were always members of the stable community on the ARs. It was likely that the positive effects of barnacles had created living conditions that can maintain the coexistence of attached organisms.
Data availability statement
The original contributions presented in the study are included in the article/Supplementary Material. Further inquiries can be directed to the corresponding author.
Author contributions
CQ conceived of the study and participated in its design. RL and YG drafted the manuscript and performed the field experiments. SZ provided scientific advice. HZ and AZ sorted the data. All authors contributed to the article and approved the submitted version.
Funding
This work was financially supported by the National Natural Science Foundation of China (No. 32160863), Hainan Provincial Natural Science Foundation of China (No. 321CXTD446), Key Research and Development Program of Fangchenggang (No. AB21014015) and South Sea Fisheries Research Institute, Chinese Academy of Fishery Sciences (No. 2020YJ04).
Acknowledgments
We thank the editor and reviewers for their constructive comments on our present work.
Conflict of interest
The authors declare that the research was conducted in the absence of any commercial or financial relationships that could be construed as a potential conflict of interest.
Publisher’s note
All claims expressed in this article are solely those of the authors and do not necessarily represent those of their affiliated organizations, or those of the publisher, the editors and the reviewers. Any product that may be evaluated in this article, or claim that may be made by its manufacturer, is not guaranteed or endorsed by the publisher.
Supplementary material
The Supplementary Material for this article can be found online at: https://www.frontiersin.org/articles/10.3389/fmars.2022.950151/full#supplementary-material
References
Abed R. M. M., Fahdi D. A., Muthukrishnan T. (2019). Short-term succession of marine microbial fouling communities and the identification of primary and secondary colonizers. Biofouling 35, 526–540. doi: 10.1080/08927014.2019.1622004
Antoniadou C., Voultsiadou E., Chintiroglou C. (2010). Benthic colonization and succession on temperate sublittoral rocky cliffs. J. Exp. Mar. Biol. Ecol. 382 (2), 145–153. doi: 10.1016/j.jembe.2009.11.004
Birdsey E. M., Johnston E. L., Poore A. G. B. (2012). Diversity and cover of a sessile animal assemblage does not predict its associated mobile fauna. Mar. Biol. 159, 551–560. doi: 10.1007/s00227-011-1834-0
Bremner J., Rogers S. I., Frid C. L. J. (2003). Assessing functional diversity in marine benthic ecosystems a comparison of approaches. Mar. Ecol. Prog. Ser. 254, 11–25. doi: 10.3354/meps254011
Chao A. (1984). Nonparametric estimation of the number of classes in a population. Scandinavian J. Stat 11 (4), 265–270. doi: 10.2307/4615964
Chao M., Yang A. (1993). Stopping rules and estimation for recapture debugging with unequal failure rates. Biometrika 80, 193–201. doi: 10.2307/2336768
Charvet S., Statzner B., Usseglio-Polatera P., Dumont B. (2000). Traits of benthic macroinvertebrates in semi-natural French streams: an initial application to biomonitoring in Europe. Freshw. Biol. 43, 277–296. doi: 10.1046/j.1365-2427.2000.00545.x
Chen Y. (2017). Functional diversity: a new view point in the relationship between biodiversity and ecosystem functioning research. J. Yunnan Univ. 39, 1082–1088. doi: 10.7540/j.ynu.20170175
Chevenet F., Dolédec S., Chessel D. (1994). A fuzzy coding approach for the analysis of long-term ecological data. Freshw. Biol. 31, 295–309. doi: 10.1111/j.1365-2427.1994.tb01742.x
Coleman F. C., Williams S. L. (2002). Overexploiting marine ecosystem engineers: potential consequences for biodiversity. Trends Ecol. Evol. 17 (1), 40–44. doi: 10.1016/S0169-5347(01)02330-8
Diaz S., Cabido M. (2001). Vive la difference: plant functional diversity matters to ecosystem processes. Trends Ecol. Evol. 16 (11), 646–655. doi: 10.1016/S0169-5347(01)02283-2
Fariñas-Franco J. M., Roberts D. (2014). Early faunal successional patterns in artificial reefs used for restoration of impacted biogenic habitats. Hydrobiologia 727, 75–94. doi: 10.1007/s10750-013-1788-y
Guo B., Chen W., Gao Y., Zhang B., Wang S., Wang Y., et al. (2020). Community characteristics of attaching organisms on the artificial reefs built in different years in dashentang, tianjin. Prog. Fish. Sci. 41, 12–18. doi: 10.19663/j.issn2095-9869.20190918002
Hahn C. Z., Michalski S. G., Fischer M., Durka W. (2016). Genetic diversity and differentiation follow secondary succession in a multi-species study on woody plants from subtropical China. J. Plant Ecol. 10, 213–221 doi: 10.1093/jpe/rtw054
Herbert R. J. H., Collins K., Mallinson J., Hall A. E., Pegg J., Ross K., et al. (2017). Epibenthic and mobile species colonisation of a geotextile artificial surf reef on the south coast of England. PloS One 12, e0184100. doi: 10.1371/journal.pone.0184100
Higgins E., Scheibling R. E., Desilets K. M., Metaxas A. (2019). Benthic community succession on artificial and natural coral reefs in the northern gulf of aqaba, red Sea. PloS One 14 (2), e0212842. doi: 10.1371/journal.pone.0212842
Huang Z., Liang X., Zeng J. (2006). Prelmiinary study on effects of accrete organisms of artificial reef material. South China Fish. Sci. 2 (1), 34–38. doi: 10.3969/j.issn.2095-0780.2006.01.007
Iljin I. N., Petrosyan V. G., Bessonov S. A., Dergunova N. N. (2013). Modeling of the invasion and development of the pelagic communities of fouling organisms in the ocean. Russian J. Biol. Invasions 4, 225–233. doi: 10.1134/S207511171304005X
Jaubet M. L., Garaffo G. V., Sánchez M. A., Elías R. (2013). Reef-forming polychaetes outcompetes ecosystem engineering mussels. Mar. pollut. Bull. 71 (1–2), 216–221. doi: 10.1016/j.marpolbul.2013.03.011
Jiang X., Zhang W. (2010). Functional diversity and its research method. Acta Ecologica Sin. 30, 2766–2773.
Jolkifli H. Z. H., Wahab R. H. A. (2018). Plate settlement: Determination of fouling organisms in Brunei. ASEAN J. Sci. Technol. Dev. 35, 11–16. doi: 10.29037/ajstd.467
Lavender J. T., Dafforn K. A., Bishop M. J., Johnston E. L. (2017). Small-scale habitat complexity of artificial turf influences the development of associated invertebrate assemblages. J. Exp. Mar. Biol. Ecol. 492, 105–112. doi: 10.1016/j.jembe.2017.01.025
Leblanc A., Landry T., Miron G. (2003). Fouling organisms of the blue mussel mytilus edulis: Their effect on nutrient uptake and release. J. Shellfish Res. 22, 633–638.
Levins R. (1968). Evolution in changing environments: Some theoretical explorations (Princeton: Princeton University Press).
Lezzi M., Pasqua M. D., Pierri C., Giangrande A. (2018). Seasonal non-indigenous species succession in a marine macrofouling invertebrate community. Biol. Invasions 20 (1), 937–961. doi: 10.1007/s10530-017-1601-3
Li Z. (2019). Study on the community structure and functional diversity of fouling organisms in the coastal waters of western Taiwan strait (Xiamen: Third Institute Of Oceanography, Ministry of Natural Resources).
Li Z., Gong P., Guan C., Li J., Wang T. (2017). Study on the organisms attachment of artificial reefs constructed with five different cements. Prog. Fish. Sci. 38, 57–63. doi: 10.11758/yykxjz.20160512004
Li Y., Hong J., Li H. (2013). Fouling communities on neighboring artificial and natural reefs in Zhu island, pearl river estuary. South China Fish. Sci. 9, 20–26. doi: 10.3969/j.issn.2095-0780.2013.02.004
Li C., Huang Z., Zheng C., Lin S., Wang J., Yan S. (1991). A preliminary study of attaching organisms on artificial reef in daya bay. Chin. J. Appl. Ecol. 2 (1), 63–69.
Linden P. V. D., Patrício J., Marchini A., Cid N., Neto J. M., Marques J. C. (2012). A biological trait approach to assess the functional composition of subtidal benthic communities in an estuarine ecosystem. Ecol. Indic. 20, 121–133. doi: 10.1016/j.ecolind.2012.02.004
Lin X., Hu S., Liu S., Huang H. (2018). Unexpected prey of juvenile spotted scat (Scatophagus argus) near a wharf: The prevalence of fouling organisms in stomach contents. Ecol. Evol. 00, 1–8. doi: 10.1002/ece3.4380
Lin M., Yan W., Cao W., Yan T. (2020). Characteristics of macro-fouling communities on offshore discus buoys. Haiyang Xuebao 42, 83–89. doi: 10.3969/j.issn.0253-4193.2020.06.010
Liu L., Zhu K., Krause S. M. B., Li S., Wang X., Zhang Z., et al. (2021). Changes in assembly processes of soil microbial communities during secondary succession in two subtropical forests. Soil Biol. Biochem. 154, 108144. doi: 10.1016/j.soilbio.2021.108144
Machado G. B. O., Ferreira A. P., Leite F. P. P. (2019). Testing the importance of predation refuge vs. food quality in determining the use of macroalgal hosts by a generalist marine mesograzer. Mar. Biol. 166 (5), 55. doi: 10.1007/s00227-019-3502-8
Mason N., Mouillot D., Lee W., Wilson B. (2005). Functional richness, functional evenness and functional divergence: the primary components of functional diversity. Oilcos 111, 112–118. doi: 10.1111/j.0030-1299.2005.13886.x
Nair N. B. (2011). Ecology of marine fouling and wood-boring organisms of Western Norway. Sarsia 8, 1–88. doi: 10.1080/00364827.1962.10410269
Phuttapreecha R., Kajonwattanakul S., Songkai P., Choamanee C. (2018). Survey of fouling organisms at songkhla port in Thailand. ASEAN J. Sci. Technol. Dev. 35, 147–152. doi: 10.29037/ajstd.485
Rao R. (1982). Diversity and dissimilarity coefficents: a unified approach. Theor. Popul. Biol. 21, 24–43. doi: 10.1016/0040-5809(82)90004-1
Segata N., Izard J., Waldron L., Gevers D., Miropolsky L., Garrett W. S., et al. (2011). Metagenomic biomarker discovery and explanation. Genome Biol. 12, R60. doi: 10.1186/gb-2011-12-6-r60
Shalaeva E. A., Lisitskaya E. V. (2004). Seasonal dynamics of the numbers of larvae of common fouling organisms in balaklava bay (Black Sea). Russian J. Mar. Biol. 30, 371–378. doi: 10.1007/s11179-005-0002-0
Shang R., Li S., Huang X., Liu W., Lang X., Su J. (2021). Effects of soil properties and plant diversity on soil microbial community composition and diversity during secondary succession. Forests 12 (6), 805. doi: 10.3390/f12060805
Shannon C. E. (1948). A mathematical theory of communication. Bell Syst. Tech. J. 27, 379–423. doi: 10.1002/j.1538-7305.1948.tb01338.x
Shuai F., Li X., Chen F., Li Y., Yang J., Li J., et al. (2017). Functional diversity of freshwater fishes and methods of measurement. Acta Ecologica Sin. 37, 5228–5237. doi: 10.5846/stxb201605030836
Su Z., Xiao H., Yan Y., Huang L. (2008). Effect of fouling organisms on food uptake and nutrient release of scallop (Chlamys nobilis, reeve) cultured in daya bay. J. Ocean Univ. China 7, 93–96. doi: 10.1007/s11802-008-0093-2
Tao T., Kokoette E., Jing H., Chao L., Xi X. (2021). Chemical prevention and control of the green tide and fouling organism ulva: Key chemicals, mechanisms, and applications. Front. Mar. Sci. 8. doi: 10.3389/fmars.2021.618950
Toledo M.-I., Torres P., Díaz C., Zamora V., López J., Olivares G. (2020). Ecological succession of benthic organisms on niche-type artificial reefs. Ecol. Processes 9, 38. doi: 10.1186/s13717-020-00242-9
Townsend C., Hildrew A. (1994). Species traits in relation to a habitat templet for river systems. Freshw. Biol. 31, 265–275. doi: 10.1111/j.1365-2427.1994.tb01740.x
Uribe R. A., Ortiz M., Macaya E. C., Pacheco A. S. (2015). Successional patterns of hard-bottom macrobenthic communities at kelp bed (Lessonia trabeculata) and barren ground sublittoral systems. J. Exp. Mar. Biol. Ecol. 472, 180–188. doi: 10.1016/j.jembe.2015.08.002
Vaz-Pinto F., Torrontegi O., Prestes A. C. L., Álvaro N. V., Neto A. I., Martins G. M. (2014). Invasion success and development of benthic assemblages: Effect of timing, duration of submersion and substrate type. Mar. Environ. Res. 94, 72–79. doi: 10.1016/j.marenvres.2013.12.007
Vicente V. S., Ferreira A. P., Peres P. A., Siqueira S. G. L., Leite F. P. P., Vieira E. A. (2021). Succession of marine fouling community influences the associated mobile fauna via physical complexity increment. Mar. Freshw. Res. 72, 1506–1516. doi: 10.1071/mf21025
Wilson B., Hayek L.-a. C. (2015). Distinguishing relative specialist and generalist species in the fossil record. Mar. Micropaleontol. 119, 7–16. doi: 10.1016/j.marmicro.2015.07.001
Wu Y., Chen W., Li Q., Guo Z., Li Y., Zhao Z., et al. (2020). Ecoenzymatic stoichiometry and nutrient limitation under a natural secondary succession of vegetation on the loess plateau, China. Land Degradation Dev. 32, 399–409. doi: 10.1002/ldr.3723
Wu W., Logares R., Huang B., Hsieh C. H. (2017). Abundant and rare picoeukaryotic sub-communities present contrasting patterns in the epipelagic waters of marginal seas in the northwestern pacific ocean. Environ. Microbiol. 19, 287–300. doi: 10.1111/1462-2920.13606
Xu F., Zhang S., Wang S. (2008). An iiustrated bivalvia mollusca fauna of China seas (Beijing: Chinese Science Press).
Yen M. F. W., James W., Odette P. (2013). The interaction of marine fouling organisms with topography of varied scale and geometry: a review. Biointerphases 8, 27. doi: 10.1186/1559-4106-8-30
Zhan Q., Dong J., Sun X., Zhang Y., Li W., Zhang P., et al. (2021). A comparative study on the bio-attachment effect of reefs constructed with different materials near furong island, laizhou bay. Periodical Ocean Univ. China 51, 124–134. doi: 10.16441/j.cnki.hdxb.20200246
Zhou Y., Cai W., Chen H., Chen P., Jia X. (2010). The mechanism and research progress on fish attraction technique for artificial reefs. Mar. Fish. 32, 225–230. doi: 10.13233/j.cnki.mar.fish.2010.02.018
Keywords: attached community, artificial reefs, biodiversity, functional diversity, ecological niche, Bailong Pearl Bay
Citation: Li R, Guo Y, Zhang A, Zhang S, Zhang H and Qin C (2022) Variation in the attached community structure and function of artificial habitats during ecological succession: A case study of the artificial reef area in Bailong Pearl Bay, China. Front. Mar. Sci. 9:950151. doi: 10.3389/fmars.2022.950151
Received: 22 May 2022; Accepted: 23 September 2022;
Published: 07 October 2022.
Edited by:
Chaz Hyseni, Southern Research Station, Forest Service (USDA), United StatesReviewed by:
Wei Cong, Marine College, Shandong University, Weihai, ChinaJust T. Bayle-Sempere, University of Alicante, Spain
Peihong Jia, Hainan University, China
Copyright © 2022 Li, Guo, Zhang, Zhang, Zhang and Qin. This is an open-access article distributed under the terms of the Creative Commons Attribution License (CC BY). The use, distribution or reproduction in other forums is permitted, provided the original author(s) and the copyright owner(s) are credited and that the original publication in this journal is cited, in accordance with accepted academic practice. No use, distribution or reproduction is permitted which does not comply with these terms.
*Correspondence: Chuanxin Qin, cWluY3hAc2NzZnJpLmFjLmNu