
94% of researchers rate our articles as excellent or good
Learn more about the work of our research integrity team to safeguard the quality of each article we publish.
Find out more
ORIGINAL RESEARCH article
Front. Mar. Sci., 12 July 2022
Sec. Marine Fisheries, Aquaculture and Living Resources
Volume 9 - 2022 | https://doi.org/10.3389/fmars.2022.948882
This article is part of the Research TopicEchinoderms: Biology, Ecology and ExploitationView all 17 articles
 Chao Guo1Yuanxin Li1Jiahui Xie1Lingshu Han2Youquan Wang1Xianglei Zhang1YangLei Wu1Jian Song1Yaqing Chang1*
 Jun Ding1*
Apostichopus japonicas is an economically important species with high nutritional value. However, our knowledge of its genetic diversity and the genetic changes that occurred during its domestication or trait selection is quite limited. In this study, the whole genomes of 254 A. japonicas samples were resequenced. Analyses of the population genetic structure revealed that the genetic diversity of A. japonicas in the north of China is generally high, there was no difference in the population structure among the six cultured populations, and they were divided into two subpopulations together with AY-1 (new species). The results also showed that the genetic diversity of the AY-1 population was relatively low, the degree of linkage of alleles was high, and this population had been subjected to more positive selection. Based on Tajima’s D, FST analysis, and ROD analysis, the selected intervals and genes of the AY-1 population were identified, with some of the candidate intervals being related to an economically important trait and breeding target, namely, the number of parapodia. Gene Ontology analysis of the candidate genes revealed that the two subpopulations differed in their immune function, protein synthesis, decomposition, and transport, among others. Using GWAS, we identified 39 candidate genes for four economically important traits of A. japonicas, and we verified that those genes contained non-synonymous SNPs. Through this verification, BSL78_00022 and BSL78_00023 were found to be key genes for the number of parapodia in A. japonicas. Of these two genes, BSL78_00022 encodes a protein related to cell differentiation and proliferation, so it was assumed that three non-synonymous substitutions (Ser-Phe, Glu-Asp, and Ala-Val) in this gene are related to the changes in the number of parapodia. Meanwhile, the pleiotropic gene BSL78_04631, which is related to body weight and body wall weight, and promotes protein synthesis and cell growth, has a non-synonymous substitution (IlE-Val), which is assumed to be the reason for the difference in body weight and body wall weight of A. japonicas. These results provide a new perspective for explaining the genetic structure characteristics of A. japonicas and analyzing the selection and economically important traits in the breeding of new species.
Apostichopus japonicas, belonging to the class Holothuroidea within the Echinodermata, is an economically important species for aquaculture in China (Xu et al., 2015). In 2020, the output of A. japonicas in China reached 196,500 tons, with the coastal areas of Shandong and Liaoning being the main areas of production. To improve the yield and quality of cultured A. japonicas, genetic breeding of this species has been carried out in China since the early 1990s (Han et al., 2016). By 2021, six new species of A. japonicas, including “Shuiyuan No. 1” and “AY-1,” had been approved by the National Appraisal Committee of Aquatic Protospecies and Improved Varieties. Before that, A. japonicas farms used wild or cultured A. japonicas without selection for breeding as the parents to carry out seedling breeding of this species (Ru et al., 2019). “AY-1” (GS-01-014-2017) is a new species of A. japonicas approved by the National Appraisal Committee of Aquatic Protospecies and Improved Varieties in 2018, which was cultured via four generations of breeding, with “Shuiyuan No. 1” (GS-02-005-2009) as the candidate parent. It features long parapodia (fleshy thorns) on the body surface that are arranged in six regular rows, with an average number in each individual of more than 45. Compared with “Shuiyuan No. 1,” “AY-1” cultured under the same conditions had an average increase in the number of parapodia of 12.8%. At present, “AY-1” is widely cultured in Shandong and Liaoning provinces (Ding and Chang, 2020).
With the development of high-throughput sequencing technology and various omics technologies, basic studies on the application of breeding and population genetics of A. japonicas have been carried out. For example, Chen et al. (Chen et al., 2008) studied the genetic variation of wild and hatched A. japonicas populations in northern China using microsatellite markers. Their results showed that hatched populations typically differed significantly from wild populations. In addition, Chang et al. (Chang et al., 2009) studied the genetic structure of five natural A. japonicas populations [i.e., Aomori, Japan (JA and JR), Yosu, South Korea (KY), Dalian, China (CD), and Vladivostok, Russia (RV)], using 10 microsatellite markers. The results showed that the levels of genetic diversity of the five populations were similar. Moreover, Zhao et al. (Zhao et al., 2020) screened metabolic markers of A. japonicas populations in different regions of China (Jinzhou, Pikou, Dalian, and Rushan) through metabolomic methods. Furthermore, Gao et al. (Gao et al., 2019) carried out transcriptome analysis on the body wall of A. japonicas and revealed the differences in growth between the largest and smallest individuals in the purebred population and hybrid population. However, owing to technical constraints, the population genetic structure of the main cultured populations of A. japonicas in China is still largely unknown. In 2017, the Institute of Oceanography, Chinese Academy of Sciences, Ocean University of China, Dalian Ocean University, and other institutions in China successively completed the whole-genome sequencing of A. japonicas, laying a foundation for subsequent studies on the population structure and economically important traits of this species (Zhang et al., 2017; Li et al., 2018).
Genome-wide association study (GWAS) can mine sites and genes related to trait variation by obtaining a large number of single-nucleotide polymorphism (SNP) sites across the whole genome. Its results have the advantages of high resolution, providing a wide source of research materials, capturing abundant variation, high accuracy, and is relatively quick to obtain (Tam et al., 2019). To date, GWAS has been widely applied in the systematic screening of sites or genes related to economically important traits of aquatic animals such as fish, shellfish, and crustaceans (Abdelrahman et al., 2017). For example, Zhou et al. (Zhou et al., 2022) obtained genome regions and candidate genes related to various growth traits of mandarinfish through GWAS. In addition, Yang et al. (Yang et al., 2020) identified candidate SNPs and genes related to growth traits of Epinephelusfuscoguttatus using GWAS. Moreover, Wang et al. (Wang et al., 2022) identified genes related to carotenoid accumulation in scallops by GWAS, and He et al. (He et al., 2022) used this approach to reveal single-nucleotide polymorphism sites related to the shell shape of Crassostrea Gigas. Lyu et al. (Lyu et al., 2021) also identified candidate genes for growth traits in Litopenaeus vannamei by GWAS. Finally, Cui et al. (Cui et al., 2015) obtained sex-linked markers of Eriocheir sinensis by the same approach. However, no study on the trait-associated sites and genes of A. japonicas as determined using GWAS have been reported.
To summarize the current study, 254 A. japonicas individuals were resequenced based on their genomes, including “AY-1” and six major A. japonicas cultured populations in northern China. By population structure analysis, LD attenuation analysis, population group selection analysis, and genome-wide association study, we finally revealed the population structure and genetic diversity of this species, identified areas and candidate genes for artificial selection of “AY-1,” and revealed four candidate genes related to economically important traits. This study provides important information for germplasm conservation and genetic breeding of Apostichopus japonicas.
From July 2020, The samples were distributed as the new variety “AY-1” (J) (n=49), the cultured A. japonicas in Yantai, Shandong province (Y) (n=40), Mouping, Shandong Province (SZ) (n=25), South Huangcheng Island, Yantai, Shandong Province (SY) (n=28), Xixiakou, Weihai, Shandong Province (YS) (n=26), Ant Island, Jinzhou District, Dalian, Liaoning Province (M) (n=28) and Xinyulong, Pingdao, Dalian, Liaoning Province (X) (n=58), Based on our traits of interest, we sampled from a total sample of 505 sea cucumbers based on a normal distribution, and finally obtained 254 sea cucumbers for resequencing (Figure 1).
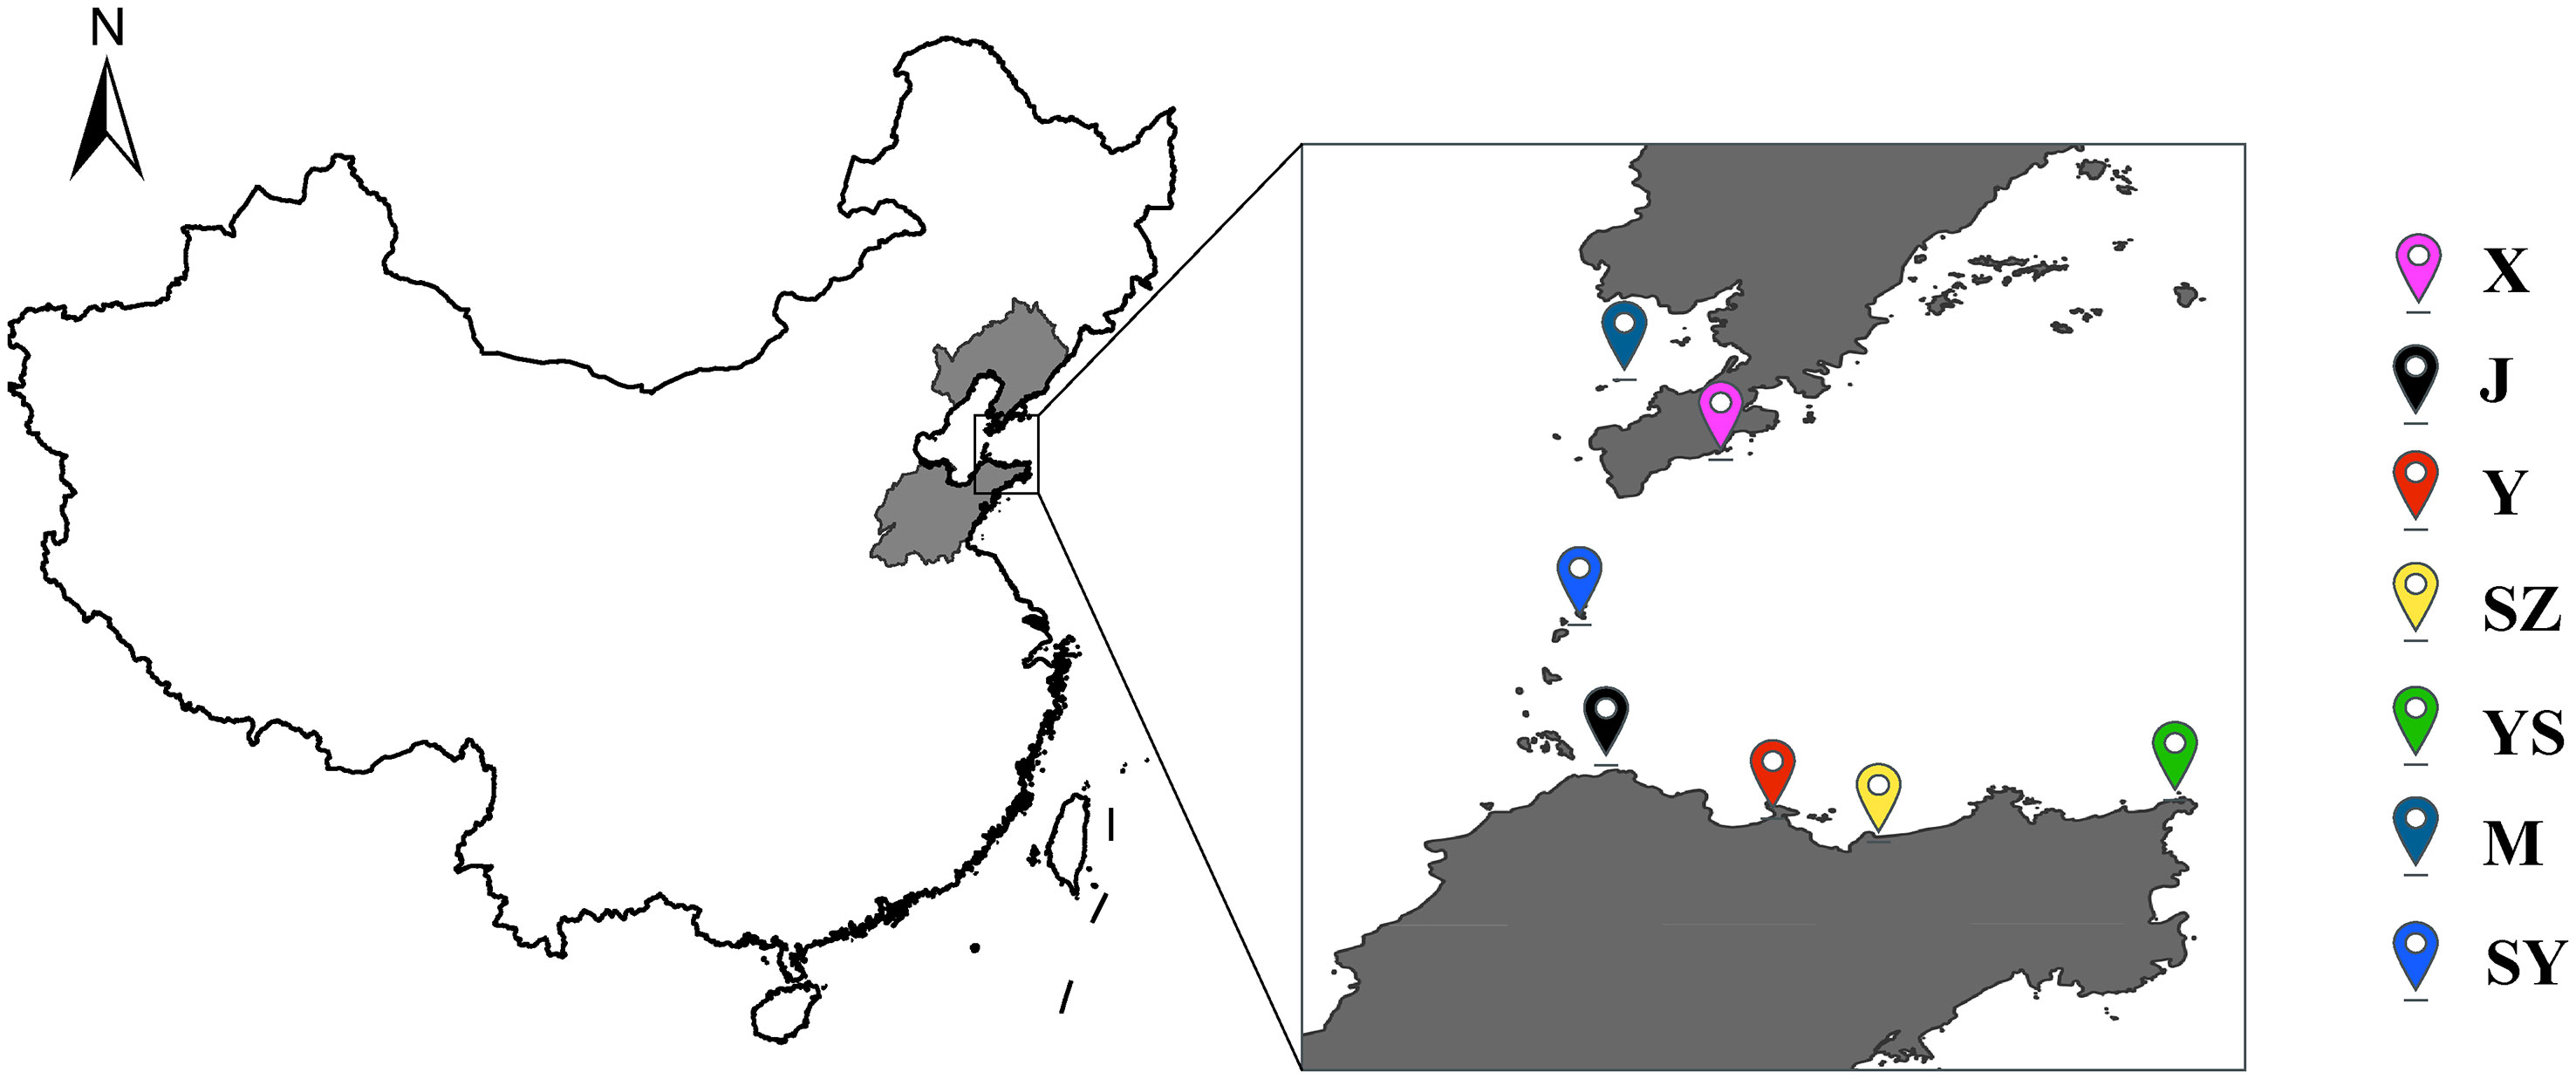
Figure 1 Geographical distribution of 254 Apostichopus japonicas.
All the samples were of the second age. The sea cucumber used in the experiment was harvested in July 2020 and transferred to the Key Laboratory of Marine Aquaculture of the Ministry of Agriculture and Rural Affairs for cultivation. All A.japonicas are reared in the same environment. The healthy non-destructive body surface of A.japonicas was selected from each population, and small pieces of the body wall and longitudinal muscle tissue were cut. After being frozen by liquid nitrogen, the samples were divided into centrifugal tubes and stored in a fresh freezer at -80°C. When measuring the number of parapodia, repeat counting three times and take the average value. Before weight measurement, dry the water on the surface of A.japonicas and let stand for 2-5min repeat weighing three times and take the average value. Similarly, the body wall weight was the average value after the visceral tissue was removed and repeatedly weighed three times. The body wall production rate was calculated by dividing the body wall weight by body weight.
Due to the particularity of Marine organisms’ tissues, it is necessary to remove proteins, fats, and other organic compound impurities. In this experiment, The total genome DNA was extracted by the SDS method. TIANGEN amp Marine Animals DNA Kit (TIANGEN, Beijing, China) was used to extract the muscle tissue of A.japonicas. The purity and integrity of nucleic acid were preliminarily detected by 1% agarose gel electrophoresis. The main band of qualified DNA samples was clear without degradation or slight degradation. The mass concentration of the tested DNA samples was adjusted to about 100ng/ul and stored.
The qualified samples were randomly broken into 350bp fragments by Bioruptor Pico ultrasonic fragmentation instrument, and then the genomic DNA library construction kit was used for library preparation. The library’s construction includes the process of DNA fragment end complementing, 3’ end adding ‘A’, DNA end linking adaptor, and PCR amplification. Quality control was carried out for the constructed libraries, and high-throughput sequencing was performed on the Illumina HiSeq2500 sequencing platform for qualified libraries.
Clean Reads are obtained by filtering Raw Reads of the original off-machine data. We adopt BWA (v0.7.12) software will clean reads and A.japonicas reference gene (https://ftp.ncbi.nlm.nih.gov/genomes/all/GCA/002/754/855/Gca_002754855.1_asm275485v1/). The initial comparison results were in Sam format, and then SamTools (1.9) was used to convert the results into BAM format and sort them. Suppose the result of a sample contains multiple libraries. In that case, the BAM results of multiple libraries are combined with SamTools. Then Picard is used to mark and remove repeated sequences, and then basic data information statistics and map comparison statistics are performed.
GATK (V3.8) was used for population SNPs detection of samples, and the obtained results were filtered to obtain credible SNPs, and the population SNPs results were saved in VCF format. ANNOVAR (V0.35) annotated SNPs based on the given chromosome, origin site, termination site, reference nucleotide, and mutant nucleotide. According to the genome annotation results, these SNPs were divided into exon, intron, intergene, upstream and downstream, and splicing sites. SNPs located in coding exons are further divided into synonymous SNPs (which do not cause amino acid changes) and non-synonymous SNPs (which cause amino acid changes).
To determine that SNPs used for phylogenetic tree construction and structural analysis were independent, we extracted a subset of 607,714 SNPs from the SNP dataset of all samples using LD thresholds (r2<0.05). The population structure analysis was carried out in Admixture (V1.3.0) with K value set from 1 to 9, and the minimum CV error value appeared at K = 2. Phylogenetic tree (NJ tree) analysis was constructed by VCF2Dis (V1.45).
The data analyzed by PCA and LD decay also used independent SNPs filtered by LD threshold(r2<0.05), and Plink (V1.90b6.21) software was used for PCA analysis, and the analysis was specified to PC10. PopLDdecay software (V3.41) was used to analyze LDdecay.
In population selection analysis, VCFtools (V0.1.16) was used to calculate inter-population FST analysis and intra-population nucleotide diversity (Pi) with a sliding window of 100KB and a sliding step of 10KB. Tajima’s D test in the population was performed by VCFtools using 100KB and 10KB non-overlapping sliding Windows, respectively. Use Perl scripts to calculate inter-group ROD values based on the formula ROD=1-(Pi pop1)/(Pi pop2).
Eggnog-mapper (V5.0) was used to carry out homology annotation according to the genome protein sequence file of A.japonicas to obtain the corresponding relationship between genes and GO term. R package AnnotationForge was used to construct the background file of GO analysis. R package clusterProfile (V4.2.0) was used for enrichment analysis.
Genome-wide association analysis was conducted by GEMMA (0.98.3), and generalized linear model (GLM) and mixed linear model (LMM) were used to analyze four economic traits, including the number of feet, body weight, body wall weight, and body wall production rate, respectively. Meanwhile, To avoid the influence of subgroup differentiation on GWAS results, When GEMMA was used for GLM association model analysis, we added the relatedness matrix as a covariable. The significance screening threshold of relevant SNPs was set as -log10P > 6, and the following strategies were adopted to analyze SNPs: Firstly, based on the screening of significantly correlated SNPs (-log10P > 6), the SNPs associated with both models were selected for further analysis; Secondly, LD block analysis was performed on the upstream and downstream of the genome of these SNPs, focusing on non-synonymous SNPs. Third, search for genes corresponding to non-synonymous SNPs and find out their functions; Fourth, to more accurately analyze the functions of these candidate genes, eggNOG annotation was used, and the homologous gene functions were searched.
qRT-PCR was used for gene expression analysis. The primers were designed by Primer 5.0 (Primer sequences are shown in Supplementary Table 1), and two genes related to the number of parapodia and one gene related to growth traits were selected for qRT-PCR detection. For the verification of the number of parapodia, the number of parapodia was 25 (less parapodia), 30 (control), and 46 (more parapodia), with three parallel samples in each group. The body wall tissues with the weight of 50g (large weight), 100g (control), and 170g (lightweight) were selected for growth traits, with three parallel samples in each group. Total RNA was extracted by the Tiangen kit and verified by qRT-PCR. The gene expression level was calculated by the comparative -ΔΔt method.
To study the population structure of “AY-1” and the A. japonicas populations in representative regions of northern China, we collected seven A. japonicas populations in the main production areas of Shandong and Liaoning. In the GWAS, the traits that we focused on were growth traits (body weight, body wall weight, and body wall production rate) and the number of parapodia. The distribution of each trait of the total sample is shown in Supplementary Figure 1. Under the condition that the characters conform to the normal distribution roughly, the parapodium number was 23-49, the body weight was 14-238 g, the body wall weight was 9.8-149 g, and the body wall production rate was 0.33%-0.95%. With consideration of the GWAS requirements, 25 to 60 sea cucumbers per population were selected for whole-genome resequencing. The high-throughput sequencing was performed through the sequencing platform Illumina HiSeq2500, and the reads between the sequencing data and the unique position of the reference genome were 92.57%-93.80%, and the average sequencing depth was 10.58x (see Supplementary Table 2). SNPs were unevenly distributed across the genome, with 53.74% in intergenic regions, 25.51% in introns, 3.51% in exons, and the rest scattered in other regions (see Supplementary Table 3). Indels had a distribution similar to SNPs, with 53.30% in intergenic regions, 24.55% in introns, only 0.89% in exons, and the rest scattered in other regions (see Supplementary Table 4). Finally, 11,736,971 high-quality SNP sites were obtained by filtering (with MAF <0.05 and max-missing 0.8 as the standard), which could meet the requirements of subsequent analysis.
To avoid the effect of long LD fragments on the population structure, single SNP sites filtered by a linkage disequilibrium threshold (LD r2 < 0.05) were used for the population structure analysis, phylogenetic tree construction, and PCA of A. japonicas. The admixture population structure analysis showed that the seven A. japonicas populations could be divided into two subpopulations according to the minimum CV error value (when k=2), namely, the AY-1 subpopulation and the CN subpopulation (Figure 2B). When k=3 or 4, the AY-1 subpopulation also showed a population structure different from that of other A. japonicas populations.
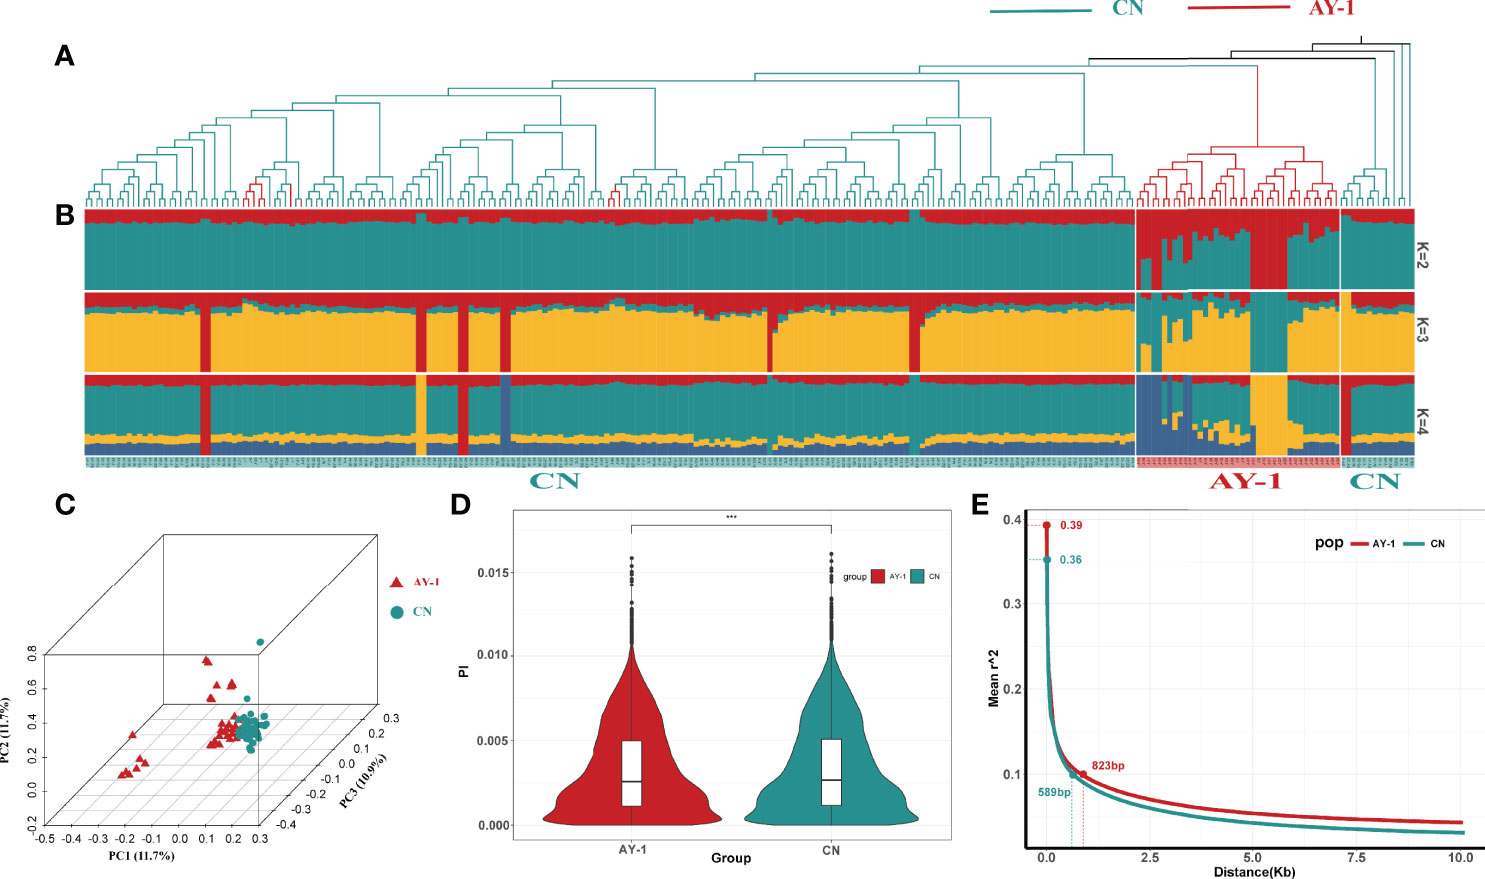
Figure 2 Population structure analysis of Apostichopus japonicas. (A) phylogenetic tree, The blue branch represents the CN subgroup, and the red branch represents the AY-1 subgroup. (B) Population structure of Apostichopus japonicas, Each column represents an individual, and the individual is matched with the phylogenetic tree branches in Figure A in turn. The color in the structure plot indicates the component state in each sample. (C) PCA figure. (D) Nucleotide polymorphisms (Pi) in two subpopulations. (E) Linkage disequilibrium for two subgroups. *** means p<0.001 in significance test
The phylogenetic tree divided all individuals into two main groups of populations (Figure 2A), which was consistent with the results of the population structure analysis, in which most AY-1 A. japonicas clustered individually, while other A. japonicas populations clustered in a mixed way, showing clusters of individuals rather than populations.
In the PCA analysis, PC1 to PC10 were analyzed, and the proportions of variation explained by PC1, PC2, and PC3 were 11.7%, 10.9%, and 10.5%, respectively (Figure 2C). The PCA chart showed that the AY-1 subpopulation was clearly separated from the CN subpopulation, but it had a large internal degree of dispersion, and there were still a small number of individuals overlapping with the CN subpopulation, which was consistent with the phylogenetic tree and results of population structure analysis.
By calculating the nucleotide diversity (π) within the two subpopulations, we further characterized their genetic diversity and differences. The statistical results of the nucleotide diversity analysis of the two subpopulations are shown in Figure 2D. The nucleotide diversity of the A. japonicas subpopulation in northern China was significantly higher than that of the AY-1 subpopulation. With the windows whose π values corresponded to the top 5% of thresholds as the comparison node, the nucleotide diversity of the AY-1 subpopulation was 7.92 x 10⁻³, and the nucleotide diversity of the CN subpopulation was 8.09 x 10⁻³. This result was consistent with expectations, namely, the genetic diversity of artificially selected populations is lower than that of natural populations.
LD attenuation is often associated with genetic diversity and the history of domestication, so we further examined the linkage disequilibrium attenuation values of the two A. japonicas subpopulations. The results of this statistical analysis are shown in Figure 2E. The maximum value of the LD coefficient (r2) of the AY-1 subpopulation was 0.39 and that of the CN subpopulation was 0.36. The corresponding physical distance when the LD coefficient (r2) was reduced to 0.1 was taken as the LD attenuation distance of the subpopulations. The attenuation distance of the AY-1 subpopulation was 823 bp and that of the CN subpopulation was 598 bp. The LD attenuation rate of the AY-1 A. japonicas subpopulation was relatively low, indicating that the linkage between markers in this subpopulation was higher and its genetic diversity was lower. This conclusion is in line with the LD attenuation characteristics of domesticated populations, and consistent with the conclusion of the above nucleotide diversity (π) analysis.
To examine the internal positive selection effect of the two A. japonicas subpopulations, we used Tajima’s D test (Tajima, 1989) to analyze the differences in the number of nucleotide segregating sites (θw) and nucleotide diversity (π) within the two subpopulations. The results of Tajima’s D test are shown in Figure 3A (calculated using a 100 kb non-overlapping sliding window). In most of the same genomically regions, Tajima’s D value of the AY-1 subpopulation was lower than that of the CN subpopulation, and there were a large number of regions with Tajima’s D values of less than 0. The AY-1 subpopulation had 164 windows with Tajima’s D value less than 0, while the CN subpopulation had only 22. This indicated that the AY-1 subpopulation had lower genetic diversity and more rare alleles, and had been subjected to more positive selection. A 10 kb non-overlapping sliding window was used to calculate Tajima’s D value of the AY-1 subpopulation, the top 5% of windows with the small to large Tajima’s D value (Tajima’s D < -0.167) were selected, and a total of 3871 candidate regions were obtained. These regions covered a total of 1842 genes in the genome annotation file. The Gene Ontology analysis showed that candidate genes were mainly enriched in biological process (BP) and the main functions involved were immune response (e.g., regulation of wound healing, regulation of response to effectiveness, positive regulation of wound healing, and others), morphological development (e.g., fin morphogenesis, embryonic Pectoral fin Morphogenesis, fin development, and others), and Signal transduction (positive regulation of Wnt signaling pathway). (Supplementary Figure 2).
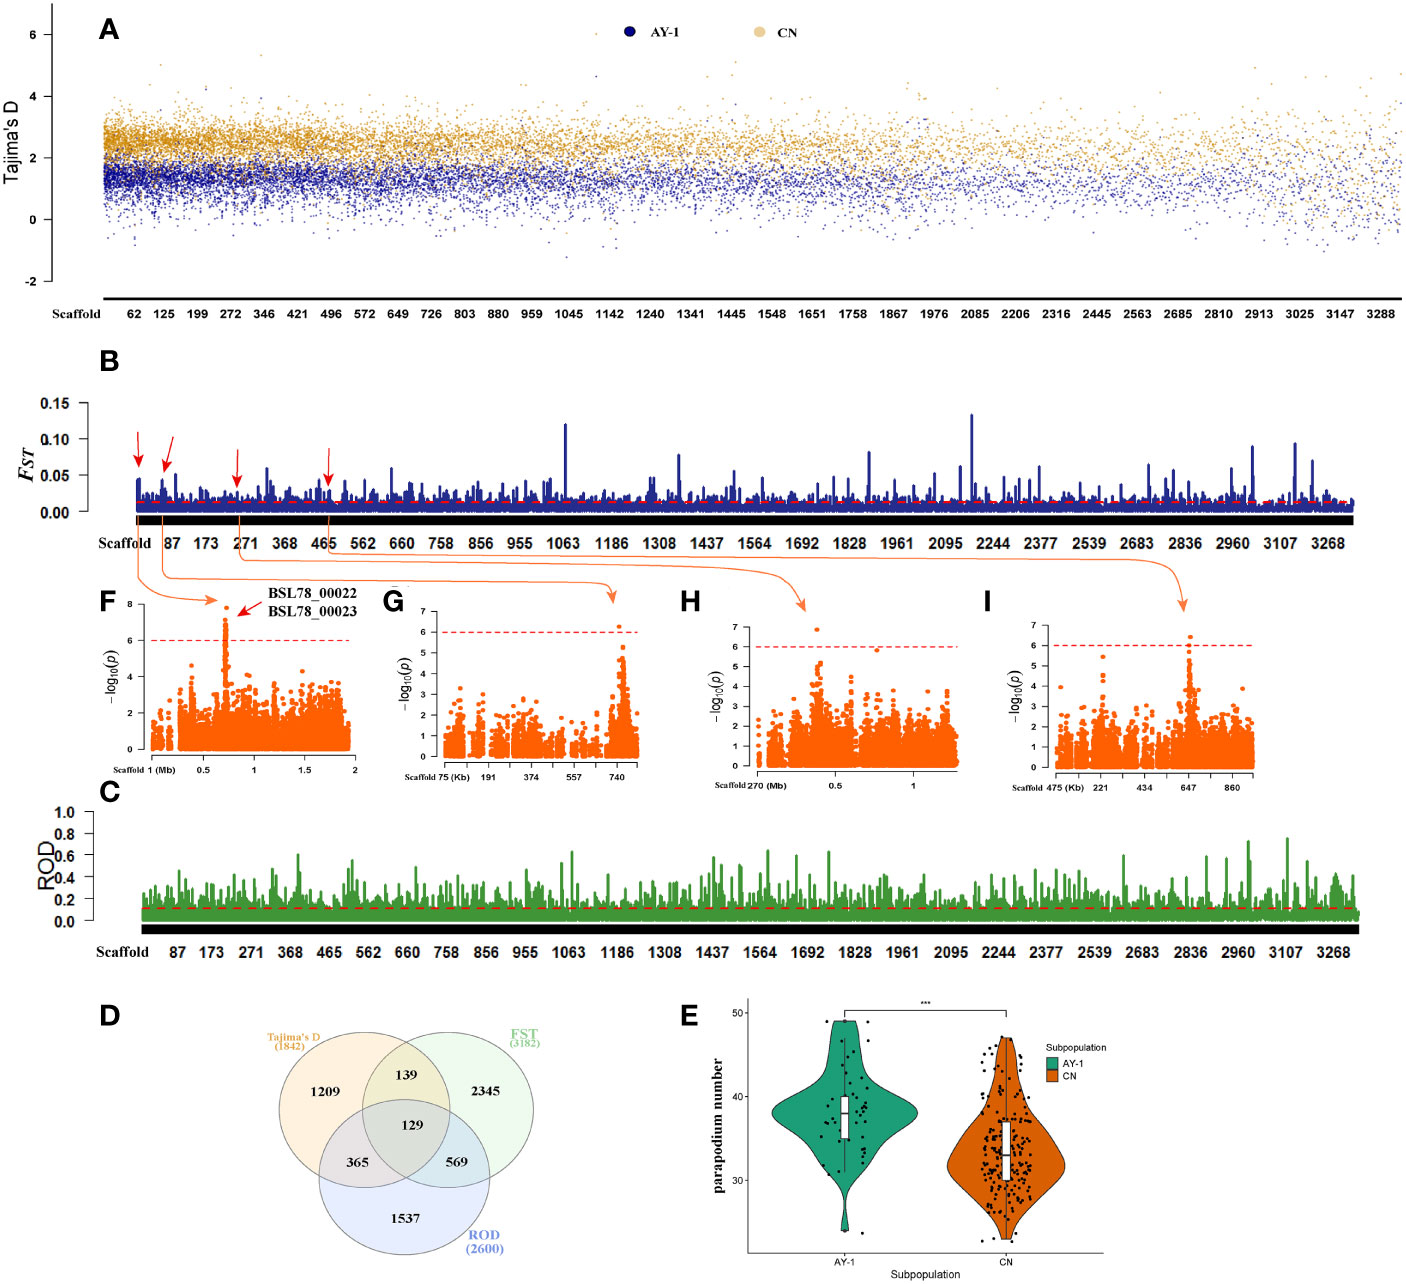
Figure 3 Group selection analysis. (A) Tajima’s D analysis, 1000kb non-overlapping sliding window. (B) Based on the FST analysis of the inter-population divergence test, the threshold line is the value corresponding to the top 95% of FST. (C) ROD analysis based on inter-group divergence test. (D) Tajima’s D, FST, and ROD analyzed the intersection of selected genes. (E) Statistical analysis of quantitative characters of two subpopulations. (F−I) parapodium number GWAS analysis of local Manhattan map. The Scaffold starting with “MRZV” was replaced for the convenience of showing. The replacement method is Scaffold MRZV01000001.1-MRZV01003278.1 corresponding to Scaffold 1-Scaffold 3394 (Supplementary Table 12).
Fixation statistic (FST) (Nei and Chesser, 1983) can be used to estimate the difference between the average amount of polymorphism in two subpopulations and the average amount of polymorphism in the whole subpopulation; the change in its value reflects the differentiation level of the population. To identify the regions where the domesticated population (“AY-1” subpopulation) was quite different from the natural population (subpopulations in northern China), we selected the regions with FST thresholds in the top 5% as candidate intervals (100 kb sliding window, sliding step size of 10 kb), and a total of 982 candidate intervals were screened (Figure 3B). These selected intervals covered a total of 3182 genes in the genome annotation file. The results of Gene Ontology analysis of candidate genes showed that these genes were mainly enriched in biological process (BP) terms, such as regulation of inflammatory response; regulation of wound healing; negative regulation of inflammatory response; negative regulation of defense response; muscle cell cellular homeostasis; and inflammatory response (Supplementary Figure 3). Generally, the FST value was greater than 0.05 indicating that there was moderate or higher genetic differentiation among populations. In this study, 16 intervals with FST values greater than 0.05 were obtained, of which 7 intervals covered a total of 10 genes, such as BSL78_21603, BSL78_22159, and BSL78_27475. These genes are related to GTPase activity, GTP binding, ATP binding, DNA binding, and ATP-dependent microtubule motor activity, among others (Supplementary Table 5).
The reduction of diversity (ROD) index can measure the loss of polymorphism in a domesticated population relative to the corresponding wild population based on the difference in nucleic acid polymorphism π between these populations. Therefore, we adopted this index to evaluate the loss of nucleic acid polymorphisms in “AY-1” relative to the A. japonicas subpopulations in northern China (Figure 3C). After the π values of the two subpopulations were calculated using a 100 kb sliding window (with a sliding step size of 10 kb), the ROD value between the subpopulations was deduced, and the regions with ROD threshold values in the top 5% were selected as candidate intervals (ROD > 0.103), and a total of 1321 candidate intervals were obtained by screening. These selected intervals covered a total of 2600 genes in the genome annotation file. The results of Gene Ontology analysis showed that Candidate genes were mainly enriched in biological processes (BP) such as Proteasomal protein catabolic process, purine nucleoside catabolic process, and regulation of transcription by RNA polymerase III, etc. (Supplementary Figure 4). To improve the reliability of the selected regions and candidate genes of “AY-1” A. japonicas, we further selected Tajima’s D, FST, ROD selected regions, and the overlapping genes obtained above, and finally obtained 255 regions and 129 genes (Figure 3D), which should be valuable for further study.
Through the phenotypic data analysis, it was found that the two subpopulations had a significant difference in the number of parapodia (Figure 3E). To explore whether the selected regions of “AY-1” were associated with this trait, we matched the parapodium number-associated sites obtained from the GWAS with the regions with FST and ROD thresholds in the top 5%. We found that 41 sites were located within the above-mentioned regions, of which 36 were located in the matching regions with FST thresholds within the top 5% (31 sites were located in Scaffold MRZV01000001.1: 710,001 bp-810,000 bp and the other 5 sites were in Scaffolds MRZV01000075.1, MRZV01000474.1, and MRZV01000269.1) (Figures 3F–I). The distribution of the other five loci matching the selected region of the ROD analysis was as follows, three SNP loci were located in Scaffold MRZV01000163.1, and the other two loci were located in Scaffold MRZV01000306.1 and Scaffold MRZV01000888.1, respectively (Supplementary Table 6).
The parapodia on the back of A. japonicas are hollow, cone-shaped, fleshy, thorn-like tissues, which function in breathing and exchanging information with the outside world. The number of parapodia has always been one of the most economically important traits of A. japonicas. In this study, the generalized linear model (GLM) and the linear mixed model (LMM) were used to perform a genome-wide association analysis on the number of parapodia. By using the threshold -log10P > 6, a total of 73 SNPs that were significantly associated with the number of parapodia were identified in the GLM association model (Figure 4A; Supplementary Table 6), QQ-plot shows that the fitting model is reasonable (Supplementary Figure 5). Using the same threshold, 16 significant loci were identified by the LMM model (Supplementary Table 7). Through mutual validation of the results of the two association models, we focused on the SNPs obtained in Scaffolds MRZV01000001.1, MRZV01000029.1, MRZV01000070.1, and MRZV01001092.1. These SNPs were associated with eight genes in the A. japonicas genome (Figure 4A; Table 1). Notably, the 31 SNPs located at MRZV01000001.1 were in genomic regions with selection signals (Figure 3H).
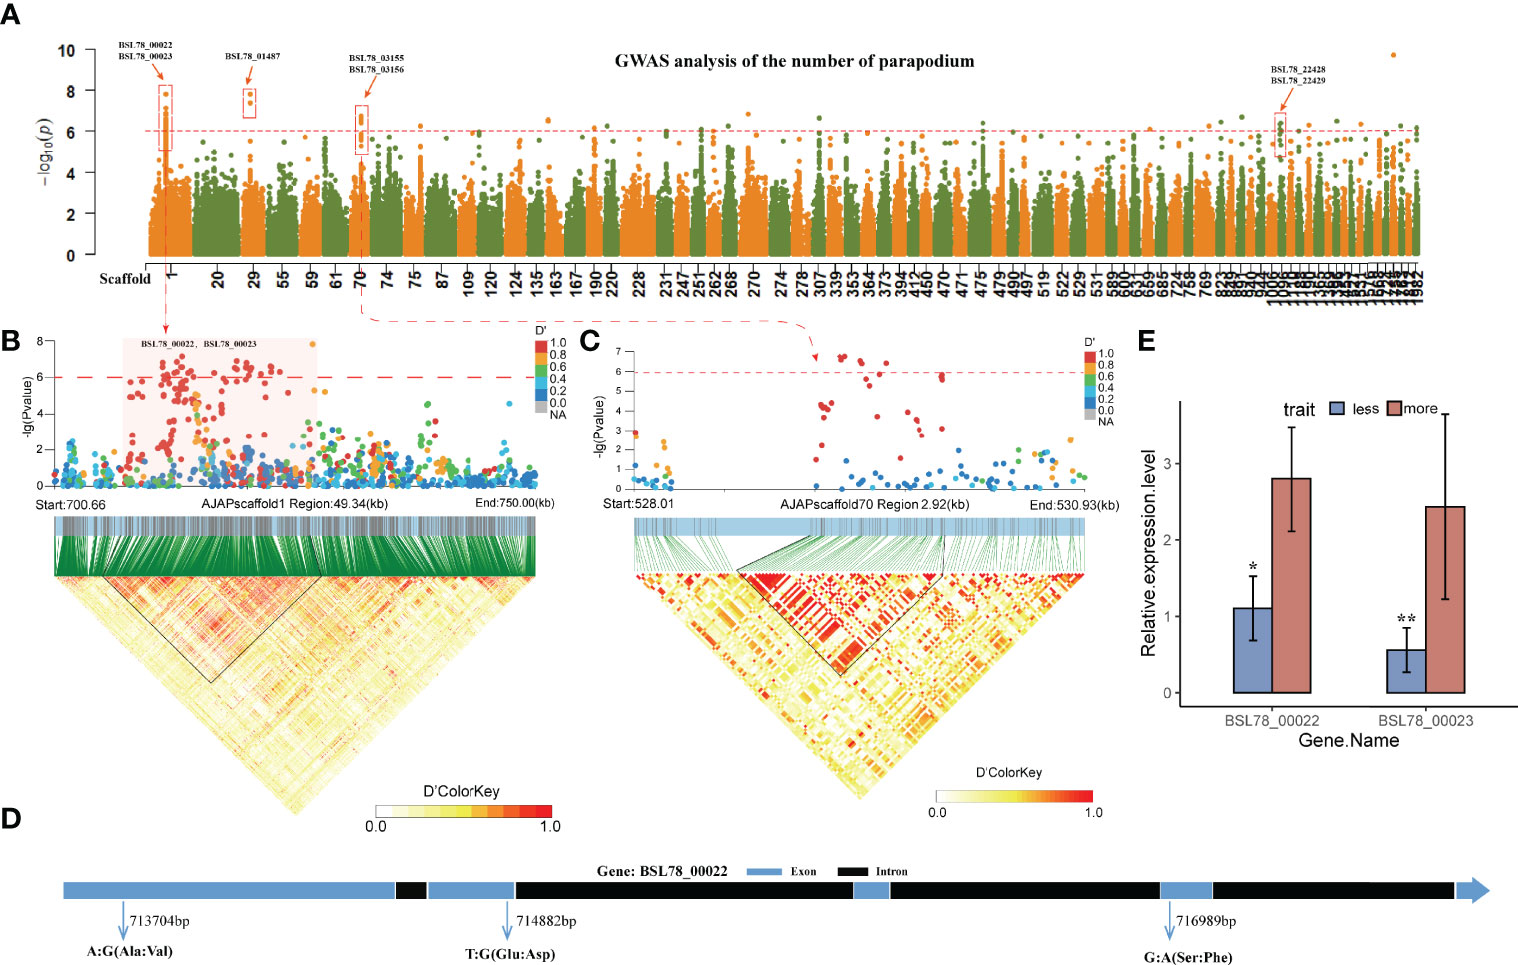
Figure 4 GWAS analysis of the number of parapodium. (A) GWAS analysis of the number of parapodium, Only the scaffolds of the 200 SNPs with the maximum -log10P values are shown (GLM model results). (B) A LD block on Scaffold 1 related to the number of parapodium. (C) A LD block on Scaffold 70 related to the number of parapodium. (D) Structure of gene BSL78_00022. (E) qRT-PCR results of gene BSL78_00022 and gene BSL78_00022. The Scaffold starting with “MRZV” was replaced for the convenience of showing. The replacement method is Scaffold MRZV01000001.1-MRZV01003278.1 corresponding to Scaffold 1-Scaffold 3394 (Supplementary Table 12). ** means p<0.01 in significance test. * means p<0.05 in significance test.
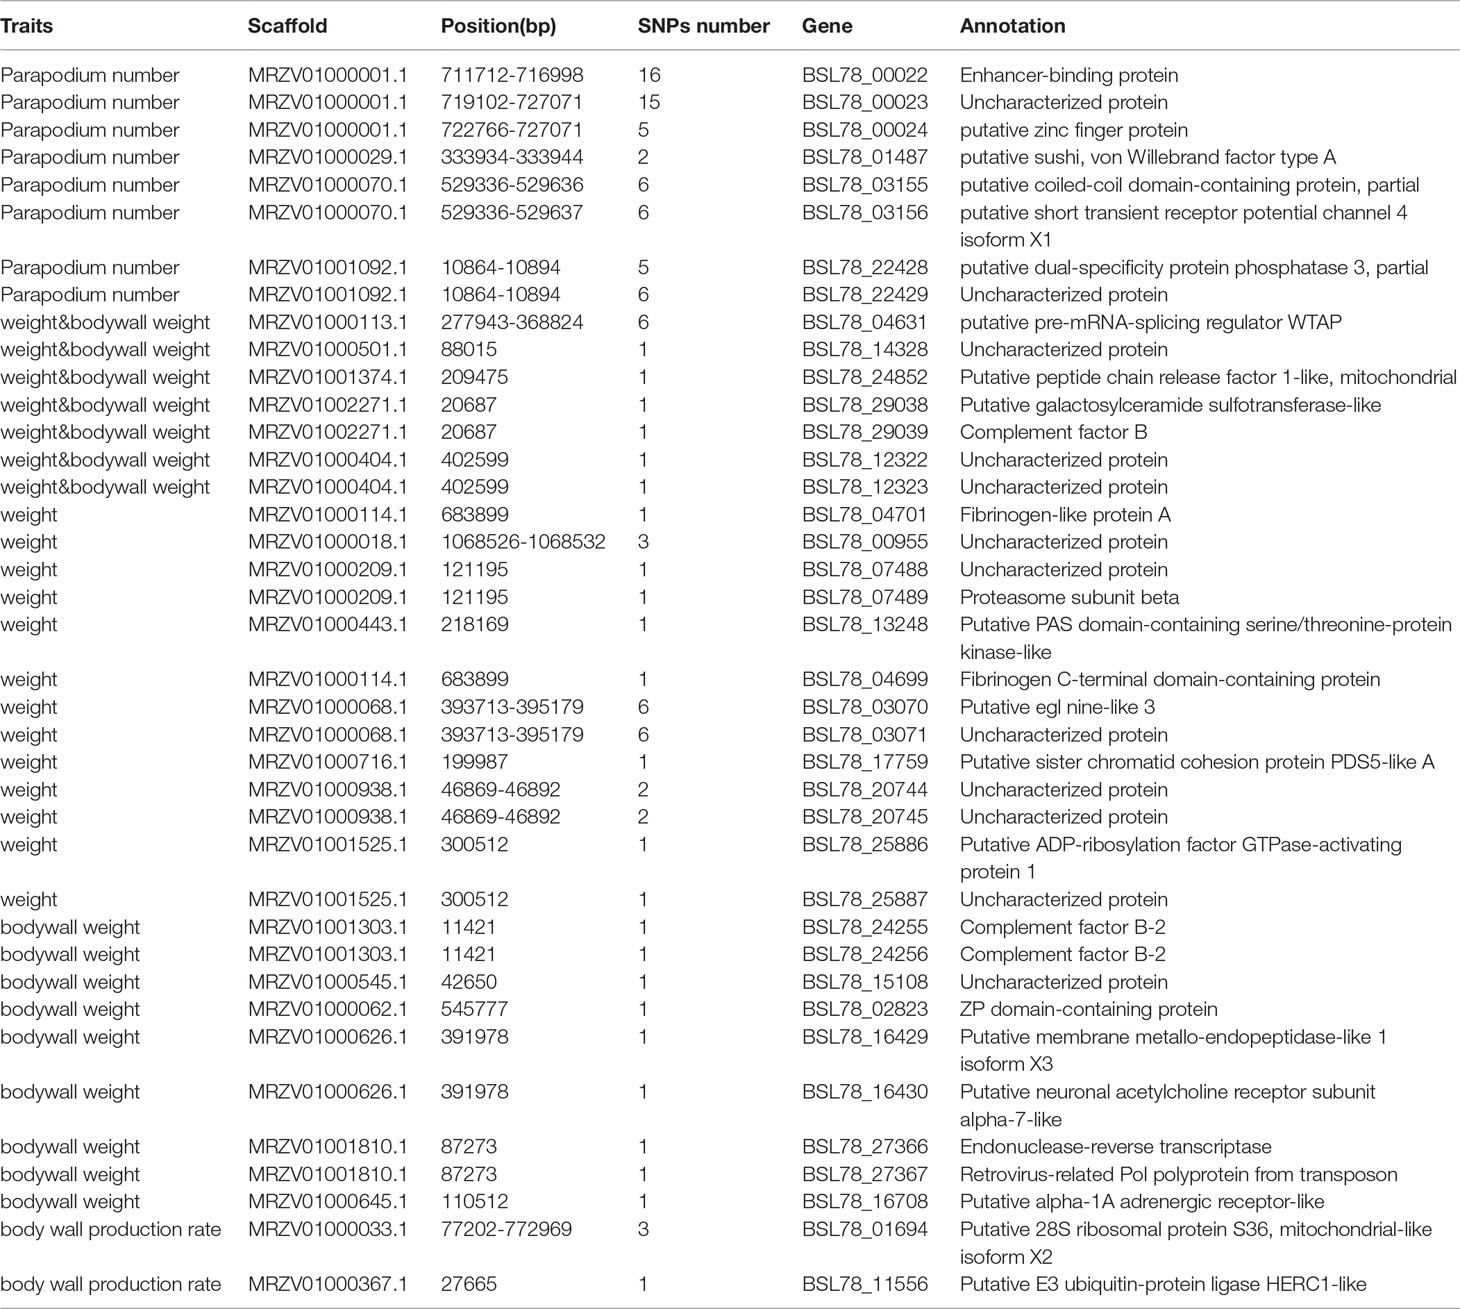
Table 1 Candidate genes of 4 traits.
Linkage analysis of the upstream and downstream regions of the genome was performed with the above SNPs, and two LD blocks were identified in Scaffolds MRZV01000001.1 (711.7-723.7 kb) and MRZV01000070.1 (529-530 kb) (Figures 4B, C), of which the haplotype block located in Scaffold MRZV01000070.1 529-530 kb was located in the spacer region between the BSL78_03155 gene and the BSL78_03156 gene. Two related signal genes, namely, BSL78_00022 and BSL78_00023, were found in the haplotype block located at Scaffold MRZV01000070.1 711.7-723.7 kb. There were three non-synonymous significantly associated SNPs (-log10P > 6) in the BSL78_00022 gene as follows: SNP1 (G/A) located at Scaffold MRZV01000001.1 716,989 bp, which caused the amino acid to change from serine to phenylalanine; SNP2 (T/G) located at Scaffold MRZV01000001.1 714,882 bp, which caused the amino acid to change from glutamic acid to aspartic acid; and SNP3 (A/G) located at Scaffold MRZV01000001.1 713,704 bp, which caused the amino acid to change from alanine to valine (Figure 4D). The A. japonicas genome annotation file indicated that the BSL78_00022 gene encodes an enhancer-binding protein, and the eggNOG homology annotation indicated that its homologous gene is CTCF. CTCF is expressed in various structures of other species, and its function is mainly related to gene expression regulation and transcriptional regulation (Phillips and Corces, 2009). The qRT-PCR results showed that the expression levels of BSL78_00022 and BSL78_00023 were significantly higher in A. japonicas with multiple parapodia than in those with few parapodia (Figure 4E).
The growth traits of A. japonicas are essential research topics in aquaculture breeding, and body weight, body wall weight, and body wall production rate are important indicators to measure its growth. Pearson’s correlation analysis showed that the body weight and body wall weight of A. japonicas were significantly positively correlated, but they were not correlated with the body wall production rate (Supplementary Figure 6).
Genome-wide association study on three traits was performed in this study with a generalized linear model (GLM) and linear mixed model (LMM), using a threshold of -log10P > 6. Overall, 51 significantly associated SNPs were identified for body weight (Figure 5A; Supplementary Table 8) and 45 for body wall weight in the GLM association model (Figure 5B; Supplementary Table 10), QQ-plot shows that the fitting model is reasonable (Supplementary Figures 7, 8). Using the same threshold, a total of 17 significant loci were identified in the LMM model related to body weight and 19 significant loci related to body wall weight (Supplementary Tables 9, 11). After mutual verification of the association results, we focused on the genes corresponding to the SNPs associated with both models. A total of 21 associated genes were identified for body weight (Table 1), and a total of 16 were identified for body wall weight (Table 1). In addition, by comparison, we found six SNPs in Scaffold MRZV01000113.1 that were pleiotropically associated with body weight and body wall weight (Figure 5B), which provided a genetic explanation for the positive correlation between body wall weight and bodyweight of A. japonicas. These SNPs corresponded to the BSL78_04631 gene in the genome annotation file. Further analysis of the BSL78_04631 gene showed that there was a non-synonymous SNP (-log10P > 6) significantly correlated with body weight and body wall weight in this gene, which was located at A/G of Scaffold MRZV01000113.1 278,613 bp, causing the amino acid to change from isoleucine to valine (Figure 5C). The qRT-PCR results showed that the expression level of BSL78_04631 in A. japonicas with large body weight and body wall was significantly higher than that in those with small body weight and body wall (Figure 5D).
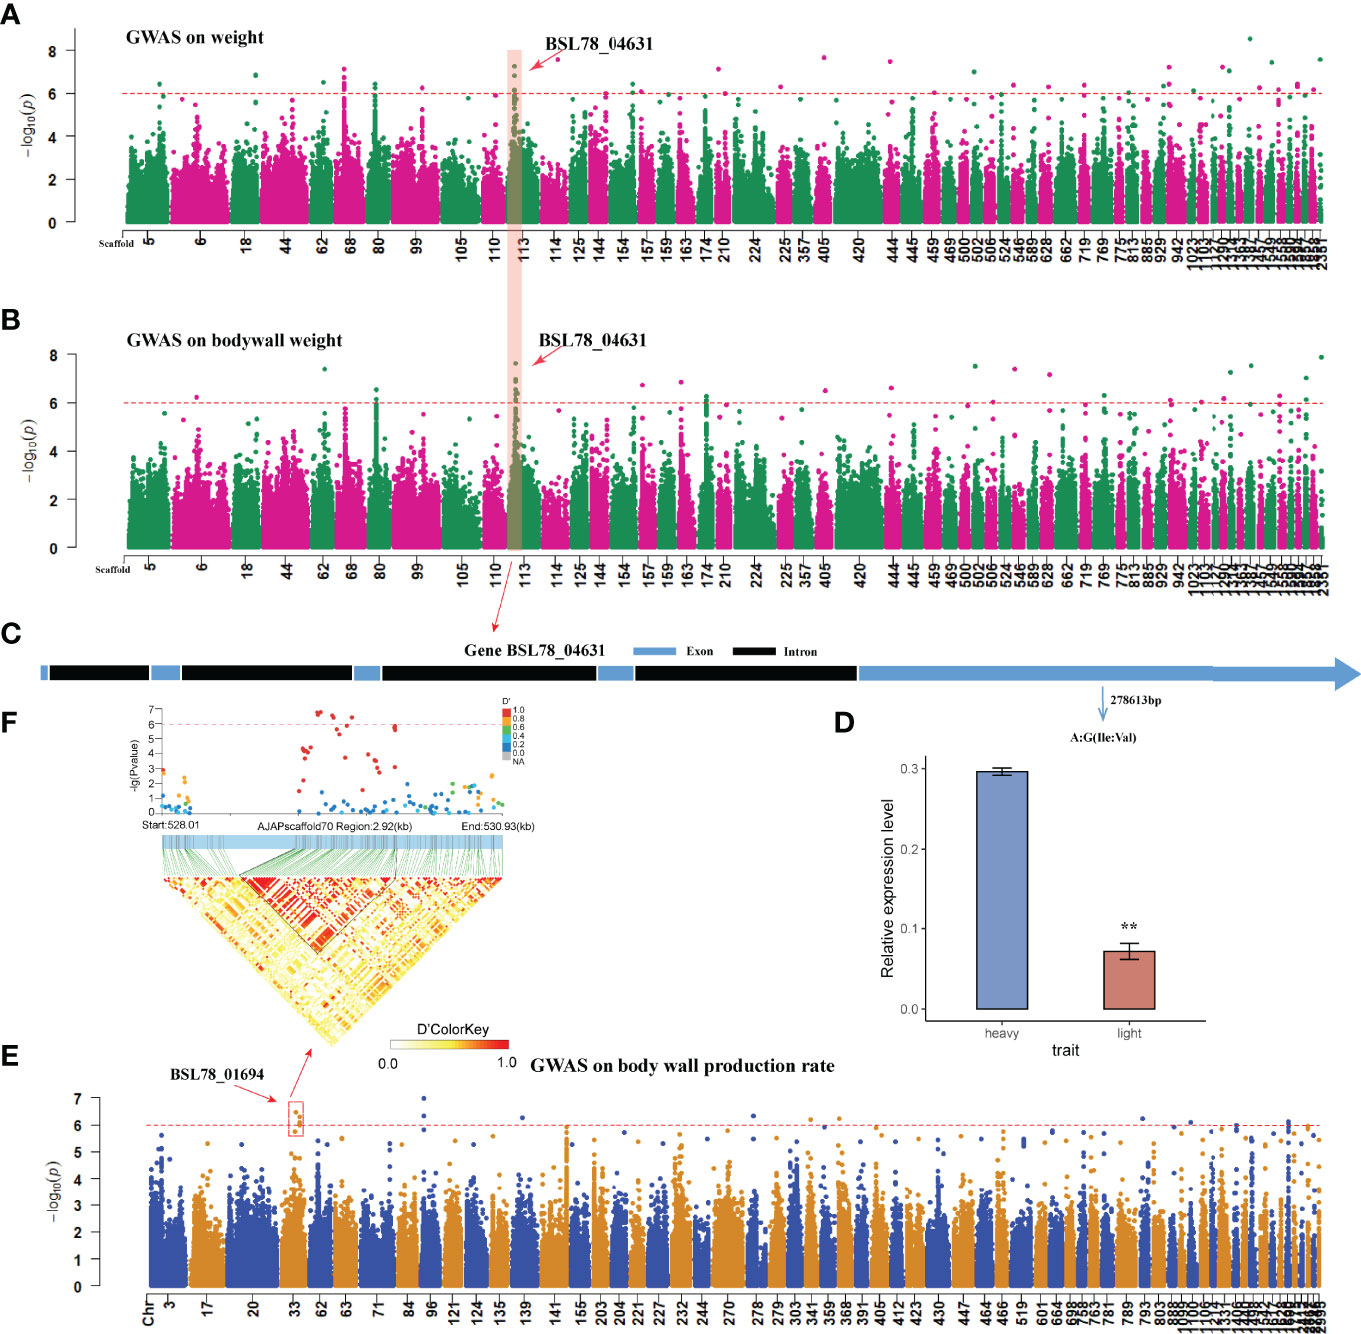
Figure 5 Genome-wide association analysis of growth traits in Apostichopus japonicus. (A) Body weight GWAS analysis, Only the scaffolds of the 200 SNPs with the maximum -log10P values are shown (GLM model results). (B) Body wall weight GWAS analysis, Only the scaffolds of the 200 SNPs with the maximum -log10P values are shown (GLM model results). (C) Structure of gene BSL78_04631. (D) qRT-PCR results of gene BSL78_04631. (E) Genome-wide association analysis of body wall production rate in Apostichopus japonicus, Only the scaffolds of the 200 SNPs with the maximum -log10P values are shown. (F) A LD block on Scaffold 33 related to body wall production rate. The Scaffold starting with “MRZV” was replaced for the convenience of showing. The replacement method is Scaffold MRZV01000001.1-MRZV01003278.1 corresponding to Scaffold 1-Scaffold 3394 (Supplementary Table 12). ** means p<0.01 in significance test.
In the association analysis of the body wall production rate of A. japonicas, a total of 13 significantly associated SNPs were identified by using the threshold -log10P > 6 in the GLM association model (Figure 5E, Supplementary Table 12), QQ-plot shows that the fitting model is reasonable (Supplementary Figure 9). Using the same threshold, 10 significant loci were identified by the LMM model (Supplementary Table 13). The association results were mutually verified, and the two models were associated with two genes in the genome annotation file (Table 1). The LD linkage analysis was performed upstream and downstream of the significantly associated SNPs, and it was identified that there was one LD block in Scaffold MRZV01000033.1 771-773 kb (Figure 5F), which was completely located within the region of the BSL78_01694 gene.
Although the Apostichopus japonicas genome was published as early as 2017 (Zhang et al., 2017), no in-depth population-based studies of population-wide selection and economically important traits have been reported on this species. In this study, whole-genome resequencing analysis was conducted on a total of 254 A. japonicas individuals collected from seven cultured populations including a new species of A. japonicas, “AY-1,” which was used as the major research object, by the genetic resources of the major A. japonicas breeding areas in China. From the population structure analysis based on high-density SNP markers, we found that there was no difference in the population structure of A. japonicas cultured populations in different regions of northern China, while most individuals in the AY-1 population showed a different population structure from the CN population. This was associated with the AY-1 population being subjected to intentional artificial selection and having Russian A. japonicas ancestry, which was also confirmed by the phylogenetic tree and PCA results.
In the comparative analysis of the two populations, we found that the genetic diversity (π) of the AY-1 population was lower than that of the CN population, which is in line with the genetic characteristics of domesticated populations, namely, the lower genetic diversity of populations subjected to artificial selection and domestication (Sonnante et al., 1994; Reif et al., 2005; Flint-Garcia, 2013; Smýkal et al., 2018). The linkage disequilibrium
(LD) analysis indicated that the LD attenuation distance of the AY-1 population was smaller than that of the CN population. The LD attenuation distance usually reflects the domestication relationship of a population to a certain extent: the LD attenuation distance of domesticated populations is longer. For example, the attenuation distance of wild oyster populations is 0.13 kb, while that of domesticated oyster populations is 0.35 kb (r2 threshold = 0.2) (Hu et al., 2021); meanwhile, the LD attenuation distance of domesticated goldfish is significantly larger than that of common crucian carps (Chen et al., 2020). It is worth noting that, strictly speaking, the CN population is not a wild population, but has been subjected to unintentional artificial selection. Therefore, irrespective of whether we are referring to the AY-1 population or the CN population, the LD attenuation distance is shorter than that of other domesticated aquatic animals (For example, Crassostrea Gigas, Nile Tilapia, Large Yellow Croaker, scallop) (Cádiz et al., 2020; Hu et al., 2022; Kon et al., 2021; Wang et al., 2021). Therefore, we speculate that the gene recombination frequency and genetic diversity of the current cultured A. japonicas populations in China are generally high. Tajima’s D is an important indicator to test the effect of positive selection within a population (Tajima, 1989; Prezeworski et al., 2005). In the AY-1 population, there were many regions where Tajima’s D value was less than zero, and the values at most positions were smaller than those of the CN population. This indicated that AY-1 has more low-frequency allele sites, lower genetic diversity, and has been subjected to more positive selection.
For group selection candidate gene function analysis, we found that a large number of genes in the 982 candidate intervals obtained by FST analysis were enriched in pathways related to inflammation, inflammation regulation, and regulation of wound healing. Selected genes obtained by Tajima’s D analysis in the AY-1 population were also enriched in the similar immune reaction-related term. These results indicated that the immune function of the AY-1 population was different from that of the CN population. The genes’ function in regions with FST values greater than 0.05 is mainly related to the biological processes involved in GTP and ATP. GTPase plays important role in energy supply (Sahlin et al., 1998), signal transduction (Narumiya, 1996), and protein biosynthesis (Hershey and Monro, 1966; Schimmel, 1993), and transport (Jones et al., 1995) in vivo. Therefore, we further speculate that the two subgroups may be different in these functions. Both FST analysis and ROD analysis were associated with the regulation of transcription by the RNA polymerase III pathway, RNA polymerase III plays a key functional role in the synthesis of a variety of small and stable RNAs and protein synthesis (Turowski and Tollervey, 2016). It is noteworthy that all three analyses are directly related to protein-related GO terms, such as secretory granule localization, proteasomal protein catabolic process, and negative regulation of protein homooligomerization. These results indicate that there are differences in protein synthesis, activation, and decomposition between the two subgroups, which is worthy of further investigation.
In the GWAS, we focused on the number of parapodia and growth traits (body weight, body wall weight, and meat yield) of A. japonicas. The parapodia of A. japonicas function in breathing and exchanging information with the outside world. The number of parapodia is an important indicator of the economic value of A. japonicas. In this study, 31 SNPs located in Scaffold MRZV01000001.1 were identified to be significantly correlated with the number of parapodia, and these sites were also in the top 5% of the candidate intervals in the FST analysis. This provides a genetic explanation for the positive selection to which the number of parapodia in A. japonicas was subjected in artificial breeding. The LD block analysis showed that these SNPs had a block in MRZV01000070.1 711.7–723.7 kb. In this block, we determined that the key genes for the number of parapodia in A. japonicas were BSL78_00022 and BSL78_00023. Of these two genes, BSL78_00022 encodes an enhancer-binding protein. One study showed that the enhancer-binding protein plays a key role in cell differentiation and cell proliferation (Umek Robert et al., 1991). In addition, a homolog of BSL78_00022, CTCF, is a highly conserved zinc finger protein, and it is involved in various regulatory functions including transcriptional activation/repression, insulation, and imprinting (Phillips and Corces, 2009; Ong and Corces, 2014). Therefore, we speculate that the BSL78_00022 gene plays a key role in the formation of A. japonicas parapodia. However, owing to the lack of experimental data to establish the link between this gene and the number of A. japonicas parapodia, its specific regulatory mechanism is still unclear.
In the association analysis of growth traits, six SNPs related to body weight and body wall weight pleiotropy were found in Scaffold MRZV01000113.1. The BSL78_04631 gene corresponding to these sites encodes the pre-mRNA-splicing regulator WTAP. WTAP has functions involving mRNA methylation, the spliceosome, and regulation of alternative mRNA splicing (Yang et al., 2015; Selberg et al., 2019), which also plays a role in promoting protein synthesis and cell growth (Villa et al., 2021). Therefore, we speculate that the BSL78_04631 gene plays a role in regulating the growth of A. japonicas. Meanwhile, we identified one LD block in Scaffold MRZV01000033.1 that was associated with the rate of body wall production rate. This block was completely contained in the BSL78_01694 gene, which was predicted to encode 28S ribosomal protein S36 and mitochondrial-like isoform X2. Ribosomal proteins are key proteins involved in the formation of ribosomes and are closely related to protein synthesis (Wilson and Nierhaus, 2005). Studies have shown that the body wall of A. japonicas. contains a large amount of collagen (Senadheera et al., 2020), and the gene BSL78_04694 is significantly correlated with the skin extraction rate of A. japonicas., which may indicate that it indirectly affects the collagen synthesis of the body wall of A. japonicas. by affecting the formation of ribosomes. In this study, other candidate genes associated with significantly related SNPs were also identified. However, because no gene transformation system has yet been established for A. japonicas, and some candidate genes have not been characterized, we could not determine the direct relationship between traits and gene functions within a short time. The data from this study provide a genetic basis for future gene function research and breeding of A. japonicas.
In this study, 254 Apostichopus japonicas individuals including the new species “AY-1” and six A. japonicas populations from major breeding areas of northern China were resequenced using high-throughput sequencing methods. The population structure analysis showed that the genetic diversity of A. japonicas was generally high and there was no difference in the population structure among the six cultured A. japonicas populations; they were divided into two subpopulations together with AY-1. The degree of linkage of alleles of the AY-1 population was high and this population was subject to more positive selection. In the population selection analysis, the selected intervals and genes of the AY-1 population were obtained, in which some of the candidate intervals were shown to be related to their economically important traits targeted by breeding, such as the number of parapodia. Functional analysis of the candidate genes showed that the two subpopulations had differences in terms of immune function, signal transduction, as well as protein synthesis, decomposition, activation, and transport. In the GWAS, 39 candidate genes for four economically important traits were obtained. Besides, we also verified the genes with non-synonymous SNPs; as a result, it was found that BSL78_00022 and BSL78_00023 are key genes for the number of parapodia in A. japonicas, and BSL78_04631 is a key gene associated with the growth traits of this species. This study provides new insights into the genetic structure of A. japonicas in northern China and important information for the subsequent genetic analysis and breeding of this species.
The animal study was reviewed and approved by Ethics Committee of Dalian Ocean University. Written informed consent was obtained from the owners for the participation of their animals in this study.
The original contributions presented in the study are included in the article/Supplementary Material. Further inquiries can be directed to the corresponding authors.
JD and YC conceived and designed the experiments. CG, YL, XZ, JX, JS, YW, and LH performed the experiments. CG analyzed the data. CG wrote the paper. All authors read and approved the manuscript. All authors contributed to the article and approved the submitted version.
This work was supported by The National Key Research and Development Program of China (SY2018YD0901600), The National Natural Science Foundation of China (31772849), Liaoning Higher School Innovation Team Support Program (LT2019003), Dalian High-level Talent Innovation Support Program Project in 2020 (2020RD03).
The authors declare that the research was conducted in the absence of any commercial or financial relationships that could be construed as a potential conflict of interest.
All claims expressed in this article are solely those of the authors and do not necessarily represent those of their affiliated organizations, or those of the publisher, the editors and the reviewers. Any product that may be evaluated in this article, or claim that may be made by its manufacturer, is not guaranteed or endorsed by the publisher.
This work was supported by The National Key Research and Development Program of China (SY2018YD0901600), The National Natural Science Foundation of China (31772849), Liaoning Higher School Innovation Team Support Program (LT2019003), Dalian High-level Talent Innovation Support Program Project in 2020 (2020RD03). We thank Liwen Bianji (Edanz) (www.liwenbianji.cn) for editing the language of a draft of this manuscript.
The Supplementary Material for this article can be found online at: https://www.frontiersin.org/articles/10.3389/fmars.2022.948882/full#supplementary-material
Abdelrahman H., ElHady M., Alcivar-Warren A., Allen S., Al-Tobasei R., Bao L., et al. (2017). Aquaculture Genomics, Genetics and Breeding in the United States: Current Status, Challenges, and Priorities for Future Research. BMC Genomics 18 (1), 191. doi: 10.1186/s12864-017-3557-1
Cádiz M. I., López M. E., Díaz-Domínguez D., Cáceres G., Yoshida G. M., Gomez-Uchida D., et al. (2020). Whole Genome Re-Sequencing Reveals Recent Signatures of Selection in Three Strains of Farmed Nile Tilapia (Oreochromis Niloticus). Sci. Rep. 10 (1), 11514. doi: 10.1038/s41598-020-68064-5
Chang Y., Feng Z., Yu J., Ding J. (2009). Genetic Variability Analysis in Five Populations of the Sea Cucumber Stichopus (Apostichopus) Japonicus From China, Russia, South Korea and Japan as Revealed by Microsatellite Markers. Mar. Ecol. 30 (4), 455–461. doi: 10.1111/j.1439-0485.2009.00292.x
Chen L., Li Q., Yang J. (2008). Microsatellite Genetic Variation in Wild and Hatchery Populations of the Sea Cucumber (Apostichopus Japonicus Selenka) From Northern China. Aquaculture. Res. 39 (14), 1541–1549. doi: 10.1111/j.1365-2109.2008.02027.x
Chen D., Zhang Q., Tang W., Huang Z., Wang G., Wang Y., et al. (2020). The Evolutionary Origin and Domestication History of Goldfish (Carassius Auratus). Proc. Natl. Acad. Sci. 117 (47), 29775. doi: 10.1073/pnas.2005545117
Cui Z., Hui M., Liu Y., Song C., Li X., Li Y., et al. (2015). High-Density Linkage Mapping Aided by Transcriptomics Documents ZW Sex Determination System in the Chinese Mitten Crab Eriocheir Sinensis. Heredity 115 (3), 206–215. doi: 10.1038/hdy.2015.26
Ding J., Chang Y. (2020). Advances in Conservation and Utilization of Echinodermata Germplasm Resources. J. Dalian. Ocean. Univ. 35 (5), 12. doi: 10.16535/j.cnki.dlhyxb.2020-157
Flint-Garcia S. A. (2013). Genetics and Consequences of Crop Domestication. J. Agric. Food Chem. 61 (35), 8267–8276. doi: 10.1021/jf305511d
Gao K., Wang Z., Qiu X., Song J., Wang H., Zhao C., et al. (2019). Transcriptome Analysis of Body Wall Reveals Growth Difference Between the Largest and Smallest Individuals in the Pure and Hybrid Populations of Apostichopus Japonicus. Comp. Biochem. Physiol. Part D: Genomics Proteomics 31, 100591. doi: 10.1016/j.cbd.2019.05.001
Han Q., Keesing J. K., Liu D. (2016). A Review of Sea Cucumber Aquaculture, Ranching, and Stock Enhancement in China. Rev. Fisheries. Sci. Aquaculture. 24 (4), 326–341. doi: 10.1080/23308249.2016.1193472
Hershey J. W. B., Monro R. E. (1966). A Competitive Inhibitor of the GTP Reaction in Protein Synthesis. J. Mol. Biol. 18 (1), 68–76. doi: 10.1016/S0022-2836(66)80077-3
He X., Wu F., Qi H., Meng J., Wang W., Liu M., et al. (2022). Whole-Genome Resequencing Reveals the Single Nucleotide Polymorphisms Associated With Shell Shape in Crassostrea Gigas. Aquaculture 547, 737502. doi: 10.1016/j.aquaculture.2021.737502
Hu B., Tian Y., Li Q., Liu S. (2022). Genomic Signatures of Artificial Selection in the Pacific Oyster, Crassostrea Gigas. Evolutionary. Appl. 15, 618–630. doi: 10.1111/eva.13286
Jones S., Litt R. J., Richardson C. J., Segev N. (1995). Requirement of Nucleotide Exchange Factor for Ypt1 GTPase Mediated Protein Transport. J. Cell Biol. 130 (5), 1051–1061. doi: 10.1083/jcb.130.5.1051
Kon T., Pei L., Ichikawa R., Chen C., Wang P., Takemura I., et al. (2021). Whole-Genome Resequencing of Large Yellow Croaker (Larimichthys Crocea) Reveals the Population Structure and Signatures of Environmental Adaptation. Sci. Rep. 11 (1), 11235. doi: 10.1038/s41598-021-90645-1
Li Y., Wang R., Xun X., Wang J., Bao L., Thimmappa R., et al. (2018). Sea Cucumber Genome Provides Insights Into Saponin Biosynthesis and Aestivation Regulation. Cell Discov. 4 (1), 29. doi: 10.1038/s41421-018-0030-5
Lyu D., Yu Y., Wang Q., Luo Z., Zhang Q., Zhang X., et al. (2021). Identification of Growth-Associated Genes by Genome-Wide Association Study (GWAS) and Their Potential Application in the Breeding of Pacific White Shrimp (Litopenaeus Vannamei). Front. Genet. 12, 465. doi: 10.3389/fgene.2021.611570
Narumiya S. (1996). The Small GTPase Rho: Cellular Functions and Signal Transduction. J. Biochem. 120 (2), 215–228. doi: 10.1093/oxfordjournals.jbchem.a021401
Nei M., Chesser R. K. (1983). Estimation of Fixation Indices and Gene Diversities. Ann. Hum. Genet. 47 (3), 253–259. doi: 10.1111/j.1469-1809.1983.tb00993.x
Ong C.-T., Corces V. G. (2014). CTCF: An Architectural Protein Bridging Genome Topology and Function. Nat. Rev. Genet. 15 (4), 234–246. doi: 10.1038/nrg3663
Phillips J. E., Corces V. G. (2009). CTCF: Master Weaver of the Genome. Cell 137 (7), 1194–1211. doi: 10.1016/j.cell.2009.06.001
Prezeworski M., Coop G., Wall J. D. (2005). The Signature Of Positive Selection On Standing Genetic Variation. Evolution 59 (11), 2312–2323. doi: 10.1111/j.0014-3820.2005.tb00941.x
Reif J. C., Zhang P., Dreisigacker S., Warburton M. L., van Ginkel M., Hoisington D., et al. (2005). Wheat Genetic Diversity Trends During Domestication and Breeding. Theor. Appl. Genet. 110 (5), 859–864. doi: 10.1007/s00122-004-1881-8
Ru X., Zhang L., Li X., Liu S., Yang H. (2019). Development Strategies for the Sea Cucumber Industry in China. J. Oceanology. Limnology. 37 (1), 300–312. doi: 10.1007/s00343-019-7344-5
Sahlin K., Tonkonogi M., Söderlund K. (1998). Energy Supply and Muscle Fatigue in Humans. Acta Physiological Scandinavical 162 (3), 261–266. doi: 10.1046/j.1365-201X.1998.0298f.x
Schimmel P. (1993). GTP Hydrolysis in Protein Synthesis: Two for Tu? Science 259, 1264. doi: 10.1126/science.8446896
Selberg S., Blokhina D., Aatonen M., Koivisto P., Siltanen A., Mervaala E., et al. (2019). Discovery of Small Molecules That Activate RNA Methylation Through Cooperative Binding to the METTL3-14-WTAP Complex Active Site. Cell Rep. 26 (13), 3762–3771.e3765. doi: 10.1016/j.celrep.2019.02.100
Senadheera T. R. L., Dave D., Shahidi F. (2020). Sea Cucumber Derived Type I Collagen: A Comprehensive Review. Mar. Drugs 18 (9), 471. doi: 10.3390/md18090471
Smýkal P., Nelson M. N., Berger J. D., Von Wettberg E. J. B. (2018). The Impact of Genetic Changes During Crop Domestication. Agronomy 8 (7). doi: 10.3390/agronomy8070119
Sonnante G., Stockton T., Nodari R. O., Becerra Velásquez V. L., Gepts P. (1994). Evolution of Genetic Diversity During the Domestication of Common-Bean (Phaseolus Vulgaris L.). Theor. Appl. Genet. 89 (5), 629–635. doi: 10.1007/BF00222458
Tajima F. (1989). Statistical Method for Testing the Neutral Mutation Hypothesis by DNA Polymorphism. Genetics 123 (3), 585–595. doi: 10.1093/genetics/123.3.585
Tam V., Patel N., Turcotte M., Bossé Y., Paré G., Meyre D. (2019). Benefits and Limitations of Genome-Wide Association Studies. Nat. Rev. Genet. 20 (8), 467–484. doi: 10.1038/s41576-019-0127-1
Turowski T. W., Tollervey D. (2016). Transcription by RNA Polymerase III: Insights Into Mechanism and Regulation. Biochem. Soc. Trans. 44 (5), 1367–1375. doi: 10.1042/BST20160062
Umek Robert M., Friedman Alan D., McKnight Steven L. (1991). CCAAT-Enhancer Binding Protein: A Component of a Differentiation Switch. Science 251 (4991), 288–292. doi: 10.1126/science.1987644
Villa E., Sahu U., O’Hara B. P., Ali E. S., Helmin K. A., Asara J. M., et al. (2021). Mtorc1 Stimulates Cell Growth Through SAM Synthesis and M6a mRNA-Dependent Control of Protein Synthesis. Mol. Cell 81 (10), 2076–2093.e2079. doi: 10.1016/j.molcel.2021.03.009
Wang H., Lv J., Zeng Q., Liu Y., Xing Q., Wang S., et al. (2021). Genetic Differentiation and Selection Signatures in Two Bay Scallop (Argopecten Irradians) Breeds Revealed by Whole-Genome Resequencing Analysis. Aquaculture 543, 736944. doi: 10.1016/j.aquaculture.2021.736944
Wang S., Wang H., Zhao L., Zhang Y., Li T., Liu S., et al. (2022). Identification of Genes Associated With Carotenoids Accumulation in Scallop (Patinopecten Yessoensis). Aquaculture 550, 737850. doi: 10.1016/j.aquaculture.2021.737850
Wilson D. N., Nierhaus K. H. (2005). Ribosomal Proteins in the Spotlight. Crit. Rev. Biochem. Mol. Biol. 40 (5), 243–267. doi: 10.1080/10409230500256523
Xu D., Su L., Zhao P. (2015). Apostichopus Japonicus in the Worldwide Production and Trade of Sea Cucumbers. Developments. Aquaculture. Fisheries. Sci. 2015 (39), 383–398.
Yang Y., Sun B.-F., Xiao W., Yang X., Sun H.-Y., Zhao Y.-L., et al. (2015). Dynamic M6a Modification and its Emerging Regulatory Role in mRNA Splicing. Sci. Bull. 60 (1), 21–32. doi: 10.1007/s11434-014-0695-6
Yang Y., Wu L., Wu X., Li B., Huang W., Weng Z., et al. (2020). Identification of Candidate Growth-Related SNPs and Genes Using GWAS in Brown-Marbled Grouper (Epinephelus Fuscoguttatus). Mar. Biotechnol. 22 (2), 153–166. doi: 10.1007/s10126-019-09940-8
Zhang X., Sun L., Yuan J., Sun Y., Gao Y., Zhang L., et al. (2017). The Sea Cucumber Genome Provides Insights Into Morphological Evolution and Visceral Regeneration. PloS Biol. 15 (10), e2003790. doi: 10.1371/journal.pbio.2003790
Zhao G., Zhao W., Han L., Ding J., Chang Y. (2020). Metabolomics Analysis of Sea Cucumber (Apostichopus Japonicus) in Different Geographical Origins Using UPLC–Q-TOF/MS. Food Chem. 333, 127453. doi: 10.1016/j.foodchem.2020.127453
Keywords: Apostichopus japonicas, resequencing, genome-wide association analysis, population structure, population genetics
Citation: Guo C, Li Y, Xie J, Han L, Wang Y, Zhang X, Wu Y, Song J, Chang Y and Ding J (2022) Revealing Selection in Breeding and Genetic Characteristics of Economically Important Traits of New Species of Apostichopus Japonicas Based on Genome Resequencing and GWAS Analysis. Front. Mar. Sci. 9:948882. doi: 10.3389/fmars.2022.948882
Received: 20 May 2022; Accepted: 03 June 2022;
Published: 12 July 2022.
Edited by:
Bin Xia, Qingdao Agricultural University, ChinaReviewed by:
Lina Sun, Chinese Academy of Sciences (CAS), ChinaCopyright © 2022 Guo, Li, Xie, Han, Wang, Zhang, Wu, Song, Chang and Ding. This is an open-access article distributed under the terms of the Creative Commons Attribution License (CC BY). The use, distribution or reproduction in other forums is permitted, provided the original author(s) and the copyright owner(s) are credited and that the original publication in this journal is cited, in accordance with accepted academic practice. No use, distribution or reproduction is permitted which does not comply with these terms.
*Correspondence: Jun Ding, ZGluZ2p1bjE5NzMxMTE5QGhvdG1haWwuY29t; Yaqing Chang, eXFjaGFuZ0BkbG91LmVkdS5jbg==
Disclaimer: All claims expressed in this article are solely those of the authors and do not necessarily represent those of their affiliated organizations, or those of the publisher, the editors and the reviewers. Any product that may be evaluated in this article or claim that may be made by its manufacturer is not guaranteed or endorsed by the publisher.
Research integrity at Frontiers
Learn more about the work of our research integrity team to safeguard the quality of each article we publish.