 Gyundo Pak
 Joocheul Noh
 Young-Gyu Park
 Hyunkeun Jin
 Jae-Hyoung Park
95% of researchers rate our articles as excellent or good
Learn more about the work of our research integrity team to safeguard the quality of each article we publish.
Find out more
ORIGINAL RESEARCH article
Front. Mar. Sci. , 08 August 2022
Sec. Physical Oceanography
Volume 9 - 2022 | https://doi.org/10.3389/fmars.2022.946767
This article is part of the Research Topic Air-Sea Interaction and Oceanic Extremes View all 31 articles
During July of 2021, the sea surface temperature of the mid-latitude western North Pacific had increased by five degrees over 10 days. This high temperature was maintained for approximately a month before it disappeared rapidly in approximately five days. The underlying mechanisms of this unprecedented marine heatwave event have not yet been researched through a quantitative approach. The development and decay processes of the marine heatwave event were investigated using heat budget analysis and one-dimensional modeling. In mid-July, an anomalous high-pressure atmospheric circulation, affecting to the reduced cloud coverage and increased solar radiation, anchored where the marine heatwave occurred. The increased solar radiation accompanied by the weakened wind reduced the vertical mixing and resulted in a thinner mixed-layer, which accelerated the sea surface warming. The impact of reduced mixing is as important as the increase in solar radiation. In mid-August, typhoon-induced entrainment mainly caused sea surface cooling. The wind-driven mechanical mixing between warm surface water and cooler subsurface water lowered the SST. Additionally, evaporative cooling by strong winds, which drives buoyancy-driven vertical mixing, contributed to the decay of the MHW. The effect of mechanical mixing on cooling is comparable to that of buoyancy-driven mixing.
Marine heatwaves (MHW) describe the anomalous sea surface temperature (SST) that may persist for days to months (MHWs; Hobday et al., 2016). Due to the anomalous thermal conditions, its impact expands to marine ecosystems and causes devastating damages to economics and society, e.g., coral bleaching, harmful algal blooms, and massive mortality of not only oceanic, but also terrestrial species (Le Nohaïc et al., 2017; Jones et al., 2018; Roberts et al., 2019; Le et al., 2020). MHWs have been observed globally, not only in the coastal area but also in the open sea (Olita et al., 2007; Pearce and Feng, 2013; Dzwonkowski et al., 2020; Park et al., 2021). Owing to global warming, the duration and intensity of MHWs have been and will continue to increase (Hobday et al., 2018; Oliver et al., 2018; Plecha and Soares, 2020). Under the circumstance, a better understanding of the mechanism of MHW is essential for the improved preparation and prevention of the damages from MHWs.
Many studies were conducted to understand the structures and governing processes of MHWs. Thus far, MHWs are thought to be driven not only by large-scale climatic forcings, such as El Niño, Pacific Decadal Oscillation, and Atlantic Multi-decadal Oscillation (Oliver et al., 2018), but also by local or regional atmospheric and oceanic processes, such as enhanced solar heating due to stagnant high-pressure systems, warm advection, and reduced vertical mixing between sub-and surface layers. (Moisan and Niiler, 1998; Miyama et al., 2021; Oliver et al., 2021; Mawren et al., 2022).
In mid-July 2021, the SST over the mid-latitude western North Pacific region (35–55°N and 130–180°E) started to rise rapidly. Over ten days, the SST increased by approximately 2–5°C (Figure 1A), and the warm state was maintained for a month. The MHW in the concerned area abruptly disappeared in about five days in mid-August. To date, this open ocean MHW is record-breaking in terms of its extent, magnitude, and time scales.
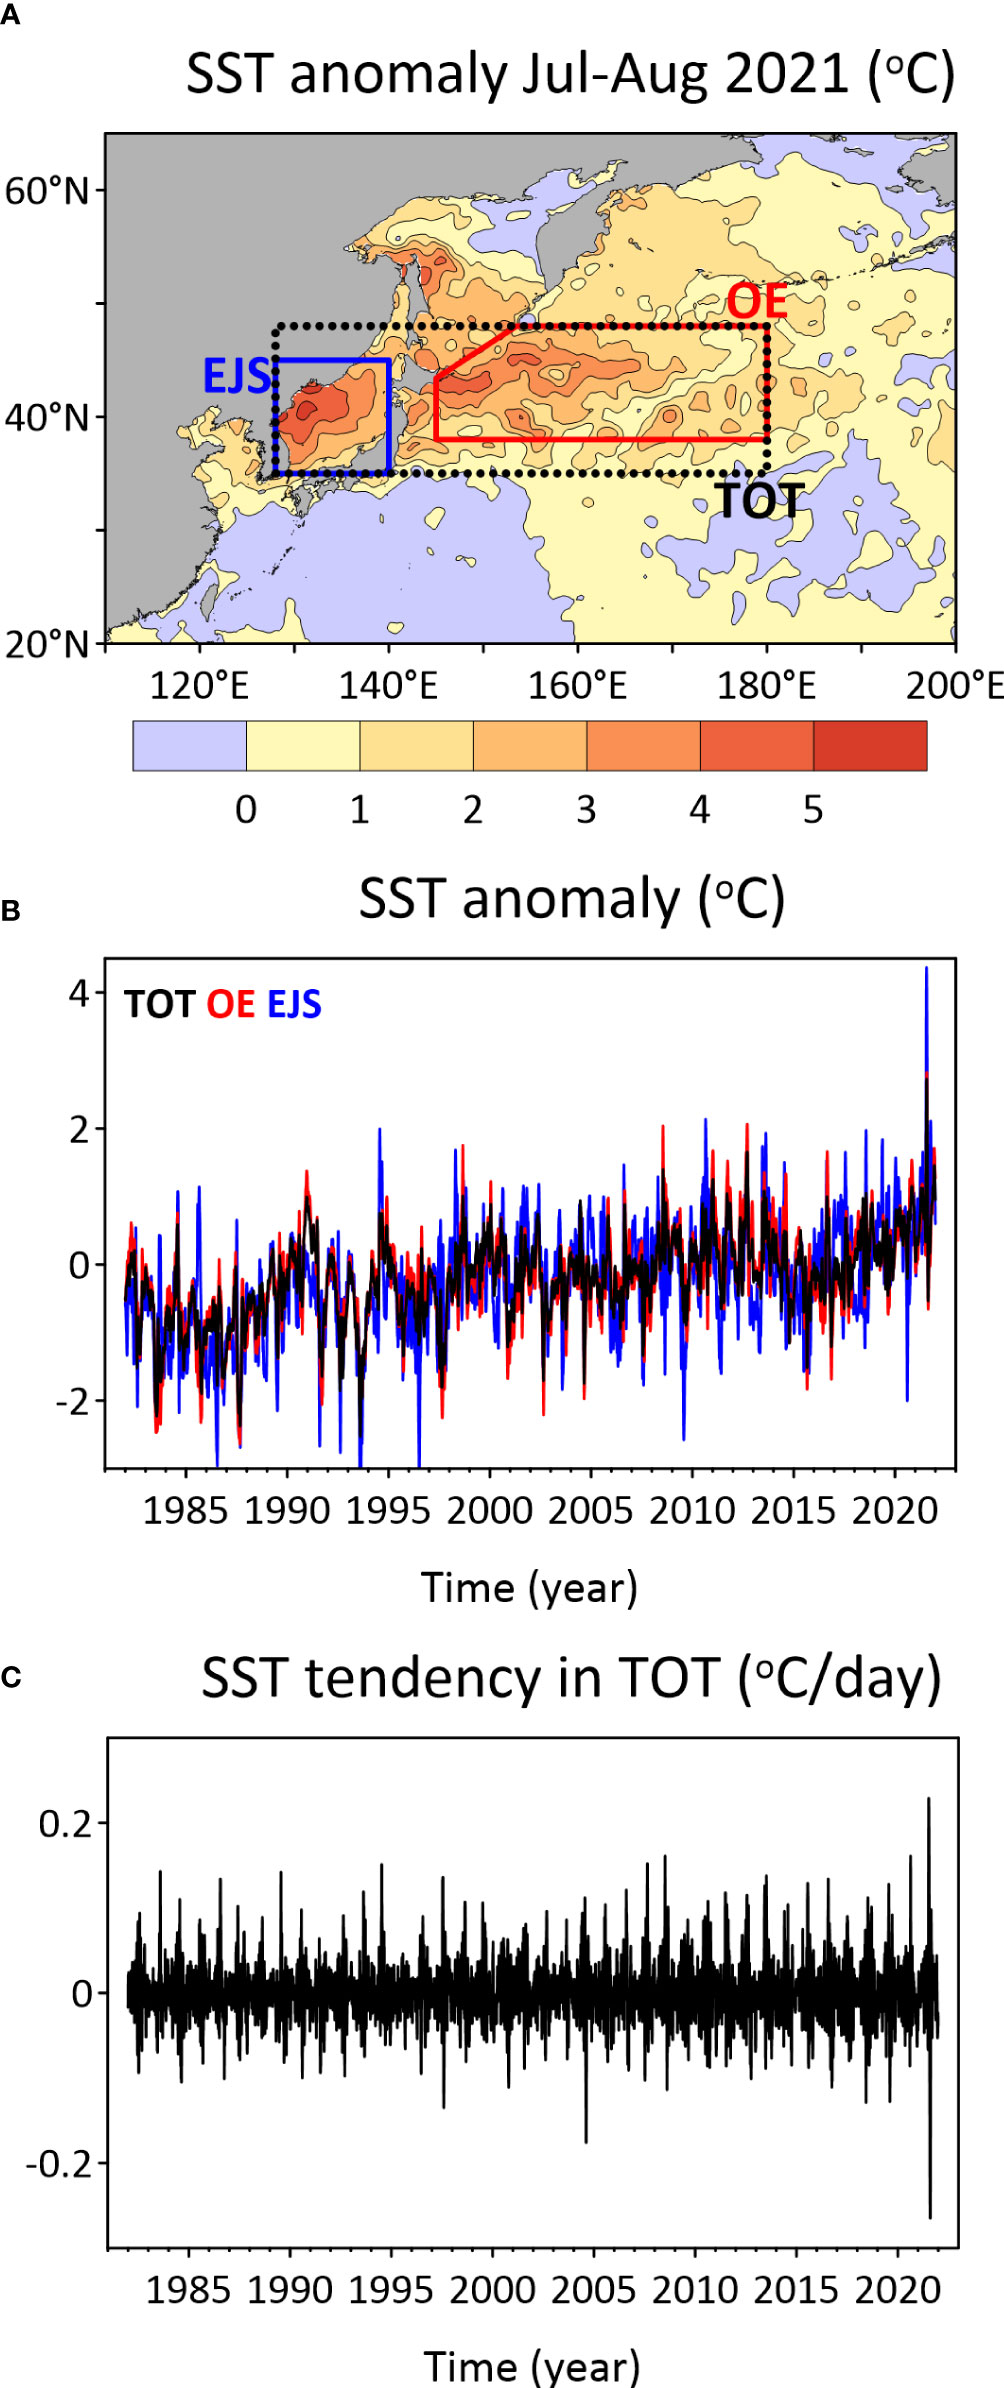
Figure 1 (A) Spatial map depicting the distribution of the sea surface temperature (SST) anomaly during July 16–August 15 2021, relative to the climatology of 2001–2020, overlaying with the total (TOT) mid-latitude in the western North Pacific (black dotted box), Oyashio Extension (OE; red box), and East/Japan Sea (EJS; blue box) regions. (B) Time series of the 11-day moving average of the SST anomaly in TOT (black), OE (red), and EJS (blue) regions. (C) Time series of SST tendency obtained from the 11-day moving average of the SST in TOT.
Brief mechanisms of the MHW were introduced in a previous study from large-scale forces to the local process (Kuroda and Setou, 2021). In early July 2021, the North Pacific subtropical high expanded northwestward, and the westerly jet shifted northward. These atmospheric changes induced a positive net heat flux, and the MHW developed. The change also weakened the wind resulting in a thinner mixed-layer (or the upper ocean more stratified) and consequently accelerated the SST increase. Additionally, concerning the decay of the MHW, which was more rapid than the development, they suggested that atmospheric cooling and enhanced wind mixing were responsible. To better understand this phenomenon, however, further quantitative clarification of the governing factors is required. The relative contribution of the net heat flux, ocean vertical mixing, and advection on the SST change need to be revealed. Also, it is noteworthy that the strength of stratification near the surface, which is inversely proportional to the vertical mixing, can be increased by surface heat flux and reduced wind stress. Thus, the portions of surface heat flux (i.e. buoyancy-driven mixing) and wind stress (i.e. mechanical mixing) on the surface stratification should be studied to better understand the development and decay of such MHWs.
The objective of this study is to quantify the mechanisms of the unprecedented warming and cooling during the MHW period in the summer of 2021. We suggest possible dynamics from the analysis of environmental conditions. Subsequently, we compare the portions of heat flux, horizontal advection, and ocean vertical mixing that contribute to the abrupt near-surface temperature warming and cooling by conducting a heat budget analysis. The contributions of mechanical mixing and buoyancy-driven mixing to the temperature change were quantitatively examined using a one-dimensional ocean mixed-layer model.
Version 2 of the daily high-resolution (1/4°) blended SST analysis based on optimal interpolation (OISST, Reynolds et al., 2007) during 1982–2021 was used to investigate the 2021 MHW event in the western North Pacific. The climatology for 2001–2020 was used as a baseline to show the MHW event, considering recent warming trends. The anomaly is the deviation from the climatology unless stated otherwise. As satellite-based OISST does not provide subsurface structures, we used daily three-dimensional 1/12° ocean temperatures and currents from the global ocean reanalysis, widely known as GLORYS12 (Jean-Michel et al., 2021), and operational analysis provided by the Copernicus Marine Environment Monitoring Service (https://marine.copernicus.eu). Both products are provided on the same grid system. The vertical grid spacing is about 1 m at the surface and about 15 m at the vicinity of the 100 m depth. Considering the time coverage of the model data, the reanalysis and analysis were merged temporally with the periods of 2001–2018 and 2019–2021, respectively. For convenience, this merged data is hereafter referred to as GLORYS. The choice of the periods of the reanalysis and analysis data sets does not significantly affect the robustness of the results.
Meteorological variables, such as the heat flux, geopotential height, total cloud cover, and 10-m wind speed were used to investigate the mechanisms of the MHW. Data for these variables were obtained from hourly data of ERA5 reanalysis (Hersbach et al., 2020) from the European Centre for Medium-Range Weather Forecast. Considering the time interval of the oceanic data, the daily averages of atmospheric reanalysis were used in this study. The best track of Typhoon Mirinae for August 03–11, 2021, was obtained from the Regional Specialized Meteorological Center of the Japan Meteorological Agency (https://www.jma.go.jp).
Heat budget analyses were conducted to investigate the mechanisms of MHW in the western North Pacific during the summer of 2021. The budget equation can be derived from the ocean temperature equation (Pak et al., 2017). The governing equation for the ocean temperature in z-level coordinates is
where T is the ocean potential temperature, q is radiative heating, and u (u, v) and w are the horizontal and vertical velocities, respectively. Here, we assume a constant specific heat (cp = 3,850 J Kg-1 °C-1) and vertical eddy diffusivity (Kv = 10-4 m2 s-1). The constant Kv was come from the global averaged vertical eddy diffusivity (Talley et al., 2011). We used a constant potential density (ρo = 1,024 kg m-3) because it varied within almost 2% of the study region.
Taking the vertical integral of Equation (1) from time-dependent depth h to the surface based on earlier studies (Stevenson and Niiler, 1983; Qiu and Kelly, 1993; Vivier et al., 2002; Dong et al., 2007; Kelly et al., 2007), we obtain
where Tm and um are depth-averaged T and u, respectively, from depth h to the surface; the prime (′) indicates deviation from the depth-averaged values; and T-h, u-h, and w-h are those at depth h. Qnet is the net surface heat flux, the sum of the shortwave radiation, longwave radiation, latent heat flux, and sensible heat flux. Qz is the shortwave radiation penetrating below h. Jerlov water type I was used to obtain the attenuation curve of shortwave radiation (Paulson and Simpson, 1977).
Dividing Equation (2) by h and neglecting convergence of small perturbation term , the depth-averaged temperature tendency equation is as follows:
where is the entrainment velocity, which is the sum of temporal change of MLD, lateral induction, and vertical advection effect (Kim et al., 2006).
Equation (3), which is very similar to the budget equation of Vijith et al. (2020), states that the tendency of temperature over layer h is the sum of the effects of the surface net heat flux (Q), horizontal advection of depth-averaged T and u (HADV), entrainment and detrainment (ENT), and ocean vertical mixing at depth h (VMIX). Here, h is defined as the mixed-layer depth (MLD), where the temperature is 2°C different from the surface instead of using the classical MLD criteria (De Boyer Montégut et al., 2004). With the classical criteria, the temporal variability of MLD is too small that ENT cannot be properly estimated in summer. Our MLD criteria can well resolve the temporal change of upper-layer thermal condition and this MLD will better represent the surface stratification. The use of our MLD criteria is justified by a good agreement between the temporal variability of the mixed-layer temperature (MLT) and SST tendency (see Section 4.1).
In the study region, the lateral induction and vertical advection components of the ENT have negligible impact to the MLT tendency (Kim et al., 2006). Thus, we only considered the effect of the temporal change of MLD among the components of the entrainment velocity. Following the budget closure of Kim et al. (2006), when calculating ENT, not only the entrainment but also detrainment effects were regarded. As VMIX is relatively smaller than ENT, VMIX is added with ENT to be regarded as a term related to ocean vertical mixing (OVMIX).
The final form of the tendency equation for the mixed-layer becomes
where MLT tendency is the temporal change in the MLT. We refer to the residual of Equation (4) as Res.
The Price-Weller-Pinkel (PWP) mixed-layer model (Price et al., 1986) was used to identify the main drivers of the MHW in the summer of 2021. The PWP model is a simple one-dimensional model that predicts the vertical structure of the upper ocean based on the local air-sea fluxes of heat, freshwater, and momentum. Because the contribution of salinity effect on the MLD is much weaker than that of temperature effect in most of the western North Pacific (De Boyer Montégut et al., 2007; Kido et al., 2021), we neglect the salinity equation from the PWP model. Thus, the model equations are as follows:
where ρ is the variable seawater density when the salinity is 34 psu, and f is the Coriolis parameter at 40°N and k is the unit vector in the vertical direction. F and G represent the heat and momentum fluxes, respectively. We also used the same attenuation curve of shortwave radiation as in the heat budget equation. The momentum flux is applied in the form of a body force uniformly at the mixing layer depth (hρ), defined as the layer with a small density gradient (∂ρ/∂z < 10-3 kg m-4), which indicates the bottom of the active convection (Brainerd and Gregg, 1995). The momentum flux and wind stress (τ) are estimated as follows:
where ρa is the air density (1.22 kg m-3) and CD is a constant drag coefficient (1.3 × 10⁻³). U10 is the daily wind speed at 10 m.
To account for the effect of heat and wind-induced mixing, vertical mixing was additionally applied with parameterization based on the density gradient and Richardson numbers. We have three thresholds for stable conditions, as follows:
where g is constant gravity (9.8 m s-2) and Δ denotes the difference between the mixed-layer and the layer just beneath. Rib, Rig, and Ric are the bulk, gradient, and critical Richardson number, respectively. When each parameter exceeds the threshold, as shown in Equations (9–11), the buoyancy and momentum are iteratively redistributed until they are stable. The mixing process in Equation (9) parameterizes free convection by surface cooling, and those in Equations (10) and (11) represent the parameterization of wind-driven entrainment and shear instability, respectively. We used period-dependent Ric because it depends on ocean conditions (Canuto, 1998; Mack and Schoeberlein, 2004; Galperin et al., 2007). For July 2021, when the stratification evolved, classical Ric (0.25) was used, assuming a linear stable-stratified shear flow (Howard, 1961; Miles, 1961). For August 2021, when the stratification was weakened, it was assumed that all shear energy was converted to potential energy (Bye, 1988; Canuto, 1998), and thus large Ric (1.5) was used.
The model was set to 0–300 m at a 1-m vertical resolution and integrated with one-day intervals. The daily heat flux components and U10 were obtained from the ERA5. Detailed descriptions of the numerical experiments, including the initial conditions and experimental settings, are provided in Section 4.2.
The oceanic conditions of the MHW in the western North Pacific in the summer of 2021 were first reported by Kuroda and Setou (2021). Additionally, these authors investigated the relevant atmospheric circulation patterns during the development and decay of MHW. In this section, we will revisit the structure of the MHW to provide basic information for quantitative analysis.
The western North Pacific experienced an unprecedented hot summer in 2021, as indicated by the summer SST anomaly (Figure 1A). A positive anomalous summer SST pattern was observed in the mid-latitude (35–50°N) regions. The maximum positive SST anomaly was detected in the northwestern part of the East/Japan Sea (EJS). Furthermore, the Oyashio Extension (OE) and southern part of the Okhotsk Sea show a high SST anomaly during this period. The time series of the 11-day moving average of the SST anomaly indicates that the MHW developed in the summer of 2021, lasted for approximately a month with the highest SST ever, and then rapidly retreated (Figure 1B). The maximum SST anomaly exceeds 2.7°C, 2.8°C, and 4.3°C at the averaged of the total mid-latitude in the western North Pacific (TOT, denoted in Figure 1A), OE, and EJS, respectively. This finding is consistent with that of Kuroda and Setou (2021) who first reported this MHW event with other datasets. All the time series of area-averaged SST anomalies in the EJS and OE, as well as the TOT, show similar rapid warming and cooling characteristics in the summer of 2021. As the MHW was rapidly and almost simultaneously developed and then abruptly decayed over the large area of the western North Pacific, we used the TOT region to analyze temporal surface thermal variability. The SST tendency during the warming and cooling periods are also unprecedentedly strong (Figure 1C).
On closer examination of the summer SST time series (Figure 2), an MHW with a much higher SST than the climatology was observed between mid-July and mid-August 2021 (Figure 2A). Subsequently, SST abruptly drops by more than one standard deviation beneath the climatological mean. Particularly, SST increased rapidly from July 11 to 20 and dropped from August 7 to 14 in 2021. We refer to these periods as warming and cooling periods, respectively. The time series of the SST tendency also clearly shows warming and cooling periods (Figure 2B). Although the temporal variability of SST tendency from GLORYS contains short-term variability and cooling is more intense in a shorter period (Figures 2C, D), it is generally similar to that from OISST (Figures 2A, B). The overall good agreement between GLORYS and OISST justified the use of GLORYS in subsequent analyses.
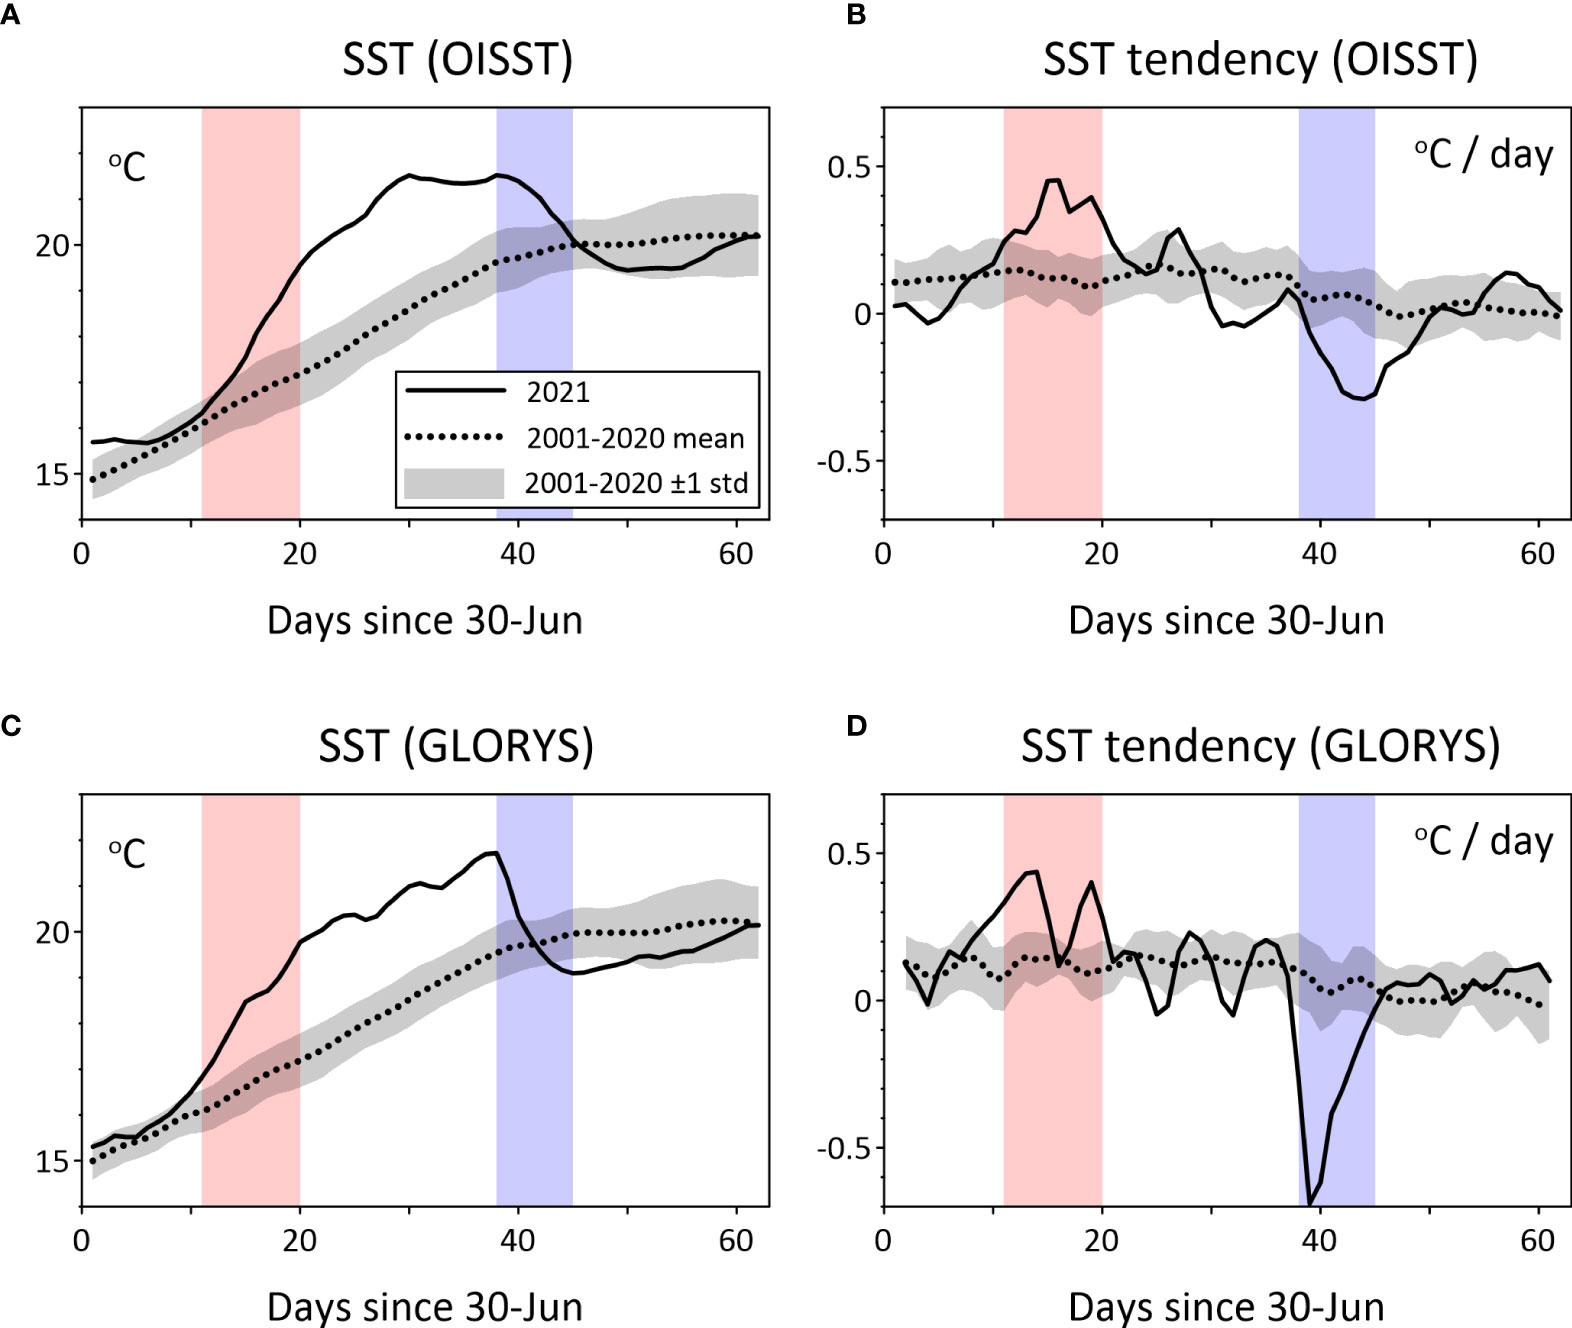
Figure 2 Time series plots of (A, C) sea surface temperature (SST) and (B, D) SST tendency in the total (TOT) mid-latitude in the western North Pacific region for 2021 (solid line), climatology for 2001–2020 (dotted line), and its typical interannual variability estimated using one standard deviation (gray shading) from the (A, B) OISST and (C, D) GLORYS. The periods of rapid warming and cooling are indicated by red and blue shadings, respectively.
The MHW that quickly developed over a large area of the western North Pacific and retreated rapidly in the summer of 2021 is formed likely due to air–sea interactions rather than ocean dynamics. Hence, changes in surface heat flux and ocean surface stratification can be considered as the causes of warming and cooling of SST. We will examine how heat flux and stratification can induce drastic changes in SST.
During summer, the surface net heat flux acts as a source of heat for the western North Pacific (Kwon et al., 2010; Pak et al., 2017). It is reported that the reduced release of latent heat flux and sensible heat flux is important for many MHW events (Sen Gupta et al., 2020; Schlegel et al., 2021). This is mainly due to weak wind stress and a warm atmosphere overlying the ocean surface. In addition, increased shortwave radiation is also reported as a major cause of MHW (Liu et al., 2022).
A significant incoming net heat flux compared to the climatology was detected during the warming period, and a negative heat flux anomaly relative to the climatology occurred during the cooling period (Figure 3). This is consistent with the SST variability in the summer of 2021, which indicated that the changes in heat flux can qualitatively explain rapid warming and cooling. Decomposition of the surface heat flux shows that shortwave radiation contributes to most of the positive net heat flux anomalies during the warming period. This implies that the MHW event developed probably because of the increased shortwave radiation. On the other hand, latent heat flux was mostly responsible for the strong negative heat flux anomaly during the cooling period. This suggests the possibility that the latent heat flux contributes significantly on the SST drop. Additionally, shortwave radiation decreased below one standard deviation from the climatology during the cooling period. Longwave radiation and sensible heat flux did not significantly contribute to the anomalous net heat flux during the entire analysis period. Therefore, we focused on shortwave radiation and latent heat flux among the components of the surface heat flux in subsequent analyses.
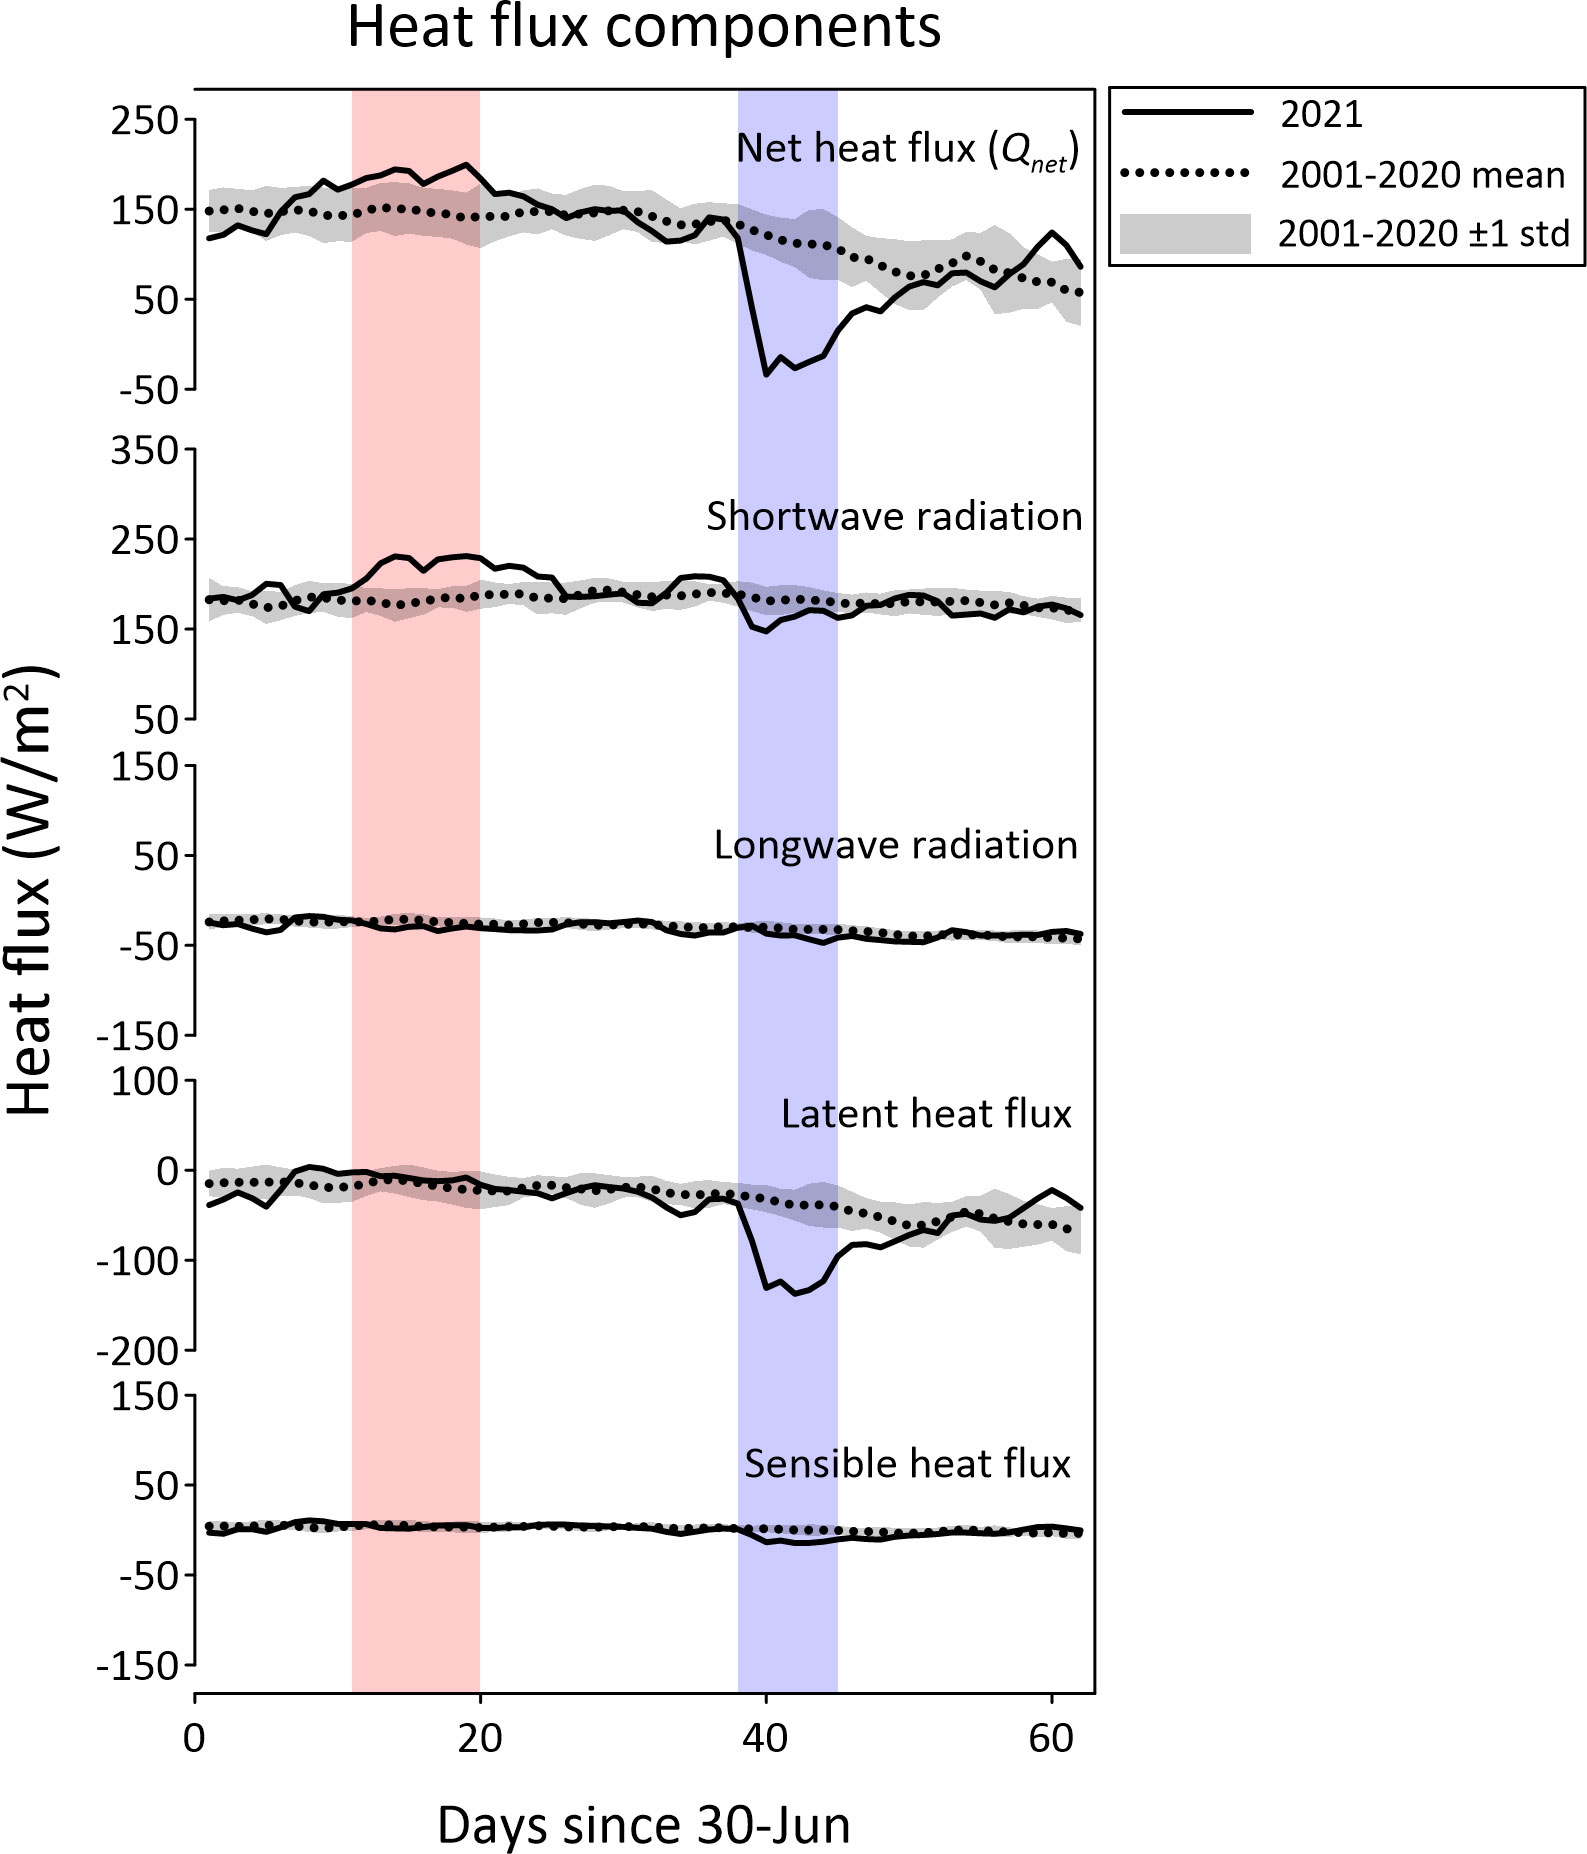
Figure 3 Time series plots of the surface net heat flux and its components in the total (TOT) mid-latitude in the western North Pacific region for 2021 (solid line), climatology for 2001–2020 (dotted line), and its typical interannual variability estimated using one standard deviation. Positive indicates downward flux.
Intensified surface stratification enhance the MHWs (Holbrook et al., 2019). The heating of the ocean surface further stratifies the vertical structure of the ocean by reducing the density of the surface, which causes more intense surface heating. Contrastingly, the cooling of the surface increases the density of the surface water and breaks the stratification, resulting in deepening of the MLD (i.e., buoyancy-driven mixing). The changes in vertical mixing due to surface wind stress can also play a similar role on the SST by creating a difference in ocean stratification (i.e., mechanical mixing).
Here, the ocean surface stratification is represented by the MLD because our MLD represents well the vertical gradient of temperature, thus that of density. A shallower (deeper) MLD implies a stronger (weaker) surface stratification. Therefore, SST and MLD were negatively correlated with each other. In most areas north of 35°N, the correlation between the daily time series of SST and MLD for July–August 2021 was significantly negative (Figure 4A). In the TOT region (Figure 4B), the MLD was especially shallow during the MHW period (15 July–10 August). This negative correlation between SST and MLD does not necessarily indicate that the SST increase is influenced by the strengthening of surface stratification. However, it shows that surface stratification and SST are strongly related.
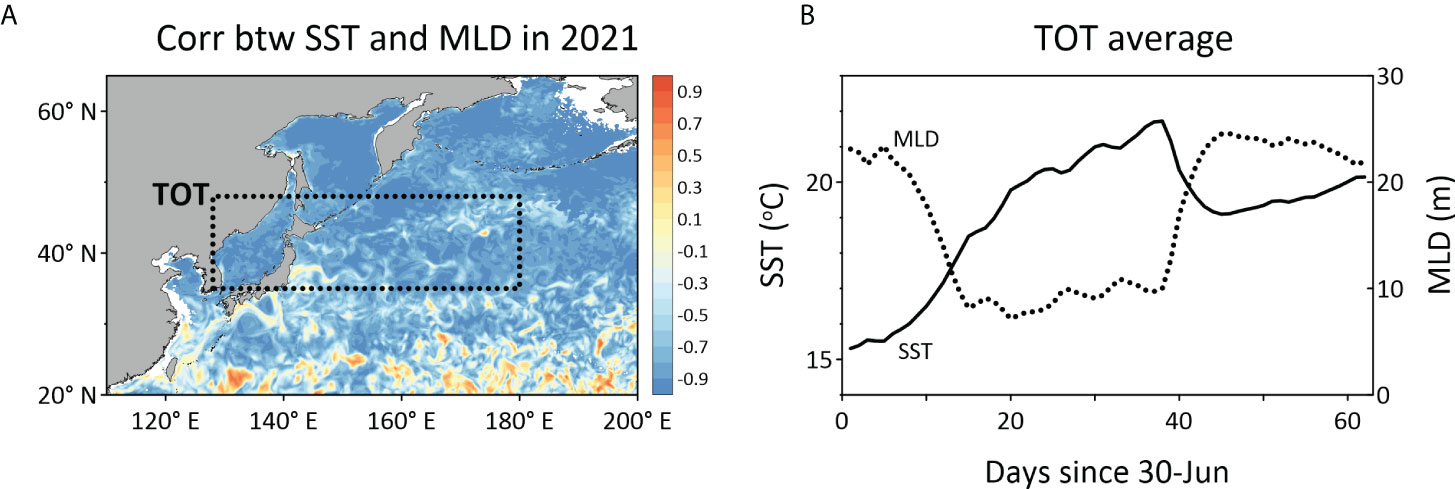
Figure 4 (A) Spatial map showing the distribution of correlation between the daily sea surface temperature (SST) and mixed-layer depth (MLD) during July–August 2021. (B) Time series plot of SST and MLD in the total (TOT) mid-latitude in the western North Pacific region.
Surface stratification is mostly controlled by buoyancy-driven and mechanical mixings. Therefore, we investigated the environmental variables involved in the change of surface heat flux and wind during the warming and cooling periods to understand the cause of the development and decay of the MHW in the western North Pacific in subsequent analyses.
During the warming period, an anomalous high-pressure atmospheric circulation pattern was observed over the mid-latitude western North Pacific (Figure 5A). There are two separate centers of the high-pressure anomaly in the EJS and central North Pacific regions. The total cloud cover was also reduced in relation to anomalous high-pressure circulation patterns. Negative total cloud cover anomalies were detected in the EJS, and there was also a band of negative total cloud cover anomaly over 30°–40°N in the North Pacific (Figure 5B). The reduction in total cloud cover resulted in an increase in surface shortwave radiation (Figure 5C). This heat flux increase may directly influence the increase in SST and cause strengthening of the surface stratification (Figure 5E), which can also accelerate the SST increase. Alternatively, the weakening of the surface wind may have influenced the strong surface stratification during the warming period (Figure 5D). Therefore, the environmental conditions favor the increase in SST in the western North Pacific during the warming period (Figure 5F).
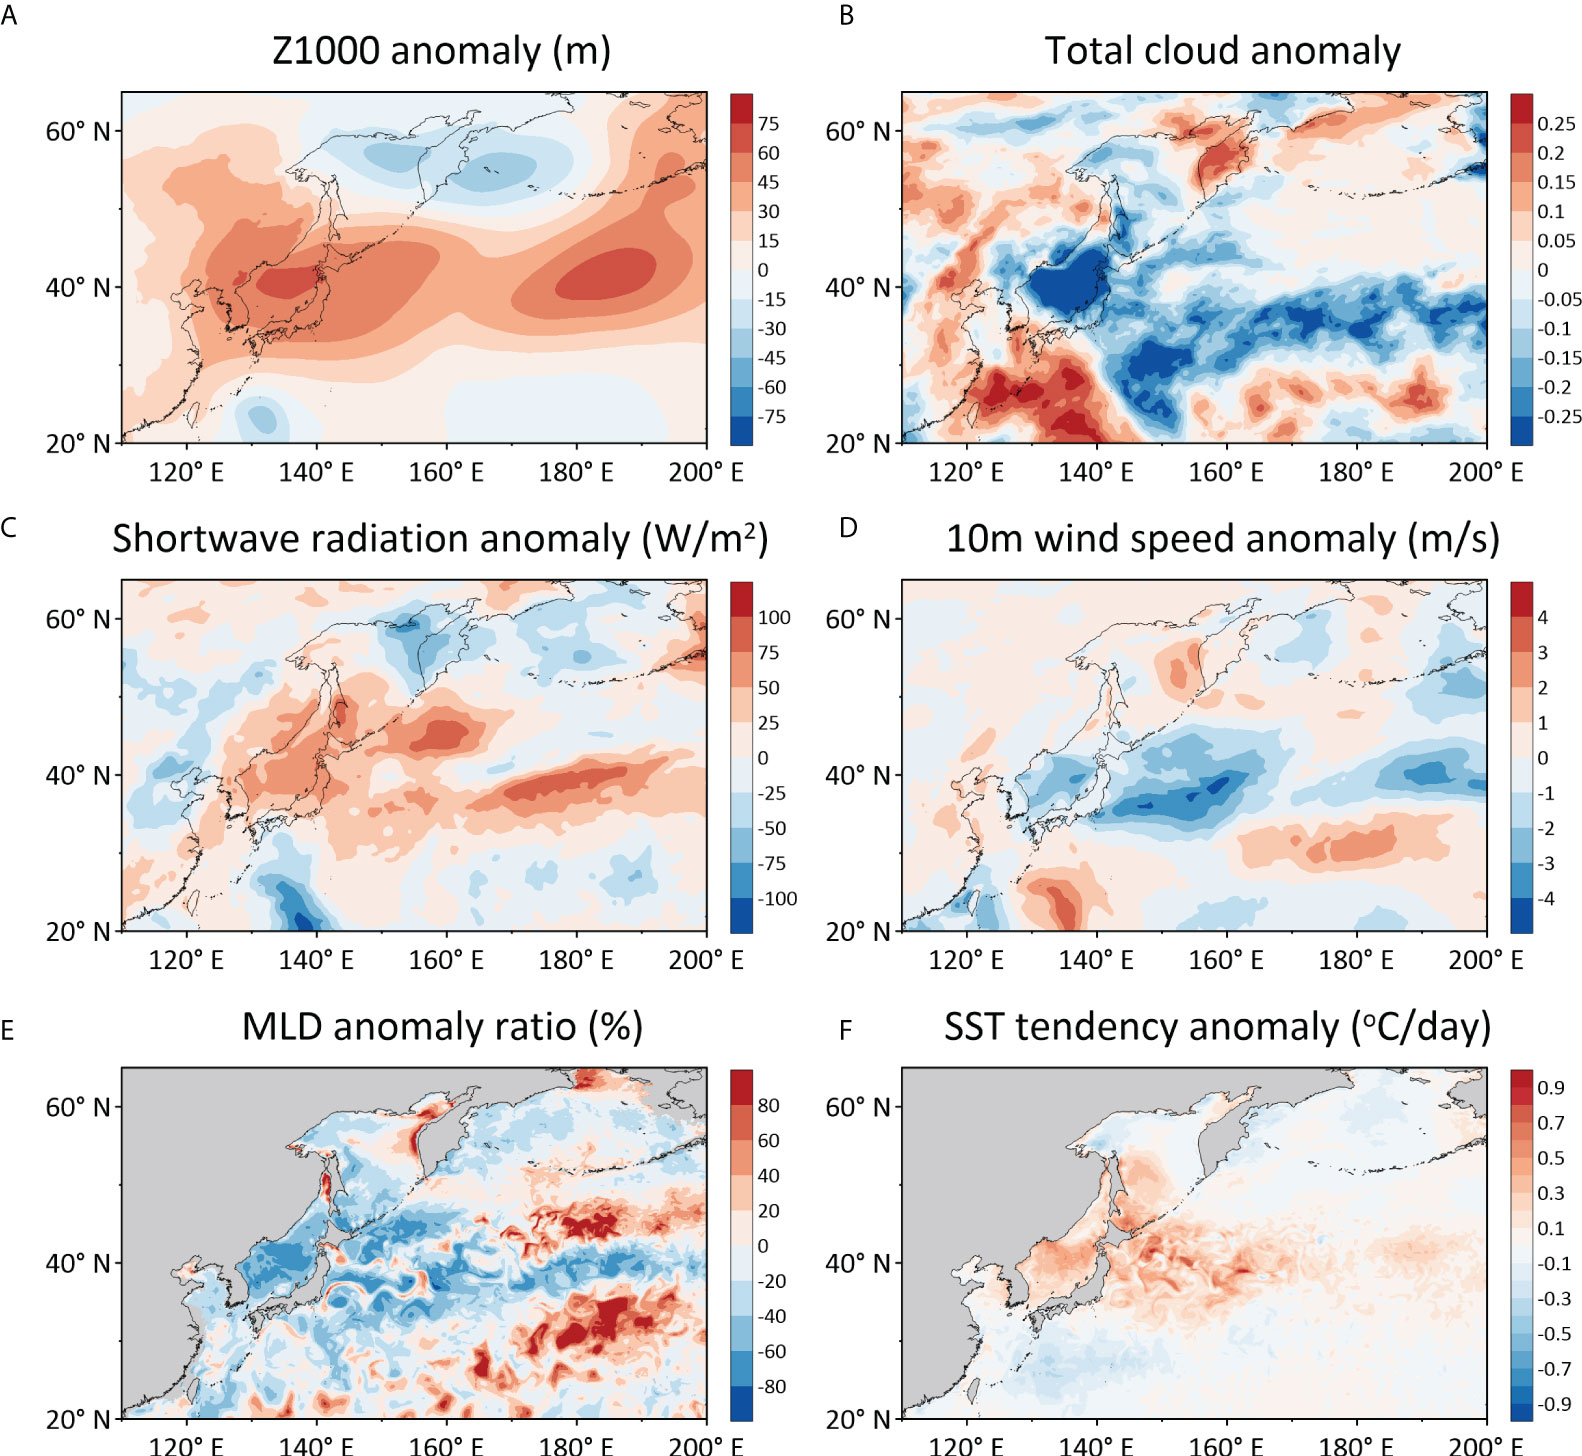
Figure 5 Spatial maps depicting the distribution of the (A) geopotential height at 1,000 hPa (Z1000) anomaly, (B) total cloud cover anomaly, (C) shortwave radiation anomaly, (D) 10-m wind speed anomaly, (E) ratio of the mixed-layer depth (MLD) anomaly to climatological MLD, and (F) sea surface temperature (SST) tendency anomaly during the warming period of 2021 relative to 2001–2020.
During the cooling period, the latent heat flux probably acted in cooling the SST (Figure 3B). Several days before the cooling period, Typhoon Mirinae passed east of Japan causing strong anomalous surface winds in the western North Pacific region (Figure 6A). The decrease in shortwave radiation during the cooling period (Figure 3) is also explained by the typhoon event because the cloud cover would be increased along the typhoon track. This typhoon-related strong wind occurs the strong latent heat flux release (Figure 6B), which can cause a drop in SST. The buoyancy-driven vertical mixing by the latent heat flux, as well as the mechanical mixing due to the strong wind itself (Figure 6A), may deepen the surface mixed-layer (Figure 6C). Therefore, both buoyancy-driven and mechanical mixings favored in inducing a rapid decrease in SST during the cooling period (Figure 6D).
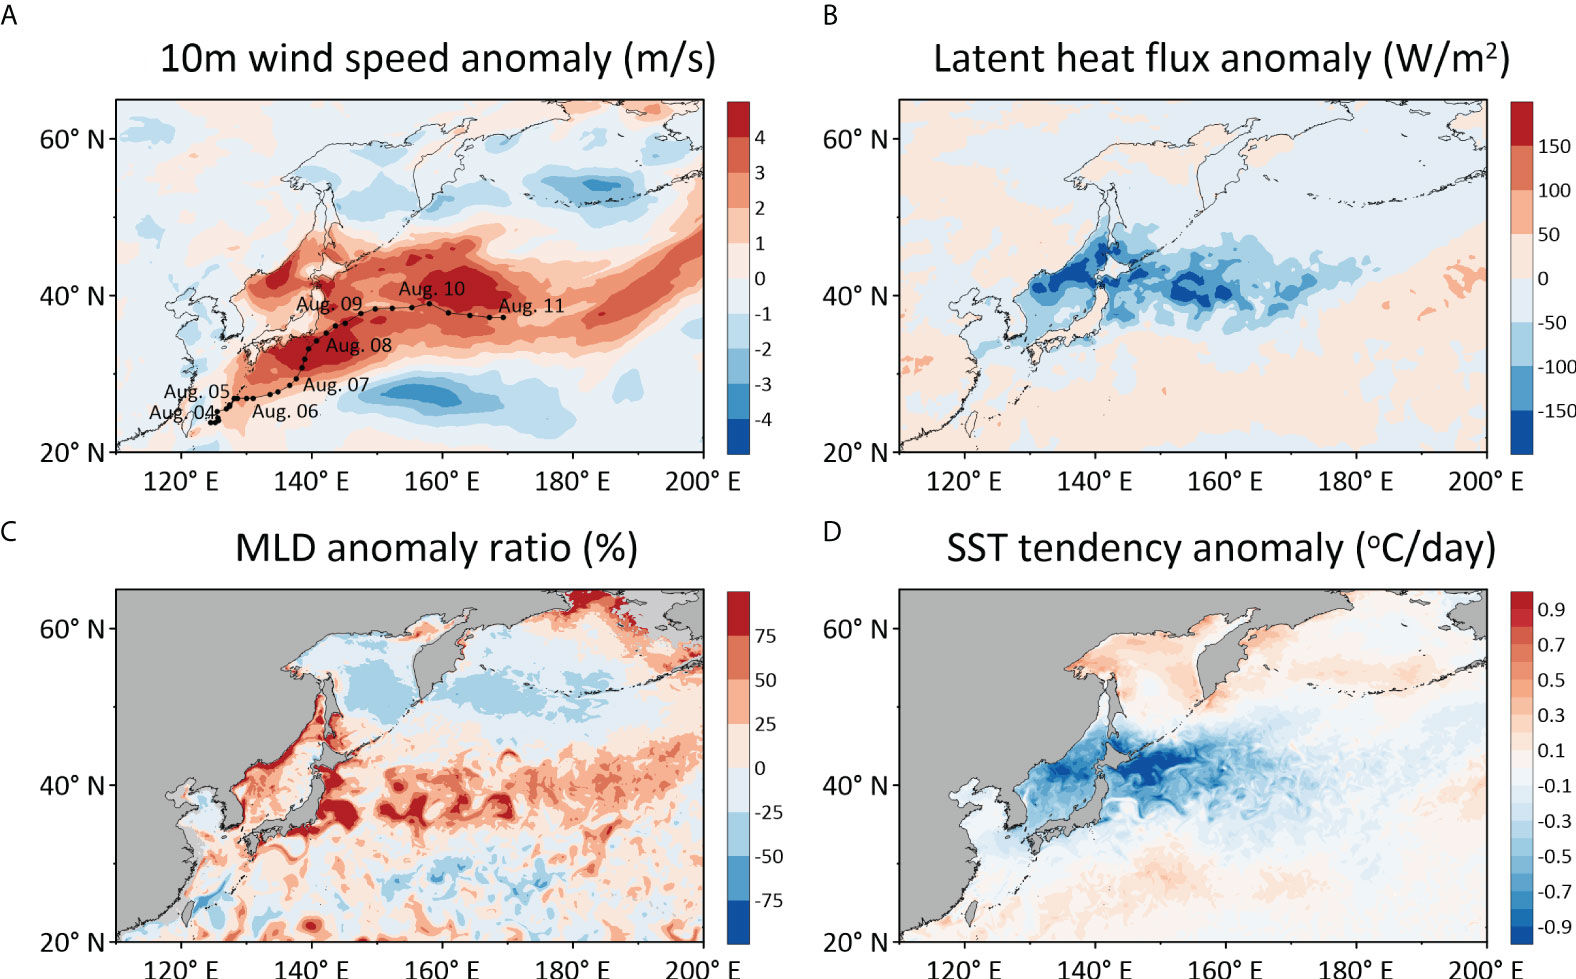
Figure 6 Spatial maps depicting the distribution of the (A) 10-m wind speed anomaly with best track of Typhoon Mirinae, (B) latent heat flux anomaly, (C) ratio of the mixed-layer depth (MLD) anomaly to climatological MLD, and (D) sea surface temperature (SST) tendency anomaly in the cooling period of 2021 relative to 2001–2020.
The above results suggest that both the heat flux and wind speed anomalies are favorable for inducing warming and cooling of the SST. However, these analyses only suggest qualitative explanation. To confirm the suggested mechanisms quantitatively, heat budget calculation and one-dimensional modeling are conducted, and their results are discussed in the subsequent section.
The daily time series of the area-averaged MLT tendency and the sum of the budget terms for 2021 indicated that our heat budget analysis was successfully conducted for the TOT region (Figure 7A). The correlation between MLT tendency and the sum of budget terms is more than 0.97, and the root-mean-square of the Res is 0.06°C/day, which is small enough to neglect during the July–August 2021.
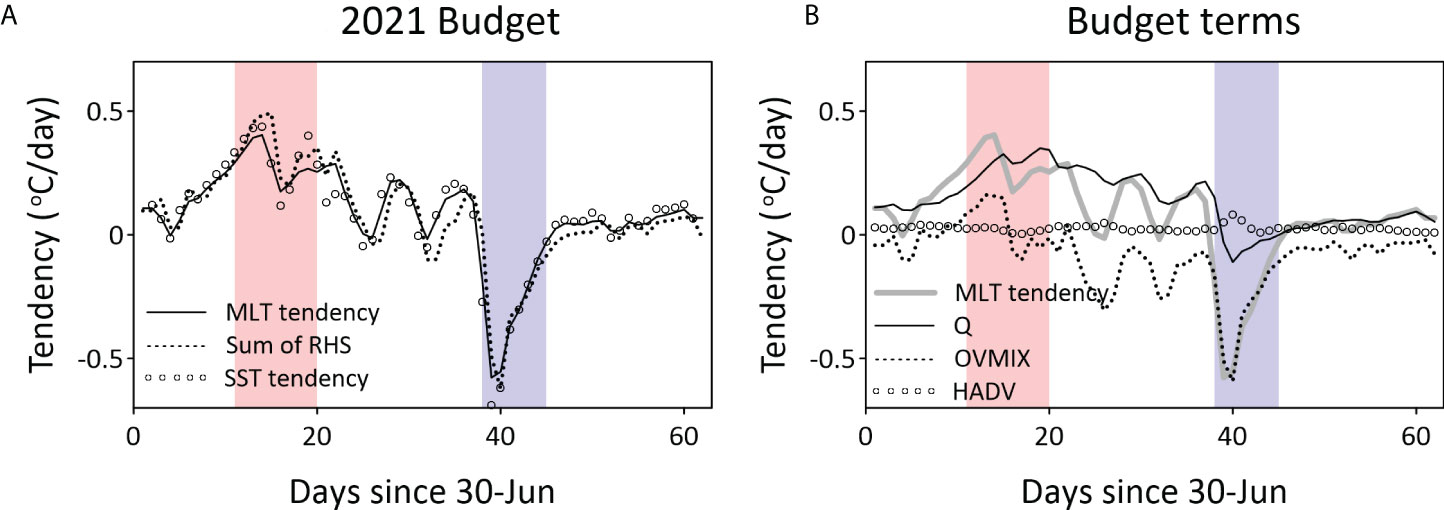
Figure 7 Time series plots illustrating the (A) mixed-layer temperature (MLT) tendency (solid line), sum of tendency budget terms (dotted line), and sea surface temperature (SST) tendency (circles), and (B) MLT tendency due to surface heat flux (Q; solid line), ocean vertical mixing and entrainment/detrainment terms (OVMIX; dotted line), and horizontal advection (HADV; circles) overlaying with MLT tendency (thick gray line) in the total (TOT) mid-latitude in the western North Pacific region.
The decomposition of the budget terms (Q, HADV, and OVMIX) clearly shows the quantitative contributions of each term on the warming and cooling periods (Figure 7B). During the warming period, mean MLT tendency was +0.29°C/day, which is almost explained by Q (+0.29°C/day). As only the shortwave radiation among the heat flux components has a significant anomaly during the warming period (Figure 3), the SST warming is possibly caused by the increased shortwave radiation. Additionally, the shallow MLD related to the weakened wind can also affect the increase in SST, as Q is inversely proportional to MLD, which is shoaling during this period (Figure 4B). OVMIX (+0.04°C/day) does not have significant contribution to the MLT tendency during the warming period. However, it contributes to the short-term scale temporal variability of the MLT tendency (Figure 7B). The HADV has negligible impacts all the time, although it almost always contributes to increase the MLT by approximately 0.02°C/day.
The spatial distribution of each budget term also suggested consistent results (Figure 8). The variability of the sum of the budget terms agreed well with that of the MLT tendency during the warming period (Figures 8A, B). This positive tendency is well explained by Q (Figure 8C), and HADV has spatially small-scale patterns, which are mostly canceled on average over a large area (Figure 8D). OVMIX (Figure 8E) contributes slightly to the MLT increase near and east of Japan, and MLT decreases near the Eurasian continent and subtropical regions. We still have Res, although relatively small negative values are observed north of 30°N (Figure 8F).
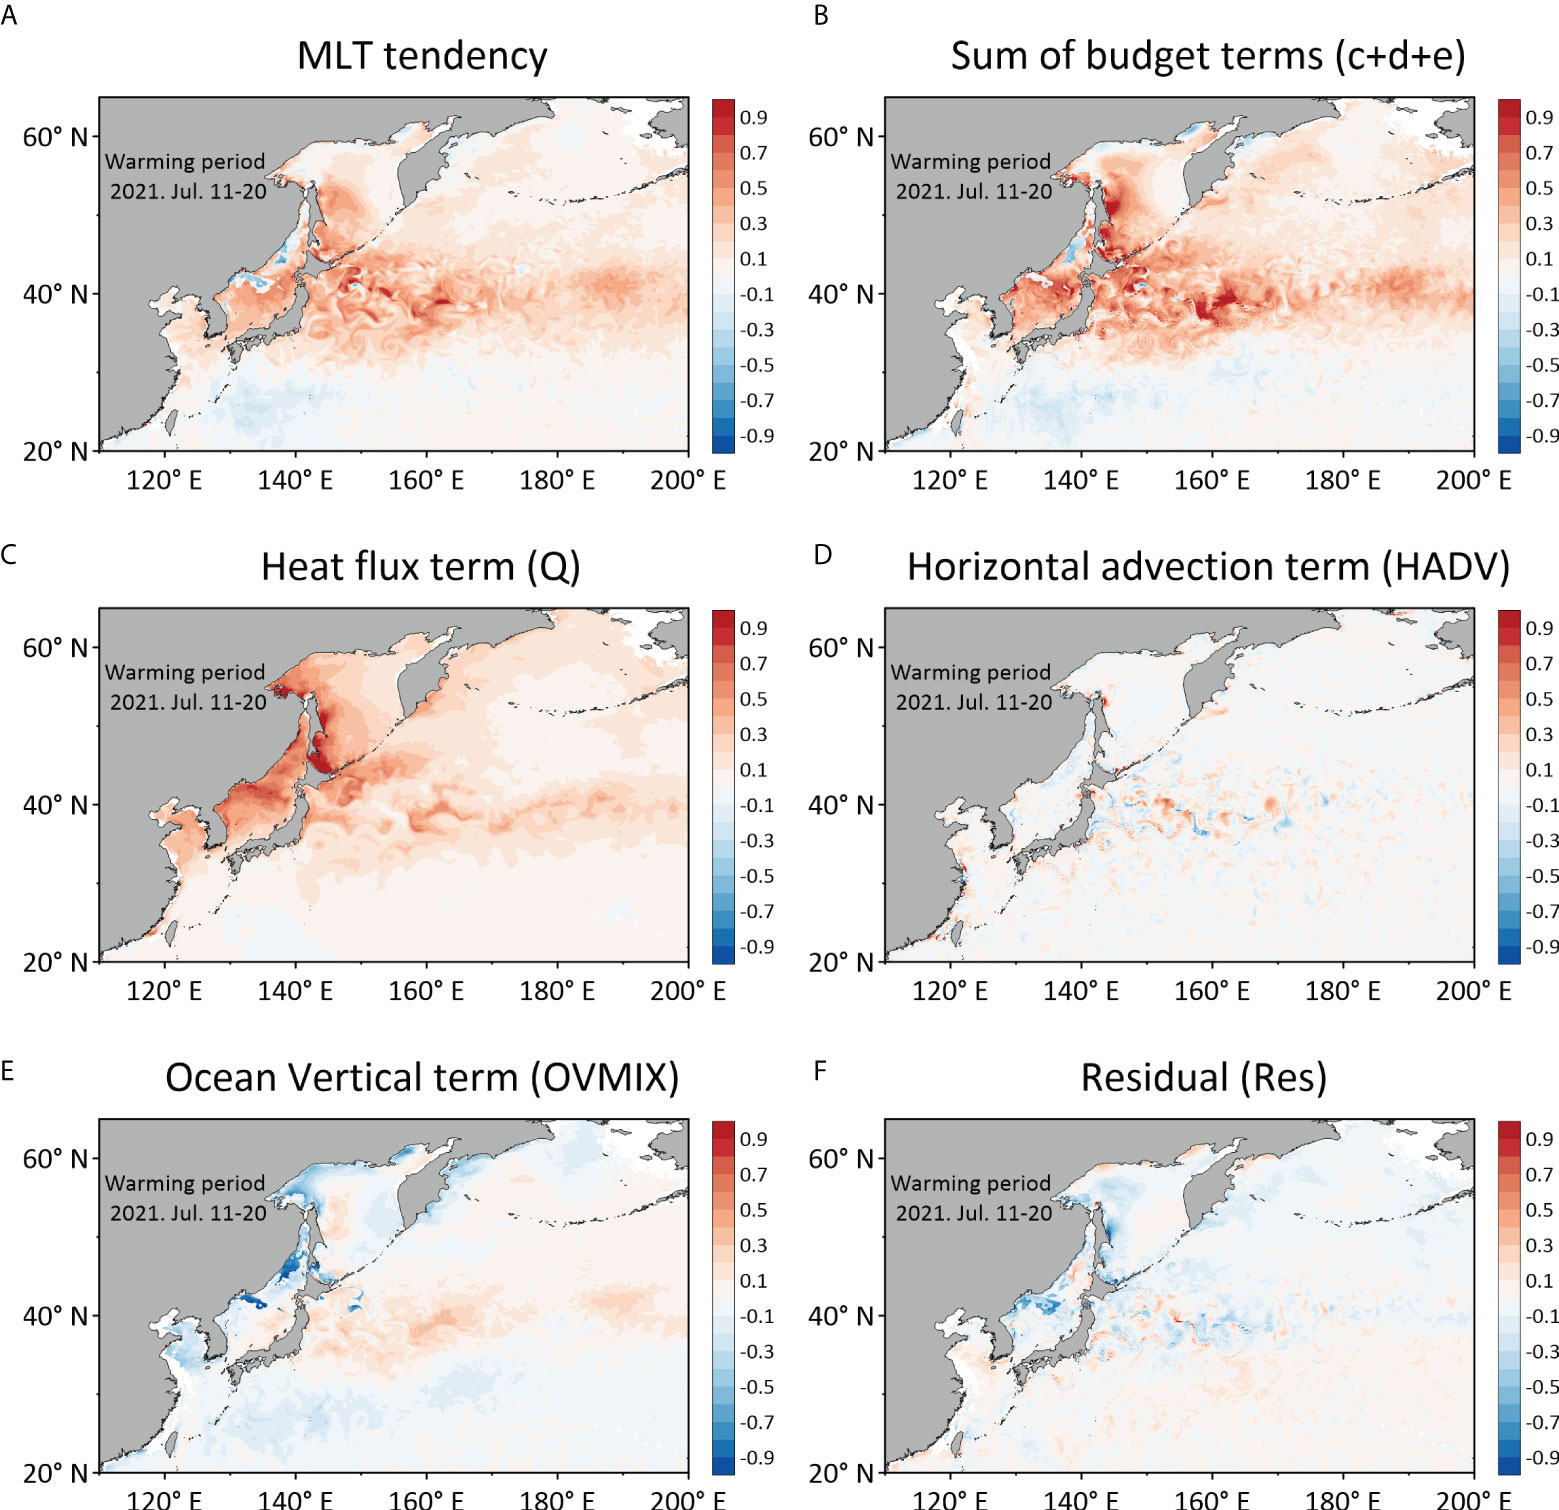
Figure 8 Spatial maps depicting the distribution of mixed-layer temperature (MLT) tendency budgets during the warming period: (A) MLT tendency, (B) sum of budget terms, (C) surface heat flux term (Q), (D) horizontal advection term (HADV), (E) ocean vertical mixing term (OVMIX), and (F) residuals (Res).
During the cooling period, negative MLT tendency (-0.29°C/day) was mainly explained by OVMIX (-0.29°C/day) with the minor influence of the decreased Q (-0.02°C/day) (Figure 7B). This implies that entrainment has a much greater contribution to the MLT decrease than the heat flux release itself. The entrainment is due to the deepening of the MLD (i.e., weakening of surface stratification), which is caused by intensified buoyancy-driven mixing and/or mechanical mixing, both of which are due to increased surface wind speed. At the early stage of the cooling period, HADV showed the largest value (0.08°C/day) but did not significantly affect the overall tendency variability.
Consistent findings were observed in the spatial distribution during the cooling period (Figure 9). The MLT decrease was the most vigorous in the EJS and east of Japan (Figure 9A), and the budget equation closed well (Figure 9B). OVMIX played a significant role in the negative MLT tendency with the center of action in the EJS (Figure 9E). Q also contributes minorly to cooling the MLT, but with a positive MLT tendency in the other region (Figure 9C). HADV and Res also contributed minorly to the MLT tendency during the cooling period (Figures 9D, F).
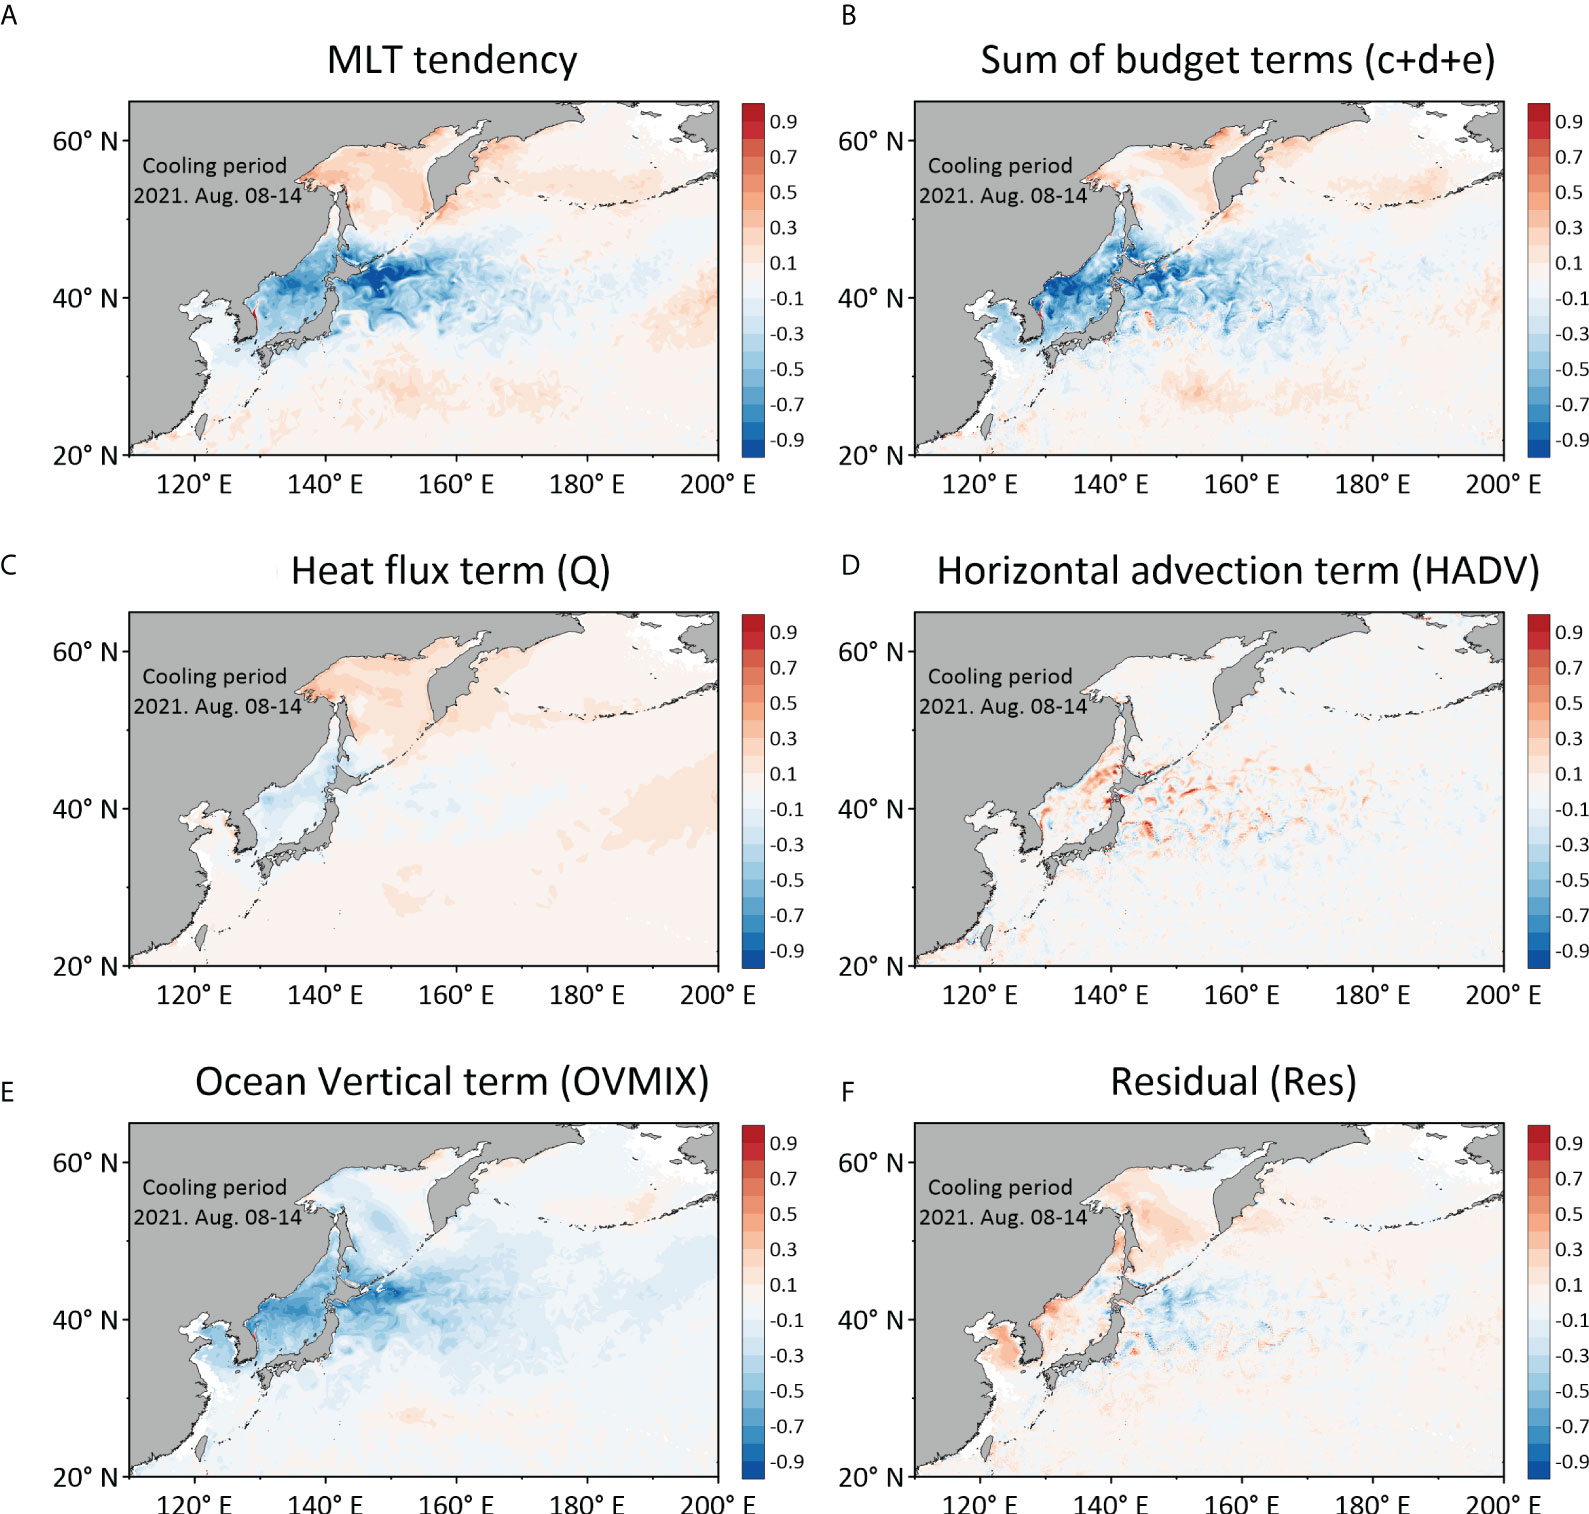
Figure 9 Spatial maps depicting the distribution of mixed-layer temperature (MLT) tendency budgets during the cooling period: (A) MLT tendency, (B) sum of budget terms, (C) surface heat flux term (Q), (D) horizontal advection term (HADV), (E) ocean vertical mixing term (OVMIX), and (F) residuals (Res).
Stronger buoyancy-driven and mechanical mixings, both due to the strong surface wind anomaly, could lower SST. However, the quantitative contributions of both mixing mechanisms cannot be estimated using heat budget analysis. Simultaneously, the relative contribution of increased shortwave radiation and weakened wind speed during the warming period is not investigated yet. In the subsequent section, sensitivity tests with a one-dimensional model will provide the contributions of each mechanism to the SST changes. The negligible impact of HADV guarantees the applicability of the one-dimensional model.
To analyze the impact of shortwave radiation, latent heat flux, and wind speed on the warming and cooling of the MLT in the summer of 2021, we conducted sensitivity tests with a one-dimensional model. For every experiment, the first initial condition was taken from the area-averaged temperature profile of GLORYS in the western North Pacific region in July 10, 2021, which was just before the warming period. After integration for the warming period, all the experiments were re-initialized with the temperature profile on August 6, 2021 and integrated during the cooling period.
Five experiments were conducted for the sensitivity tests (Table 1). The CTRL is driven by the area-averaged time series of realistic forcing conditions of shortwave radiation, longwave radiation, latent heat flux, sensible heat flux, and wind stress in 2021 (Figure 10). The CLIM is forced by climatological forcing conditions, which are defined as the 11-day moving-averaged climatology for 2001–2020. We also conducted experiments to isolate the contributions of shortwave radiation, wind stress, and latent heat flux. The SOLAR uses the 2021 forcing condition of shortwave radiation, while the climatological forcing is used for other variables. Similarly, the WIND and LATENT used 2021 forcing conditions of wind stress and latent heat flux, respectively, with climatological forcing for other variables. As the variability of the longwave radiation and sensible heat flux was negligible (Figure 3), we did not separately consider both, and only climatological values were applied in the three experimental runs.
Table 1 Forcing conditions for sensitivity tests of one-dimensional model.
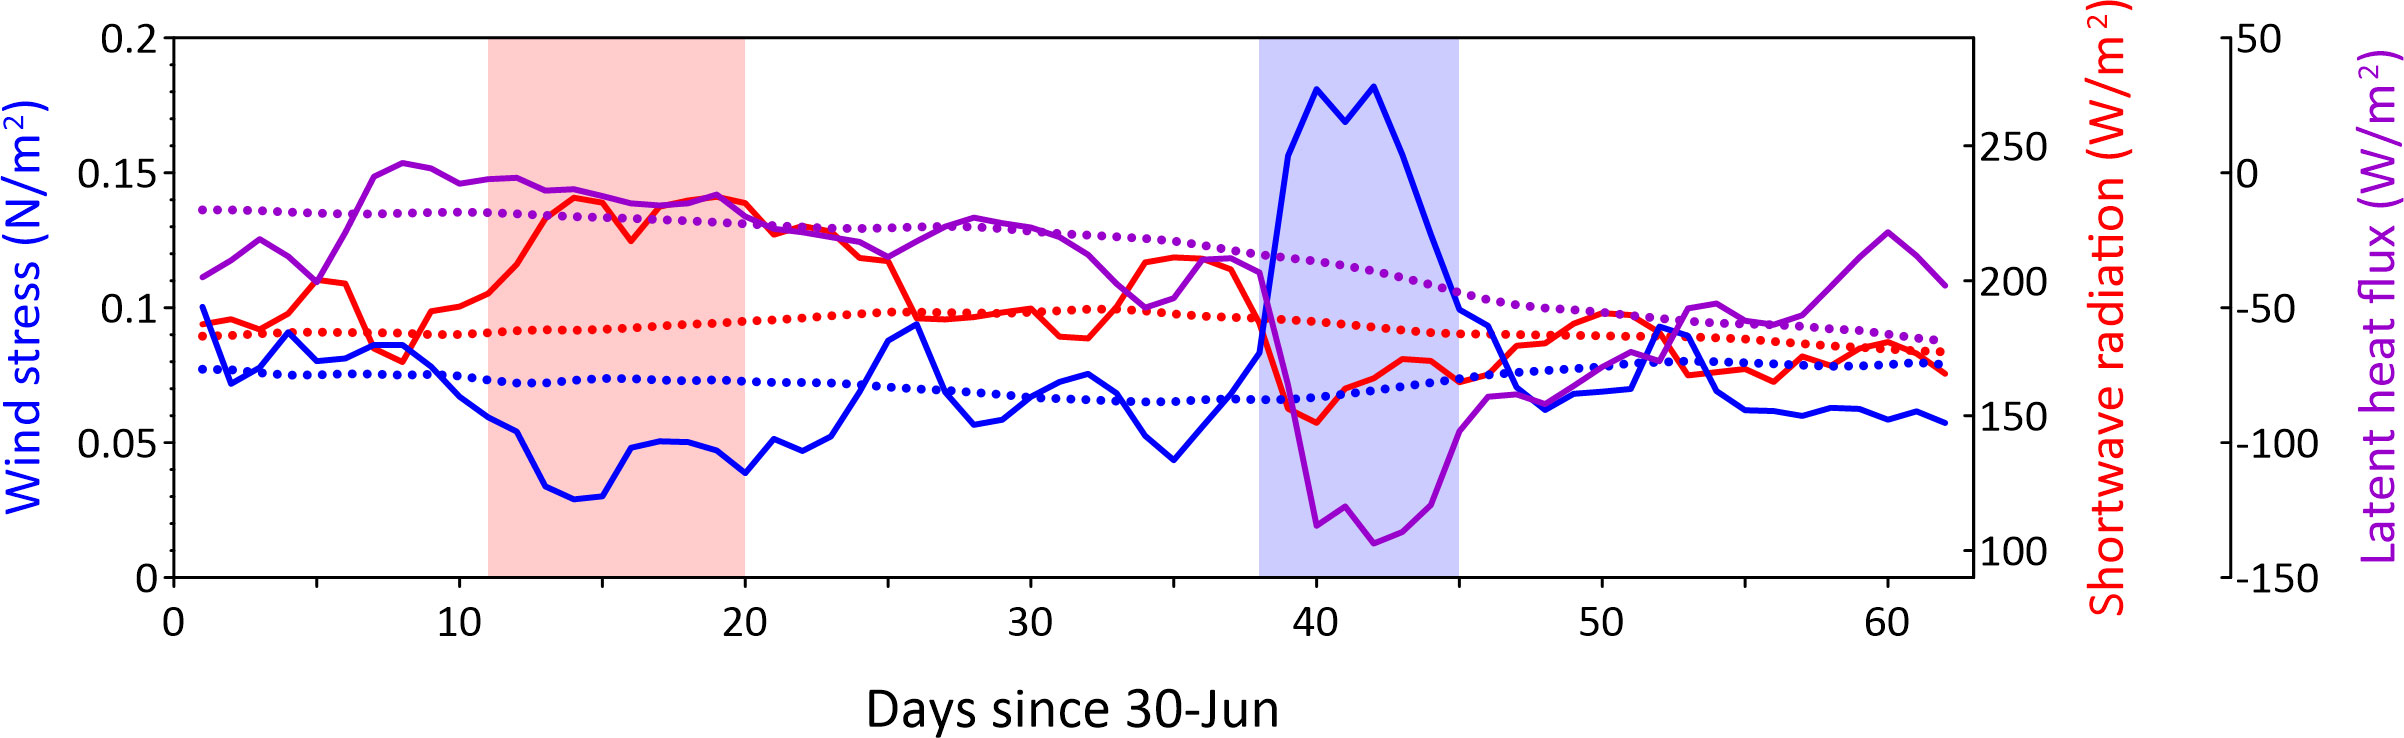
Figure 10 Time series plots of 2021 (solid) and climatological (dotted) forcing data for one-dimensional model. Red, blue, and purple indicate shortwave radiation, wind stress, and latent heat flux, respectively.
A comparison of MLT from GLORYS, CTRL, and CLIM suggests that our one-dimensional model successfully reproduced the warming and cooling periods in the summer of 2021 (Figures 11A, B). During the warming period (Figure 11A), MLTs from the SOLAR and WIND suggest that both shortwave radiation and wind stress contribute significant warming with a bit more contribution from the increased shortwave. The effect of shortwave radiation shoaling on the MLD was relatively smaller than that of the wind stress (Figure 11C). The positive anomaly of the latent heat flux during the warming period (Figure 10) also contributed to the warming of SST. However, the impact of the latent heat flux anomaly on the MLT and MLD seemed to be less than those of the shortwave radiation and wind stress (Figures 11A, C).
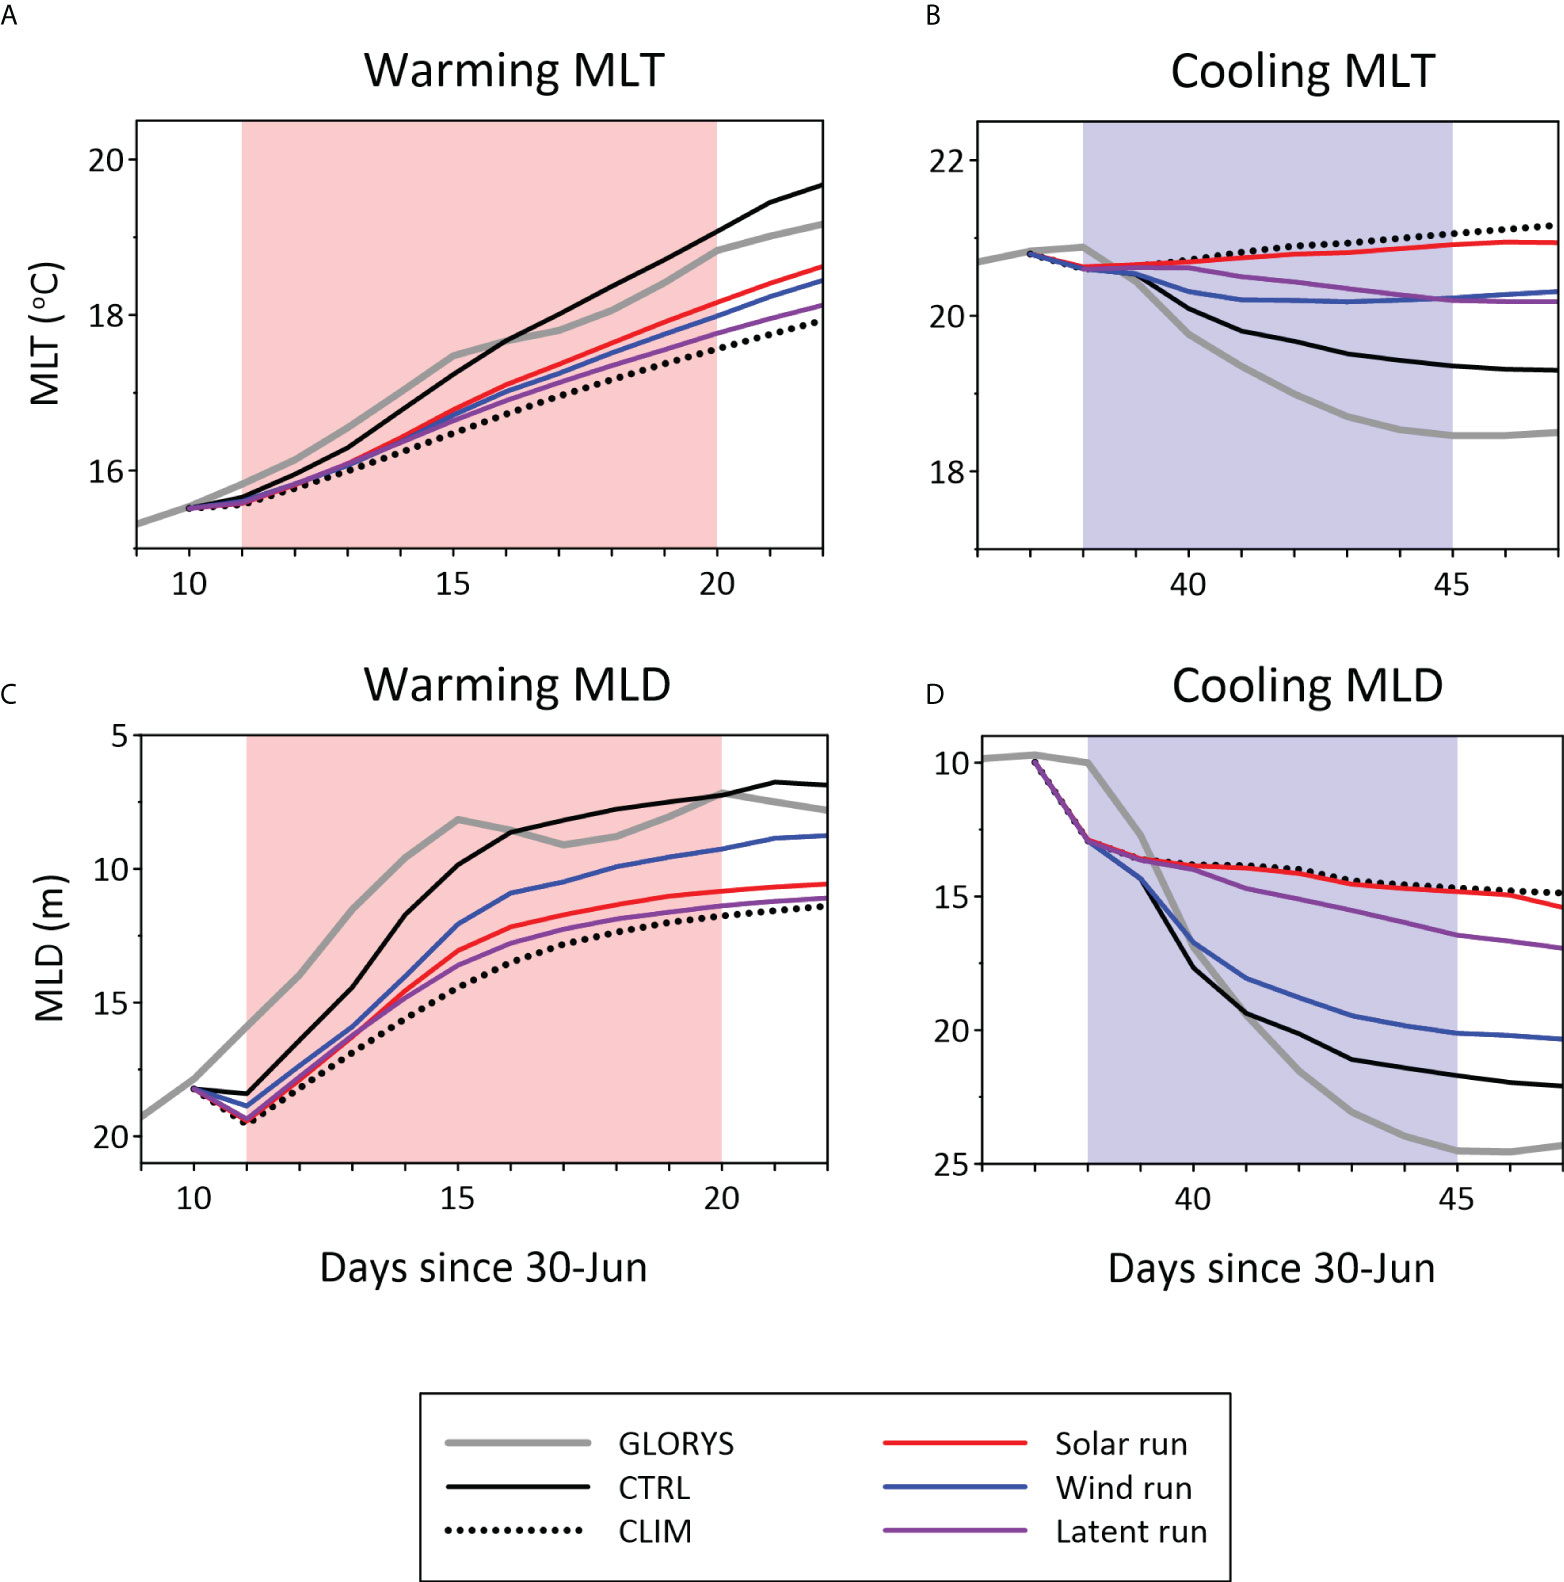
Figure 11 Time series plots of (A, B) mixed-layer temperature (MLT) and (C, D) mixed-layer depth (MLD) from CTRL (black solid), CLIM (black dotted), SOLAR (red), WIND (blue), and LATENT (purple) overlaying those from ocean analysis data (GLORYS; gray) during the (A, C) warming period and (B, D) cooling period.
During the cooling period, the CTRL, WIND, and LATENT capture the cooling of the MLT and deepening of the MLD (Figures 11B, D), indicating that both the increased wind stress and heat flux release during the cooling period (Figure 10) have a significant impact on the SST drop. At the early stage of the cooling period, the influence of the wind stress, i.e., mechanical mixing, has a greater contribution to the cooling than the latent heat flux release. Subsequently, at the end of the cooling period, the contribution of the latent heat flux became almost the same as that of the wind stress (Figure 11B), indicating that the contribution of buoyancy forcing and mechanical mixing on the SST drop during the cooling period was comparable. Mechanical mixing causes the SST to decrease faster than the buoyancy forcing because the timing when the strengthening of the wind stress started earlier than the drop of latent heat flux (Figure 10). The deepening of the MLD from the WIND (i.e., mechanical mixing) is much deeper than that from LATENT (i.e., buoyancy-driven mixing; Figure 11D), which indicates that mechanical mixing by the typhoon-induced wind is responsible for the change in the surface stratification during the cooling period. Shortwave radiation also decreased during the cooling period (Figure 10); however, its contribution to the cooling of the MLT was negligible (Figure 11B).
A record-breaking MHW event, with not only anomalously high SST but also unprecedented strong warming and cooling tendencies, in the western North Pacific during the summer of 2021 (Figure 1). The mechanisms underlying rapid warming and cooling were investigated using qualitative and quantitative approaches. We found that anomalous heat flux (Figure 3) and ocean surface stratification (Figure 4) can result in rapid warming and cooling of SST. Therefore, we investigated the period-average of the anomalous meteorological variables related to the changes in heat flux and surface stratification to understand the process of the development and decay of the MHW. The anomalous strong shortwave radiation and weak wind speed, possibly affected by the high-pressure atmospheric circulation, were responsible for the rapid warming (Figure 5). After a-month-persisting of the MHW, MHW was disappeared due to the strong surface wind induced by typhoon events (Figure 6).
The mechanisms listed above are confirmed by heat budget analysis. Our heat budget analysis successfully separated the MLT tendency into the Q, HADV, and OVMIX. Mean MLT tendency during the warming period was +0.29°C/day and this is almost explained by Q (+0.29°C/day) with negligible OVMIX contribution (+0.04°C/day). On the other hand, during the cooling period, mean MLT tendency (-0.29°C/day) was mostly affected by OVMIX (-0.29°C/day) with minor influence of Q (-0.02°C/day). HADV has a negligible influence on both the warming and cooling periods (Figure 7B). These results suggest that the intensified shortwave radiation income and weakened wind during mid-July 2021 were enough to make the rapid warming of SST. Also, the deepening of MLD due to the mechanical and buoyancy-driven mixing was responsible for the SST drop during mid-August 2021.
Sensitivity tests with a one-dimensional model further confirmed the contribution of each forcing mechanism to the warming and cooling events. During the warming period, both the increased shortwave radiation and weakened wind stress were comparably responsible, but a bit more contribution from the shortwave radiation, for the increase in MLT, while the shoaling of the MLD was better explained by the weakened wind stress. During the cooling period, buoyancy forcing and mechanical mixing, both due to the typhoon event, contributed similarly to the decrease in MLT. However, the deepening of the MLD is better explained by mechanical mixing due to the increased momentum flux compared to the latent heat flux release under the influence of Typhoon Mirinae.
Our findings are consistent with those of Kuroda and Setou (2021), who first reported extensive MHW in the western North Pacific in the summer of 2021. These authors pointed out that surface heat flux and surface stratification are likely related to MHW events. However, we took a closer look at the cooling period than Kuroda and Setou (2021) and showed a possible relationship with the typhoon event. Additionally, we have provided sufficient additional information through the heat budget calculation. The heat budget analysis confirmed that both increased shortwave radiation and weakened surface stratification contributed to the rapid warming. Additionally, the heat budget analysis shows that the effect of ocean vertical mixing dominates that of heat flux release during the cooling period. We also suggested the contribution of shortwave radiation, latent heat flux, and wind stress on warming and cooling periods using a one-dimensional mixed-layer model. These results are the novelty of this study and can only be confirmed through heat budget analysis and modelling studies. Such additional information will aid to enrich our understanding of unprecedented MHW.
The original contributions presented in the study are included in the article/supplementary material. Further inquiries can be directed to the corresponding author.
GP and J-HP derived the research idea and wrote the first manuscript. JN and Y-GP carried the sensitivity tests with one-dimensional model. HJ contributed to the analysis with ocean data. All authors participated in discussions about the results and contributed to the final manuscript.
This study was supported by the Ministry of Oceans and Fisheries, Korea (Investigation and Prediction System Development of Marine Heatwaves around the Korean Peninsula originating from the subarctic and western Pacific; grant no. 20190344 and Study on Northwestern Pacific warming and genesis and rapid intensification of typhoon; grant no. 20220566) and Korea Institute of Ocean Science & Technology (Influences of the Northwest Pacific circulation and climate variability on the Korean water changes and material cycle I–the role of Jeju warm current and its variability; grant no. PEA0011).
We would like to thank the Ocean Climate Prediction Center at Korea Institute of Ocean Science & Technology for providing us with information on the 2021 marine heatwaves.
The authors declare that the research was conducted in the absence of any commercial or financial relationships that could be construed as a potential conflict of interest.
All claims expressed in this article are solely those of the authors and do not necessarily represent those of their affiliated organizations, or those of the publisher, the editors and the reviewers. Any product that may be evaluated in this article, or claim that may be made by its manufacturer, is not guaranteed or endorsed by the publisher.
Brainerd K. E., Gregg M. C. (1995). Surface mixed and mixing layer depths. Deep. Sea. Res. I. 42, 1521–1543. doi: 10.1016/0967-0637(95)00068-H
Bye J. A. T. (1988). A Richardson number criterion for the air-Sea interface. Boundary-Lay. Meteorol. 44, 407–410. doi: 10.1007/BF00123024
Canuto V. M. (1998). Turbulence in stars. ii. shear, stable stratification, and radiative losses. Astrophys. J. 508, 767–779. doi: 10.1086/306427
De Boyer Montégut C., Madec G., Fischer A. S., Lazar A., Iudicone D. (2004). Mixed layer depth over the global ocean: An examination of profile data and a profile-based climatology. J. Geophys. Res. Ocean. 109, C12003. doi: 10.1029/2004jc002378
De Boyer Montégut C., Mignot J., Lazar A., Cravatte S. (2007). Control of salinity on the mixed layer depth in the world ocean: 1. general description. J. Geophys. Res. Ocean. 112, C06011. doi: 10.1029/2006JC003953
Dong S., Gille S. T., Sprintall J. (2007). An assessment of the southern ocean mixed layer heat budget. J. Clim. 20, 4425–4442. doi: 10.1175/JCLI4259.1
Dzwonkowski B., Coogan J., Fournier S., Lockridge G., Park K., Lee T. (2020). Compounding impact of severe weather events fuels marine heatwave in the coastal ocean. Nat. Commun. 11, 4623. doi: 10.1038/s41467-020-18339-2
Galperin B., Sukoriansky S., Anderson P. S. (2007). On the critical Richardson number in stably stratified turbulence. Atmos. Sci. Lett. 8, 65–69. doi: 10.1002/asl.153
Hersbach H., Bell B., Berrisford P., Hirahara S., Horányi A., Muñoz-Sabater J., et al. (2020). The Era5 global reanalysis. Q. J. R. Meteorol. Soc 146, 1999–2049. doi: 10.1002/qj.3803
Hobday A. J., Alexander L. V., Perkins S. E., Smale D. A., Straub S. C., Oliver E. C. J., et al. (2016). A hierarchical approach to defining marine heatwaves. Prog. Oceanogr. 141, 227–238. doi: 10.1016/j.pocean.2015.12.014
Hobday A. J., Oliver E. C., Gupta A. S., Benthuysen J. A., Burrows M. T., Donat M. G., et al. (2018). Categorizing and naming marine heatwaves. Oceanography 31, 162–173. doi: 10.5670/oceanog.2018.205
Holbrook N. J., Scannell H. A., Sen Gupta A., Benthuysen J. A., Feng M., Oliver E. C. J., et al. (2019). A global assessment of marine heatwaves and their drivers. Nat. Commun. 10, 2624. doi: 10.1038/s41467-019-10206-z
Howard L. N. (1961). Note on a paper of John w. miles. J. Fluid. Mech. 10, 509–512. doi: 10.1017/S0022112061000317
Jean-Michel L., Eric G., Romain B.-B., Gilles G., Angélique M., Marie D., et al. (2021). The Copernicus global 1/12° oceanic and Sea ice Glorys12 reanalysis. Front. Earth Sci. 9. doi: 10.3389/feart.2021.698876
Jones T., Parrish J. K., Peterson W. T., Bjorkstedt E. P., Bond N. A., Ballance L. T., et al. (2018). Massive mortality of a planktivorous seabird in response to a marine heatwave. Geophys. Res. Lett. 45, 3193–3202. doi: 10.1002/2017GL076164
Kelly K. A., Thompson L., Cheng W., Metzger E. J. (2007). Evaluation of hycom in the kuroshio extension region using new metrics. J. Geophys. Res. Ocean. 112, C01004. doi: 10.1029/2006JC003614
Kido S., Nonaka M., Tanimoto Y. (2021). Impacts of salinity variation on the mixed-layer processes and Sea surface temperature in the kuroshio-oyashio confluence region. J. Geophys. Res. Ocean. 126, e2020JC016914. doi: 10.1029/2020JC016914
Kim S.-B., Fukumori I., Lee T. (2006). The closure of the ocean mixed layer temperature budget using level-coordinate model fields. J. Atmos. Ocean. Technol. 23, 840–853. doi: 10.1175/jtech1883.1
Kuroda H., Setou T. (2021). Extensive marine heatwaves at the Sea surface in the northwestern pacific ocean in summer 2021. Remote Sens. 13, 3989. doi: 10.3390/rs13193989
Kwon Y.-O., Alexander M. A., Bond N. A., Frankignoul C., Nakamura H., Qiu B., et al. (2010). Role of the gulf stream and kuroshio–oyashio systems in Large-scale atmosphere–ocean interaction: A review. J. Clim. 23, 3249–3281. doi: 10.1175/2010jcli3343.1
Le M. H., Dinh K. V., Nguyen M. V., Rønnestad I. (2020). Combined effects of a simulated marine heatwave and an algal toxin on a tropical marine aquaculture fish cobia (Rachycentron canadum). Aquacult. Res. 51, 2535–2544. doi: 10.1111/are.14596
Le Nohaïc M., Ross C. L., Cornwall C. E., Comeau S., Lowe R., Mcculloch M. T., et al. (2017). Marine heatwave causes unprecedented regional mass bleaching of thermally resistant corals in northwestern Australia. Sci. Rep. 7, 14999. doi: 10.1038/s41598-017-14794-y
Liu K., Xu K., Zhu C., Liu B. (2022). Diversity of marine heatwaves in the south China Sea regulated by enso phase. J. Clim. 35, 877–893. doi: 10.1175/jcli-d-21-0309.1
Mack S. A., Schoeberlein H. C. (2004). Richardson Number and ocean mixing: Towed chain observations. J. Phys. Oceanogr. 34, 736–754. doi: 10.1175/1520-0485(2004)034<0736:RNAOMT>2.0.CO;2
Mawren D., Hermes J., Reason C. (2022). Marine heatwaves in the Mozambique channel. Clim. Dyn. 58, 305–327. doi: 10.1007/s00382-021-05909-3
Miles J. W. (1961). On the stability of heterogeneous shear flows. J. Fluid. Mech. 10, 496–508. doi: 10.1017/S0022112061000305
Miyama T., Minobe S., Goto H. (2021). Marine heatwave of Sea surface temperature of the oyashio region in summer in 2010–2016. Front. Mar. Sci. 7. doi: 10.3389/fmars.2020.576240
Moisan J. R., Niiler P. P. (1998). The seasonal heat budget of the north pacific: Net heat flux and heat storage rates 1950–1990). J. Phys. Oceanogr. 28, 401–421. doi: 10.1175/1520-0485(1998)028<0401:Tshbot>2.0.Co;2
Olita A., Sorgente R., Natale S., Gaberšek S., Ribotti A., Bonanno A., et al. (2007). Effects of the 2003 European heatwave on the central Mediterranean Sea: Surface fluxes and the dynamical response. Ocean. Sci. 3, 273–289. doi: 10.5194/os-3-273-2007
Oliver E. C., Benthuysen J. A., Darmaraki S., Donat M. G., Hobday A. J., Holbrook N. J., et al. (2021). Marine heatwaves. Annu. Rev. Mar. Sci. 13, 313–342. doi: 10.1146/annurev-marine-032720-095144
Oliver E. C., Donat M. G., Burrows M. T., Moore P. J., Smale D. A., Alexander L. V., et al. (2018). Longer and more frequent marine heatwaves over the past century. Nat. Commun. 9, 1324. doi: 10.1038/s41467-018-03732-9
Pak G., Park Y.-H., Vivier F., Bourdallé-Badie R., Garric G., Chang K.-I. (2017). Upper-ocean thermal variability controlled by ocean dynamics in the kuroshio-oyashio extension region. J. Geophys. Res. Ocean. 122, 1154–1176. doi: 10.1002/2016jc012076
Park Y.-G., Seo S., Kim D. G., Noh J., Park H. M. (2021). Coastal observation using a vertical profiling system at the southern coast of Korea. Front. Mar. Sci. 8. doi: 10.3389/fmars.2021.668733
Paulson C. A., Simpson J. J. (1977). Irradiance measurements in the upper ocean. J. Phys. Oceanogr. 7, 952–956. doi: 10.1175/1520-0485(1977)007<0952:Imituo>2.0.Co;2
Pearce A. F., Feng M. (2013). The rise and fall of the “Marine heat wave” off Western Australia during the summer of 2010/2011. J. Mar. Syst. 111, 139–156. doi: 10.1016/j.jmarsys.2012.10.009
Plecha S. M., Soares P. M. (2020). Global marine heatwave events using the new Cmip6 multi-model ensemble: From shortcomings in present climate to future projections. Environ. Res. Lett. 15, 124058. doi: 10.1088/1748-9326/abc847
Price J. F., Weller R. A., Pinkel R. (1986). Diurnal cycling: Observations and models of the upper ocean response to diurnal heating, cooling, and wind mixing. J. Geophys. Res. Ocean. 91, 8411–8427. doi: 10.1029/JC091iC07p08411
Qiu B., Kelly K. A. (1993). Upper-ocean heat balance in the kuroshio extension region. J. Phys. Oceanogr. 23, 2027–2041. doi: 10.1175/1520-0485(1993)023<2027:UOHBIT>2.0.CO;2
Reynolds R. W., Smith T. M., Liu C., Chelton D. B., Casey K. S., Schlax M. G. (2007). Daily high-Resolution-Blended analyses for Sea surface temperature. J. Clim. 20, 5473–5496. doi: 10.1175/2007jcli1824.1
Roberts S. D., Van Ruth P. D., Wilkinson C., Bastianello S. S., Bansemer M. S. (2019). Marine heatwave, harmful algae blooms and an extensive fish kill event during 2013 in south Australia. Front. Mar. Sci. 6. doi: 10.3389/fmars.2019.00610
Schlegel R. W., Oliver E. C. J., Chen K. (2021). Drivers of marine heatwaves in the Northwest Atlantic: The role of air–Sea interaction during onset and decline. Front. Mar. Sci. 8. doi: 10.3389/fmars.2021.627970
Sen Gupta A., Thomsen M., Benthuysen J. A., Hobday A. J., Oliver E., Alexander L. V., et al. (2020). Drivers and impacts of the most extreme marine heatwave events. Sci. Rep. 10, 19359. doi: 10.1038/s41598-020-75445-3
Stevenson J. W., Niiler P. P. (1983). Upper ocean heat budget during the Hawaii-to-Tahiti shuttle experiment. J. Phys. Oceanogr. 13, 1894–1907. doi: 10.1175/1520-0485(1983)013<1894:Uohbdt>2.0.Co;2
Talley L. D., Pickard G. L., Emery W. J., Swift J. H. (2011). “Chapter 7 - dynamical processes for descriptive ocean circulation,” in Descriptive physical oceanography (Sixth edition). Eds. Talley L. D., Pickard G. L., Emery W. J., Swift J. H. (Boston: Academic Press), 187–221.
Vijith V., Vinayachandran P. N., Webber B. G. M., Matthews A. J., George J. V., Kannaujia V. K., et al. (2020). Closing the Sea surface mixed layer temperature budget from in situ observations alone: Operation advection during bobble. Sci. Rep. 10, 7062. doi: 10.1038/s41598-020-63320-0
Keywords: marine heatwaves, mid-latitude western North Pacific, sea surface temperature, heat budget analysis, one-dimensional mixed-layer model
Citation: Pak G, Noh J, Park Y-G, Jin H and Park J-H (2022) Governing factors of the record-breaking marine heatwave over the mid-latitude western North Pacific in the summer of 2021. Front. Mar. Sci. 9:946767. doi: 10.3389/fmars.2022.946767
Received: 18 May 2022; Accepted: 15 July 2022;
Published: 08 August 2022.
Edited by:
Leonie Esters, University of Bonn, GermanyReviewed by:
Jian Shi, Ocean University of China, ChinaCopyright © 2022 Pak, Noh, Park, Jin and Park. This is an open-access article distributed under the terms of the Creative Commons Attribution License (CC BY). The use, distribution or reproduction in other forums is permitted, provided the original author(s) and the copyright owner(s) are credited and that the original publication in this journal is cited, in accordance with accepted academic practice. No use, distribution or reproduction is permitted which does not comply with these terms.
*Correspondence: Jae-Hyoung Park, b2NlYW5qaHBhcmtAa2lvc3QuYWMua3I=
Disclaimer: All claims expressed in this article are solely those of the authors and do not necessarily represent those of their affiliated organizations, or those of the publisher, the editors and the reviewers. Any product that may be evaluated in this article or claim that may be made by its manufacturer is not guaranteed or endorsed by the publisher.
Research integrity at Frontiers
Learn more about the work of our research integrity team to safeguard the quality of each article we publish.