 Jimena Samper-Villarreal
 Jairo Moya-Ramírez2
 Jorge Cortés
95% of researchers rate our articles as excellent or good
Learn more about the work of our research integrity team to safeguard the quality of each article we publish.
Find out more
ORIGINAL RESEARCH article
Front. Mar. Sci. , 07 October 2022
Sec. Marine Ecosystem Ecology
Volume 9 - 2022 | https://doi.org/10.3389/fmars.2022.945783
This article is part of the Research Topic Tropical Blue Carbon: Challenges and Opportunities View all 8 articles
In some regions of the Caribbean Sea, seagrasses have been negatively affected by sea turtle overgrazing. Seagrass canopy complexity has declined at a long-term monitoring site in Costa Rica. We deployed megaherbivore exclosures for 13 months and found an increase over time in seagrass cover and maximum canopy height to ~ 75% and 20 cm respectively in the exclosures; while they remained steady in controls at < 25% and ~ 5 cm. Following exclusion, above ground biomass was higher in exclosures (320 ± 58 g DW m-2) compared to controls (171 ± 60 g DW m-2). Leaves were longer and wider in the exclosures (8 ± 5 cm and 0.8 ± 0.2 cm) compared to controls (2 ± 2 cm and 0.5 ± 0.1 cm). Above ground biomass Corg pools in exclosures (1.2 ± 0.2 Mg ha-1) were two-times higher than in controls (0.6 ± 0.2 Mg ha-1). Meanwhile, there was no variation between treatments in seagrass shoot density (1,692 ± 803 shoots m-2), below ground biomass (246 ± 103 g DW m-2) and its Corg pool (0.8 ± 0.4 Mg ha-1). Relative sediment level increased up to 4.4 cm within exclosures revealing a net increase in sediment Corg, while surficial sediment Corg percentage was similar between exclosures and controls. Releasing these meadows from megaherbivore grazing therefore led to a clear increase within exclosures of seagrass cover, canopy complexity, above ground biomass, and Corg pools in above ground biomass and sediment. Our study reveals that the decline in canopy complexity over time at this meadow is linked to megaherbivore grazing and has most likely led to a decrease in blue carbon pools. Excessive megaherbivore grazing at this site could lead to a continued decline or potential loss of the meadow, and seagrass conservation and restoration initiatives should include consideration of trophic dynamics.
Seagrass meadows are an important coastal habitat and provide many ecosystem services (Nordlund et al., 2018). An emergent service is organic carbon (Corg) sequestration, also referred to as Blue Carbon, which mitigates atmospheric carbon dioxide concentrations linked to climate change (Mcleod et al., 2011). Seagrasses are vascular marine plants which can store Corg for decadal time periods in their biomass through the process of photosynthesis. In the Caribbean, Thalassia testudinum is the largest seagrass species (van Tussenbroek et al., 2010) with a short shoot life expectancy of 20+ years (Peterson and Fourqurean, 2001; van Tussenbroek, 2002). Corg from seagrass biomass and from non-seagrass sources suspended in the water column can be buried in the associated sediment for up to thousands of years (Mateo et al., 1997; Duarte et al., 2013). Seagrass canopies decrease water flow, thereby promoting particle deposition and limiting resuspension (Gacia and Duarte, 2001; Koch et al., 2006). Seagrass canopies with longer leaves and higher shoot densities have greater capacity for water flow attenuation (Adams et al., 2016). Variations in seagrass canopy structural complexity could affect their capacity to bury seagrass and non-seagrass Corg in their associated sediment.
There is limited information on the effect of seagrass canopy on Corg sequestration in seagrass sediment under conditions that minimize potential confounding factors. From recent studies, we know that many biotic and abiotic variables may affect canopy structural complexity and therefore the input and deposition of Corg in seagrass sediment, such as geomorphic conditions, water depth, hydrodynamics, and grazing (Mazarrasa et al., 2018). Seagrasses have many direct grazers, which range from small invertebrates, to urchins, juvenile and adult fishes, birds, and larger grazers such as sea turtles, manatees, dugongs, and sharks (Valentine and Duffy, 2006; Leigh et al., 2018). Grazers can feed on above or below ground biomass, and flowering structures, thereby also playing a role in seagrass pollination (van Tussenbroek et al., 2016). Larger grazers can influence the structural complexity of the seagrass canopy and species composition of the meadows. Sea turtles intermittently visit specific grazing areas and consume leaf tissue by cropping the tops of the leaves, with new leaf material produced between each visit (Bjorndal, 1980; Christianen et al., 2021). Historically, seagrasses evolved under grazing pressure and meadows may not have been dominated by large climax seagrass species with structurally complex canopies but a dynamic mosaic of varying grazing stages (Christianen et al., 2021). A decrease in herbivore abundance due to anthropogenic pressure may have led to more structurally complex canopies, yet the biomass that is not consumed by grazing can then potentially degrade within the meadow and serve as a substrate for slime molds and other microbiota, thereby negatively impacting seagrasses and/or sediment oxygenation (Jackson et al., 2001). Seagrass canopy complexity can decrease due to grazing dynamics, with a potential effect on Corg in their associated sediment.
Seagrass meadows were historically resilient to coastal impacts and withstood high levels of herbivory, yet seagrasses have been declining in recent decades at alarming rates. Seagrasses are a highly threated coastal habitat and declined worldwide at an estimated 7% per year between 1990 and 2000, compared to a 1% decline per year before 1940 (Waycott et al., 2009). Diminished water quality, algal blooms, destructive fishing practices, invasive species, and climate change are key stressors of seagrass habitats (Orth et al., 2006). Seagrass grazing at low intensities can increase nutrient content and productivity in seagrasses, while excessive grazing can lead to a decline in both parameters (Fourqurean et al., 2010; Molina Hernández and van Tussenbroek, 2014; Fourqurean et al., 2019; Christianen et al., 2021). Seagrass meadows have been recently declining or have collapsed at multiple locations from increased grazing intensity from megaherbivores, mainly sea turtles (Christianen et al., 2014; Fourqurean et al., 2019; Christianen et al., 2021). Intense grazing by sea turtles can lead to rhizome consumption and an increase in pioneer seagrass species (Christianen et al., 2014; Scott et al., 2020; Christianen et al., 2021). Increased urchin densities and consequent grazing can also lead to seagrass loss (Rose et al., 1999; Langdon et al., 2011). Seagrass decline and loss could diminish the ecosystem services meadows provide, including Corg sequestration.
Overgrazing can impact multiple seagrass ecosystem services. Seagrass capacity to support fisheries by serving as a nursery habitat and their role in coastal protection, nutrient uptake and Corg sequestration may be diminished under excessive grazing (Scott et al., 2018; Christianen et al., 2021). Living seagrass tissue and a positive carbon balance lead to Corg sequestration. In contrast, the degradation or loss of living seagrass tissues diminishes active Corg sequestration in the ecosystem and leaves the Corg pools in the sediment vulnerable to remineralization (Pendleton et al., 2012; Marbà et al., 2015). Overgrazing by sea urchins has been shown to decrease seagrass sediment Corg by as much as 35% to 46% (Carnell et al., 2020). Trophic dynamics between seagrass, grazers and their predators, can influence seagrass canopies and the Corg stored in their sediment, with higher Corg sequestration expected at intermediate grazing and predation levels (Atwood et al., 2015). Corg content in seagrass sediment can be unaffected by simulated grazing (Moran and Bjorndal, 2007; Dahl et al., 2016) or experimental shading, yet may lead to erosion and a decrease in Corg in surficial sediment layers (Dahl et al., 2016). Overgrazing in seagrass meadows can therefore lead to the destabilization and/or erosion of the sediment and subsequent loss of associated Corg (Dahl et al., 2021). More research is currently needed on the dynamics of Corg sequestration and grazing, particularly in tropical regions.
The effects of overgrazing on seagrasses have not been studied in Central America to date (Dahl et al., 2021) and blue carbon studies in tropical seagrass meadows have been scarce (Serrano et al., 2021). In this study, we aimed to assess the effect of megaherbivore exclusion over a 13-month time period at a tropical seagrass meadow that has shown decline in structural complexity over twenty years of monitoring. We hypothesized that seagrass structural complexity would increase within megaherbivore exclosures compared to control plots. Given an increase in canopy structural complexity within the megaherbivore exclosures, we expected to find higher Corg pools in seagrass biomass and in the associated sediment.
This field study was carried out next to the long-term seagrass monitoring site at Perezoso, Cahuita National Park, southern Caribbean coast of Costa Rica (9°44’13” N; 82°48’24” W). This is a tropical location, with average air temperatures ~ 26°C and water temperatures at 1.5 m between 25 and 33°C (Cortés et al., 2010). Annual precipitation at this location ranges from 1,400 to 4,000 mm (Cortés et al., 2010). There are two dry periods each year, one in March and the other from September to October (Cortés, 2016). Tidal variation is less than 50 cm, and it is mixed and semidiurnal (Lizano, 2006).
At Cahuita, seagrass meadows are found in a sheltered coral reef lagoon. Seagrasses are composed mainly of turtle grass T. testudinum, mixed with manatee grass Syringodium filiforme as a minor component (Fonseca E. et al., 2007; Cortés et al., 2010; Loría-Naranjo et al., 2018). Halodule wrightii and Halophila decipiens are smaller species that have also been found sporadically in these meadows (Samper-Villarreal et al., 2018b). There is synchronized flowering of T. testudinum and S. filiforme around March (Nielsen-Muñoz and Cortés, 2008; Samper-Villarreal et al., 2020b). The long-term monitoring site is less than 1 m in depth and is close to the mouth of Perezoso river (Fonseca E. et al., 2007; Cortés et al., 2010). Seagrass meadows at this site have been monitored at quarterly to biannual intervals since 1999 using the CARICOMP methodology (CARICOMP, 2001). At this site, seagrass canopy complexity has declined in recent times. Leaf length and width of T. testudinum went from 17.5 cm and 9.9 mm respectively in the year 2000, to 2.8 cm and 5.9 mm by 2015 (Fonseca E. et al., 2007; Loría-Naranjo et al., 2018). A decline in T. testudinum biomass may be linked to environmental deterioration (van Tussenbroek et al., 2014) and Cahuita has been under continued siltation stress since the 1980´s (Cortés and Risk, 1985). There is no treatment of waste water in the town nearby, yet water quality conditions within Cahuita National Park are not considered a key factor leading to seagrass decline (Samper-Villarreal et al., 2021).
Five exclosures and five control plots were haphazardly deployed at the study site on September 1st 2018 and removed on October 3rd 2019, for a total of 13 months deployed in the field. Megaherbivore exclosures were assembled in the field and composed of commercially available electro-welded mesh made of steel rods (5 mm diameter) with 15 cm square openings (Figure 1). Exclosure opening size was aimed at protecting seagrass from grazing by megaherbivores such as fish > 15 cm, sea turtles, and manatees, while smaller herbivores such as small invertebrates, urchins and fish < 15 cm were not excluded. Exclosure tops consisted of square 1.5 x 1.5 m panels. The exclosure sides consisted of rectangular panels 1.5 m in length by 30 cm in height above the sediment and 15 cm pins left at the bottom of each side panel and inserted into the sediment. At each of the corners of the exclosure a rebar rod (50 cm length and 10 mm diameter) was inserted ~ 15 cm into the sediment to support the exclosure and aid anchoring it to the sediment. The panels were attached to each other and to the support rods using plastic zip ties. Control plots consisted only of the rebar rods at the four corners marking an area with the same dimensions as the exclosures. Each exclosure and control were marked with numbered plastic identification tags.
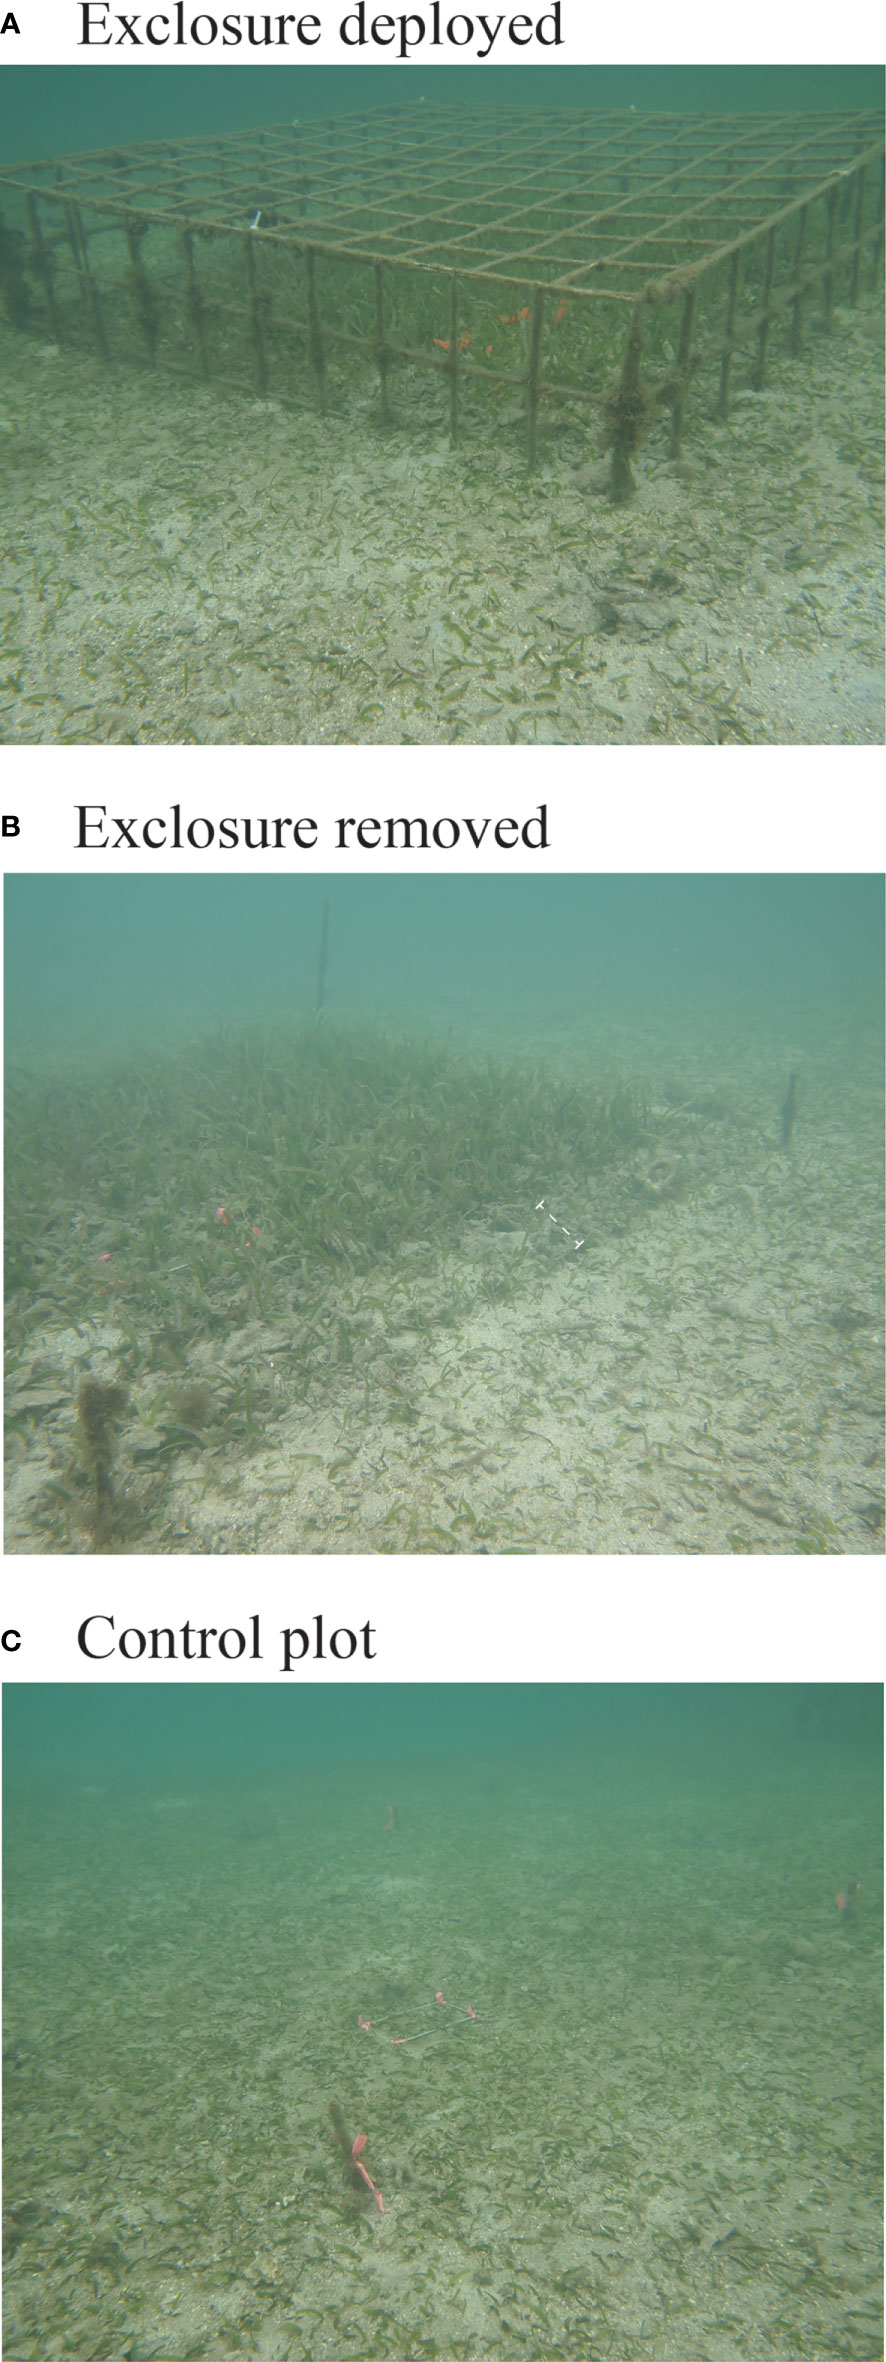
Figure 1 Field photos following 13 months of megaherbivore exclusion. (A) Exclosure deployed in the seagrass meadow. (B) Seagrass immediately after exclosure removal at the time of sample collection. The white dotted line highlights the transition zone near the side panels within the exclosure. (C) Control plot at the seagrass site. Flagging tape marked the rebar at the corners of the control plot and the productivity quadrats in the cages and controls marked in the week prior to sample collection. Cahuita National Park, Limón, southern Caribbean coast of Costa Rica.
Exclosure panels were painted prior to submersion with two coats of industrial epoxy covering (Carbomastic 615 by Carboline) and allowed to dry thoroughly for protection from corrosion while minimizing impact on marine biota. While the exclosures were in the field, we noted growth of crustose coralline algae, fleshy and filamentous macroalgae, corals, and other invertebrates on the exclosures and metal rods; which were removed during each visit at monthly intervals to avoid any potential unintended effects from this biota, such as light limitation. At the 12-month mark from deployment, in September 2019, we noted deterioration in the welded metal of the exclosures and concluded that the exclosures would most likely not hold up for the several months remaining until the following dry season in March. We therefore removed the exclosures after 13 months from the time of deployment, near the end of that dry season.
Seagrass species composition, cover and maximum canopy height were measured once in each exclosure and control (n=5 per treatment). Measurements were carried out at the time of exclosure deployment, at six, nine and 12 months since the date of exclosure deployment, at the time of exclosure removal, and two weeks after exclosure removal. One side panel was left in place on every exclosure plot following exclosure removal to help plot identification two weeks after exclosure removal. Seagrass cover per species was visually estimated by the same observer in a 45 x 45 cm area in the center of each of the exclosures and a 50 x 50 cm area using a quadrat in the center of the control plots. Maximum canopy height was measured using a hand-held ruler.
On the final day of the exclusion period and just before exclosures removal, we measured the relative surficial sediment level inside each of the exclosure. A white PVC corer was placed vertically on the sediment immediately outside each exclosure and the level of the sediment inside the exclosure compared to outside the exclosure at sediment eye level was marked with a pencil on the PVC and the distance measured with a ruler. This was repeated on each side for each exclosure and the four measurements averaged for each exclosure. There was no noticeable increase in the sediment level within the control plots, therefore surficial sediment level measurements were not carried out.
Immediately after removal of the exclosures, 20 ml of surficial sediment was collected in duplicate from each plot (n=10 per treatment) using a 2.8 cm diameter and 3.0 cm depth corer (60 ml plastic syringes). A biomass sample was collected from the top right corner of each plot at the time of exclosure deployment (n=5 per treatment) and from the center of each plot (n=5 per treatment) at the time of exclosure removal. Biomass cores were collected using an 8 cm diameter and 22 cm depth PVC corer and rinsed in the field using a 1 mm opening mesh. Samples were kept frozen until further processing. Following the CARICOMP methodology to measure seagrass productivity (CARICOMP, 2001), a small quadrat of 20 cm x 10 cm was placed near the center of each exclosure and control plot a week before exclosure removal (n=5 per treatment). All T. testudinum leaves within the quadrat were marked at the sediment surface at the time of quadrat placement and shoots were collected on the day of exclosure removal, seven days after marking them. Three T. testudinum seagrass shoots were collected from each of the exclosures for epiphyte estimation (n=15). Seagrass shoots for epiphytes were not collected from the control plots as epiphytes were not seen on their leaves in the field.
Biomass samples were separated into the different seagrass components of leaves and shoots, rhizomes, roots, and flowering structures, and macroalgae and detritus. Seagrass leaves were separated into those with and without epiphytes. Calcareous algae epiphytes were removed from biomass samples by acidification with 10% HCl and filamentous and fleshy algae were removed by manual scraping (CARICOMP, 2001).
For each biomass core, we noted total seagrass shoot density and shoot density for each species. Photographs were taken of a maximum of three shoots per species per core along with a ruler for size estimation. Biomass components were then dried at 60°C and dry weight (DW) per square meter calculated. Leaf length, width and area were estimated from the photographs using ImageJ (Schneider et al., 2012). The total number of leaves and shoots analyzed per treatment depended on the number of species in the samples, whether there were three shoots or less of each species and the number of leaves in each of the shoots (please refer to Table 1 for number of samples analyzed per treatment). Using the photographs, we noted presence or absence of evidence of herbivory for each leaf in the following categories: round leaf tip, leaf tip senescence, shredded leaf tip, elliptical bite marks, and scraping on leaf blade (Valentine and Duffy, 2006). Each leaf could have more than one category.
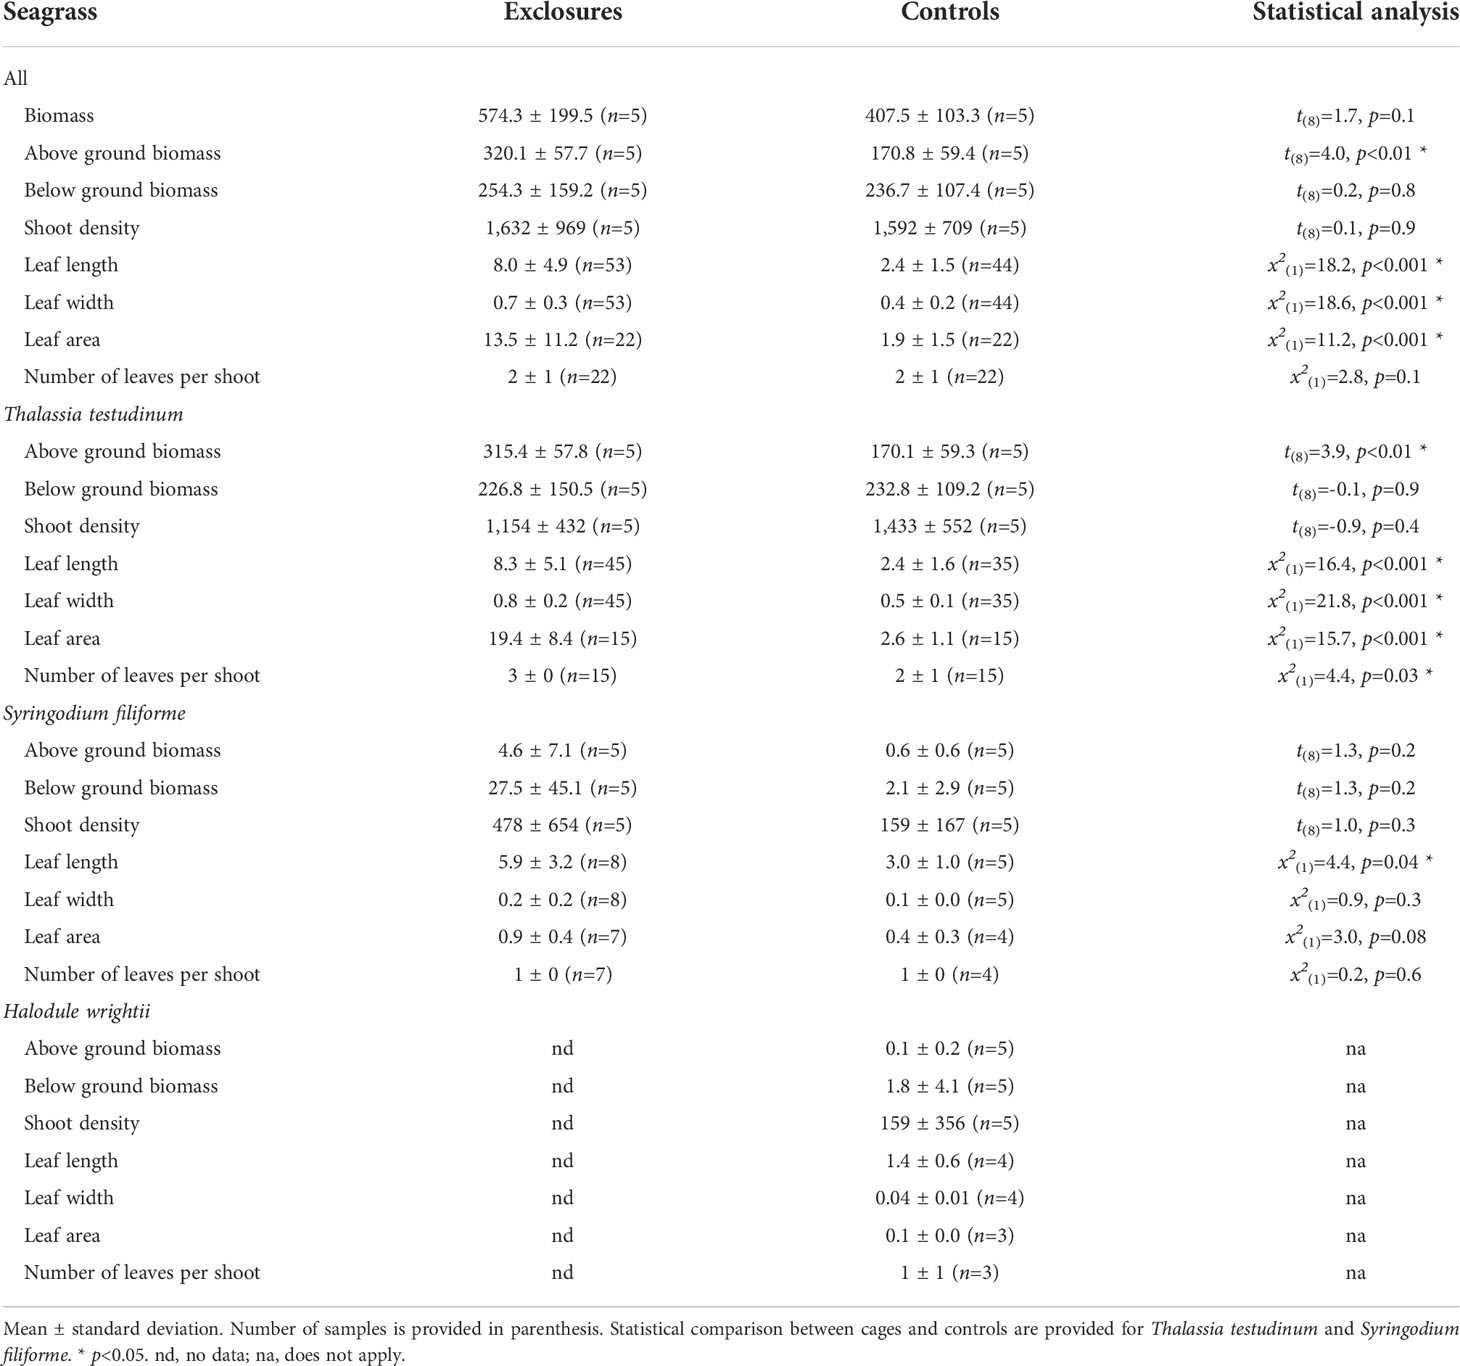
Table 1 Seagrass biomass (g DW m-2), density (shoots m-2), leaf length and width (cm) and area (cm2), and number of leaves per shoot within exclosures and control plots following 13 months of megaherbivore exclusion at Cahuita National Park, Costa Rica.
To measure seagrass leaf productivity, T. testudinum leaves that were marked and collected after a week were separated into old standing crop, new growth and new leaves. Samples were then acidified in 10% HCl and dried at 60°C (n=5 per treatment). To quantify seagrass productivity (mg DW shoot-1 day-1) in the exclosures and control plots, the dry weight of new material (new leaves + new growth) was divided by the density of each quadrat and the number of days from marking to sampling (CARICOMP, 2001).
Epiphytes were isolated from each of the three shoots collected within each of the exclosures by manually scraping each leaf side with a razor blade and distilled water. The epiphytes and water were placed in pre-weighed glass petri dishes, dried at 60°C and weighed. Seagrass leaves per shoot were also dried at 60°C and weighed. Percentage epiphyte biomass per shoot was calculated by comparing epiphyte weight with the corresponding seagrass shoot weight plus epiphyte weight.
Surficial sediment cores were dried at 60°C. One of the sediment samples per plot was used to measure grain size (n=5 per treatment) with an automated shaker at 90 rpm for 15 minutes with sieves of > 4, 4, 2, 1, 0.5, 0.25, 0.125, and < 0.062 mm diameter sizes. The other sediment sample for each plot was weighed to estimate sediment dry bulk density (DBD) and homogenized using a mortar and pestle (n= 5 per treatment). Living seagrass biomass and invertebrates found in the sediment samples were removed before further processing. A subsample of ~ 2 to 3 g of homogenized sediment was used to measure carbon content by Loss on Ignition (LOI) (Heiri et al., 2001). Pre-weighed crucibles were placed in a muffle furnace at 550°C for 4 h, allowed to cool in a desiccator and weighed. Crucibles were then reinserted at 950°C for 2 h, allowed to cool and weighed again. Acidified and non-acidified subsamples of homogenized surficial sediment were used for isotopic analyses. To remove carbonates from the sediment prior to carbon isotopic analysis, ~ 14 ml of 10% HCl was added to ~ 1 ml of homogenized sediment from each sample, allowed to react for 48 h at room temperature and rinsed twice using a centrifuge at 5,000 rpm and distilled water. Acidified sediment samples were then dried at 60°C and homogenized.
We carried out isotopic analyses on non-acidified seagrass biomass from the three species found for both δ13C and δ15N, non-acidified sediment samples for δ15N, and acidified sediment samples for δ13C. Dried above and below ground non-acidified biomass samples for each species from the biomass cores were homogenized and loaded onto tin capsules for stable isotope analyses and carbon content estimation. For seagrass biomass, we measured elemental composition (%) of carbon and nitrogen concurrently with isotopic analyses of the non-acidified biomass. For T. testudinum we analyzed one sample of above ground and one for below ground biomass from each core sampled (n=5 for each per treatment). For S. filiforme we were only able to analyze three samples of above ground (n=3 per treatment) and two samples of below ground material (n=2 per treatment). For H. wrightii we were only able to analyze one sample of above ground and one of below ground biomass, which were only found in the control plots (n=1 for each within controls). Unacidified homogenized sediment was loaded onto tin capsules for δ15N measurement (n=5 per treatment). Acidified homogenized sediment was loaded onto tin capsules for δ13C analysis (n=5 per treatment). Isotopic analyses were carried out at the University of California Davis Stable Isotope Facility.
Carbon percentage was measured as part of the stable isotope analyses for above and below ground biomass. To calculate biomass Corg pools, we estimated mean above and below ground biomass Corg content (% DW) for each seagrass species and related them to the biomass (g DW m-2) of each. To estimate sediment Corg pools, we first calculated organic and inorganic matter from the variation in sediment sample weight during the LOI process (Heiri et al., 2001). Sediment Corg content (% DW) was then calculated using the following equation (Fourqurean et al., 2012; Howard et al., 2014): % Corg = 0.40 * % LOI550 – 0.21. Sediment inorganic carbon (Cinorg) content (% DW) was calculated using (Heiri et al., 2001): % Cinorg = % LOI950 * 1.36. Surficial sediment Corg and Cinorg pools (Mg ha-1) were calculated by relating carbon content (%) to the sediment dry bulk density and standardized to a 10 cm depth interval.
To analyze the origin of Corg in surficial seagrass sediment we considered three potential sources from samples collected in the area: seagrasses, suspended matter, and mangroves. Mean biomass isotopic values for all seagrass species in this study (-7.8 ± 1.5 ‰ δ13C and 1.9 ± 1.0 ‰ δ15N, n=32) were used in the mixing model. Suspended matter values used were -16.4 ± 5.0 ‰ δ13C and 5.2 ± 0.5‰ δ15N from Cahuita (Samper-Villarreal et al., unpublished data). Mangrove values were -31.3 ± 2.1 ‰ δ13C and 4.0 ± 1.0 ‰ δ15N from a mangrove further south on the Caribbean coast (Samper-Villarreal et al., unpublished data).
We analyzed variability of biomass, density, sediment Corg and grain size, and stable isotope and elemental composition between controls and exclosures at the end of the exclusion period using t-tests (de Winter, 2013). To account for interdependence of samples collected within the same sampling date and individual plots we used linear mixed effects models with the packages lme4 (Bates et al., 2015) and lmerTest (Kuznetsova et al., 2017) to analyze potential variation of seagrass cover per species and maximum canopy height during the exclusion time period, biomass, density and leaf metrics at the beginning and at the end of the exclusion time period, and for leaf metrics between the two treatments following the exclusion time period. The simmr package (Parnell, 2021) was used for the carbon sources mixing model. Normality was checked visually and all analyses were done in R v.4.2 (R Core Team, 2021).
Over the 13 months of megaherbivore exclusion, seagrass maximum canopy height increased over time within the exclosures (x2(1)=19.7, p<0.001) while it remained steadily low in the controls (x2(1)=1.8, p=0.2, Figure 2). Total seagrass cover also increased during the exclusion time period within the exclosures (x2(1)=18.1, p<0.001), while it actually decreased in the control plots (x2(1)=16.5, p<0.001 respectively; Figure 2) which remained exposed to megaherbivore grazing. Seagrass cover responded differently during the time of megaherbivore exclusion for the three species found. Cover of T. testudinum increased over time within the exclosures (x2(1)=16.3, p<0.001), while it decreased in the control plots (x2(1)=23.4, p<0.001; Figure 3). In contrast, cover of S. filiforme remained similar over time within exclosures (x2(1)=1.6, p=0.2) and control plots (x2(1)=0.3, p=0.6; Figure 3). Similar to S. filiforme, H. wrightii cover did not vary over time within the exclosures (x2(1)=0.2, p=0.7) or control plots (x2(1)=1.0, p=0.3; Figure 3).
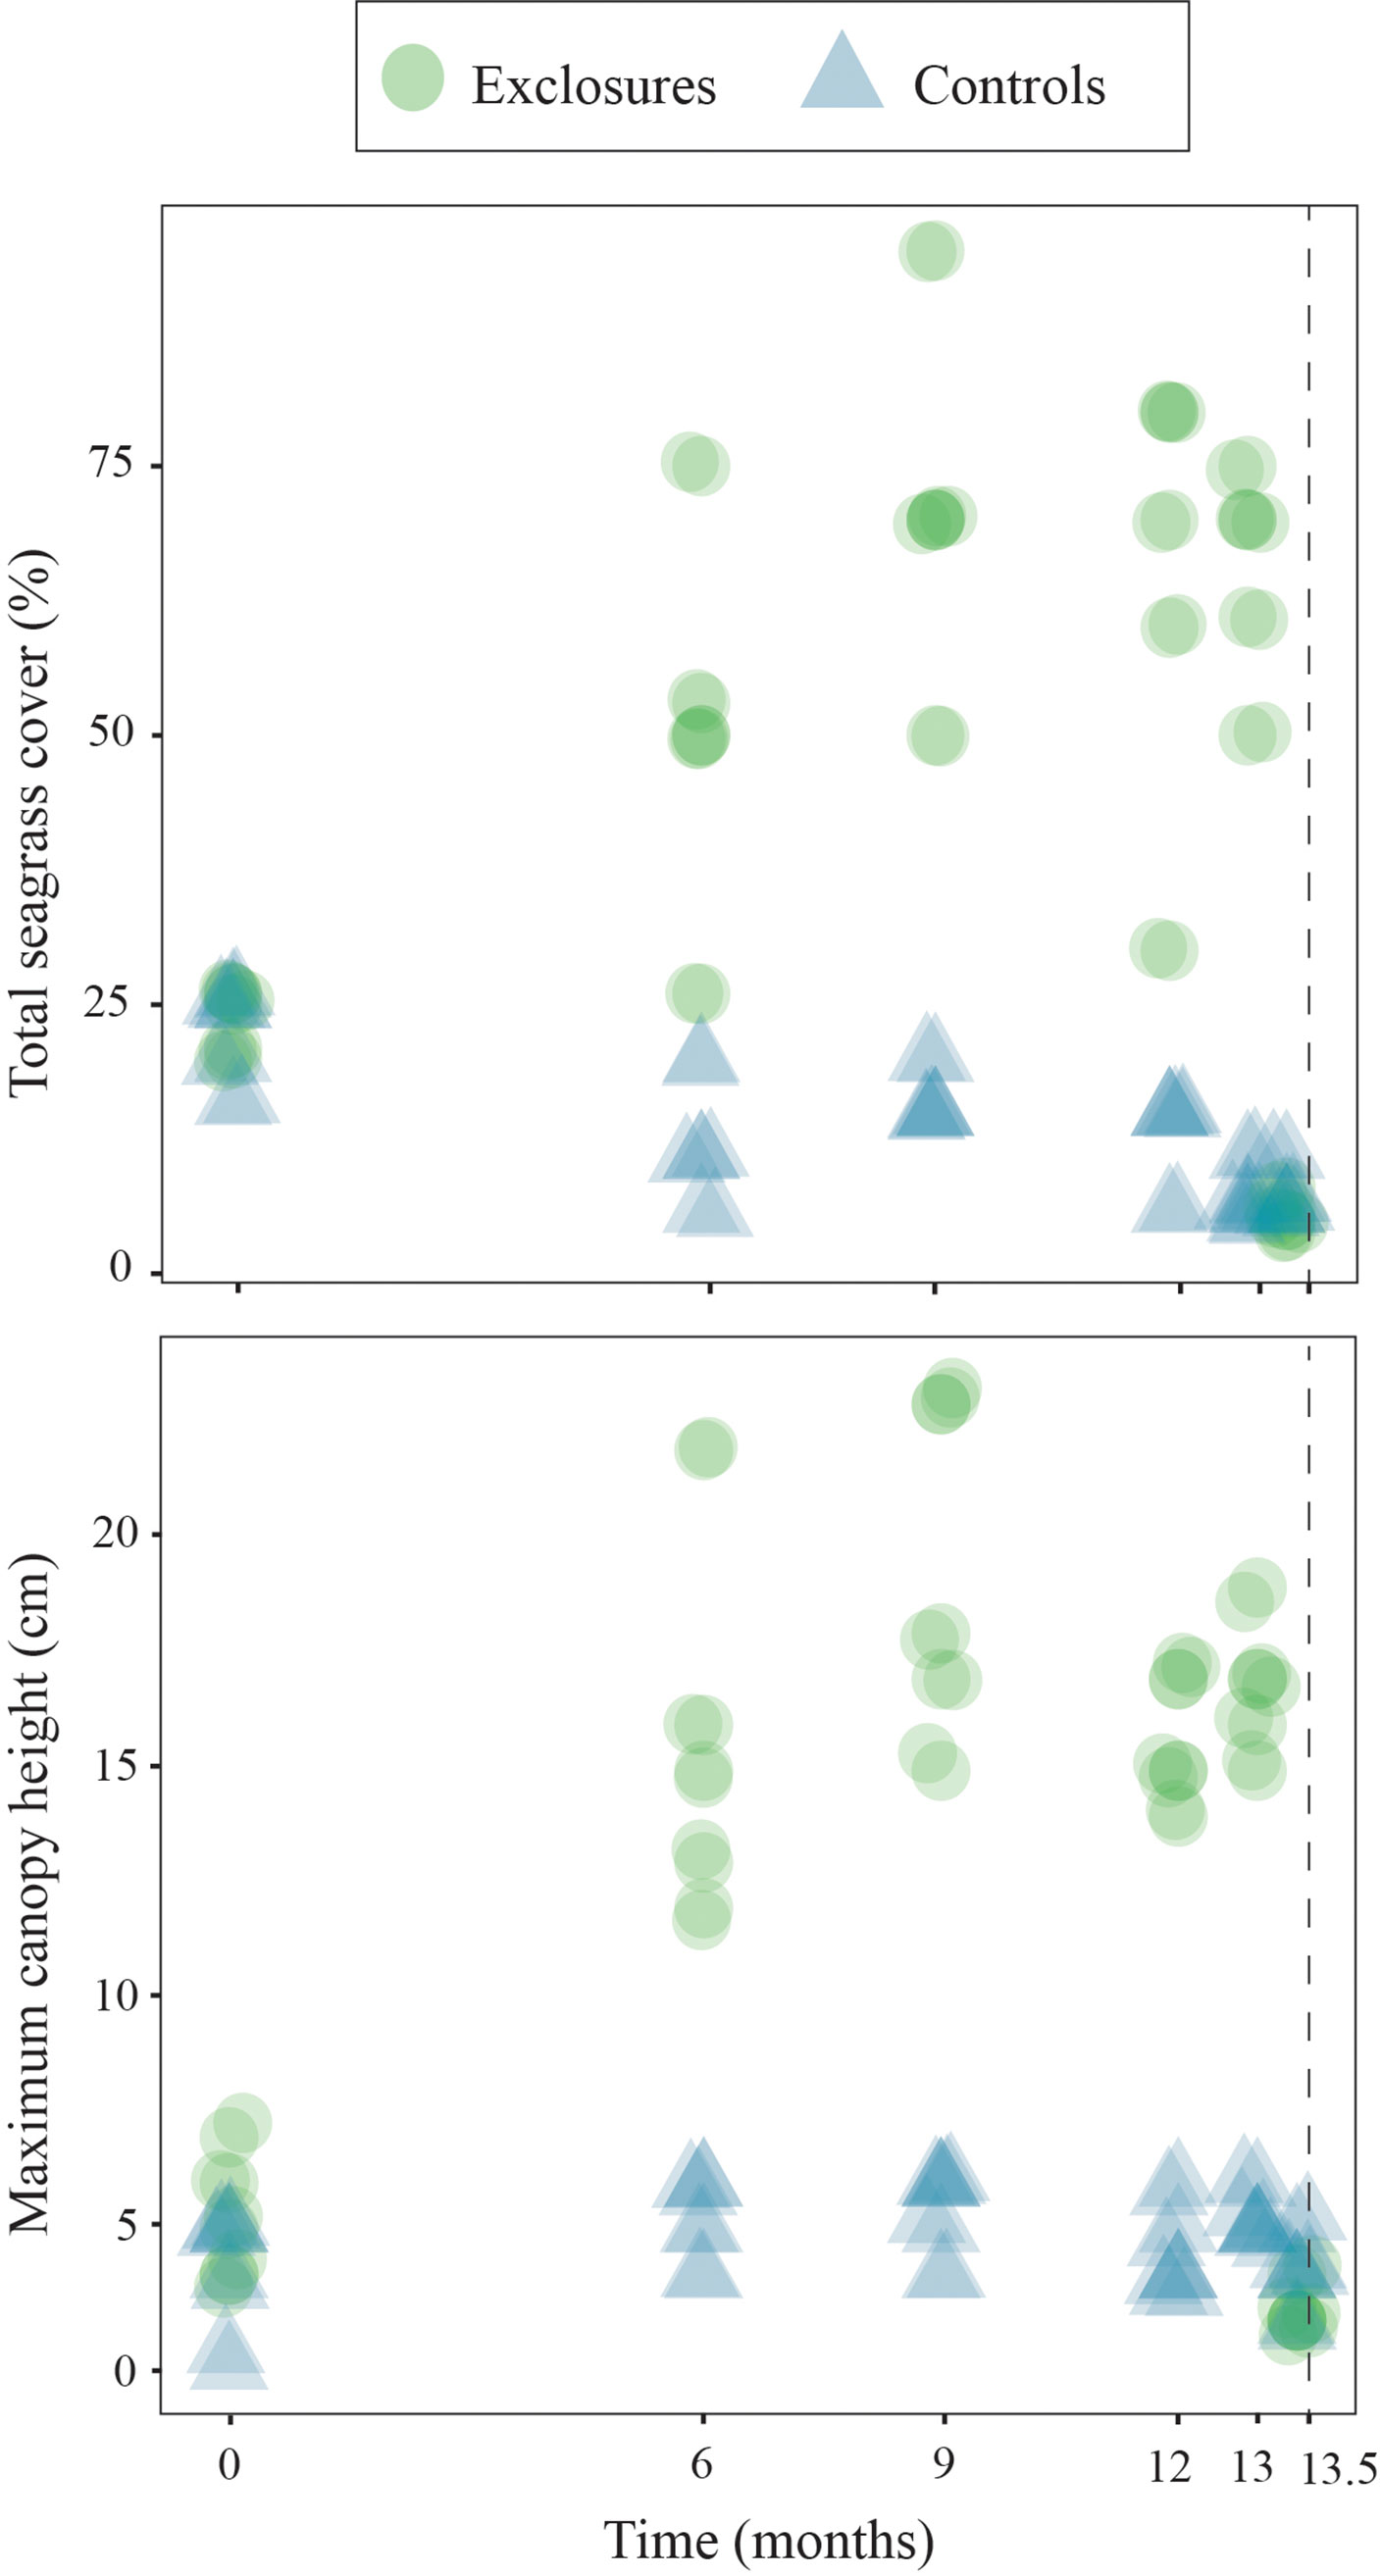
Figure 2 Total seagrass cover and maximum canopy height within exclosures and controls over 13 months of megaherbivore exclusion at Cahuita, southern Caribbean coast of Costa Rica. The dotted line marks an additional sampling two weeks after exclosures were removed. Results have been jittered for visualization purposes.
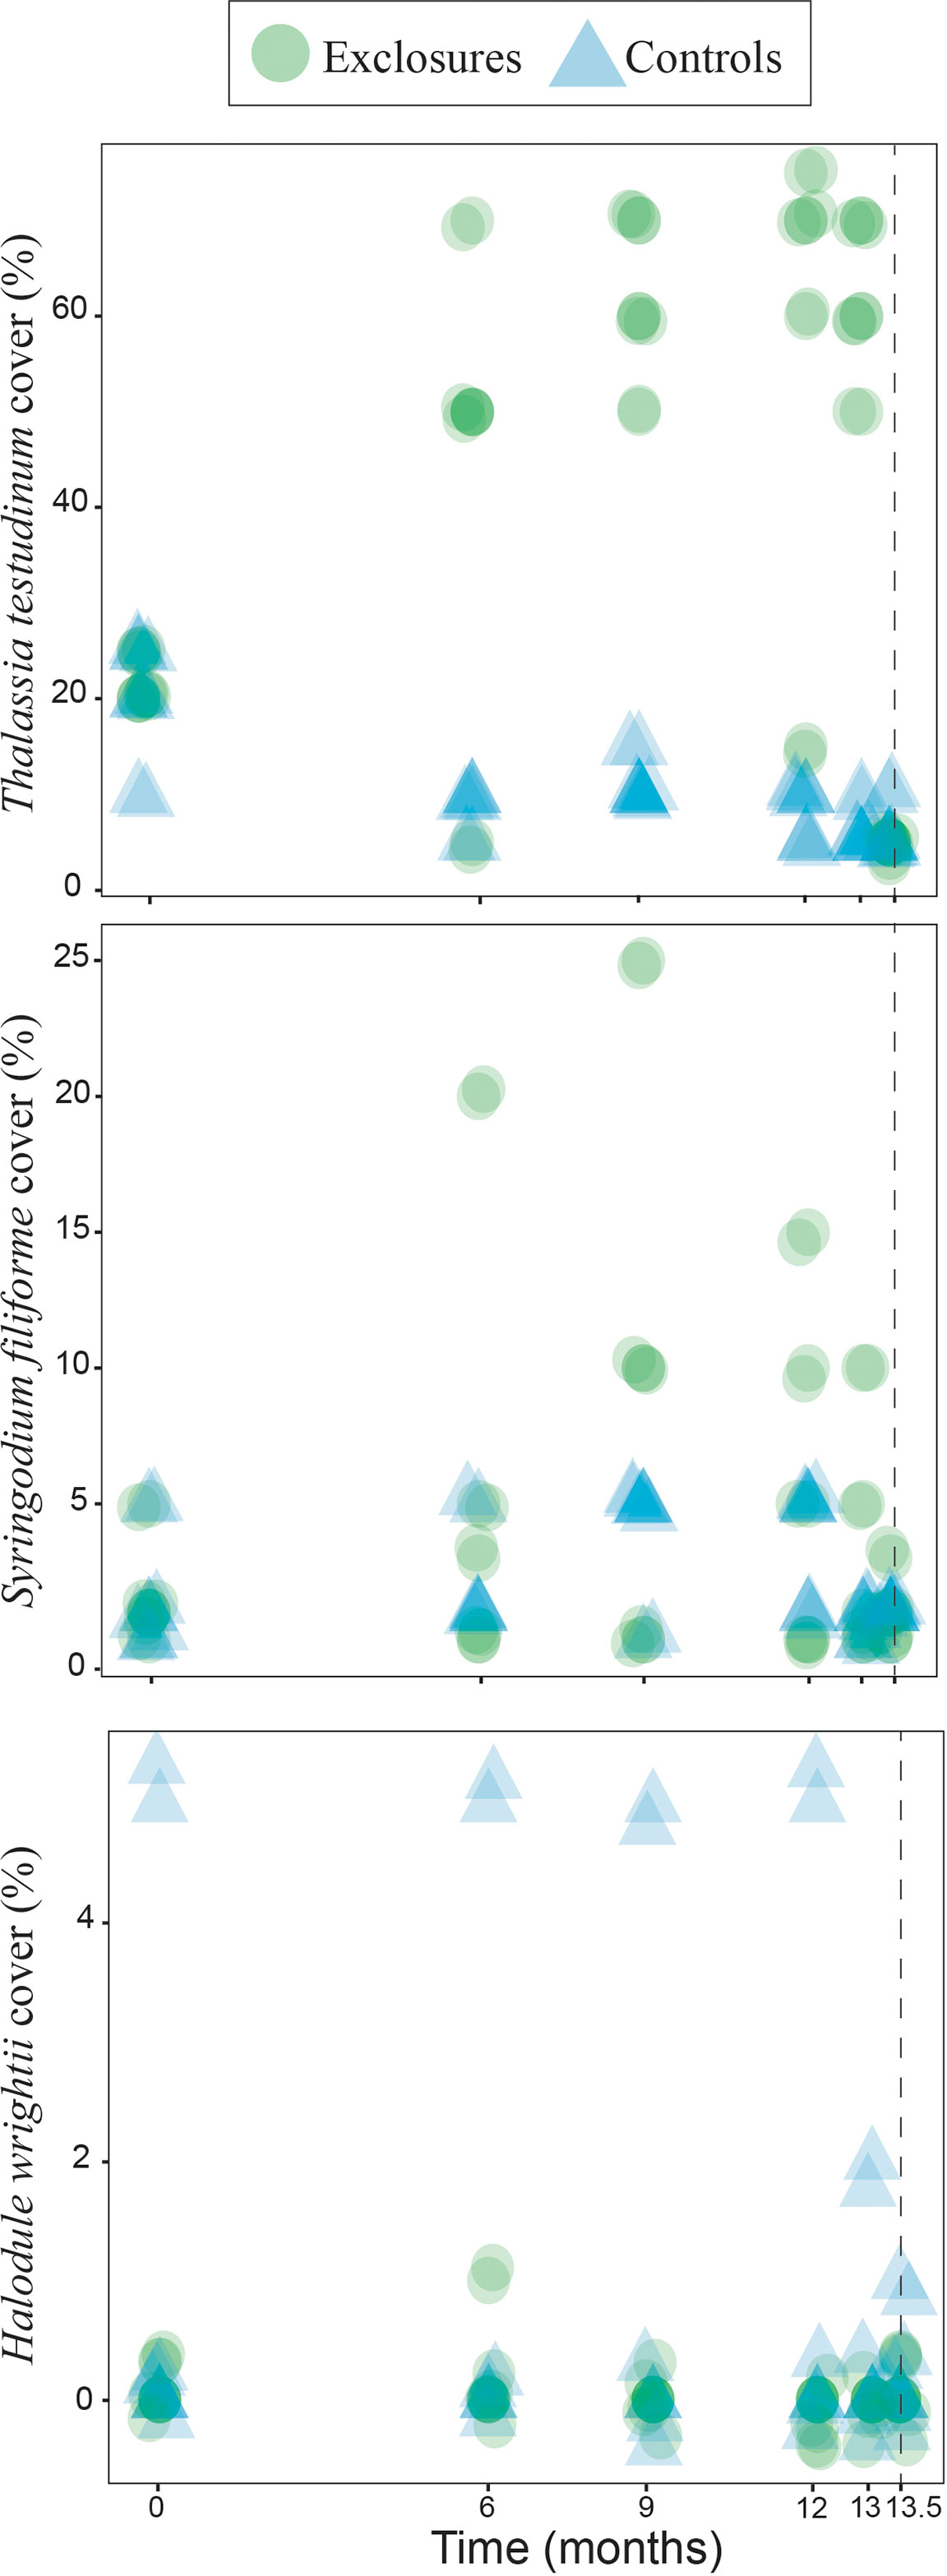
Figure 3 Seagrass cover per species within exclosures and in the control plots over 13 months of megaherbivore exclusion at Cahuita, southern Caribbean coast of Costa Rica. The dotted line marks a sampling two weeks after the removal of the exclosures. Results have been jittered for visualization purposes.
We sampled seagrass biomass cores in each of the exclosures and controls at the time of deployment and after the megaherbivore exclusion time period. We were therefore able to compare seagrass biomass and canopy complexity for those two sampling dates and treatments. When comparing seagrasses at the beginning and after 13 months of megaherbivore exclusion, we found larger leaves overall within exclosures at the end of the megaherbivore exclusion time period (x2(1)=10.4, p<0.01; Figure 4). Thalassia testudinum leaf length (x2(1)=11.3, p<0.001) and width (x2(1)=17.6, p<0.001) were higher within exclosures following megaherbivore exclusion (Figure 4). Meanwhile, we found overlapping values overall for biomass and density (Figure 4), without any statistically significant differences for total (x2(1)=2.6, p=0.1), above ground (x2(1)=0.3, p=0.6; Figure 4) and below ground (x2(1)=0.3 p=0.6; Figure 4) biomass or shoot density (x2(1)=1, p=1; Figure 4).
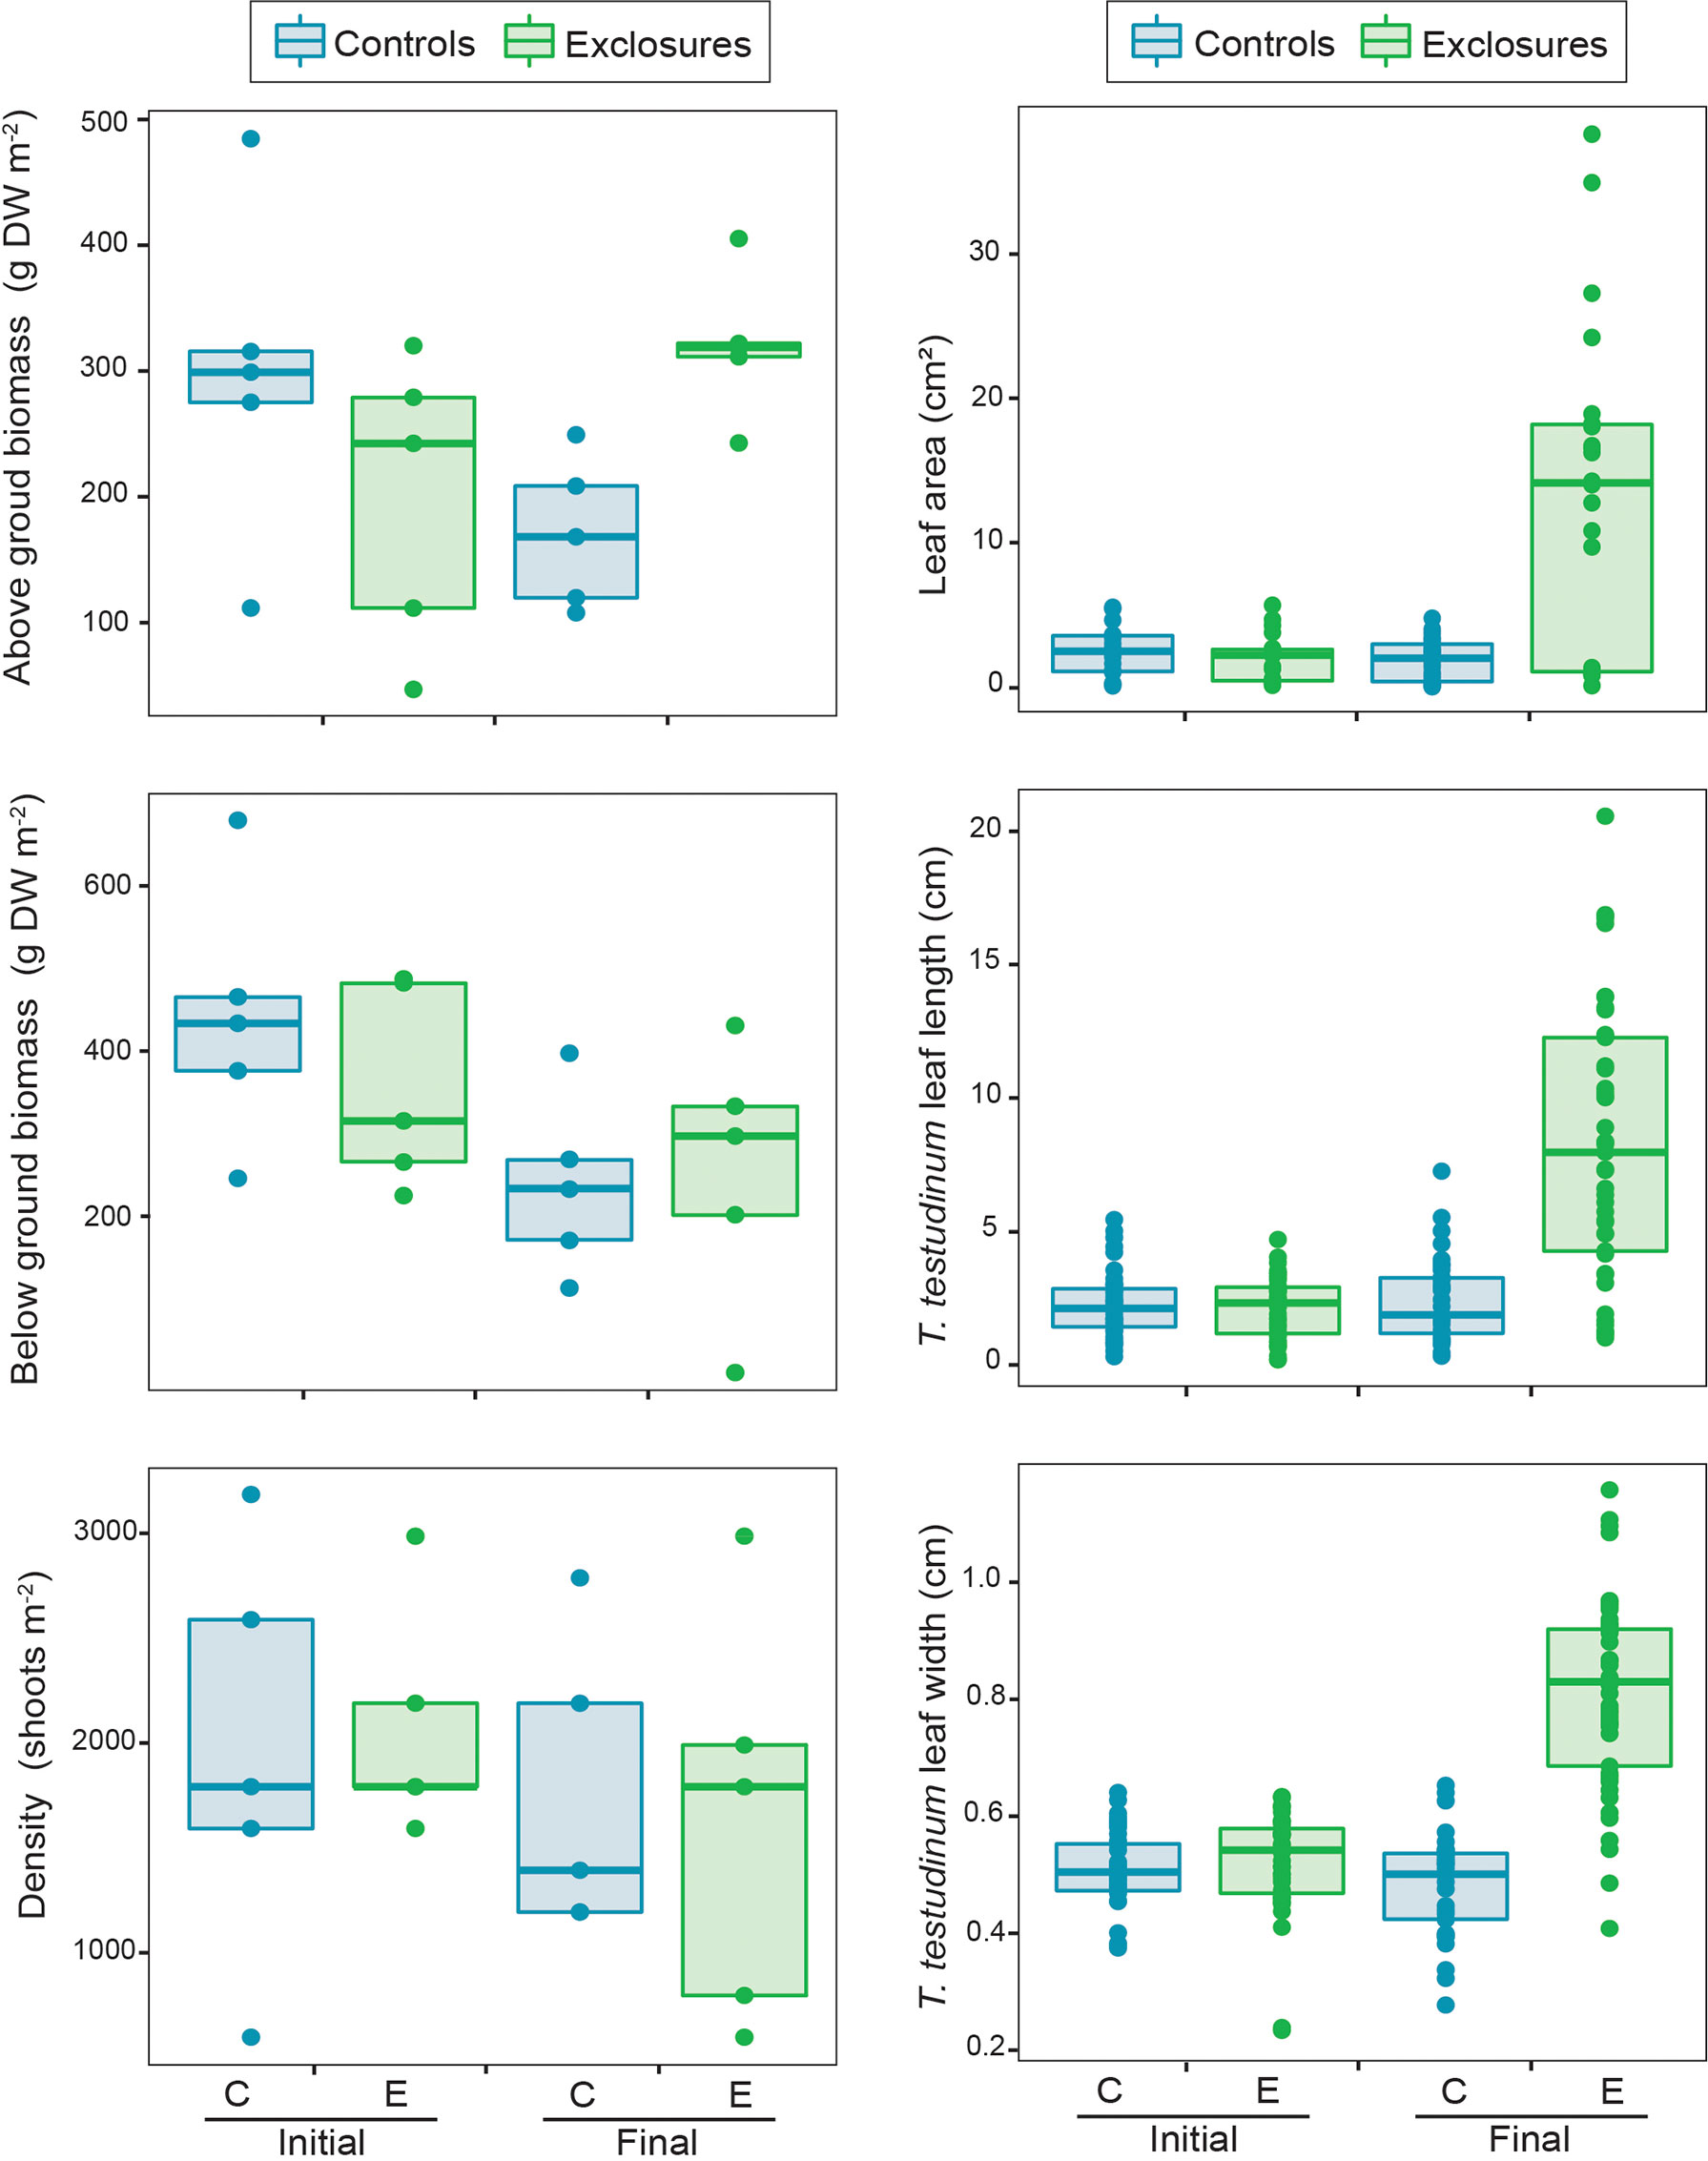
Figure 4 Seagrass above and below ground biomass, density, leaf area and Thalassia testudinum leaf length and width within controls and exclosures at the start and end of 13 months of megaherbivore exclusion at Cahuita, southern Caribbean coast of Costa Rica.
At the sampling following the exclusion period, above ground biomass was higher in the exclosures compared to the controls, while total and below ground biomass did not vary between the two treatments (Table 1). During exclosure removal, only T. testudinum and S. filiforme were found in both exclosures and controls, while H. wrightii was not found within exclosures (Table 1). Thalassia testudinum above ground biomass was two-times higher within exclosures; while its below ground biomass was similar between exclosures and controls (Table 1, Figure 4). There was no variation in above or below ground biomass between exclosures and controls for S. filiforme (Table 1). Average detritus biomass in exclosures (314 ± 272 g DW m-2) was similar to the controls (330 ± 187 g DW m-2; t(8)=-0.1, p=0.9). Benthic macroalgae were not found in the exclosures and their biomass was 0.4 ± 0.9 g DW m-2 in the controls.
At the end of the megaherbivore exclusion period, seagrass leaves were clearly longer and wider within the exclosures compared to the controls (Table 1). Thalassia testudinum leaves were longer, wider, had more leaves per shoot and leaf area per shoot was almost eight times larger within exclosures compared to controls (Table 1, Figure 4). Syringodium filiforme leaves were longer but not wider, and did not have more leaves or area per shoot in the exclosures compared to the controls (Table 1). Leaf productivity of T. testudinum at the time of exclosure removal was about two-times higher within the exclosures (2.0 ± 0.7 mg DW shoot-1 day-1, n=5) compared to the controls (0.7 ± 0.2 mg DW shoot-1 day-1, n=5; t(8)=4.4, p<0.01). In contrast, total shoot density was similar in exclosures and controls (Table 1).
Following the exclusion period, Corg content (% DW) in seagrass biomass overall was 35.6 ± 1.5% (n=15) within exclosures, which was higher than the 34.8 ± 2.1% (n=17) found in controls (x2(1)=3.9, p=0.047). Thalassia testudinum had higher Corg content (% DW) in above and below ground biomass in the exclosures compared to the controls (Table 2). In contrast, Corg content in above and below ground biomass of S. filiforme was similar between exclosures and controls (Table 2).
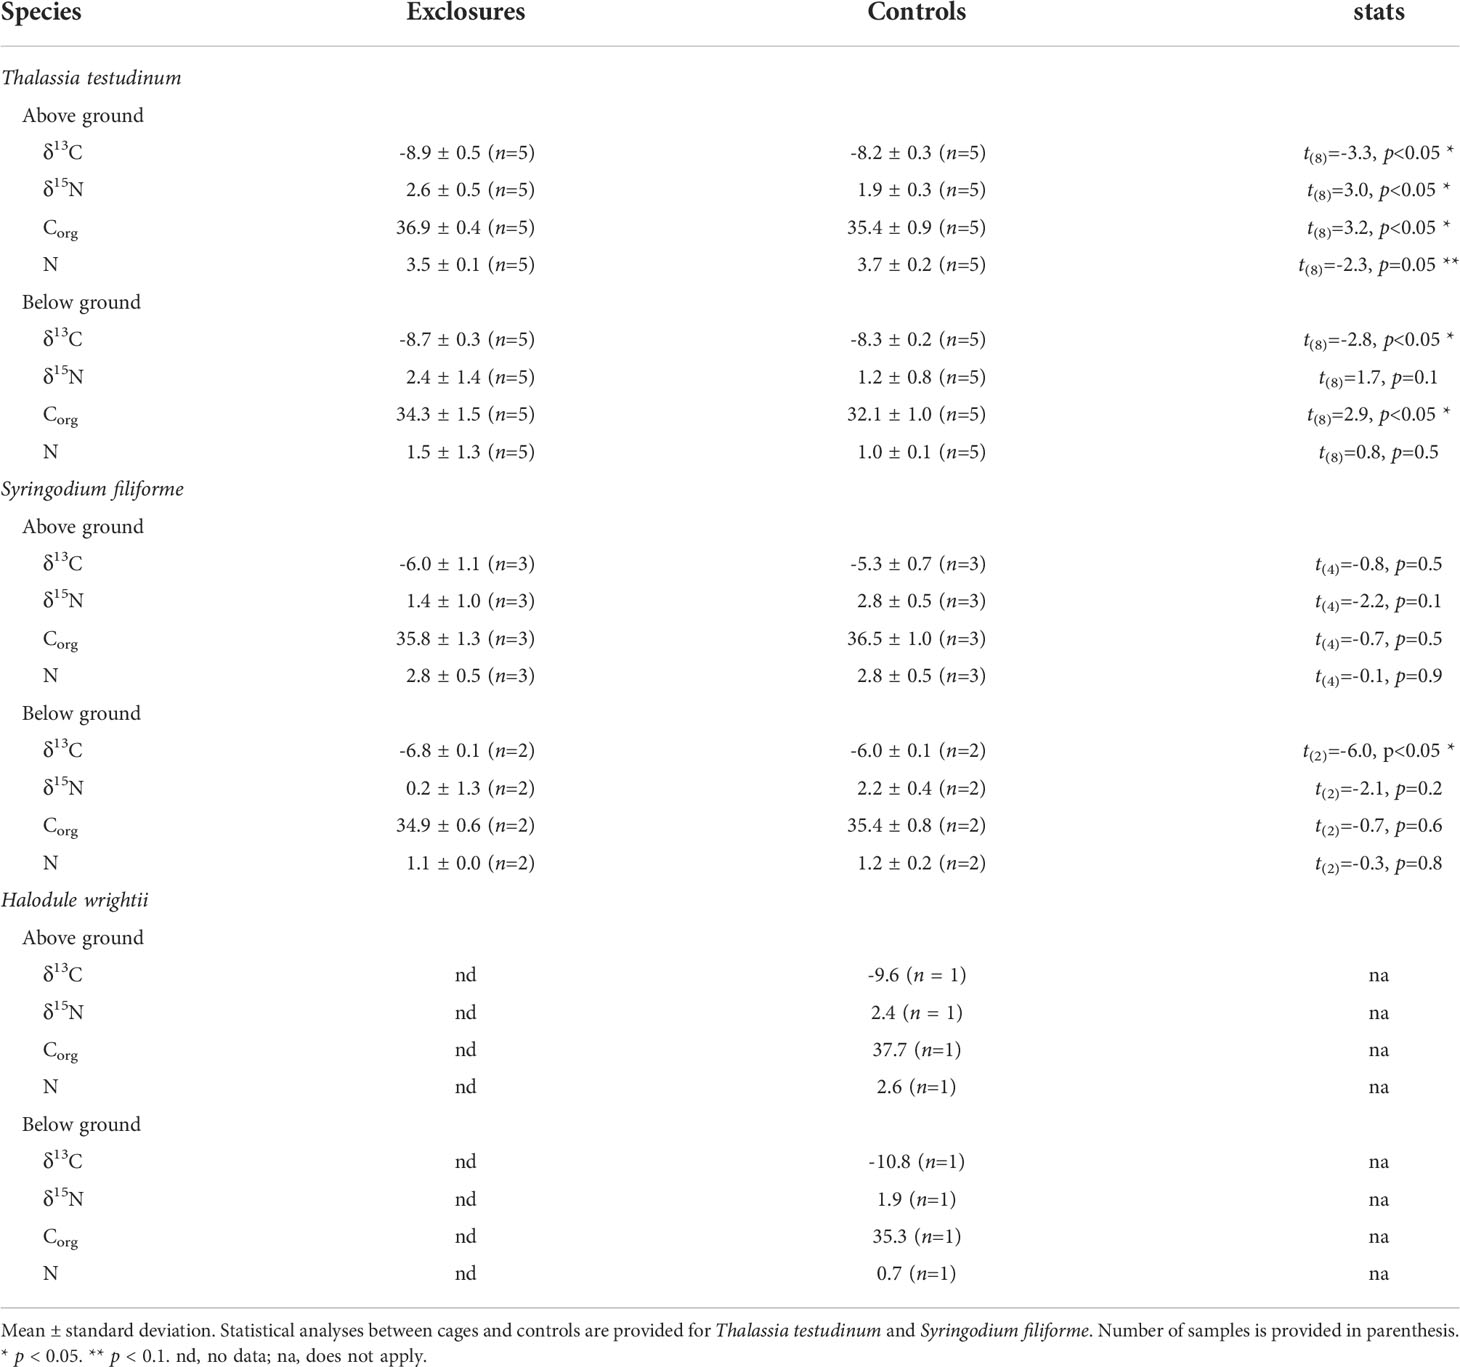
Table 2 Stable isotope (‰) and elemental composition (%) of seagrass biomass per species within exclosures and control plots following 13 months of megaherbivore exclusion at Cahuita National Park, Costa Rica.
Above ground biomass pools in the exclosures were 1.2 ± 0.2 Mg Corg ha-1; while the controls had about half of that with 0.6 ± 0.2 Mg Corg ha-1 (t(8)=4.3, p<0.01). Below ground biomass pools in the exclosures contained 0.9 ± 0.5 Mg Corg ha-1 which was similar to the pool in the controls of 0.8 ± 0.3 Mg Corg ha-1 (t(8)=0.4, p=0.7). Total biomass Corg pools in the exclosures of 2.1 ± 0.7 Mg Corg ha-1 were marginally similar to the 1.4 ± 0.3 Mg Corg ha-1 in the controls (t(8)=2.0, p=0.08).
Biomass δ13C in exclosures (-8.0 ± 1.4 ‰, n=15) was more negative than in the controls (-7.7 ± 1.6 ‰, n=17; x2(1)=9.5, p<0.01). Above and below ground biomass of T. testudinum had enriched δ13C values in the controls compared to the exclosures (Table 2). Below ground biomass of S. filiforme also had enriched δ13C values in the controls compared to the exclosures, while there was no variation between them for above ground biomass (Table 2).
Nitrogen content (% DW) in seagrass was similar between exclosures and controls. Biomass contained 2.4 ± 1.2% nitrogen within exclosures (n=15), which was similar to the 2.2 ± 1.2% (n=17) found in controls (x2(1)=0.2, p=0.6). Nitrogen content of T. testudinum in below ground biomass was similar between exclosures and controls (Table 2). Meanwhile, above ground biomass had marginally significant higher nitrogen content in controls compared to the exclosures (Table 2). Nitrogen content in S. filiforme biomass was similar between exclosures and controls (Table 2).
Total biomass δ15N was 2.0 ± 1.3 ‰ (n=15) in exclosures and 1.9 ± 0.7 ‰ (n=17) in controls, and did not vary between them (x2(1)=0.01, p=0.8). Above and below ground biomass of S. filiforme and below ground biomass of T. testudinum had similar δ15N in the exclosures and controls (Table 2). In contrast, above ground biomass of T. testudinum had enriched δ15N values in the exclosures compared to the controls (Table 2).
There was evidence of grazing on all S. filiforme leaves both in the exclosures and the controls. Leaves of S. filiforme were not considered to have been subjected to breakage as this is a hydrodynamically calm area of the meadow and there are much longer leaves of S. filiforme without evidence of breakage in higher energy areas nearby (JSV pers. obs.). Leaves of T. testudinum showed evidence of herbivory on ~ 50% of their tips, both in the exclosures and the controls. Grazing evidence on leaves consisted mainly of shredded leaf tips and some leaf scraping. Elliptical bite marks were not found in either exclosures or controls. Rounded leaf tips and leaf tip senescence were found on leaves inside the exclosures and in the controls (Table 3). Epiphytes on T. testudinum were only found within the exclosures and were dominated by crustose coralline algae (CCA). Seagrass dry weight per T. testudinum shoot was 0.05 ± 0.02 g (n=15) and epiphyte dry weight per shoot was 0.01 ± 0.007 g (n=15). Epiphytes represented 17 ± 7% of the total weight per shoot.
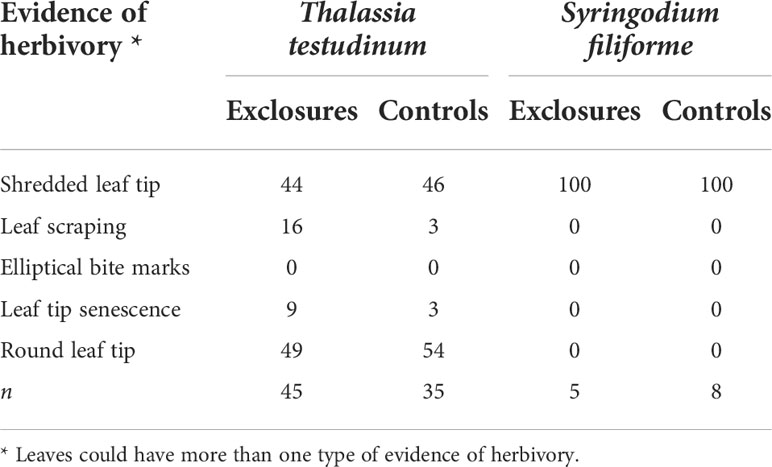
Table 3 Evidence of herbivory (%) on seagrass leaves within exclosures and control plots per species following a 13-month megaherbivore exclusion experiment at Cahuita National Park, Costa Rica.
There was a net increase in Corg stored in the sediment within the exclosures. Following the 13-month deployment period, the increase in mean relative surficial sediment level within the exclosures ranged from 1.7 to 4.4 cm higher than the level outside of the exclosures. Percentage Corg in the surficial sediment of the exclosures was 1.9 ± 0.3%, similar to the Corg of 2.1 ± 0.3% in the controls (t(8)=-1.0, p=0.3). Sediment Corg pools standardized to 10 cm depth were 20.5 ± 2.7 Mg ha-1 in the exclosures, similar to the Corg pools of 21.2 ± 2.8 Mg ha-1 in the controls (t(8)=-0.4, p=0.7). Percentage Cinorg in the sediment of the exclosures was 31.3 ± 0.9%, similar to 30.4 ± 1.8% Cinorg found in the controls (t(8)=1.0, p=0.3).
Sediment dry bulk density (DBD) within megaherbivore exclosures was 1.1 ± 0.1 g ml-1 (n=5), similar to the density of 1.0 ± 0.1 g ml-1 (n=5) found in the controls (t(8)=1.0, p=0.3). Sediment grain size was similar between exclosures and controls, except for higher pebble content within exclosures and higher percentage of coarse sand in the controls (Table 4). Fine sand was marginally higher in the exclosures compared to the controls (p=0.07, Table 4). In the field, we noted dead coral fragments of more than ~ 10 cm on the sediment surface within the exclosures (JSV pers. obs.), which were not included in the grain size analysis.
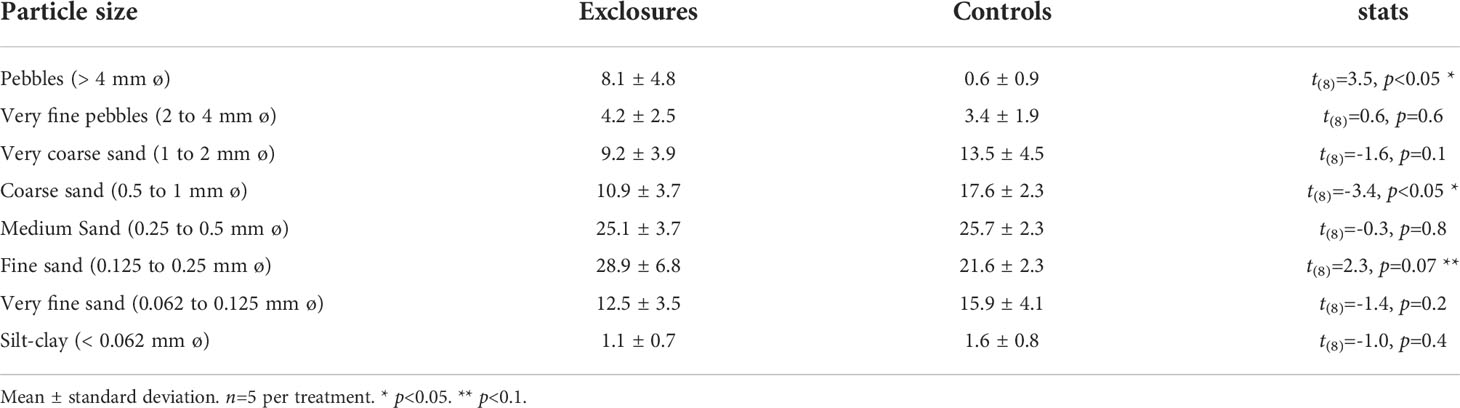
Table 4 Sediment grain size per particle size (%) within exclosures and control plots following 13 months of megaherbivore exclusion at Cahuita National Park, Costa Rica.
Sediment δ13C was -17.6 ± 0.6 ‰ within exclosures, which was marginally depleted compared to the -16.6 ± 0.6 ‰ found in controls (t(8)=-2.2, p=0.055, Figure 5). Sediment nitrogen content was 0.05 ± 0.01% within exclosures, similar to the 0.06 ± 0.01% in controls (t(8)=-0.7, p=0.5). Sediment δ15N was 3.5 ± 0.2 ‰ within exclosures and 3.3 ± 0.3 ‰ in controls, and did not vary between them (t(8)=1.4, p=0.2; Figure 5). The three-source stable isotope mixing models revealed a contribution from seagrass sources of 41% to the Corg in the sediment within the exclosures and 48% in controls. Meanwhile, non-seagrass sources included in the model (mangrove and suspended matter) contributed 59% to the Corg in the sediment in exclosures and 53% in the controls.
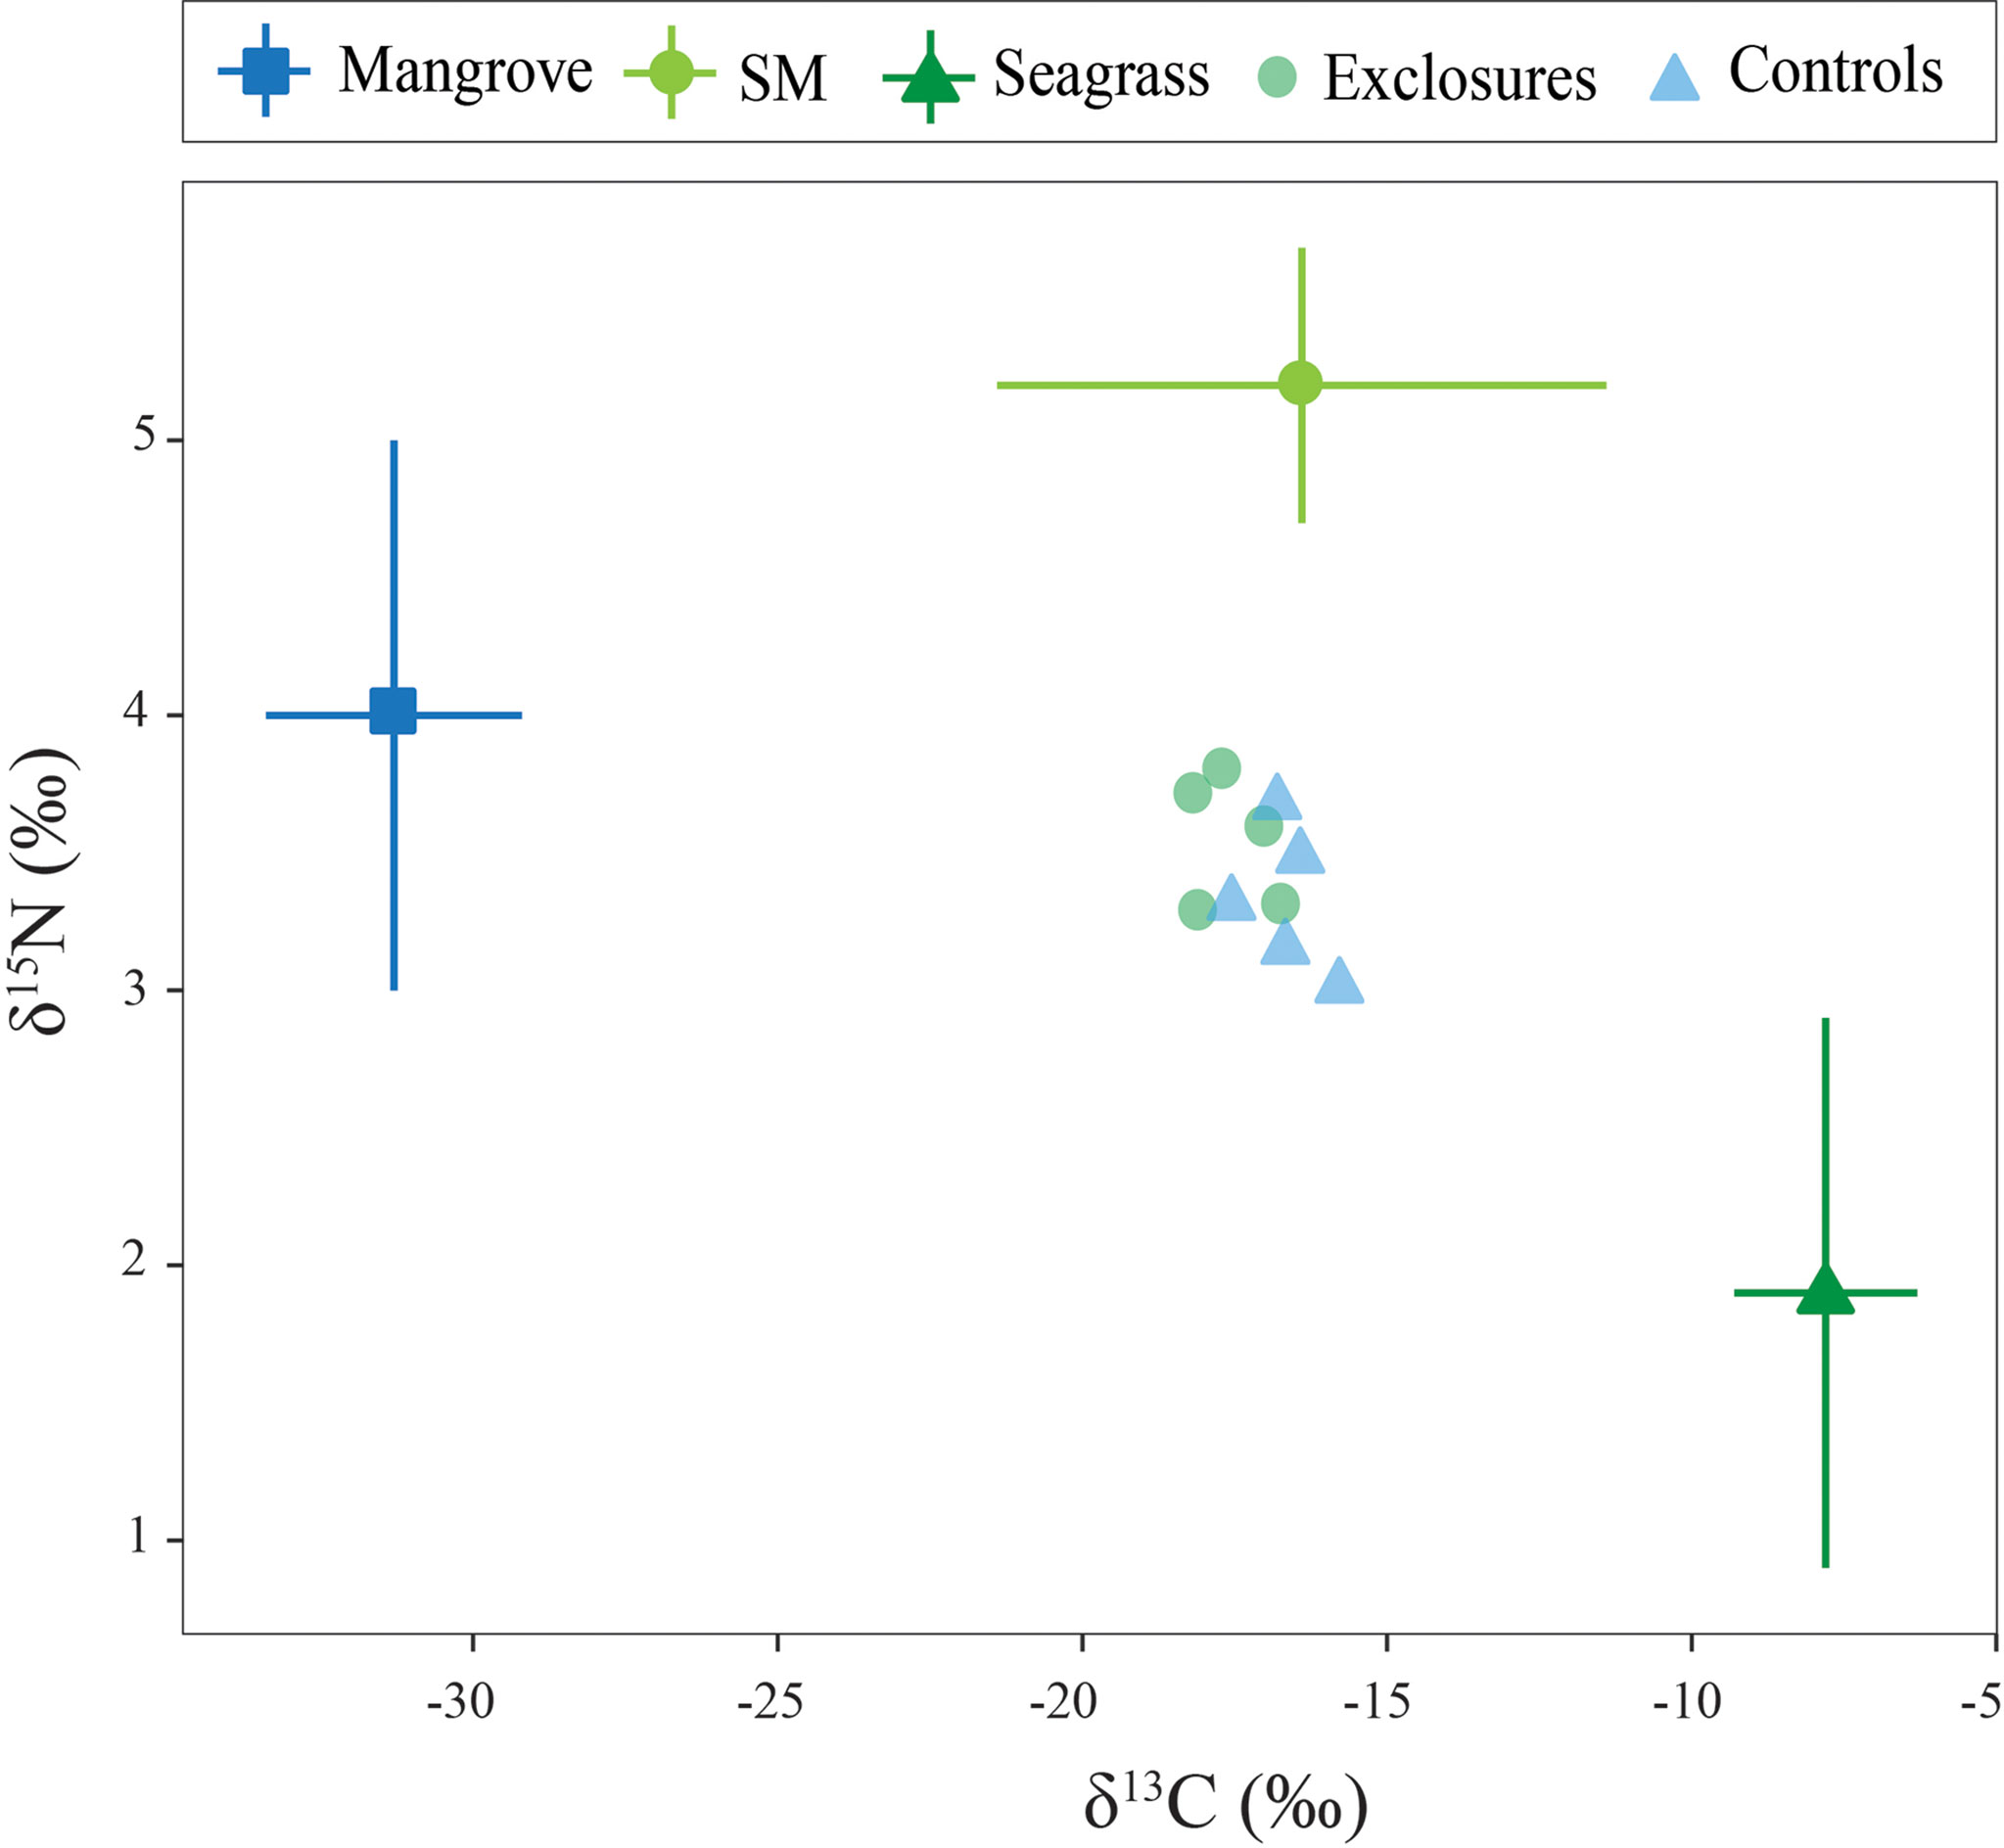
Figure 5 Sediment carbon and nitrogen isotopic values within exclosures and control plots following 13 months of megaherbivore exclusion at Cahuita National Park, Costa Rica. Potential sources used in the mixing models are also included in the graph for comparison.
Megaherbivore exclosures were removed during a full day of field work. At the end of the work day the areas where the exclosures had been removed were clearly identifiable due to more complex seagrass canopies compared to the controls and surrounding seagrasses (Figure 1). The site was visited early the next morning and again two weeks after exclosure removal and the canopy complexity showed an immediate marked decline, with seagrasses that were within the exclosures no longer discernable from the controls (JSV pers. obs., Figure 1).
A tropical seagrass meadow in the southern Caribbean coast of Costa Rica has been monitored since 1999, revealing a marked decline in canopy structural complexity. This decline in leaf length, width and seagrass biomass, has not been caused by diminished water quality. Here, for the first time, we provide evidence that grazing by megaherbivores is the key factor leading to the decline of seagrass canopy complexity at this site. We found higher biomass and sediment Corg pools in more complex canopies protected from megaherbivory, and therefore highlight the need for conservation and management initiatives to protect and increase the carbon sequestration capacity and other ecosystem services provided by these meadows.
The release of seagrasses from megaherbivore grazing within the exclosures at Cahuita led to much larger canopies. Thanks to long-term seagrass monitoring efforts we know that seagrass canopy complexity and biomass have decreased over time at this meadow. Leaf length of T. testudinum decreased from 18 cm in the year 2000 to only 3 cm by 2015; meanwhile leaf width decreased from 10 mm to 6 mm in that period (Fonseca E. et al., 2007; Loría-Naranjo et al., 2018). By the end of our study in 2019, T. testudinum in the control plots had a leaf length of only 2 cm and width of 5 mm, revealing a continued decline of leaf size. Diminished water quality is a key stressor for seagrasses which can cause a decline in canopy complexity, seagrass degradation, and can ultimately lead to seagrass loss (Waycott et al., 2005; Orth et al., 2006). This site has been under siltation stress for decades (Cortés and Risk, 1985; Cortés et al., 2010), yet water conditions are not considered to be causing the recent decline in canopy complexity (Samper-Villarreal et al., 2021). We know that decreases in seagrass leaf length and width can also occur from megaherbivore grazing (Moran and Bjorndal, 2005; Fourqurean et al., 2010). By protecting seagrasses from megaherbivory for 13 months at this site we found a marked increase in seagrass canopy complexity within exclosures, thereby revealing megaherbivore grazing as the key factor leading to recent seagrass decline at this site.
Other studies on megaherbivore grazing on seagrass meadows have also found higher canopy complexity when protected from herbivory. In the Caribbean, a one year sea turtle exclusion experiment also led to increased canopy structural complexity, with longer and wider T. testudinum leaves within exclosures in Bermuda (Fourqurean et al., 2010). In grazed meadows of the United States Virgin Islands (USVI), T. testudinum leaves were also wider after three months of sea turtle exclusion (Williams, 1988). In the Indian Ocean, seagrass leaves were longer and wider at meadows under lower grazing pressure along a natural sea turtle grazing gradient (Lal et al., 2010). Meanwhile, in Australia, exclusion of megaherbivores for three months led to higher seagrass leaf length within exclosures compared to grazed controls (Scott et al., 2020; Scott et al., 2021a). Despite a clear increase in leaf length and width after 13 months of exclusion of megaherbivore grazing in our study, shoot densities did not vary between exclosures and controls. This lack of variation in shoot density was also found in the USVI, following three months of sea turtle exclusion (Williams, 1988) and after simulated grazing in the Bahamas (Moran and Bjorndal, 2005). In contrast, excessive grazing led to lower shoot densities in Bermuda (Fourqurean et al., 2010), in the Indian Ocean (Lal et al., 2010), and at one site with intensive grazing in the Great Barrier Reef (Scott et al., 2020). This indicates that the exclusion time period in our study was enough to note changes in leaf length and width but might not have been enough to identify changes in shoot density.
Following the megaherbivore exclusion period at our site, above ground biomass was two-times higher within exclosures, thereby coinciding with the findings from different studies in which seagrasses are released from sea turtle grazing. Increased above ground biomass was also found in Bermuda in seagrasses when protected from megaherbivore grazing (Fourqurean et al., 2010). Above ground biomass of seagrasses was also higher when sea turtle grazing pressure was lower along a grazing gradient in the Indian Ocean (Lal et al., 2010) and after megaherbivore exclusion in Australia (Scott et al., 2020; Scott et al., 2021a). While above ground biomass clearly increases when released from megaherbivore grazing, below ground biomass can remain similar. In our study, we did not find differences in below ground biomass between exclosures and controls. Below ground biomass was also similar between exclosures and controls in Bermuda when protected from excessive grazing (Fourqurean et al., 2010). Furthermore, simulated grazing did not have an effect on below ground biomass in the Bahamas (Moran and Bjorndal, 2005). In addition, exclusion of megaherbivores did not have an effect on below ground biomass in mainland Australia (Scott et al., 2021a). In contrast, in the Great Barrier Reef (GBR), below ground biomass declined at a site exposed to intensive grazing (Scott et al., 2020). Seagrasses are plants that live anchored to the benthos by a network of rhizomes and roots buried in the sediment, photosynthesizing in their above ground biomass and storing the products in their non-photosynthetic biomass below the sediment. Sea turtles usually feed on new leaf tissue and only consume rhizomes once leaves are scarce (Christianen et al., 2014; Christianen et al., 2021). Thus, a decline in seagrass below ground biomass may be indicative of grazing levels at which sufficient above ground biomass cannot be maintained via leaf production.
At our site, leaf growth appears to be enough to sustain grazing of only above ground biomass at the time of our study. Seagrass response to grazing may include increased leaf production using their stored reserves (Valentine and Duffy, 2006). Leaf production as a response to simulated grazing of T. testudinum has been previously found (Moran and Bjorndal, 2005). Leaf productivity of T. testudinum in our study was about two times higher within exclosures compared to controls. Leaf production rates of T. testudinum were also higher within exclosures compared to controls which continued to be grazed in Bermuda and the USVI (Williams, 1988; Fourqurean et al., 2010). However, there is great variability in T. testudinum leaf productivity among the CARICOMP monitoring stations in the Caribbean, which has been linked to variations in environmental conditions at each site (van Tussenbroek et al., 2014). It is also possible that our leaf productivity values in the controls are an underestimation of actual leaf production, as it is likely that some of the newly produced material would have been consumed by megagrazers during the seven days in the field prior to shoot collection. Therefore, studying potential spatial and temporal variability in leaf productivity as well as quantifying grazing rates is needed to assess actual leaf production.
We did not find any flowering shoots at the beginning or end of our study. The lack of flowering within exclosures might be due to the synchronized nature of flowering early in the year at this site (Nielsen-Muñoz and Cortés, 2008; Samper-Villarreal et al., 2020b). In the Caribbean, T. testudinum has developed synchronized flowering strategies linked to predation of reproductive structures by fish (van Tussenbroek et al., 2008). Meanwhile, flowering has been shown to decrease in seagrasses under greater sea turtle grazing in the Indian Ocean (Lal et al., 2010). At this time, further studies at a higher temporal resolution are needed to understand the effect of grazing on flowering at this meadow.
Following 13 months of megaherbivore exclusion, above ground biomass Corg pools increased within the exclosures while below ground biomass Corg pools remained similar between exclosures and controls. In our study, T. testudinum biomass had higher Corg content (%) in the exclosures compared to the controls. In contrast, megaherbivore exclusion in Bermuda did not increase T. testudinum leaf Corg content within exclosures compared to controls (Fourqurean et al., 2010). In our study, higher T. testudinum Corg content combined with higher above ground biomass led to a two-fold increase in above ground biomass Corg pools (Mg Corg ha-1) in the exclosures compared to controls. Above ground biomass Corg pools in both exclosures and controls at this Caribbean site were higher than on the Pacific coast of Costa Rica (Samper-Villarreal and Cortés, 2020; Samper-Villarreal et al., 2020a; Samper-Villarreal et al., 2022). This is most likely due to the presence of much smaller seagrass species on the Pacific coast. Compared to other meadows also dominated by T. testudinum, above ground biomass Corg pools were higher than meadows in Florida (Armitage and Fourqurean, 2016) and were within ranges for meadows in Mexico (Herrera-Silveira et al., 2020). The variation found in above ground biomass Corg pools in meadows of similar species may be linked to the great spatial variability in seagrass biomass among meadows in the Caribbean (van Tussenbroek et al., 2014). Above and below ground biomass of T. testudinum at our site had enriched (less negative) δ13C values in the controls compared to the exclosures in our study. Seagrass leaf δ13C is enriched at higher irradiance levels (Durako and Hall, 1992; Fourqurean et al., 2019). Enrichment of δ13C coincides with lower structural complexity in the controls and therefore most likely higher light availability, yet light availability was not measured in the field.
There was a net increase in sediment Corg pools within the exclosures compared to controls due to an increase in the surficial sediment level within exclosures, while sediment Corg content (%) remained similar between treatments. More complex canopies decrease water flow and increase the deposition of suspended particles, thereby increasing vertical accretion of seagrass sediment (Kennedy et al., 2010). Short- and long-term sediment accumulation rates within seagrass meadows dominated by T. testudinum in the Colombian Caribbean range between 0.04 and 0.7 cm yr-1 (Serrano et al., 2021). Meanwhile, sediment accretion over the summer from experimental eelgrass transplantation in the Wadden Sea was 0.5–0.7 cm (Bos et al., 2007). At our site in 13 months within exclosures, the relative sediment level increased up to 4.4 cm, however long-term accretion rates at this site will be subject to compaction and they remain unknown at this time. Corg content (%) in the surficial sediment at our tropical study site was similar to the reported 2% Corg for seagrass sediment globally (Fourqurean et al., 2012), similar to the Pacific coast of Costa Rica (Samper-Villarreal et al., 2018a; Samper-Villarreal et al., 2020a; Samper-Villarreal and Cortés, 2020; Samper-Villarreal et al., 2022), and higher than meadows also dominated by T. testudinum in the Caribbean coast of Colombia (Serrano et al., 2021); thus indicating effective Corg sequestration in seagrass sediment at our site. Similar to our findings, sediment Corg content did not decrease at a simulated grazing experiment in the Bahamas which maintained canopy structural complexity low over 16 months in clipped plots (Moran and Bjorndal, 2005; Moran and Bjorndal, 2007). Meanwhile, a shading and clipping experiment in Tanzania led to lower Corg and higher erosion in surficial sediment of clipped plots (Dahl et al., 2016). Seagrass loss due to excessive urchin grazing also let to erosion of the top 30 cm of the barren sediment in a temperate Australian meadow (Carnell et al., 2020). Hydrodynamic regime can influence sediment Corg content in seagrass meadows, with lower Corg at more dynamic locations overall (Mazarrasa et al., 2018). The Caribbean has a very low tidal range, with under 50 cm change at our study site; while the locations in Africa and Australia mentioned above are exposed to tidal ranges of over 3 m. Hydrodynamic conditions and their potential interactions with canopy complexity may be a factor influencing the effect of diminished canopy complexity on Corg in seagrass sediment that should be further explored.
We anticipated that sediment within the exclosures would contain more Corg than controls from an increase in input of Corg from both allochthonous and autochthonous sources. Seagrass canopies promote the deposition of suspended particles in the sediment (Koch et al., 2006) and about ~ 50% of Corg from seagrasses is retained within the sediment (Kennedy et al., 2010). In Colombia, seagrass contribution to the sediment was slightly lower than at our site (Serrano et al., 2021). The three-source stable isotope mixing model in our study revealed similar contributions to the sediment in the exclosures and controls. This indicates that there is a net increase in the quantity of Corg within exclosures without a marked variation in the proportion of autochthonous and allochthons sources, though it might take longer than 13 months for marked autochthonous carbon input.
Sediment composition and crustose coralline algae (CCA) epiphytes may be playing a role in sediment accretion within exclosures at our site. In our study, sediment grain size was similar between exclosures and controls overall, yet in the field we noted large pieces of coral rubble (~ 10 cm and larger) inside the exclosures. The burial of large carbonate fragments within seagrass sediment might play a role in vertical accretion that we did not capture in our study. Meanwhile, epiphytic CCA contributed up to 0.6 cm yr-1 in the sediment accretion rate in temperate meadows in Australia (Walker and Woelkerling, 1988). At our study site, a total of 26 species from different functional algal groups have been reported to occur as epiphytes on T. testudinum (Samper-Villarreal et al., 2008). We did not find any epiphytes on T. testudinum leaves in the controls. However, there were abundant CCA on the leaves in the exclosures, representing ~ 20% of the total weight per shoot. In contrast, after three months of herbivore exclusion in the GBR, there was no change in epiphyte abundance, potentially due to low epiphyte loads over all (Scott et al., 2021a). Repeated grazing by green sea turtles (C. mydas) on seagrass leaves crops them to several centimeters above sediment level, which leads to newer leaf tissue with lower calcareous epiphyte content (Bjorndal, 1980). Furthermore, smaller grazers can feed directly on algal epiphytes on seagrass leaves (Valentine and Duffy, 2006). The diversity, abundance and grazing rate of epiphytic grazers is currently unknown at this study site and requires further study.
While it was clear from our study that seagrasses were grazed outside of the exclosures the identity of seagrass grazers at Cahuita remains unclear. There are a multitude of seagrass grazers, from small invertebrates to megaherbivores (Valentine and Duffy, 2006). In the GBR, grazing by macro and mesoherbivores can influence seagrass canopy complexity, yet their impact can vary spatially and temporally (Scott et al., 2021a; Scott et al., 2021b). On a subtropical eelgrass meadow, five-weeks of exclusion showed that smaller grazers can lead to an increase in seagrass epiphytes, while exclusion of grazers such as small fish and shrimp led to increased seagrass cover, shoot height and density. Meanwhile, exclusion of megaherbivores such as large fish, sea turtles and dugongs did not show an effect on the meadows (Ebrahim et al., 2014). Our exclosures were constructed to protect seagrasses from grazers larger than the 15 cm square openings. We did not see parrotfish and sea urchins during the study (JSV pers. obs.), though they were previously common at this meadow and other meadows on the southern Caribbean coast of Costa Rica (Alvarado et al., 2004). At our site, we did not find elliptical bite marks on seagrass leaves, and most of the grazing evidence consisted of shredded leaf tips. It is common to see green turtles (Chelonia mydas) at the study site, particularly late in the afternoon (JSV and JMR pers. obs.). Therefore, we strongly suspect sea turtles are the key megaherbivore grazers at this site. This is also supported by the presence of a transition zone of ~ 10 cm at the sides of the exclosures where seagrasses were cropped to heights similar to the control plots (see Figure 1). This indicates that the exclosures still allowed some grazing at the top and sides of the exclosures, which could be from where sea turtles could place their head inside. This indicates that the maximum leaf lengths found in our study from megaherbivore exclusion might be an underestimation of complete exclusion from megaherbivore grazing and further studies are needed both to directly identify seagrass grazers and to provide adequate grazing rate estimates.
This study provides novel blue carbon data from an understudied region, contributing to further understand the role of seagrass structural complexity and grazing dynamics on carbon storage. We found that releasing seagrasses from megaherbivore grazing led to an increase in seagrass canopy structural complexity and blue carbon pools. The reported values however may be underestimations of the maximum Corg storage they could reach at this site. Thalassia testudinum is the largest species found in Costa Rica (Samper-Villarreal et al., 2018b) and it is the climax seagrass found in the Caribbean (van Tussenbroek et al., 2010). Following 13 months of megaherbivore exclusion, T. testudinum leaf length and width increased dramatically within the exclosures compared to controls. However, leaves within exclosures were still not as long or wide as found two decades prior at Cahuita (Fonseca E. et al., 2007) or at other locations in the Caribbean (Hackney and Durako, 2004). Our findings clearly identify grazing by megaherbivores as the key factor influencing the decline in seagrass canopy complexity in recent years at this site.
Sea turtle populations in the Caribbean have been increasing thanks to conservation efforts. The largest rookery of C. mydas in the Atlantic is found on the northern Caribbean coast of Costa Rica and has a positive population trend (Bjorndal et al., 1999; Troëng and Rankin, 2005). Seagrasses evolved under grazing pressures from large sea turtle populations (Jackson et al., 2001; Bjorndal and Bolten, 2003); however, seagrass meadows are now threatened by a multitude of local, regional, and global anthropogenic stressors (Orth et al., 2006; Waycott et al., 2009). Therefore, current seagrass meadows may not be able to sustain previous grazing levels (Bjorndal and Bolten, 2003). Evidence of this is that degradation and loss of seagrasses at many locations from sea turtle overgrazing has occurred in recent times (Christianen et al., 2014; Christianen et al., 2021). Furthermore, recovery from a barren state may be difficult and could need active restoration efforts. Therefore, it is necessary to intervene meadows under excessive grazing in a timely manner before they shift to a barren state (Christianen et al., 2021). Strategies to protect seagrass from excessive grazing may include megaherbivore exclusion or physical deterrents, such as increasing benthic coralline algae which protect seagrasses near the substrate (Leemans et al., 2020; Christianen et al., 2021). Sea turtle grazing can also be influenced by interactions with apex predators such as sharks (Heithaus et al., 2014). To prevent further decline or loss of seagrasses from excessive megaherbivore grazing, seagrass conservation or restoration efforts need to minimize anthropogenic stressors on seagrasses while at the same time taking into consideration food web dynamics as part of their initiatives.
The data supporting the conclusions of this article will be made available by the authors upon request.
JS-V, JC contributed to study conception, design and funding acquisition. JS-V, JM-R carried out fieldwork. JS-V collected and processed samples, carried out data analysis and developed the manuscript draft, tables and figures. JM-R, JC revised the manuscript draft. All authors approved the submitted manuscript.
This project was funded by the Vicerrectoría de Investigación at the University of Costa Rica.
We would like to thank J. G. Sagot, J. M. Gudiño, Y. Cruz, H. Arce, J. Brais, M. Solís, and A. Moya for their help in the field. We thank M. Mairena and family for their help accessing the study site. Our thanks to R. Valenciano for help with grain size analysis. Our gratitude to the staff at the Área de Conservación La Amistad-Caribe, Parque Nacional Cahuita and CIMAR for their support to carry out the project.
The authors declare that the research was conducted in the absence of any commercial or financial relationships that could be construed as a potential conflict of interest.
All claims expressed in this article are solely those of the authors and do not necessarily represent those of their affiliated organizations, or those of the publisher, the editors and the reviewers. Any product that may be evaluated in this article, or claim that may be made by its manufacturer, is not guaranteed or endorsed by the publisher.
Adams M. P., Hovey R. K., Hipsey M. R., Bruce L. C., Ghisalberti M., Lowe R. J., et al. (2016). Feedback between sediment and light for seagrass: Where is it important? Limnol. Oceanogr. 61, 1937–1955. doi: 10.1002/lno.10319
Alvarado J. J., Cortés J., Salas E. (2004). Population densities of Diadema antillarum Philippi at Cahuita National Park (1977-2003), Costa Rica. Caribb. J. Sci. 40, 257–259.
Armitage A. R., Fourqurean J. W. (2016). Carbon storage in seagrass soils: long-term nutrient history exceeds the effects of near-term nutrient enrichment. Biogeosciences 13, 313–321. doi: 10.5194/bg-13-313-2016
Atwood T. B., Connolly R. M., Ritchie E. G., Lovelock C. E., Heithaus M. R., Hays G. C., et al. (2015). Predators help protect carbon stocks in blue carbon ecosystems. Nat. Clim. Change 5, 1038–1045. doi: 10.1038/nclimate2763
Bates D., Mächler M., Bolker B., Walker S. (2015). Fitting linear mixed-effects models using lme4. J. Stat. Software 67, 1–48. doi: 10.18637/jss.v067.i01
Bjorndal K. A. (1980). Nutrition and grazing behavior of the green turtle Chelonia mydas. Mar. Biol. 56, 147–154. doi: 10.1007/BF00397131
Bjorndal K. A., Bolten A. B. (2003). From ghosts to key species: restoring sea turtle populations to fulfill their ecological roles. Mar. Turt. Newsl. 100, 16–21.
Bjorndal K. A., Wetherall J. A., Bolten A. B., Mortimer J. A. (1999). Twenty-six years of green turtle nesting at tortuguero, Costa Rica: an encouraging trend. Conserv. Biol. 13, 126–134. doi: 10.1046/j.1523-1739.1999.97329.x
Bos A. R., Bouma T. J., de Kort G. L., van Katwijk M. M. (2007). Ecosystem engineering by annual intertidal seagrass beds: sediment accretion and modification. Estuar. Coast. Shelf Sci. 74, 344–348. doi: 10.1016/j.ecss.2007.04.006
CARICOMP (2001). CARICOMP methods manual levels 1 & 2: Methods for mapping and monitoring of physical and biological parameters in the coastal zone of the Caribbean. Kingston, Jamaica: Data Management Centre.
Carnell P. E., Ierodiaconou D., Atwood T. B., Macreadie P. I. (2020). Overgrazing of seagrass by sea urchins diminishes blue carbon stocks. Ecosystems 23, 1437–1448. doi: 10.1007/s10021-020-00479-7
Christianen M. J. A., Herman P. M. J., Bouma T. J., Lamers L. P. M., van Katwijk M. M., van der Heide T., et al. (2014). Habitat collapse due to overgrazing threatens turtle conservation in marine protected areas. Proc. R. Soc B Biol. Sci. 281, 20132890. doi: 10.1098/rspb.2013.2890
Christianen M. J., van Katwijk M. M., van Tussenbroek B. I., Pagès J. F., Ballorain K., Kelkar N., et al. (2021). A dynamic view of seagrass meadows in the wake of successful green turtle conservation. Nat. Ecol. Evol. 5, 553–555. doi: 10.1038/s41559-021-01433-z
Cortés J. (2016). “The Caribbean coastal and marine ecosystems,” in Costa Rican Ecosystems. Ed. Kappelle M. (Chicago and London: University of Chicago Press), 591–617.
Cortés J., Fonseca A. C., Nivia-Ruiz J., Nielsen-Muñoz V., Samper-Villarreal J., Salas E., et al. (2010). Monitoring coral reefs, seagrasses and mangroves in Costa Rica (CARICOMP). Rev. Biol. Trop. 58 (Suppl. 3), 1–22. doi: 10.15517/RBT.V58I0.20036
Cortés J. N., Risk M. J. (1985). A reef under siltation stress: Cahuita, Costa Rica. Bull. Mar. Sci. 36, 339–356.
Dahl M., Björk M., Gullström M. (2021). Effects of seagrass overgrazing on sediment erosion and carbon sink capacity: Current understanding and future priorities. Limnol. Oceanogr. Lett. 6, 309–319. doi: 10.1002/lol2.10211
Dahl M., Deyanova D., Lyimo L. D., Näslund J., Samuelsson G. S., Mtolera M. S. P., et al. (2016). Effects of shading and simulated grazing on carbon sequestration in a tropical seagrass meadow. J. Ecol. 104, 654–664. doi: 10.1111/1365-2745.12564
de Winter J. C. F. (2013). Using the student’s t-test with extremely small sample sizes. Pract. Assess. Res. Eval. 18, 10. doi: 10.7275/E4R6-DJ05
Duarte C. M., Kennedy H., Marbà N., Hendriks I. (2013). Assessing the capacity of seagrass meadows for carbon burial: Current limitations and future strategies. Ocean Coast. Manage. 83, 32–38. doi: 10.1016/j.ocecoaman.2011.09.001
Durako M. J., Hall M. O. (1992). Effects of light on the stable carbon isotope composition of the seagrass Thalassia testudinum. Mar. Ecol. Prog. Ser. 86, 99–101.
Ebrahim A., Olds A., Maxwell P., Pitt K., Burfeind D., Connolly R. (2014). Herbivory in a subtropical seagrass ecosystem: separating the functional role of different grazers. Mar. Ecol. Prog. Ser. 511, 83–91. doi: 10.3354/meps10901
Fonseca E. A. C., Nielsen M. V., Cortés J. (2007). Monitoreo de pastos marinos en Perezoso, Cahuita, Costa Rica (sitio CARICOMP). Rev. Biol. Trop. 55, 55–66. doi: 10.15517/rbt.v55i1.6057
Fourqurean J. W., Duarte C. M., Kennedy H., Marbà N., Holmer M., Mateo M. A., et al. (2012). Seagrass ecosystems as a globally significant carbon stock. Nat. Geosci. 5, 505–509. doi: 10.1038/ngeo1477
Fourqurean J. W., Manuel S., Coates K. A., Kenworthy W. J., Smith S. R. (2010). Effects of excluding sea turtle herbivores from a seagrass bed: overgrazing may have led to loss of seagrass meadows in Bermuda. Mar. Ecol. Prog. Ser. 419, 223–232. doi: 10.3354/meps08853
Fourqurean J. W., Manuel S. A., Coates K. A., Massey S. C., Kenworthy W. J. (2019). Decadal monitoring in Bermuda shows a widespread loss of seagrasses attributable to overgrazing by the green sea turtle Chelonia mydas. Estuaries Coasts 42, 1524–1540. doi: 10.1007/s12237-019-00587-1
Gacia E., Duarte C. M. (2001). Sediment retention by a mediterranean Posidonia oceanica meadow: the balance between deposition and resuspension. Estuar. Coast. Shelf Sci. 52, 505–514. doi: 10.1006/ecss.2000.0753
Hackney J. W., Durako M. J. (2004). Size–frequency patterns in morphometric characteristics of the seagrass Thalassia testudinum reflect environmental variability. Ecol. Indic. 4, 55–71. doi: 10.1016/j.ecolind.2003.12.001
Heiri O., Lotter A. F., Lemcke G. (2001). Loss on ignition as a method for estimating organic and carbonate content in sediments: reproducibility and comparability of results. J. Paleolimnol. 25, 101–110. doi: 10.1023/A:1008119611481
Heithaus M. R., Alcoverro T., Arthur R., Burkholder D. A., Coates K. A., Christianen M. J. A., et al. (2014). Seagrasses in the age of sea turtle conservation and shark overfishing. Front. Mar. Sci. 1. doi: 10.3389/fmars.2014.00028
Herrera-Silveira J. A., Pech-Cardenas M. A., Morales-Ojeda S. M., Cinco-Castro S., Camacho-Rico A., Caamal Sosa J. P., et al. (2020). Blue carbon of Mexico, carbon stocks and fluxes: a systematic review. PeerJ 8, e8790. doi: 10.7717/peerj.8790
Howard J., Hoyt S., Isensee K., Pidgeon E., Telszewski M. (eds.) (2014). Coastal Blue Carbon: Methods for Assessing Carbon Stocks and Emissions Factors in Mangroves, Tidal Salt Marshes, and Seagrass Meadows. Conservation International, Intergovernmental Oceanographic Commission of UNESCO, International Union for Conservation of Nature, Arlington, Virginia, USA.
Jackson J. B. C., Kirby M. X., Berger W. H., Bjorndal K. A., Botsford L. W., Bourque B. J., et al. (2001). Historical overfishing and the recent collapse of coastal ecosystems. Science 293, 629–637. doi: 10.1126/science.1059199
Kennedy H., Beggins J., Duarte C. M., Fourqurean J. W., Holmer M., Marbà N., et al. (2010). Seagrass sediments as a global carbon sink: Isotopic constraints. Glob. Biogeochem. Cycles 24, GB4026. doi: 10.1029/2010GB003848
Koch E. W., Ackerman J. D., Verduin J., van Keulen M. (2006). “Fluid dynamics in seagrass ecology–from molecules to ecosystems,” in Seagrasses: Biology, ecology and conservation. Eds. Larkum A. W. D., Orth R. J., Duarte C. M. (Dordrecht: Springer Netherlands), 193–225. doi: 10.1007/978-1-4020-2983-7_8
Kuznetsova A., Brockhoff P. B., Christensen R. H. B. (2017). lmerTest package: Tests in linear mixed effects models. J. Stat. Software 82, 1–26. doi: 10.18637/jss.v082.i13
Lal A., Arthur R., Marbà N., Lill A. W. T., Alcoverro T. (2010). Implications of conserving an ecosystem modifier: Increasing green turtle (Chelonia mydas) densities substantially alters seagrass meadows. Biol. Conserv. 143, 2730–2738. doi: 10.1016/j.biocon.2010.07.020
Langdon M. W., Paling E. I., Van Keulen M. (2011). The development of urchin barrens in seagrass meadows at Luscombe Bay, Western Australia from 1985 to 2004. Pac. Conserv. Biol. 17, 48. doi: 10.1071/PC110048
Leemans L., Martínez I., van der Heide T., van Katwijk M. M., van Tussenbroek B. I. (2020). A mutualism between unattached coralline algae and seagrasses prevents overgrazing by sea turtles. Ecosystems 23, 1631–1642. doi: 10.1007/s10021-020-00492-w
Leigh S. C., Papastamatiou Y. P., German D. P. (2018). Seagrass digestion by a notorious ‘carnivore.’. Proc. R. Soc B Biol. Sci. 285, 20181583. doi: 10.1098/rspb.2018.1583
Lizano O. (2006). Algunas características de las mareas en la costa Pacı́fica y Caribe de Centroamérica. Rev. Cienc. Tecnol. 24, 51–64.
Loría-Naranjo M., Samper-Villarreal J., Sandoval-Siles M., Cortés J. (2018). Intra- and inter-annual variation in a seagrass meadow on the Caribbean coast of Costa Rica: 2009-2015. Rev. Biol. Trop. 66, 1149–1161. doi: 10.15517/rbt.v66i3.31035
Marbà N., Arias-Ortiz A., Masqué P., Kendrick G. A., Mazarrasa I., Bastyan G. R., et al. (2015). Impact of seagrass loss and subsequent revegetation on carbon sequestration and stocks. J. Ecol. 103, 296–302. doi: 10.1111/1365-2745.12370
Mateo M. A., Romero J., Pérez M., Littler M. M., Littler D. S. (1997). Dynamics of millenary organic deposits resulting from the growth of the mediterranean seagrass Posidonia oceanica. Estuar. Coast. Shelf Sci. 44, 103–110. doi: 10.1006/ecss.1996.0116
Mazarrasa I., Samper-Villarreal J., Serrano O., Lavery P. S., Lovelock C. E., Marbà N., et al. (2018). Habitat characteristics provide insights of carbon storage in seagrass meadows. Mar. Pollut. Bull. 134, 106–117. doi: 10.1016/j.marpolbul.2018.01.059
Mcleod E., Chmura G. L., Bouillon S., Salm R., Björk M., Duarte C. M., et al. (2011). A blueprint for blue carbon: toward an improved understanding of the role of vegetated coastal habitats in sequestering CO2. Front. Ecol. Environ. 9, 552–560. doi: 10.1890/110004
Molina Hernández A. L., van Tussenbroek B. I. (2014). Patch dynamics and species shifts in seagrass communities under moderate and high grazing pressure by green sea turtles. Mar. Ecol. Prog. Ser. 517, 143–157. doi: 10.3354/meps11068
Moran K., Bjorndal K. (2005). Simulated green turtle grazing affects structure and productivity of seagrass pastures. Mar. Ecol. Prog. Ser. 305, 235–247. doi: 10.3354/meps305235
Moran K. L., Bjorndal K. A. (2007). Simulated green turtle grazing affects nutrient composition of the seagrass Thalassia testudinum. Mar. Biol. 150, 1083–1092. doi: 10.1007/s00227-006-0427-9
Nielsen-Muñoz V., Cortés J. (2008). Abundancia, biomasa y floración de Thalassia testudinum (Hydrocharitaceae) en el Caribe de Costa Rica. Rev. Biol. Trop. 56 (Suppl. 4), 175–189. doi: 10.15517/rbt.v56i4.27223
Nordlund L. M., Jackson E. L., Nakaoka M., Samper-Villarreal J., Beca-Carretero P., Creed J. C. (2018). Seagrass ecosystem services – what’s next? Mar. Pollut. Bull. 134, 145–151. doi: 10.1016/j.marpolbul.2017.09.014
Orth R. J., Carruthers T. J. B., Dennison W. C., Duarte C. M., Fourqurean J. W., Heck K. L., et al. (2006). A global crisis for seagrass ecosystems. BioScience 56, 987. doi: 10.1641/0006-3568(2006)56[987:AGCFSE]2.0.CO;2
Parnell A. (2021) Simmr: A stable isotope mixing model. R package version 0.4.5. Available at: https://www.R-project.org/package=simmr.
Pendleton L., Donato D. C., Murray B. C., Crooks S., Jenkins W. A., Sifleet S., et al. (2012). Estimating global “blue carbon“ emissions from conversion and degradation of vegetated coastal ecosystems. PLoS One 7, e43542. doi: 10.1371/journal.pone.0043542
Peterson B. J., Fourqurean J. W. (2001). Large-scale patterns in seagrass (Thalassia testudinum) demographics in south Florida. Limnol. Oceanogr. 46, 1077–1090. doi: 10.4319/lo.2001.46.5.1077
R Core Team (2021). R: A language and environment for statistical computing. r foundation for statistical computing (Vienna, Austria:R Development Core Team). Available at: https://www.R-project.org/.
Rose C., Sharp W., Kenworthy W., Hunt J., Lyons W., Prager E., et al. (1999). Overgrazing of a large seagrass bed by the sea urchin Lytechinus variegatus in outer Florida Bay. Mar. Ecol. Prog. Ser. 190, 211–222. doi: 10.3354/meps190211
Samper-Villarreal J., Bernecker A., Wehrtmann I. S. (2008). Inventory of macroalgal epiphytes on the seagrass Thalassia testudinum (Hydrocharitaceae) in Parque Nacional Cahuita, Caribbean coast of Costa Rica. Rev. Biol. Trop. 56 (Suppl. 4), 163–174. doi: 10.15517/rbt.v56i4.27220
Samper-Villarreal J., Cambronero Bolaños R., Heidemeyer M., Mora Vargas M., Mora Vargas R. (2020a). Characterization of seagrasses at two new locations in the Eastern Tropical Pacific (El Jobo and Matapalito, Costa Rica). Aquat. Bot. 165, 103237. doi: 10.1016/j.aquabot.2020.103237
Samper-Villarreal J., Cortés J. (2020). Seagrass characterization on the southern Pacific coast of Costa Rica: history, vegetation, and environment. Bot. Mar. 63, 429–438. doi: 10.1515/bot-2020-0022
Samper-Villarreal J., Loría-Naranjo M., van Tussenbroek B. I., Cortés J. (2020b). Synchronized sexual reproduction of the seagrass Syringodium filiforme (Cymodoceaceae) in a tropical reef lagoon on the Caribbean coast of Costa Rica. Rev. Cienc. Mar. Costeras 12, 49–68. doi: 10.15359/revmar.12-1.3
Samper-Villarreal J., Moya-Ramírez J., Cortés J. (2022). First characterization of seagrasses at Sámara Bay, Pacific coast of Costa Rica. Aquat. Bot. 178, 103486. doi: 10.1016/j.aquabot.2021.103486
Samper-Villarreal J., Rojas-Ortega G., Vega-Alpíza J. L., Cortés J. (2018a). New sighting of seagrasses in the Eastern Tropical Pacific (Bahía Potrero, Costa Rica). Aquat. Bot. 151, 25–29. doi: 10.1016/j.aquabot.2018.07.010
Samper-Villarreal J., Sagot-Valverde J. G., Gómez-Ramírez E. H., Cortés J. (2021). Water quality as a potential factor influencing seagrass change over time at Cahuita National Park, Costa Rica. Caribb. J. Sci. 51, 72–85. doi: 10.18475/cjos.v51i1.a9
Samper-Villarreal J., van Tussenbroek B. I., Cortés J. (2018b). Seagrasses of Costa Rica: from the mighty Caribbean to the dynamic meadows of the Eastern Tropical Pacific. Rev. Biol. Trop. 66 (Suppl. 1), S53–S65. doi: 10.15517/rbt.v66i1.33260
Schneider C. A., Rasband W. S., Eliceiri K. W. (2012). NIH Image to ImageJ: 25 years of image analysis. Nat. Methods 9, 671–675. doi: 10.1038/nmeth.2089
Scott A. L., York P. H., Duncan C., Macreadie P. I., Connolly R. M., Ellis M. T., et al. (2018). The role of herbivory in structuring tropical seagrass ecosystem service delivery. Front. Plant Sci. 9. doi: 10.3389/fpls.2018.00127
Scott A. L., York P. H., Rasheed M. A. (2020). Green turtle (Chelonia mydas) grazing plot formation creates structural changes in a multi-species Great Barrier Reef seagrass meadow. Mar. Environ. Res. 162, 105183. doi: 10.1016/j.marenvres.2020.105183
Scott A. L., York P. H., Rasheed M. A. (2021a). Herbivory has a major influence on structure and condition of a Great Barrier Reef subtropical seagrass meadow. Estuaries Coasts 44, 506–521. doi: 10.1007/s12237-020-00868-0
Scott A. L., York P. H., Rasheed M. A. (2021b). Spatial and temporal patterns in macroherbivore grazing in a multi-species tropical seagrass meadow of the Great Barrier Reef. Diversity 13, 12. doi: 10.3390/d13010012
Serrano O., Gómez-López D. I., Sánchez-Valencia L., Acosta-Chaparro A., Navas-Camacho R., González-Corredor J., et al. (2021). Seagrass blue carbon stocks and sequestration rates in the Colombian Caribbean. Sci. Rep. 11, 11067. doi: 10.1038/s41598-021-90544-5
Troëng S., Rankin E. (2005). Long-term conservation efforts contribute to positive green turtle Chelonia mydas nesting trend at Tortuguero, Costa Rica. Biol. Conserv. 121, 111–116. doi: 10.1016/j.biocon.2004.04.014
Valentine J. F., Duffy J. E. (2006). “The central role of grazing in seagrass ecology,”, in Seagrasses: Biology, ecology and conservation. Eds. Larkum A. W. D., Orth R. J., Duarte C. M. (Dordrecht: Springer Netherlands), 463–501. doi: 10.1007/978-1-4020-2983-7_20
van Tussenbroek B. I. (2002). Static life-table analysis and demography of the foliar shoots of the tropical seagrass Thalassia testudinum. Bull. Mar. Sci. 71, 1247–1256.
van Tussenbroek B. I., Cortés J., Collin R., Fonseca A. C., Gayle P. M. H., Guzmán H. M., et al. (2014). Caribbean-Wide, long-term study of seagrass beds reveals local variations, shifts in community structure and occasional collapse. PLoS One 9, e90600. doi: 10.1371/journal.pone.0090600
van Tussenbroek B. I., Santos M. B., Wong J. G. R., van Dijk K., Waycott M. (2010). A guide to the tropical seagrasses of the Western Atlantic (Mexico: UNAM).
van Tussenbroek B. I., Villamil N., Márquez-Guzmán J., Wong R., Monroy-Velázquez L. V., Solis-Weiss V. (2016). Experimental evidence of pollination in marine flowers by invertebrate fauna. Nat. Commun. 7, 12980. doi: 10.1038/ncomms12980
van Tussenbroek B., Wong J., Márquez-Guzman J. (2008). Synchronized anthesis and predation on pollen in the marine angiosperm Thalassia testudinum (Hydrocharitaceae). Mar. Ecol. Prog. Ser. 354, 119–124. doi: 10.3354/meps07212
Walker D., Woelkerling W. (1988). Quantitative study of sediment contribution by epiphytic coralline red algae in seagrass meadows in Shark Bay, Western Australia. Mar. Ecol. Prog. Ser. 43, 71–77. doi: 10.3354/meps043071
Waycott M., Duarte C. M., Carruthers T. J. B., Orth R. J., Dennison W. C., Olyarnik S., et al. (2009). Accelerating loss of seagrasses across the globe threatens coastal ecosystems. Proc. Natl. Acad. Sci. 106, 12377–12381. doi: 10.1073/pnas.0905620106
Waycott M., Longstaff B. J., Mellors J. (2005). Seagrass population dynamics and water quality in the Great Barrier Reef region: A review and future research directions. Mar. Pollut. Bull. 51, 343–350. doi: 10.1016/j.marpolbul.2005.01.017
Keywords: blue carbon, carbon sequestration, stable isotopes, Halodule, Parque Nacional Cahuita
Citation: Samper-Villarreal J, Moya-Ramírez J and Cortés J (2022) Megaherbivore exclusion led to more complex seagrass canopies and increased biomass and sediment Corg pools in a tropical meadow. Front. Mar. Sci. 9:945783. doi: 10.3389/fmars.2022.945783
Received: 16 May 2022; Accepted: 15 September 2022;
Published: 07 October 2022.
Edited by:
Emilio Fernández, University of Vigo, SpainReviewed by:
Michael Alan Rasheed, James Cook University, AustraliaCopyright © 2022 Samper-Villarreal, Moya-Ramírez and Cortés. This is an open-access article distributed under the terms of the Creative Commons Attribution License (CC BY). The use, distribution or reproduction in other forums is permitted, provided the original author(s) and the copyright owner(s) are credited and that the original publication in this journal is cited, in accordance with accepted academic practice. No use, distribution or reproduction is permitted which does not comply with these terms.
*Correspondence: Jimena Samper-Villarreal, amltZW5hLnNhbXBlcnZpbGxhcnJlYWxAdWNyLmFjLmNy
Disclaimer: All claims expressed in this article are solely those of the authors and do not necessarily represent those of their affiliated organizations, or those of the publisher, the editors and the reviewers. Any product that may be evaluated in this article or claim that may be made by its manufacturer is not guaranteed or endorsed by the publisher.
Research integrity at Frontiers
Learn more about the work of our research integrity team to safeguard the quality of each article we publish.