 Jacqueline V. Alva García*Shannon G. KleinTaiba Alamoudi†Silvia Arossa†Anieka J. Parry†Alexandra Steckbauer†Carlos M. Duarte
- Red Sea Research Center (RSRC) and Computational Bioscience Research Center (CBRC), King Abdullah University of Science and Technology (KAUST), Thuwal, Saudi Arabia
Anthropogenic pressures have driven large-scale declines in coral cover on >50% of tropical coral reefs. Most research efforts have focused on ocean warming, ocean acidification, and overfishing impacts. Despite increasing instances of reef-associated hypoxic events, the role of reduced O2 in affecting coral reef performance is largely unknown. Here, we assessed the hypoxic thresholds of two Red Sea coral species: Porites sp. and Galaxea fascicularis. We exposed coral fragments of both species to one control treatment (6.8 mg O2 L−1) and three reduced dissolved oxygen treatments (5.25, 3.5, and 1.25 mg O2 L−1) during a 10-day experiment. Across the two species, maximum (Fv/Fm) and effective (F′/Fm′) photochemical efficiency, chlorophyll a, and dark respiration declined under the lowest O2 treatment (1.25 mg O2 L−1). Porites sp. coral fragments, however, were remarkably resistant and showed no signs of sublethal bleaching after 10 days of exposure to reduced O2. Conversely, 17% of G. fascicularis fragments bleached after only three nights of exposure to the lowest O2 treatment (1.25 mg O2 L−1). Our data show that longer-term hypoxic events (i.e., days to weeks) can induce coral bleaching, but these effects depend on the extent of O2 reduction and are likely species-specific. Importantly, the levels of O2 usually defined as hypoxic (~2.0 to 2.8 mg O2 L−1) do not adequately capture the thresholds reported here. Hence, further research is urgently needed to more accurately describe the vulnerability of coral taxa to hypoxic and anoxic events.
1 Introduction
Coral reefs are one of the most productive and biodiverse ecosystems on Earth (Connell, 1978; Moberg and Folke, 1999; Costanza et al., 2014). They play an essential role as ecological and economic resources, providing food, shelter, and habitat for many marine organisms (Hoegh-Guldberg et al., 2017). Coral reef ecosystems strongly depend on the complex interactions between Scleractinian corals and their photosynthetic dinoflagellates of the family Symbiodiniaceae spp. (LaJeunesse et al., 2018), as well as an array of microorganisms such as bacteria, archaea, fungi, and viruses (Knowlton and Rohwer, 2003; Marhaver et al., 2008; Bourne et al., 2016)—together this association is termed the coral holobiont. This beneficial relationship involves an exchange of photosynthetic end products (carbon and oxygen) from the Symbiodiniaceae to the coral host, which can provide the host with up to 90% of their daily energy requirement (Muscatine and Porter, 1977). Indeed, this association is essential for coral survival and growth but can rapidly deteriorate under environmental stress (Glynn, 1993; LaJeunesse et al., 2018). A common manifestation of this deterioration is coral bleaching, where the coral host exhibits a decrease in Symbiodiniaceae cells from their gastrodermal tissues and parallel reductions in photosynthetic pigments under prolonged environmental stress.
Global warming, ocean acidification, overfishing, and nutrient pollution are considered the main drivers of coral reef degradation (Hughes et al., 2003). However, recent research indicates that acute hypoxia events may be increasing in coral reef ecosystems (Altieri et al., 2017; Johnson et al., 2021a). Recently, reported hypoxia events (defined as O2 levels ≤2 mg O2 L−1) on tropical reefs have caused mass coral bleaching and mortality (varying from 0% to 100% mortality, depending on the species; Altieri et al., 2017; Alderdice et al., 2021; Johnson et al., 2021a). Hypoxia events are driven by numerous, and sometimes interacting, drivers that include temperature increases (directly via decreases in the solubility of O2 and indirectly through heightened community respiration in response to elevated temperatures), eutrophication (via the breakdown of organic matter and resulting microbial O2 demand), and stratification of seawater surface (Keeling et al., 2010; Breitburg et al., 2018; Hughes et al., 2020; Klein et al., 2020), among others.
In coral reef ecosystems, extreme diel dissolved oxygen (DO) fluctuations have been reported to vary between 0 and 18 mg O2 L−1 (DeCarlo et al., 2017). These changes in O2 depend on the location (and depth), time of the day, and water movement, owing to the differential influence of community metabolic production and consumption processes on O2 availability in the water medium (Al-Horani, 2005; Guadayol et al., 2014; Giomi et al., 2019; Nelson and Altieri, 2019). Within the coral holobiont, Symbiodiniaceae produce more O2 than the coral host can consume during the daytime, acting as a net O2 source. However, Symbiodiniaceae cease O2 production at nighttime and rely on efficient O2 extraction from the surrounding seawater medium (Kühl et al., 1995). At nighttime, the holobiont actively consumes O2, and this process presumably involves a competition between the holobiont partners for O2 when its supply is limited. Hence, corals may be particularly vulnerable to O2 deprivation at nighttime when productivity ceases, and holobiont respiration consumes oxygen. Indeed, reductions in DO availability can directly limit aerobic respiration and affect other coral holobiont processes such as photosynthesis and calcification (Yonge et al., 1928; Gardella and Edmunds, 1999; Al-Horani et al., 2007; Nelson and Altieri, 2019). Consequently, declines in DO can potentially modify the interactions between corals, Symbiodiniaceae, and their microbiota, leading to competition for O2 under hypoxic conditions between the otherwise partners.
Exposure time is another factor known to influence the biological responses of marine taxa to hypoxia. Steckbauer et al. (2020) found a positive trend between the effect of the exposure time and hypoxia impacts on the responses of marine taxa, suggesting that prolonged exposure to hypoxic conditions negatively impacts the survival of marine organisms. Despite the potential for, and observed, impacts of hypoxic events on corals, hypoxic thresholds of corals that consider exposure time remain poorly studied. Although scarce, the reported hypoxic thresholds differ substantially among coral species. For instance, coral bleaching events in Costa Rica and Panama caused widespread bleaching of Pocillopora spp., which suffered 90% to 100% mortality. On the other hand, Porites lobata, Pavona clavus, Pavona gigantea, and Gardinoseris planulata experienced no mortality after the same event (Guzmán et al., 1990; Nelson and Altieri, 2019). Haas et al. (2014) reported a lethal threshold of 2 to 4 mg O2 L−1 in Acropora yongei by analyzing the effects of hypoxia at nighttime. Another experimental study done by Altieri et al. (2017) found that Stephanocoenia intersepta were highly resistant to hypoxia, even after being exposed to hypoxic seawater (0.5 mg O2 L−1) for 1 week. In most instances, published experiments that test the hypoxic effects on corals typically apply lower temperature regimes and short-term exposure. However, thresholds of hypoxia are not static and increase with warming (Matthews and McMahon, 1999; Vaquer-Sunyer and Duarte, 2008). Discounting the potential role of thermal regimes may lead to underestimating coral tolerance. In addition to the lower temperature regimes, another research gap in the published studies lies in the manipulation of experimental O2 levels, where N2 gas is used to reduce O2. However, this approach inadvertently displaces CO2 and increases seawater pH (Klein et al., 2017), thereby affecting the carbonate system and confounding any observed effects.
Here, we aimed to examine the response of two abundant Red Sea coral species—Porites sp. and G. fascicularis corals—to reduced DO concentrations and characterized their hypoxic thresholds. We hypothesized that the prolonged exposure of corals to reduced DO concentrations could trigger coral bleaching and eventual mortality beyond an O2 threshold where O2 availability is insufficient to maintain the symbiotic relationship between corals and their symbionts. We hypothesized that corals would exhibit a decrease in both maximum (Fv/Fm) and effective (F′/Fm′) photochemical efficiency, lower respiration rates, symbiont counts, and chlorophyll a (Chl a) content under two decreased O2 treatments (3.5 and 1.25 mg O2 L−1). We further hypothesized that the corals would exhibit different phenotypes of coral health degradation, such as coral bleaching/paling, rapid tissue disintegration (also termed “melting phenomenon”), or even mortality at low DO (∼1.25 mg O2 L−1) concentrations.
2 Materials and methods
2.1 Coral collection
We identified and collected three adult colonies of both Porites sp. and G. fascicularis off the coast of Thuwal in the Central Red Sea, Saudi Arabia (22°18′12.4ʺN, 38°57′38.3ʺE) at depths between 8 and 12 m in early June of 2021. To minimize the likelihood of collecting identical genotypes, we sampled colonies separated by at least 5 m (Rädecker et al., 2017). Porites sp. is a reef-building coral easily distinguished by its surface morphology (polyp diameter of ~1 mm) and corallite skeletal characteristics (Smith et al., 2007). G. fascicularis is also a scleractinian coral, characterized by larger polyp diameters of, on average, 1 cm (Veron, 1980).
After collection, the colonies were immediately transported to the experimental laboratory facilities of the Coastal and Marine Resources Lab (CMR) at King Abdullah University of Science and Technology (KAUST). We fragmented the colonies into 156 coral fragments per species (~2 cm width) and allowed them to recover for 2 days at 28°C under a 12:12 light–dark cycle [350 μmol photons m2 s−1 of photosynthetic active radiation (PAR)]. Then, the temperature was increased to 32°C over 7 days, at a rate of 0.5°C per day, to mimic summer temperatures in the Central Red Sea (Chaidez et al., 2017; Osman et al., 2018; Genevier et al., 2019). The fragments were kept in a continuous flow-through tank during the recovery period, where fresh filtered seawater (20 μm pore size) was supplied from the Red Sea.
2.2 Experimental design
For the two species, we conducted two separate but identical 10-day experiments. The experimental design for both species included a stable DO control treatment (6.8 mg O2 L−1) and three reduced O2 treatments (5.25, 3.5, and 1.25 mg O2 L−1), hereafter termed high, medium, and low O2 treatments, respectively. We selected these DO concentrations according to normoxic and hypoxic levels reported by the meta-analysis of Steckbauer et al. (2020). For both coral species, pH (8.2 ± 0.07SD) levels, temperature (32°C ± 0.22SD), salinity (~44 ppt), and PAR (350 μmol photons m−2 s−1) were held constant in a 12:12 light:dark diel cycle throughout all four treatments and represented conditions in the field at the time of coral collection. Each experiment evaluated 48 coral fragments, which we randomly distributed among the four DO treatments (n = 12).
Prior to the commencement of each experiment, coral fragments were acclimated to the experimental system. We used four 600-L tanks as water baths to control the temperature inside each 2-L aquarium. The acclimation day started at 5:00 a.m. by placing one coral fragment per 2-L of glass aquarium; to minimize potential effects associated with individual water baths, we randomly distributed the 2-L aquaria across four water baths. Each aquarium was equipped with one standard aquarium bubbler and one transparent plastic lid to prevent seawater evaporation and minimize the influence of air/seawater gas exchange. Next, we started the experimental gas treatments by introducing each coral fragment into the control conditions (6.8 mg O2 L−1 ± 0.38SD, 32°C ± 0.22SD, and pH 8.2 ± 0.07SD). To transition the corals from acclimation conditions to our defined control and reduced DO treatments, we used an 8-h O2 drift based on hypoxic diel cycle duration reported by Tyler et al. (2009). The transition started at 10:00 p.m. on the acclimation day and ended at 6:00 a.m. on the next day (experiment day 1). Our control treatment remained stable throughout the O2 drift at 6.8 mg O2 L−1.
On the other hand, for the rest of the treatments, the O2 concentration decreased as follows: the high treatment decreased 0.19 mg O2 h−1 until reaching a final concentration of 5.25 mg O2 L−1, the medium treatment decreased 0.41 mg O2 h−1 until it reached 3.5 mg O2 L−1, and the low treatment decreased 0.70 mg O2 h−1 until reaching a final concentration of 1.25 mg O2 L−1 (Figure S4). Throughout the experiments, we exchanged 100% of the seawater in each aquarium at 6:00 a.m. each day.
2.3 Gas manipulation
To customize the gas treatments, we used a modified version of the LabView software (sensu Klein et al., 2017). We delivered the gas treatments via four sets of three mass flow controllers (MFCs) [Omega, N2 (0 to 2 L min−1), CO2 (0 to 20 ml min−1), and O2 (0 to 2 L min−1)]. We connected the MFCs to pure O2 and CO2 cylinders (Air Liquide, Jeddah) and liquid N2 dewars equipped with vaporizers, which we used to deliver pure N2 gas at high flow rates. The four unique gas mixtures were continuously supplied to the 2-L aquaria via stainless steel manifolds connected to tubing equipped with aquarium air stones. This approach permitted the equilibration of the seawater to the desired treatment levels. We manually controlled the gas flow rates to the individual aquaria with standard five-way aquarium manifolds. We measured temperature, pH, and DO levels every day using a Mettler Toledo sensor (at 4 a.m. and 2:00 p.m.) (Table S1).
2.4 Analysis of carbonate chemistry
To characterize the seawater carbonate chemistry, we collected 120 ml of seawater samples for total alkalinity (TA) analysis on days 1, 3, and 10 of each experiment. We randomly selected three replicate aquaria from each of the four treatments for TA analysis. The samples were collected in borosilicate glass bottles through a drawing tube to prevent the formation of bubbles and immediately preserved the seawater with 50 μl of mercuric chloride HgCl2 (5%). The samples were then stored at 23°C and analyzed within 30 days of the conclusion of the experiments. We measured TA via an open-cell titration method with 0.1 M of hydrochloric acid, using an Alkalinity Titrator (MODEL AS-ALK2, Apollo SciTech, U.S.A, Kloehn - U.S.A). The titrator was equipped with two pumps (VersaPump 6, Kloehn), a pH meter (Orion Star A2II, Thermo Fisher, U.S.A.), and a pH probe (SI Analytics, Germany), following the method retrieved from Dickson et al. (2007). We then calculated the partial pressure of CO2 (pCO2) from measured values of TA, pH, temperature, and salinity values using the “carb” and “errors” functions in the seacarb package 3.3.0v in R software, obtained from Lavigne and Gattuso (2011).
2.5 Mortality and coral bleaching
When the coral fragments exhibited any of the following signs—there was evident tissue degradation, polyps showed either discoloration or appeared withdrawn, or when substantial reductions in pigment were visible—they were recorded as dead (Anton et al., 2020). Visual observations were conducted immediately after simulated sunrise and sunset (i.e., twice per day).
2.6 Physiological response variables
2.6.1 Dark respiration (O2 flux)
Rates of dark respiration (DR) were measured at the end of each experiment via O2 flux incubations. For this, we used a FireSting-O2 (PyroScience, Germany) connected to four fiber-optic sensors that measured DO concentrations every 20 s. We calibrated the sensors at 32°C using a two-point calibration (0% and 100% O2 saturation). On day 10 of each experiment, we conducted O2 flux incubations in two rounds. Each round consisted of six coral fragments and five seawater blanks. The water used for each measurement was seawater taken directly from the same aquarium as the sampled coral fragment (i.e., seawater premanipulated to conditions of the appropriate treatment). Each round measured fragments (and seawater blanks) from all four treatments so as not to confound the measurement rounds with the treatments examined. We randomized the sample selection to ensure we analyzed the same number of fragments per treatment (n = 3) per set. We used chambers with a volume of 50 ml, which we equipped with internal stir bars. We used waterproof paper (~4 cm2 in size) as an interior shelf to separate the coral fragment from the magnetic stirrer, which allowed the seawater to mix and maintain homogeneous O2 levels within the chamber. In total darkness, we used an IKA RT 15 magnetic stir plate to control the stir bars and keep the temperature at 32°C inside a thermally controlled growth chamber (Percival Scientific Inc.). For Porites sp., incubations lasted 2.5 h, while for G. fascicularis, incubations lasted 1 h. Finally, we calculated the DR rates for each coral fragment by subtracting the blank DR rate from the sample DR rate and dividing it by the superficial area of each fragment (mg O2 cm−2 h−1).
2.6.2 Maximum (Fv/Fm) and effective photochemical efficiency (F′/Fm′)
On each day of the experiments, we measured dark-adapted maximum photochemical efficiency (Fv/Fm) and effective photochemical efficiency (F′/Fm′) of photosystem II (PSII) in all aquaria. We did the measurements at 04:00 a.m. and 2:00 p.m. local time, respectively, using a MINI-PAM (Walz, Germany). To avoid potential artifacts associated with the timing of measurements, we changed the order in which the aquaria were measured. For G. fascicularis, we conducted three technical measures per fragment to reduce variability in the values taken. We used the average (mean) values of the technical measurements for statistical analysis, which we considered the statistical unit/biological replicate. However, due to the small size of Porites sp., we conducted only one technical replicate, which we used for data analysis.
2.6.3 Symbiodiniaceae cell density and chlorophyll a
After the O2 flux incubations, we froze and stored all coral fragments at −20°C. Before analysis, the fragments were thawed at room temperature (~23°C) and incubated in 3 ml of sodium dodecyl sulfate (SDS) 0.1% solution for 30 min. We then removed the coral tissue from each fragment by blasting them with air (using a 1,000μl pipette tip connected to tubing and benchtop air supply) in a fume hood. We transferred the resulting slurry to 15-ml Falcon tubes (Fisherbrand, U. S. A) and homogenized the sample with a tissue homogenizer (MicroDisTec homogenizer 125, Thermo Fisher Scientific) for 30 s. Next, we transferred two 500-μl aliquots of the slurry (one for Symbiodiniaceae cell counting and one for chlorophyll a to 1.5 ml Eppendorf tubes). The aliquots allocated to Symbiodiniaceae cell counts were resuspended after centrifugation at 16,000g for 15 min. Then, we discarded the supernatant (500 μl) and washed the remaining Symbiodiniaceae pellet using 1× phosphate buffer solution (PBS, 500 μl), and we centrifuged it for 5 min at 16,000g. After the centrifugation, we discarded the supernatant and repeated the process with Milli-Q water. Then, we resuspended the remaining pellet using 250 μl of PBS and 250 μl of SDS. Finally, the Symbiodiniaceae cells were counted in three replicate aliquots of 10 μl, each using a hemocytometer (Hausser Scientific, U. S. A.) under an upright fluorescence microscope (Leica DM6000 B running LAS X).
The 500-μl aliquots of the coral slurry allocated to measurements of Chl a were centrifuged (3,000g at 4°C) for 10 min. After centrifugation, the supernatant was discarded and the pellet was resuspended in 500 μl of ethanol 100%. The samples were incubated overnight at 4°C in total darkness extraction. The samples were then centrifuged at 16,000g and 4°C for 5 min. Finally, we transferred an aliquot of 150 μl of each sample (in triplicates) into a 96-well flat-bottom plate; ethanol 100% was used as a blank. We measured absorbance at 629 and 665 nm using a SpectraMax Paradigm microplate reader (Molecular Devices, U. S. A.). Finally, total Chl a concentrations were obtained using the following equation (−2.6094 × A629 + 12.4380 × A665) for dinoflagellates in ethanol (Ritchie, 2006).
Counts of Symbiodiniaceae cells and concentrations of Chl a were both normalized to coral fragment surface area (cm2).
2.7 Surface area
To calculate the superficial area of each fragment, we used the aluminum foil method (Marsh, 1970). First, we calculated a conversion factor of 3.82 × 10⁻³ g cm−2 by weighing six 10-cm2 aluminum foil squares. Then, each sample was wrapped in aluminum foil three times (i.e., three technical replicates), covering the entire surface of the fragment while carefully avoiding overlap. The foil was then removed, weighed (to the nearest milligrams), and then averaged. Finally, we calculated the superficial for each sample using the conversion factor previously obtained.
2.8 Statistical analysis
We analyzed the response variables of maximum (Fv/Fm) and effective (F′/Fm′) photochemical efficiency, O2 flux, symbiont density, and Chl a using the linear mixed models (LMMs) in SPSS (IBM SPSS, version 28, U. S. A.). Before starting the analyses, we checked all data for the assumptions of normality and homoscedasticity by using Q–Q plots of the residuals and standardized residual plots. For maximum (Fv/Fm) and effective (F′/Fm′), we considered all factors (species and O2 treatment) except time as fixed factors; all factors were fixed for the rest of the dependent variables. In addition, we considered colony number as a random factor for all dependent variables. Preliminary analyses for all dependent variables revealed significant effects of colony number, so it was retained in further analyses. In all repeated-measure LMMs, we analyzed different models [e.g., CS, AR (1), and AR (1) heterogeneous] to assess the model that best fitted by comparing various goodness-of-fit statistics [e.g., −2 restricted log-likelihood, Akaike’s information criteria (AIC), and Bayesian information criterion (BIC)]. To quantify the sublethal exposure time (SLT50), we used a two-parameter log-logistic dose–response model from the drc package in R (Ritz et al., 2015). We conducted all sublethal threshold analyses in R Studio (version 3.6.2). Data are reported as mean ± one standard error (1SE) unless otherwise indicated (e.g., standard deviation as 1SD).
3 Results
3.1 Mortality and coral bleaching
We observed no mortality in either species during the experiments. However, after the third night of exposure to the low O2 treatment, we observed color loss in 17% of the G. fascicularis fragments, and by the end of the experiment, 58% of the fragments had bleached. In contrast, no Porites sp. fragments bleached under the same O2 treatment. Across both experiments/species, no signs of bleaching were observed for any other O2 treatments (Figure 1).
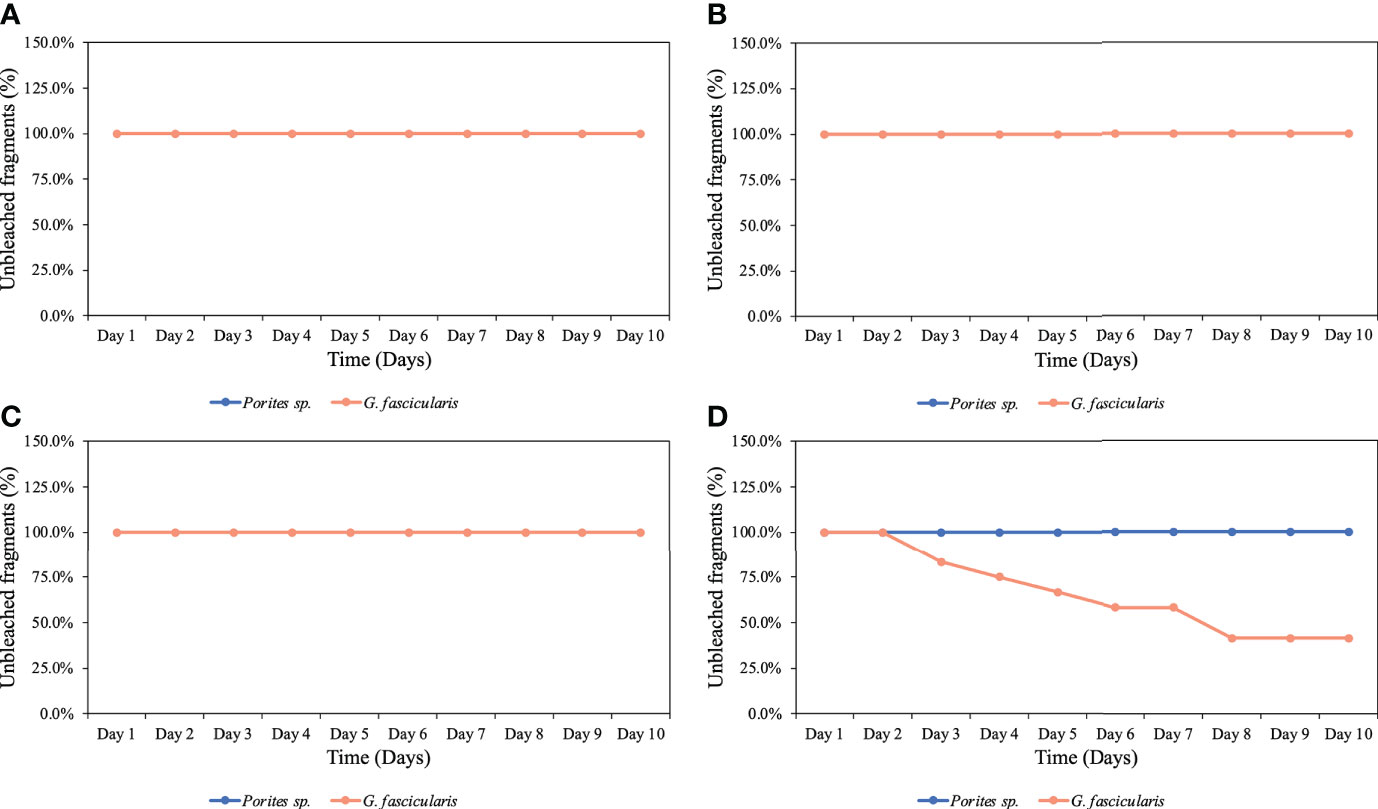
Figure 1 Percentage of unbleached coral fragments throughout the complete experiments for both species. (A) Control (6.8 mg O2 L−1), (B) high O2 treatment (5.25 mg O2 L−1), (C) medium O2 treatment (3.5 mg O2 L−1), and (D) low O2 treatment (1.25 mg O2 L−1). Porites sp. did not experience any bleaching at any of the four different treatments; on the other hand, G. fascicularis started experiencing bleaching after the third night of exposure to the low O2 treatment.
Unfortunately, logistical constraints associated with the sacrificial nature of some of the measurements limited our ability to examine more replicates across a higher number of O2 treatments; hence, the statistical power for our SLC50 calculation was admittedly low (n = 4). Therefore, we calculated the median sublethal exposure time (SLT50) under the low O2 treatment at 5.15 ± 0.80SE days at 32°C (Figure 2), which is supported by greater statistical power (n = 10).
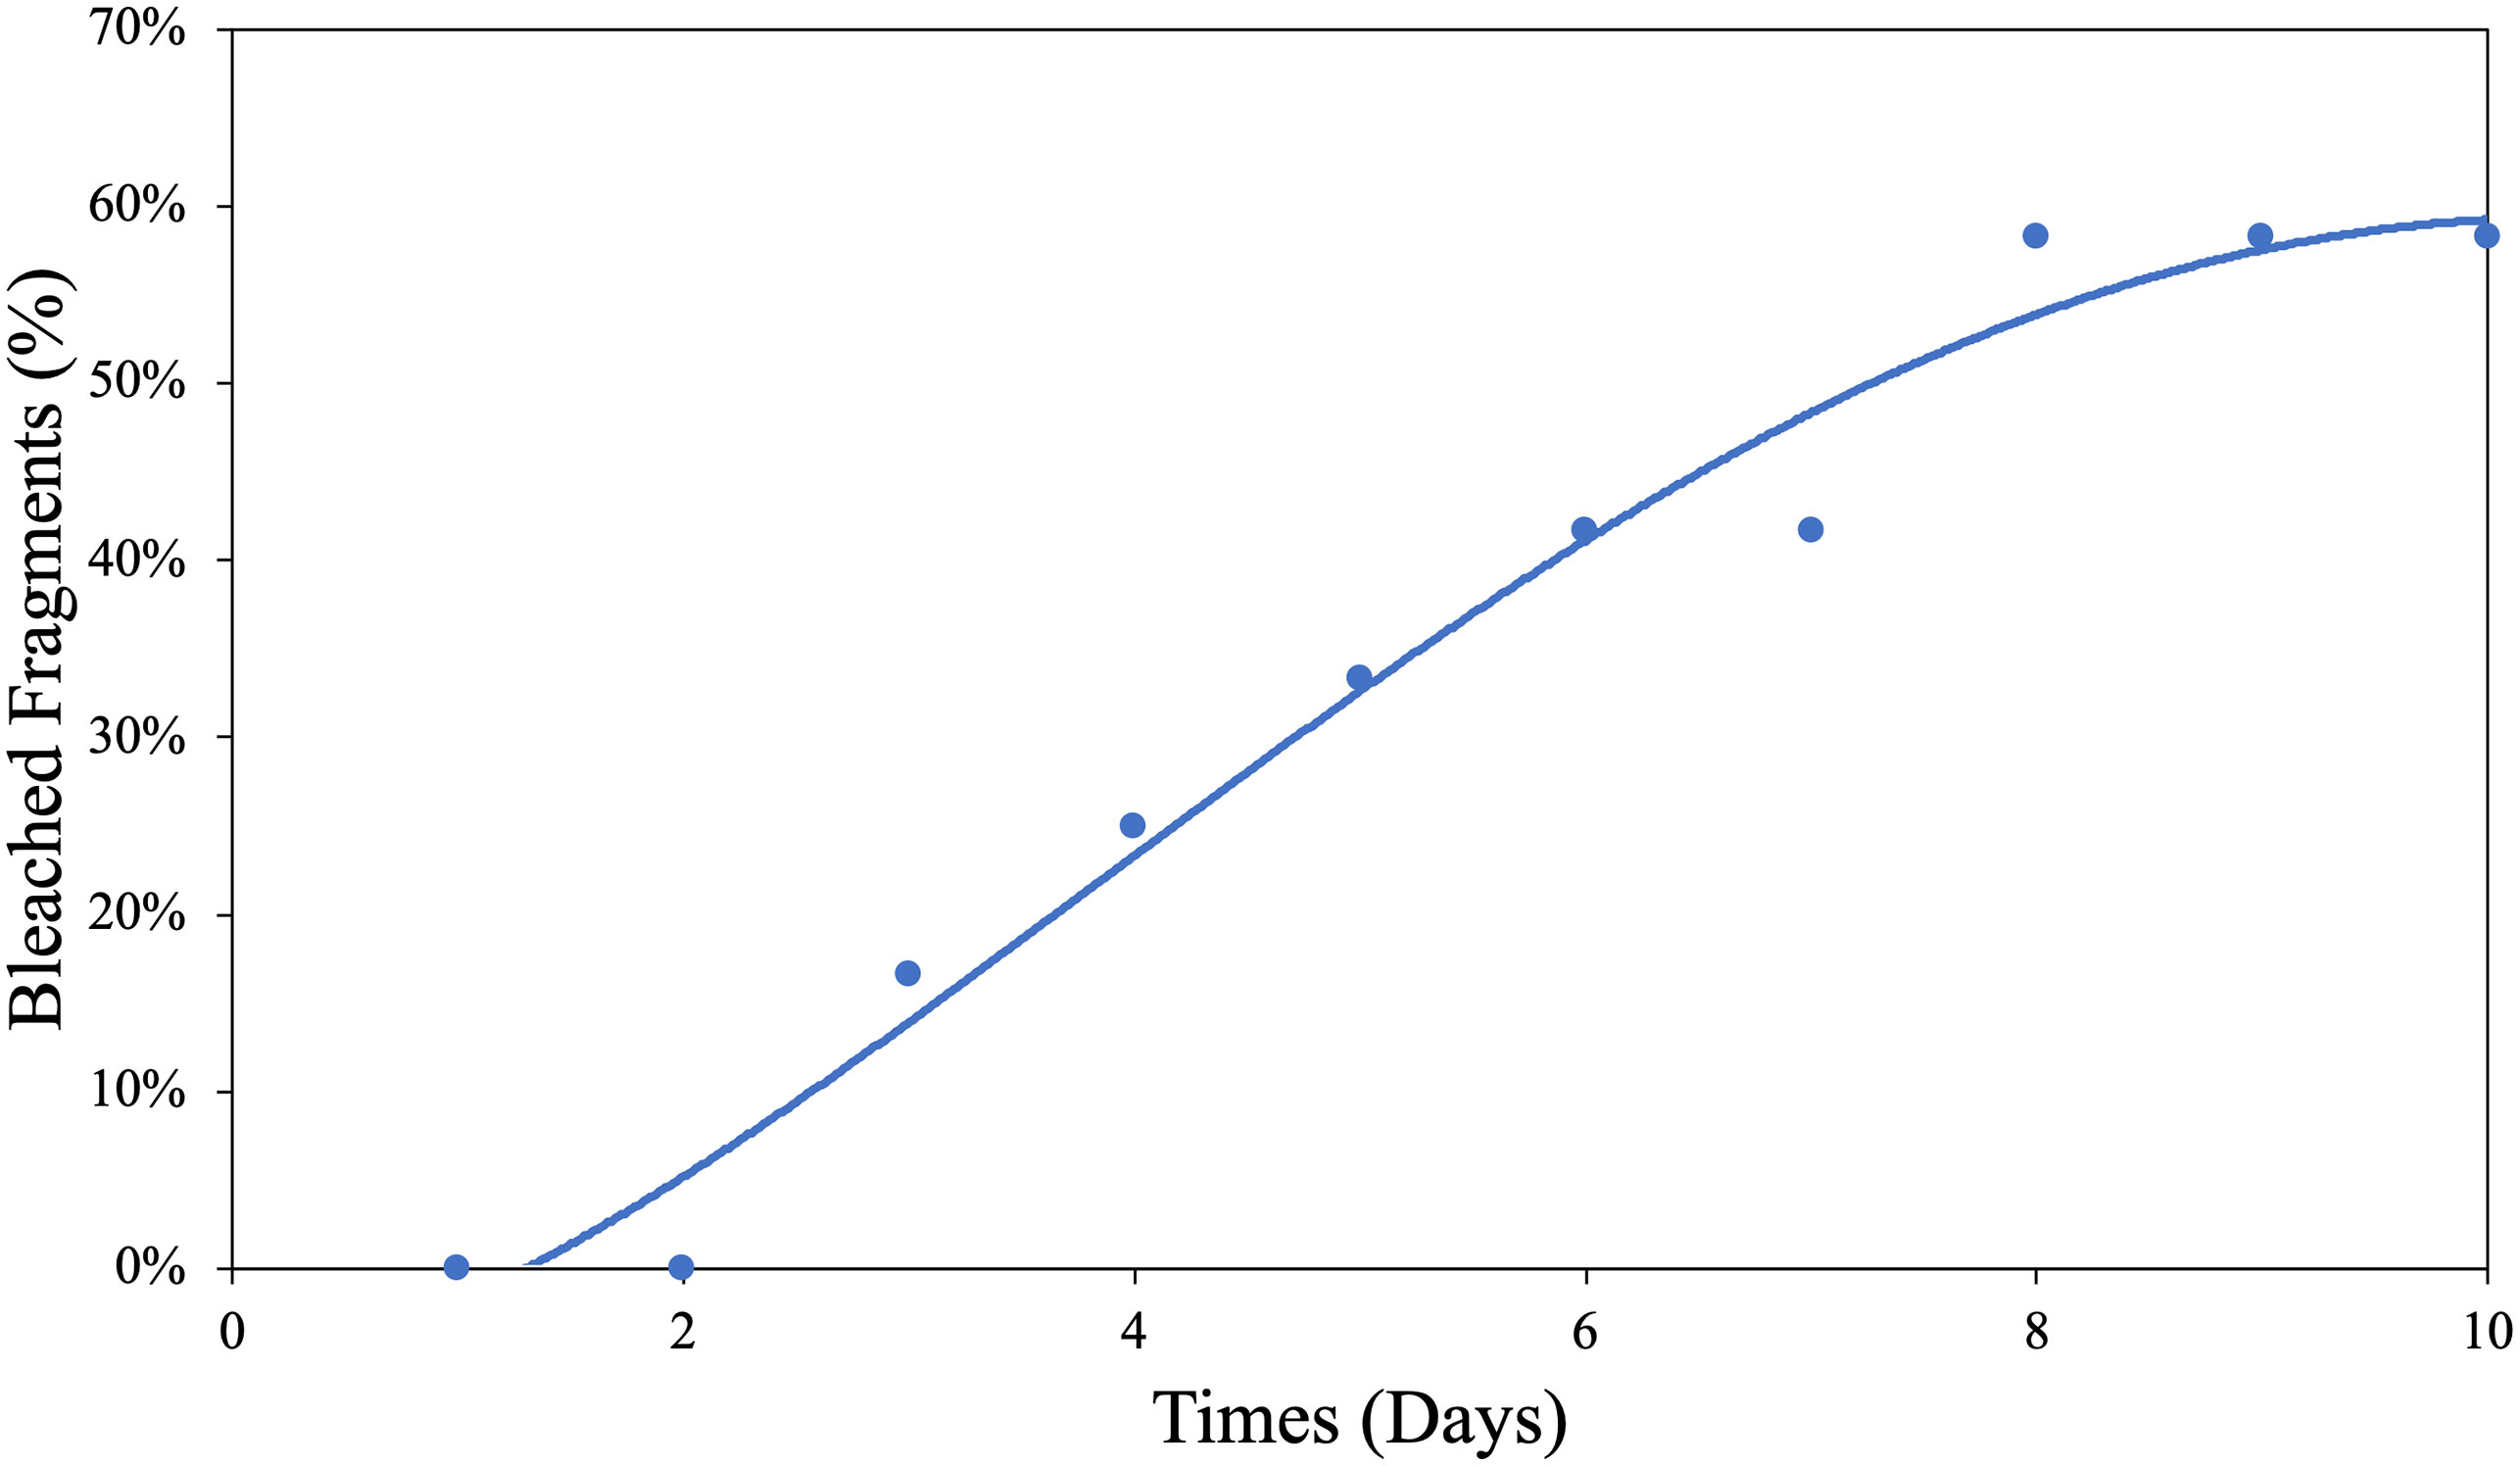
Figure 2 Hypoxic bleaching threshold determination for G. fascicularis. The median sublethal bleaching time for G. fascicularis, the SLT50, was estimated at 5.15 ± 0.80SE days at 32°C.
3.2 Physiological response variables
3.2.1 Dark respiration (O2 flux)
DR rates differed among the two species (p = 0.009, Table 1) [i.e., G. fascicularis were 88.6% (control treatment), 216.0% (high treatment), 25.8% (medium treatment), and 32.4% (low treatment) higher than Porites sp.]. The rates of DR also differed significantly among O2 treatments (p = 0.031), regardless of the species examined. For example, DR rates of G. fascicularis were 9.3% higher in the control treatment than the high DO treatment and 170.2% higher in the control treatment relative to the low DO treatment. On the other hand, DR rates of Porites sp. were higher (0.12 mg O2 cm−2 h−1) in the control treatment, but the rates declined by 45.4%, 38.9%, and 47.3% in the high, medium, and low DO treatments (Figure 3). Taken together, these results show sharp reductions in DR rates in the lower DO treatments for both species relative to those in the control, indicating oxygen-conforming behavior.
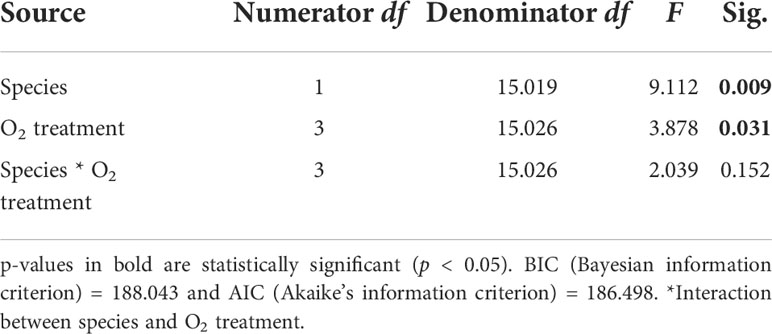
Table 1 Summary of results for LMMs comparing dark respiration rates between treatments for both Porites sp. and G. fascicularis.
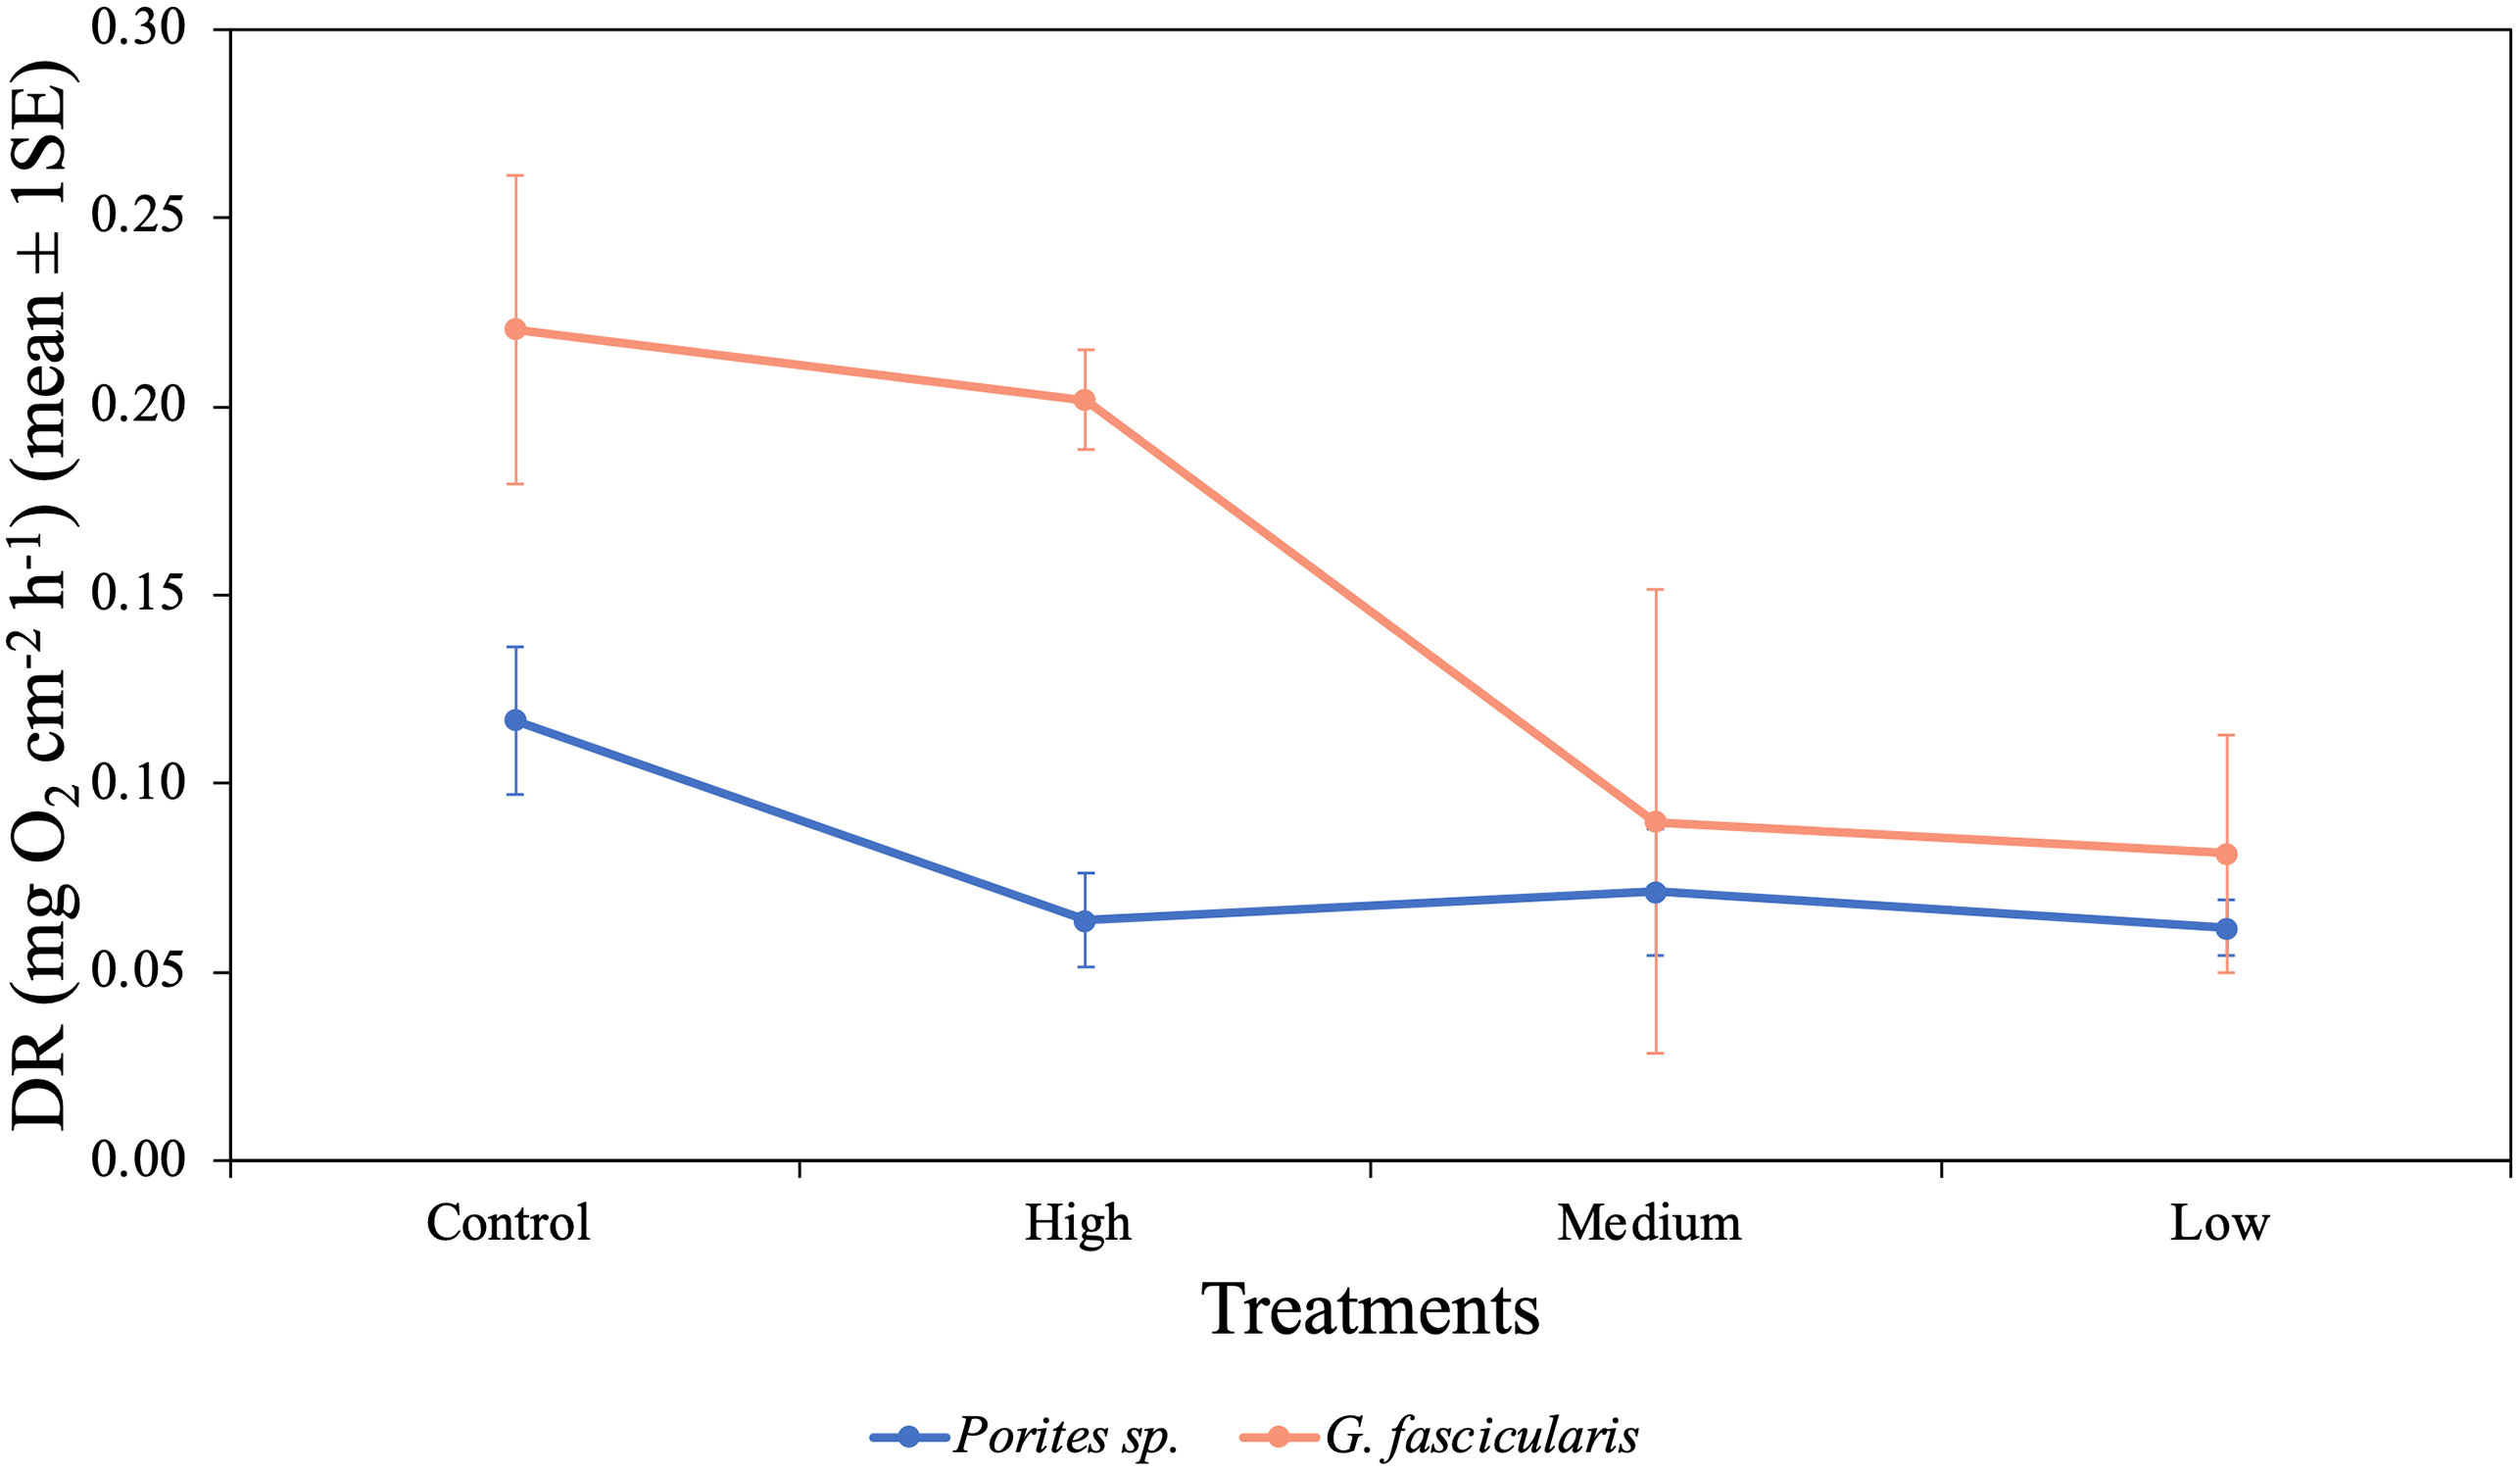
Figure 3 Mean (± 1SE) rates of dark respiration (mg O2 cm−2 h−1) for Porites sp. and G. fascicularis under four different O2 treatments.
3.2.2 Maximum (Fv/Fm) and effective photochemical efficiency (F′/Fm′)
We found a significant interaction between species and time for both maximum and effective photochemical efficiency (p < 0.001, Tables 2, 3), indicating that the Fv/Fm and F′/Fm′ values differed among species, but these differences depended on exposure time. For instance, Porites sp. coral fragments exhibited lower Fv/Fm values at the beginning of the experiment (0.492 ± 0.010SE) regardless of the treatment, which then increased by 33.8% on day 10. On the other hand, G. fascicularis Fv/Fm values exhibited a decreasing trend throughout the experiment (regardless of the treatment) starting at 0.719 ± 0.008SE (day 1) and ending at 0.644 ± 0.007SE (day 10) (Figure 4). Porites sp. and G. fascicularis F′/Fm′ showed inconsistent patterns throughout the experiment, regardless of the treatment (Figure 5).
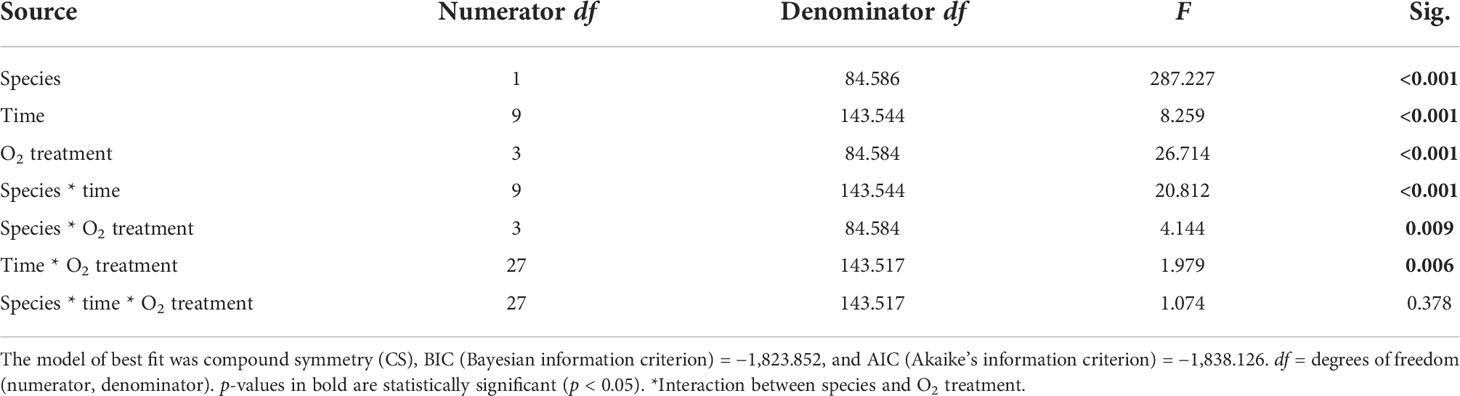
Table 2 Summary of results for LMMs comparing maximum Fv/Fm reading between treatments throughout the experiment.

Table 3 Summary of results for LMMs comparing effective F′/Fm′ reading between treatments throughout the experiment.
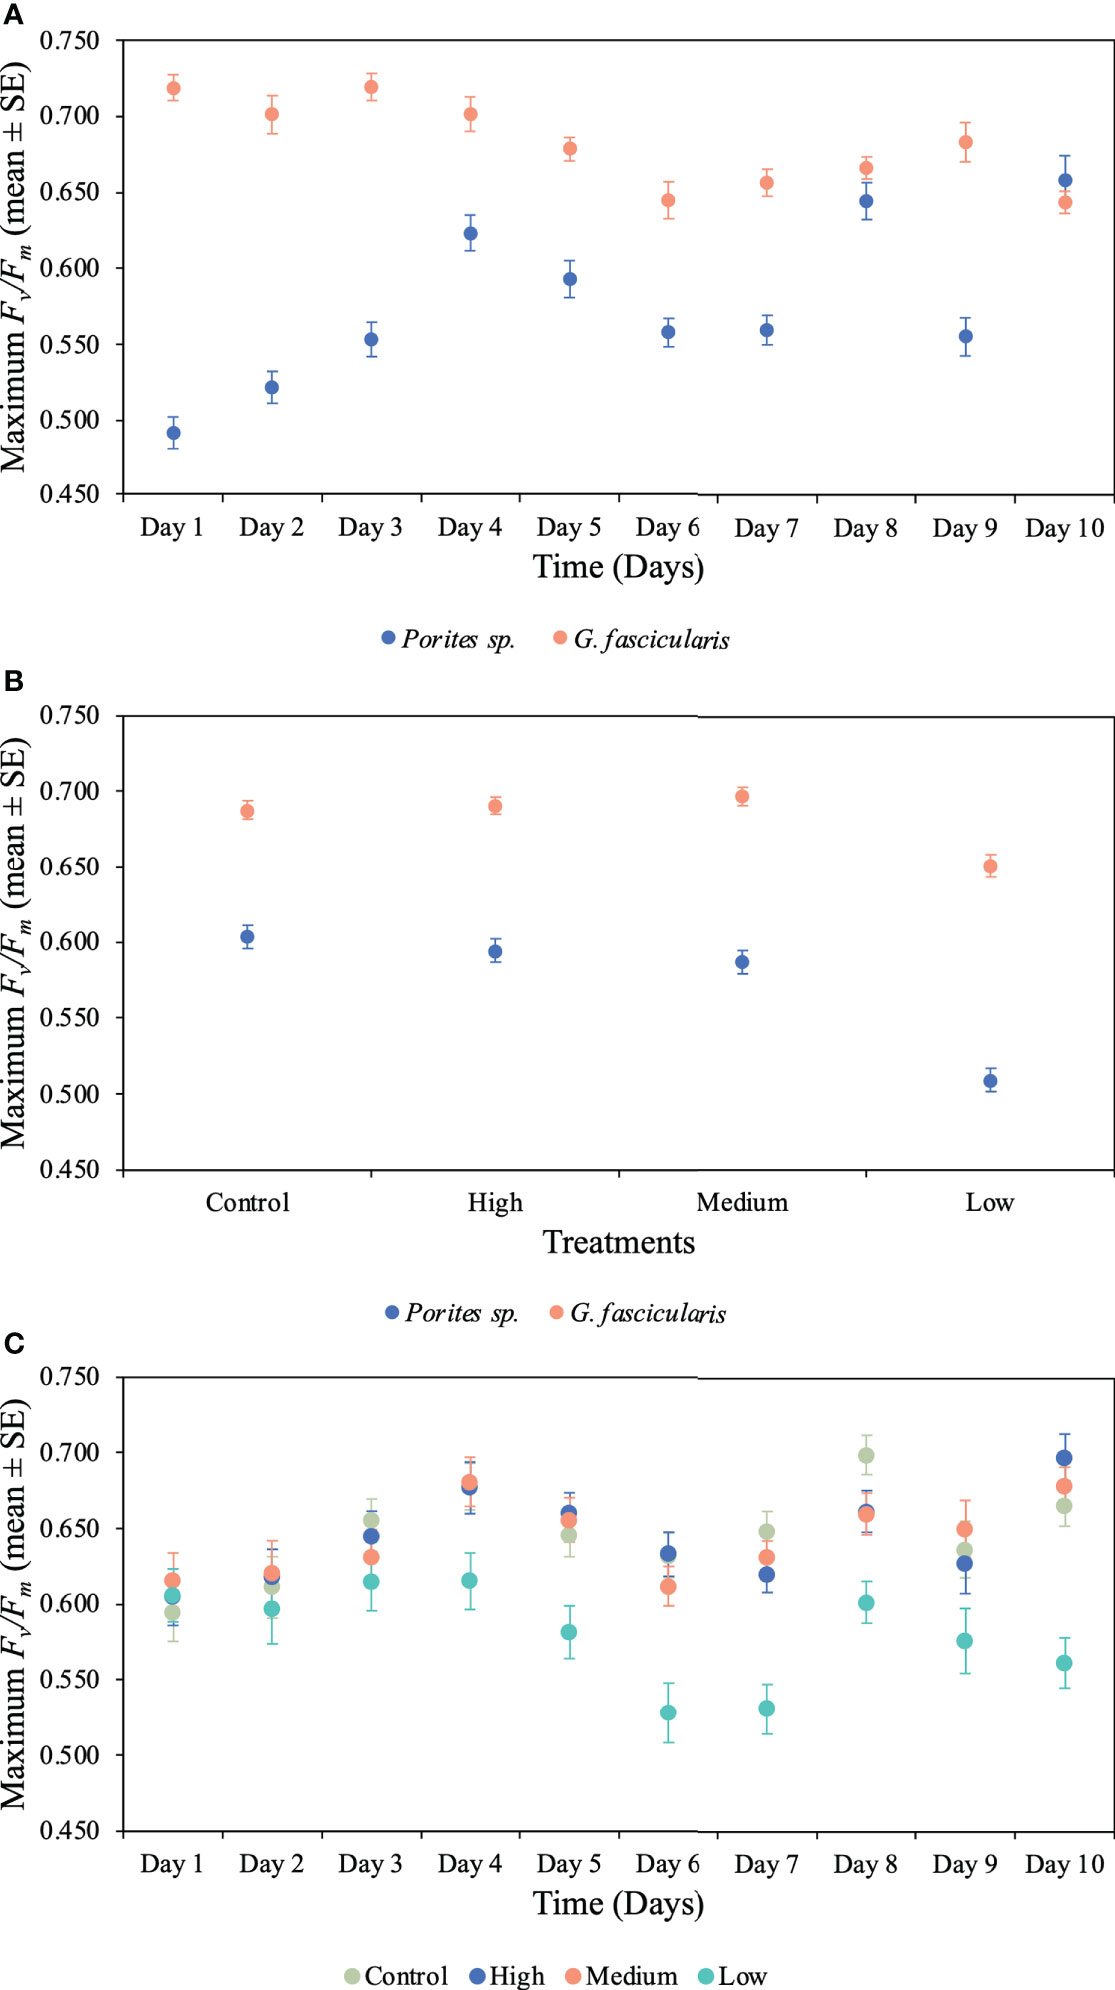
Figure 4 Mean (± 1SE) rates of maximum photochemical efficiency (Fv/Fm) and its interaction between (A) species and time for Porites sp. and G. fascicularis throughout the 10 days of the experiment (p < 0.001), (B) species and O2 treatment for Porites sp. and G. fascicularis under all four different O2 treatments (p = 0.009), and (C) time and O2 treatment for Porites sp. and G. fascicularis throughout the 10 days of the experiment (p = 0.006).
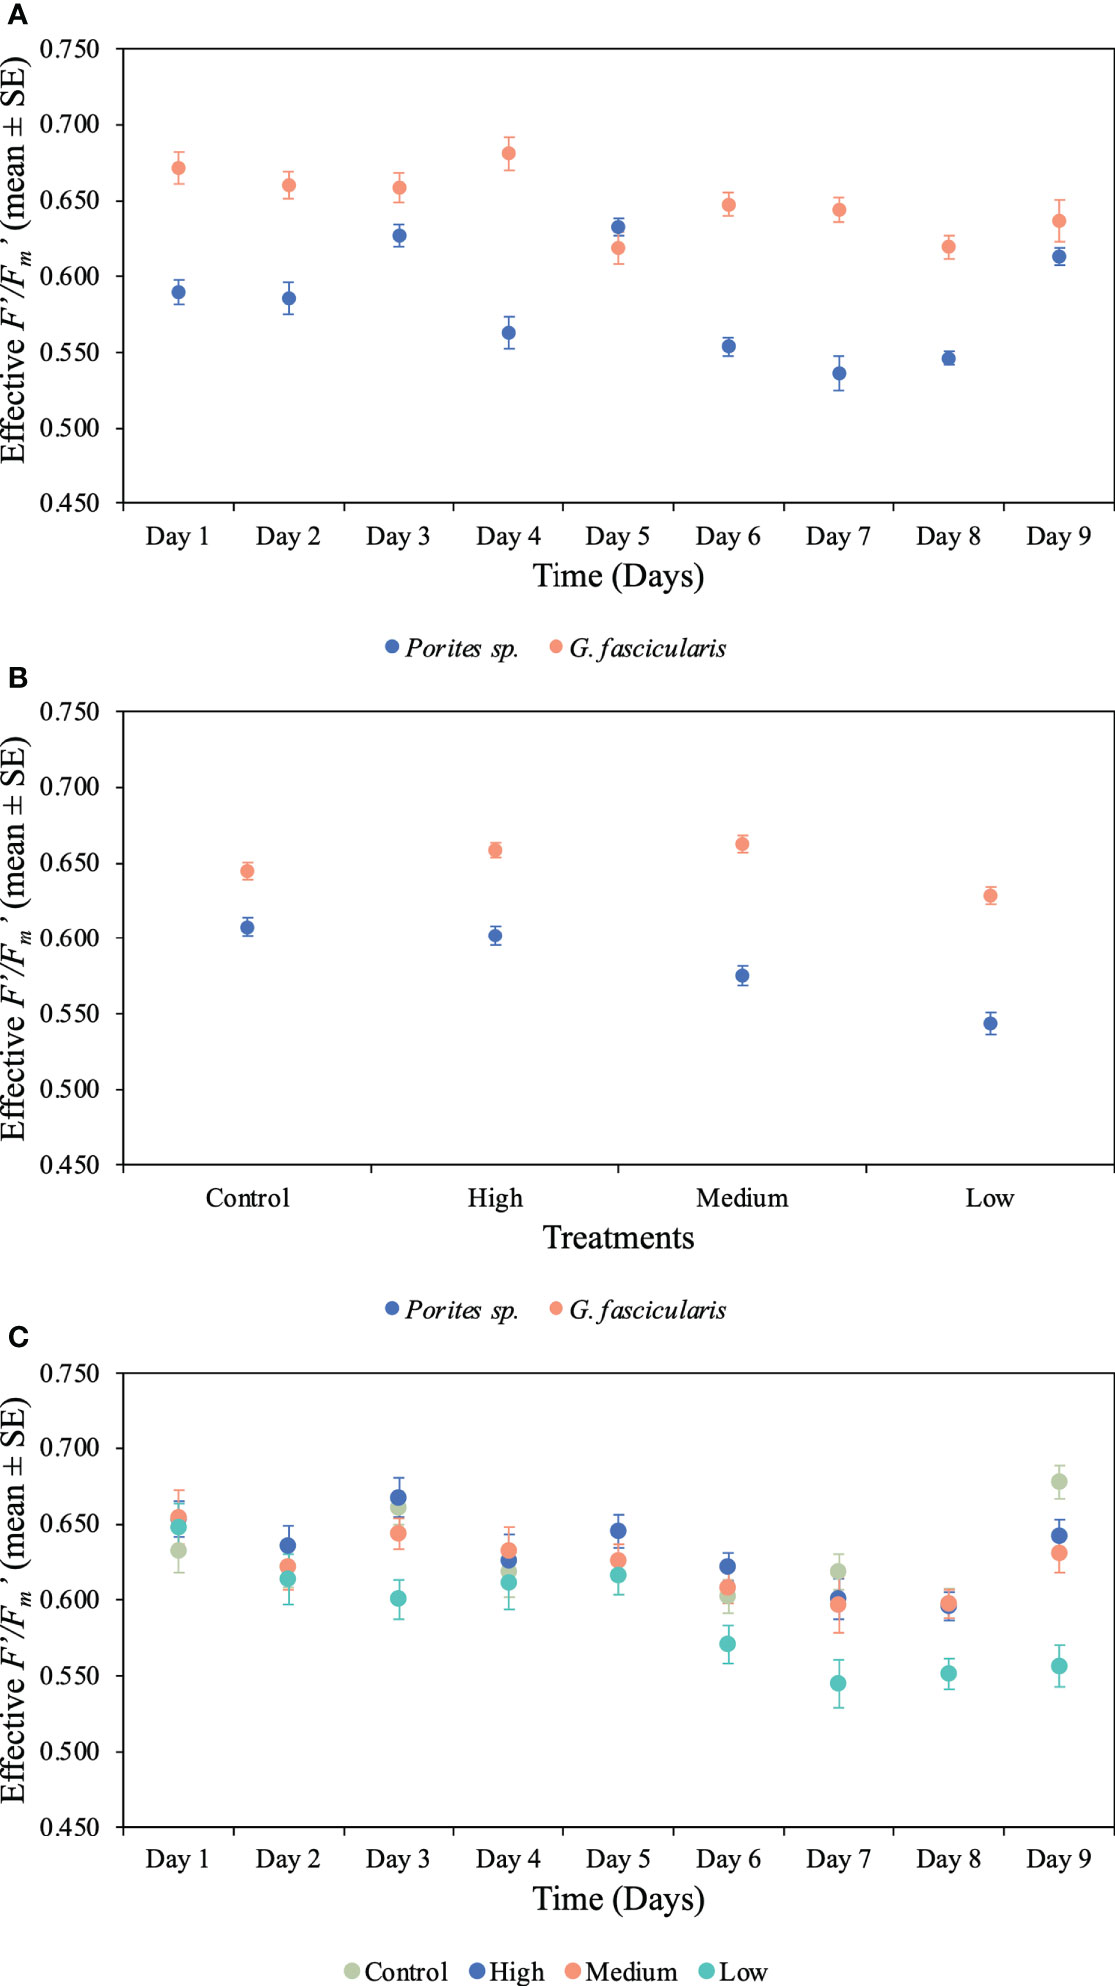
Figure 5 Mean (± 1SE) rates of effective photochemical efficiency (F′/Fm′) and its interaction between (A) species and time for Porites sp. and G. fascicularis throughout the 10 days of the experiment (p < 0.001), (B) species and O2 treatment for Porites sp. and G. fascicularis under all four different O2 treatments (p = 0.023), and (C) time and O2 treatment for Porites sp. and G fascicularis throughout the 10 days of the experiment (p = 0.044).
We further detected a significant interaction between species and O2 treatments for both Fv/Fm and F′/Fm′ indicating that differences among species were inconsistent among the O2 levels tested. For Fv/Fm (p < 0.001, Table 2) and F′/Fm′ (p = 0.023, Table 3), values in the low O2 treatment were reduced relative to all other treatments across both species (Figures 4, 5).
There was also a significant interaction between time and O2 treatments for both maximum and effective photochemical efficiency suggesting that differences among O2 treatments were influenced by exposure time regardless of the species analyzed. That is, for Fv/Fm (p = 0.009, Table 2) on day 1, values in all treatments were around 0.605 ± 0.004SE, increasing to 0.680 ± 0.009SE by day 10 in the control, high, and medium treatments. However, values in the low treatment decreased to 0.561 ± 0.017SE regardless of the species (Figure 4). On the other hand, for F′/Fm′ (p = 0.044, Table 3), all treatments had similar values throughout the experiment, except for the low O2 treatment which exhibited 14.4% reduction by the end of the experiment (Figure 5). We calculated the SLT50 for both species in the low O2 treatment at 32°C. For Porites sp., we calculated the SLT50 at 5.23 ± 3.81SE (Fv/Fm) and 6.54 ± 3.55SE (F′/Fm′) days; on the other hand, for G. fascicularis, we obtained SLT50 at 3.22 ± 1.65SE (Fv/Fm) and 5.43 ± 2.43SE (F′/Fm′) days.
3.2.3 Symbiodiniaceae cell density
We found a significant difference in the symbiont density between species (p < 0.001, Table 4), which indicates that cell density differed between the two species regardless of the O2 treatments. The cell density for G. fascicularis fragments was one order of magnitude higher than for Porites sp. fragments. In addition, the cell density also differed between O2 treatments regardless of species (p = 0.035, Table 4). For example, the cell density of G. fascicularis in the control treatment was 34.5% and 71.4% higher when compared with the medium and low O2 treatments; however, when compared with the high treatment, it was 18.5% lower. On the other hand, Porites sp. fragments had a greater cell density in the control treatment by 104.6% than in the low O2 treatment; however, it was lower by 1.8% and 36.3% when compared with the high and medium treatments, respectively. Both species exhibited the lowest cell density in the low O2 treatment, which suggests that symbionts were experiencing stress due to the reduced DO concentrations (Figure 6).
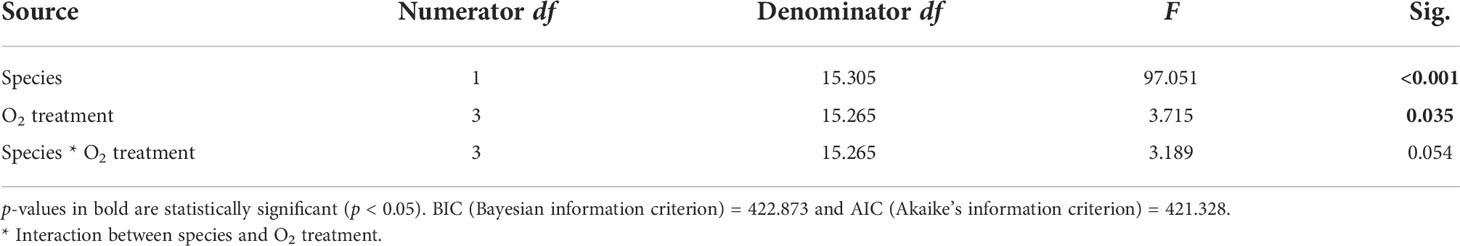
Table 4 Summary of results for LMMs comparing Symbiodiniaceae cell densities between treatments for both species.
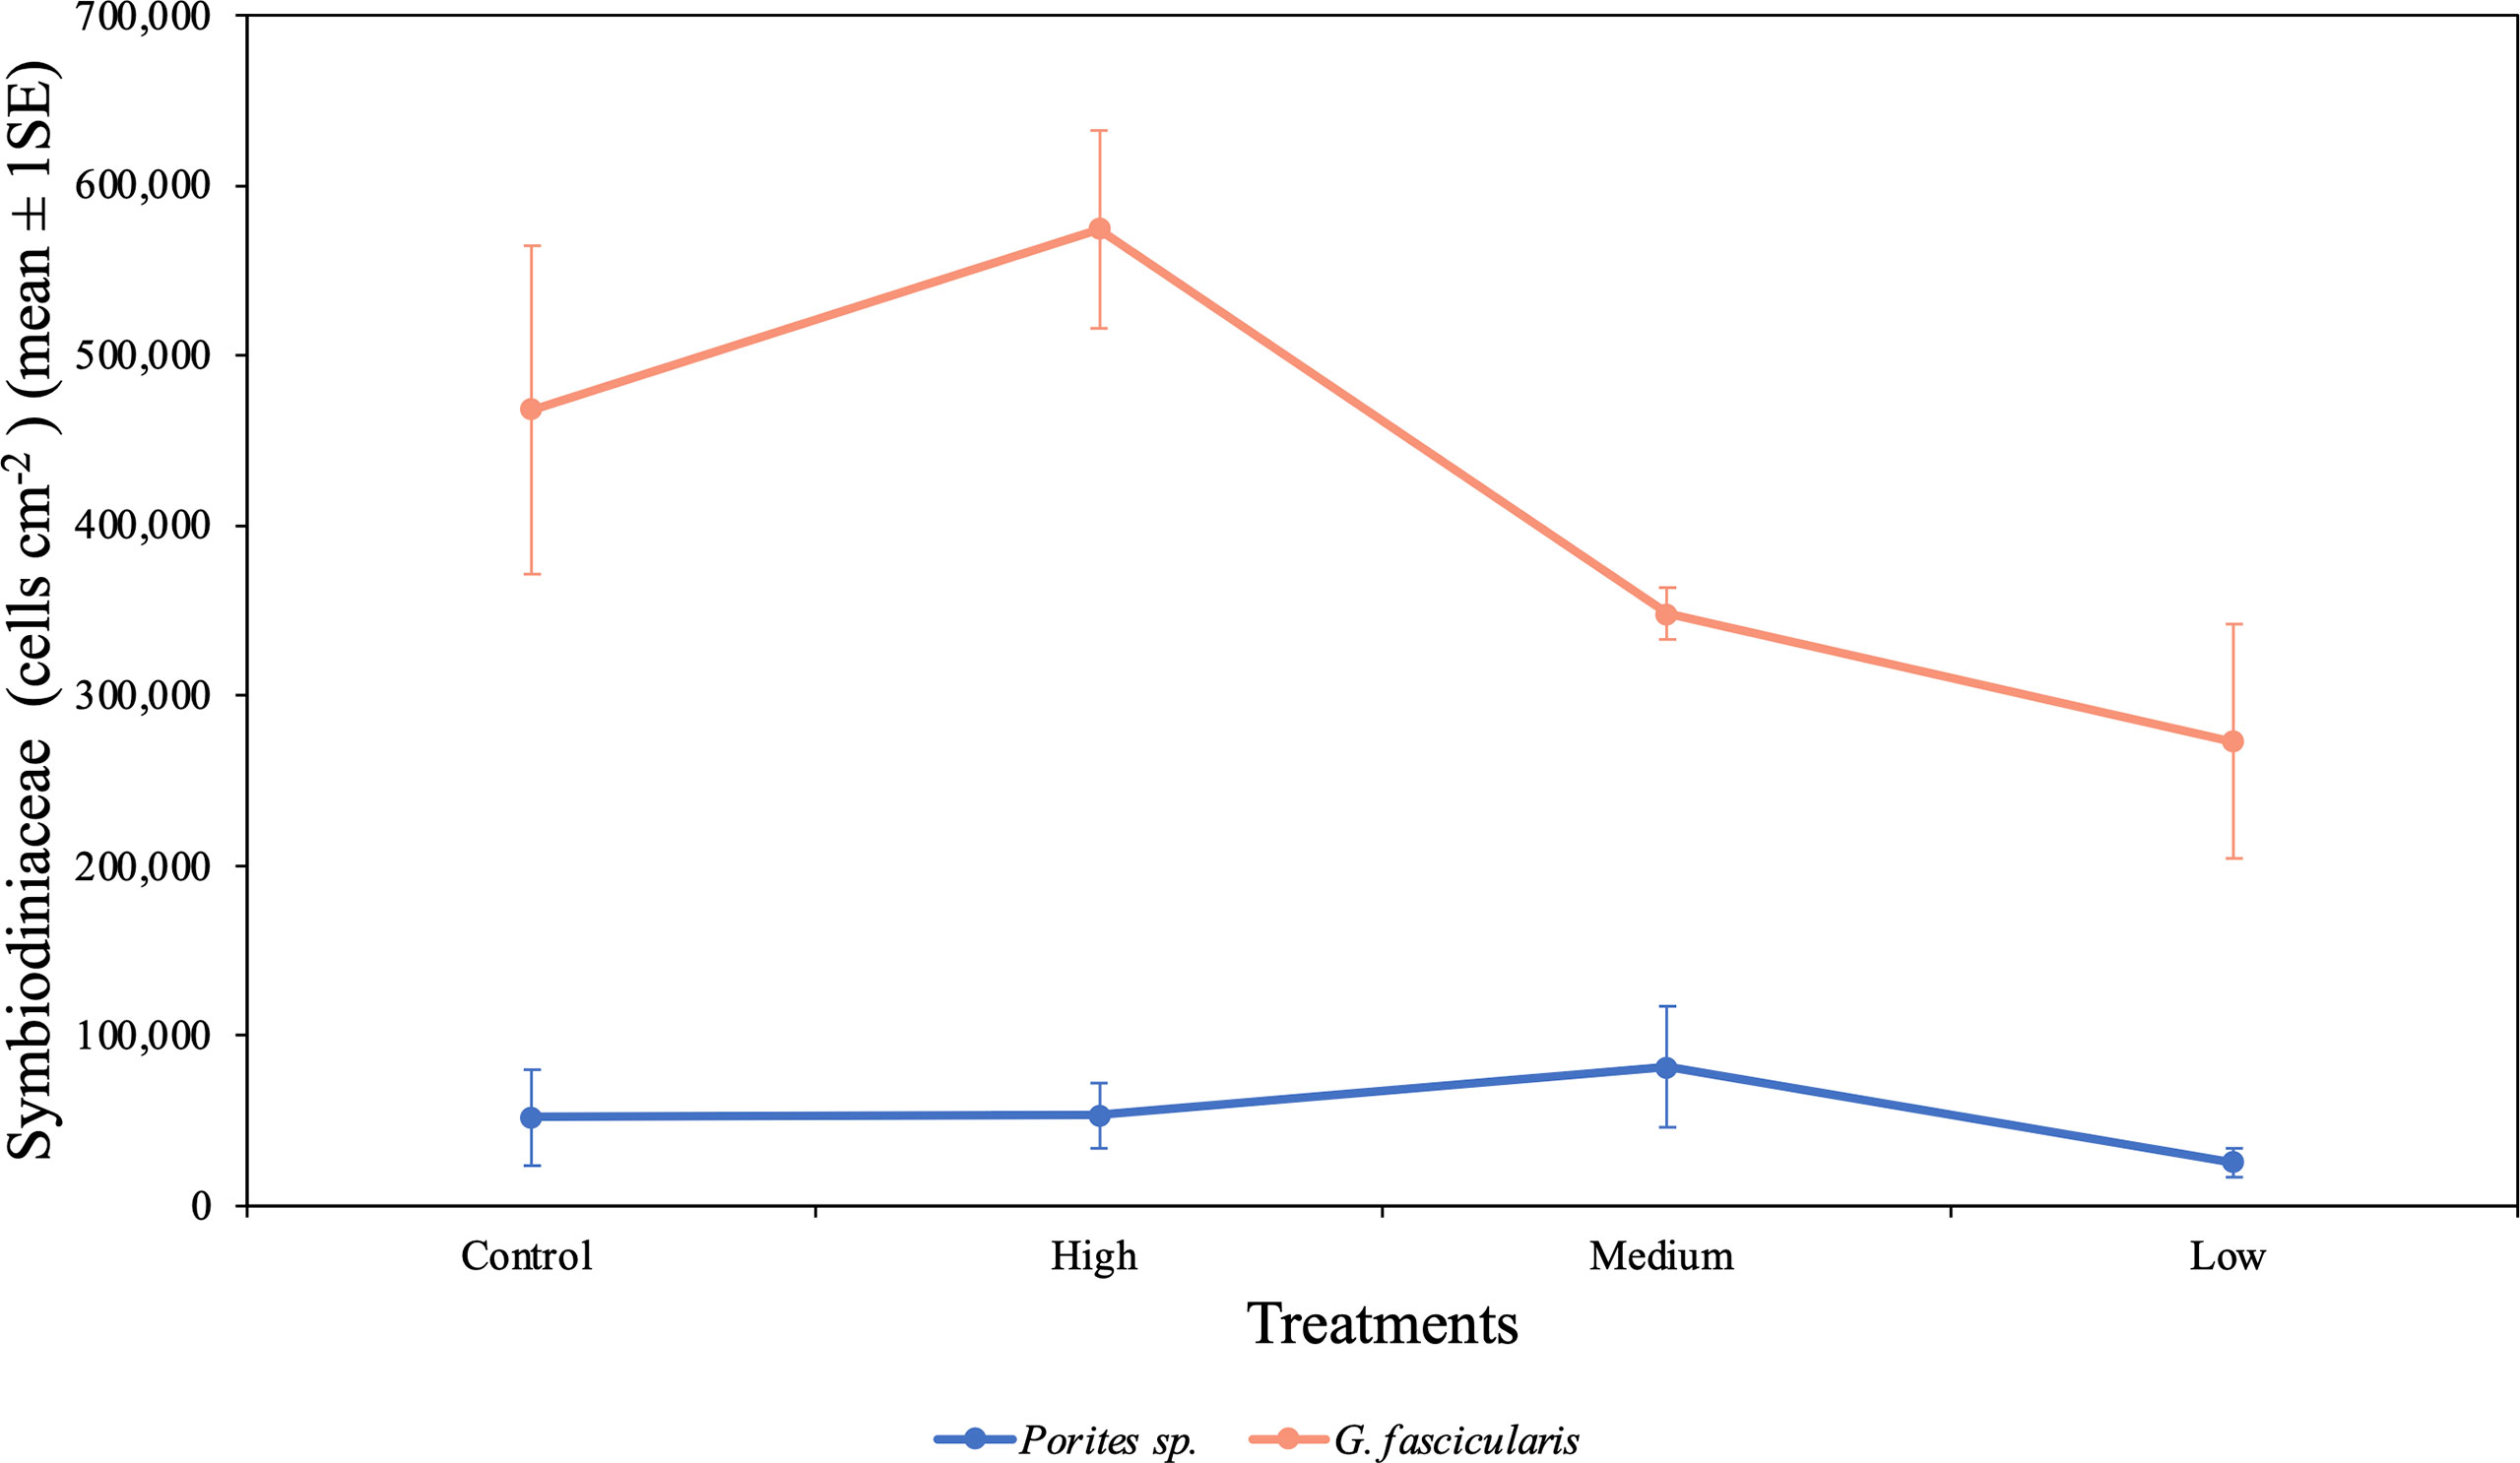
Figure 6 Mean (± 1SE) rates of Symbiodiniaceae cell density (cells cm−2) for Porites sp. and G. fascicularis under all four O2 treatments. Control and high O2 treatment had a more significant cell density for G. fascicularis, while medium and low O2 treatments presented a minor density. Porites sp. presented similar cell density between all four treatments.
3.2.4 Chlorophyll a
We found a significant interaction between species and O2 treatments (p = 0.028, Table 5), indicating that differences in Chl a content between the two species were inconsistent among the O2 treatments. For instance, Porites sp. fragments under the low O2 treatment exhibited Chl a contents 56.6%, 54.4%, and 58.7% lower than fragments in the control, high, and medium treatments, respectively. However, in G. fascicularis fragments, Chl a content was higher in the control and high O2 treatments, relative to the medium and low O2 treatments (Figure 7).
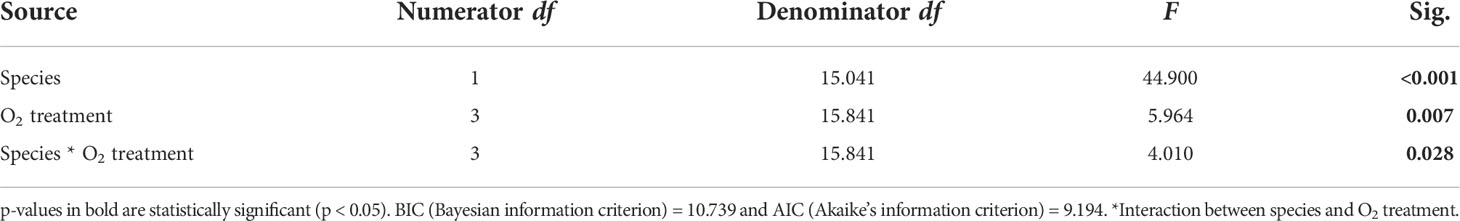
Table 5 Summary of results for LMMs comparing Chl a content between treatments for both species.
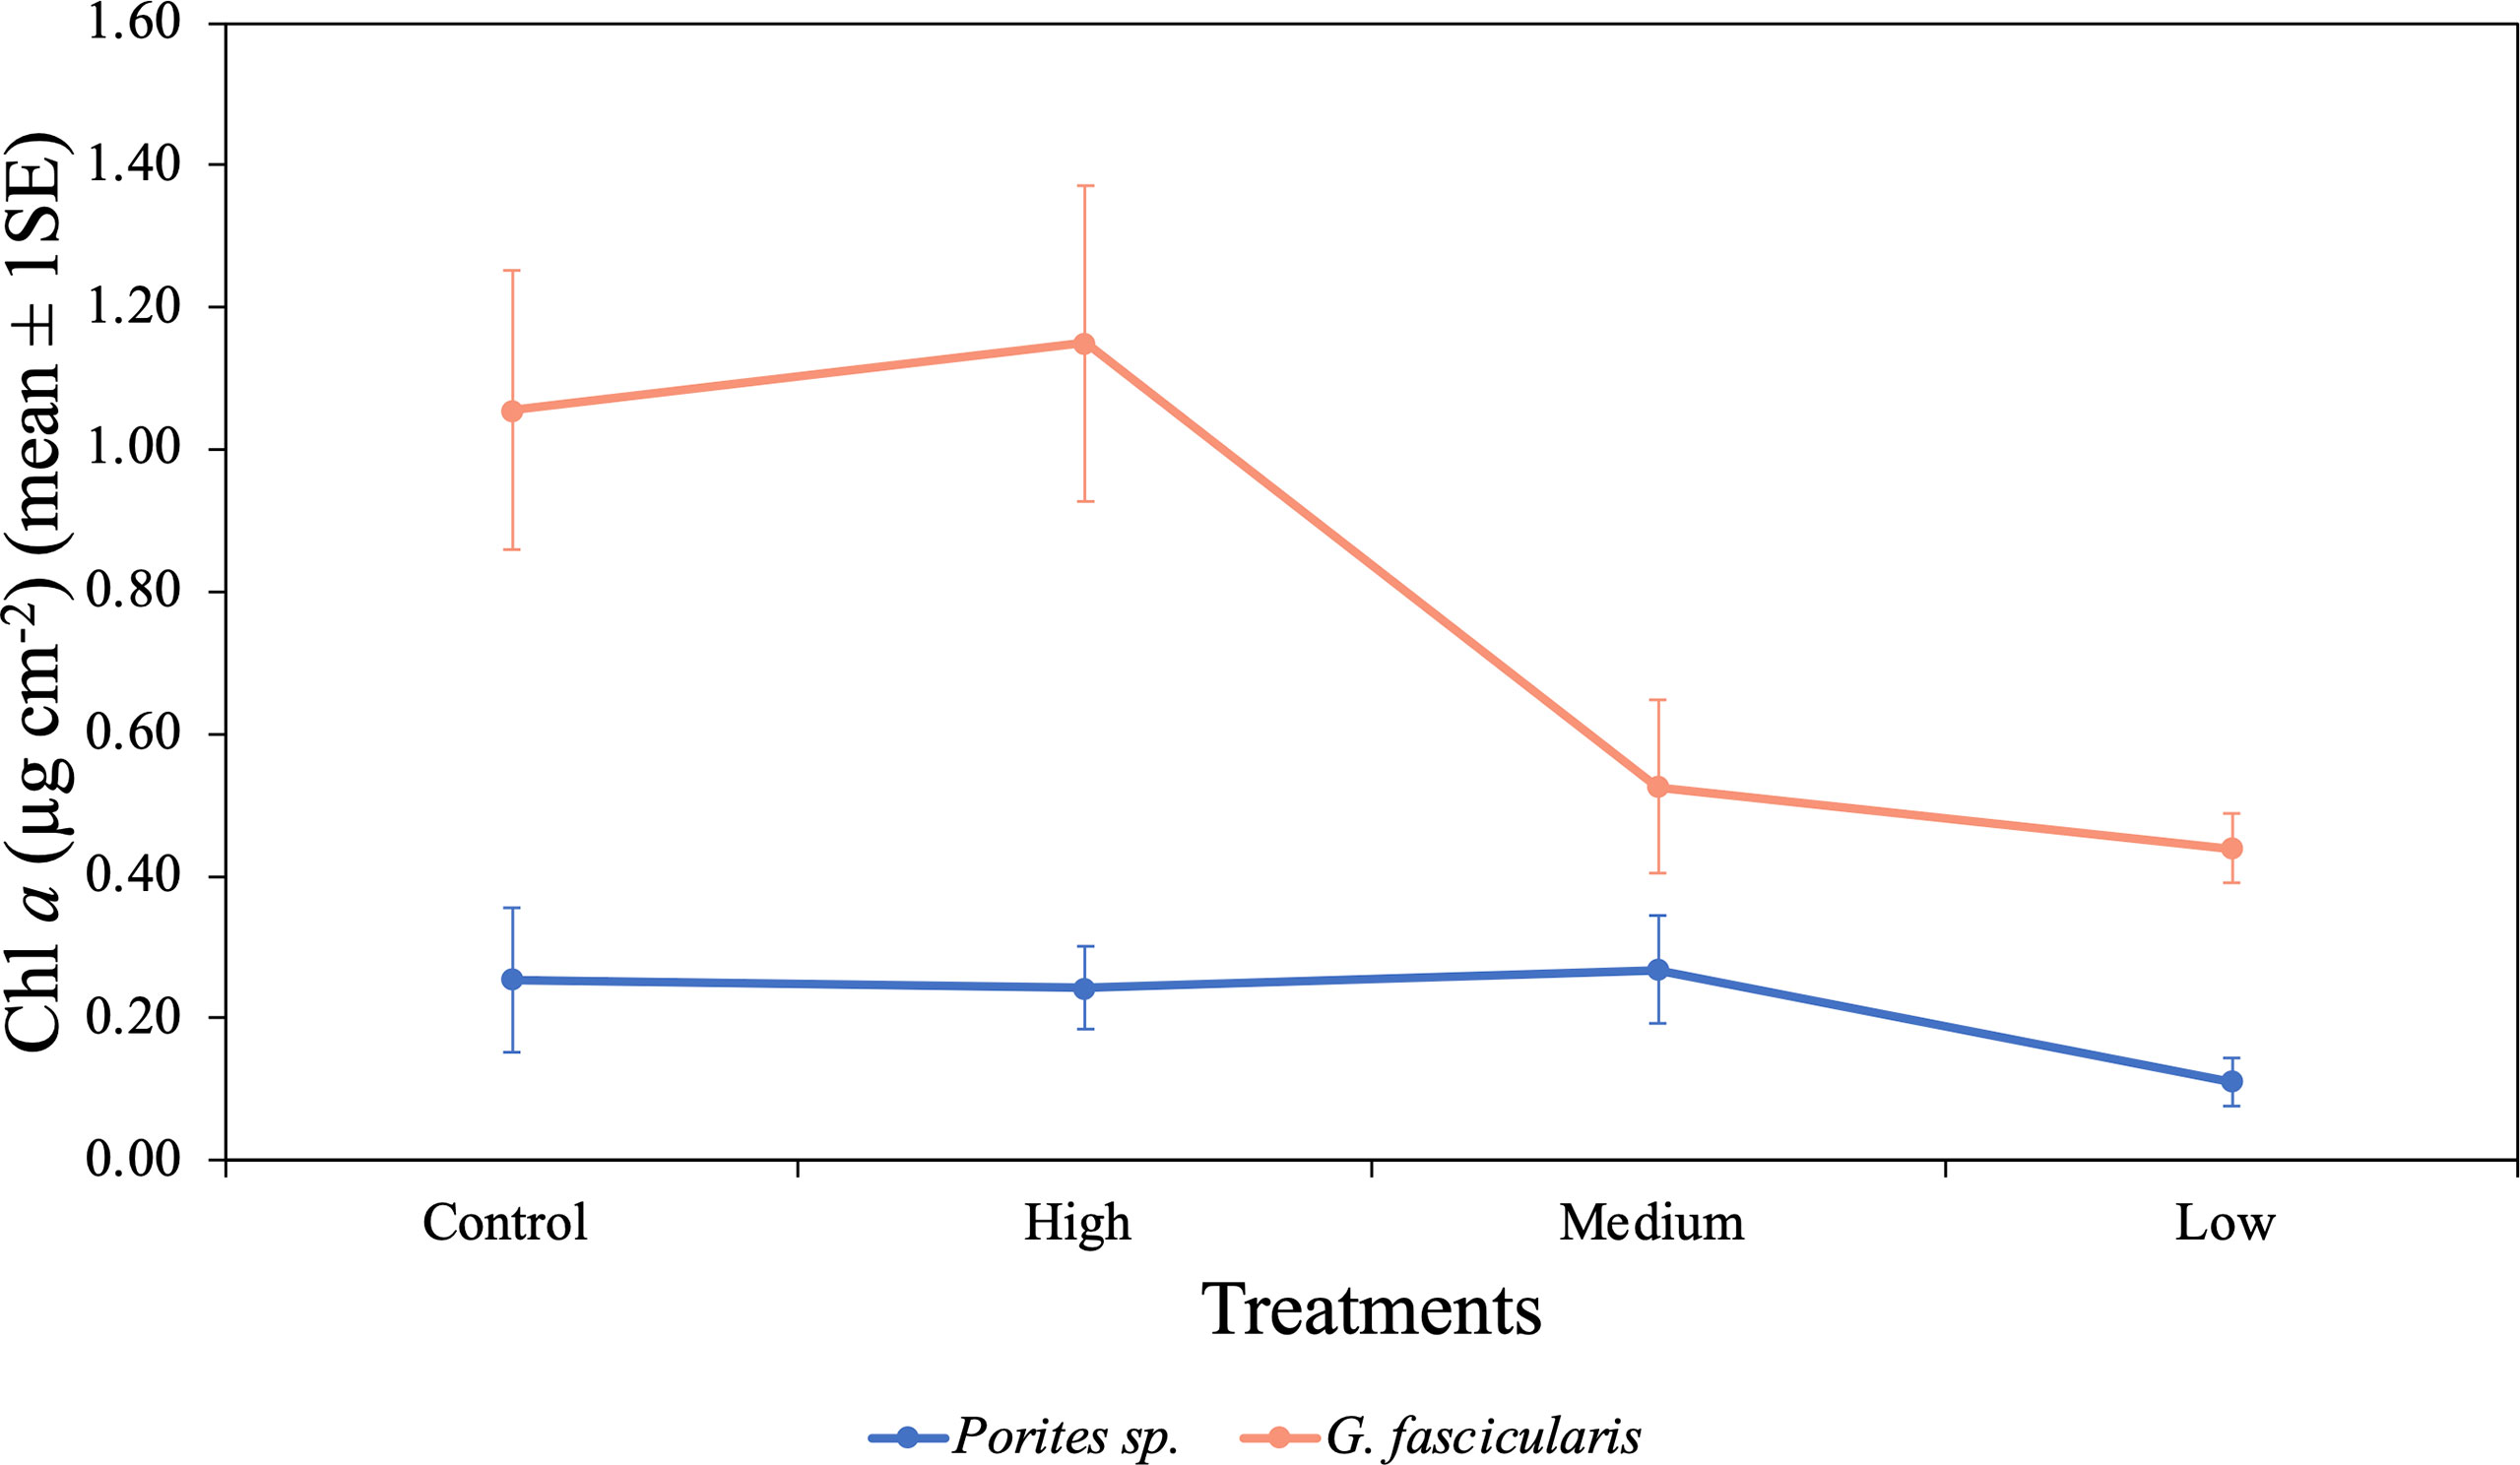
Figure 7 Mean (± 1SE) Chl a (µg cm−2) rates for Porites sp. and G. fascicularis under four O2 treatments. High and low O2 treatments had greater Chl a content for G. fascicularis, while control and medium O2 treatments presented a minor density. Porites sp. presented similar protein content between all four treatments.
4 Discussion
Our findings support the hypothesis that prolonged exposure to hypoxic conditions negatively affects coral physiological performance in the Red Sea and may induce bleaching. Our experiment results showed differences in the physiological responses among the two species tested, with Porites sp. showing higher resistance to the reduced DO treatments tested. Overall, these findings are consistent with previous observations, where massive corals are considered to be more resistant to hypoxic events (Guzmán et al., 1990; Laboy-Nieves et al., 2001). Our results are consistent with the in-situ observations of Laboy-Nieves et al. (2001), where Porites spp. corals from the Morrocoy National Park in Venezuela survived a mass mortality event due to abnormal levels in several physicochemical parameters, including reduced concentrations of DO (<2.3 mg O2 L−1). Similar results were observed by Fine et al. (2013) and Furby et al. (2013), where Porites spp. experienced a lower percentage of bleaching compared with other branching species such as Acropora, Pocillopora, and Stylophora, in the 2010 Red Sea mass bleaching event. However, since DO was not measured in either of these two studies, and the temperature effects were not analyzed in the present study, we can only suggest that hypoxic effects may have influenced the results observed in the 2010 Red Sea bleaching event. Therefore, future experiments should analyze the interaction between increased temperature and decreased DO.
Contrary to the apparent resistance of Porites sp., our results showed hypoxia-induced bleaching for 58% of the G. fascicularis fragments under the low O2 treatment by the end of the experiment. Similar results were observed by Furby et al. (2013) and Monroe et al. (2018), where the genus Galaxea was one of the most impacted by the 2010 Red Sea bleaching event, aligning with previous findings implicating a potential role of O2 deprivation in coral bleaching tolerance (Alderdice et al., 2021), although future experiments are required to test this hypothesis. In the present study, the harmful effects for Porites sp. were not observed even after 10 days of exposure to the different reduced O2 treatments. However, G. fascicularis started bleaching after the third night of the experiment. We further calculated the median bleaching time (SLT50) for G. fascicularis of 5.15 ± 0.80SE days under our low O2 treatment at 32°C. To this day, and according to our knowledge, this is the first hypoxic bleaching threshold yet reported for G. fascicularis or Red Sea corals.
Based on historical bleaching events in the Red Sea, it has been suggested that, although G. fascicularis is considered to be relatively resilient, acute environmental stress can still disrupt its symbiotic relationship with Symbiodiniaceae (Brown et al., 1995; Hou et al., 2018). Our results suggest that exposure time plays a critical role in disrupting this symbiosis, experiencing more severe repercussions when corals are exposed to extended periods of severe hypoxia. Given these results, we hypothesize that previous research testing short exposure times (hours to a few days) may be underestimating the resistance of coral species to hypoxia (Table 6). Therefore, we urge the community to research not only short-term hypoxic events (diel cycles) but also long-term hypoxic events.
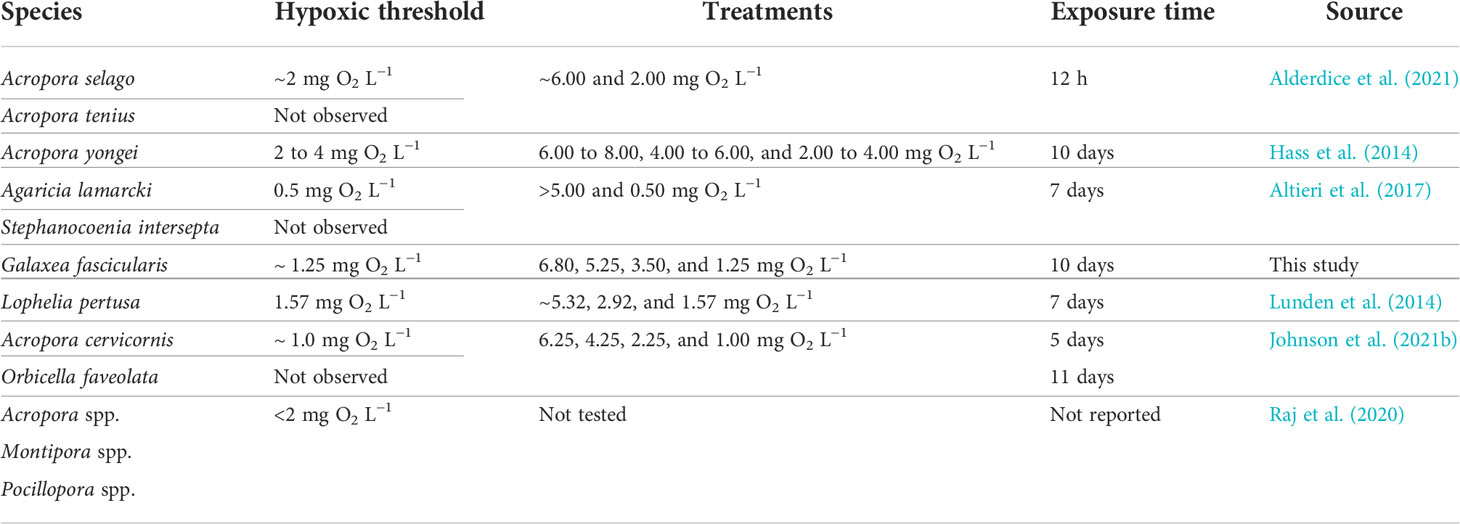
Table 6 To-date summary of hypoxic thresholds at which different coral species presented evident tissue degradation, polyps showed either discoloration or appeared withdrawn, or when substantial reductions in pigment were visible.
Corals from both species, Porites sp. and G. fascicularis, consistently exhibited reduced DR rates under the medium and low O2 treatments, which indicates that the corals are capable of metabolic regulation as an adaptive mechanism to resist hypoxia. Given our results, we hypothesize that DO availability directly influences respiration by increasing respiration rates under high concentrations of O2 and decreasing when found in low O2 concentrations. Osinga et al. (2017) reported similar results for G. fascicularis DR rates, where under hypoxic conditions (~1.62 mg O2 L−1) respiration was lower than in the normoxic (~8.11 mg O2 L−1) and hyperoxic (~12.17 mg O2 L−1) treatments. Similar results were reported by Gardella and Edmunds (1999), where respiration in symbionts isolated from Dichocoenia stokesii in their normoxic treatment (7.53 to 7.84 mg O2 L−1) respired significantly more than those isolated in the hypoxic treatment (3.84 to 4.15 mg O2 L−1). In addition, DR rates differed substantially between species, with G. fascicularis supporting greater respiration rates than Porites sp. in both control and high O2 treatments. This divergence in respiration rates between species could be due to the differences in polyp size, also reflected in a higher symbiont load and Chl a content from G. fascicularis.
Our analysis showed that the interaction between time, O2 treatment, and species significantly affected the maximum photochemical efficiency (Fv/Fm), showing the lowest values of (Fv/Fm) in the low O2 treatment by day 10 for both species. A decline in photochemical efficiency is often used as an indicator of stress because it is considered to be a precursor of coral bleaching due to damage in the photosystems of the symbionts (Jones et al., 1998). Hence, our results suggest that corals in the low O2 treatment experienced damage in their symbionts’ photosynthetic capacity due to prolonged exposure to severe hypoxic conditions. This finding is also supported by Haas et al. (2014), where the maximum (Fv/Fm) measurements for the A. yongei coral fragments under the hypoxic treatment (2 to 4 mg O2 L−1) declined until they reached ~70% of their initial values after the third night of the experiment. Similar results were obtained by Ulstrup et al. (2005), where Pocillopora damicornis coral fragments experienced a reduction in their maximum (Fv/Fm) under anoxic conditions (0 mg O2 L−1). The SLT50 for maximum Fv/Fm values for the low O2 treatment was calculated for both Porites sp. (5.23 ± 3.81SE days) and G. fascicularis (3.22 ± 1.65SE days) at 32°C.
The interaction between time, oxygen treatment, and species also significantly affected our experiment’s effective photochemical efficiency (F′/Fm′), with the low O2 treatment displaying the lowest (F′/Fm′) values for both species by day 9. Haas et al. (2014) showed effective (F′/Fm′) values that mirrored our results, where the effective (F′/Fm′) measurements for the A. yongei coral fragments under the hypoxic treatment (2 to 4 mg O2 L−1) declined until they reached ~80% of their initial values. The SLT50 values for effective F′/Fm′ values for the low O2 treatment at 32°C for Porites sp. and G. fascicularis were equal to 6.54 ± 3.55SE days and 5.43 ± 2.43SE days, respectively.
Both species also displayed the lowest cell count in the low O2 treatment. Similar results were reported by Alderdice et al. (2021) in their short-term hypoxia assay, where the Symbiodiniaceae cell density (cells cm−2) of Acropora selago decreased after 12 h of nighttime low DO (~2 mg O2 L−1) exposure. However, the Symbiodiniaceae cell density of A. selago fragments did not significantly decrease under their control treatment (~6 mg O2 L−1). Altogether, these results indicate that the severity and duration of deoxygenation events should be considered when estimating coral thresholds to constrained O2 availability.
In our experiment, the resilient Porites sp. fragments displayed a minor decrease in Chl a content under the low O2 treatment; however, the susceptible G. fascicularis experienced a significant reduction in Chl a content for both medium and low O2 treatments. Alderdice et al. (2021) reported similar results in their short-term deoxygenation assay, where the Chl a content of Acropora tenuis fragments remained almost the same in both control and hypoxic (~6 and ~2 mg O2 L−1, respectively) treatment after 12 h of nighttime low O2 exposure. However, A. selago displayed a lower Chl a content in the hypoxic treatment (~2 mg O2 L−1) after 12 h of nighttime low O2 exposure.
In the present study, the chosen experimental DO levels tried to mimic the deoxygenation events observed on coral reefs (Breitburg et al., 2018; Johnson et al., 2021a). Therefore, in the present study, we tested reduced O2 levels down to between 1.0 and 1.5 mg O2 L−1. However, some in-situ studies have recorded deoxygenated events on reefs that can reach anoxic conditions (<1 mg O2 L−1) (Chan et al., 2008; Johnson et al., 2021a). The duration of our study likely aligns with the exposure time of events observed on reefs (Johnson et al., 2021a); nonetheless, it is possible that we could have observed bleaching effects on Porites sp. by further reducing DO levels to below 1 mg O2 L−1. Given the differential susceptibility between the two coral species examined here, further research testing lower DO levels (<1 mg O2 L−1) will better determine bleaching thresholds for the resilient species.
Our experimental results support the hypothesis that prolonged exposure to hypoxic conditions with increasing ocean warming may negatively impact coral reefs’ survival in the Red Sea’s warm water. The Red Sea is inherently prone to hypoxia due to the warm temperatures in summer (up to 35°C; Chaidez et al., 2017) and high salinity, which reduce the solubility of O2. In addition, high temperatures lead to high respiratory oxygen demand, so corals may be recurrently exposed to hypoxic conditions, often approaching their sublethal thresholds, during summer nights. However, the two species tested showed considerable differences in vulnerability to hypoxia, with G. fascicularis bearing large polyps with high respiratory O2 demands, being highly vulnerable, and Porites sp. bearing much smaller polyps with much lower respiratory needs, being far more resistant. Specifically, Porites sp. showed high resistance to hypoxia, although all the measured response variables declined under hypoxia.
In contrast, we resolved an O2 SLT50 bleaching threshold for G. fascicularis of 5.15 ± 0.80SE days under the low O2 treatment (1.25 mg O2 L−1) at 32°C, the average maximum temperature in the central Red Sea. Hence, sustained heat waves are expected to lead to hypoxia-induced bleaching of vulnerable Red Sea corals, such as G. fascicularis. Overall, our findings support the hypothesis that oxygen limitation could be an aggravating factor in increasing coral bleaching in a warming ocean, although greater empirical evidence is required to confirm this.
Data availability statement
The original contributions presented in the study are included in the article/Supplementary Material. Further inquiries can be directed to the corresponding author.
Author contributions
Conceptualization: CD and SK. Experimental design: JG, SK and CD. Data collection: JG, SK, TA, SA, AS, and AP. Data analysis/interpretation: JG, SK and CD. Supervision: CD. Writing—original draft: JG. Writing—review and editing: JG, SK and CD. All authors contributed to the article and approved the submitted version.
Funding
Funding supporting this research was provided by the King Abdullah University of Science and Technology through baseline research funds awarded to CD.
Acknowledgments
We thank S. Schmidt-Roach and A. Prieto for their help with the collection and maintenance of the corals. We also thank the KAUST Coastal and Marine Resources Core Labs (CMR) team for their support and assistance.
Conflict of interest
The authors declare that the research was conducted in the absence of any commercial or financial relationships that could be construed as a potential conflict of interest.
Publisher’s note
All claims expressed in this article are solely those of the authors and do not necessarily represent those of their affiliated organizations, or those of the publisher, the editors and the reviewers. Any product that may be evaluated in this article, or claim that may be made by its manufacturer, is not guaranteed or endorsed by the publisher.
Supplementary material
The Supplementary Material for this article can be found online at: https://www.frontiersin.org/articles/10.3389/fmars.2022.945293/full#supplementary-material
References
Alderdice R., Suggett D. J., Cárdenas A., Hughes D. J., Kühl M., Pernice M., et al. (2021). Divergent expression of hypoxia response systems under deoxygenation in reef-forming corals aligns with bleaching susceptibility. Global Change Biol. 27 (2), 312–326. doi: 10.1111/gcb.15436
Al-Horani F. A. (2005). Effects of changing seawater temperature on photosynthesis and calcification in the scleractinian coral galaxea fascicularis, measured with O2, Ca2+ and pH microsensors. Scientia Marina 69 (3), 347–354. doi: 10.3989/scimar.2005.69n3347
Al-Horani F. A., Tambutté É., Allemand D. (2007). Dark calcification and the daily rhythm of calcification in the scleractinian coral, galaxea fascicularis. Coral Reefs 26 (3), 531–538. doi: 10.1007/s00338-007-0250-x
Altieri A. H., Harrison S. B., Seemann J., Collin R., Diaz R. J., Knowlton N. (2017). Tropical dead zones and mass mortalities on coral reefs. Proc. Natl. Acad. Sci. 114 (14), 3660–3665. doi: 10.1073/pnas.1621517114
Anton A., Randle J. L., Garcia F. C., Rossbach S., Ellis J. I., Weinzierl M., et al. (2020). Differential thermal tolerance between algae and corals may trigger the proliferation of algae in coral reefs. Global Change Biol. 26 (8), 4316–4327. doi: 10.1111/gcb.15141
Bourne D. G., Morrow K. M., Webster N. S. (2016). Insights into the coral microbiome: underpinning the health and resilience of reef ecosystems. Annu. Rev. Microbiol. 70 (1), 317–340. doi: 10.1146/annurev-micro-102215-095440
Breitburg D., Levin L. A., Oschlies A., Grégoire M., Chavez F. P., Conley D. J., et al. (2018). Declining oxygen in the global ocean and coastal waters. Science 359 (6371), eaam7240. doi: 10.1126/science.aam7240
Brown B. E., Le Tissier M. D. A., Bythell J. C. (1995). Mechanisms of bleaching deduced from histological studies of reef corals sampled during a natural bleaching event. Mar. Biol. 122 (4), 655–663. doi: 10.1007/BF00350687
Chaidez V., Dreano D., Agusti S., Duarte C. M., Hoteit I. (2017). Decadal trends in red Sea maximum surface temperature. Sci. Rep. 7 (1), 1–8. doi: 10.1038/s41598-017-08146-z
Chan F., Barth J. A., Lubchenco J., Kirincich A., Weeks H., Peterson W. T., et al. (2008). Emergence of anoxia in the California current large marine ecosystem. Science 319 (5865), 920–920. doi: 10.1126/science.1149016
Connell J. H. (1978). Diversity in tropical rain forests and coral reefs: high diversity of trees and corals is maintained only in a nonequilibrium state. Science 199 (4335), 1302–1310. doi: 10.1126/science.199.4335.1302
Costanza R., De Groot R., Sutton P., van der Ploeg S., Anderson S. J., Kubiszewski I., et al. (2014). Changes in the global value of ecosystem services. Global Environ. Change 26, 152–158. doi: 10.1016/j.gloenvcha.2014.04.002
DeCarlo T. M., Cohen A. L., Wong G. T., Shiah F. K., Lentz S. J., Davis K. A., et al. (2017). Community production modulates coral reef pH and the sensitivity of ecosystem calcification to ocean acidification. J. Geophysical Res: Oceans 122 (1), 745–761. doi: 10.1002/2016JC012326
Dickson A. G., Sabine C. L., Christian J. R. (2007). “North pacific marine science organization,” in Guide to best practices for ocean CO2 measurements. (Sidney, British Columbia: North Pacific Marine Science Organization). 191. (PICES Special Publication 3; IOCCP Report 8). doi: 10.25607/OBP-1342
Fine M., Gildor H., Genin A. (2013). A coral reef refuge in the red Sea. Global Change Biol. 19 (12), 3640–3647. doi: 10.1111/gcb.12356
Furby K. A., Bouwmeester J., Berumen M. L. (2013). Susceptibility of central red Sea corals during a major bleaching event. Coral reefs 32 (2), 505–513. doi: 10.1007/s00338-012-0998-5
Gardella D. J., Edmunds P. J. (1999). The oxygen microenvironment adjacent to the tissue of the scleractinian dichocoenia stokesii and its effects on symbiont metabolism. Mar. Biol. 135 (2), 289–295. doi: 10.1007/s002270050626
Genevier L. G., Jamil T., Raitsos D. E., Krokos G., Hoteit I. (2019). Marine heatwaves reveal coral reef zones susceptible to bleaching in the red Sea. Global Change Biol. 25 (7), 2338–2351. doi: 10.1111/gcb.14652
Giomi F., Barausse A., Duarte C. M., Booth J., Agusti S., Saderne V., et al. (2019). Oxygen supersaturation protects coastal marine fauna from ocean warming. Sci. Adv. 5 (9), eaax1814. doi: 10.1126/sciadv.aax1814
Glynn P. W. (1993). Coral reef bleaching: ecological perspectives. Coral Reefs 12 (1), 1–17. doi: 10.1007/BF00303779
Guadayol O., Silbiger N. J., Donahue M. J., Thomas F. I. (2014). Patterns in temporal variability of temperature, oxygen and pH along an environmental gradient in a coral reef. PloS One 9 (1), e85213. doi: 10.1371/journal.pone.0085213
Guzmán H. M., Cortés J., Glynn P. W., Richmond R. H. (1990). Coral mortality associated with dinoflagellate blooms in the eastern pacific (Costa Rica and Panama). Mar. Ecol. Prog. Ser. (Halstenbek) 60, 299–303. doi: 10.3354/meps060299
Haas A. F., Smith J. E., Thompson M., Deheyn D. D. (2014). Effects of reduced dissolved oxygen concentrations on physiology and fluorescence of hermatypic corals and benthic algae. PeerJ 2, e235. doi: 10.7717/peerj.235
Hoegh-Guldberg O., Poloczanska E. S., Skirving W., Dove S. (2017). Coral reef ecosystems under climate change and ocean acidification. Front. Mar. Sci. 4, 158. doi: 10.3389/fmars.2017.00158
Hou J., Xu T., Su D., Wu Y., Cheng L., Wang J., et al. (2018). RNA-Seq reveals extensive transcriptional response to heat stress in the stony coral galaxea fascicularis. Front. Genet. 9, 37. doi: 10.3389/fgene.2018.00037
Hughes D. J., Alderdice R., Cooney C., Kühl M., Pernice M., Voolstra C. R., et al. (2020). Coral reef survival under accelerating ocean deoxygenation. Nat. Climate Change 10 (4), 296–307. doi: 10.1038/s41558-020-0737-9
Hughes T. P., Baird A. H., Bellwood D. R., Card M., Connolly S. R., Folke C., et al. (2003). Climate change, human impacts, and the resilience of coral reefs. science 301 (5635), 929–933. doi: 10.1126/science.1085046
Johnson M. D., Scott J. J., Leray M., Lucey N., Bravo L. M. R., Wied W. L., et al. (2021a). Rapid ecosystem-scale consequences of acute deoxygenation on a Caribbean coral reef. Nat. Commun. 12 (1), 1–12. doi: 10.1038/s41467-021-24777-3
Johnson M. D., Swaminathan S. D., Nixon E. N., Paul V. J., Altieri A. H. (2021b). Differential susceptibility of reef-building corals to deoxygenation reveals remarkable hypoxia tolerance. Sci. Rep. 11 (1), 1–12. doi: 10.1038/s41598-021-01078-9
Jones R. J., Hoegh-Guldberg O., Larkum A. W., Schreiber U. (1998). Temperature-induced bleaching of corals begins with impairment of the CO2 fixation mechanism in zooxanthellae. Plant Cell Environ. 21 (12), 1219–1230. doi: 10.1046/j.1365-3040.1998.00345.x
Keeling R. F., Körtzinger A., Gruber N. (2010). Ocean deoxygenation in a warming world. Annu. Rev. Mar. Sci. 2 (1), 199–229. doi: 10.1146/annurev.marine.010908.163855
Klein S. G., Pitt K. A., Nitschke M. R., Goyen S., Welsh D. T., Suggett D. J., et al. (2017). Symbiodinium mitigate the combined effects of hypoxia and acidification on a noncalcifying cnidarian. Global Change Biol. 23 (9), 3690–3703. doi: 10.1111/gcb.13718
Klein S. G., Steckbauer A., Duarte C. M. (2020). Defining CO2 and O2 syndromes of marine biomes in the anthropocene. Global Change Biol. 26 (2), 355–363. doi: 10.1111/gcb.14879
Knowlton N., Rohwer F. (2003). Multispecies microbial mutualisms on coral reefs: the host as a habitat. Am. Nat. 162 (S4), S51–S62. doi: 10.1086/378684
Kühl M., Cohen Y., Dalsgaard T., Jørgensen B. B., Revsbech N. P. (1995). Microenvironment and photosynthesis of zooxanthellae in scleractinian corals studied with microsensors for O2, pH and light. Mar. Ecology-Progress Ser. 117 (1-3), 159–172. doi: 10.3354/meps117159
Laboy-Nieves E. N., Klein E., Conde J. E., Losada F., Cruz J. J., Bone D. (2001). Mass mortality of tropical marine communities in morrocoy, Venezuela. Bull. Mar. Sci. 68 (2), 163–179.
LaJeunesse T. C., Parkinson J. E., Gabrielson P. W., Jeong H. J., Reimer J. D., Voolstra C. R., et al. (2018). Systematic revision of symbiodiniaceae highlights the antiquity and diversity of coral endosymbionts. Curr. Biol. 28 (16), 2570–2580. doi: 10.1016/j.cub.2018.07.008
Lavigne H., Gattuso J. P. (2011) Seacarb: seawater carbonate chemistry with r. r package version 2.4.1. Available at: http://CRAN.Rproject.org/package=seacarb.
Lunden J. J., McNicholl C. G., Sears C. R., Morrison C. L., Cordes E. E. (2014). Acute survivorship of the deep-sea coral lophelia pertusa from the gulf of Mexico under acidification, warming, and deoxygenation. Front. Mar. Sci. 1, 78. doi: 10.3389/fmars.2014.00078
Marhaver K. L., Edwards R. A., Rohwer F. (2008). Viral communities associated with healthy and bleaching corals. Environ. microbiol. 10 (9) pp, 2277–2286. doi: 10.1111/j.1462-2920.2008.01652.x
Marsh J. A. Jr. (1970). Primary productivity of reef-building calcareous red algae. Ecology 51 (2), 255–263. doi: 10.2307/1933661
Matthews M. A., McMahon R. F. (1999). Effects of temperature and temperature acclimation on survival of zebra mussels (Dreissena polymorpha) and Asian clams (Corbicula fluminea) under extreme hypoxia. J. Molluscan Stud. 65 (3), 317–325. doi: 10.1093/mollus/65.3.317
Moberg F., Folke C. (1999). Ecological goods and services of coral reef ecosystems. Ecol. Economics 29 (2), 215–233. doi: 10.1016/S0921-8009(99)00009-9
Monroe A. A., Ziegler M., Roik A., Röthig T., Hardenstine R. S., Emms M. A., et al. (2018). In situ observations of coral bleaching in the central Saudi Arabian red Sea during the 2015/2016 global coral bleaching event. PloS One 13 (4), e0195814. doi: 10.1371/journal.pone.0195814
Muscatine L., Porter J. W. (1977). Reef corals: Mutualistic symbioses adapted to nutrient-poor environments. Bioscience 27 (7), 454–460. doi: 10.2307/1297526
Nelson H. R., Altieri A. H. (2019). Oxygen: the universal currency on coral reefs. Coral Reefs 38 (2), 177–198. doi: 10.1007/s00338-019-01765-0
Osinga R., Derksen-Hooijberg M., Wijgerde T., Verreth J. A. (2017). Interactive effects of oxygen, carbon dioxide and flow on photosynthesis and respiration in the scleractinian coral galaxea fascicularis. J. Exp. Biol. 220 (12), 2236–2242. doi: 10.1104/pp.59.5.868
Osman E. O., Smith D. J., Ziegler M., Kürten B., Conrad C., El-Haddad K. M., et al. (2018). Thermal refugia against coral bleaching throughout the northern red Sea. Global Change Biol. 24 (2), e474–e484. doi: 10.1111/gcb.13895
Rädecker N., Pogoreutz C., Ziegler M., Ashok A., Barreto M. M., Chaidez V., et al. (2017). Assessing the effects of iron enrichment across holobiont compartments reveals reduced microbial nitrogen fixation in the red Sea coral pocillopora verrucosa. Ecol. Evol. 7 (16), 6614–6621. doi: 10.1002/ece3.3293
Raj K. D., Mathews G., Obura D. O., Laju R. L., Bharath M. S., Kumar P. D., et al. (2020). Low oxygen levels caused by noctiluca scintillans bloom kills corals in gulf of mannar, India. Sci. Rep. 10 (1), 1–7. doi: 10.1038/s41598-020-79152-x
Ritchie R. J. (2006). Consistent sets of spectrophotometric chlorophyll equations for acetone, methanol and ethanol solvents. Photosynthesis Res. 89 (1), 27–41. doi: 10.1007/s11120-006-9065-9
Ritz C., Baty F., Streibig J. C., Gerhard D. (2015). Dose-response analysis using r. PloS One 10 (12), e0146021. doi: 10.1371/journal.pone.0146021
Smith L. W., Barshis D., Birkeland C. (2007). Phenotypic plasticity for skeletal growth, density and calcification of porites lobata in response to habitat type. Coral Reefs 26 (3), 559–567. doi: 10.1007/s00338-007-0216-z
Steckbauer A., Klein S. G., Duarte C. M. (2020). Additive impacts of deoxygenation and acidification threaten marine biota. Global Change Biol. 26 (10), 5602–5612. doi: 10.1111/gcb.15252
Tyler R. M., Brady D. C., Targett T. E. (2009). Temporal and spatial dynamics of diel-cycling hypoxia in estuarine tributaries. Estuaries Coasts 32 (1), 123–145. doi: 10.1007/s12237-008-9108-x
Ulstrup K. E., Hill R., Ralph P. J. (2005). Photosynthetic impact of hypoxia on in hospite zooxanthellae in the scleractinian coral pocillopora damicornis. Mar. Ecol. Prog. Ser. 286, 125–132. doi: 10.3354/meps286125
Vaquer-Sunyer R., Duarte C. M. (2008). Thresholds of hypoxia for marine biodiversity. Proc. Natl. Acad. Sci. 105 (40), 15452–15457. doi: 10.1073/pnas.0803833105
Yonge S. C. M., Nicholls A. G., Yonge M. J. (1928). The relationship between respiration in corals and the production of oxygen by their zooxanthellae. Sci. Reports/Gt. Barrier Reef Exped 29 (1932), 1. Available at: https://biostor.org/reference/175051.
Keywords: coral reefs, dissolved oxygen, deoxygenation, O2 depletion, exposure time
Citation: Alva García JV, Klein SG, Alamoudi T, Arossa S, Parry AJ, Steckbauer A and Duarte CM (2022) Thresholds of hypoxia of two Red Sea coral species (Porites sp. and Galaxea fascicularis). Front. Mar. Sci. 9:945293. doi: 10.3389/fmars.2022.945293
Received: 16 May 2022; Accepted: 11 October 2022;
Published: 27 October 2022.
Edited by:
Jian-Wen Qiu, Hong Kong Baptist University, Hong Kong SAR, ChinaCopyright © 2022 Alva García, Klein, Alamoudi, Arossa, Parry, Steckbauer and Duarte. This is an open-access article distributed under the terms of the Creative Commons Attribution License (CC BY). The use, distribution or reproduction in other forums is permitted, provided the original author(s) and the copyright owner(s) are credited and that the original publication in this journal is cited, in accordance with accepted academic practice. No use, distribution or reproduction is permitted which does not comply with these terms.
*Correspondence: Jacqueline V. Alva García, jacqueline.alvagarcia@kaust.edu.sa
†These authors have contributed equally to this work