
95% of researchers rate our articles as excellent or good
Learn more about the work of our research integrity team to safeguard the quality of each article we publish.
Find out more
ORIGINAL RESEARCH article
Front. Mar. Sci. , 29 July 2022
Sec. Marine Ecosystem Ecology
Volume 9 - 2022 | https://doi.org/10.3389/fmars.2022.939393
 Satomi Takagi*Hiroshi KurodaNatsuki HasegawaTsuyoshi WatanabeTatsuya UnumaYukiko TaniuchiTakashi Yokota†Daisuke Izumida†Toru NakagawaTadahide KurokawaTomonori Azumaya
Unprecedented, large-scale harmful algal blooms (HABs) dominated by Karenia selliformis occurred off the southeastern coast of Hokkaido, Japan, from late September to early November 2021, about a month after intense and extensive marine heatwaves (MHWs) had subsided. The aims of the present study were to understand the mechanism of development, maintenance, and decay of the HABs as well as to investigate the effect of the MHWs on the HABs. We developed a one-dimensional, lower trophic-level ecosystem model (NEMURO+) to simulate the HABs. The model successfully simulated the 2021 HABs and indicated that their development, maintenance, and decay were controlled primarily by changes of water temperature. Nitrate supply from subsurface layers by seasonal vertical diffusion in autumn also helped to maintain the HABs. Vertical diffusion following MHWs in 2021 contributed to the long duration of the preferred temperature for K. selliformis and the occurrence of pre-bloom of K. selliformis, resulting in preconditioning and accelerating the HABs. However, simulations for normal years (i.e., the climatological mean during 2003–2018) showed that HABs could have occurred, even in the absence of MHWs. The simulations indicated that massive blooms of other phytoplankton species (e.g., diatoms) would not have occurred in 2021, even in the absence of a K. selliformis bloom. The implication was that the HABs in 2021 were the species-specific responses of K. selliformis. The proposed mechanism of the HABs was peculiar to our study area and differed from that previously reported for other K. selliformis blooms. Specifically, the preferred temperature for the HABs of K. selliformis was clearly lower than the previously reported preferred temperature of K. selliformis; thus, the physiological characteristics of the K. selliformis that bloomed in our study area differed from those of other K. selliformis strains. These discoveries provide the first evidence to explain how MHWs affect HABs, and to understand how inter-regional dissimilarities of K. selliformis can lead to large-scale, devastating outbreaks under different oceanographic conditions.
Harmful algal blooms (HABs) are a worldwide problem that causes a variety of negative impacts on marine ecosystems, aquaculture, fisheries, local economies, and human health and well-being (Morris, 1999; Anderson et al., 2015; Berdalet et al., 2015; Brown et al., 2020; Sakamoto et al., 2021). The frequency and geographic distribution of HABs have increased in recent decades (reviewed by Fu et al., 2012). Recent reports of a correlation between the frequency of HABs and changing climate conditions, including warming, stratification intensity, and natural patterns of climate variability such as the El Niño Southern Oscillation and Pacific Decadal Oscillation (León-Muñoz et al., 2018; Phlips et al., 2020; Trainer et al., 2020; Lim et al., 2021) have suggested that climate change is increasing the risk of HABs.
Record-breaking marine heatwaves (MHWs; Hobday et al., 2016) occurred over the northwestern Pacific Ocean during July–August 2021 (Kuroda and Setou, 2021). About a month after the MHWs, unprecedented, large-scale HABs were first observed along >300 km of the southeastern coast of Hokkaido, Japan, including places where water depths were less than 300 m, that is, coastal shelf waters. The HABs continued until early November 2021 (Kuroda et al., 2021; Hasegawa et al., under review). The consequences included disastrous massive die-offs of wild sea urchins, chum salmon in fixed nets, and juvenile fishes in rearing facilities (Kuroda et al., 2021). Karenia selliformis was identified as a dominant species of the HABs (Iwataki et al., 2022). Just 1 year before the occurrence of the HABs, a large-scale bloom of K. selliformis was recorded to the east of the Kamchatka Peninsula during September–October 2020 (Bondur et al., 2021). Particle-tracking simulations of the HABs in southeast Hokkaido suggested that the Pacific Ocean east of the Kamchatka Peninsula could have been one of the sites from which the algae or their seeds were transported (Kuroda et al., 2021). In addition, rDNA sequencing showed that the K. selliformis from the HABs that occurred southeast of Hokkaido in 2021 and east of Kamchatka in 2020 were identical (Iwataki et al., 2022).
Large blooms of K. selliformis have been reported in various regions such as the Gulf of Gabès, Tunisia (Feki et al., 2008; Zingone et al., 2021); Kuwait and adjacent locations in the Arabian Gulf (Heil et al., 2001); around the coast of South Island, New Zealand (MacKenzie et al., 1996); and south of Chile (Mardones et al., 2020). These blooms have killed a variety of marine organisms. Monitoring and statistical modeling of K. selliformis blooms in the Gulf of Gabès have revealed a relationship between K. selliformis blooms and environmental factors, including nutrient concentrations, salinity, and temperature (Feki et al., 2008; Feki-Sahnoun et al., 2014; Feki-Sahnoun et al., 2017; Feki-Sahnoun et al., 2018; Feki-Sahnoun et al., 2020). The requirement of high salinity (>36.0) for the blooms has been documented in several studies (Feki et al., 2008; Medhioub et al., 2009; Feki-Sahnoun et al., 2017; Feki-Sahnoun et al., 2018; Feki-Sahnoun et al., 2020). Feki-Sahnoun et al. (2017) have reported higher concentrations of K. selliformis in a highly saline, semi-enclosed lagoon compared with the adjacent open coastline and have suggested that the weak advection of water out of the lagoon results in little dilution of the K. selliformis population and sustains the growth and maintenance of the bloom. The blooms of K. selliformis that occurred southeast of Hokkaido in 2021 were along the open coast facing the North Pacific Ocean, and the salinities along the coast ranged from 32.0 to 35.0 (Kuroda et al., 2017). In addition, the presence of terrestrial sanctuaries in southeast Hokkaido, one of which is a Ramsar Site (http://www.env.go.jp/en/nature/nps/park/kushiro/index.html; accessed on 8 February 2022), suggests that nutrients from industrial developments are insignificant causes of pollution along the coastline of southeast Hokkaido. Therefore, the geographical and environmental conditions differ greatly between southeast Hokkaido and other regions where the mechanisms responsible for HABs of K. selliformis have been investigated previously, for example, estuaries, lagoons, and closed bay. The implication is that the HABs that occurred off the southeast Hokkaido coast in 2021 could be caused by different mechanisms. It is also noteworthy that previous studies of K. selliformis blooms have not proposed any mechanism for the demise of the blooms.
Inclusion of physical data in an ecosystem model can enable demonstration of phytoplankton bloom dynamics and nutrient cycles. The minimum trophic structure and the number and kinds of biological relationships thought to be essential to describe ecosystem dynamics in the North Pacific are represented in the Pacific International Council for the Exploration of the Sea Climate Change and Carrying Capacity prototype, lower trophic-level, marine ecosystem model named “NEMURO” (North Pacific Ecosystem Model for Understanding Regional Oceanography). NEMURO can be driven with environmental metrics (temperature, light intensity, and vertical diffusion coefficient) and thereby simulate changes in phytoplankton biomass. Kishi et al. (2007) have described the biological and physical processes simulated by NEMURO and the equations that describe the exchange of material and energy between the state variables of the model. In the same study, they also used NEMURO to reproduce the seasonal changes of concentrations of nutrients and chlorophyll a at Stn. A7 off southeast Hokkaido (41.5°N, 145.5°E, Figure 1). The trophic structure of the area where the HABs occurred off southeast Hokkaido in 2021 can thus be reproduced using a modified version of NEMURO.
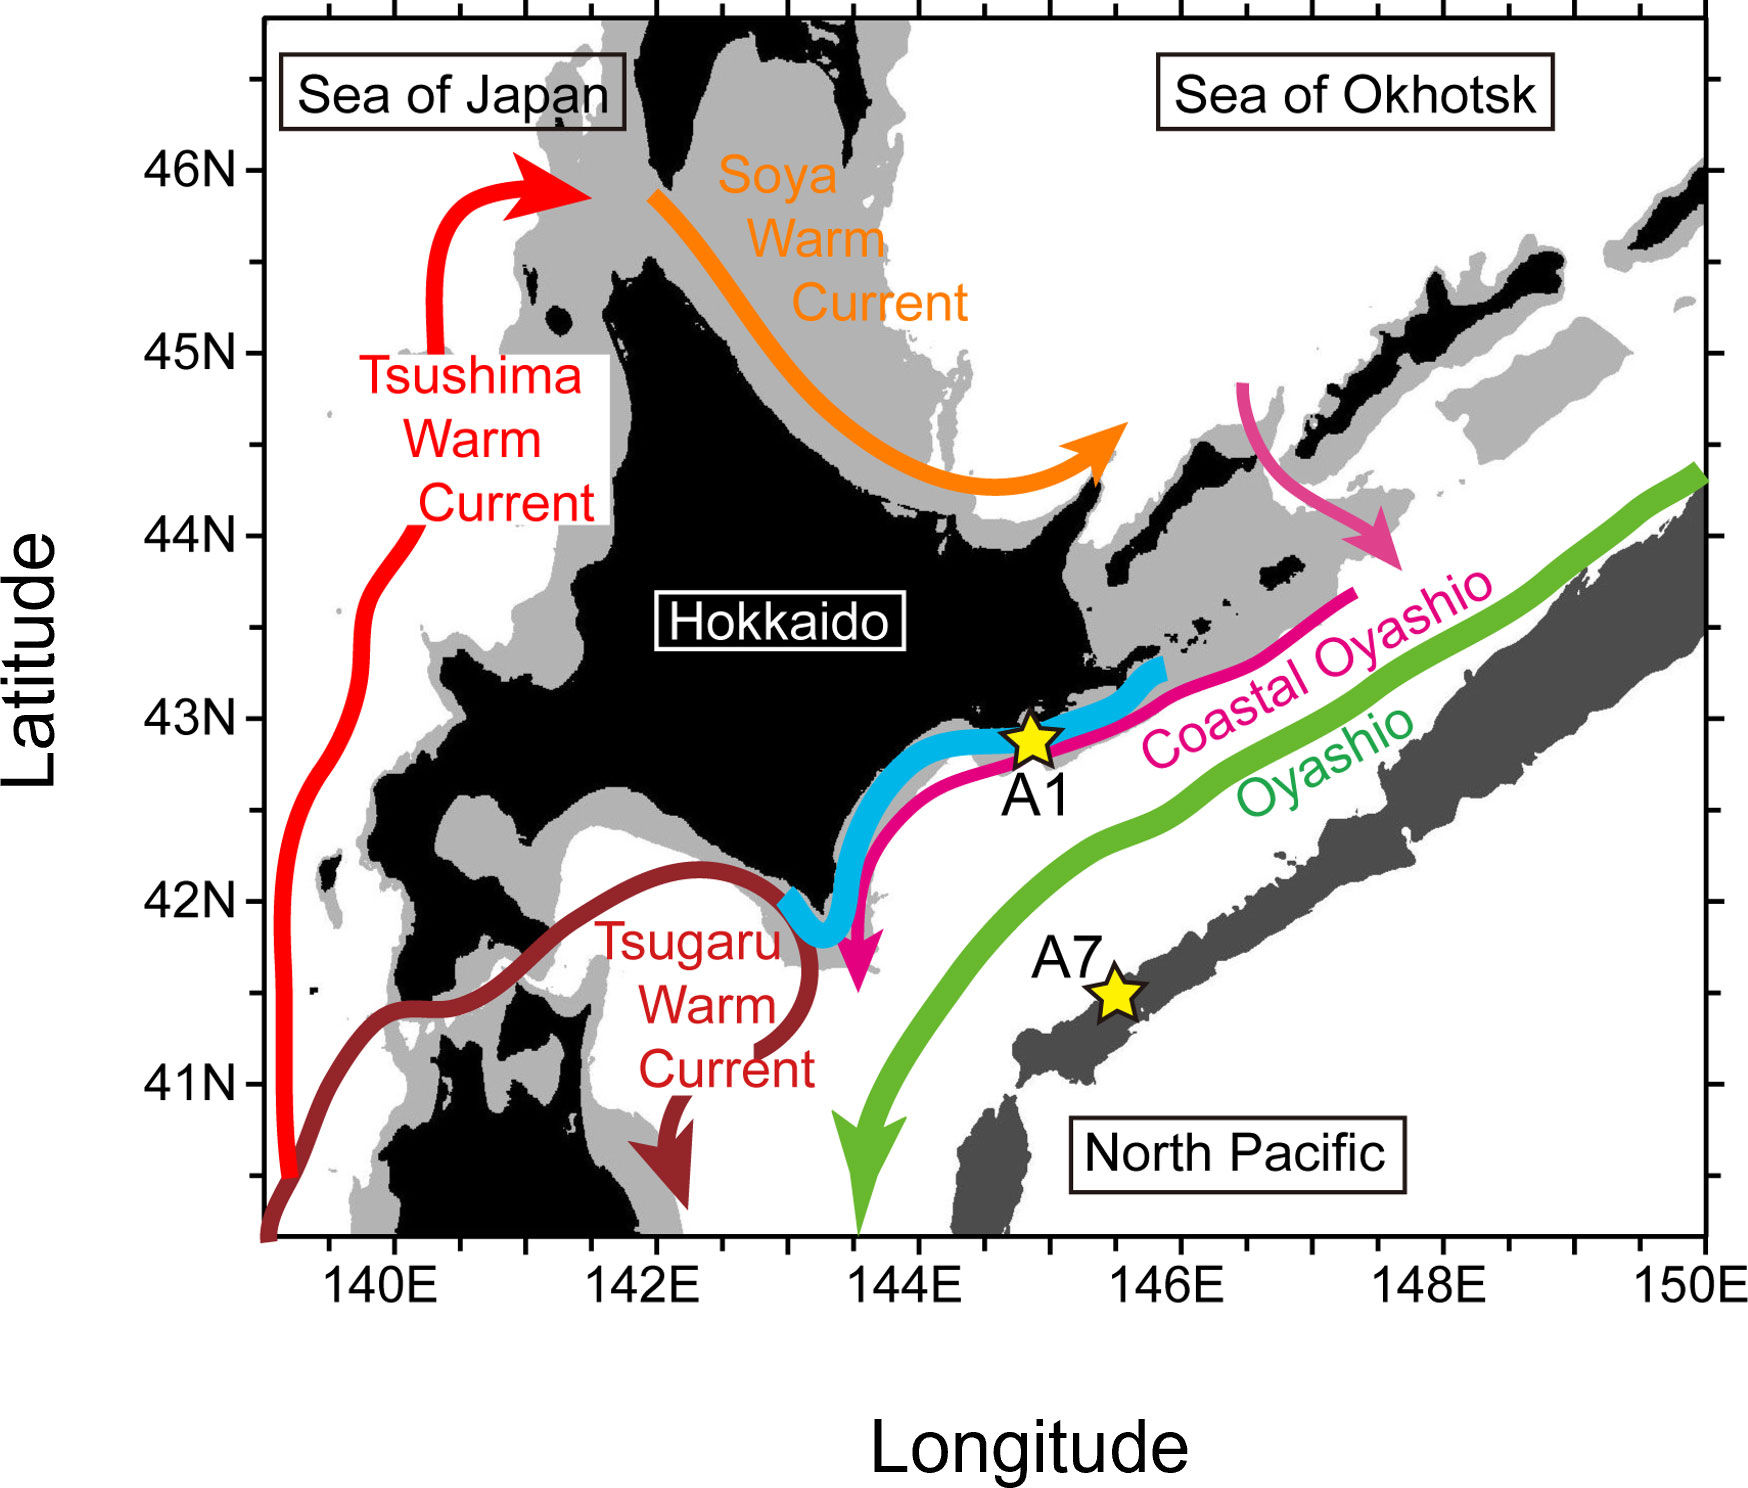
Figure 1 Location of Stns. A1 and A7 (yellow stars) and schematic of surface ocean currents (arrows) around Hokkaido during summer−autumn. Water depths ≥6500 m (i.e., trenches) and < 200 m (i.e., continental shelf) are shown by dark and light gray shading, respectively. The bold, light-blue line roughly indicates coastal waters where fisheries experienced devastating damages that were attributable to harmful algal blooms after mid-September 2021.
The purpose of the present study was to investigate the mechanisms responsible for the development, maintenance, and decay of the HABs off southeast Hokkaido in 2021 by simulating the HABs using a one-dimensional version of NEMURO. We tuned NEMURO to simulate coastal shelf water, and we added a new compartment that reflected the biological characteristics of K. selliformis and seasonal changes in chlorophyll a concentration off southeast Hokkaido. We also investigated the effect of the MHWs by simulating conditions during normal years before the HABs occurred.
The one-dimensional (vertical) NEMURO model used in this study followed the biomass (µmol L−1) of 11 compartments: large phytoplankton (PL), small phytoplankton (PS), large zooplankton (ZL), small zooplankton (ZS), predatory zooplankton (ZP), nitrate (NO3), ammonium (NH4), silicic acid (Si(OH)4), particulate organic nitrogen (PON), biogenic silica (Opal), and dissolved organic nitrogen (DON). Section 1.1 in the Supplementary Material shows the equations governing the flows of nitrogen and silicon through the 11 compartments. PL is assumed to represent diatoms, which make siliceous tests. PS represents small phytoplankton other than diatoms. ZL represents omnivorous meso-zooplankton that undergo seasonal, vertical migrations; they ascend into and descend below the model domain (Kishi et al., 2001). ZS represents microzooplankton such as ciliates and zooflagellates, and ZP represents omnivorous macrozooplankton such as euphausiidae and chaetognatha. The rate of change of the biomass in each of the 11 compartments was described by a differential equation (Kishi et al., 2007). The source and sinks of the 11 compartments were represented by individual biochemical processes that were determined independently in each compartment or as functions of the biomasses in other compartments. For the case of source and sink of phytoplankton, photosynthesis, respiration, excretion, grazing by herbivorous zooplankton, and other causes of mortality affected each phytoplankton group. Those processes were all assumed to be temperature dependent. Photosynthesis was also assumed to depend on light intensity, which decreased with increasing depth and NO3 and NH4 concentrations. In addition, Si(OH)4 concentrations assumed to influence the photosynthetic rates of PL. The factors that drove the model were the seawater temperature, vertical diffusion coefficient, and light intensity.
To simulate the HABs that occurred off southeast Hokkaido in 2021 (for brevity, “the 2021 HABs”), a new compartment, “phytoplankton population dominated by K. selliformis (PK),” which reflected the biological characteristics of K. selliformis and the surface chlorophyll a concentrations off southeast Hokkaido during the 2021 HABs, was added to NEMURO (NEMURO+). Figure 2 is a schematic of NEMURO+. The flow of nitrogen through PK was based on the flow of nitrogen through PS. The rate of change of the PK biomass was described as follows:
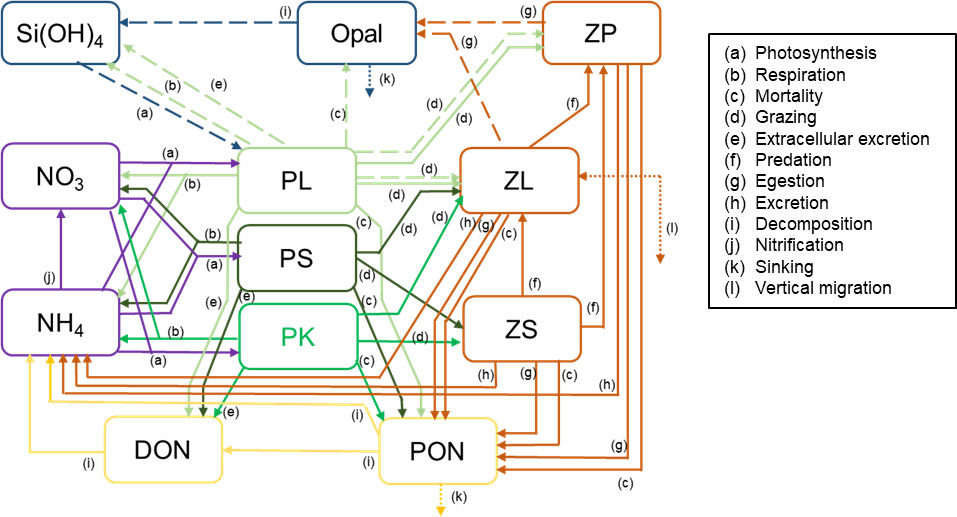
Figure 2 Schematic of the NEMURO+ showing the 12 compartments and the processes linking them. Solid and dashed arrows indicate flows of nitrogen and silicon, respectively. Dotted arrows indicate the exchange or sinking of materials between the modeled box and the region below the mixed layer. PL, population of large phytoplankton (diatom); PK, phytoplankton population dominated by Karenia selliformis; PS, population of phytoplankton other than PL and PK; ZL, population of large zooplankton; ZS, population of small zooplankton; ZP, population of predatory zooplankton; NO3, nitrate; NH4, ammonium; Si(OH)4, silicate; PON, particulate organic nitrogen; Opal, biogenic silica; DON, dissolved organic nitrogen.
where KZ is the vertical diffusion coefficient. The initial PK biomass was 2.0 µmol N L−1. Grazing pressures on PK by ZL and ZS were assumed to be half the grazing pressures on PS to reflect the high rejection rate of Karenia sp. by zooplanktons (Schultz & Kiørboe, 2009; Xu and Kiørboe, 2018). The maximum growth rate (Vmax ) of PK was set to 3.0 d−1, which was higher than that of PL, because a previous study had reported the Vmax of Karenia mikimotoi, which was also detected in the water samples from the 2021 HABs (Iwataki et al., 2022), to be higher than that of diatoms (Li et al., 2010). Past studies have documented the influence of salinity and temperature on the growth rate of Karenia sp., including K. selliformis (Magaña and Villareal, 2006; Errera & Campbell, 2011; Feki et al., 2013; Mardones et al., 2020). Because the salinity off southeast Hokkaido is in the range 32.0–35.0 throughout years (Section 1.2 in the Supplementary Material; Kuroda et al., 2017), any effects of salinity were omitted to keep the model simple. The fc(T) term, which represents a temperature-dependent function (Kamezawa et al., 2009), was included in the equation for photosynthesis of PK (GppPK) as follows:
where PK, biomass of PK measured in nitrogen (µmol N L−1); PS, biomass of PS measured in nitrogen (µmol N L−1); PL, biomass of PL measured in nitrogen (µmol N L−1); H1, upper depth of the layer (m); H2, lower depth of the layer (m); IoptPK, PK optimum light intensity (W m−2); IH1, light intensity at the upper depth of the layer (W m−2); Z, vertical coordinate (m); α1, light extinction coefficient of seawater (m−1); α2, self shading coefficient (µmol N L−1 m−1); KNO3PK, PK half-saturation constant for nitrate (µmol N L−1); ΨPK, PK ammonium inhibition coefficient (µmol N L−1); KNH4PK, PK half-saturation constant for ammonium (µmol N L−1); kGppPK, PK temperature coefficient for photosynthetic rate (°C−1); T, seawater temperature (°C).
The terms P1(I), P2(N), and P3(T) change as functions of light intensity, nitrogen (nitrate and ammonium) concentration and water temperature, respectively. The nitrogen uptake term P2(N) is based on Michaelis–Menten relationship and gourmet term of ammonium (preference of phytoplankton for ammonia over nitrate; Wroblewski, 1977).
The function fc(T) in the equation for P3(T) (Eq. [7]) was the product of two sigmoid functions (Thornton & Lessem, 1978).
The sigmoid functions increase (gcta) and decrease (gctb) with changes in seawater temperature.
To determine the values of te1−te4, daily values of satellite-derived chlorophyll a concentrations (SCCs) and Himawari-8–derived sea surface temperatures between 140–150°E and 40–46°N from 31 August 2021 to 31 December 2021 were collected from the European Union’s Copernicus Marine Service and the Japan Aerospace Exploration Agency P-tree system, respectively. The frequency distribution of SCCs that exceeded 10 mg m−3 was calculated as a function of sea surface temperatures based on Kuroda et al. (2021). We then calculated the values of te1−te4 that produced the highest correlation coefficient between the frequency distributions and the fc(T) function (Figure 3; Table 1). Phototaxis was omitted because significant effects on PK concentrations were not observed (see Section 1.3 in the Supplementary Material for details). The other parameters of PK were the same as the default parameters of PS.
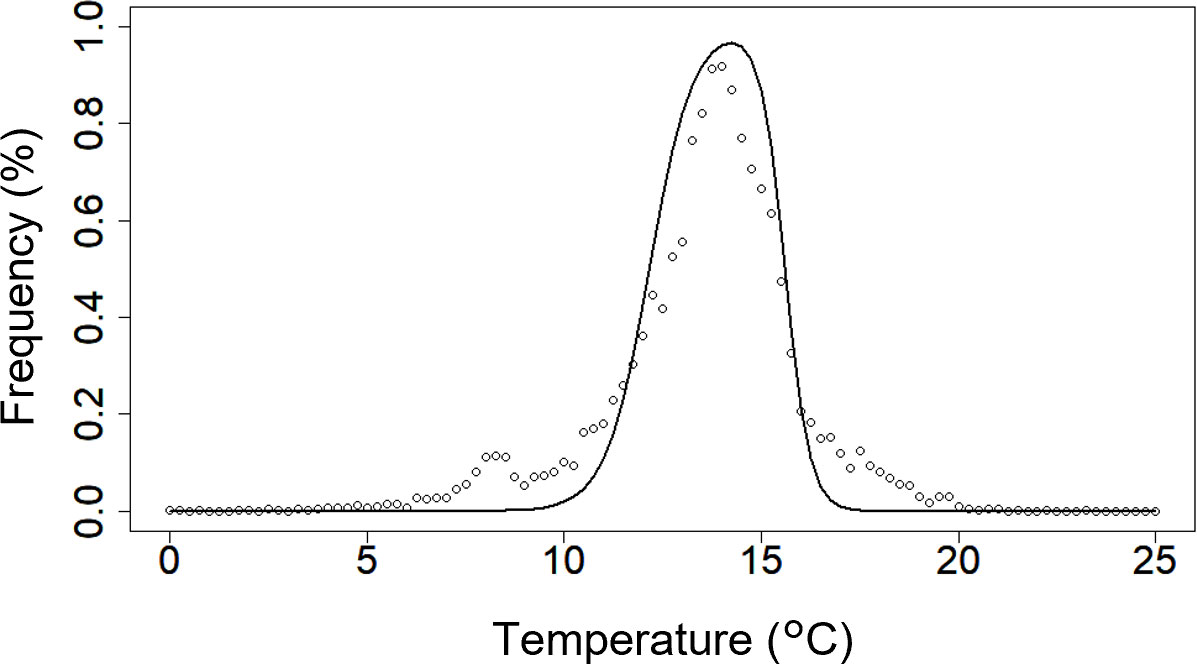
Figure 3 Frequency distributions of chlorophyll-a concentrations that exceeded 10 mg m−3 (open circles) versus sea-surface temperature. The black line shows the fc(T) function fitted to the data. The daily satellite-derived chlorophyll-a concentrations (SCCs) and Himawari-8-derived sea surface temperatures at longitudes of 140–150°E and latitudes of 40–46°N from 31 August 2021 to 31 December 2021 were collected from the European Union’s Copernicus Marine Service and the Japan Aerospace Exploration Agency P-tree system, respectively. The frequency distribution for SCCs exceeding 10 mg m−3 was calculated as a function of sea surface temperatures on the basis of Kuroda et al. (2021).

Table 1 Parameter values of fc(T) function.
The original parameter set of the 11 compartments in NEMURO had previously been modified to reasonably simulate seasonal cycles of biochemical components at Stn. A7 (Kishi et al., 2007), near the Kuril-Kamchatka Trench, where there is on average a northeastward Oyashio return flow (Kuroda et al., 2017). Our focus was on the Pacific shelf, the location of the core of the 2021 HABs. The 11 compartments in NEMURO+ was therefore tuned to reproduce seasonal changes of nutrients and plankton concentration at Stn. A1 on the shelf at a water depth of ~100 m (144° 50.0′E, 42° 50.0′N; Figure 1).
The one-dimensional (vertical) NEMURO+ for Stn. A1 had 101 vertical layers with intervals of 1 m. We neglected horizontal and vertical advection. Physical variables (i.e., temperature and the vertical diffusion coefficient) were not explicitly determined with the model but extracted from the daily mean output of a three-dimensional, realistic ocean model with a horizontal resolution of 1/50° (Kuroda et al., 2021). The realistic ocean model could reasonably simulate oceanographic conditions around the study area. The daily outputs during 2003–2018 and 2021 were applied to our simulation; the outputs during 2003–2018 were climatologically averaged and input to NEMURO+ as normal conditions. The outputs during 2021 were input to NEMURO+ as the conditions during a year with HABs and MHWs. The state variables for the 11 compartments in the water column were computed sequentially by integrating the diffusion-reaction equations.
The initial NO3 and Si(OH)4 concentrations in NEMURO+ were set to 15.0 µmol L−1 and 25.0 µmol L−1, respectively, the corresponding average concentration at Stn. A1 in January of 2003–2018 estimated from field measurements (Kuroda et al., 2017; Kuroda et al., 2019). Light intensity at the sea surface was calculated from the radiation model of Reed (1977).
A time step of 5 s was used in the numerical integration. Daily mean external forcing data were linearly interpolated at each time step during the model run. The model quickly reached a nearly steady state after the first month of integration. The model simulations were therefore carried out from 1 January for 360 days, because our primary focus was the summer-autumn time interval. The initial biomass of each compartment and the driving forces were set for each layer. We analyzed the daily model outputs averaged over 17,280 time steps (i.e., 1 day) (Section 2.4).
Values of the biochemical parameters in the 11 compartments other than PK were identical to the default values for Stn. A7 (Kishi et al., 2007), except for the maximum growth rates of PS and PL. The tuning of these values was essential to reasonably simulate the seasonal cycle of nutrients and microalgae at Stn. A1, which is strongly affected by seawater and microalgae from the Sea of Okhotsk rather than from the North Pacific Ocean, which affects conditions at Stn. A7 (e.g., Kuroda et al, 2019). To determine the maximum growth rates, climatological mean forcings averaged over 2003–2018 were input to the one-dimensional NEMURO+ without inclusion of the initial biomass of the PK compartment (i.e., PK=0). We varied Vmax from 0.5 to 4 times the default values. Finally, Vmax of 2.4 d−1 for PL and 1.0 d−1 for PS were selected because those values best reproduced the seasonal changes at Stn. A1 (see Section 1.4. in the Supplementary Material for details).
The NEMURO+ was run with the 2021 forcing data at Stn. A1 (Figures 4A, C). We inserted the initial biomass of PK on day 60 because the particle-tracking simulation by Kuroda et al. (2021) had indicated that a small percentage of the algal cells in the 2021 HABs that were transported from the eastern coast of the Kamchatka Peninsula would have reached the waters off southeast Hokkaido in the beginning of March 2021 at the earliest.
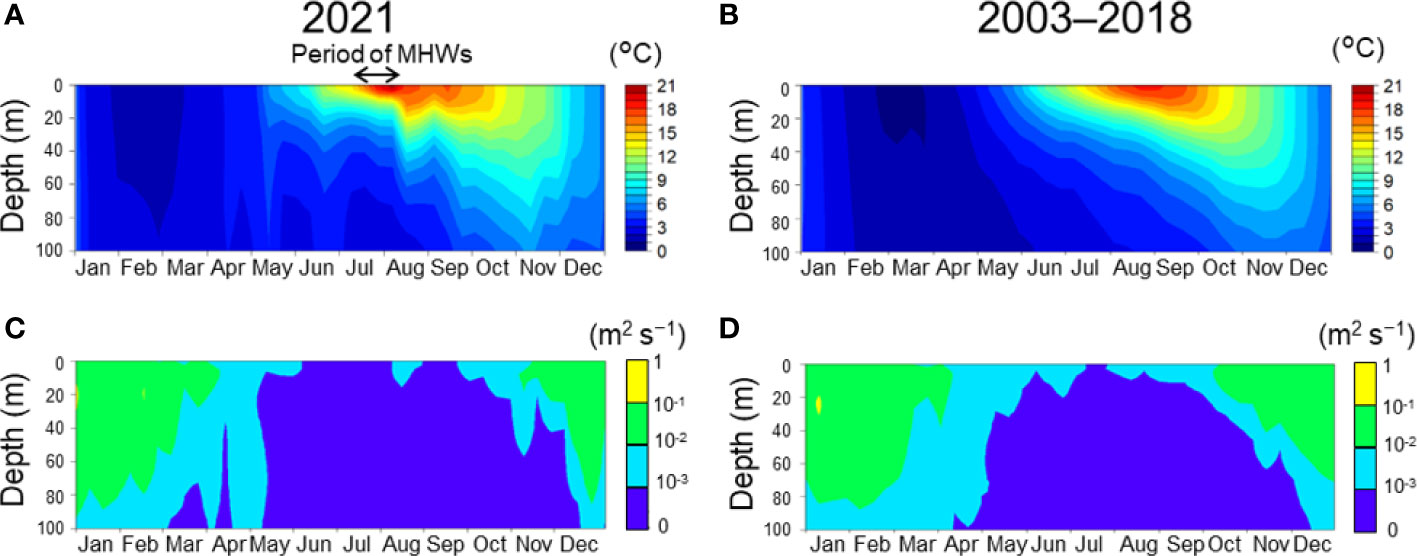
Figure 4 Seasonal changes of water temperature (A, B) and vertical diffusion coefficient (C, D) at Stn. A1. A and C indicate the daily mean in 2021. B and D indicate averaged daily means during 2003–2018. Black arrows indicate the period when the marine heatwaves occurred. Daily means were extracted from a three-dimensional realistic ocean model with a horizontal resolution of 1/50° (Kuroda et al., 2021).
Two sensitivity experiments were performed by changing the model settings. To investigate the effects of HABs on the lower trophic-level ecosystem on the shelf, we ran NEMURO+ without a PK compartment (i.e., PK≡0) with daily mean forcing during 2021 and compared results of the NEMURO+ with and without PK. To evaluate effects of the MHWs in summer 2021 on the occurrence of the HABs, the NEMURO+ with a PK compartment was run with the climatological daily mean forcing averaged over 2003–2018 at Stn. A1 (Figures 4B, D). In the second sensitivity experiment, the initial biomass of the PK was set on day 60.
Figure 5 shows seasonal changes of the PK concentration, the initial value of which was inserted on day 60 in 2021. The PK concentration immediately decreased to less than 0.1 µmol N L−1 within 15 days after the insertion. The surface concentration increased slightly in July and then fluctuated during July–August. At depths above 25 m, the PK concentration briefly increased in mid-August and then abruptly decreased. At depths less than 25 m, the PK concentration increased from September and exceeded 0.4 µmol N L−1 during late September to early November. The PK concentration then decreased to less than 0.1 µmol N L−1 at the end of November. The NEMURO+ thus reproduced the 2021 HABs reasonably well.
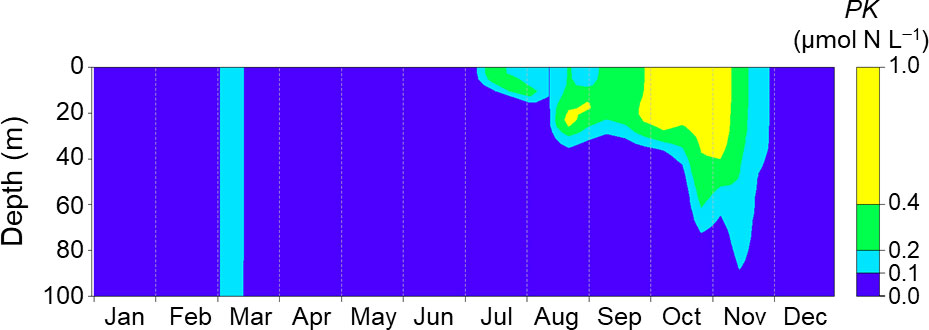
Figure 5 Seasonal changes of PK concentration simulated with the daily mean of driving forces at Stn. A1 in 2021. The biomass was initialized on day 60.
Figures 6A, C show seasonal changes in the values of the source term (GppPK) and the sum of sink terms (respiration, mortality, extracellular excretion, and grazing by ZS and ZL ) in the PK biomass equation (Eq. [1]) with the 2021 driving forces. The values in the surface layer (0–10 m) and subsurface layer (15–25 m) are shown separately because of the different manner of development of the PK concentration. In the surface layer, the source term increased from July, became erratic, and then increased dramatically from mid-September (Figure 6A). It then reached a peak at the end of October and decreased during November. In the subsurface layer, the source term increased dramatically in the middle of August, decreased until the beginning of September, and then remained relatively high until the beginning of November (Figure 6C). The sink term exceeded the source term during August–September in the surface layer and from November in both layers.
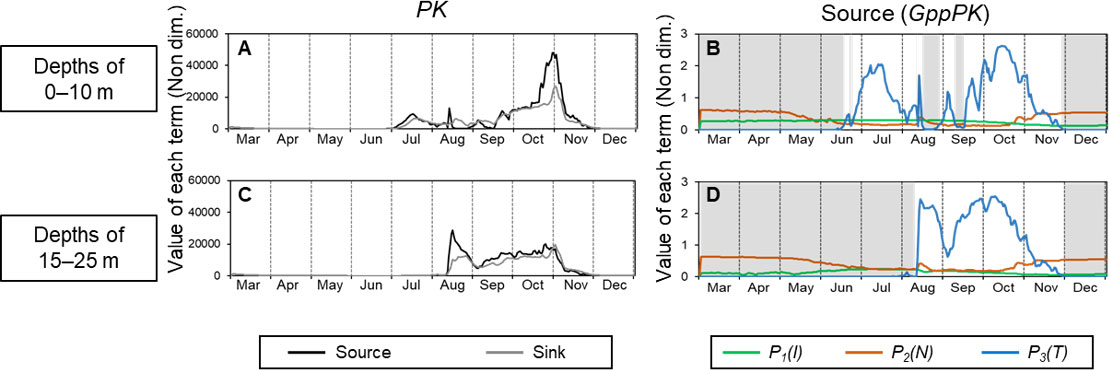
Figure 6 Seasonal changes of the values of each term in the equation for PK and GppPK at depth intervals of 1–10 m (A, B) and 15–25 m (C, D) in 2021. A and C show the source (GppPK) and sink (sum of respiration, mortality, extracellular excretion, and grazing) terms in the PK biomass equation (Eq. [1]). B and D show values of P1(I) , P2(N) , and P3(T) in GppPK (Eq. [2]). Gray shading shows the period when P3(T) was the factor limiting GppPK.
The values of each term in GppPK, which changes with light intensity (P1(I)), nitrogen concentration (P2(N)), and temperature (P3(T)) are shown in Figures 6B, D to help explain the variations of PK. Because GppPK is the product of the PK concentration and the dimensionless variables P1(I) , P2(N) , and P3(T), the smallest of the dimensionless variables is most limiting to PK production. At the surface, P3(T) was the limiting factor (<0.01) until the middle of June. It increased toward the middle of July and was erratic between late July and mid-September. It subsequently increased to a peak in the middle of October. In the subsurface layer, P3(T) was the limiting factor (<0.01) until the end of July. It increased sharply in the middle of August, remained high during the remainder of August, decreased in early September, and then increased to a peak in the middle of October. In both layers, P3(T) decreased after the middle of October, became less than 0.01 at the beginning of December, and was the most limiting factor during December. P1(I) did not largely change until December. P2(N) increased temporarily in the middle of August and then gradually increased after late October. Because production by PK increased when the restriction by P3(T) was lifted, PK production was temperature dependent. However, the patterns of the peaks differed between PK production (Figures 6A, C) and P3(T) (Figures 6B, D).
Figure 7 shows seasonal changes of PL, PS, NO3, Si(OH)4, and NH4 concentrations in 2021 simulated with and without initial insertion of PK on day 60. Both simulations showed increases of PL and PS and decreases of NO3 and Si(OH)4 in spring. In the simulation without inclusion of PK, PL and PS concentrations during September–November were higher than those in the simulation with inclusion of PK (Figures 7A–D). However, those concentrations in autumn were low compared with the concentrations in spring and the PK concentrations during autumn blooms (Figure 5). There was not a large difference in the NO3 concentration dynamics between the two simulations (Figures 7E, F). The Si(OH)4 concentration decreased in July and September–October in both simulations, but the reduction of the Si(OH)4 concentration was greater in the simulation without inclusion of PK (Figures 7G, H). The NH4 concentration decreased to <0.05 µmol N L−1 in July and September–October in the simulation with PK (Figures 7I, J).
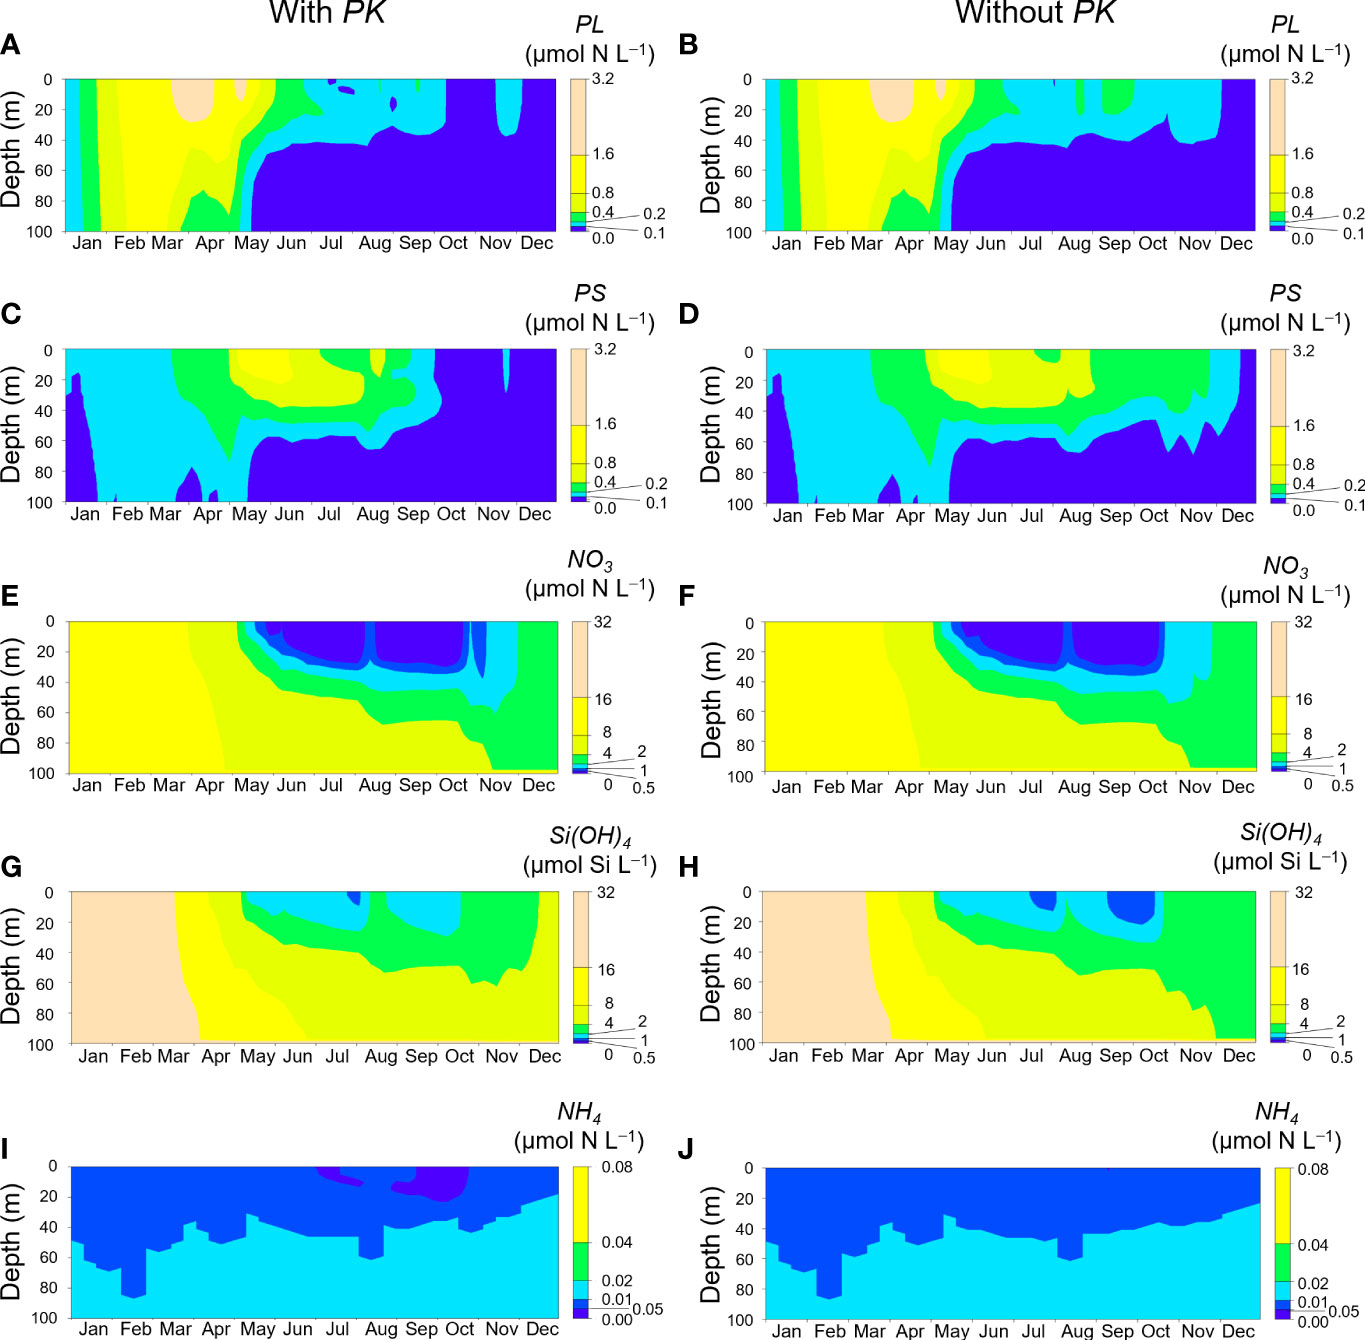
Figure 7 Seasonal changes of PL (A, B), PS (C, D), NO3 (E, F), Si(OH)4 (G, H), and NH4 (I, J) concentrations at Stn. A1 in 2021. A, C, E, G and I are simulations with initial inclusion of PK on day 60, and B, D, F, H and J are simulations without inclusion of PK.
Figure 8 shows seasonal changes of PK concentrations simulated with climatological daily mean forcing data as the normal conditions without MHWs. The PK concentration was <0.1 µmol N L−1 until the end of July and increased gradually from August. It remained >0.4 µmol N L−1 during October. These results indicated that even under normal conditions without MHWs, a bloom of K. selliformis could occur if K. selliformis was present, but the occurrence of the simulated bloom was delayed compared with 2021 (Figure 5).
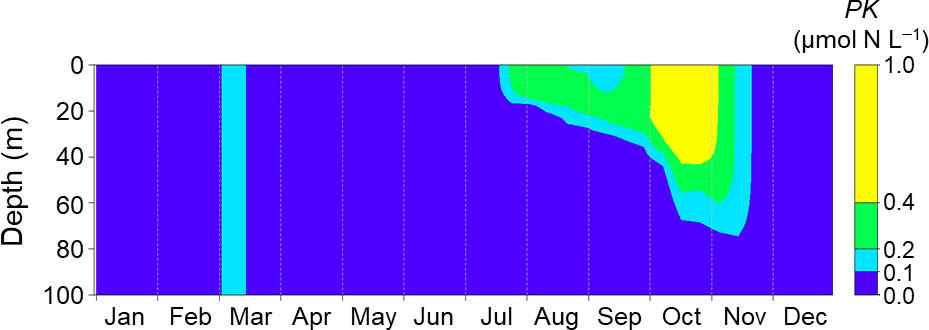
Figure 8 Seasonal changes of PK concentration simulated with the mean daily driving forces at Stn. A1 during 2003–2018. The biomass was initialized on day 60.
The inclusion of PK in the simulation along with the 2021 driving forces showed that the increase of the PK concentration to >0.4 µmol N L−1 occurred in the subsurface layer during late August (pre-bloom). The main PK outbreak then occurred at depths shallower than 25 m during late September to early November (Figure 5). The simulated result that the highest PK concentration occurred in the subsurface layer prior to the main outbreak was consistent with the chlorophyll fluorescence intensity off southeast Hokkaido at the beginning of September 2021 (Misaka and Ando, 2021) and the pattern of K. mikimotoi HABs (Aoki et al., 2017). Kuroda et al. (2022) have reported that the SCCs in the area where the 2021 HABs occurred increased greatly from mid-September, and the SCCs remained high until mid-October. The high chlorophyll a concentrations in surface water sampled in a harbor located in southeast Hokkaido during mid-September to mid-November (Hasegawa et al., under review) indicated that the inclusion of PK in the present simulation could have reproduced the transition and underlying dynamics of the development, maintenance, and decay of the 2021 HABs. The preferred temperature for K. selliformis (11°C−17°C) estimated by fitting the SCCs with fc(T) (Figure 3) was consistent with the temperature range when the chlorophyll a concentration in water samples from the harbor was high (Hasegawa et al., under review).
Grazing pressure on PK by ZL and ZS in NEMURO+ were reduced to half the pressure on PS to reflect the high rate of rejection of PK by zooplanktons. We also conducted numerical experiments without reducing the grazing pressure and could not reproduce the PK outbreak during late September to early November (our unpublished data). The reduction of grazing pressure was employed on the basis of results from previous studies. Those studies have indicated that K. selliformis is the most problematic species of several toxic dinoflagellates in the Gulf of Gabés (Feki et al., 2008; Dammak-Zouari et al., 2009). The allelopathy and toxicity of K. mikimotoi, which was also detected in the 2021 HAB, are efficient competitive strategies that prevent other algae from gaining an advantage and inhibit the ingestion of K. mikimotoi by zooplankton (Li et al., 2019). Reducing the grazing pressure on PK by a factor of 2, however, may not be the most appropriate way to represent the toxic effects of K. selliformis. It may therefore be necessary to reconsider the implications of its toxicity and reformulate those implications by using the results of experiments with representative zooplanktons grazing on K. selliformis. Such experiments are being carried out by our project team.
The simulation without inclusion of PK resulted in higher concentrations of PL and PS in September and lower Si(OH)4 concentrations in late July and during late September to mid-October compared with the concentrations when PK was included (Figures 7A–H). These results indicated that the bloom of K. selliformis indirectly suppressed the blooms of other phytoplankton. The suppression of PL resulted in less consumption of Si(OH)4. In situ measurements of silicate concentrations and diatom abundance around Stn. A1 on the shelf in October 2021 (Taniuchi et al. unpublished data) revealed patterns like our simulated results. This consistency between the simulations and observations indicated that the 2021 HABs greatly changed the structure of the marine ecosystem off southeast Hokkaido at low trophic levels.
The maximum cell density of PK simulated in the present study was 256000 cells L−1 estimated using the minimum nitrate cell quota of K. mikimotoi (3.13 pmol per cell; Yamaguchi and Itakura, 1999). It is noteworthy that this density was close to that of Karenia spp. (~277000 cells L−1) at a depth of 10-m off southeast Hokkaido estimated based on a ship survey in October 2021 (Kuroda et al., 2022). The magnitude of the simulated PK blooms was small compared with the spring bloom of PL, despite previous studies having reported that SCCs in the area where the 2021 HABs occurred exceeded 10 mg m−3 and were comparable with the chlorophyll a concentrations at Stn. A1 during April (8–15 µg L−1, see Supplementary Figure 4 for detail) (Kuroda et al., 2021; Kuroda et al., 2022). Our model thus underestimated the blooms of K. selliformis in 2021. Possible reasons for the discrepancy include uncertainties of biochemical parameters at Stn. A1 that were not adjusted in this study and biochemical processes peculiar to HABs that were not included in our model. The one-dimensional simplification may also be responsible for the underestimation. Horizontal advection as well as vertical processes associated with submesoscale variability were neglected in the one-dimensional simplification. In fact, however, the spatial distribution of K. selliformis abundance is characterized by patch- and streak-like inhomogeneous, submesoscale structures on the shelves (Kuroda et al., 2022). If such submesoscale processes contributed more to the blooms of K. selliformis in 2021 than to the spring blooms of microalgae other than K. selliformis, a one-dimensional simplification may have underestimated the blooms of K. selliformis in 2021. Future work should examine the impacts of the simplification by extending the model from one to three dimensions.
Although our simulation showed a decrease of the NH4 concentration when the PK concentration increased (Figure 7I), an increase of ammonium concentration during the 2021 HABs was reported based on monitoring of shoreline water in Kushiro (Hasegawa et al., under review). There are two possible reasons for the discrepancy between our simulation and in situ observations. One is the difference in the focal regions. Our model focused on Stn. A1, which is in coastal shelf water shallower than 100 m, whereas their monitoring was conducted in a fishing harbor at depths less than 10 m (Hasegawa et al., under review). The other possibility is the effect of factors not considered in the NEMURO+. The fact that there was a massive die-off of animals such as sea urchins and chum salmon caused by the 2021 HABs suggests that ammonification of the nitrogen in the dead animals may have been a source of ammonium. The NEMURO+ consisted of phytoplankton, zooplankton, and the nutrients silicon and nitrogen. Therefore, nutrients supplied from the massive mortality attributed to the 2021 HABs were not represented in the model. Additional investigations that include consideration of macro-organisms would be required to understand the effect of the 2021 HABs on the whole ecosystem.
The simulated results of the 2021 HABs showed that the occurrence and termination of the 2021 HABs were controlled principally by changes of water temperature. The PK concentration temporarily increased during July in the surface layer and during August in the subsurface layer. The PK outbreak then occurred between late September and early November (Figure 5). At each of these times, the value of P3(T) increased abruptly (Figures 6B, D), and the water temperature changed to the optimum temperature of approximately 14°C for PK (Figure 3). The result was elimination of any restriction of PK production by P3(T) without a decrease of P1(I) or P2(N) (Figures 6B, D). The implication is that changes of water temperature determined the onset of the increase of K. selliformis production. A similar result has been obtained in previous studies: An increase of water temperature is one of the triggers for an outbreak of K. selliformis (Clement et al., 2001; Uribe and Ruiz, 2001; Brand et al., 2012; Feki et al., 2013). We should note here that the temperature increased during the rapid, pre-bloom growth of PK in the subsurface layer in late August, but it decreased in the surface layer and increased in the subsurface layer before the main outbreak in the present study. During March−June and December, when the water temperature was less than 10°C and the PK concentration was less than 0.1 µmol N L−1 (Figure 5), P3(T) was less than 0.01 at depths shallower than 25 m and hence was the limiting factor (Figures 6B, D). In the subsurface layer, the value of P3(T) remained very small until early August, when the temperature was still less than 10°C. After mid-November, the source term (GppPK) dropped below the sum of the sink terms in the equation for PK biomass (Figures 6A, C), and the PK concentration decreased. The decrease of water temperature and P3(T) at that time indicated that the decrease of the water temperature had reduced PK production. The result was the decline of the PK concentration. A temperature greater than the lower limit of the preferable temperature range for K. selliformis therefore inhibited K. selliformis blooms.
Vertical migration plays an important role in initiating HABs of K. mikimotoi, because it allows the K. mikimotoi cells to access nutrients in subsurface water and still receive enough light (Gillibrand et al., 2016). We observed that algal cells accumulated at the surface of a fishing harbor in the daytime during the 2021 HABs. However, inclusion of phototaxis of PK in a simulation did not significantly affect PK concentrations (see Section 1.3 in the Supplementary Materials for details). This observation was consistent with the highly temperature dependence of K. selliformis production.
Some large-scale HABs following MHWs have been reported globally (e.g., Jöhnk et al., 2008; Roberts et al., 2019). Past studies have suggested that the MHWs triggered the HABs, but the mechanism has been unclear. In the case of southeast Hokkaido, record-breaking MHWs occurred at the sea surface in the northwestern Pacific Ocean in July 2021 (Kuroda and Setou, 2021). The 2021 HABs was the first case of the occurrence of a large-scale bloom of K. selliformis after MHWs. The conditions that triggered the 2021 HABs were somewhat similar to conditions at the beginning of K. selliformis blooms in Tunisia: unusually high temperatures and greatly reduced rainfall compared with normal years (reviewed by Brand et al., 2012). However, the results of the simulation under normal conditions in the present study suggested that the K. selliformis blooms could occur even in the absence of MHWs (Figure 8). In the simulation without inclusion of PK, the increased concentration of PL during September was less than 0.4 µmol N L−1 (Figure 7B), which was lower than the PK concentration that reproduced the 2021 HABs (Figure 5). The 2021 HABs could therefore have occurred only as long as a population of K. selliformis was present in the coastal waters off southeast Hokkaido before the summer. In other words, the HABs in 2021 were species-specific responses of K. selliformis.
The implications of this conclusion do not, however, mean that the MHWs contributed little to the 2021 HABs. Our numerical simulations revealed that the timing of the onset of the pre-bloom and main bloom as well as their durations were regulated by the MHWs. According to Kuroda and Setou (2021), there were MHWs between 10 July and 18 August 2021; the MHWs developed rapidly toward the end of July, reached a maximum, and subsided immediately after 10 August, synchronously with a drastic meridional shift of the westerly jet. As a result of the subsidence around mid-August, the sea surface temperature immediately decreased, whereas the subsurface temperature increased temporarily because of very intensive vertical convection and mixing (Figure 4A). This vertical convection and mixing accelerated entrainment of subsurface water into the surface layer and resulted in uplifting of nutrient-rich water into the euphotic zone. This process was reflected by the higher vertical diffusion coefficient in mid-August in 2021 than during normal years (Figures 4C, D). Our simulation for 2021 also revealed a supply of NO3 and Si(OH)4 from deep layers in mid-August, regardless of inclusion of PK (Figures 7E–H). These results indicated that the higher PK concentration during the pre-bloom in the subsurface layer compared with normal years was due to NO3 supplied via vertical diffusion associated with the subsidence of the MHWs (Figures 4C, D), as Kuroda et al. (2021) have suggested. Our simulation thus reproduced the pre-bloom primarily in the subsurface layer where the temperature was favorable, and the favorable temperature and blooms continued until the end of August when the water temperature decreased following the water column destratification. Incidentally, a similar, simulated pre-bloom in the subsurface layer did not occur under normal conditions (Figure 8).
The duration of the simulated main bloom after mid-September was also controlled by water temperatures. Water temperatures at the sea surface after the 2021 MHWs tended to be higher than in normal years and decreased slowly after September (Figures 4A, B). The slowness of the cooling process during autumn 2021 played an important role in prolonging the time during which temperatures were favorable for K. selliformis growth. The increase of P2(N) when P3(T) began to decrease in late October suggested that maintenance of the 2021 HABs was also supported by seasonal nitrogen supply from subsurface water.
There were two P3(T) peaks during July–November 2021 in our simulation (Figure 6B). However, the value of the source of PK was clearly higher during the second than the first P3(T) peak (Figure 6A). The difference implied that the production and concentration of PK during the blooms depended on the PK concentration just before the blooms. We therefore propose that K. selliformis concentrations, enhanced by the pre-bloom which was triggered by the subsidence of MHWs, would have preconditioned and accelerated the main bloom and extended its duration.
Internal transcribed spacer and large subunit sequence rDNA phylogenies have divided K. selliformis strains into two groups: group I: southeast Hokkaido, Kamchatka, and Chile (strain isolated in 1999); group II: Tunisia, New Zealand, Iran, and Chile (strain isolated in 2018) (Iwataki et al., 2022). In the case of K. mikimotoki, the temperature to which strains have adapted has varied between subspecies: 10°C–25°C for a Norwegian isolate (Tangen, 1977) and 6°C–20°C for a European isolate (Holligan, 1985). The range of estimated preferred (11°C–17°C) and optimum (approximately 14°C) temperature for the K. selliformis population in the 2021 HABs were narrower and somewhat lower than those reported for K. selliformis populations from the Gulf of Gabés (Feki-Sahnoun et al., 2017) and a strain isolated from HABs in Chile during 2018 (Mardones et al., 2020). Although Feki-Sahnoun et al. (2017) have suggested that an increase of water temperature is followed by an increase of salinity (>42.0) that cause the occurrence of K. selliformis blooms, the fact that the salinities at Stn. A1 were 32.5–34.5 throughout the year (Supplementary Figure 1) implies that the 2021 HABs were not affected by changes of salinity. The low preferred temperature and salinity of K. selliformis in the present study compared with those previously reported for K. selliformis suggested that there is regional variability between populations of K. selliformis. Inter-regional, comparative studies of K. selliformis blooms are needed to understand the mechanisms that lead to regional adaptation.
The 2021 HABs were extensive and covered an area along >300 km of coastline. This area included some very nearshore areas, where river discharges caused an influx of nutrients and very low-salinity waters. Analyses of SCCs have suggested that very low-salinity waters from rivers (typically, <32.0) would link to high SCCs in very nearshore areas, whereas high-salinity (>33.6), subtropical waters would suppress the occurrence of HABs (Kuroda et al., 2021; Kuroda et al., 2022). Thorough understanding of the HAB phenomena would require that the spatial differences of salinity be simulated by a three-dimensional model.
To investigate the mechanisms responsible for the development, maintenance, and decay of the 2021 HABs, we developed NEMURO+, a modified version of NEMURO, that included a new compartment (PK) that simulated the characteristics of K. selliformis. The following results were obtained with the simulations:
• The development, maintenance, and decay of the 2021 HABs occurred primarily in response to changes of water temperature
• Nitrate supplied by seasonal, vertical diffusion in autumn helped to maintain the 2021 HABs
• The 2021 HABs could have occurred even if there had been no MHWs
• The subsidence of the 2021 MHWs led to an influx of nitrate in mid-August and prolonged the time when the temperatures in autumn were within the range that accelerated the 2021 HABs of K. selliformis
• The preferred temperature and salinity of K. selliformis in the present study were low compared with those previously reported for K. selliformis in other regions
The present study for the first time explained how MHWs affect HABs. The results revealed that the mechanisms responsible for the 2021 HABs differed from the mechanisms associated with K. selliformis blooms reported in other regions. These discoveries should lead to better understanding of how the regional peculiarities of K. selliformis can lead to large-scale, devastating outbreaks under different environmental conditions.
The raw data supporting the conclusions of this article will be made available by the authors, without undue reservation.
ST, HK and TA conducted investigation and validation. HK and TA conceptualized and provided methodology. NH and TW supported ST to visualize data. ST summarized the ideas and prepared original draft through discussions with co-authors. HK, NH, TW, TU, YT, TY, DI, TN, TK, and TA checked and modified the manuscript. All authors contributed to the article and approved the submitted version.
This study was supported by funds provided by the Japan Fisheries Research and Education Agency.
We sincerely thank Mr. H Kasai, Dr. T Nakanowatari and Dr. HW Chou of Kushiro Field Station for valuable discussion on reproductivity of model simulation. We also thank Dr. K Yuasa of Hatsukaichi Field Station and Dr. T Shikata of Goto Field Station, Japan Fisheries Research and Education Agency for helpful information of biological features of Karenia sp.
The authors declare that the research was conducted in the absence of any commercial or financial relationships that could be construed as a potential conflict of interest.
All claims expressed in this article are solely those of the authors and do not necessarily represent those of their affiliated organizations, or those of the publisher, the editors and the reviewers. Any product that may be evaluated in this article, or claim that may be made by its manufacturer, is not guaranteed or endorsed by the publisher.
The Supplementary Material for this article can be found online at: https://www.frontiersin.org/articles/10.3389/fmars.2022.939393/full#supplementary-material
Anderson C. R., Moore S. K., Tomlinson M. C., Silke J., Cusack C. K. (2015). “Chapter 17 – living with harmful algal blooms in a changing world: strategies for modeling and mitigating their effects in coastal marine ecosystems,” in Coastal and marine hazards, risks, and disasters. eds. Shroder J. F., Ellis J. T., Sherman D. J. (Amsterdam: Elsevier), 495–561. doi: 10.1016/B978-0-12-396483-0.00017-0
Aoki K., Kameda T., Yamatogi T., Ishida N., Hirae S., Kawaguchi M., et al. (2017). Spatio-temporal variations in bloom of the red-tide dinoflagellate karenia mikimotoi in imari bay, Japan, in 2014: factors controlling horizontal and vertical distribution. Mar. pollut. Bull. 124, 130–138. doi: 10.1016/j.marpolbul.2017.07.019
Berdalet E., Fleming L. E., Gowen R., Davidson K., Hess P., Backer L. C., et al. (2015). Marine harmful algal blooms, human health and wellbeing: Challenges and opportunities in the 21st century. J. Mar. Biol. Assoc. UK 96, 61–91. doi: 10.1017/S0025315415001733
Bondur V. G., Zamshin V. V., Chvertkova O. I. (2021). Space study of a red tide-related environmental disaster near kamchatka peninsula in September–October 2020. Dokl. Earth Sci. 497, 255–260. doi: 10.1134/S1028334X21030016
Brand L. E., Campbell L., Eileen Bresnan E. (2012). Karenia: the biology and ecology of a toxic genus. Harmful Algae 14, 156–178. doi: 10.1016/j.hal.2011.10.020
Brown A. R., Lilley M., Shutler J., Lowe C., Artioli Y., Torres R., et al. (2020). Assessing risks and mitigating impacts of harmful algal blooms on mariculture and marine fisheries. Rev. Aquac. 12, 1663–1688. doi: 10.1111/raq.12403
Clement A., Miriam S., Arzul G., Guzman L., Alarcon C. (2001). “Widespread outbreak of a haemolytic, ichthyotoxic gymnodinium sp. in southern chile”, in Harmful algal blooms 2000. Eds. Hallegraeff G. M., Blackburn S. I., Bolch C. J., Lewis R. J. (Paris: IOC of UNESCO), 66–69.
Dammak-Zouari H., Hamza A., Bouain A. (2009). Gymnodiniales in the gulf of gabes (Tunisia). Cah. Biol. Mar. 50, 153–170. doi: 10.21411/CBM.A.3F122090
Errera R. M., Campbell L. (2011). Osmotic stress triggers toxinproduction by the dinoflagellate karenia brevis. Proc. Natl. Acad. Sci. U.S.A. 108, 10597–10601. doi: 10.1073/pnas.1104247108
Feki W., Hamza A., Bel Hassen M., Rebai A. (2008). Les Efflorescences phytoplanctoniques dans le golfe de gabès (Tunisie) au cours de dix ans de surveillance, (1995-2005). Bull. Inst. Natl. Scien. Tech. Mer. Salammbô 35, 105–116. Available at: http://hdl.handle.net/1834/3702
Feki W., Hamza A., Frossard V., Abdennadher M., Hannachi I., Jacquot M., et al. (2013). What are the potential drivers of blooms of the toxic dinoflagellate karenia selliformis? a 10-year study in the gulf of gabes, Tunisia, southwestern Mediterranean Sea. Harmful Algae 23, 8–18. doi: 10.1016/j.hal.2012.12.001
Feki-Sahnoun W., Hamza A., Mahfoudi M., Rebai A., Bel Hassen M. (2014). Long-term microphytoplankton variability patterns using multivariate analyses: ecological and management implications. Environ. Sci. pollut. Res. 21, 11481–11499. doi: 10.1007/s11356-014-3009-2
Feki-Sahnoun W., Hamza A., Njah H., Barraj N., Mahfoudi M., Rebai A., et al. (2017). Bayesian Network approach to determine environmental factors controlling karenia selliformis occurrences and blooms in the gulf of gabès, Tunisia. Harmful Algae 63, 119–132. doi: 10.1016/j.hal.2017.01.013
Feki-Sahnoun W., Njah H., Hamza A., Barraj N., Mahfoudi M., Rebai A., et al. (2020). Using a naive bayes classifier to explore the factors driving the harmful dinoflagellate karenia selliformis blooms in a southeastern Mediterranean lagoon. Ocean Dynamics 70, 897–911. doi: 10.1007/s10236-020-01365-5
Feki-Sahnoun W., Njah H., Hamza A., Barraj N., Mahfoudi M., Rebai A., et al. (2018). Using general linear model, Bayesian networks and naive bayes classifier for prediction of karenia selliformis occurrences and blooms. Ecol. Inform. 43, 12–23. doi: 10.1016/j.ecoinf.2017.10.017
Fu F. X., Tatters A. O., Hutchins D. A. (2012). Global change and the future of harmful algal blooms in the ocean. Mar. Ecol. Prog. Ser. 470, 207–233. doi: 10.3354/meps10047
Gillibrand P. A., Siemering B., Miller P. I., Davidson K. (2016). Individual-based modelling of the development and transport of a karenia mikimotoi bloom on the north-west European continental shelf. Harmful Algae 53, 118–134. doi: 10.1016/j.hal.2015.11.011
Heil C. A., Glibert P. M., Al-Sarawi M. A., Faraj M., Behbehani M., Husain M. (2001). First record of a fish-killing gymnodinium sp. bloom in Kuwait bay, Arabian Sea: chronology and potential causes. Mar. Ecol. Prog. Ser. 214, 15–23. doi: 10.3354/meps214015
Hobday A. J. (2016). “Marine dinoflagellate blooms growth strategies and environmental exploitation,” Toxic dinoflagellates: proceedings of the Third International Conference on Toxic Dinoflagellates. eds. Anderson D. M., White A. W., Baden D. G. (New York: Elsevier), 133–139.
Holligan P. M. (1985). “"Marine dinoflagellate blooms growth strategies and environmental exploitation,” in Toxic dinoflagellates: proceedings of the Third International Conference on Toxic Dinoflagellates. eds. Anderson D. M., White A. W., Baden D. G.. (New York: Elsevier) 133–139.
Iwataki M., Lum W. M., Kuwata K., Takahashi K., Arima D., Kuribayashi T., et al. (2022). Morphological variation and phylogeny of karenia selliformis (Gymnodiniales, dinophyceae) in an intensive cold-water algal bloom in eastern Hokkaido, Japan. Harmful Algae 114, 102204. doi: 10.1016/j.hal.2022.102204
Jöhnk K. D., Huisman J., Sharples J., Sommeijer B., Visser P. M., Stroom J. M. (2008). Summer heatwaves promote blooms of harmful cyanobacteria. Global Change Biol. 14, 495–512. doi: 10.1111/j.1365-2486.2007.01510.x
Kamezawa Y., Azumaya T., Nagasawa T., Kishi M. (2009). A fish bioenergetics model of Japanese chum salmon (Oncorhynchus keta) for studying the influence of environmental factor changes. Bull. Jpn. Soc Fish. Oceanogr. 7, 87–95.
Kishi M. J., Kashiwai M., Ware D. M., Megrey B. A., Eslinger D. L., Werner F. E., et al. (2007). NEMURO–a lower trophic level model for the north pacific marine ecosystem. Ecol. Modell. 202, 12–25. doi: 10.1016/j.ecolmodel.2006.08.021
Kishi M. J., Motono H., Kashiwai M., Tsuda A. (2001). An ecological-physical coupled model with ontogenetic vertical migration of zooplankton in the northwestern pacific. J. Oceanogr. 57, 499–507. doi: 10.1023/A:1021517129545
Kuroda H., Azumaya T., Setou T., Hasegawa N. (2021). Unprecedented outbreak of harmful algae in pacific coastal waters off southeast Hokkaido, Japan, during late summer 2021 after record-breaking marine heatwaves. J. Mar. Sci. Eng. 9, 1335. doi: 10.3390/jmse9121335
Kuroda H., Setou T. (2021). Extensive marine heatwaves at the sea surface in the northwestern pacific ocean in summer 2021. Remote Sens. 13, 3989. doi: 10.3390/rs13193989
Kuroda H., Taniuchi Y., Watanabe T., Azumaya T., Hasegawa N. (2022). Distribution of harmful algae (Karenia spp.) in October 2021 off southeast Hokkaido, Japan. Fron. Mar. Sci. 9. doi: 10.3389/fmars.2022.841364
Kuroda H., Toya Y., Watanabe T., Nishioka J., Hasegawa D., Taniuchi Y., et al. (2019). Influence of coastal oyashio water on massive spring diatom blooms in the oyashio area of the north pacific ocean. Prog. Oceanogr. 175, 328–344. doi: 10.1016/j.pocean.2019.05.004
Kuroda H., Wagawa T., Kakehi S., Shimizu Y., Kusaka A., Okunishi T., et al. (2017). Long-term mean and seasonal variation of altimetry-derived oyashio transport across the a-line off the southeastern coast of Hokkaido, Japan. Deep-Sea Res. Part I 121, 95–109. doi: 10.1016/j.dsr.2016.12.006
León-Muñoz J., Urbina M. A., Garreaud R., Iriarte J. L. (2018). Hydroclimatic conditions trigger record harmful algal bloom in western Patagonia (summer 2016). Sci. Rep. 8, 1330. doi: 10.1038/s41598-018-19461-4
Li J., Glibert P. M., Zhou M. (2010). Temporal and spatial variability in nitrogen uptake kinetics during harmful dinoflagellate blooms in the East China Sea. Harmful Algae 9, 531–539. doi: 1016/j.hal.2010.03.007
Li X., Yan T., Yu R., Zhou M. (2019). A review of karenia mikimotoi: Bloom events, physiology, toxicity and toxic mechanism. Hamful Algae 90, 101702. doi: 10.1016/j.hal.2019.101702
Lim Y. K., Park B. S., Kim J. H., Baek S. S., Baek S. H. (2021). Effect of marine heatwaves on bloom formation of the harmful dinoflagellate cochlodinium polykrikoides: Two sides of the same coin? Harmful Algae 104, 102029. doi: 10.1016/j.hal.2021.102029
MacKenzie L., Haywood A., Adamson J., Truman P., Till D., Satake M., et al. (1996). ““Gymnodimine contamination of shellfish in new zealand”,” in Harmful and toxic algal blooms. Eds. Yasumoto T., Oshima Y., Fukuyo Y. (Sendai: Intergovernmental Oceanographic Commission of UNESCO), 97–100.
Magaña H. A., Villareal T. A. (2006). The effect of environmental factors on the growth rate of karenia brevis (Davis) g. Hansen and moestrup. Harmful Algae 5, 192–198. doi: 10.1016/j.hal.2005.07.003
Mardones J. I., Norambuena L., Paredes J., Fuenzalida G., Dorantes-Aranda J. J., Chang K. J. L., et al. (2020). Unraveling the karenia selliformis complex with the description of a non-gymnodimine producing Patagonian phylotype. Harmful Algae 98, 101892. doi: 10.1016/j.hal.2020.101892
Medhioub A., Medhioub W., Amzil Z., Sibat M., Bardouil M., Ben Neila I., et al. (2009). Influence of environmental parameters on karenia selliformis toxin content in culture. Cah. Biol. Mar. 50, 333–342. doi: 10.21411/CBM.A.9CCEA9A1
Misaka T., Ando Y. (2021). Hokkaido taiheiyo engan de hassei shita daikibo akashiwo ni tsuite (Huge red tide occurred in Pacific coast of Hokkaido). Shikenkenkyu Ha Ima, 943 (in Japanese).
Morris J. G. Jr. (1999). Harmful algal blooms: An emerging public health problem with possible links to human stress on the environment. Annu. Rev. Environ. Resour. 24, 367–390.
Phlips E. J., Badylak S., Nelson N. G., Havens K. E. (2020). Hurricanes, El niño and harmful algal blooms in two sub-tropical Florida estuaries: Direct and indirect impacts. Sci. Rep. 10, 1910. doi: 10.1038/s41598-020-58771-4
Reed R. K. (1977). On estimating isolation over the ocean. J. Phys. Oceanogr. 7, 482–485. doi: 10.1175/1520-0485(1977)007<0482:OEIOTO>2.0.CO;2
Roberts S. D., Van Ruth P. D., Wilkinson C., Bastianello S. S., Bansemer M. S. (2019). Marine heatwave, harmful algae blooms and an extensive fish kill event during 2013 in south Australia. Front. Mar. Sci. 6. doi: 10.3389/fmars.2019.00610
Sakamoto S., Lim W. A., Lu D., Daic X., Orlova T., Iwataki M. (2021). Harmful algal blooms and associated fisheries damage in East Asia: Current status and trends in China, Japan, Korea and Russia. Harmful Algae 102, 101787. doi: 10.1016/j.hal.2020.101787
Schultz M., Kiørboe T. (2009). Active prey selection in two pelagic copepods feeding on potentially toxic and non-toxic dinoflagellates. J. Plankton Res. 31, 553–561. doi: 10.1093/plankt/fbp010
Tangen K. (1977). Blooms of gyrodinium aureolum (Dinophygeae) in north European waters, accompanied by mortality in marine organisms. Sarsia 63, 123133. doi: 10.1080/00364827.1977.10411330
Thornton K. W., Lessem A. S. (1978). A temperature algorithm for modifying biological rates. Trans. Amer. Fish. Soc 107, 284–287. doi: 10.1577/1548-8659(1978)107<284:ATAFMB>2.0.CO;2
Trainer V. L., Moore S. K., Hallegraeff G., Kudela R. M., Clement A., Mardones J. I., et al. (2020). Pelagic harmful algal blooms and climate change: Lessons from nature’s experiments with extremes. Harmful Algae 91, 101591. doi: 10.1016/j.hal.2019.03.009
Uribe J. C., Ruiz M. (2001). Gymnodinium brown tide in the magellanic fjords, southern Chile. Rev. Biol. Mar. Oceanogr. 36, 155–164. doi: 10.4067/S0718-19572001000200004
Wroblewski J. S. (1977). A model of phytoplankton plume formation during Oregon upwelling. J. Mar. Res. 35, 357–394.
Xu J. Y., Kiørboe T. (2018). Toxic dinoflagellates produce true grazer deterrents. Ecology 99, 2240–2249. doi: 10.1002/ecy.2479
Yamaguchi M., Itakura S. (1999). Nutrition and growth kinetics in nitrogen- or phosphorus-limited cultures of the noxious red tide dinoflagellate gymnodinium mikimoti. Fish. Sci. 65, 367–373. doi: 10.2331/fishsci.65.367
Keywords: harmful algal blooms, one dimensional ecosystem model, NEMURO, Karenia selliformis, marine heatwave, northwestern Pacific Ocean
Citation: Takagi S, Kuroda H, Hasegawa N, Watanabe T, Unuma T, Taniuchi Y, Yokota T, Izumida D, Nakagawa T, Kurokawa T and Azumaya T (2022) Controlling factors of large-scale harmful algal blooms with Karenia selliformis after record-breaking marine heatwaves. Front. Mar. Sci. 9:939393. doi: 10.3389/fmars.2022.939393
Received: 09 May 2022; Accepted: 27 June 2022;
Published: 29 July 2022.
Edited by:
Michelle Jillian Devlin, Centre for Environment, Fisheries and Aquaculture Science (CEFAS), United KingdomReviewed by:
Liam Fernand, Centre for Environment, Fisheries and Aquaculture Science (CEFAS), United KingdomCopyright © 2022 Takagi, Kuroda, Hasegawa, Watanabe, Unuma, Taniuchi, Yokota, Izumida, Nakagawa, Kurokawa and Azumaya. This is an open-access article distributed under the terms of the Creative Commons Attribution License (CC BY). The use, distribution or reproduction in other forums is permitted, provided the original author(s) and the copyright owner(s) are credited and that the original publication in this journal is cited, in accordance with accepted academic practice. No use, distribution or reproduction is permitted which does not comply with these terms.
*Correspondence: Satomi Takagi, takagi_satomi02@fra.go.jp; satomit@affrc.go.jp
†Present addresses: Takashi Yokota, Nagasaki Field Station, Fisheries Technology Institute, Japan Fisheries Research and Education Agency, Nagasaki, Japan
Daisuke Izumida, Kamiura Field Station, Fisheries Technology Institute, Japan Fisheries Research and Education Agency, Saiki, Japan
Disclaimer: All claims expressed in this article are solely those of the authors and do not necessarily represent those of their affiliated organizations, or those of the publisher, the editors and the reviewers. Any product that may be evaluated in this article or claim that may be made by its manufacturer is not guaranteed or endorsed by the publisher.
Research integrity at Frontiers
Learn more about the work of our research integrity team to safeguard the quality of each article we publish.