 Astrid Spielmeyer
 Christopher R. Loeffler
 Oliver Kappenstein
95% of researchers rate our articles as excellent or good
Learn more about the work of our research integrity team to safeguard the quality of each article we publish.
Find out more
ORIGINAL RESEARCH article
Front. Mar. Sci. , 28 July 2022
Sec. Marine Biogeochemistry
Volume 9 - 2022 | https://doi.org/10.3389/fmars.2022.937438
This article is part of the Research Topic Marine Microalgae and Biotoxins View all 5 articles
Ciguatoxins (CTXs) are a group of marine biotoxins, consisting of over 30 different congeners that can contaminate marine food webs. Generally, the molecular structures among the known congeners are variable by geographical region (i.e., ocean basin) and vector species. Limited information is available regarding the CTX profiles among or within CTX vector species and their capture regions. Within this study, an in-depth investigation based on a semi-targeted LC-MS/MS approach was conducted to investigate 52 tissue samples from a single species Lutjanus bohar (Lutjanidae), a common CTX vector, sourced from two distinct regions (Indian Ocean and Pacific Ocean). All samples revealed the presence of a complex CTX contaminant profile, with samples containing several congeners of the CTX3C-group (2,3,51-trihydroxyCTX3C, 2,3,-dihydroxyCTX3C, 2-hydroxyCTX3C, M-seco-CTX3C, 51-hydroxyCTX3C, CTX3C, and respective 49-epimers in most cases). All samples were previously found to possess a CTX-like toxicity within an in vitro cytotoxicity assay (N2a-bioassay), demonstrating the relevance of CTX3C-group congeners with regard to ciguatera poisoning. Individual samples contained an indistinguishable toxin profile within the species and among the distinct oceanic capture regions. These findings imply either a species-specific CTX metabolism or the emergence of an interoceanic CTX toxin profile. The inter-regional CTX profile demonstrated here provides further evidence that classifying CTX congeners based on ocean basins may be imprecise.
Ciguatoxins (CTXs) are potent, lipophilic marine biotoxins that can result in an intoxication in humans called ciguatera poisoning (CP). Early studies considered CP to be the result of a bioaccumulative process within the marine food web (Randall, 1958). This was later described through the analysis of samples representing various levels of the marine food web in the CP endemic region of French Polynesia (Yasumoto et al., 1977a). Therein, a CTXs source organism was identified as a dinoflagellate (Yasumoto et al., 1977b). Subsequent investigations into CP endemic regions in search of regional source CTX-producing organisms has resulted in the identification of several species of the genus Gambierdiscus and Fukuyoa which have been demonstrated to produce CTX. Species in these two genera are distributed globally and are mainly found in shallow tropical and subtropical marine waters (overview provided by e.g., [Tester et al. (2018); Chinain et al. (2020)].
Commonly, CTXs are categorized into three different geographic groups, namely CTXs from the Pacific Ocean (P-CTX), the Caribbean Sea (C-CTX) and Indian Ocean (I-CTX). P-CTXs have been sub-divided into two additional groups, CTX3C- and CTX4A-group, based on the algal precursors leading to the congeners of the respective groups. Intense research on compound isolation and structural elucidation was conducted for cultures of Gambierdiscus spp. and fish tissue samples from the Pacific Ocean (Murata et al., 1990; Satake et al., 1993; Satake et al., 1998; Yasumoto et al., 2000). Consequently, the CTX congeners with the most accurate description are the CTX3C- and CTX4A-groups. For the C-CTX-group, four distinct structures are described, however, additional congeners are presumed based on bioassay guided fractionation and LC-MS/MS analyses (Lewis et al., 1998; Pottier et al., 2002; Estevez et al., 2019; Kryuchkov et al., 2020). I-CTXs are the group with the least accurate description and to-date, their full structure elucidation has not been accomplished. Six potential I-CTX congeners were identified in shark tissue from Madagascar and the molecular formulas were obtained by liquid chromatography coupled to high-resolution mass spectrometry (Diogène et al., 2017). The structure of I-CTXs is purportedly similar to Caribbean CTXs as the congeners C-CTX-1 and I-CTX-1 share the same molecular formula and were found to possess similar retention times (Hamilton et al., 2002; Diogène et al., 2017). The algal sources for either C-CTXs or I-CTXs have not been resolved.
Accumulation of CTXs in animals is accompanied by biotransformation (mainly oxidation). This biologically diverse process is believed to be the source for the broad spectrum of CTX congeners observed. Currently, more than 30 different congeners have been identified (epimers are considered as individual compounds) (FAO and WHO, 2020). In vitro studies using S9 liver extracts of different fish species suggest a species-specific metabolism of CTXs (Ikehara et al., 2017), a potential pathway for species specific CTX profiles in fish tissue samples. The elucidation of either species’ or regions’ specific CTX profiles requires multiple replicates from a single species, within or among regions, or CTX vectors that represent various trophic levels. Studies providing this level of information are available primarily for congeners of the CTX4A-group, few studies report about congeners of the CTX3C-group (Mak et al., 2013; Wong et al., 2014; Yogi et al., 2014; Oshiro et al., 2021a; Oshiro et al., 2021b; Oshiro et al., 2022). CTX4A-group congeners have a higher representation in published literature, potentially as a complete description is available for this group, facilitating the analytical identification. From an ecological point-of-view, it remains unclear whether the common identification of CTX4A-group congeners at selected study sites is because of the dominance of these congeners within the dinoflagellate community, the dominance of these congeners at the respective study sites or different bioaccumulation patterns of the CTX4A- and CTX3C-group congeners. This paucity of data hampers the evaluation of CTX dynamics within the marine food web.
In the context of two ciguatera outbreaks in Europe (details provided in [Loeffler et al. (2022) and Loeffler et al. (2022, preprint)], 52 samples of Lutjanus bohar (Perciformes: Lutjanidae) were obtained in commercial packaging as frozen fillets or steaks. Sample extracts were analyzed by a neuroblastoma in vitro cell bioassay (N2a-bioassay) and LC-MS/MS. One sample set originated from the Indian Ocean. Knowledge about the occurrence of CTX producers and vectors is sparse in this region, as also emphasized by Habibi et al. (2021). Studies are further hampered by the limited knowledge about CTX congeners in the Indian Ocean. Instead of focusing on congeners of the I-CTX-group only, a semi-targeted approach was utilized within this study. By including all known CTX congeners into the LC-MS/MS method, several congeners of the CTX3C-group were identified in commercial fish product declared and verified as captured off the southwest coast of India. The profile determined in these samples was indistinguishable from the CTX profile obtained for the Pacific Ocean samples. This is the first detailed report of CTX profiles in L. bohar from the Pacific and Indian Ocean consisting of congeners of the CTX3C-group.
Chemicals and solvents were purchased from various suppliers [details provided in Spielmeyer et al. (2021)]. CTX3C (100 ng, lot APK4222 and TWJ6482) was obtained from FUJIFILM Wako Chemicals Europe GmbH (Neuss, Germany) and reconstituted in 1 mL methanol (0.1 mg L-1). Standards of CTX1B (4 mg L-1), 52-epi-54-deoxyCTX1B (P-CTX-2, 1 mg L-1), and 54-deoxyCTX1B (P-CTX-3, 2 mg L-1; all solutions in methanol) were purchased from Professor R. J. Lewis (The Queensland University, Australia, prepared 17th November 2005). Mixed standard solutions were prepared in methanol. Both stock and mixed standard solutions were stored in glass vials at -20°C.
Fish samples investigated in this study were obtained in the context of two ciguatera outbreaks occurring in the European Union in 2017 and 2020. Samples did not include meal remnants, but were part of the same lots being mentioned in the respective Rapid Alert System for Food and Feed (RASFF) reports (2017.0345 and 2020.2254). Samples were obtained from retail (samples from India) or from two restaurants that initially bought the product from a wholesaler (samples from Vietnam). Further details about the outbreaks and trace-back are provided in Loeffler et al. (2022) and Loeffler et al. (2022, preprint). In both cases, fish species were identified as L. bohar by DNA barcoding (Loeffler et al., 2022; Loeffler et al. 2022, preprint). Sample bags (800 g net weight per bag) consisted of fish fillets (Vietnam origin) or fish steaks (India origin) with skin. The skin and bones were removed before extraction. In total, 52 tissue samples were investigated. Of these, 45 samples derived from FAO region of capture 71 (Western Pacific) (samples 1 to 45, outbreak from 2017) and seven from FAO 51 (Western Indian Ocean) (samples 46 to 52, outbreak from 2020). A map showing the samples’ origin is provided in Figure 1.
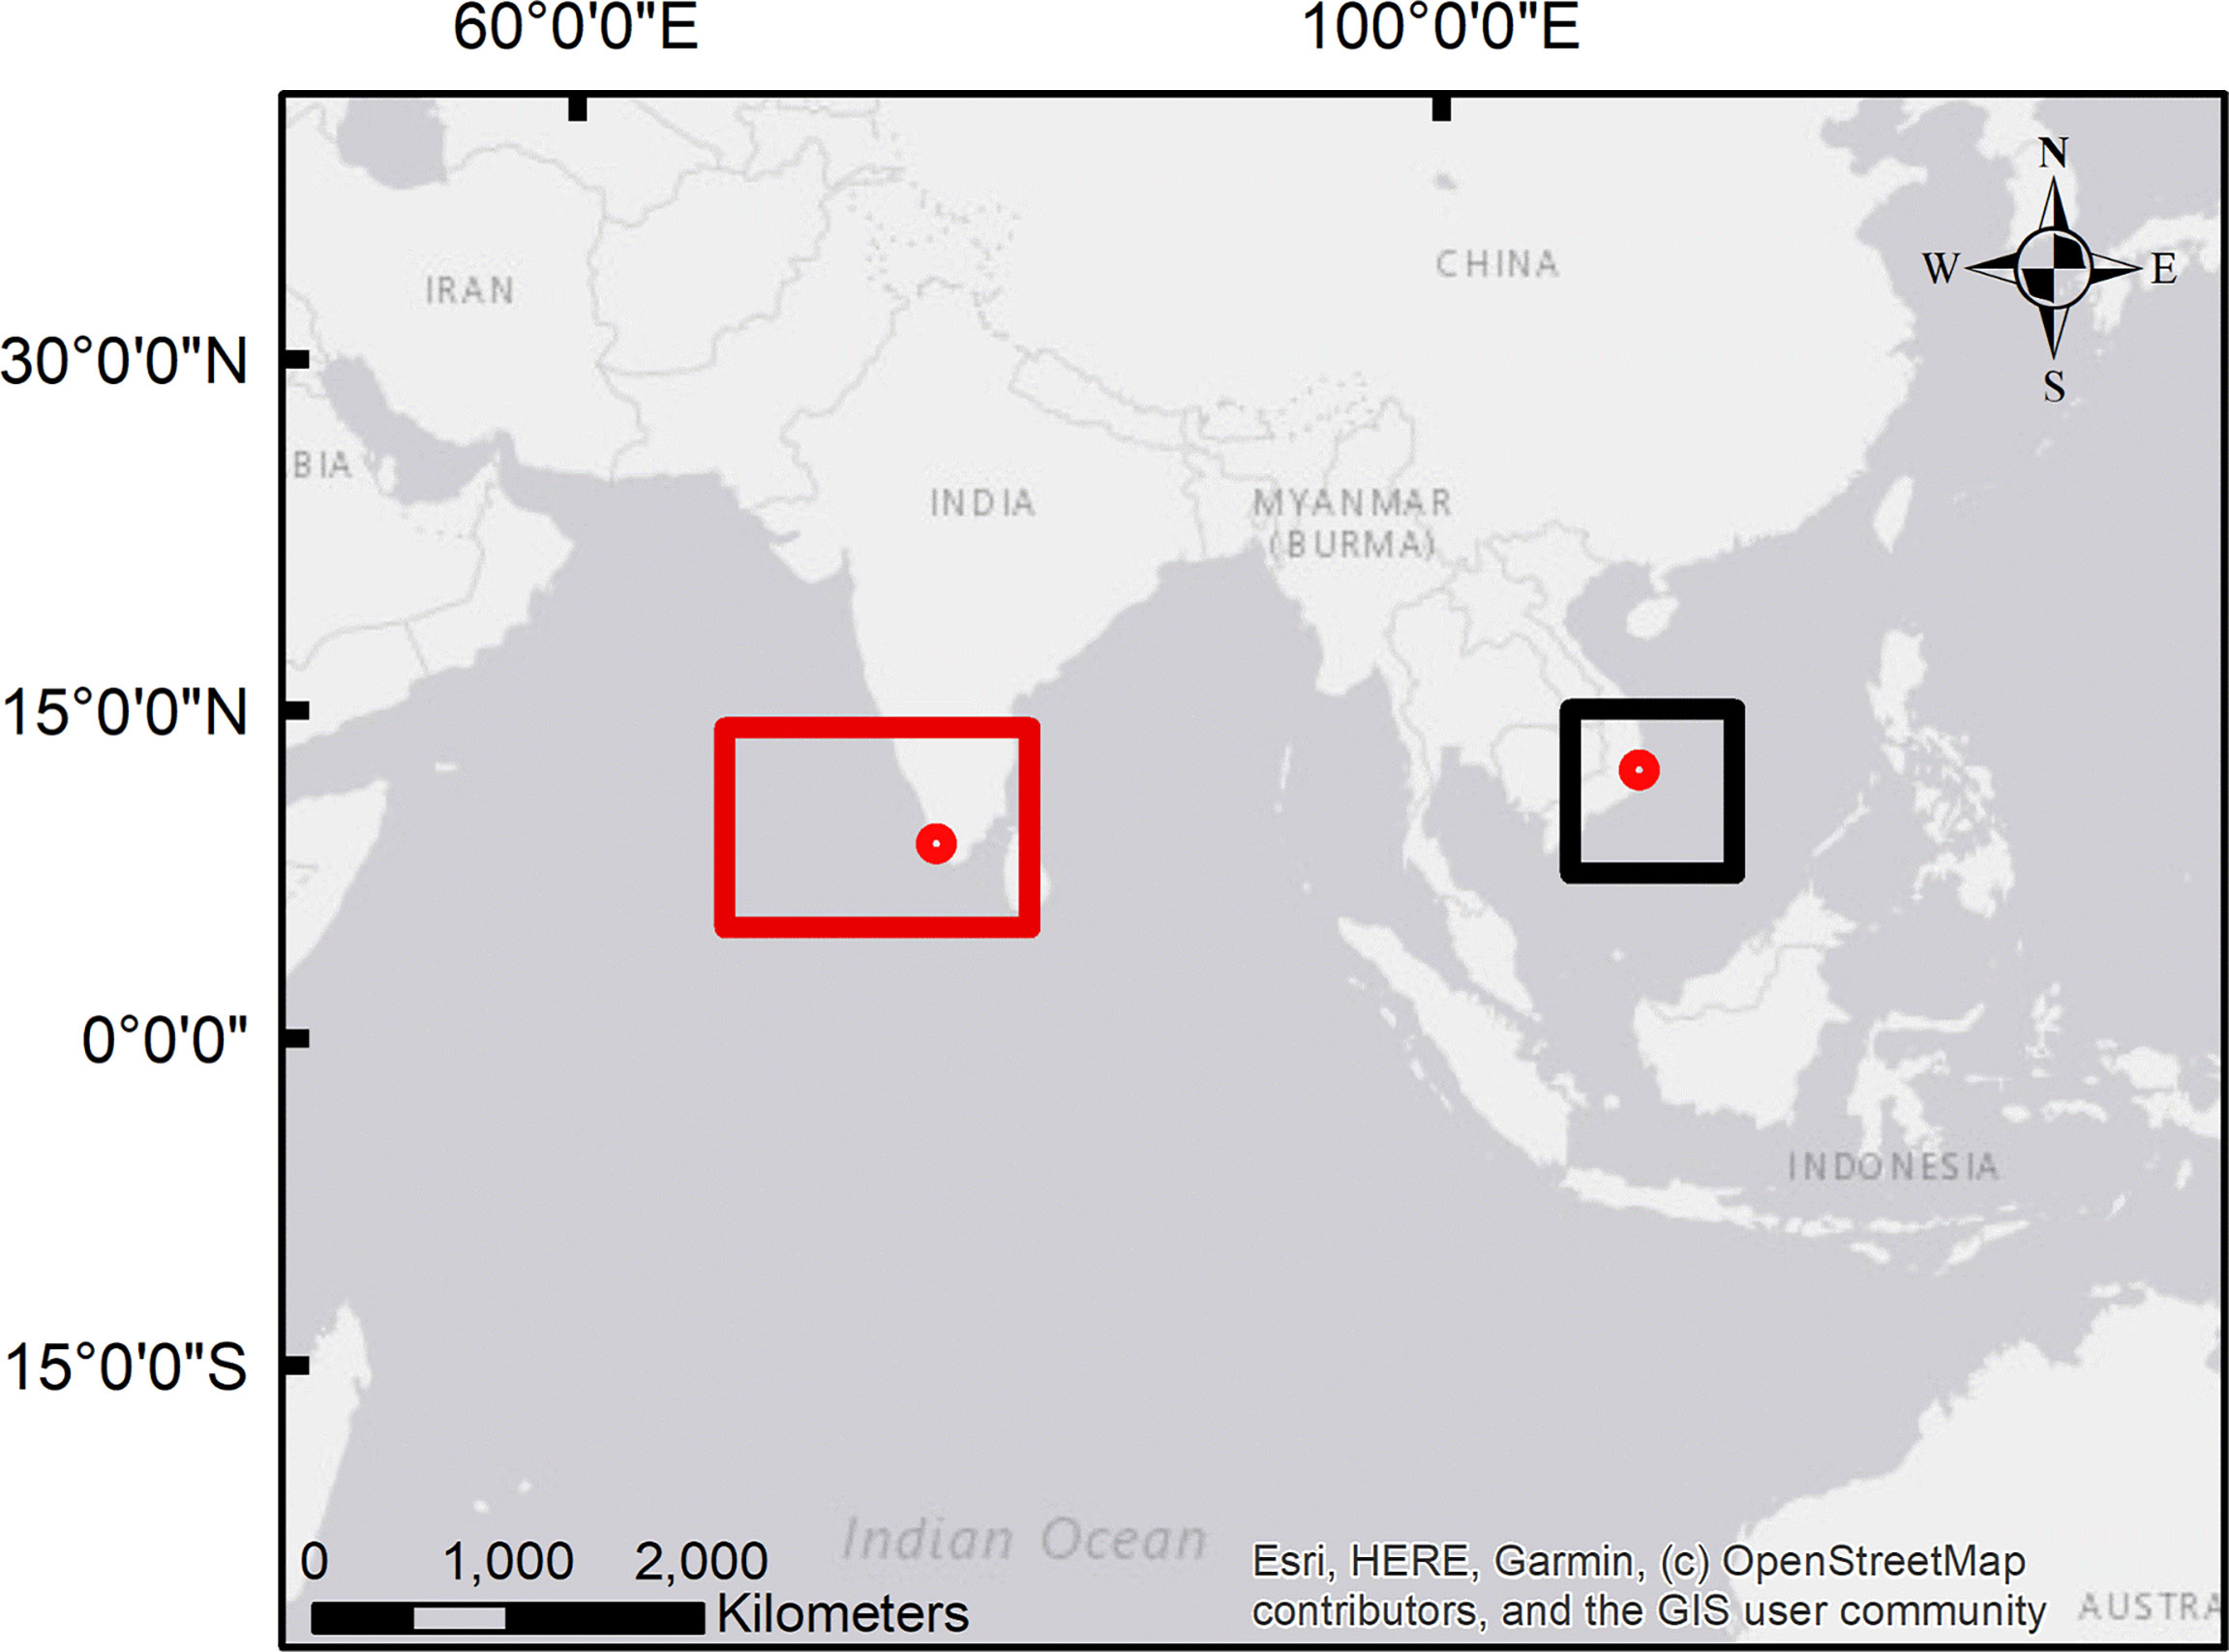
Figure 1 Map showing the location of the processing plants (red circles) and the estimated catchment areas of the samples from the Indian Ocean (red rectangular) and the Pacific Ocean (black square); details about the potential catchment areas (outbreak trace-back) are provided in Loeffler et al. (2022) and Loeffler et al. (2022, preprint); source of the map: Esri, HERE, Garmin, © OpenStreetMap contributors, and the Geographic Information System (GIS) User Community.
Fish samples were extracted according to Spielmeyer et al. (2021). In brief, 5 g fish tissue was enzymatically degraded using papain. The treated sample was extracted with acetone, saturated sodium chloride solution, and ethyl acetate. The raw extract was washed with saturated sodium chloride solution, reduced to dryness, reconstituted in 80% methanol and defatted in three steps using n-hexane, n-hexane after addition of saturated sodium carbonate, and n-hexane after addition of citric acid solution. The defatted sample was cleaned-up using reversed phase solid phase extraction (SPE) followed by normal phase SPE. Normal phase SPE finally delivered two fractions (filtrate and eluate) that were reduced to dryness and reconstituted in 500 µL methanol (i.e., 10 g tissue equivalents (TE) mL-1). Samples were stored in glass vials at -20°C until analysis.
The cleaned-up samples were analyzed by LC-MS/MS. Details concerning the analytical methods and setups are provided in Spielmeyer et al. (2021) and in the Supplementary Material. In brief, low-resolution analyses were performed on an Agilent 1290 Infinity II UHPLC (Agilent, Waldbronn, Germany) connected to a Sciex QTrap 6500+ mass spectrometer (Sciex, Darmstadt, Germany) using the selected reaction monitoring mode (SRM). Due to the high stability of sodium adducts, the m/z of the respective sodium adducts ([M+Na]+) were selected both in the first and third quadrupole. In total, twenty ion transitions were monitored to cover over 30 different congeners from the CTX4A-, CTX3C-, C-CTX- and I-CTX-groups described in literature (Yasumoto et al., 2000; Pottier et al., 2002; Abraham et al., 2012; Diogène et al., 2017; Kryuchkov et al., 2020) (details provided in Supplementary Table 1).
Due to the lack of analytical standards for the CTX3C-group congeners (besides CTX3C itself), peak assignment was performed based on the elution profiles reported in literature (Yasumoto et al., 2000; Yogi et al., 2011) (Supplementary Table 2). Peak assignment was further supported by low-resolution MS/MS analysis using the fragmentation pattern of the respective ammonium adducts ([M+NH4]+). Recorded fragments corresponded to [M+H]+, [M+H-H2O]+, [M+H-2H2O]+, and [M+H-3H2O]+ of the respective congener (detailed discussion provided in Spielmeyer et al. (2021)).
All 52 samples were analyzed within one analytical batch each as a single injection. Stability of the MS signal intensity and the retention time over the entire batch were checked by injecting a standard solution after every ninth sample. The concentration was 1 µg L-1 for CTX1B, 52-epi-54-deoxyCTX1B, and 54-deoxyCTX1B and 2 µg L-1 for CTX3C. Relative standard deviation of the peak areas and retention times ranged from 1.2% to 8.1% and from 0.06 to 0.21% over the entire batch, respectively. An example of a chromatogram of the standard solution is provided in Supplementary Figure 1.
Extracts for determining the composite toxicity were prepared according to the method published by Dickey (2008). Briefly, 5 g of raw fish (without skin) was homogenized in acetone (2 mL g-1) using an ultra turrax. The tissue was separated from acetone by centrifugation and the extract was decanted into a new vessel. The tissue pellet was broken up and the extraction process was repeated, pooling the acetone extracts. The acetone extract was reduced to dryness, reconstituted in 80% methanol (2 mL g-1) and defatted in two steps using n-hexane (1 mL g-1). The aqueous phase was reduced to dryness, reconstituted in water (1 mL g-1) and extracted twice with chloroform (1 mL g-1). The chloroform extract was reduced to dryness, reconstituted in a small volume of chloroform and cleaned-up via normal phase SPE. The eluate was reduced to dryness and reconstituted in 1 mL methanol (i.e., 5 g TE mL-1). Samples were stored in glass vials at -20 °C until analysis.
Composite toxicity was determined using mouse (Mus musculus) neuroblastoma type cells (N2a CCL-131™, American Type Culture Collection, LGC Standards GmbH Wesel, Germany; Lot 63649750, frozen on 24th February 2016 at passage number 184) within the in vitro neuro2a cell bioassay (N2a-bioassay). Modifications to the cell line were conducted according to Loeffler et al. (2021). Cell line maintenance as well as dosing were performed as previously described (Manger et al., 1993; Manger et al., 1995; Dickey, 2008). The treatment medium was removed after 22-24 h and replaced with 3-(4,5-dimethylthiazol-2-yl)-2,5-diphenyltetrazolium bromide (MTT) to be used for examining the percentage of formazan color development among the N2a-bioassay conditions. CTX3C equivalent (eq.) values in standard plates were normalized to provide CTX3C equivalent activity of the samples in ng CTX3C eq. per g tissue equivalent
Peak areas of the assigned congeners (2,3,51-trihydroxyCTX3C, 2,3-dihydroxyCTX3C and 49-epimer, 51-hydroxyCTX3C, M-seco-CTX3C and 49-epimer, 2-hydroxyCTX3C and 49-epimer, CTX3C and 49-epimer, structures provided in Figure 2) were determined for the sodium adducts. Peak integration was performed manually using the software SciexOS-Q (version 1.6.1). The ratio of toxin contained in each sample was calculated as follows. The peak areas for the congener with R-configuration at C-49 (in the following “49R-congener”) and its 49-epimer (S-configuration at C-49, in the following “49-epimer”) were combined (e.g., area of 2,3-dihydroxyCTX3C plus area of 49-epi-2,3-dihydroxyCTX3C). This sum was divided by the total peak area (sum of the peak areas of all congeners detected in the respective sample). For determining the toxin profile for one region (Pacific or Indian Ocean), the average of the toxin ratio of all samples from the respective region was calculated. Non-detected congeners were included with a ratio of 0%.
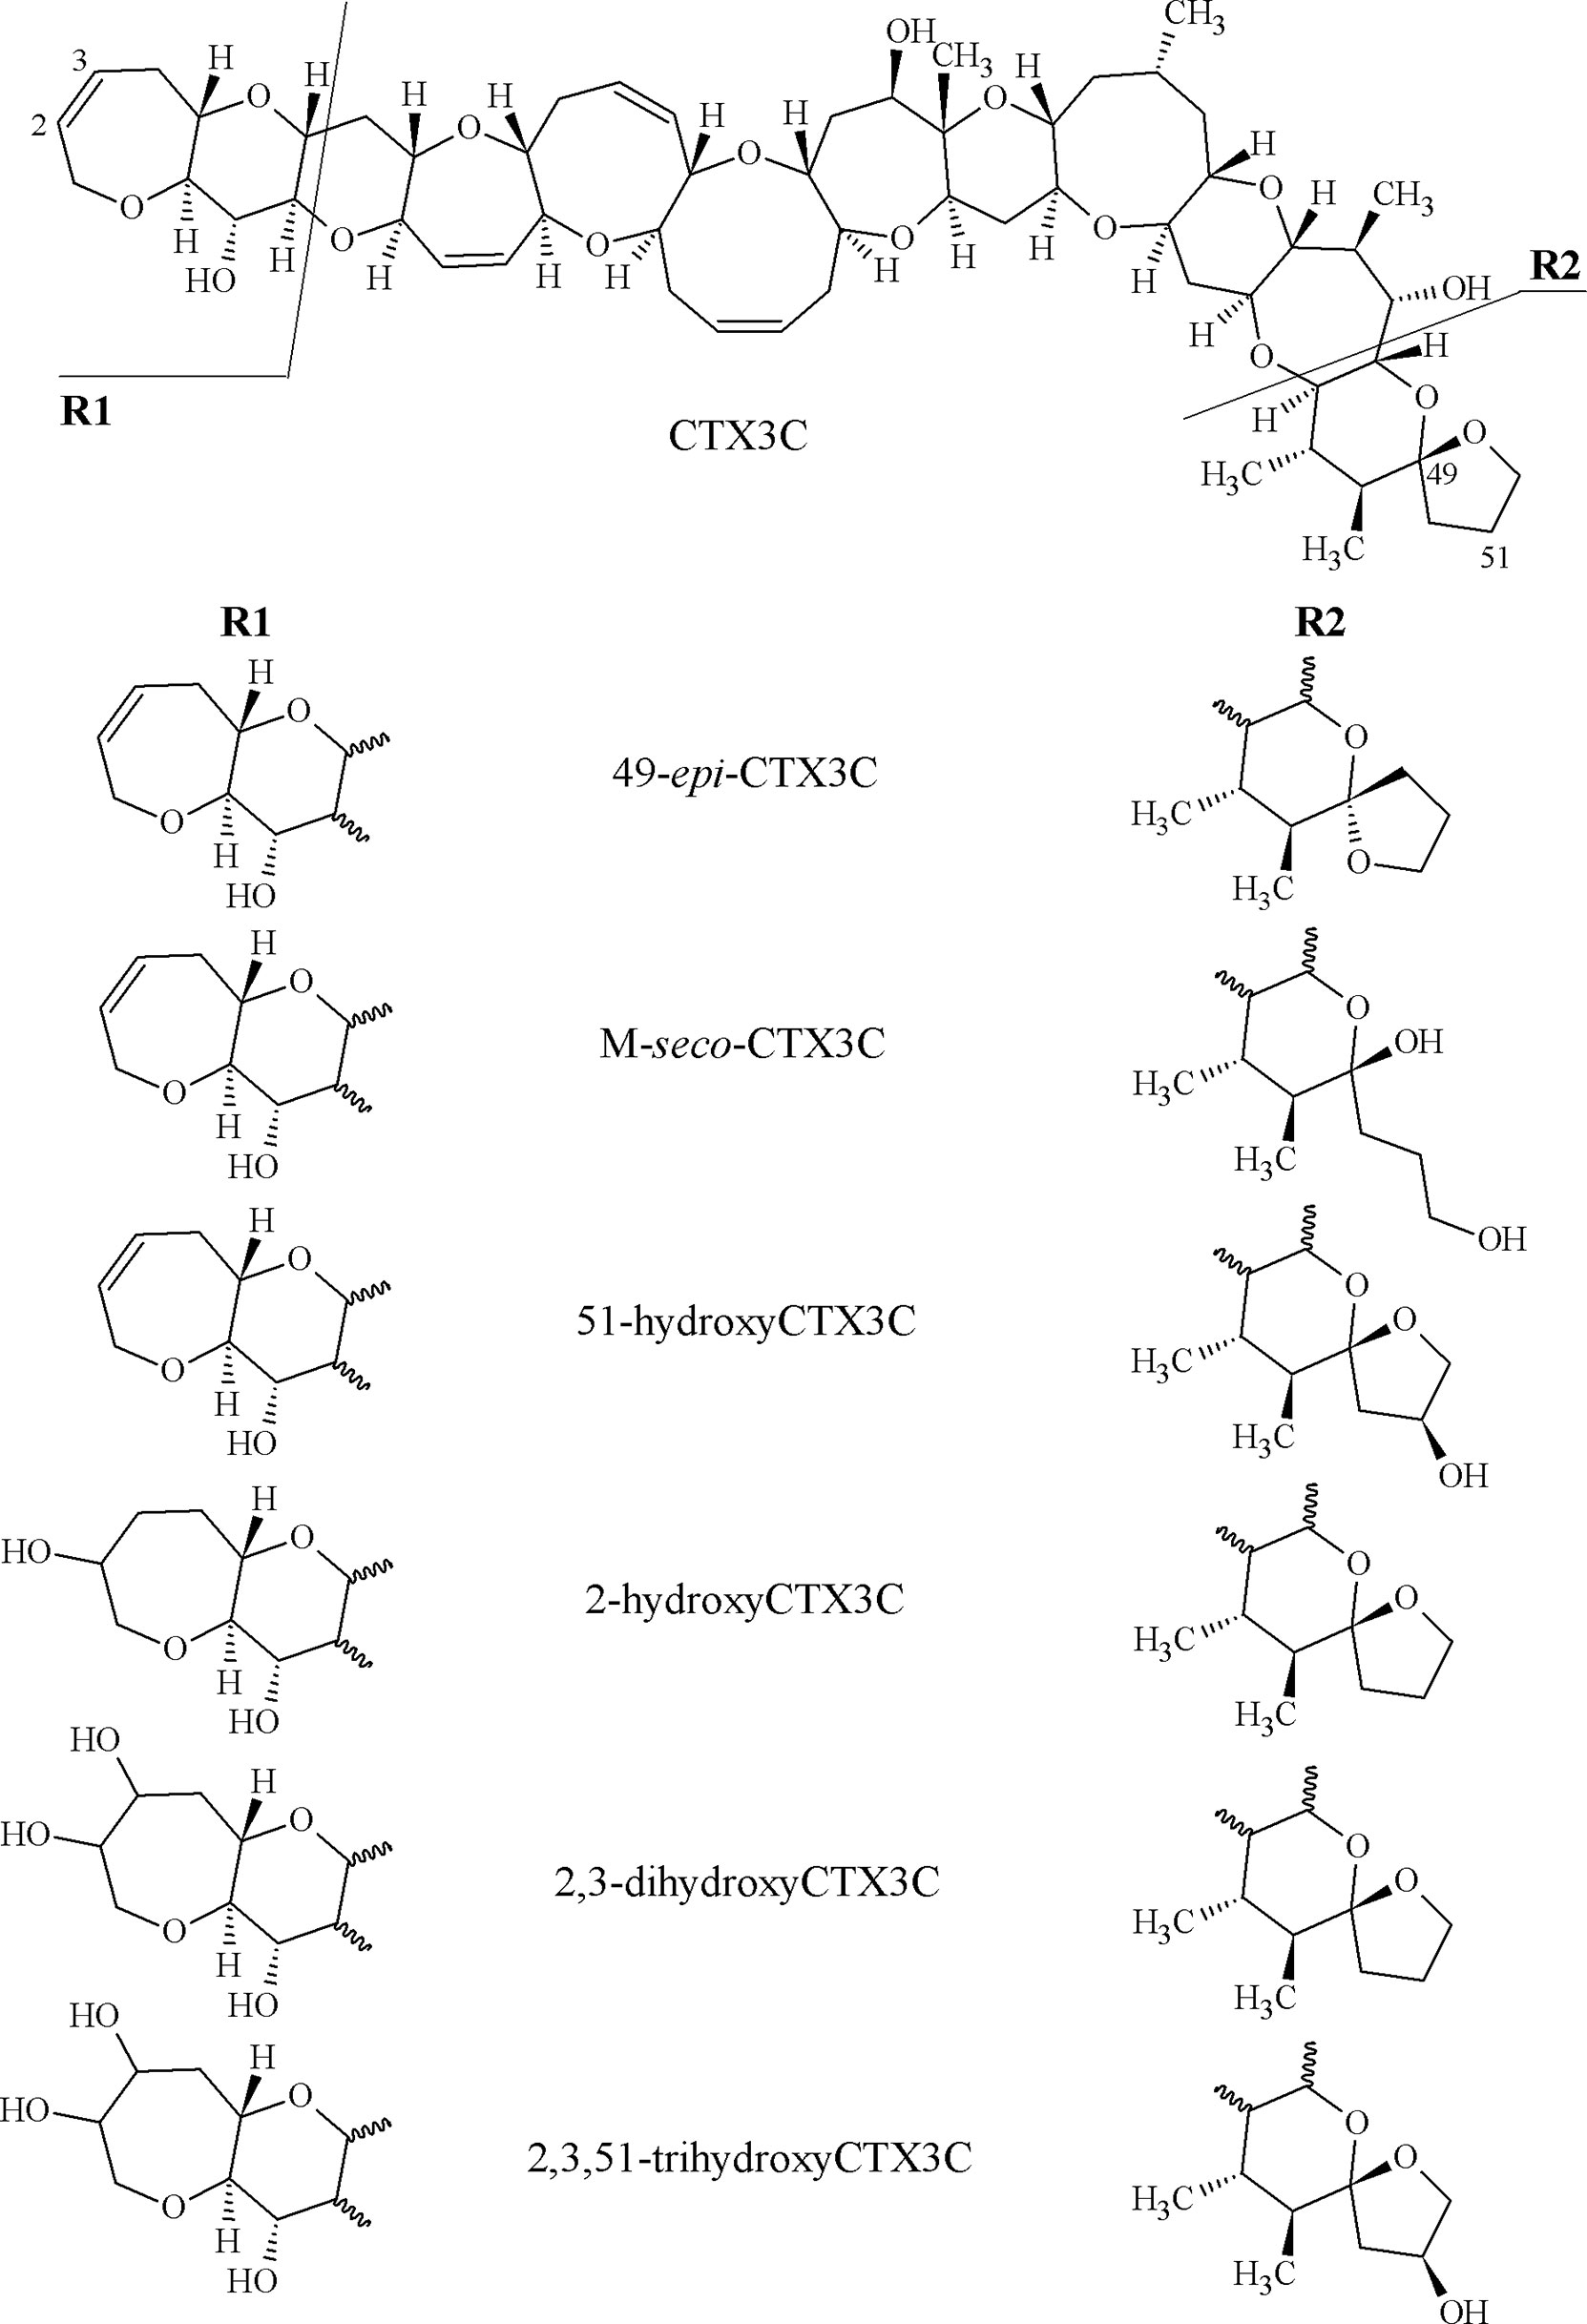
Figure 2 Structures of congeners of the CTX3C-group detected in sample extracts within this study.
Peak areas of the 49R-congener and its corresponding 49-epimer were combined in order to obtain a CTX profile dependent on the oxidation status of the respective compound and independent of the configuration at C-49. The quotient of the 49R-congener and its 49-epimer was evaluated separately. For this, the peak area of the 49R-congener was divided by the peak area of the 49-epimer. A quotient above 1 indicates a dominance of the 49R-congener, in case of a quotient below 1 the 49-epimer possesses the higher peak area.
Correlation coefficients for peak areas and toxicity equivalents were determined as Spearman’s rank order coefficients using SigmaPlot 14. Ranked data were utilized as data were not normal distributed. Non-detected congeners (peak area “0”) were not considered and were removed from the data set of the respective congener. Toxicity equivalents were determined using the N2a-bioassay, results were previously published in Loeffler et al. (2022) and Loeffler et al. (2022, preprint).
All sample extracts revealed the presence of several CTX3C-group congeners. Congeners from other groups were not detected (detection limit for CTX1B, 52-epi-54deoxyCTX1B and 54-deoxyCTX1B: 0.02 µg kg-1 (Spielmeyer et al., 2021); see also Supplementary Figure 2). In total, ten different congener peaks were identified, most likely belonging to 2,3,51-trihydroxyCTX3C, 2,3-dihydroxyCTX3C and its 49-epimer, M-seco-CTX3C and its 49-epimer, 2-hydroxyCTX3C and its 49-epimer, 51-hydroxyCTX3C, and CTX3C and its 49-epimer. Details concerning peak assignment are provided in Spielmeyer et al. (2021). Examples for the respective chromatograms are provided in Figure 3 with samples 24, 30 and 46 representing samples of different toxicity, different toxin profiles (presence/absence of 51-hydroxyCTX3C or 49-epiCTX3C/CTX3C) (Figure 4) and different origin (samples 24 and 30 from Pacific Ocean, sample 46 from Indian Ocean). An example for the ammonium adduct analysis is provided for sample 21 that revealed all congener peaks in high intensity (Figure 4A). The sodium adduct chromatogram of sample 21 with detailed peak assignment is shown in Supplementary Figure 1.
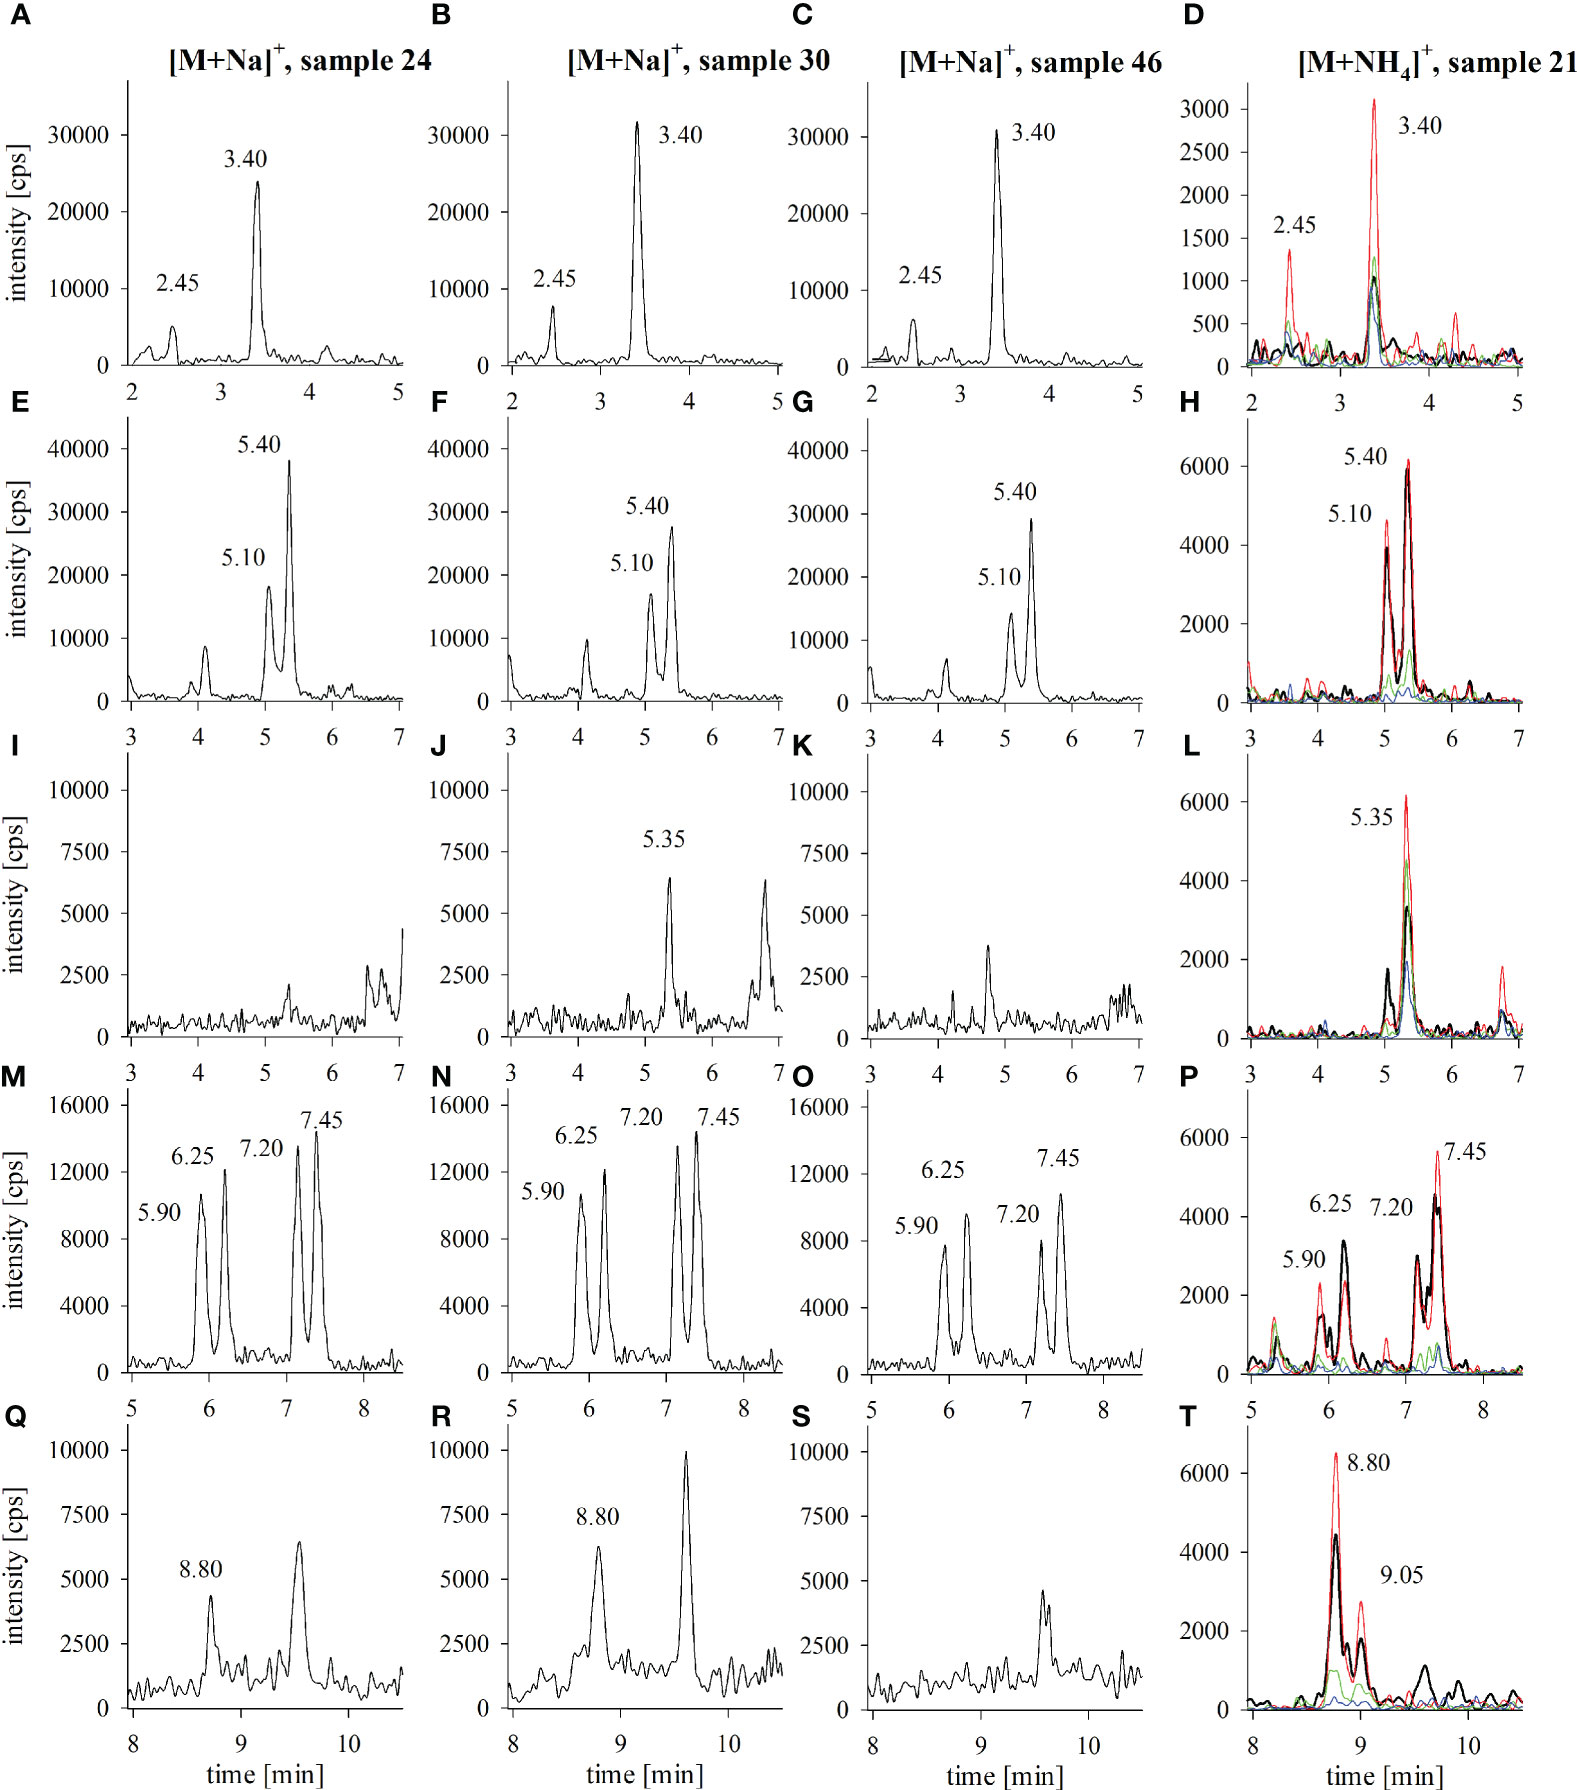
Figure 3 LC-MS/MS chromatograms of selected fish tissue extracts from the Pacific (samples 21, 24, 30) and the Indian Ocean (sample 46); panels show the extracted ion chromatograms for (A-D) 2,3,51-trihydroxyCTX3C (peak at 3.40 min), (E-H) 2,3-dihydroxyCTX3C (5.10 and 5.40 min), (I-L) 51-hydroxyCTX3C (5.35 min), (M-P) M-seco-CTX3C (5.90 and 6.25 min) and 2-hydroxyCTX3C (7.20 and 7.45 min), (Q-T) CTX3C (8.80 and 9.05 min) for the analysis of the sodium adducts (samples 24, 30, 46) and the analysis of the fragments of the ammonium adducts (sample 21); in case of two peaks, the first peak was assigned to the respective 49-epimer of the compound; recorded fragments of the ammonium adducts correspond to [M+H]+ (black), [M+H-H2O]+ (red), [M+H-2H2O]+ (green), [M+H-3H2O]+ (blue); a full time range LC-MS/MS chromatogram of the sodium adducts of a CTX standard solution and the extract of sample 21 is provided in Supplementary Figure 1.
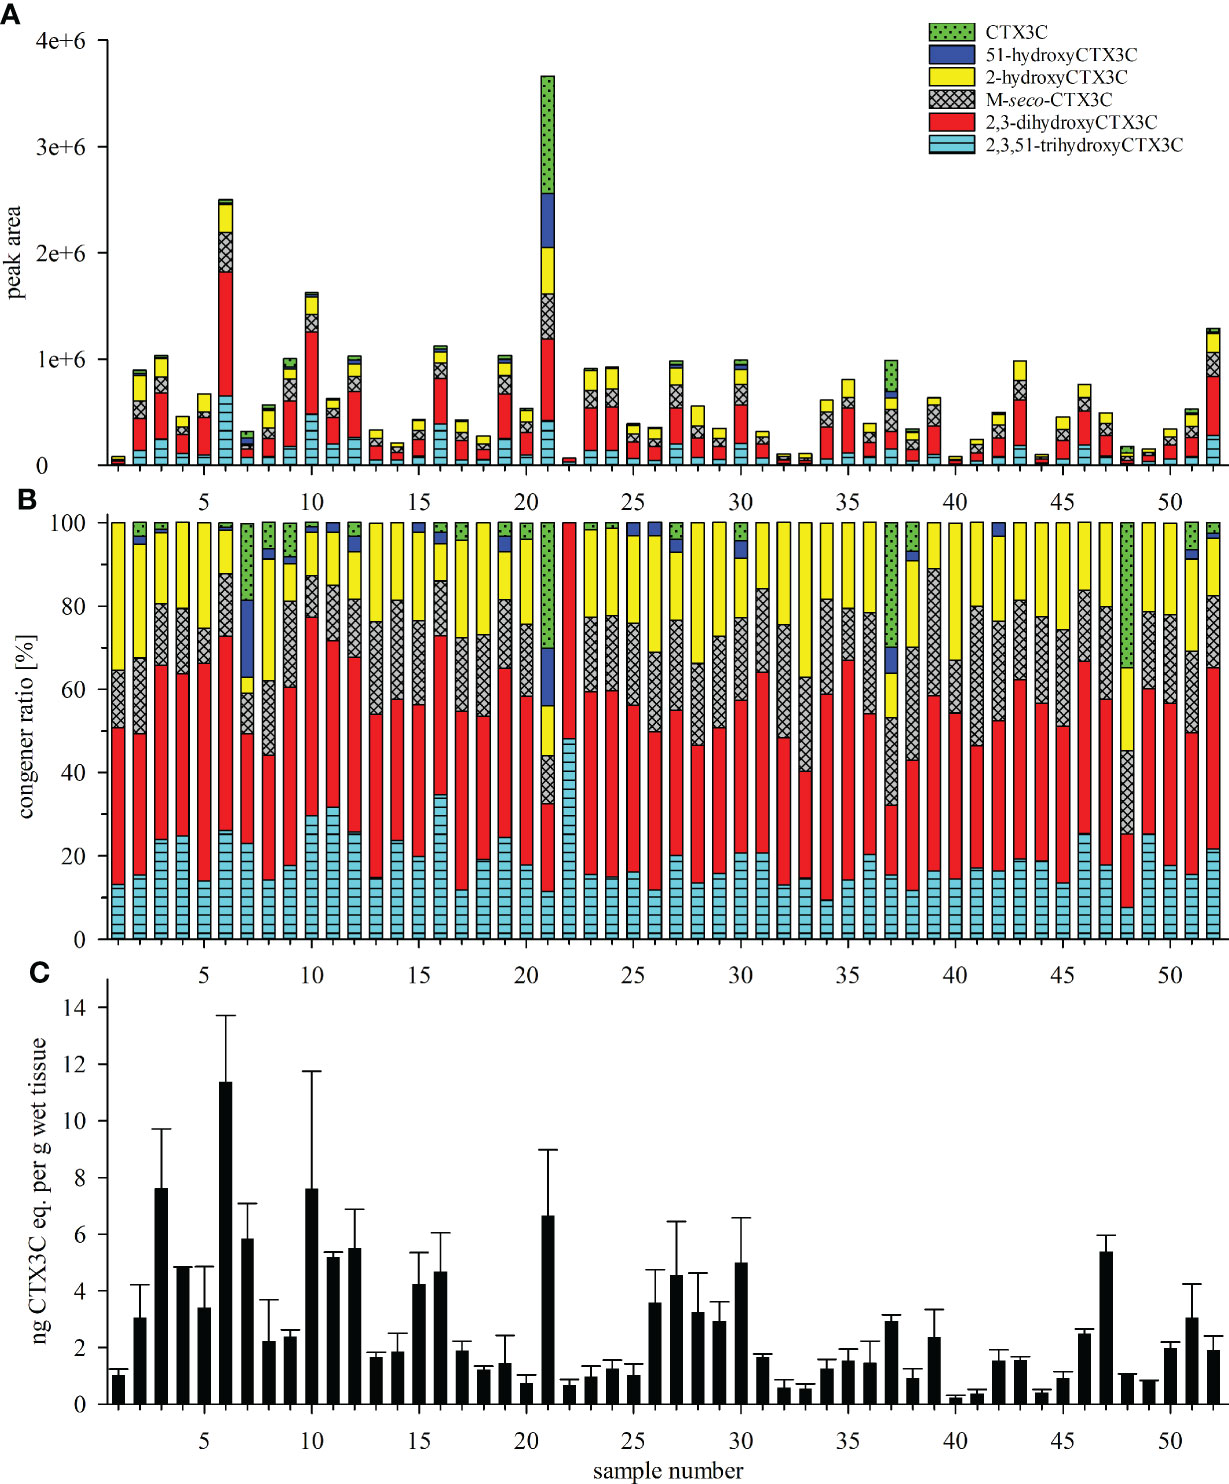
Figure 4 (A, B) Toxin profile and (C) composite toxicity determined for the fifty-two L. bohar tissue samples from the Pacific Ocean (samples 1 to 45) and the Indian Ocean (samples 46 to 52); (A) absolute and (B) relative peak areas of the respective congeners determined by LC-MS/MS analysis, areas of the 49-epimer and the 49R-congener were combined; (C) toxicity equivalents expressed as ng CTX3C eq. per g wet tissue were determined by N2a-bioassay; error bars represent the standard deviation from three independent analyses performed for each samples (i.e., minimum three independent assays, each assay includes three replicate points); N2a-bioassay data according to Loeffler et al. (2022) and Loeffler et al. (2022, preprint).
Samples differed in the number and intensity of the detected peaks (Figure 4A). All samples showed peaks for 2,3-dihydroxyCTX3C and its 49-epimer, and 2,3,51-trihydroxyCTX3C. With the exception of sample 22, all sample chromatograms revealed the presence of M-seco-CTX3C as well as 2-hydroxyCTX3C (n=51). The respective 49-epimers were detected in 49 and 50 samples, respectively. The 49-epimer of CTX3C was detected in 22 samples, CTX3C was found in nine of those samples. CTX3C was the only congener that was transferred into two fractions during sample preparation [filtrate and eluate, see Material and methods and Spielmeyer et al. (2021)] whereas 49-epiCTX3C was detected in the eluate only. 51-hydroxyCTX3C was detected in 22 samples as well, however, its presence was not necessarily accompanied by the presence of CTX3C (Figures 4A, B).
Toxin profiles for samples from the Pacific (samples 1 to 45) and the Indian Ocean (sample 46 to 52) showed no distinct differences concerning detected congeners and congener ratio (Figures 4A, B and 5). In most samples, 2,3-dihydroxyCTX3C and its 49-epimer was the dominant congener (Figure 4B). For the average profile, a portion of 38.2% and 35.7% was calculated for samples from the Pacific and Indian Ocean, respectively (Figure 5). For both regions, 2,3,51-trihydroxyCTX3C, M-seco-CTX3C and 2-hydroxyCTX3C showed a similar portion of approximately 19%. CTX3C and 51-hydroxyCTX3C contributed less than 10% to the mean toxin profile (Figure 5). However, in distinct samples (e.g., samples 21, 37, 48) CTX3C was the dominating congener (Figures 4A, B). These calculations are based on the assumption that all congeners possess a similar ionization efficiency during LC-MS/MS analysis.

Figure 5 CTX profiles in fish tissue samples from the Pacific and the Indian Ocean; percentage values based on the average proportion of compounds among samples by region, values in () refer to the standard deviation; non-detected congeners within one sample were considered with “0%”.
Upon visually inspecting the data, absolute peak areas by LC-MS/MS and the composite toxicity by the N2a-bioassay appeared to be correlated with high peak areas corresponding to high toxicity (Figures 4A, C). Contrary to this general trend, the highest total peak area was not determined for the most toxic sample (sample 6), but for sample 21 that, unlike the others, showed high portions of 51-hydroxyCTX3C, CTX3C and its 49-epimer (Figure 4A). Consequently, the data point for sample 21 was outside from the trend line for several congeners (Figure 6, denoted by an asterisk *). Removing this sample from the data set did not improve the Spearman’s rank order coefficients (rS), thus, the data point was not excluded from the calculation.
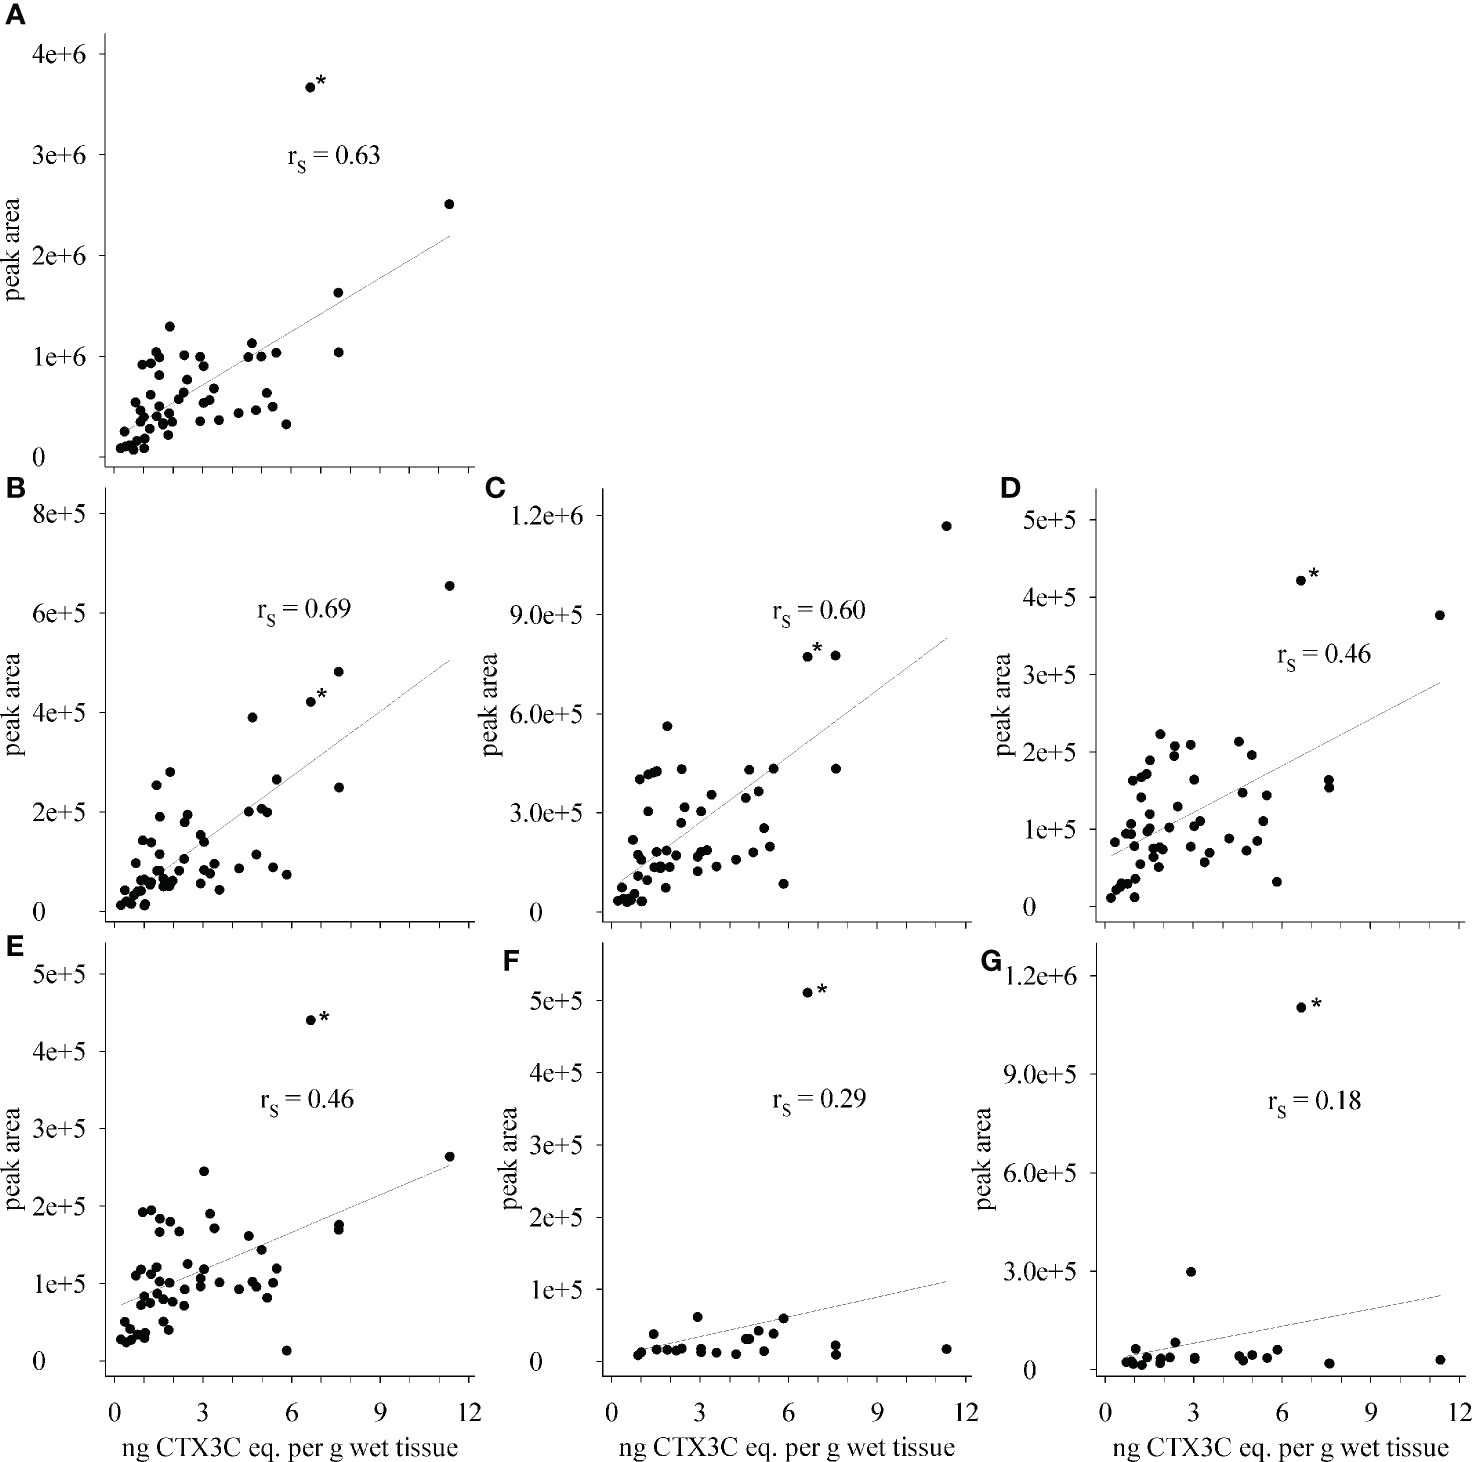
Figure 6 Correlation between composite toxicity determined by N2a-bioassay and peak areas determined by LC-MS/MS for (A) total peak area, (B) 2,3,51-trihydroxyCTX3C, (C) 2,3-dihydroxyCTX3C and 49-epimer, (D) M-seco-CTX3C and 49-epimer, (E) 2-hydroxyCTX3C and 49-epimer, (F) 51-hydroxyCTX3C, and (G) CTX3C and 49-epimer; rS - Spearman’s rank order coefficient; * - sample 21.
Spearman’s rank order coefficients (rS) were calculated for peak areas determined by LC-MS/MS and composite toxicity determined in the N2a-bioassay. For the total peak area (sum of all peak areas determined in each sample) a coefficient of rS = 0.63 was obtained. Different rS values were determined for the respective congeners (Figure 6, Table 1). Highest coefficients (rS = 0.69 and rS = 0.60) were determined for the congeners with the highest oxidations status (2,3,51-trihydroxyCTX3C and 2,3-dihydroxyCTX3C) and, in case of 2,3-dihydroxyCTX3C, for the congener with the highest ratio (highest peak area in most samples). The values were comparable to the coefficient determined for the total peak area (Table 1). Lower coefficients were obtained for the lower oxidized congeners M-seco-CTX3C and 2-hydroxyCTX3C (rS = 0.46) (Figure 6, Table 1). Coefficient of rS = 0.29 (p = 0.19) and rS = 0.18 (p = 0.41) were determined for 51-hydroxyCTX3C and CTX3C, respectively. However, these results should be considered carefully as these congeners were detected in less than half of the samples and often in minor amounts (Figures 4, 5 and Table 1).
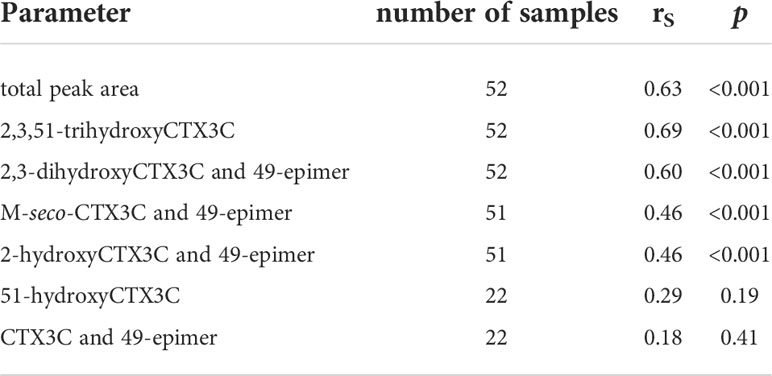
Table 1 Spearman’s rank order coefficient (rS) calculated for composite toxicity (determined by N2a-bioassay) and peak areas (LC-MS/MS).
Peaks of the potential 49-epimers were observed for 2,3-dihydroxyCTX3C, M-seco-CTX3C, 2-hydroxyCTX3C, and CTX3C. In all cases, the 49-epimer peak preceded the peak of the 49R-congener (Figure 3). No corresponding peaks were found for the congeners with a hydroxyl group at the C-51 position (2,3,51-trihydroxyCTX3C, 51-hydroxyCTX3C) (Figure 3). Regarding 2,3,51-trihydroxyCTX3C, a peak eluting 1 min before the 49R-congener was observed in 45 samples. It showed the same fragmentation pattern (Figure 3D) and was also previously detected using a high-resolution mass spectrometer setup (Spielmeyer et al., 2021; Loeffler et al., 2022).
The peak area quotient of the 49R-congener and the 49-epimer was calculated for 2,3-dihydroxyCTX3C, M-seco-CTX3C, and 2-hydroxyCTX3C. The average quotient ranged from 1.17 to 1.35 with the 49R-congener being the dominant compound for the majority of the samples (Table 2). The same calculation was conducted for 2,3,51-trihydroxyCTX3C and the peak detected at 2.5 minutes. Here, a quotient of 5.2 was determined (Table 2).
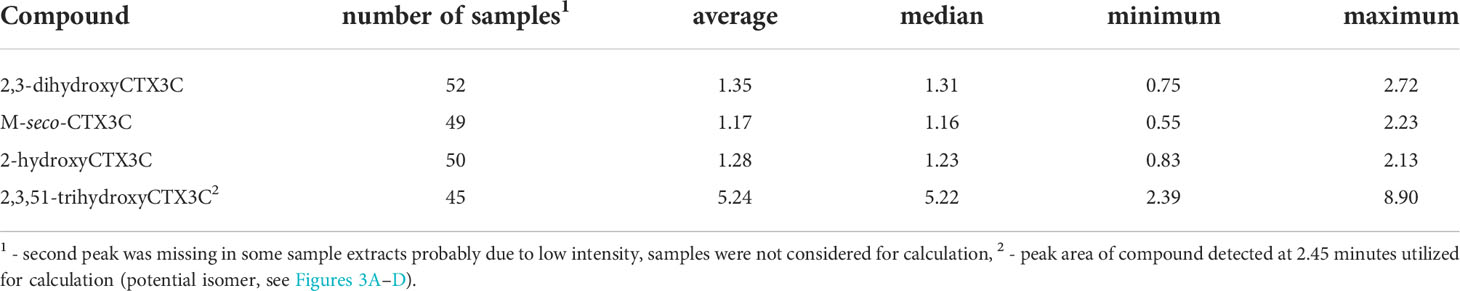
Table 2 Quotient determined for the peak areas of the 49R-congener and 49-epimer or 49R-congener and potential isomer.
Fifty-two tissue samples of L. bohar were obtained in the context of two ciguatera outbreaks in the EU. All sample extracts were analyzed to investigate their CTX profiles which revealed the presence of several (putative) CTX3C-group congeners. Reference standards for these compounds are unavailable; therefore, a co-injection could not be performed as a final proof to verify the correct peak annotation. This presents a challenge, therefore, within this study, congener peaks were assigned based on their m/z, retention time as well as the fragmentation of the ammonium adducts [for a detailed discussion of the peak assignment see Spielmeyer et al. (2021)].
The congener 49-epiCTX3C was detected more often than CTX3C which might imply a higher occurrence of the 49-epimer in naturally incurred samples. However, CTX3C was found to split into two distinct fractions during sample preparation. This can result in a lower frequency of detection of this congener in samples with CTX3C contents close to the limit of detection [0.04 to 0.08 µg kg-1, Spielmeyer et al. (2021)]. Conversely, during sample preparation, 49-epiCTX3C is only transferred into one fraction, and this consolidation can potentially lead to its higher frequency of detection. The lower occurrence of CTX3C is therefore ascribed to analytical and preparatory limitations rather than natural preferences for the 49-epimer (see also discussion in below).
The CTX3C-group has historically been considered associated to the Pacific Ocean basin as congeners were initially isolated from sample material obtained from this region (Murata et al., 1990; Satake et al., 1993; Satake et al., 1998; Yasumoto et al., 2000; FAO and WHO, 2020). However, this core precept of regional CTX distinction was refuted with this set of congeners found in L. bohar samples from the Western Indian Ocean. Both congeners and congener ratios were comparable for the sample sets from the Pacific (samples 1 to 45) and the Indian Ocean (samples 46 to 52) (Figures 4B, 5), indicating a strong similarity (and possible single Gambierdiscus spp. source) for the CTX3C-group profile within this species among distinct regions. Because these results contradict the established historic association of CTX3C as being found only within the Pacific Ocean basin, this emphasizes that LC-MS/MS methods which are based on a restricted focus for CTXs of an associated geographic origin of sample material should be expanded. If this region focused approach to CTX detection were followed strictly, the unexpected CTX3C-group congeners in the samples from the Indian Ocean would have been overlooked resulting in a false negative conclusion.
In general, CTX analysis is hampered by the limited availability of analytical standards for compound confirmation. The most conservative CTX analysis approach would be to only include congeners with available standards into an LC-MS/MS method in order to avoid false positive results due to inaccurate peak assignment. However, if samples were checked for the commercially available compounds only (CTX1B, CTX3C), nine samples (17%) would have been considered as CTX-positive (detection of CTX3C) although the N2a-bioassay identified CTX-like toxicity in all (100%) sample extracts. An LC-MS/MS method expanded to include other CTX congeners, even though reference standards are not available, would reduce the likelihood of a false negative conclusion. There are several compound confirmation approaches which can be performed variably to support peak assignment (e.g., analysis of fragments, consideration of fragment ratio, high-resolution MS analyses). Additionally, elution profiles of several CTX congeners are already published [e.g., congeners from the CTX3C-group in Yasumoto et al. (2000); Yogi et al. (2011)]. Improving the coverage of potential CTX compounds in a sample, and the subsequent knowledge gained regarding CTX occurrence and CTX profiles in different regions could be improved, thus aiding different competent authorities in food safety and stakeholders of the responsible industries alike.
All L. bohar tissue samples investigated in this study showed a comparable CTX profile consisting of congeners from the CTX3C-group. CTX3C was identified in 22 out of 52 samples (42%). Excluding sample 21 and 37, it contributed only a small portion to the absolute CTX burden (Figure 4A). Fish representing a high trophic level fish (e.g., L. bohar) can contain a high proportion of oxidized algal CTX metabolites due to biotransformation (Yasumoto et al., 2000; Mak et al., 2013; Wong et al., 2014; Yogi et al., 2014). Herein, small amounts of the algal metabolite are demonstrated to also be capable of occurring in a fish species representing a high trophic feeding level. Hawaiian monk seals (high trophic level predators) have also been demonstrated to accumulate CTX3C in their liver (Bottein et al., 2011). Satake et al. (1993) identified CTX3C as minor compound in moray eels, Yogi et al. (2011) found both CTX3C and its 49-epimer in spotted knifejaw (Oplegnathus punctatus). The detection of CTX3C in non-herbivorous animals (i.e., spotted knifejaw, moray eel, and monk seal) could be either an indicator of a CTX3C non-metabolism pathway along the food web or foraging activity by higher trophic level species which on occasion do consume benthic feeding species. Of particular note is the high content of CTX3C in sample 21, which could indicate the individual feeding behavior of the corresponding fish, that it (at least partly) fed on a low trophic level organism. These findings further support the notion that LC-MS/MS methods should cover all known CTX congeners irrespective of the reported samples origin or trophic level description.
The oxidized CTX congener 2,3-dihydroxyCTX3C was the most abundant compound among the CTX profiles identified in the samples. This congener was isolated and structurally elucidated using extracts of moray eel Gymnothorax javanicus (Satake et al., 1998). The same extract delivered the structure of 51-hydroxyCTX3C (Satake et al., 1998). Both congeners were not detected in Gambierdiscus spp. cultures and the authors concluded that the compounds were produced in fish by oxidative biotransformation of CTX3C. The potential formation of 2,3-dihydroxyCTX3C out of CTX3C was proven in vitro using a liver S9 fractions of L. bohar or O. punctatus (Ikehara et al., 2017). Therefore, it is assumed that the 2,3-dihydroxyCTX3C detected within this study was the result of an oxidative biotransformation process derived from CTX3C. This process may have occurred either within the individual L. bohar found to contain 2,3-dihydroxyCTX3C, or this process may have occurred within a prey item, or both.
Within the same in vitro setup (Ikehara et al., 2017), 51-hydroxyCTX3C was detected after incubating CTX3C with fish liver S9 fraction derived from O. punctatus, but not from L. bohar. This might be due to the low transformation rate of CTX3C (see Figure 4 in Ikehara et al. (2017)), the lack of enzymes for an oxidation at C-51 in L. bohar or the subsequent oxidation of 51-hydroxyCTX3C to 2,3,51-trihydroxyCTX3C. That congener is not mentioned in the study of Ikehara et al. (2017), therefore no conclusion can be drawn based on the in vitro experiment. For most of the samples investigated here, 51-hydroxyCTX3C contributed less than 5% to the detected CTX congeners whereas the average share of 2,3,51-trihydroxyCTX3C was approximately 19% (Figures 4B, 5). Furthermore, 2,3,51-trihydroxyCTX3C was detected in all samples, whereas its putative precursor 51-hydroxyCTX3C was detected in less than half. This implies that 51-hydroxyCTX3C is easily transformed to 2,3,51-trihydroxyCTX3C, either by a prey item or by L. bohar. Whether 51-hydroxyCTX3C is produced as an intermediate form by L. bohar itself (and subsequently oxidized to 2,3,51-trihydroxyCTX3C) or whether the species takes up the congener from lower trophic fish has not yet been elucidated.
The high ratio of 2,3-dihydroxyCTX3C in all 52 samples indicates that the oxidation at C-2 and C-3 is common. It appears likely that the same enzyme catalyzes the transformation from 51-hydroxyCTX3C to 2,3,51-trihydroxyCTX3C. The two highly oxidized congeners contribute around 50% to the determined CTX profile in most samples (Figures 4B, 5). This is in agreement with the general assumption that high trophic level fish mainly contain oxidized CTX congeners due to several biotransformation steps within the food web (Lewis and Holmes, 1993). For instance, Mak et al. (2013) investigated fish of different trophic levels from coral reefs of the Republic of Kiribati. They found that carnivorous fish tend to contain higher ratios of CTX1B than herbivorous and omnivorous fish; however, this does not preclude CTX1B from being detected in herbivorous species (Mak et al., 2013).
For the average profile, both 2-hydroxyCTX3C and M-seco-CTX3C contribute approximately 19% to the CTX profile. These congeners were reported for cultures of G. polynesiensis, in trace amounts of selected clones (Chinain et al., 2010; Longo et al., 2019; Longo et al., 2020). Yasumoto et al. (2000) identified M-seco-CTX3C in G. toxicus and 2-hydroxyCTX3C in fish. Fish species investigated were Scarus gibbus (parrotfish), L. bohar, and G. javanicus (moray eel), but no differentiation was provided concerning which congener was isolated from which species. Based on the low portion of the congeners in algae, the formation of both compounds due to biotransformation in the food web is most likely leading to the high ratio of both congeners observed in the L. bohar samples investigated in this study. The high ratio of both congeners suggests that they are not extensively biotransformed to other congeners, but accumulated in the fish. The question remains whether the transformation occurs only at the beginning of the food web (i.e., in herbivorous fish or invertebrates), throughout the food web (i.e., different trophic levels produce these congeners) or whether only high trophic level fish are capable of this biotransformation. As already stated by Mak et al. (2013), the investigation of lower trophic species could help to better understand CTX dynamics and CTX biotransformation within the marine food web.
Peaks of potential 49-epimers were detected for 2,3-dihydroxyCTX3C, 2-hydroxyCTX3C, M-seco-CTX3C and CTX3C and the compounds eluted shortly before the 49R-congener (Figure 3). No comparable peaks were observed for 51-hydroxyCTX3C and 2,3,51-trihydroxyCTX3C. Apparently, the oxidation at the position C-51 does not occur in case of the 49-epimer, potentially due to steric factors. This aspect was already discussed for the CTX4A-group congeners with 52-epi-54-deoxyCTX1B not being oxidized to 52-epiCTX1B (Lewis et al., 1993). The formation of the 49-epimer is catalyzed by acids. An epimerization during sample preparation is not expected as solutions containing 0.1% acetic acid only were utilized. Furthermore, the same 49-epimers were observed for extracts being prepared without addition of acids [see chromatogram in Loeffler et al. (2022)]. It is assumed that the 49-epimers are already present in the sample tissue.
Theoretically, the 49-epimers might be produced in two different ways. The epimerization might occur during biotransformation (e.g., formation of 49-epi-2,3-dihydroxyCTX3C out of CTX3C) or 49-epimer precursors such as 49-epiCTX3C are biotransformed in the same manner as the 49R-congener. The first option should lead to 49-epimers of 2,3,51-trihydroxyCTX3C or 51-hydroxyCTX3C, but these were not observed. Ikehara et al. (2017) used CTX3C in their in vitro study and found one peak for 2,3-dihydroxyCTX3C only. Consequently, the second option is considered as relevant. Cultures of G. polynesiensis were reported to contain both CTX3C and its 49-epimer with a ratio’s quotient around 1.5 [ratio of CTX3C divided by ratio of 49-epiCTX3C, data can be found in Figure 5 in Chinain et al. (2010)]. This is comparable to the peak area quotients determined within this study (Table 2). Thus, 49-epimers and their corresponding 49R-congeners seem to be metabolized in the same way except for the oxidation at C-51 which occurs for the 49R-congener only.
The 49R-congener was the dominant configuration in most samples (Table 2). Based on MM2 calculations, the R-configuration at C-49 is considered more stable than the S-configuration (Yasumoto et al., 2000). In acidified solutions, the formation of the 49-epimer of CTX3C can be observed, but a complete conversion does not take place and the 49R-congener remains the main compound (according to Figure S1 in Oshiro et al. (2021a), incubation performed in 0.1 M hydrochloric acid in chloroform/dioxane). In case of the m/z corresponding to 2,3,51-trihydroxyCTX3C, an additional peak with the same fragmentation pattern (observed fragments plus ratio of the single fragments) was observed (Figures 3A–D). In contrast to the other potential 49-epimers, it eluted 1 min before the 49R-congener. The peak area quotient of the 49R-congener and this peak was above five. For 2,3-dihydroxyCTX3C, 2-hydroxyCTX3C, and M-seco-CTX3C, the mean quotient was between 1.17 and 1.35 (Table 2). Both aspects (retention time difference, peak area quotient) make it seem unlikely that the peak at 2.45 min is the 49-epimer of 2,3,51-trihdroxyCTX3C. As the fragmentation pattern looks similar, it might be an isomer of 2,3,51-trihydroxyCTX3C which is currently undescribed.
Peak areas of the single congeners were correlated with the composite toxicity. It must be noted that values for both parameters were obtained for two different sets of extracts. This might influence the results for the coefficients. However, extracts of both methods delivered comparable results within the N2a-bioassay (Spielmeyer et al., 2021), thus, the impact should not be substantial. The different limits of quantitation (LOQ) of the two analytical methods should be taken into account as well. LOQs of 0.002 µg CTX3C eq. per kg TE and 0.2 µg CTX3C kg-1 were determined for the N2a-bioassay (Loeffler et al., 2021) and LC-MS/MS analysis (Spielmeyer et al., 2021), respectively. The lower LOQ of the N2a-bioassay can influence the correlation coefficient, when positive results in the N2a-bioassay are not accompanied by a positive detection of CTX by LC-MS/MS. In order to limit this influence, samples were not considered for determination of the Spearman’s rank order coefficient when the respective congener was not detected in the sample (see also number of samples in Table 1).
Highest Spearman’s rank order coefficients were obtained for the highest oxidized congeners (i.e., 2,3,51-trihydroxyCTX3C, 2,3-dihydroxyCTX3C). As the sum of these congeners contributed the most to the total peak area for most of the samples, the coefficient for total peak area was in the same order of magnitude. Wong et al. (2014) analyzed fish samples from markets in Hong Kong both via mouse bioassay (MBA) and LC-MS/MS. In case of the LC-MS/MS data, contents (in ppb) were converted to mouse units per kg fish (content multiplied by toxicity equivalent factors (TEFs)). The Spearman’s rank correlation between both methods was highest for total toxicity (rS = 0.78) and CTX1B (rS = 0.75), followed by 52-epi-54-deoxyCTX1B (rS = 0.60) and 54-deoxyCTX1B (rS = 0.37). These results are comparable to coefficients determined within this study showing the similarity among results determined by cell-assays, the MBA, and chemical analysis performed by LC-MS/MS.
The lowest coefficient was obtained for the algal metabolite CTX3C (rS = 0.18) which is the lowest oxidized congener of the compounds detected within this study. Lower oxidized CTX congeners were previously considered less toxic than higher oxidized CTX metabolites based on results obtained for isolated compounds using the MBA (Lewis et al., 1991). Results from MBA studies (LD50 after intraperitoneal administration) were utilized for estimating the TEFs. The TEF of CTX1B was set to 1.0 and other congeners were set relative to this compound. For the congeners detected in this study, TEFs are available for CTX3C (0.2), 51-hydroxyCTX3C (1.0) and 2,3-dihydroxyCTX3C (0.1) (EFSA, 2010). Later reports calculated a relative potency of 1.3 for 51-hydroxyCTX3C [also relative to 1.0 for CTX1B, FAO and WHO (2020)] [calculations based on the original observations by Satake et al. (1998); Yogi et al. (2014)].
Although 51-hydroxyCTX3C is reportedly five times more toxic than CTX3C (based on the TEF), only a weak correlation between peak area and composite toxicity was found for both congeners within this study. Thus, these compounds are likely a minor contributor to the measured composite toxicity. This is mainly ascribed to the low detection frequency and the small peak intensity (i.e., low concentration). 2,3-DihydroxyCTX3C is the dominant congener and shows a high correlation with the composite toxicity (rS = 0.60). This agrees with the assumption of highly oxidized congeners being more toxic, but contradicts the low TEF determined for this compound. It should be considered that the currently recognized TEFs were estimated using results from MBA studies whereas composite toxicity within this study was determined by N2a-bioassay, which has a higher detection sensitivity. Depending on the assay, CTX congeners can show different relative potencies [see Table 1 in Yogi et al. (2014)]. However, the results presented here indicate that a re-evaluation of the TEFs might be appropriate.
The congeners M-seco-CTX3C, 2-hydroxyCTX3C and 2,3,51-trihydroxyCTX3C were equally representative based on the average CTX profile (Figure 5), but correlation with composite toxicity was higher for 2,3,51-trihydroxyCTX3C (rS = 0.69) than for the other two congeners (both rS = 0.46). This would support the assumption that the toxicity depends on the oxidation status of the congener. For these three congeners, no TEFs are available so far. These compounds should be included in future (re-)evaluation studies of the single toxins.
Currently, there is no guidance value for congeners of the CTX3C- and I-CTX-group. Guidance values were only defined for CTX1B (0.01 µg CTX1B eq. per kg) and C-CTX-1 (0.1 µg C-CTX-1 eq. per kg) in finfish (USFDA, 2021). The least and most toxic samples in the N2a-bioassay (sample 40 and sample 6, respectively) revealed a content of 0.23 and 11.4 µg CTX3C eq. kg-1, respectively (Loeffler et al., 2022). Thus, all samples exceeded the available guidance values. Fish meal remnants from a CP outbreak that occurred in Germany in 2017 were analyzed for C-CTX-1 and CTX1B by LC-MS/MS, and were negative for these two compounds, but positive for CTX-like toxicity by the N2a-bioassay (detailed information in Loeffler et al. (2022)). This example of a negative result by LC-MS/MS when focusing on only two CTX congeners demonstrates the importance of investigating the other CTX congeners including the CTX3C group in CP implicated products as these congeners remarkably contribute to sample toxicity.
This study investigated tissue samples of L. bohar originating from Vietnam and the southwestern coast of India, representing the western Pacific Ocean (FAO 71) and northwestern part of the Indian Ocean (FAO 51), respectively. Despite these regional distances (approx. 4,000 km apart), all samples revealed a similar CTX profile consisting of congeners from the CTX3C-group. Congeners from the CTX4A-group such as CTX1B or 54-deoxyCTX1B or peaks deriving from m/z of reported I-CTX congeners were included in the LC-MS/MS method, but not detected (see Supplementary Table 1, Supplementary Figure 2).
Reports regarding CTX profiles in L. bohar and/or fish from these distinct oceanic regions provide variable results. From the region of Southwest India, Rajeish et al. (2016) and Rajisha et al. (2017) reported ciguatera outbreaks and determined toxicity by MBA. However, a CTX profile description was not available and, thus, reported CTX profiles from the region cannot be compared. From Vietnam, Ha et al. (2018) investigated L. bohar involved in two CP outbreaks. While they checked for CTX4A- and CTX3C-group congeners, only CTX4A-group congeners were detected (i.e., CTX1B, 52-epi-54-deoxyCTX1B, and 54-deoxyCTX1B) with CTX1B being the dominant compound. Therefore, the same species from the same region appears to provide two divergent CTX profiles. L. bohar samples from a Japanese wholesale market were investigated by Oshiro et al. (2021b). In two samples, they found 2,3,51-trihydroxyCTX3C, 2,3-dihydroxyCTX3C and 2-hydroxyCTX3C, but no 51-hydroxyCTX3C. This finding is comparable to the results reported here, albeit from a third distinct region. It is not mentioned whether the authors evaluated the extracts for M-seco-CTX3C as well. All samples revealed the presence of CTX1B, also in absence of CTX3C-group congeners, and this compound showed the highest concentration of the detected congeners in all L. bohar samples (Oshiro et al., 2021b).
Fish flesh of several species implicated with ciguatera cases in Okinawa (Japan) showed a CTX4A-group profile (Yogi et al., 2011). Within the same study, L. bohar from Minamitorishima (Japan) showed a mixed-profile consisting of CTX4A- and CTX3C-group congeners whereas O. punctatus from Miyazaki (Japan) revealed CTX3C-group congeners only (Yogi et al., 2011). O. punctatus caught at Okinawa contained CTX4A-group congeners (Yogi et al., 2014). An investigation on Viti Levu Island (Fiji) showed sampling place dependent CTX profiles with a mixed profile (CTX4A- and CTX3C-group) on the south side and a CTX3C profile on the west side of the island (Oshiro et al., 2021a). These results show that the same fish species can accumulate congeners of different CTX-groups and that a mixed profile (accumulation of congeners from more than one CTX-group) is possible. Consequently, as already pointed out by Oshiro et al. (2021a), the detected CTX-group in fish depends on the Gambierdiscus species being present in the respective waters rather than the fish species.
Detailed information about the occurrence of Gambierdiscus is not available for all regions worldwide. There are no reports about Gambierdiscus along the Indian coast. In waters of the Pakistani coast, G. polynesiensis, G. toxicus, G. belizeanus, and G. australes were found beside Fukuyoa yasumotoi (former G. cf. yasumotoi) (Munir et al., 2011). In this context, the presence of the same species in the region of Indian seems possible. For the south coast of Vietnam (Cau Island, Binh Thuan Province), Roeder et al. (2010) isolated G. toxicus (identification performed using microscopy techniques) which was later re-classified as G. polynesiensis (FAO and WHO, 2020). Thus, G. polynesiensis is likely the common organism (reported so far) for the two regions of interest in this study. The CTX profile of this species was investigated for different strains. It mainly consisted of CTX3C and its 49-epimer as well as M-seco-CTX3C (together approximately 80%, see Figure 5 in Chinain et al. (2010)). CTX4B contributed only 1% to the profile. This congener is the precursor of 54-deoxyCTX1B and CTX1B. The low proportion of CTX4B in G. polynesiensis might be the reason for the non-detection of CTX1B in the samples investigated here.
The CTX profiles determined in this study from the two independent sample sets originating from the western Pacific and northwestern Indian Ocean were indistinguishable, indicating a conserved profile within species among regions. Following the conclusions from Oshiro et al. (2021a) this implies that a single Gambierdiscus species was present at both locations capable of producing the same toxins (i.e., high portions of CTX3C and 49-epiCTX3C) or two distinct Gambierdiscus species can produce an indistinguishable CTX profile among the two regions. For L. bohar samples within each sample set (Pacific or Indian Ocean), the ratios of the single congeners were also similar. This suggests a species-specific metabolism of the CTX congeners ingested, as the food webs are regionally independent. This was also observed in the in vitro study by Ikehara et al. (2017) where S9 liver extracts of different fish species were used. Therein different congener profiles were found to be liver extract dependent. Yogi et al. (2014) reported comparable CTX profiles for the same species collected at the same place over a decadal period, indicating regional profile stability. Oshiro et al. (2022) determined the CTX profile in Variola louti collected from Ryukyu Island (Japan) over three years. The ratio of the detected congeners (CTX1B, 52-epi-54-deoxyCTX1B, 54-deoxyCTX1B) showed a similar consistency as the profiles determined for L. bohar in this study [see Figure S4 in Oshiro et al. (2022)]. Beside the species-specific metabolism, those results suggest that on a small scale a permanent CTX source can be present within a local food web leading to consistent CTX profiles within a species over time.
Within this study, a detailed CTX profile analyses for L. bohar from the larger Indo-West Pacific region including sites from the western Pacific Ocean and the northwestern Indian Ocean was conducted. Both sample sets revealed similar profiles consisting of congeners from the CTX3C-group, indicating a species-specific CTX metabolism as well as a conserved CTX producing Gambierdiscus species source among distinct oceans. These results provide justification for investigating the Gambierdiscus species complex in both regions to further elucidate the CTX producing source. Because of the indistinguishable nature of the CTX profiles among distinct regions, these results also question the importance of regional differentiation for CTX groups, particularly from an analytical point of view, which can lead to a false sense of regional distinction. Gambierdiscus is a recognized cosmopolitan genera, for instance, the species G. australes has been reported in the Atlantic Ocean, Mediterranean Sea, the northern Indian Ocean (Pakistan), and throughout the Pacific Ocean (Japan, Hawaii, and French Polynesia) (detailed overview provided in Tester et al., 2018). Furthermore, other Gambierdiscus species were already reported to occur in different regions (and Ocean basins) worldwide. Therefore, finding CTX3C-group congeners in fish samples from the Indian Ocean, which are indistinguishable from those identified from the western Pacific Ocean, underlines the necessity to screen for all known congeners in CP investigations, without a regional bias on toxin identification. Future studies should investigate samples for the full range of already described CTX congeners and conduct a thorough CTX profile determination in fish species from several trophic levels in known CP regions to gain better insight in the CTX dynamics in marine food webs.
The raw data supporting the conclusions of this article will be made available by the authors, without undue reservation.
AS and CL designed the study, collected, and analyzed the data, AS created the graphics and wrote the original manuscript. AS, CL, and OK edited the manuscript. All authors contributed to the article and approved the submitted version.
The authors declare that the research was conducted in the absence of any commercial or financial relationships that could be construed as a potential conflict of interest.
All claims expressed in this article are solely those of the authors and do not necessarily represent those of their affiliated organizations, or those of the publisher, the editors and the reviewers. Any product that may be evaluated in this article, or claim that may be made by its manufacturer, is not guaranteed or endorsed by the publisher.
The Supplementary Material for this article can be found online at: https://www.frontiersin.org/articles/10.3389/fmars.2022.937438/full#supplementary-material
Abraham A., Jester E. L. E., Granade H. R., Plakas S. M., Dickey R. W. (2012). Caribbean Ciguatoxin profile in raw and cooked fish implicated in ciguatera. Food Chem. 131, 192–198. doi: 10.1016/j.foodchem.2011.08.059
Bottein M.-Y. D., Kashinsky L., Wang Z., Littnan C., Ramsdell J. S. (2011). Identification of ciguatoxins in Hawaiian monk seals Monachus schauinslandi from the northwestern and main Hawaiian islands. Environ. Sci. Technol. 45, 5403–5409. doi: 10.1021/es2002887
Chinain M., Darius H. T., Ung A., Cruchet P., Wang Z., Ponton D., et al. (2010). Growth and toxin production in the ciguatera-causing dinoflagellate Gambierdiscus polynesiensis (Dinophyceae) in culture. Toxicon 56, 739–750. doi: 10.1016/j.toxicon.2009.06.013
Chinain M., Gatti C. M. I., Roué M., Darius H. T. (2020). “"Ciguatera-causing dinoflagellates in the genera gambierdiscus and fukuyoa: Distribution, ecophysiology and toxicology,",” in Dinoflagellates: Morphology, life history and ecological significance. Ed. Rao D. V. S. (New York, NY, USA: Nova Science Publishers, Inc), 405–457.
Dickey R. W. (2008). “"Ciguatera toxins: Chemistry, toxicology, and detection,",” in Seafood and freshwater toxins. Ed. Botana L. M. (Boca Raton: CRC Press), 479–500.
Diogène J., Reverté L., Rambla-Alegre M., Del Río V., de la Iglesia P., Campàs M., et al. (2017). Identification of ciguatoxins in a shark involved in a fatal food poisoning in the Indian ocean. Sci. Rep. 7, 8240. doi: 10.1038/s41598-017-08682-8
Efsa (2010). Scientific opinion on marine biotoxins in shellfish – emerging toxins: Ciguatoxin group. Efsa J. 8, 1627. doi: 10.2903/j.efsa.2010.1627
Estevez P., Castro D., Pequeno-Valtierra A., Leao J. M., Vilarino O., Diogene J., et al. (2019). An attempt to characterize the ciguatoxin profile in Seriola fasciata causing ciguatera fish poisoning in macaronesia. Toxins 11, 221. doi: 10.3390/toxins11040221
Fao, Who (2020). “Report of the expert meeting on ciguatera poisoning. Rome, 19–23 November 2018,” in Food safety and quality no. 9(Rome). Available at: https://doi.org/10.4060/ca8817en
Habibi N., Uddin S., Bottein M.-Y. D., Faizuddin M. (2021). Ciguatera in the Indian ocean with special insights on the Arabian Sea and adjacent gulf and seas: A review. Toxins 13, 525. doi: 10.3390/toxins13080525
Hamilton B., Hurbungs M., Jones A., Lewis R. J. (2002). Multiple ciguatoxins present in Indian ocean reef fish. Toxicon 40, 1347–1353. doi: 10.1016/S0041-0101(02)00146-0
Ha D. V., Uesugi A., Uchida H., Ky P. X., Minh D. Q., Watanabe R., et al. (2018). Identification of causative ciguatoxins in red snappers Lutjanus bohar implicated in ciguatera fish poisonings in Vietnam. Toxins 10, 420. doi: 10.3390/toxins10100420
Ikehara T., Kuniyoshi K., Oshiro N., Yasumoto T. (2017). Biooxidation of ciguatoxins leads to species-specific toxin profiles. Toxins 9, 205. doi: 10.3390/toxins9070205
Kryuchkov F., Robertson A., Miles C. O., Mudge E. M., Uhlig S. (2020). LC–HRMS and chemical derivatization strategies for the structure elucidation of Caribbean ciguatoxins: Identification of c-CTX-3 and -4. Mar. Drugs 18, 182. doi: 10.3390/md18040182
Lewis R. J., Holmes M. J. (1993). Origin and transfer of toxins involved in ciguatera. Comp. Biochem. Physiol. Part C: Pharmacol Toxicol. Endocrinol. 106, 615–628. doi: 10.1016/0742-8413(93)90217-9
Lewis R. J., Norton R. S., Brereton I. M., Eccles C. D. (1993). Ciguatoxin-2 is a diastereomer of ciguatoxin-3. Toxicon 31, 637–643. doi: 10.1016/0041-0101(93)90118-3
Lewis R. J., Sellin M., Poli M. A., Norton R. S., Macleod J. K., Sheil M. M. (1991). Purification and characterization of ciguatoxins from moray eel (Lycodontis javanicus, muraenidae). Toxicon 29, 1115–1127. doi: 10.1016/0041-0101(91)90209-A
Lewis R. J., Vernoux J. P., Brereton I. M. (1998). Structure of Caribbean ciguatoxin isolated from Caranx latus. J. Am. Chem. Soc. 120, 5914–5920. doi: 10.1021/ja980389e
Loeffler C. R., Bodi D., Tartaglione L., Dell'aversano C., Preiss-Weigert A. (2021). Improving in vitro ciguatoxin and brevetoxin detection: selecting neuroblastoma (Neuro-2a) cells with lower sensitivity to ouabain and veratridine (OV-LS). Harmful Algae 103, 101994. doi: 10.1016/j.hal.2021.101994
Loeffler C. R., Spielmeyer A., Blaschke V., Bodi D., Kappenstein O. (2022, preprint). Ciguatera poisoning trace-back in Europe leads to a novel ciguatoxin-3C group characterization from the Indian ocean. doi: 10.21203/rs.3.rs-1715170/v1
Loeffler C. R., Spielmeyer A., Friedemann M., Kapp K., Schwank U., Kappenstein O., et al. (2022). Food safety risk in Germany from mislabeled imported fish: Ciguatera outbreak trace-back, toxin elucidation, and public health implications. Front. Mar. Sci. 9, 849857. doi: 10.3389/fmars.2022.849857
Longo S., Sibat M., Darius H. T., Hess P., Chinain M. (2020). Effects of pH and nutrients (nitrogen) on growth and toxin profile of the ciguatera-causing dinoflagellate Gambierdiscus polynesiensis (Dinophyceae). Toxins 12, 767. doi: 10.3390/toxins12120767
Longo S., Sibat M., Viallon J., Darius H. T., Hess P., Chinain M. (2019). Intraspecific variability in the toxin production and toxin profiles of in vitro cultures of Gambierdiscus polynesiensis (Dinophyceae) from French Polynesia. Toxins 11, 735. doi: 10.3390/toxins11120735
Mak Y. L., Wai T.-C., Murphy M. B., Chan W. H., Wu J. J., Lam J. C. W., et al. (2013). Pacific ciguatoxins in food web components of coral reef systems in the republic of Kiribati. Environ. Sci. Technol. 47, 14070–14079. doi: 10.1021/es403175d
Manger R. L., Leja L. S., Lee S. Y., Hungerford J. M., Hokama Y., Dickey R. W., et al. (1995). Detection of sodium channel toxins: Directed cytotoxicity assays of purified ciguatoxins, brevetoxins, saxitoxins, and seafood extracts. J. AOAC Int. 78, 521–527. doi: 10.1093/jaoac/78.2.521
Manger R. L., Leja L. S., Lee S. Y., Hungerford J. M., Wekell M. M. (1993). Tetrazolium-based cell bioassay for neurotoxins active on voltage-sensitive sodium channels: Semiautomated assay for saxitoxins, brevetoxins, and ciguatoxins. Analytical Biochem. 214, 190–194. doi: 10.1006/abio.1993.1476
Munir S., Siddiqui P. J. A., Morton S. L. (2011). The occurrence of the ciguatera fish poisoning producing dinoflagellate genus Gambierdiscus in Pakistan waters. Algae 26, 317–325. doi: 10.4490/algae.2011.26.4.317
Murata M., Legrand A. M., Ishibashi Y., Fukui M., Yasumoto T. (1990). Structures and configurations of ciguatoxin from the moray eel Gymnothorax javanicus and its likely precursor from the dinoflagellate Gambierdiscus toxicus. J. Am. Chem. Soc. 112, 4380–4386. doi: 10.1021/ja00167a040
Oshiro N., Nagasawa H., Watanabe M., Nishimura M., Kuniyoshi K., Kobayashi N., et al. (2022). An extensive survey of ciguatoxins on grouper Variola louti from the Ryukyu islands, Japan, using liquid chromatography-tandem mass spectrometry (LC-MS/MS). J. Mar. Sci. Eng. 10, 423. doi: 10.3390/jmse10030423
Oshiro N., Tomikawa T., Kuniyoshi K., Ishikawa A., Toyofuku H., Kojima T., et al. (2021a). LC–MS/MS analysis of ciguatoxins revealing the regional and species distinction of fish in the tropical Western pacific. J. Mar. Sci. Eng. 9, 299. doi: 10.3390/jmse9030299
Oshiro N., Tomikawa T., Kuniyoshi K., Kimura K., Kojima T., Yasumoto T., et al. (2021b). Detection of ciguatoxins from fish introduced into a wholesale market in Japan. Food Hygiene Saf. Sci. (Shokuhin Eiseigaku Zasshi) 62, 8–13. doi: 10.3358/shokueishi.62.8
Pottier I., Vernoux J. P., Jones A., Lewis R. J. (2002). Analysis of toxin profiles in three different fish species causing ciguatera fish poisoning in guadeloupe; French West indies. Food Additives Contaminants 19, 1034–1042. doi: 10.1080/02652030210155378
Rajeish M., Shekar M., Madhushree H. N., Venugopal M. N. (2016). Presumptive case of ciguatera fish poisoning in mangalore, India. Curr. Sci. 111, 1543–1547. doi: 10.18520/cs/v111/i9/1543-1547
Rajisha R., Kishore P., Panda S. K., Harikrishnan G., Ajitha K. C., Suresh M. K., et al. (2017). Incidence of ciguatoxin fish poisoning in trivandrum, India. Indian J. Fisheries 64, 129–133. doi: 10.21077/ijf.2017.64.4.71558-20
Randall J. E. (1958). A review of ciguatera, tropical fish poisoning, with a tentative explanation of its cause. Bull. Mar. Sci. 8, 236–267.
Roeder K., Erler K., Kibler S., Tester P., Van The H., Nguyen-Ngoc L., et al. (2010). Characteristic profiles of ciguatera toxins in different strains of Gambierdiscus spp. Toxicon 56, 731–738. doi: 10.1016/j.toxicon.2009.07.039
Satake M., Fukui M., Legrand A.-M., Cruchet P., Yasumoto T. (1998). Isolation and structures of new ciguatoxin analogs, 2,3-dihydroxyCTX3C and 51-hydroxyCTX3C, accumulated in tropical reef fish. Tetrahedron Lett. 39, 1197–1198. doi: 10.1016/S0040-4039(97)10808-5
Satake M., Murata M., Yasumoto T. (1993). The structure of CTX3C; a ciguatoxin congener isolated from cultured Gambierdiscus toxicus. Tetrahedron Lett. 34, 1975–1978. doi: 10.1016/S0040-4039(00)91978-6
Spielmeyer A., Loeffler C. R., Bodi D. (2021). Extraction and LC-MS/MS analysis of ciguatoxins: A semi-targeted approach designed for fish of unknown origin. Toxins 13, 630. doi: 10.3390/toxins13090630
Tester P. A., Wickliffe L., Jossart J., Rhodes L. L., Enevoldsen H., Adachi M., et al. (2018). “Global distribution of the genera Gambierdiscus and Fukuyoa”, in Harmful algae 2018 - from ecosystems to socioecosystems. Ed. Hess P.
Usfda (2021)Fish and fishery products - hazards and controls guidance. In: Food and Drug Administration, Department of Health and Human Services June 2021; fourth edition. Available at: https://www.fda.gov/food/seafood-guidance-documents-regulatory-information/fish-and-fishery-products-hazards-and-controls (Accessed 6th April 2021).
Wong C.-K., Hung P., Lo J. Y. C. (2014). Ciguatera fish poisoning in Hong Kong–a 10-year perspective on the class of ciguatoxins. Toxicon 86, 96–106. doi: 10.1016/j.toxicon.2014.05.006
Yasumoto T., Bagnis R., Thevenin S., Garcon M. (1977a). A survey of comparative toxicity in the good chain of ciguatera. Bull. Japanese Soc. Sci. Fisheries 43, 1015–1019. doi: 10.2331/suisan.43.1015
Yasumoto T., Igarashi T., Legrand A. M., Cruchet P., Chinain M., Fujita T., et al. (2000). Structural elucidation of ciguatoxin congeners by fast-atom bombardment tandem mass spectroscopy. J. Am. Chem. Soc. 122, 4988–4989. doi: 10.1021/ja9944204
Yasumoto T., Nakajima I., Bagnis R., Adachi R. (1977b). Finding of a dinoflagellate as a likely culprit of ciguatera. Bull. Japanese Soc. Sci. Fisheries 43, 1021–1026. doi: 10.2331/suisan.43.1021
Yogi K., Oshiro N., Inafuku Y., Hirama M., Yasumoto T. (2011). Detailed LC-MS/MS analysis of ciguatoxins revealing distinct regional and species characteristics in fish and causative alga from the pacific. Analytical Chem. 83, 8886–8891. doi: 10.1021/ac200799j
Keywords: marine biotoxins, ciguatoxins, ciguatera poisoning, red snapper, LC-MS/MS, N2a-assay
Citation: Spielmeyer A, Loeffler CR and Kappenstein O (2022) Identical Ciguatoxin-3C group profiles in Lutjanus bohar from the Pacific and Indian Oceans - indicating the need to re-evaluate geographical CTX classifications. Front. Mar. Sci. 9:937438. doi: 10.3389/fmars.2022.937438
Received: 06 May 2022; Accepted: 08 July 2022;
Published: 28 July 2022.
Edited by:
Ana R. Díaz-Marrero, Institute of Natural Products and Agrobiology (CSIC), SpainReviewed by:
Bernd Krock, Alfred Wegener Institute Helmholtz Centre for Polar and Marine Research (AWI), GermanyCopyright © 2022 Spielmeyer, Loeffler and Kappenstein. This is an open-access article distributed under the terms of the Creative Commons Attribution License (CC BY). The use, distribution or reproduction in other forums is permitted, provided the original author(s) and the copyright owner(s) are credited and that the original publication in this journal is cited, in accordance with accepted academic practice. No use, distribution or reproduction is permitted which does not comply with these terms.
*Correspondence: Astrid Spielmeyer, YXN0cmlkLnNwaWVsbWV5ZXJAYmZyLmJ1bmQuZGU=
Disclaimer: All claims expressed in this article are solely those of the authors and do not necessarily represent those of their affiliated organizations, or those of the publisher, the editors and the reviewers. Any product that may be evaluated in this article or claim that may be made by its manufacturer is not guaranteed or endorsed by the publisher.
Research integrity at Frontiers
Learn more about the work of our research integrity team to safeguard the quality of each article we publish.