 Wenxue Wu1,2*
 Hongbin Liu2,3
- 1State Key Laboratory of Marine Resource Utilization in South China Sea, Hainan University, Haikou, China
- 2Southern Marine Science and Engineering Guangdong Laboratory, Zhuhai, China
- 3Department of Ocean Science, The Hong Kong University of Science and Technology, Kowloon, Hong Kong SAR, China
Body size is an important ecological trait, but it has been poorly explored in microbial communities. Here, we examined the effect of cell size on coastal eukaryotic communities across a size continuum of 0.2–3 (pico-), 3–20 (nano-), and 20–200 μm (micro-sized), which were characterized via high-throughput sequencing based on the V4 region of the 18S rRNA gene. We found that, at the alpha diversity level, there was a decreasing trend across the pico-, nano-, and micro-sized eukaryotic communities regarding both amplicon sequence variant (ASV) richness and Shannon index. At the beta diversity level, the three categories were significantly different, and these were accompanied by a relatively high local contribution to beta diversity in contrasting freshwater and seawater locations. The community variations observed for the microbial eukaryotes could largely be explained by the environmental effects which decreased between the pico- (40.5%), nano- (37.3%), and micro-sized (27.3%) fractions. These environmental effects were mainly contributed by several ASV modules showing opposing responses to environmental conditions. This might partly indicate the coalescence of the freshwater and seawater groups of microbial eukaryotes. In summary, our findings suggest that the cell size of microbial eukaryotes is a phylogenetically conserved trait, which is tightly associated with biogeographic patterns.
Introduction
Body size is perhaps the most fundamental ecological trait as it is associated with many biological properties. For all marine life, from bacteria to whales, size has several profound effects, for example, on the body temperature, resource encounter strategy (e.g., photosynthesis), mobility, sensing mode (e.g., echolocation), and life history strategy (Andersen et al., 2016). A lot of statistical characteristics, such as biodiversity and abundance across marine taxa, have been basically scaled with body size (Reuman et al., 2014) which represents the most commonly measured trait in ecological studies. As a consequence, size-fractionated categories at the population or community levels often exhibit distinct distributions across space. For example, large cells usually dominate phytoplankton assemblages in estuaries in terms of biomass and production, whereas small cells dominate the open oceans (Cloern, 2018). This is because cell size represents a determinant of phytoplankton metabolism (Marañón, 2015), which is strongly affected by contrasting temperatures (Mousing et al., 2014; López-Urrutia and Morán, 2015) and the supply of resources (Finkel et al., 2010; Marañón et al., 2015) across the marine realms. The phytoplankton size structure principally consists of several categories, which can shift both spatially and temporally in the global oceans (Acevedo-Trejos et al., 2013). Body size is known to be more than simply a trait that controls the physiological characteristics, and it is also relevant for community-level phenomena linking environmental conditions and compositional variations. However, the effect of differences in size is still poorly understood in marine microbial communities, partly due to the complexity of characterizing the various microorganisms.
In recent years, marine microbial eukaryotes (mainly unicellular eukaryotes) (Caron et al., 2009), have been intensively assessed via high-throughput sequencing, and this has generated important information about their taxonomic diversity (Adl et al., 2019) coupled with their diverse ecological functions. For example, research indicates that Syndiniales (Dinoflagellata, Alveolata) are mainly intracellular parasites or symbionts (Guillou et al., 2008), and Dinophyceae (Dinoflagellata, Alveolata) are of a mixotrophic nature, feeding on other microbial eukaryotes such as Bacillariophyta (Ochrophyta, Stramenopiles; also known as diatoms) (Grattepanche et al., 2011). Bacillariophyta are major primary producers (Malviya et al., 2016), while MAST (MArine STramenopiles) are bacterivorous heterotrophs (Massana et al., 2014). Mamiellophyceae, Chlorophyceae, and Trebouxiophyceae (Chlorophyta, Archaeplastida) are representative autotrophic microalgae in coastal waters (Tragin and Vaulot, 2018), and Basidiomycota (Fungi, Opisthokonta) are described as being an amoebophagous group (Corsaro et al., 2018; Grossart et al., 2019). These complex trophic roles of microbial eukaryotes support the suggestion that they represent pivotal players in marine biogeochemical processes (Worden et al., 2015).
Marine microbial eukaryotes exhibit a wide spectrum of cell sizes, which span more than five orders of magnitude (Caron et al., 2012), and they show distinct biogeographic patterns among the different size-based categories (Sommeria-Klein et al., 2021). At the alpha diversity level, the smaller-sized fractions in general have higher estimates of diversity indices. For example, the smallest size fraction (i.e., pico-sized) often shows the highest richness (de Vargas et al., 2015). However, it is still unclear whether there is a size-dependent trend in alpha diversity across a fine size scale. At the beta diversity level, due to the vast differences in richness and taxonomy, size-fractionated microbial eukaryotes are (as expected) distinct from each other (Massana et al., 2015; Xu et al., 2020). Microbial eukaryotes of different sizes are supposed to have different traits (at least regarding the cell size), efficiently indicating niche differentiations, which can be further realized by environmental adaptions (Caron et al., 2012). Their community variations (beta diversity) are anticipated to be driven by environmental effects by different amounts (Clarke and Deagle, 2020). Therefore, size-based comparisons offer a more comprehensive understanding of marine microbial eukaryotes than considering them as a biological pool.
In this study, we focused on size-fractionated microbial eukaryotes in the Pear River Estuary, located in the northern South China Sea. This estuary connects rivers, tidal wetlands, and continental shelves comprising a coastal ocean with unique and changing biogeochemical cycles (Bauer et al., 2013). In particular, the Pear River Estuary harbors typical coastal waters, which exhibit large environmental gradients within a small geographical area. For example, salinity is one of the strongest barriers for organisms within the eukaryotic tree of life to cross (Jamy et al., 2022). This likely explains the big changes in biogeographic patterns of microbial eukaryotes that occur in the coastal waters. The data we acquired in this new estuarine region survey, when combined with those from previous studies conducted in the upper Pearl River Delta (Zou et al., 2021), Pearl River-South China Sea Continuum (Wu and Liu, 2018), and offshore South China Sea (Wang et al., 2021), will together provide a more complete picture of the microbial eukaryotic communities in this region. Moreover, size-fractionated microbial eukaryotes have previously been investigated in some isolated coastal locations (Massana et al., 2015; Genitsaris et al., 2016; Elferink et al., 2020); however, they have not been well documented via a fine sampling design over an entire estuary. We collected microbial eukaryotic communities during the summer season across a size continuum of 0.2–3 μm (pico-sized eukaryotes, PE), 3–20 μm (nano-sized eukaryotes, NE), and 20–200 μm (micro-sized eukaryotes, ME). We characterized these three categories using high-throughput sequencing of the V4 region of the 18S rRNA gene, and as mentioned above, we tested whether there was a decreasing trend of alpha diversity at this fine scale (i.e., from PE, NE to ME) and whether the strength of the environmental effects driving beta diversity was strong and varied across the size continuum. We conclude that this study contributes to the long-standing task of understanding the biodiversity of marine eukaryotes from a trait-based perspective.
Materials and methods
Sample collection and environmental factor
Sampling was carried out on 10–21 July 2017 in a summer cruise supported by the OCEAN-HK project. Field seawater samples were collected from the surface (i.e., at a depth of 1 m) and bottom (i.e., depths of 6–48 m at 1–6.1 m above the sediment) layers at 19 stations (Figure 1), using Niskin bottles mounted on an SBE 32 carousel water sampler (Sea-Bird Electronics, Bellevue, WA, USA). For the molecular analyses, seawater (350–1000 ml) was immediately pre-filtered through a 200-μm mesh and then sequentially through 20 μm, 3 μm, and 0.2 μm pore-sized polycarbonate membranes (47 mm diameter, Millipore, Carrigtwohill, Cork, Ireland). Cells retained on the 20 μm, 3 μm, and 0.2 μm filters represented the collections of ME, NE, and PE, respectively. The filters were kept at –20°C onboard and then frozen at –80°C in the laboratory until required for analysis.
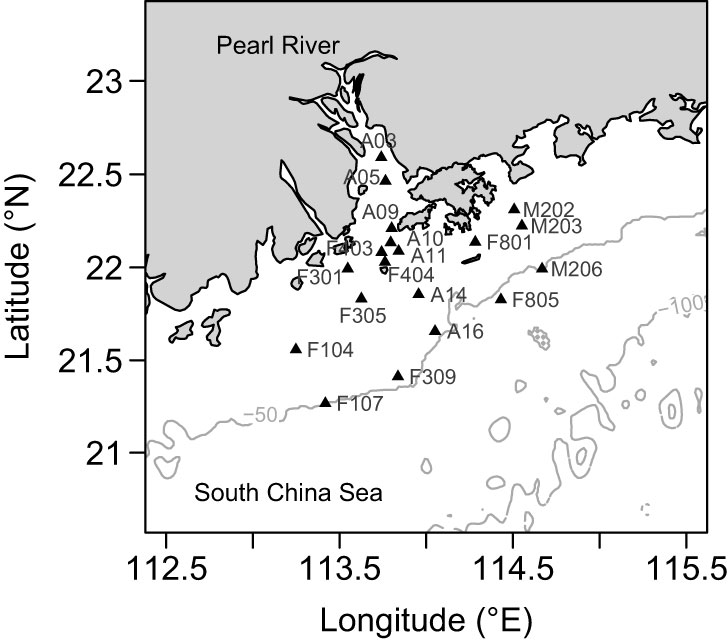
Figure 1 Map showing the sampling sites (indicated by filled triangles) in the Pearl River Estuary located in the northern South China Sea.
Temperature, salinity, and turbidity were measured at all 19 sites using a conductivity-temperature-depth (CTD) profiler. Chlorophyll a was extracted in 90% acetone and quantified fluorometrically with a Turner Designs fluorometer (Turner Designs, Sunnyvale, CA, USA). The concentration of dissolved oxygen was determined by the Winkler titration method, and nutrients (including NO2, NO3, PO4 and SiO3), dissolved organic carbon, and total suspended matter were all measured using standard protocols, as described in previous studies (Dai et al., 2009; Han et al., 2012). More details of the environmental factors measured are also as described previously (Wu et al., 2021).
DNA extraction and amplification
Each filter was cut into small pieces using sterile scissors and then each piece was transferred to a 2 ml tube provided in the FastDNA Spin Kit (MP Biomedicals, Solon, OH, USA). The pieces of filter were vortexed in a mixture of 978 μl sodium phosphate buffer and 122 μl MT buffer, at a speed of 3,500 oscl min–1 using a Mini-Beadbeater-24 (Biospec Products, Bartlesville, OK, USA). DNA was then extracted from the filter pieces following the FastDNA Spin Kit manufacturer’s protocol.
The hypervariable V4 region of the 18S rRNA gene was amplified using the following primer pair: TAReuk454FWD1 (5′-CCAGCA(G/C)C(C/T)GCGGTAATTCC-3′) and TAReukREV3 (5′-ACTTTCGTTCTTGAT(C/T)(A/G)A-3′), with a dual-index strategy (Stoeck et al., 2010). Each polymerase chain reaction (PCR) mixture (50 μl) contained 1× PCR buffer, 1.5 mM MgCl2, 0.2 mM dNTP mix, 0.5 μM each primer, 2 U Invitrogen Platinum Taq DNA polymerase (Life Technologies, Carlsbad, CA, USA), and 2.5 μl of template DNA. In general, the reaction was run under the following conditions: 95°C for 5 min, and then 35 cycles at 94°C for 30 s, 47°C for 45 s, and 72°C for 1 min, with a final extension step at 72°C for 5 min. However, since many of the ME samples failed to be amplified with 35 cycles, 40 cycles were used for the PCR amplification of them. We assessed the data from 14 samples that were successfully amplified by both 35 and 40 cycles (Supplementary Table 1). We showed that there were no significant differences (p > 0.05) at the alpha diversity level by the nonparametric Kruskal-Wallis H test (Kruskal and Wallis, 1952) (Supplementary Figure 1), or at the beta diversity level by analysis of similarity (ANOSIM) when comparing these 35- and 40-cycle groups. In addition, four ME samples were not successfully amplified even when using the modified 40-cycle protocol, and so these were replaced by filters immersed in RNAlater, which had been simultaneously collected in the same locations and water depths (Supplementary Table 1). All the products were sequenced on a HiSeq 2500 platform (Illumina, San Diego, CA, USA) with a (2 × 250 bp) paired-end strategy.
Sequence processing
Sequence data were de-multiplexed using the QIIME 2 (v. 2019.1.0) bioinformatics platform (Bolyen et al., 2019) and trimmed using cutadapt (Martin, 2011). Sequences were then quality filtered and dereplicated with DADA2 (Callahan et al., 2016) implemented in the QIIME 2 pipeline. Amplicon sequence variants (ASVs) were identified, and their taxonomies were assigned using the BLAST+ consensus classifier (Camacho et al., 2009; Bokulich et al., 2018) against the PR2 database (v. 4.12) (Guillou et al., 2013). Singletons, metazoa, and sequences unsuccessfully assigned at least at rank 2 in PR2 (e.g., Alveolata, Stramenopiles, Archaeplastida and Opisthokonta) were removed from the subsequent analyses. The ASV representatives were aligned using MAFFT (Katoh and Standley, 2013) and a phylogenetic tree was built using FastTree (Price et al., 2010).
Alpha diversity
The numbers of ASVs found across the PE, NE, and ME were illustrated with a Venn diagram, based on the full ASV-sample table. To compare alpha diversity among the three categories, the ASVs in each sample were counted using a rarified ASV-sample table (4,982 sequences per sample). The Shannon index (Shannon, 1948) was also calculated for each sample using this rarified table. For both the observed ASV numbers and Shannon indices, the nonparametric Kruskal-Wallis H test was used to examine differences among the PE, NE, and ME.
Fraction-inferred size analysis
To differentiate between the ASV proportions in the PE, NE, and ME, we defined a fraction-inferred size (FIS) index. For the FIS calculation, the full (non-rarified) ASV table was proportionally normalized and rare ASVs (average proportion <0.001% in all 114 communities) were not included. For a given ASV, we recorded its average proportions in the PE, NE, and ME, for which we gave a size weight of 1, 2, and 3, respectively. The FIS was calculated as the sum of the fraction classification-weighted proportions. The observed FIS values ranged between 1 and 3, indicating a fraction-inferred size from smaller to larger. The phylogenetic placements of the FIS index were combined through a FastTree using the ggtree package (Yu et al., 2017) in R (R Core Team, 2018). The phylogenetic signal was further analyzed using Pagel’s λ index (Pagel, 1999) with the phytools package (method = ‘lambda’) (Revell, 2012). The phylogenetic signal measure (λ) ranged between 0 and 1, indicating the extent by which a trait’s correlations among closed related ASVs matched the motion model of evolution. The p-value for λ was based on a likelihood ratio test. Given a significant phylogenetic signal, the FIS index could be assumed to indicate a set of synthesized traits associated with size (Salazar et al., 2015; Mestre et al., 2018).
Beta diversity
For beta diversity among the PE, NE, and ME, we used the unweighted and weighted UniFrac index (Lozupone and Knight, 2005). The UniFrac dissimilarities were then analyzed by principal coordinate analysis (PCoA), and ANOSIM was used to test the significance of community dissimilarities among the three categories (999 permutations).
To identify where community dissimilarities occurred intensively, we calculated the local contribution to beta diversity (LCBD) index (Legendre and De Cáceres, 2013), using the adespatial package (Dray et al., 2022). We performed a principal component analysis (PCA) using standardized environmental factors, and the first axis (PC 1) was used as a proxy of the overall environments. Salinity, as the most representative variable (Wu et al., 2021), was positively and significantly correlated with the PC 1 measurements (Spearman’s rank correlation coefficient r = 0.98, p < 0.05). The chlorophyll a concentration was not included when performing the PCA, because this (biotic) factor did not belong to typical physical and chemical parameters. The relationship between the LCBD values and PC 1 was tested using generalized additive models implemented in the mgcv package (Wood, 2011).
Variation partitioning
To examine pure environmental effects apart from spatial autocorrelation, we performed variation partitioning using the vegan package (Oksanen et al., 2018). It is well known that proportional (abundance-weighted) metrics mirror more environmental condition information than unweighted ones, and so the weighted UniFrac distance was used to account for community variations in this analysis. The environmental variables (excluding chlorophyll a) were standardized, and spatial distances were transformed to principal coordinates of neighbor matrices (PCNM) using the pcnm function. The relative importance of the environmental and spatial factors was determined using the varpart function, and significance was tested using distance-based redundancy analyses (999 permutations).
In addition, the permutational multivariate analysis of variance (PERMANOVA) was carried out using the adonis function (999 permutations) implemented in the vegan package to further identify the relationship between a particular environmental variable and community variations. Consistent with the variance partitioning analysis, the weighted UniFrac distances and standardized environmental variables were used.
Co-occurrence network analysis
To identify clusters contributing to community variations, we constructed co-occurrence networks using the igraph package (Csárdi and Nepusz, 2006). Prior to network construction, ASVs present in at least five sites were included to ensure the regional representativeness of the resulting co-occurrence relationships. In brief, robust co-occurrence relationships of pairwise ASVs (p < 0.01, r > 0.8, Spearman’s rank correlation coefficient) were retained to build the networks. In the resulting networks, each node represented an ASV, each edge represented the significantly positive or negative coexistence of two nodes, and the number of connections for each node represented its degree. Modules (i.e., clusters) in networks were inferred using a fast-greedy algorithm (Clauset et al., 2004). The co-occurrence networks were visualized using the interactive Gephi platform (Bastian et al., 2009).
The environmental effects within network modules were further examined. Nodes in the same module were expected to show similar or dissimilar responses to environmental conditions given significantly positive or negative co-occurrence relationships, respectively. Although it is generally accepted that the co-occurrence network can partly reveal biotic interactions among nodes (Fuhrman et al., 2015), our examinations primarily focused on the co-occurrence patterns themselves rather than biotic interactions due to several cautionary challenges (Röttjers and Faust, 2018). We then paid more attention to modules showing >10% contributions to the total degrees. We calculated the Spearman’s rank correlations between the PC 1 (inferred from PCA) and regional patterns of each ASV in a module. It was anticipated that significant (p < 0.05) and non-significant (p > 0.05) correlations would be detected in ASVs linked to environmental factors either directly (e.g., autotrophs) or indirectly (e.g., parasitic groups), respectively. Consequently, the former would uncover a series of ASVs responsible for environmental effects inferred from the variation partitioning analyses above.
Results
Library characterization and alpha diversity
A total of 5,816,445 sequences (4,982–79,400 per sample) were retrieved from 114 microbial eukaryotic communities. Regarding the relative abundances, Alveolate, Stramenopiles, Archaeplastida, and Opisthokonta represented the four most abundant supergroups with an average abundance of 36.9%, 26.1%, 22.5%, and 9.7%, respectively. The PE, NE, and ME categories showed opposite trends of regional relative abundances (mean ± SD) of Alveolate (i.e., PE, 45.8 ± 20.2%; NE, 35.3 ± 17.7%; and ME, 29.5 ± 15.3%) and Stramenopiles (i.e., PE, 9.3 ± 4.8%; NE, 25.6 ± 14.1%; and ME, 43.5 ± 23.4%) (Figure 2A). With regard to the average relative abundances roughly at the class level (i.e., rank 4 in the PR2 database), Syndiniales, Dinophyceae, Bacillariophyta, Chlorophyceae, Trebouxiophyceae, and Basidiomycota were the six groups with an average relative abundance >5% in the 114 communities (Supplementary Table 2).
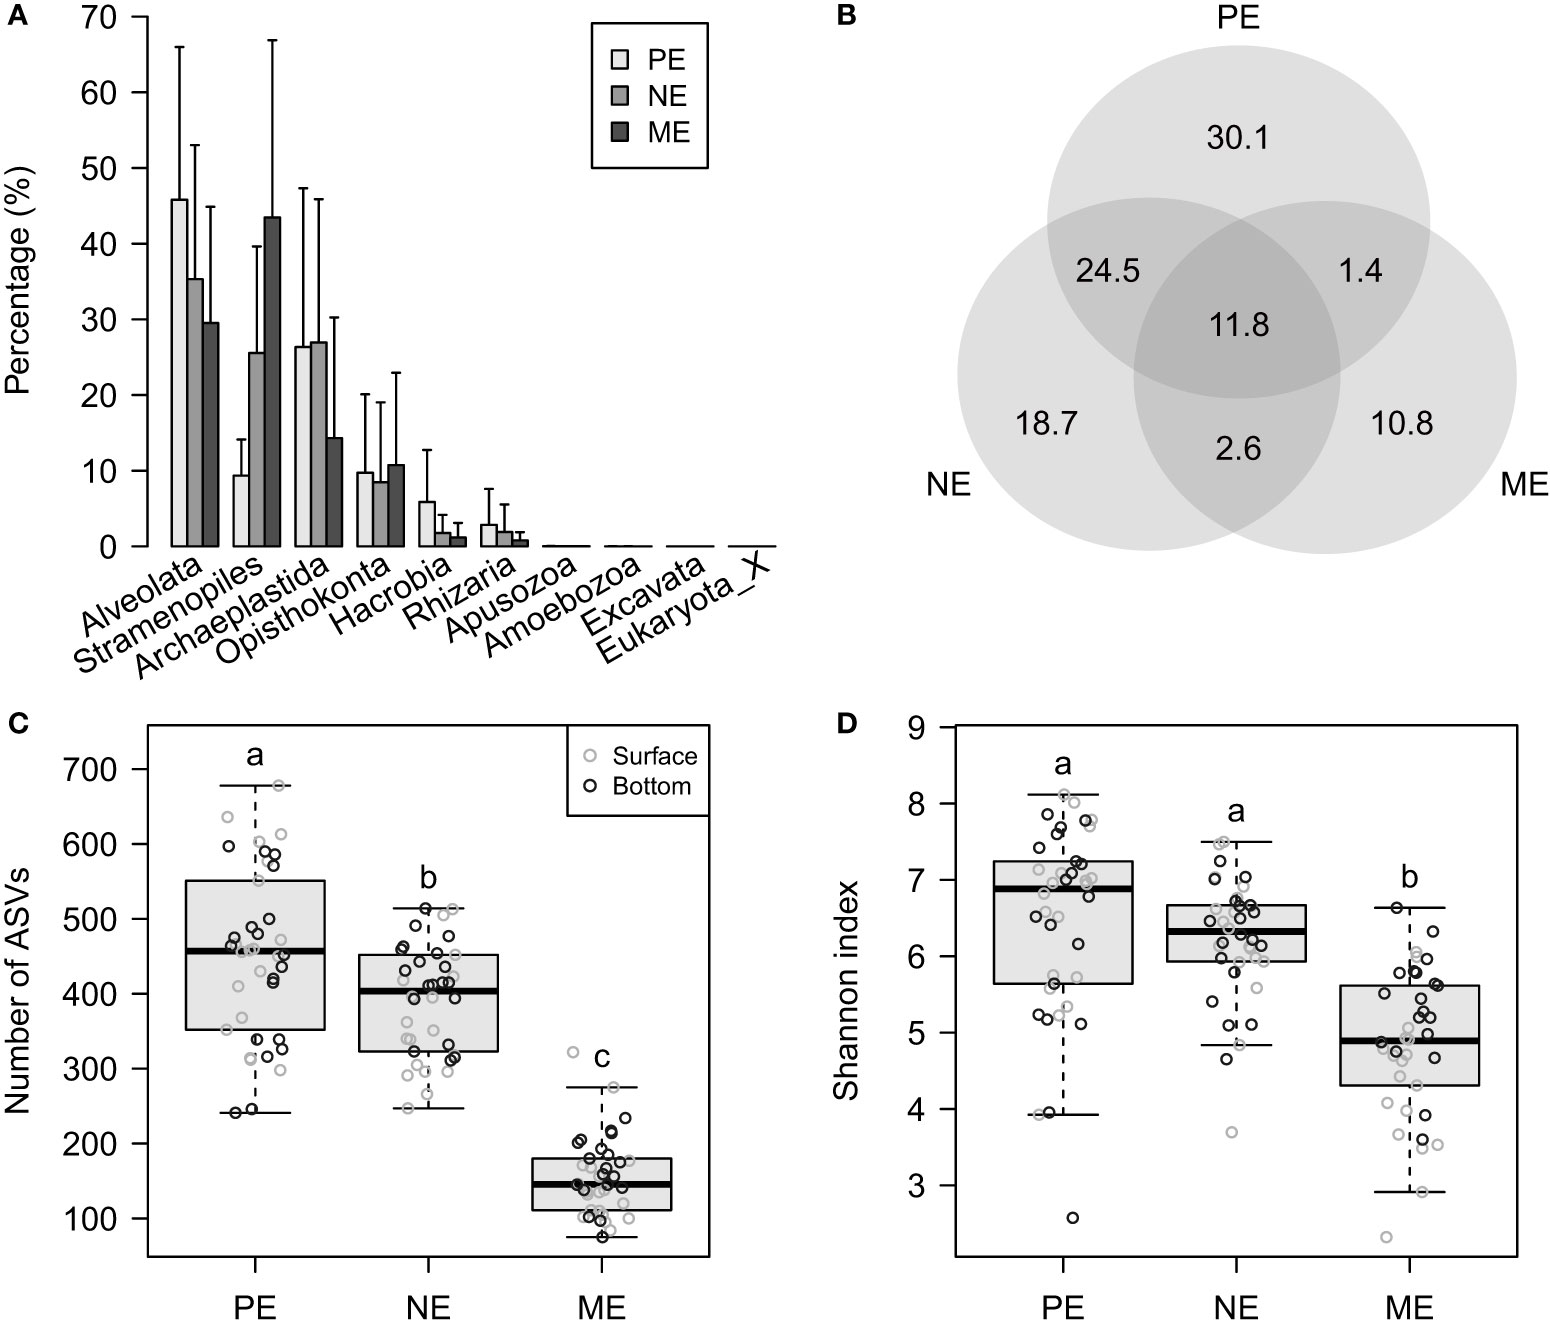
Figure 2 (A) Bar graph showing the percentage mean (and standard deviation) relative abundance of the various supergroups, based on the full ASV-sample table. (B) Venn diagram showing the percentage of ASVs that are unique in, and shared among, the PE, NE, and ME categories. (C, D) Boxplots showing the (C) observed ASV numbers and (D) Shannon indices using the rarified ASV-sample table. In (C) and (D), the letters above each boxplot indicate significant differences at p < 0.05.
The total sequences grouped into 7,011 ASVs, and the PE, NE, and ME accounted for decreasing unique proportions of 30.1%, 18.7%, and 10.8%, respectively (Figure 2B). Based on the ASV table rarified to 4,982 sequences per sample, we found that the ASV richness (i.e., the number of observed ASVs) significantly decreased from the PE-to-NE-to-ME (p < 0.05) (Figure 2C). However, there were no significant differences in the Shannon index between the PE and NE (p > 0.05) (Figure 2D), even though the PE had a higher mean than the NE.
FIS
The phylogenetic signal was strong (λ = 0.85) and significant (p < 0.001), indicating that cell size was a phylogenetically constrained trait of microbial eukaryotes. For this reason, ASVs with close phylogenetic placements showed approximate FIS calculations and a similar presence in the PE, NE, and ME (Figure 3A). The distribution of the FIS index displayed a high frequency density of 1, 2, and 3 (Figure 3B), which indicated the presence of unique ASVs in the PE, NE, and ME, respectively. At the rough phylum or class level, some clusters showed consistently distinct FIS values (Figure 3C). For example, Perkinsea mainly consisted of taxa of low FIS values, whereas Streptophyta generally included ASVs of high FIS.
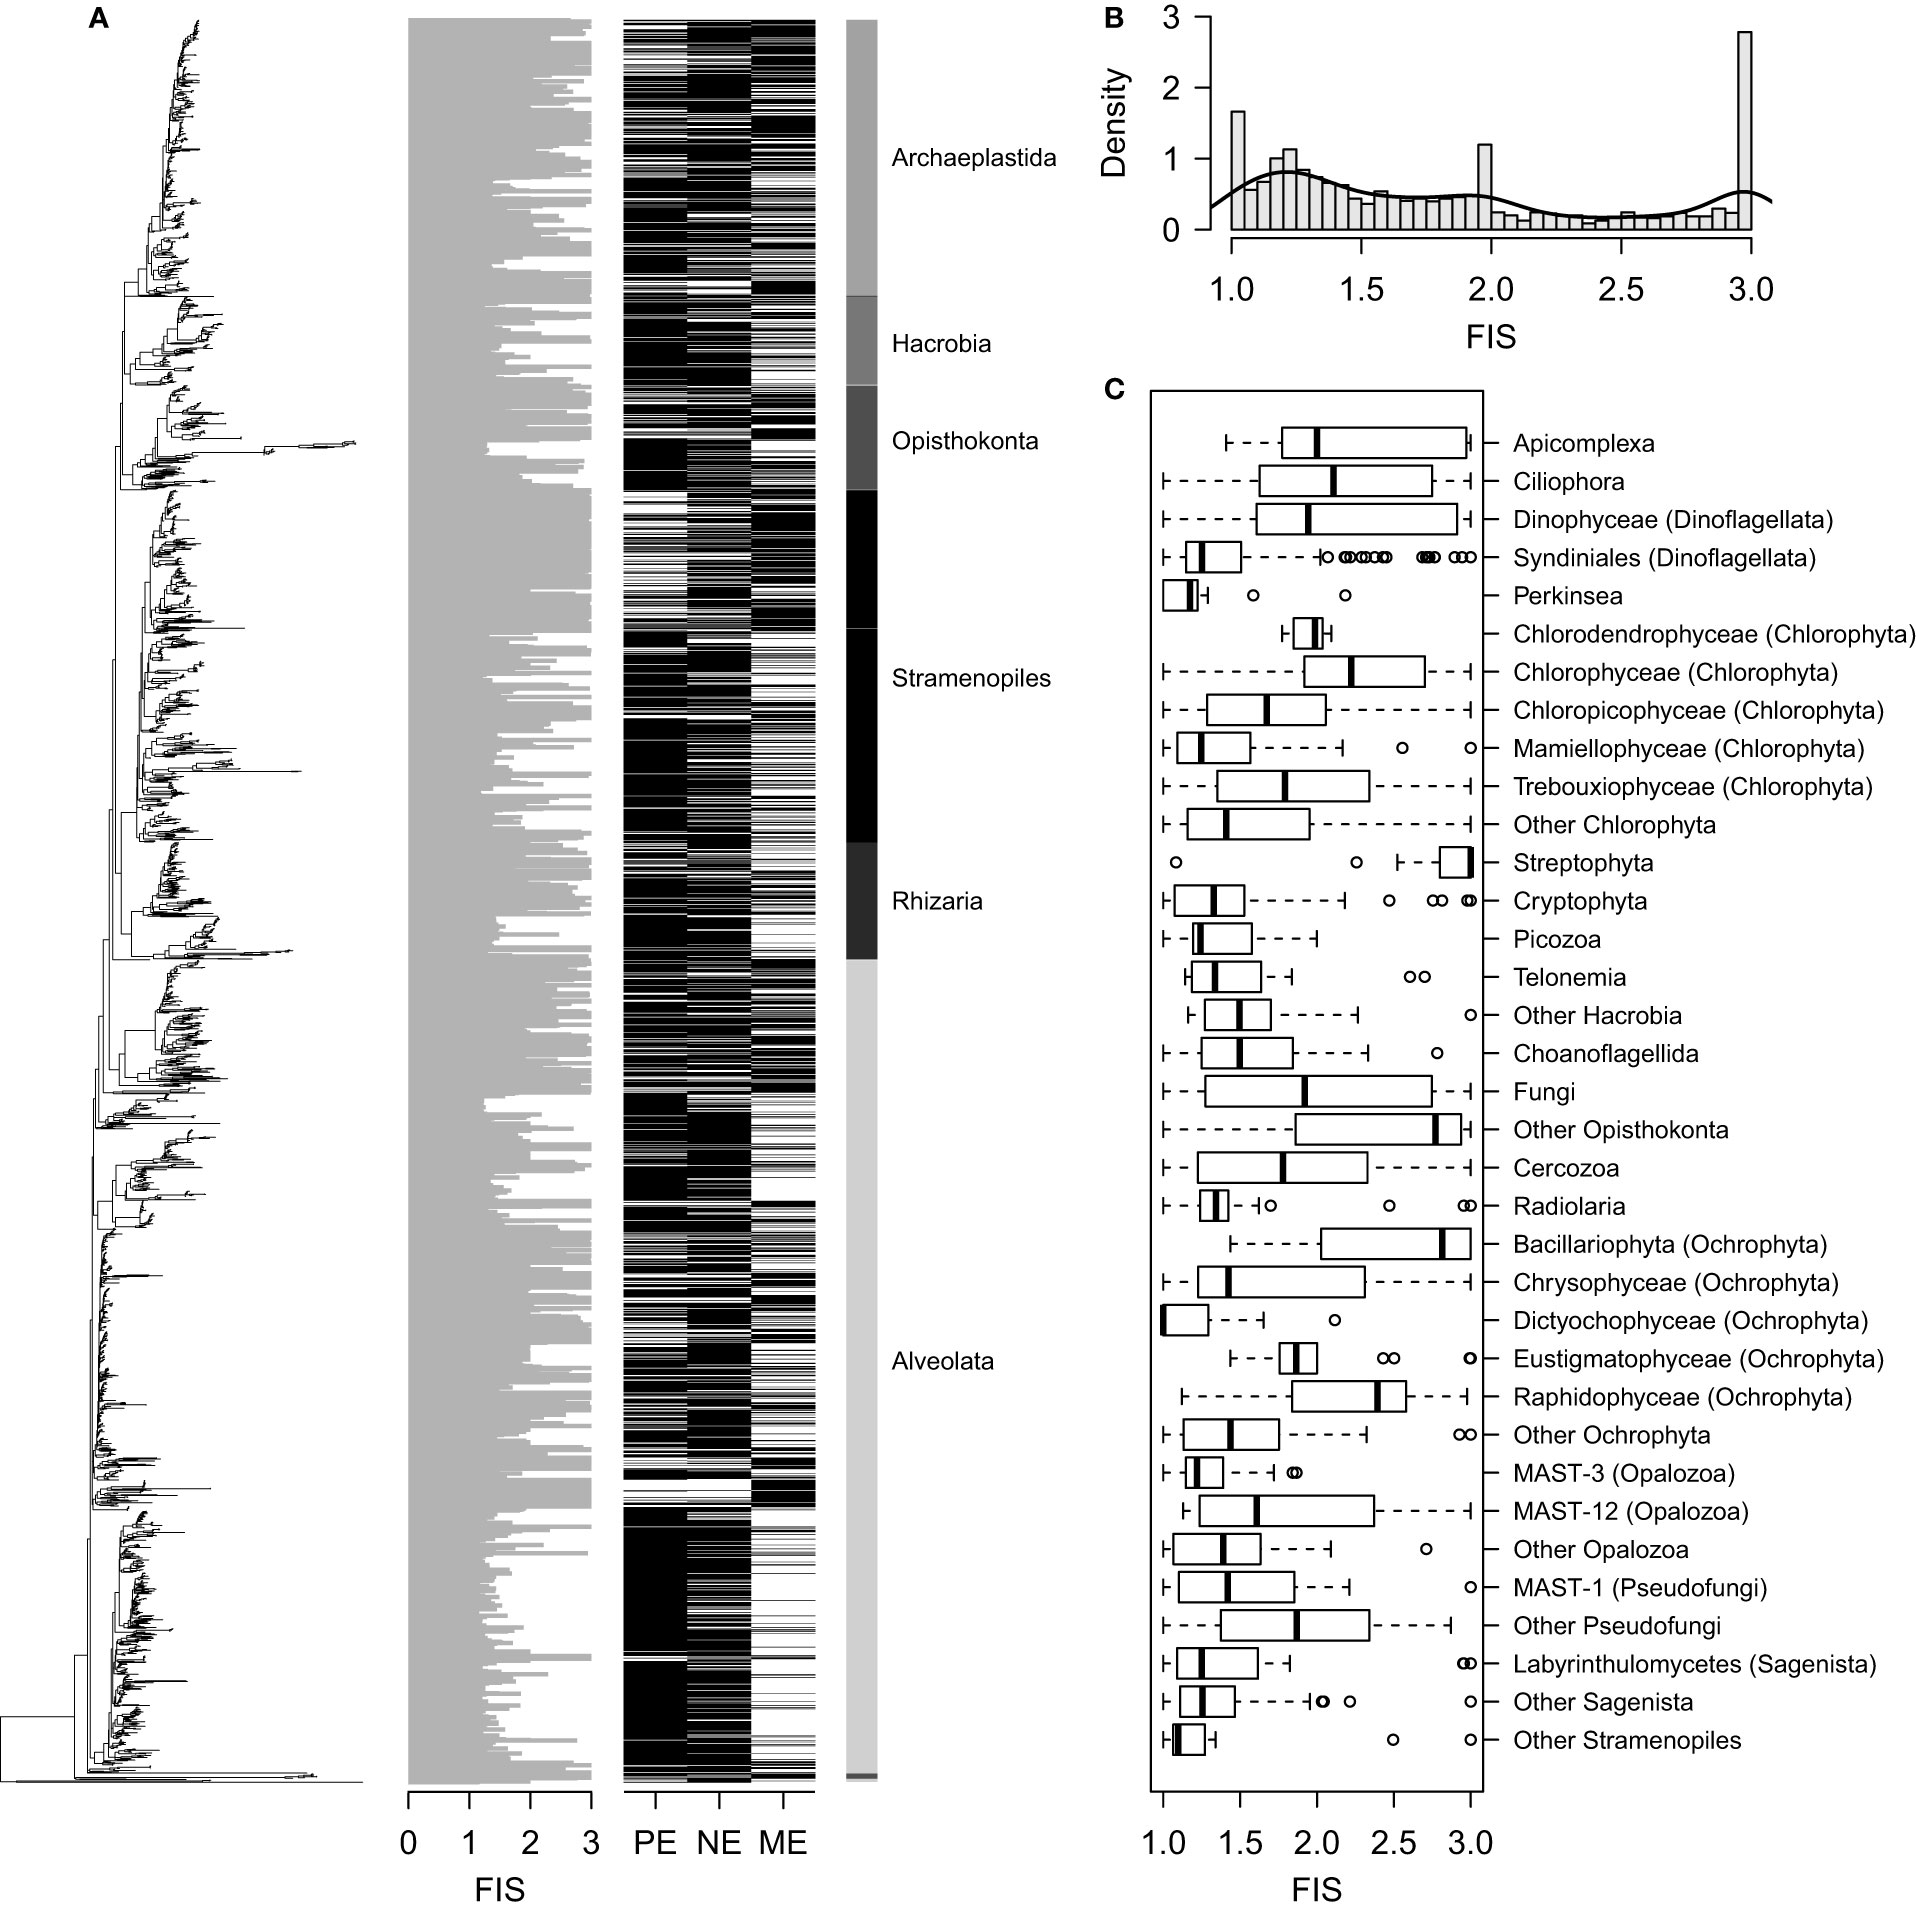
Figure 3 (A) Phylogenetic placement of the fraction-inferred size (FIS) index combined with a heatmap showing the ASV occurrence (indicated by the black bars) in each category. Taxonomic assignments at the supergroup level are added on the right side of the heatmap. (B) Histogram showing the distribution of the FIS index. The line indicates kernel density estimates for the FIS frequency. (C) Boxplots indicating the FIS index for the main lineages (generally collapsed at ranks 3 and 4 of the PR2 database). One Dinoflagellata ASV (FIS = 1.3), which could not be further assigned to a lower taxonomic level (e.g., Syndiniales and Dinophyceae), and the Amoebozoa and Apusozoa supergroups, consisting of just one (FIS = 1.2) and two (FIS = 1.2 and 1.6) ASVs, respectively, were not included in the boxplots.
Beta diversity and relative importance of environmental effects
The PE, NE, and ME were significantly different at the beta diversity level, according to the ANOSIM test (p < 0.001). However, these three categories were not separate from each other in the PCoA plots based on either unweighted or weighted UniFrac dissimilarities (Figure 4).
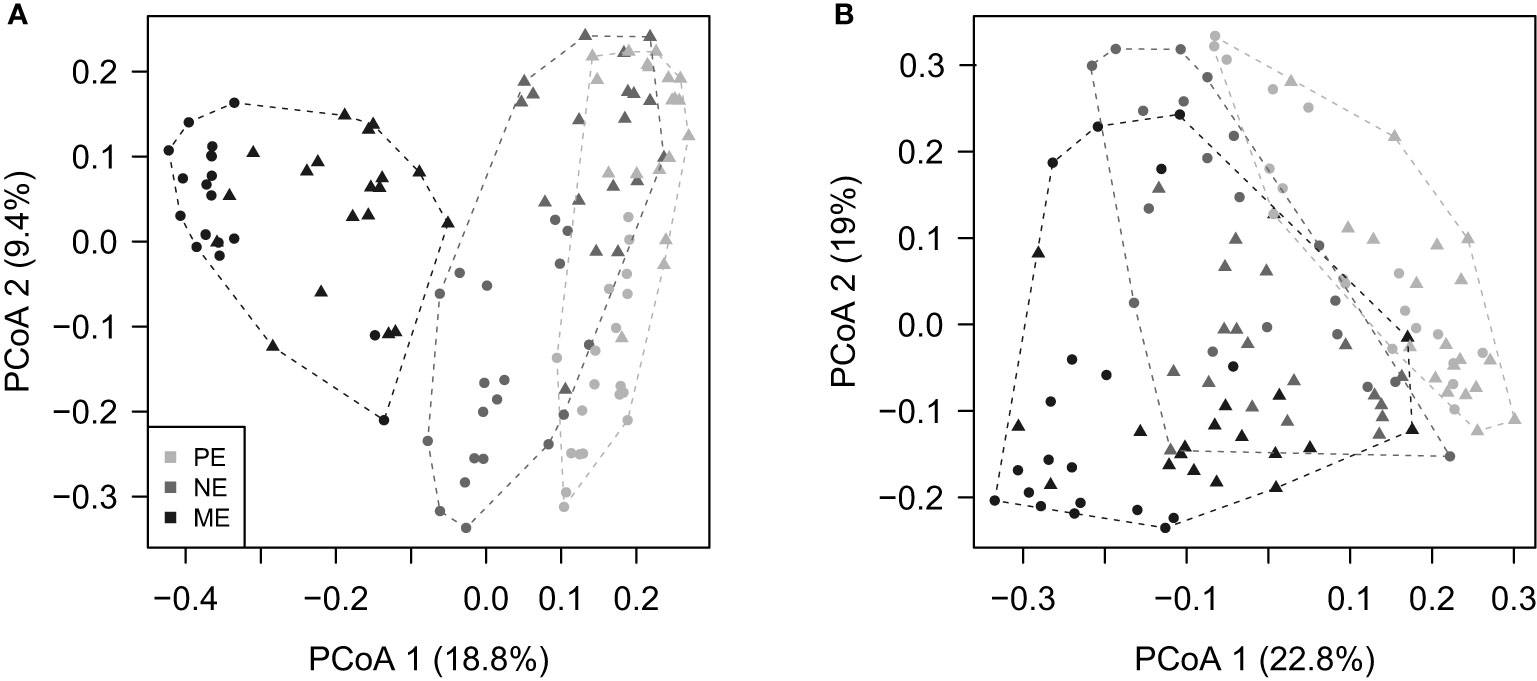
Figure 4 Principal coordinate analysis (PCoA) plots based on (A) unweighted and (B) weighted UniFrac distances showing the beta diversity patterns of the PE, NE, and ME categories. The dashed lines surrounding the symbols (i.e., the filled circles indicating surface samples, and filled triangles indicating bottom samples) delineate the convex hull for each category and are drawn in the same color.
Moreover, the LCBD values in general showed a U-shaped curve against PC 1 which indicated an environmental transition from low- to high-salinity (Figure 5). Therefore, the two ends of the freshwater- and seawater-like habitats were the main contributors to the community variations in the Pear River Estuary.
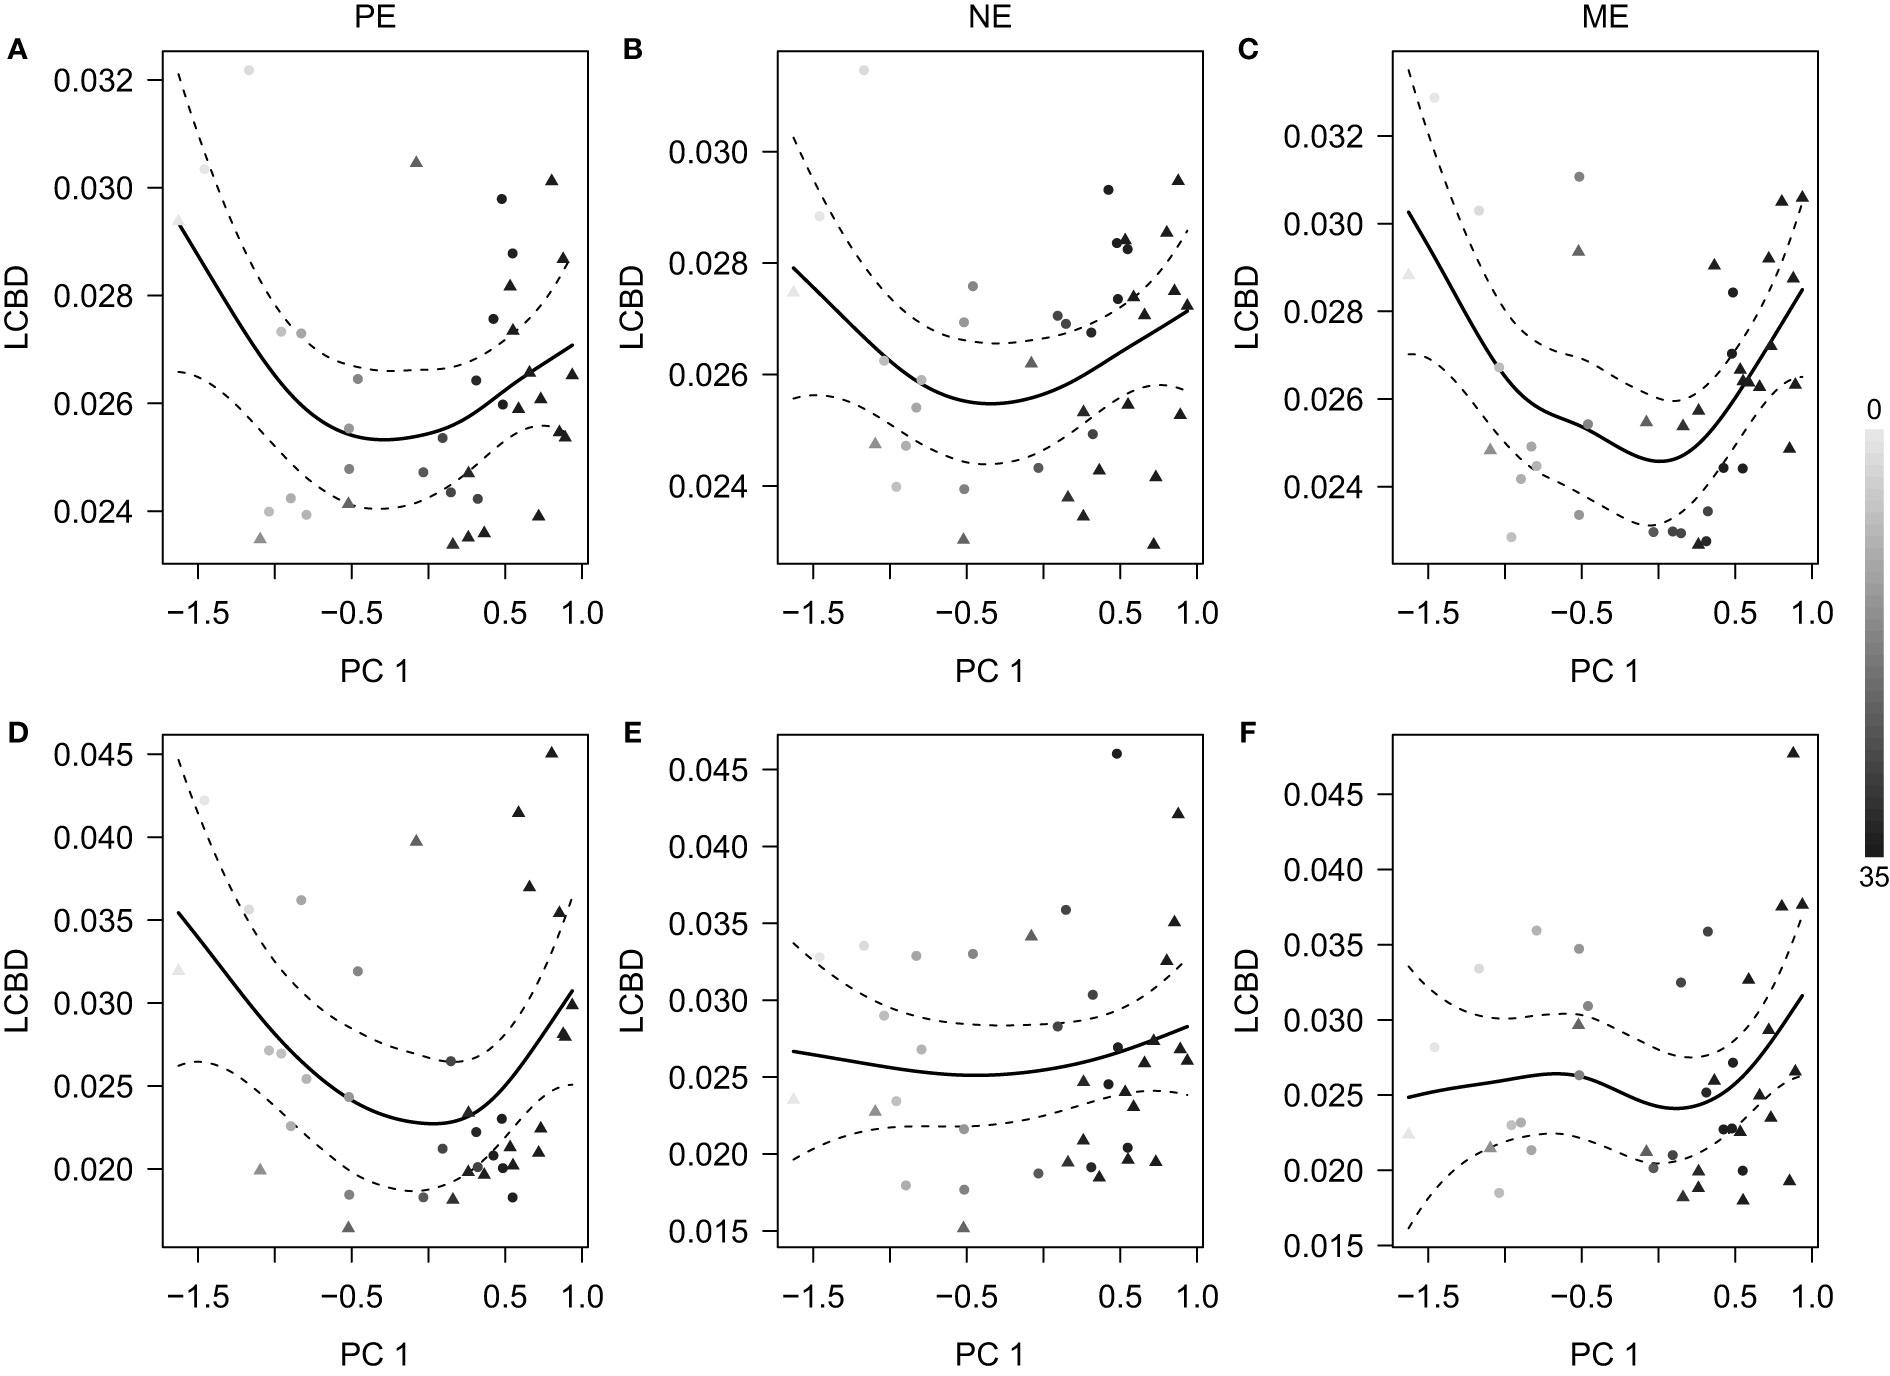
Figure 5 Relationship between the local contribution to beta diversity (LCBD) estimates and the first axis of the principal component analysis of environmental factors (PC 1). Panels (A–C) and (D–F) are results based on the unweighted and weighted UniFrac distances, respectively, for the (A, D) PE, (B, E) NE, and (C, F) ME categories. The fitted smoothers (solid lines with 95% confidence intervals) were predicted using generalized additive models. The shades of symbols (filled circles, surface samples; filled triangles, bottom samples) indicate the local salinity at each station.
Significant environmental effects on beta diversity were also detected. Based on weighted UniFrac dissimilarities, a purely relative importance of 40.5%, 37.3%, and 27.3% was observed for the PE, NE, and ME, respectively (Figure 6). In parallel, the spatial effects were much lower, and even non-significant in the ME fraction.
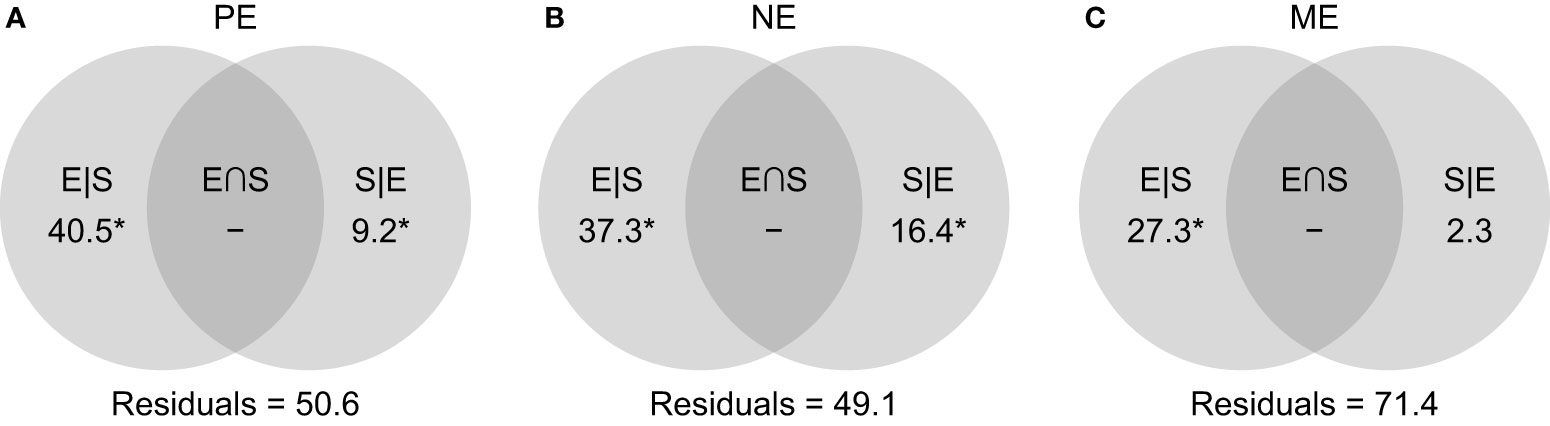
Figure 6 Venn diagrams showing the proportions of variations (in %) explained by shared (E∩S), as well as the unique effects of environmental (E|S) and spatial factors (S|E) for the (A) PE, (B) NE, and (C) ME categories. Negative values are indicated by ‘–’, and significant effects (p < 0.05) are marked with an asterisk.
Co-occurrence pattern
Microbial eukaryotes mostly exhibited positive relationships in co-occurrence patterns (Figures 7A–C), and there were three, three, and one modules showing >10% contributions to total degrees in the PE, NE, and ME networks, respectively. The ASVs belonging to each module showed variable taxonomic compositions (Figures 7D–F) and relationships related to environmental conditions (Figures 7G–I). Remarkably, the PE and NE each displayed one module composed of ASVs showing a significant linear regression relationship between degrees and correlation coefficients.
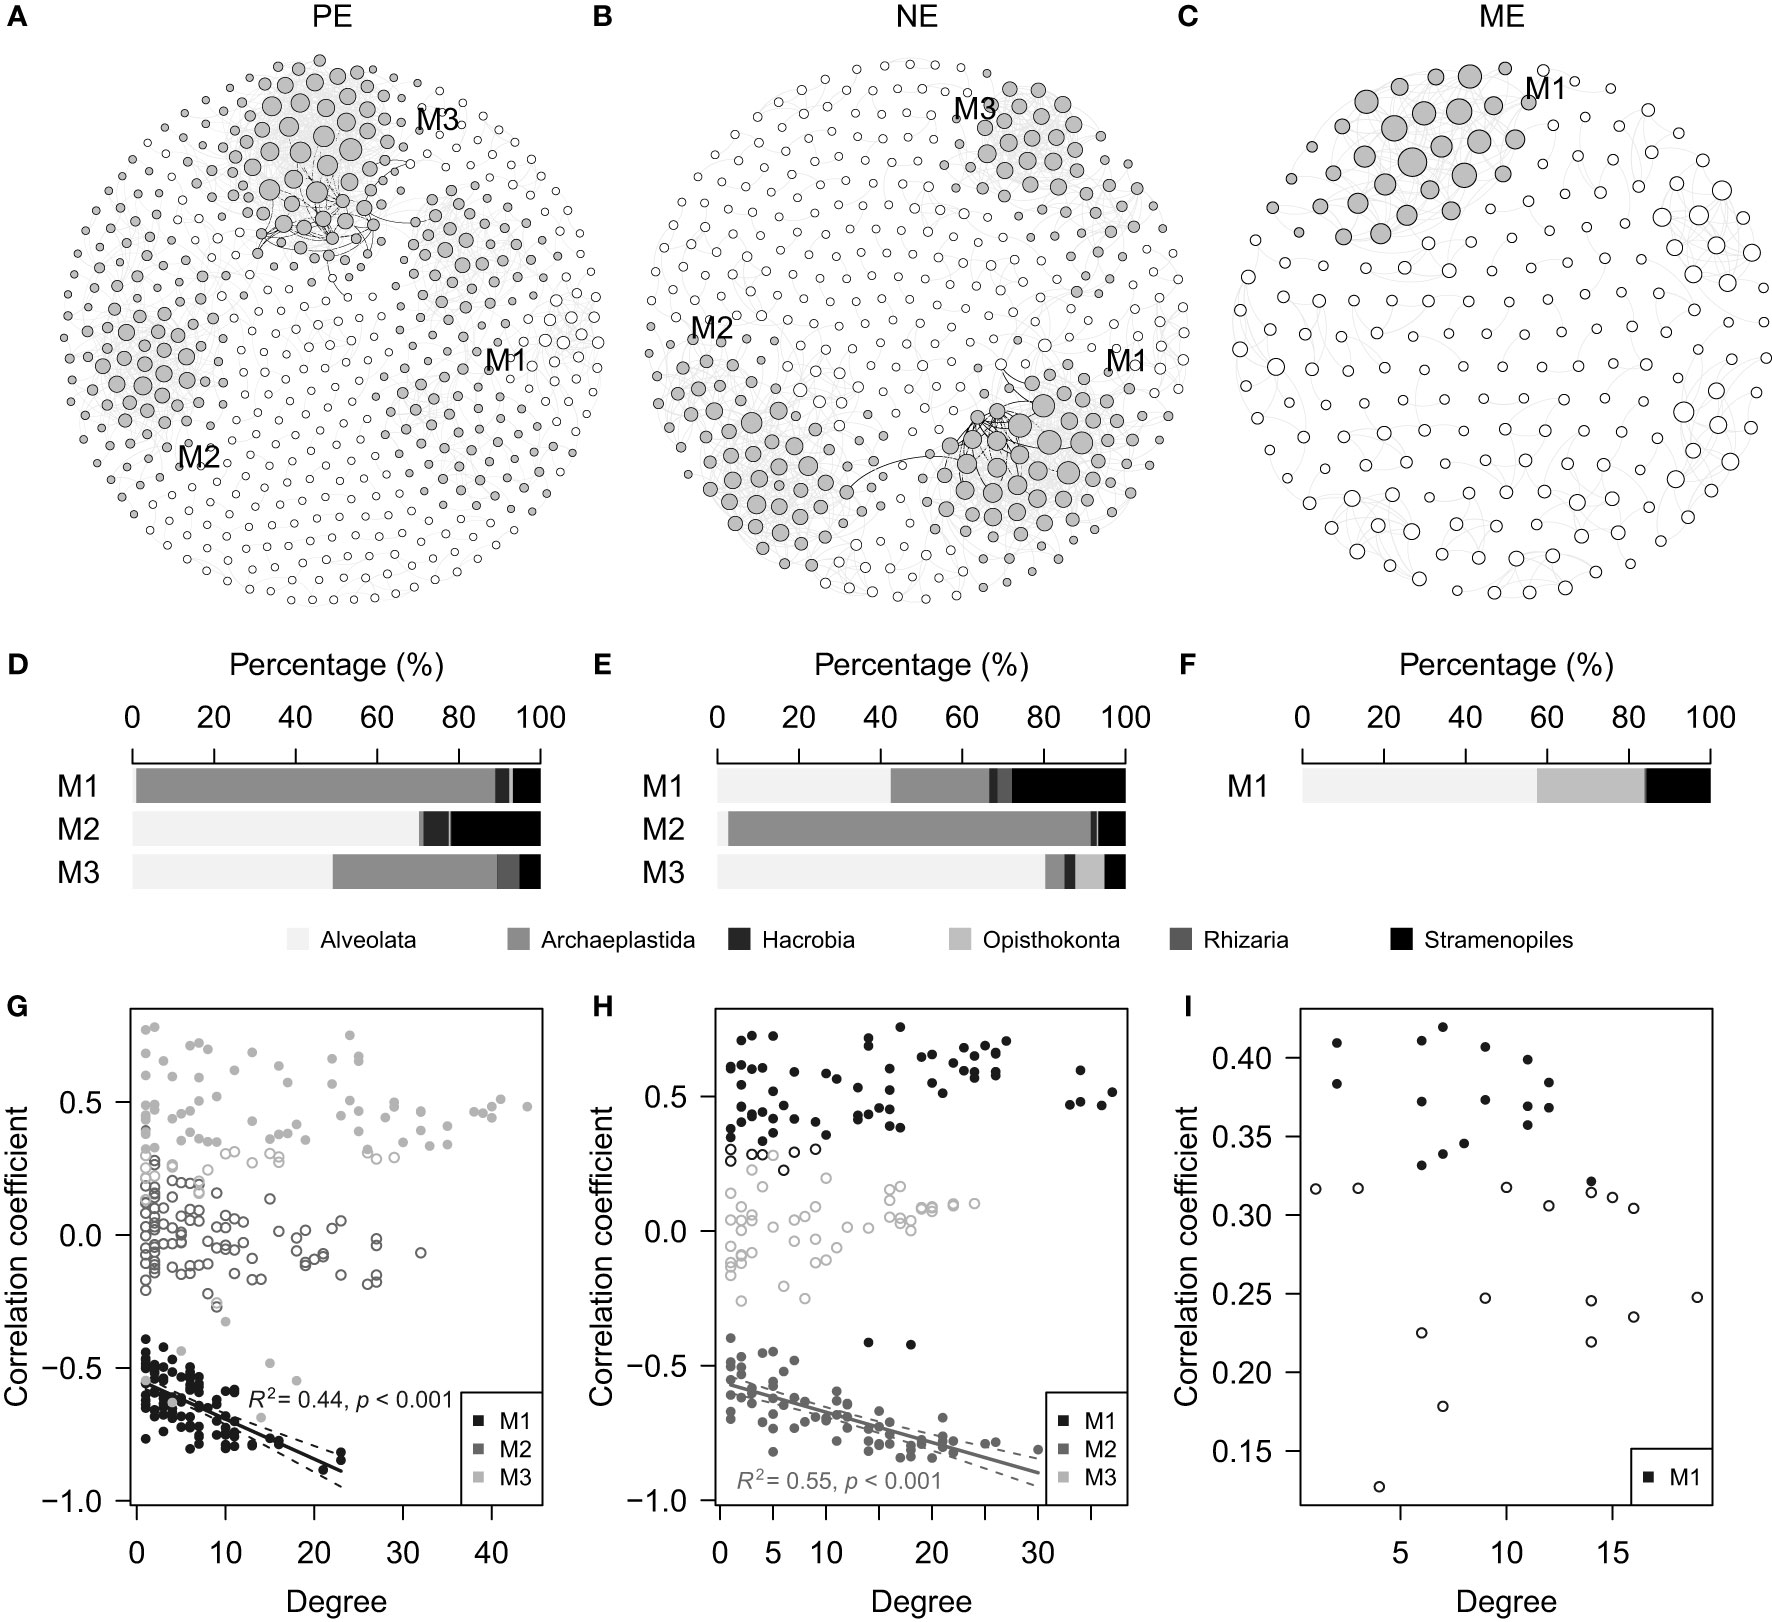
Figure 7 Co-occurrence networks showing the (A) PE, (B) NE and (C) ME categories. Major modules with >10% contributions to the total node degrees are marked with filled circles (3 modules in each of the PE and NE, and 1 module in the ME). Some of the nodes in (A) were manually moved to show a clear boundary among the M1 and M3 modules. (D–F) Horizontal stacked barcharts displaying the taxonomic compositions of the major modules shown in (A–C), respectively. (G–I) Scatter plots illustrating the relationships between degrees and correlation coefficients inferred from Spearman’s rank correlations between the ASV relative abundance and PC 1. Significant and non-significant Spearman’s rank correlations are indicated by filled and open circles, respectively. Significant linear regressions (p < 0.05), which include (G) M1 in PE and (H) M2 in NE are indicated by solid lines with a 95% confidence interval.
Discussion
This study shows that microbial eukaryotes across the size continuum were significantly different in multiple aspects. Overall, our results support the two expectations that (1) the alpha diversity of microbial eukaryotes in general, decreased as the cell size increased, and (2) the strength of the environmental effects on the beta diversity was strong and varied across the size continuum. These results support the historical perspective that organism size is a useful trait for understanding biogeographic patterns, even for microbial communities at a fine size scale.
Size dependence of alpha diversity
Microbial eukaryotes have an expected trend in size-fractionated alpha diversity. This pattern is well supported by the overall ASV numbers of each fraction (Figure 2B) and the ASV richness estimations of the rarified communities (Figure 2C), which is consistent with previous global surveys (de Vargas et al., 2015). Meanwhile, differences between the PE and NE were not significant when using a proportional measure (i.e., the Shannon index) (Figure 2D). Proportional measures of alpha diversity often carry information on environmental adaptions of populations in a given community (i.e., evenness), which suggests that this size-dependent pattern of alpha diversity can be shaped by environmental conditions. We note that the results from this study were inconsistent with those from some previous reports. For example, Logares et al. (2014) found that the nano-sized fraction had higher richness than the pico- and micro-meso-sized fractions. This discrepancy might be partly due to the difference in the targeted regions of the 18S rRNA gene (i.e., V4 versus V9), which resulted in variable diversity estimations (Dunthorn et al., 2012; Decelle et al., 2014; Tragin et al., 2018). Alternatively, the size-dependent pattern relies on the spatial scale of the sampling design, which varies from isolated sites (Logares et al., 2014), an entire estuary (i.e., this study) to global oceans (de Vargas et al., 2015). More importantly, the pattern we observed is consistent with other previous investigations, which mostly address the marine diversity spectrum of large organisms (Reuman et al., 2014). Differences in diversity are mainly due to resource partitioning, through niche differentiation. Indeed, natural environments are expected to support more organisms of smaller sizes than of larger sizes, generating a decreasing trend in alpha diversity as the size of the organisms increase. Therefore, the diversity spectrum can perhaps be extended to microbial eukaryotes based on our observations.
The cell size of microbial eukaryotes is suggested to be associated with a set of organismal characteristics related to niche and fitness, and this suggestion was supported by our finding that cell size is a phylogenetically conserved trait (Figure 3A). It is well known that phylogeny is tightly connected to functional traits in microorganisms (Martiny et al., 2013; Goberna and Verdú, 2016). Although niches cannot be simply inferred through cell size alone, differences in size can predict variations in the niche and fitness of different microbial eukaryotes (Gallego et al., 2019). For example, Syndiniales are one of the most highly represented groups in the world oceans (de Vargas et al., 2015), and in general they exhibit small FIS values (Figure 3C), mainly due to their parasitic and symbiotic life strategies. In contrast, in the Pearl River Estuary, the Bacillariophyta class is known to be a highly represented group (Wu and Liu, 2018), and this group exhibited high FIS values. These findings agree with previous reports that the larger-sized Bacillariophyta can dominate the estuarine phytoplankton (Cloern, 2018), despite their variable cell sizes across the world oceans (Malviya et al., 2016). Together with the dominance of Syndiniales and Bacillariophyta (Supplementary Table 2), our data suggest that the co-existence of most of the microbial eukaryotes might be putatively inferred from both their size and related characteristics, which contributes to the size-dependent diversity pattern.
There are some limitations in our assessments of alpha diversity when relying on pore-sized filters and 18S rDNA gene sequencing. For example, we cannot rule out some biases caused by body fragments from larger-sized organisms (Liu et al., 2017). In addition, extracellular DNA putatively adhering to small particles might also be a source of some larger-sized taxa in the smaller-sized fractions (Sørensen et al., 2013). In contrast, grazing might contribute to the existence of smaller taxa in the larger-sized categories. Indeed, some herbivorous eukaryotes can exert grazing pressures on phytoplankton independent of cell size (Cabrerizo and Marañón, 2021), which leads to biases in the size classifications. Despite these limitations, 59.6% of the total ASVs were still restricted to a single category (Figure 2B), suggesting that the protocols we used to separate the whole microbial eukaryotes into the PE, NE, and ME were effective (Logares et al., 2014). Moreover, our size dependence of alpha diversity was based on the DNA signatures found in complex estuarine waters. This pattern might be affected by including dormant taxa and mixing organisms from freshwater, seawater, and sediments in the estuarine area. Employing RNA signatures (only including active taxa) and/or surveying other waters might result in a changed pattern with an absence of the size dependence of alpha diversity found in this study (Xu et al., 2020).
Environmental effect on beta diversity
The community variations of microbial eukaryotes are largely driven by environmental effects, which decreased from the smaller- to larger-sized categories (Figure 6). The main possibility for the difference in environmental effects might be that smaller-sized microbial eukaryotes are more responsive to environmental changes. For example, a recent study conducted in the coastal waters off the Ría de Vigo in northwestern Spain showed that pico- and nano-sized eukaryotes (particularly of pigmented groups) responded profoundly to the addition of inorganic and organic nutrients (Hernández-Ruiz et al., 2020). From the size spectrum perspective, smaller microbial eukaryotes are mainly found in the lower trophic levels, and so they might respond to hydrographic conditions more efficiently. Moreover, it is supposed that as well as higher richness, smaller microbial eukaryotes also have higher cell densities (White et al., 2007). The smaller categories with more diverse and abundant assemblages might also have higher potentials to track environmental changes, which contributes to higher environmental effects.
The co-occurrence patterns further differentiate the responses of the size-fractionated microbial eukaryotes to the environmental contexts (Figures 7A–C). Indeed, many ASVs showed significant correlations with environments, suggesting that these are the main contributors of the environmental effects on the community variations observed (Figures 7G–I). However, some modules were of remarkably different taxonomic compositions. For example, modules composed mainly of ASVs with non-significant environmental correlations, had large contributions of Alveolata (Figures 7D–F), indicating that these modules might be controlled mainly by biotic interactions by parasitic or symbiotic taxa. Interestingly, the ASVs in M1 of the PE and M2 of the NE showed linear regression relationships between the degrees and coefficients (Figures 7G, H). Indeed, the three ASVs with the largest degrees (two ASVs for PE and one ASV for NE) are closely affiliated to freshwater Chlorophyta, supported by 100% sequence similarities with hits in a BLAST (NCBI) search. The negative coefficients mostly resulted from intensive filtering towards offshore environments. This phenomenon supports our cautiousness to not simply interpret the co-occurrence networks as biotic interactions (Blanchet et al., 2020), which can suffer from rapidly changing environments. We suggest that network analyses are informative for understanding environmental effects based on module-level characteristics.
In addition to the environmental effects, we acknowledge that spatial effects are also important in shaping the beta diversity of microbial eukaryotes. The spatial effects are particularly crucial for large geographical scales when ocean connectivity (rather than environmental differences) might be the key player (Villarino et al., 2018). Moreover, a considerable number of components could not be attributed to either environmental or spatial effects (Figure 6). These might result from unmeasured environmental variables or biotic factors such as via predator–prey interactions. For example, the microbial eukaryotes encompass numerous bacterivores, including mixotrophic phytoplankton (Unrein et al., 2014). These bacterivores are themselves controlled by grazing pressures commonly observed in the PE, NE, and ME (Wikner and Hagstrom, 1988; Tamigneaux et al., 1997; Caron et al., 1999). Notably, biotic interactions (e.g., grazing) can also be regulated by environmental factors (e.g., temperature) (Cabrerizo and Marañón, 2021), which suggests that there are mixed effects between biotic interactions and environmental conditions. Taking these ideas together, we suggest that environmental, spatial, and biotic factors exhibit combined and complicated effects on the beta diversity of the PE, NE, and ME.
It should be noted that the environmental effects we observed represent a single temporal scenario of the community variations across the Pearl River Estuary. A characteristic feature of the Pearl River Estuary is the occurrence of seasonal discharges of freshwater into the sea; this reaches a peak in the summer, which is when we collected our samples. As shown by the shapes of the LCBD graphs (Figure 5), the turnover of the inshore and offshore communities is considerable. This represents the outcome of the environmental gradients caused mainly by the Pearl River runoff, in comparison to other coastal waters that lack large freshwater discharges (Genitsaris et al., 2016). We suggest that more temporal investigations in this region are required to achieve a more complete view of the microbial eukaryotes. Moreover, we suggest that our results represent a view that is restricted to estuarine ecosystems. In particular, the large environmental gradients might weaken the between-fraction differences, as indicated by the overlap observed in the PCoA plots (Figure 4). A similar situation occurred in open oceans (Duret et al., 2015), which indicates that size-fractionated microbial eukaryotic communities can be strongly rearranged by water depth. More efforts are also required to survey diverse habitats in addition to estuaries.
Conclusions
This study provides new insights into the microbial eukaryotes across a size continuum of pico-, nano-, and micro-sized fractions. We showed that Alveolate, Stramenopiles, Archaeplastida, and Opisthokonta represent the four most abundant supergroups. In addition, we found that there was a decreasing trend of alpha diversity with increasing cell size. The phylogenetic signal was strong and significant for the fraction-inferred sizes, indicating that cell size was a phylogenetically conserved trait of microbial eukaryotes. Moreover, the three categories were significantly different at the beta diversity level, although they were not distinct in ordination analyses. In the Pear River Estuary, the two ends of the freshwater- and seawater-like habitats were the major contributors of the community variations observed. In addition, the community variations of the microbial eukaryotes could mainly be explained by the environmental effects, which decreased from the smaller- to larger-sized categories. The co-occurrence patterns of each category further identified a few modules with opposite responses to the environmental context, suggesting that they were largely responsible for the community variations. In conclusion, in addition to cell size, it is important to conduct more trait-based examinations to achieve a better understanding of marine planktons.
Data availability statement
The datasets presented in this study can be found in online repositories. The names of the repository/repositories and accession number(s) can be found below: NCBI BioProject: PRJNA836731.
Author contributions
WW and HL conceived and designed the study. WW performed the experiments, analyzed the data and wrote the manuscript. WW and HL contributed to manuscript revision and approved the submitted version.
Funding
This work was supported by the National Natural Science Foundation of China (No. 42176143) and the Theme-based Research Scheme of the Hong Kong Research Grants Council (No. T21/602/16).
Acknowledgments
The authors would like to thank Zhimeng Xu (The Hong Kong University of Science and Technology) for his help with field sampling and Prof. Jianping Gan (The Hong Kong University of Science and Technology) and Prof. Minhan Dai (Xiamen University) for providing the environmental variables.
Conflict of interest
The authors declare that the research was conducted in the absence of any commercial or financial relationships that could be construed as a potential conflict of interest.
Publisher’s note
All claims expressed in this article are solely those of the authors and do not necessarily represent those of their affiliated organizations, or those of the publisher, the editors and the reviewers. Any product that may be evaluated in this article, or claim that may be made by its manufacturer, is not guaranteed or endorsed by the publisher.
Supplementary material
The Supplementary Material for this article can be found online at: https://www.frontiersin.org/articles/10.3389/fmars.2022.933256/full#supplementary-material
References
Acevedo-Trejos E., Brandt G., Merico A., Smith S. L. (2013). Biogeographical patterns of phytoplankton community size structure in the oceans. Glob. Ecol. Biogeogr. 22, 1060–1070. doi: 10.1111/geb.12071
Adl S. M., Bass D., Lane C. E., Lukeš J., Schoch C. L., Smirnov A., et al. (2019). Revisions to the classification, nomenclature, and diversity of eukaryotes. J. Eukaryot. Microbiol. 66, 4–119. doi: 10.1111/jeu.12691
Andersen K. H., Berge T., Gonçalves R. J., Hartvig M., Heuschele J., Hylander S., et al. (2016). Characteristic sizes of life in the oceans, from bacteria to whales. Ann. Rev. Mar. Sci. 8, 217–241. doi: 10.1146/annurev-marine-122414-034144
Bastian M., Heymann S., Jacomy M. (2009). Gephi: an open source software for exploring and manipulating networks. Proc. Int. AAAI Conf. Web Soc. Media. 3, 361-362
Bauer J. E., Cai W.-J., Raymond P. A., Bianchi T. S., Hopkinson C. S., Regnier P. A. G. (2013). The changing carbon cycle of the coastal ocean. Nature 504, 61–70. doi: 10.1038/nature12857
Blanchet F. G., Cazelles K., Gravel D. (2020). Co-Occurrence is not evidence of ecological interactions. Ecol. Lett. 23, 1050–1063. doi: 10.1111/ele.13525
Bokulich N. A., Kaehler B. D., Rideout J. R., Dillon M., Bolyen E., Knight R., et al. (2018). Optimizing taxonomic classification of marker-gene amplicon sequences with QIIME 2’s q2-feature-classifier plugin. Microbiome 6, 90. doi: 10.1186/s40168-018-0470-z
Bolyen E., Rideout J. R., Dillon M. R., Bokulich N. A., Abnet C. C., Al-Ghalith G. A., et al. (2019). Reproducible, interactive, scalable and extensible microbiome data science using QIIME 2. Nat. Biotechnol. 37, 852–857. doi: 10.1038/s41587-019-0209-9
Cabrerizo M. J., Marañón E. (2021). Grazing pressure is independent of prey size in a generalist herbivorous protist: insights from experimental temperature gradients. Microb. Ecol. 81, 553–562. doi: 10.1007/s00248-020-01578-7
Callahan B. J., McMurdie P. J., Rosen M. J., Han A. W., Johnson A. J. A., Holmes S. P. (2016). DADA2: High-resolution sample inference from illumina amplicon data. Nat. Methods 13, 581–583. doi: 10.1038/nmeth.3869
Camacho C., Coulouris G., Avagyan V., Ma N., Papadopoulos J., Bealer K., et al. (2009). BLAST+: architecture and applications. BMC Bioinf. 10, 421. doi: 10.1186/1471-2105-10-421
Caron D. A., Countway P. D., Jones A. C., Kim D. Y., Schnetzer A. (2012). Marine protistan diversity. Ann. Rev. Mar. Sci. 4, 467–493. doi: 10.1146/annurev-marine-120709-142802
Caron D. A., Peele E. R., Lim E. L., Dennett M. R. (1999). Picoplankton and nanoplankton and their trophic coupling in surface waters of the Sargasso Sea south of Bermuda. Limnol. Oceanogr. 44, 259–272. doi: 10.4319/lo.1999.44.2.0259
Caron D. A., Worden A. Z., Countway P. D., Demir E., Heidelberg K. B. (2009). Protists are microbes too: a perspective. ISME J. 3, 4–12. doi: 10.1038/ismej.2008.101
Clarke L. J., Deagle B. E. (2020). Eukaryote plankton assemblages in the southern kerguelen axis region: ecological drivers differ between size fractions. Deep-Sea Res. II 174, 104538. doi: 10.1016/j.dsr2.2018.12.003
Clauset A., Newman M. E. J., Moore C. (2004). Finding community structure in very large networks. Phys. Rev. E 70, 066111. doi: 10.1103/physreve.70.066111
Cloern J. E. (2018). Why large cells dominate estuarine phytoplankton. Limnol. Oceanogr. 63, S392–S409. doi: 10.1002/lno.10749
Corsaro D., Köhsler M., Wylezich C., Venditti D., Walochnik J., Michel R. (2018). New insights from molecular phylogenetics of amoebophagous fungi (Zoopagomycota, zoopagales). Parasitol. Res. 117, 157–167. doi: 10.1007/s00436-017-5685-6
Csárdi G., Nepusz T. (2006). “The igraph software package for complex network research.” Inter Journal. Complex Systems, 1695. Available at: http://igraph.org.
Dai M., Meng F., Tang T., Kao S.-J., Lin J., Chen J., et al. (2009). Excess total organic carbon in the intermediate water of the south China Sea and its export to the north pacific. Geochem. Geophys. Geosyst. 10, Q12002. doi: 10.1029/2009gc002752
Decelle J., Romac S., Sasaki E., Not F., Mahé F. (2014). Intracellular diversity of the V4 and V9 regions of the 18S rRNA in marine protists (radiolarians) assessed by high-throughput sequencing. PloS One 9, e104297. doi: 10.1371/journal.pone.0104297
de Vargas C., Audic S., Henry N., Decelle J., Mahé F., Logares R., et al. (2015). Eukaryotic plankton diversity in the sunlit ocean. Science 348, 1261605. doi: 10.1126/science.1261605
Dray S., Bauman D., Blanchet G., Borcard D., Clappe S., Guenard G., et al. (2022). Adespatial: Multivariate multiscale spatial analysis. R package version 0.3-19. Available at: https://CRAN.R-project.org/package=adespatial.
Dunthorn M., Klier J., Bunge J., Stoeck T. (2012). Comparing the hyper-variable V4 and V9 regions of the small subunit rDNA for assessment of ciliate environmental diversity. J. Eukaryot. Microbiol. 59, 185–187. doi: 10.1111/j.1550-7408.2011.00602.x
Duret M. T., Pachiadaki M. G., Stewart F. J., Sarode N., Christaki U., Monchy S., et al. (2015). Size-fractionated diversity of eukaryotic microbial communities in the Eastern tropical north pacific oxygen minimum zone. FEMS Microbiol. Ecol. 91, fiv037. doi: 10.1093/femsec/fiv037
Elferink S., Wohlrab S., Neuhaus S., Cembella A., Harms L., John U. (2020). Comparative metabarcoding and metatranscriptomic analysis of microeukaryotes within coastal surface waters of west Greenland and northwest Iceland. Front. Mar. Sci. 7. doi: 10.3389/fmars.2020.00439
Finkel Z. V., Beardall J., Flynn K. J., Quigg A., Rees T. A. V., Raven J. A. (2010). Phytoplankton in a changing world: cell size and elemental stoichiometry. J. Plankton Res. 32, 119–137. doi: 10.1093/plankt/fbp098
Fuhrman J. A., Cram J. A., Needham D. M. (2015). Marine microbial community dynamics and their ecological interpretation. Nat. Rev. Microbiol. 13, 133–146. doi: 10.1038/nrmicro3417
Gallego I., Venail P., Ibelings B. W. (2019). Size differences predict niche and relative fitness differences between phytoplankton species but not their coexistence. ISME J. 13, 1133–1143. doi: 10.1038/s41396-018-0330-7
Genitsaris S., Monchy S., Breton E., Lecuyer E., Christaki U. (2016). Small-scale variability of protistan planktonic communities relative to environmental pressures and biotic interactions at two adjacent coastal stations. Mar. Ecol. Prog. Ser. 548, 61–75. doi: 10.3354/meps11647
Goberna M., Verdú M. (2016). Predicting microbial traits with phylogenies. ISME J. 10, 959–967. doi: 10.1038/ismej.2015.171
Grattepanche J. D., Breton E., Brylinski J. M., Lecuyer E., Christaki U. (2011). Succession of primary producers and micrograzers in a coastal ecosystem dominated by Phaeocystis globosa blooms. J. Plankton Res. 33, 37–50. doi: 10.1093/plankt/fbq097
Grossart H.-P., Van den Wyngaert S., Kagami M., Wurzbacher C., Cunliffe M., Rojas-Jimenez K. (2019). Fungi in aquatic ecosystems. Nat. Rev. Microbiol. 17, 339–354. doi: 10.1038/s41579-019-0175-8
Guillou L., Bachar D., Audic S., Bass D., Berney C., Bittner L., et al. (2013). The protist ribosomal reference database (PR2): a catalog of unicellular eukaryote small sub-unit rRNA sequences with curated taxonomy. Nucleic Acids Res. 41, D597–D604. doi: 10.1093/nar/gks1160
Guillou L., Viprey M., Chambouvet A., Welsh R. M., Kirkham A. R., Massana R., et al. (2008). Widespread occurrence and genetic diversity of marine parasitoids belonging to Syndiniales (Alveolata). Environ. Microbiol. 10, 3349–3365. doi: 10.1111/j.1462-2920.2008.01731.x
Han A., Dai M., Kao S.-J., Gan J., Li Q., Wang L., et al. (2012). Nutrient dynamics and biological consumption in a large continental shelf system under the influence of both a river plume and coastal upwelling. Limnol. Oceanogr. 57, 486–502. doi: 10.4319/lo.2012.57.2.0486
Hernández-Ruiz M., Barber-Lluch E., Prieto A., Logares R., Teira E. (2020). Response of pico-nano-eukaryotes to inorganic and organic nutrient additions. Estuar. Coast. Shelf Sci. 235, 106565. doi: 10.1016/j.ecss.2019.106565
Jamy M., Biwer C., Vaulot D., Obiol A., Jing H., Peura S., et al. (2022). Global patterns and rates of habitat transitions across the eukaryotic tree of life. Nat. Ecol. Evol. 6, 1458–1470. doi: 10.1038/s41559-022-01838-4
Katoh K., Standley D. M. (2013). MAFFT multiple sequence alignment software version 7: improvements in performance and usability. Mol. Biol. Evol. 30, 772–780. doi: 10.1093/molbev/mst010
Kruskal W. H., Wallis W. A. (1952). Use of ranks in one-criterion variance analysis. J. Am. Stat. Assoc. 47, 583–621. doi: 10.2307/2280779
Legendre P., De Cáceres M. (2013). Beta diversity as the variance of community data: dissimilarity coefficients and partitioning. Ecol. Lett. 16, 951–963. doi: 10.1111/ele.12141
Liu L., Liu M., Wilkinson D. M., Chen H., Yu X., Yang J. (2017). DNA Metabarcoding reveals that 200-μm-size-fractionated filtering is unable to discriminate between planktonic microbial and large eukaryotes. Mol. Ecol. Resour. 17, 991–1002. doi: 10.1111/1755-0998.12652
Logares R., Audic S., Bass D., Bittner L., Boutte C., Christen R., et al. (2014). Patterns of rare and abundant marine microbial eukaryotes. Curr. Biol. 24, 813–821. doi: 10.1016/j.cub.2014.02.050
López-Urrutia Á., Morán X. A. G. (2015). Temperature affects the size-structure of phytoplankton communities in the ocean. Limnol. Oceanogr. 60, 733–738. doi: 10.1002/lno.10049
Lozupone C., Knight R. (2005). UniFrac: a new phylogenetic method for comparing microbial communities. Appl. Environ. Microbiol. 71, 8228–8235. doi: 10.1128/aem.71.12.8228-8235.2005
Malviya S., Scalco E., Audic S., Vincent F., Veluchamy A., Poulain J., et al. (2016). Insights into global diatom distribution and diversity in the world’s ocean. Proc. Natl. Acad. Sci. U. S. A. 113, E1516–E1525. doi: 10.1073/pnas.1509523113
Marañón E. (2015). Cell size as a key determinant of phytoplankton metabolism and community structure. Ann. Rev. Mar. Sci. 7, 241–264. doi: 10.1146/annurev-marine-010814-015955
Marañón E., Cermeño P., Latasa M., Tadonléké R. D. (2015). Resource supply alone explains the variability of marine phytoplankton size structure. Limnol. Oceanogr. 60, 1848–1854. doi: 10.1002/lno.10138
Martin M. (2011). Cutadapt removes adapter sequences from high-throughput sequencing reads. EMBnet.journal 17, 10–12. doi: 10.14806/ej.17.1.200
Martiny A. C., Treseder K., Pusch G. (2013). Phylogenetic conservatism of functional traits in microorganisms. ISME J. 7, 830–838. doi: 10.1038/ismej.2012.160
Massana R., del Campo J., Sieracki M. E., Audic S., Logares R. (2014). Exploring the uncultured microeukaryote majority in the oceans: reevaluation of ribogroups within stramenopiles. ISME J. 8, 854–866. doi: 10.1038/ismej.2013.204
Massana R., Gobet A., Audic S., Bass D., Bittner L., Boutte C., et al. (2015). Marine protist diversity in European coastal waters and sediments as revealed by high-throughput sequencing. Environ. Microbiol. 17, 4035–4049. doi: 10.1111/1462-2920.12955
Mestre M., Ruiz-González C., Logares R., Duarte C. M., Gasol J. M., Sala M. M. (2018). Sinking particles promote vertical connectivity in the ocean microbiome. Proc. Natl. Acad. Sci. U. S. A. 115, E6799–E6807. doi: 10.1073/pnas.1802470115
Mousing E. A., Ellegaard M., Richardson K. (2014). Global patterns in phytoplankton community size structure-evidence for a direct temperature effect. Mar. Ecol. Prog. Ser. 497, 25–38. doi: 10.3354/meps10583
Oksanen J., Blanchet F. G., Friendly M., Kindt R., Legendre P., McGlinn D., et al. (2018) Vegan: community ecology package. r package version 2.5-3. Available at: http://CRAN.R-project.org/package=vegan.
Pagel M. (1999). Inferring the historical patterns of biological evolution. Nature 401, 877–884. doi: 10.1038/44766
Price M. N., Dehal P. S., Arkin A. P. (2010). FastTree 2 – approximately maximum-likelihood trees for large alignments. PloS One 5, e9490. doi: 10.1371/journal.pone.0009490
R Core Team (2018). R: A language and environment for statistical computing (Vienna, Austria: R Foundation for Statistical Computing). Available at: http://www.R-project.org/.
Reuman D. C., Gislason H., Barnes C., Mélin F., Jennings S. (2014). The marine diversity spectrum. J. Anim. Ecol. 83, 963–979. doi: 10.1111/1365-2656.12194
Revell L. J. (2012). Phytools: an r package for phylogenetic comparative biology (and other things). Methods Ecol. Evol. 3, 217–223. doi: 10.1111/j.2041-210x.2011.00169.x
Röttjers L., Faust K. (2018). From hairballs to hypotheses–biological insights from microbial networks. FEMS Microbiol. Rev. 42, 761–780. doi: 10.1093/femsre/fuy030
Sørensen N., Daugbjerg N., Richardson K. (2013). Choice of pore size can introduce artefacts when filtering picoeukaryotes for molecular biodiversity studies. Microb. Ecol. 65, 964–968. doi: 10.1007/s00248-012-0174-z
Salazar G., Cornejo-Castillo F. M., Borrull E., Díez-Vives C., Lara E., Vaqué D., et al. (2015). Particle-association lifestyle is a phylogenetically conserved trait in bathypelagic prokaryotes. Mol. Ecol. 24, 5692–5706. doi: 10.1111/mec.13419
Shannon C. E. (1948). A mathematical theory of communication. Bell Syst. Tech. J. 27, 379–423, 623–656. doi: 10.1002/j.1538-7305.1948.tb01338.x
Sommeria-Klein G., Watteaux R., Ibarbalz F. M., Pierella Karlusich J. J., Iudicone D., Bowler C., et al. (2021). Global drivers of eukaryotic plankton biogeography in the sunlit ocean. Science 374, 594–599. doi: 10.1126/science.abb3717
Stoeck T., Bass D., Nebel M., Christen R., Jones M. D. M., Breiner H.-W., et al. (2010). Multiple marker parallel tag environmental DNA sequencing reveals a highly complex eukaryotic community in marine anoxic water. Mol. Ecol. 19, 21–31. doi: 10.1111/j.1365-294x.2009.04480.x
Tamigneaux E., Mingelbier M., Klein B., Legendre L. (1997). Grazing by protists and seasonal changes in the size structure of protozooplankton and phytoplankton in a temperate nearshore environment (western gulf of st. Lawrence, Canada). Mar. Ecol. Prog. Ser. 146, 231–247. doi: 10.3354/meps146231
Tragin M., Vaulot D. (2018). Green microalgae in marine coastal waters: the ocean sampling day (OSD) dataset. Sci. Rep. 8, 14020. doi: 10.1038/s41598-018-32338-w
Tragin M., Zingone A., Vaulot D. (2018). Comparison of coastal phytoplankton composition estimated from the V4 and V9 regions of the 18S rRNA gene with a focus on photosynthetic groups and especially chlorophyta. Environ. Microbiol. 20, 506–520. doi: 10.1111/1462-2920.13952
Unrein F., Gasol J. M., Not F., Forn I., Massana R. (2014). Mixotrophic haptophytes are key bacterial grazers in oligotrophic coastal waters. ISME J. 8, 164–176. doi: 10.1038/ismej.2013.132
Villarino E., Watson J. R., Jönsson B., Gasol J. M., Salazar G., Acinas S. G., et al. (2018). Large-Scale ocean connectivity and planktonic body size. Nat. Commun. 9, 142. doi: 10.1038/s41467-017-02535-8
Wang F., Huang B., Xie Y., Cai S., Wang X., Mu J. (2021). Diversity, composition, and activities of nano- and pico-eukaryotes in the northern south China Sea with influences of kuroshio intrusion. Front. Mar. Sci. 8. doi: 10.3389/fmars.2021.658233
White E. P., Ernest S. K. M., Kerkhoff A. J., Enquist B. J. (2007). Relationships between body size and abundance in ecology. Trends Ecol. Evol. 22, 323–330. doi: 10.1016/j.tree.2007.03.007
Wikner J., Hagstrom A. (1988). Evidence for a tightly coupled nanoplanktonic predator-prey link regulating the bacterivores in the marine environment. Mar. Ecol. Prog. Ser. 50, 137–145. doi: 10.3354/meps050137
Wood S. N. (2011). Fast stable restricted maximum likelihood and marginal likelihood estimation of semiparametric generalized linear models. J. R. Stat. Soc Ser. B 73, 3–36. doi: 10.1111/j.1467-9868.2010.00749.x
Worden A. Z., Follows M. J., Giovannoni S. J., Wilken S., Zimmerman A. E., Keeling P. J. (2015). Rethinking the marine carbon cycle: factoring in the multifarious lifestyles of microbes. Science 347, 1257594. doi: 10.1126/science.1257594
Wu W., Liu H. (2018). Disentangling protist communities identified from DNA and RNA surveys in the pearl river–south China Sea continuum during the wet and dry seasons. Mol. Ecol. 27, 4627–4640. doi: 10.1111/mec.14867
Wu W., Xu Z., Dai M., Gan J., Liu H. (2021). Homogeneous selection shapes free-living and particle-associated bacterial communities in subtropical coastal waters. Divers. Distrib. 27, 1904–1917. doi: 10.1111/ddi.13193
Xu D., Kong H., Yang E., Li X., Jiao N., Warren A., et al. (2020). Contrasting community composition of active microbial eukaryotes in melt ponds and sea water of the Arctic ocean revealed by high throughput sequencing. Front. Microbiol. 11. doi: 10.3389/fmicb.2020.01170
Yu G., Smith D. K., Zhu H., Guan Y., Lam T. T.-Y. (2017). Ggtree: an r package for visualization and annotation of phylogenetic trees with their covariates and other associated data. Methods Ecol. Evol. 8, 28–36. doi: 10.1111/2041-210x.12628
Keywords: marine microbial eukaryote, 18S rRNA gene, size continuum, environmental effect, Pearl River Estuary
Citation: Wu W and Liu H (2022) Cell size is a key ecological trait associated with biogeographic patterns of microbial eukaryotes in coastal waters. Front. Mar. Sci. 9:933256. doi: 10.3389/fmars.2022.933256
Received: 30 April 2022; Accepted: 22 September 2022;
Published: 11 October 2022.
Edited by:
Jie Li, South China Sea Institute of Oceanology (CAS), ChinaReviewed by:
Gang Li, South China Sea Institute of Oceanology (CAS), ChinaJinjun Kan, Stroud Water Research Center, United States
Copyright © 2022 Wu and Liu. This is an open-access article distributed under the terms of the Creative Commons Attribution License (CC BY). The use, distribution or reproduction in other forums is permitted, provided the original author(s) and the copyright owner(s) are credited and that the original publication in this journal is cited, in accordance with accepted academic practice. No use, distribution or reproduction is permitted which does not comply with these terms.
*Correspondence: Wenxue Wu, d3d1QGhhaW5hbnUuZWR1LmNu