 Peng Zhao
 Song Ge
 Cairong Zhong3†
- 1State Key Laboratory of Marine Resource Utilization in the South China Sea, Hainan University, Haikou, China
- 2College of Tourism, Hainan University, Haikou, China
- 3Forestry Academy of Hainan, Haikou, China
- 4HNU-ASU Joint International Tourism College, Hainan University, Haikou, China
The climate mitigation potential of coastal blue carbon including mangroves, seagrasses and tidal marshes have been widely recognized, and guidelines for incorporating coastal wetlands into greenhouse gas inventories released by IPCC in 2014 make it possible to bring coastal blue carbon into multilevel climate governance regimes. However, the intricate guidelines and inadequate data block governments from accounting and reporting their coastal blue carbon in inventories. In this research, we integrated and simplified the equations and assumptions of IPCC inventory guidance on coastal wetlands, and took Hainan province of China as a case study by (1) formulating a land use change matrix from high resolution satellite imagery for the years of 2010 to 2020, (2) compiling dataset of emission factors for coastal wetlands of Hainan, and (3) estimating CO2, CH4, and N2O emissions from coastal wetlands in Hainan. We reveal that the mangroves’ area increased from 4,190.7 ha in 2010 to 4,644.1 ha in 2020, with a net increase of 483.9 ha from tidal flats and aquaculture ponds. The weighted average EFAGB and EFsoil of Hainan is 61.7 MgC ha-1 and 227.4 MgC ha-1, respectively,estimated from peer-reviewed literature in both Chinese and English. The annual average net CO2 emission of mangroves of Hainan is -26974.3 MgCO2e yr-1. CO2 emission from mangrove deforestation and N2O emission from shrimp aquaculture in coastal aeras may offset the efforts of coastal wetlands conservation and restoration. Countries and sub-country regions are encouraged to bring coastal blue carbon into greenhouse gases inventories as soon as possible, and to take a bottom-up strategy to initiate the task at a local level.
Introduction
Vegetated coastal wetlands, including mangroves, seagrasses and salt marshes are recognized as coastal blue carbon ecosystems, are one of the most biologically productive ecosystems in the world (Costanza et al., 1997; Howard et al., 2017). Despite occupying just 0.2% of the ocean surface, coastal blue carbon ecosystems contribute about 50% the yearly carbon burial in the ocean, despite occupying just 0.2% of the ocean surface (Duarte et al., 2013). Due to the reason that organic carbon decomposes slowly in coastal wetlands with negligible amounts of CO2 being released (Chmura et al., 2003). Moreover, these ecosystems function across a long carbon storage timeframe (Feller et al., 2007; Iacono et al., 2008), making a disproportionately significant contribution to global carbon sequestration (Macreadie et al., 2019). Therefore, the restoration of coastal blue carbon ecosystems is recommended as a regretless mitigation option at the national level for coastal countries by IPCC (Bindoff et al., 2019).
United Nations Framework Convention on Climate Change (UNFCCC) sets the regime of international climate change governance, and all parties to the convention are obligated to regularly report their GHGs emissions or removals from six sectors in their national GHGs inventories (Wilson et al., 2015). In order to include significant land-use and already occurring management activities in wetlands into inventories, the Intergovernmental Panel on Climate Change (IPCC) released the 2013 Supplement to the 2006 IPCC Guidelines for National Greenhouse Gas Inventories: Wetlands, Chapter 4 of which provides guidance on methodologies for estimating the carbon stock changes and CH4 emissions from mangroves, tidal marshes and seagrasses, and the N2O emissions from aquaculture in coastal wetlands (IPCC, 2014). Incorporating coastal blue carbon into GHGs Inventories helps explain human-induced emissions and removals of the coastal vegetated wetlands, while also informing society and professionals of climate change mitigation strategies, which are critical to producing an effective nature-based solution under the UNFCCC and its Paris Agreement (Crooks et al., 2018). The United States and Australia have incorporated coastal wetlands into their nventories since 2017 (Crooks et al., 2018). Net emissions from extraction and the regeneration of mangroves, conversion of tidal marshes and aquaculture was initially reported, with continuous improvements including consideration of seagrass drainage as well as methods and data renewal having been added to successive inventories.
The coasts of China span 18,000 km from temperate to tropical zones, and comprise a coastal wetland area of approximately 5.8×10⁶ ha which nourish vast, diverse and ecologically important mangroves, seagrasses and tidal marshes (Sun et al., 2015; Meng et al., 2019). There have been four periods of large-scale sea reclamation which, during 1960s to 2000s, reduced coastal ecological systems as well as vegetated coastal wetlands by >60% (Zhao et al., 2016). Such plummeting of natural coastlines has been ceased since 2013 due to the national call upon ecological civilization by China authority (Wang et al., 2021). Successive policies and legislation including the ban of sea reclamation, the nation-wide mangrove restoration plan and the goal of carbon neutrality by 2060, as well as the introduction of the Wetlands Protection Law, further strengthened the conservation, rehabilitation and restoration of vegetated coastal wetlands (Liu et al., 2020; Pan et al., 2022). Although China included blue carbon actions among its Nationally Determined Contributions (Gallo et al., 2017) and encouragement in blue carbon have been written into many national-level and provincial-level policies and plans, blue carbon’s absence from China’s national GHGs inventory continues to inhibit the development of a clear picture that indicates the shifting emphasis on blue carbon in official documents and research papers to an emphasis on climate actions and practices.
The effort of incorporating blue carbon into China’s national GHGs inventory has met with some difficulties. Firstly, data from national surveys and statistics on natural resources, wetlands and forests cannot fully support the needs and requirements of inventory compilation (Wang et al., 2020). For example, there is no information on tidal marshes and seagrasses, and there is no information on land-use change in mangroves in the decennial National Land Resource Survey. Second, the national default values of emission factors related to coastal wetlands have not been systematically reported according to the guidance of IPCC 2013 Supplement. Additionally, both rapid coastal zone development and its utilization during recent decades have reduced and broken up the vegetated coastal areas, with small areas possibly being left out and not added to national data. Here, we suggest taking a bottom-up strategy by beginning the research and practice with the local incorporation of blue carbon sequestration activities, and expanding the experience and knowledge across the national domain.
In this study, we followed the guidance of the IPCC on coastal wetlands, simplified the equations and assumptions, and took Hainan as an case study in order to estimate the GHG emissions of coastal wetlands by (1) acquiring activity data on the land use change matrix between 2010 and 2020 from high resolution satellite imagery, (2) summarizing emission factors of above-ground biomass storage and soil carbon storage of Hainan and its coastal regions, and (3) estimating CO2, CH4 and N2O emissions of coastal wetlands in Hainan. This study will not only provide methods for reporting on the coastal wetlands section of a provincial inventory and enlightening the national inventory compilation in a much more technician-friendly way, but it will also provide an example of how to assess the coastal wetlands protection and restoration from the perspective of climate change mitigation.
Material and methods
Study area
Hainan, the second largest island of China, is the youngest coastal province with an area of 33,900 km2 and 1,823 km of coastline. This island has a tropical monsoon climate with an average annual temperature of 25.7°C, and is famous for its rainforests and marine ecosystems such as mangroves, seagrasses and coral reefs (Gao et al., 2018). Mangroves and seagrasses are two of the main kinds of coastal blue carbon ecosystems in Hainan, the biodiversity of which ranks top in China (Chen et al., 2009). These mangroves are mainly distributed in the Dongzhai, Qinglan, Xinying, Huachang, Xinying, Qingmei and Tielu coastal areas (see Figure 1); the total area of which shows a U shape fluctuation since the 1950s due to land reclamation, and aquaculture during the 1960s through to the 2000s and mangrove restoration over the last 20 years (Liao et al., 2019). Seagrasses grow in the shallow water of lagoons, bays and on the fringes of coral reef flats along Hainan Island. Due to imprecise information on their distribution and areas still being insufficient (Hu et al., 2021), seagrasses are not included in this study.
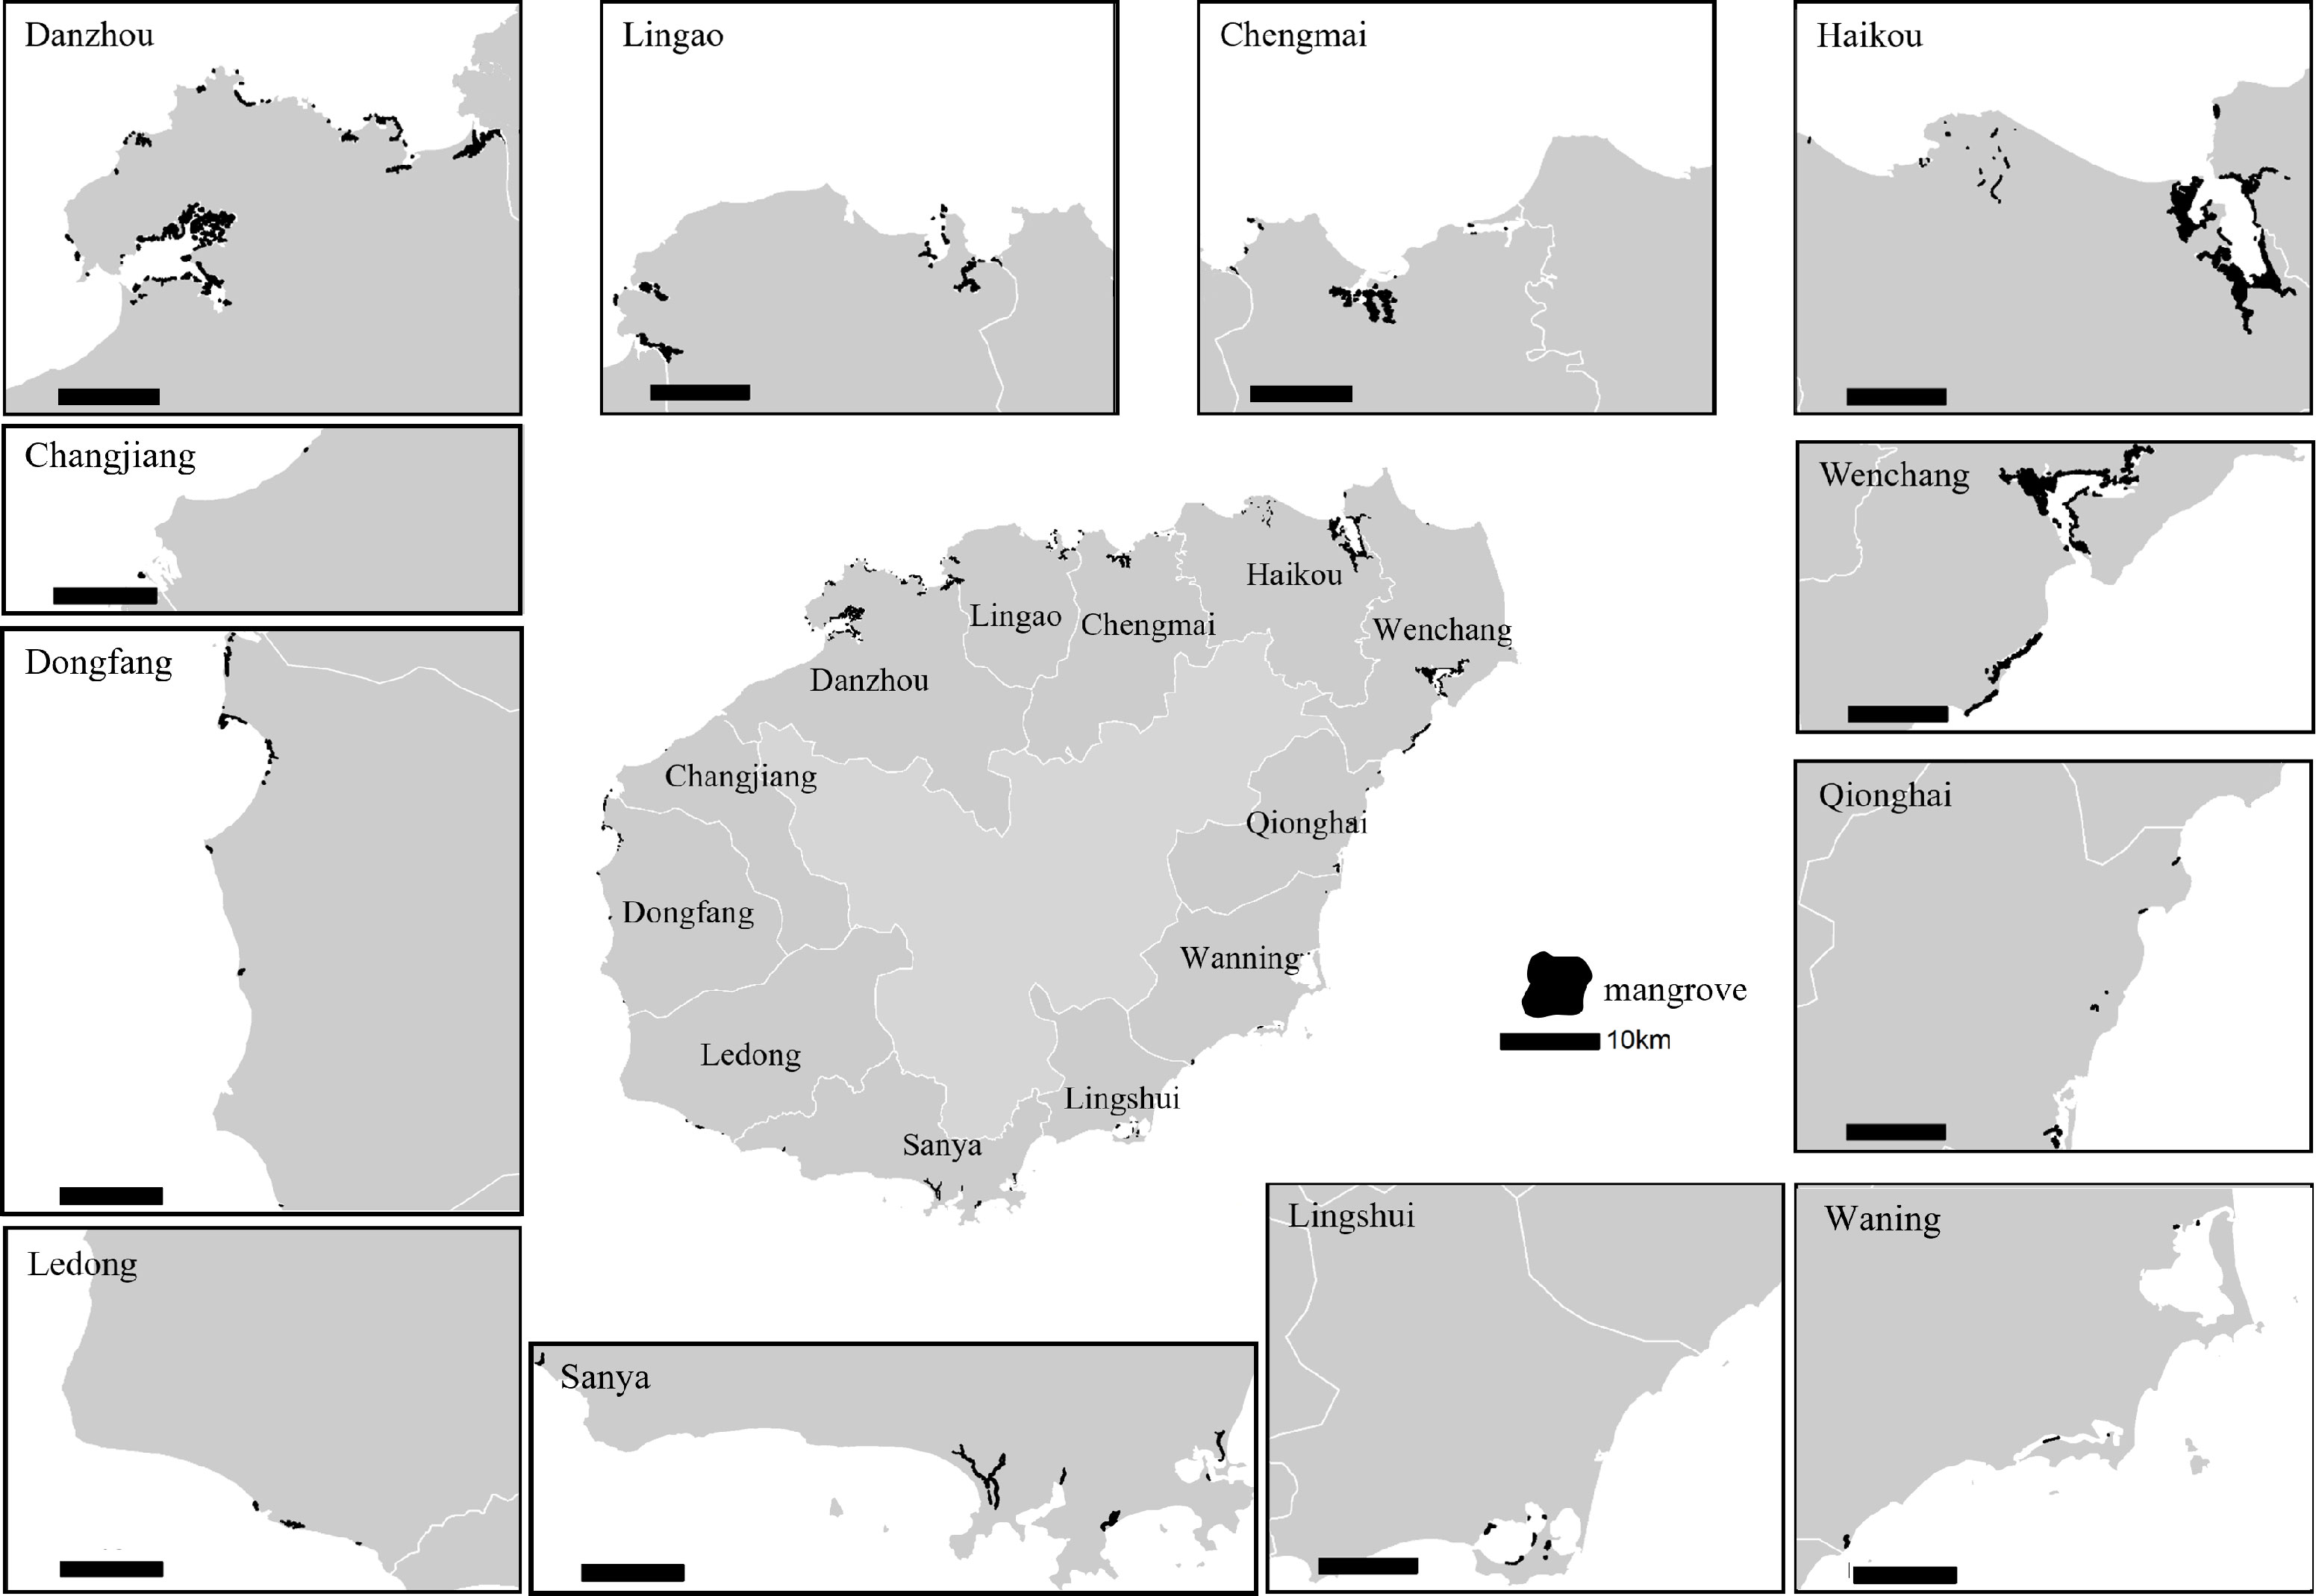
Figure 1 Mangrove distribution of Hainan in 2020.
Methodology for GHGs emission estimation
We followed the reporting framework of the 2006 Inventory Guidelines and the methodology provided in the 2013 Supplement in this study. A connection between the land-use change categories in 2006 Inventory Guidelines and the land-use categories in the 2013 Supplement (Table 1) was built to minimize the gap between the activity data acquisition and inventory reporting. The land use change categories are coastal wetlands that remain coastal wetlands (CC), non-coastal wetlands to coastal wetlands (NC), and coastal wetlands to non-coastal wetlands (CN) which should be reported in other relevant categories according to the Guidelines. We have followed practices of the United States to report the CN category under the coastal wetland category for a comprehensive understanding of change in the Hainan coastal wetlands.
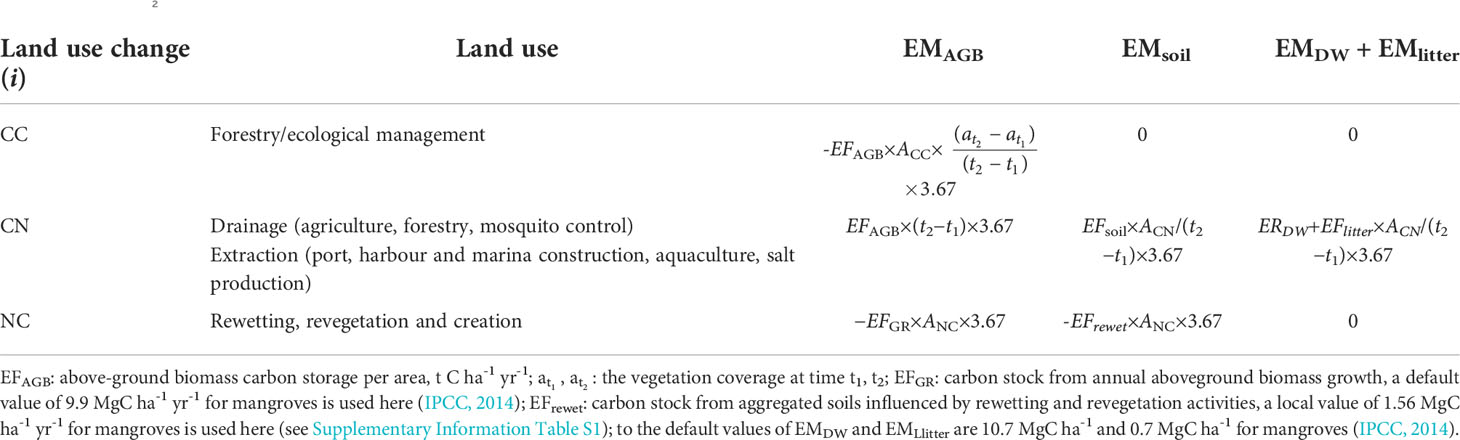
Table 1 EMCO2 calculation methods for different land-use change categories.
It is thought that the CO2, CH4 and N2O emissions (see Equation 1), induced by human activities in coastal wetlands, should be reported. With respect to CO2 emissions, there are five carbon pools including above-ground biomass, below-ground biomass, soil, dead wood and litter (see Equation 2). The below-ground biomass is inferred from the above-ground biomass with a root-shoot ratio (R) of underground biomass to above-ground biomass. Due to the strong inverse relationship between salinity and CH4 emissions, the rewetting and revegetation activities in freshwater and brackish waters with salinity<18 ppt (Equation 3) should be considered. N2O is produced by the denitrification process of residual diets and feces from aquaculture animals including those of fish and shrimps, and their emission from aquaculture activities in coastal wetlands should be considered in the inventory (see Equation 4). The emission of GHGs is calculated by multiplying an emission factor (EF) with an activity data.
In which,
EM is the total emission of GHGs from coastal wetlands, in which EMCO2 , EMN2O , EMCH4 are the emissions of CO2, CH4, N2O correspondingly, MgCO2e·yr-1
EMAGB is CO2 emission from above-ground biomass pool, MgCO2·yr-1;
i is a category of land use change, including CC, CN, and NC.
R is the ratio of below-ground biomass to above-ground biomass, and a default value of 0.49 is used in this study (IPCC, 2014).
EMsoil is CO2 emission from soil pool, MgCO2·yr-1;
EMDW is CO2 emission from the dead wood pool, MgCO2·yr-1;
EMlitter is CO2 emission from litter pool, MgCO2·yr-1;
EFCH4 is the emission factor of CH4 from rewetted soils in freshwater and brackish water with salinity<18, and a default value of 0.1937 MgCH4 ha-1 yr-1is used in this study (IPCC, 2014).
ALS is the area of rewetted soils in freshwater and brackish water with salinity<18, which has been interpreted using remote sensing imagery, ha; EFN2O is the emission factor of N2O from aquaculture production, with a default value of 0.00169 Mg N2O-N per t aquaculture product (IPCC, 2014)
Pa is the annual cultured fish and shrimp production, the data of which is available in the Hainan Statistics Yearly Book, t/yr
There are two kinds of emission factors for the CO2 emission estimation. The factor with the unit MgC ha-1 yr-1 on annual carbon flux is multiplied by the activity data (see Equation 5). And the factor with the unit MgC ha-1 on the carbon storage is used using the Stock-Difference method (IPCC, 2006) (see Equation 6).
For the EF representing annual carbon flux per area:
For the EF representing carbon storage per area:
In which,
EMi,j is the emission of CO2 of the j carbon pool in the i category, MgC ha-1;
EFi,j is CO2 emission factors of the j carbon pool in the i category, MgC ha-1 or MgC ha-1 yr-1;
Ai is the area of the i category of land-use change during t1 and t2, ha;
j is one category of the 5 carbon pools;
3.67 is the transfer factor for transferring carbon to carbon dioxide.
For simplifying the complicated guidance of the 2013 Supplement, we use the tier 1 method and relevant assumptions. Biomass is the only carbon pool considered in CC, and coverage change is used for estimating change of carbon storage in this pool; all carbon storage in the 5 carbon pools is assumed to be depleted and emitted as CO2 during the period of extraction in CN, and the carbon sequestration induced by rewetting and revegetation, and creation is calculated yearly in NC.
Activity data
Activity data is defined as the magnitude of human activity resulting in emissions or removals during a given period. For coastal wetlands, data on land areas, management systems and fertilizer use are activity data. The activity data used in this study includes ACC, ANC, ACN, ALS and Pα. Satellite imagery was used to estimate areas of the three land-use change categories and relevant sub-categories. The data for two periods of satellite imagery (2010 and 2020) with a 1.2m resolution covering the whole coastal area of Hainan were downloaded from Google Earth. The cloud coverage of imagery is less than 10%. A vector of mangrove distribution in 2020, from an official survey, was introduced in the study for ensuring data consistency and accuracy. The vector overlapped with the imagery from 2020, and the surface factures within the vectors were classified into mangroves, tidal flats, aquaculture ponds and construction lands. Then, the vector was overlapped with imagery from 2010, and the surface factures were classified as the same to get ACC and ANC, while mangroves outside the vector were added to map the 2010 mangrove distribution. Then the vector of mangrove distribution in 2010 was overlapped with imagery from 2020 to figure out the areas (ACN) of mangroves, measured in 2010, that had changed to other land-use categories. The areas (ALS) of mangroves restored in freshwaters and brackish waters were calculated to estimate the CH4 emissions. For the CC category, pixel-based classification using the Maximum Likelihood Method was used for calculating the vegetation coverage rate (at1 , at2) of mangroves in the two periods. The classification accuracies were over 85%. Data from the Hainan Statistics Yearbook on the production of shrimp was used as Pα because shrimp aquaculture is the main aquaculture activity in the coastal areas of Hainan, with fish aquaculture often being conducted in aquaculture farms on land or in offshore cages at the depth > 6m.
Emissions factors
An emission factor (EF) is a coefficient that relates the activity data to the amount of greenhouse gases or its precursors and is calculated at an average emission rate, which is often based on published measurement data. In this study, EFs, including mangrove above-ground biomass carbon storage (EFAGB), soil carbon storage (EFsoil) and the soil carbon sequestration rate (EFrewet) have been assembled through a synthesis of peer-reviewed literatures. Default values from the 2013 Supplement were applied to other EFs which are not available in the literature, such as to EFDW, EFlitter, EFGR, EFCH4 , and EFN2O . We searched the literature on the Web of Science using the search topic “TS=(carbon OR biomass) AND mangrove* AND (China OR Hainan)”, and in the CNKI (www.cnki.net), a Chinese literature database, using the search topic “SU=红树林*海南*(碳+生物量)”. Data from 20 informative papers (10 from the Web of Science, and 10 from CNKI) were compiled and assimilated (Supplementary Information Tables S2 and Table S3). We followed the suggestion of the 2013 Supplement and set the depth of the soil carbon pool at 1 m, and data of soil carbon storage at a depth of more or less than 1 m were transferred to 1 m depth with the assumption that the soil organic carbon content with the depth > 0.5 m is stable. For regions lacking local data on emission factors, the values of adjacent regions were used as a default value. Considering that the mangroves are distributed unevenly in Hainan, we calculated the weighted average EFAGB and EFsoil for Hainan Province as below:
In which:
EFAGB,Hainan is the average above-ground biomass carbon storage per area of Hainan, MgC ha-1;
EFsoil,Hainan is the average soil organic carbon storage per area of Hainan, MgC ha-1;
EFAGB,k is the average aboveground biomass carbon storage per area of the k region, MgC ha-1;
EFsoil,k is the average organic soil carbon storage per area of the k region, MgC ha-1;
Ak is the area of mangroves in the k region, ha;
AHainan is the total area of mangroves in Hainan, ha.
Results
The land-use change of mangroves between 2010 and 2020
Mangroves are distributed in all coastal regions of Hainan province (see Figure 1), 81.7% of which are located in the northern regions of Haikou, Wenchang and Danzhou, while the other areas of mangroves are scattered across 9 other coastal regions (see Table 2). The total area of mangroves in 2010 increased from 4,190.7ha to 4,644.1 ha in 2020, with an average annual growth rate of 1.1%. 4,175.4 ha of mangroves fall into the category of CC. The vegetation coverage rate increased from 91.4% to 91.5% province-wide, but it decreased in Haikou, Wenchang, Chengmai, Lingao and Ledong. A total of 483.9 ha of tidal flats (AFC) and aquaculture ponds (APC) have been revegetated into mangroves, in which, 70.3 ha we created in freshwater and brackish water. 15.3 ha of mangroves have been transformed into aquaculture ponds and construction lands. The net increased area of mangroves is 453.3 ha, while another 4.1 ha will be added in consideration of the change in vegetation coverage between 2010 and 2020.
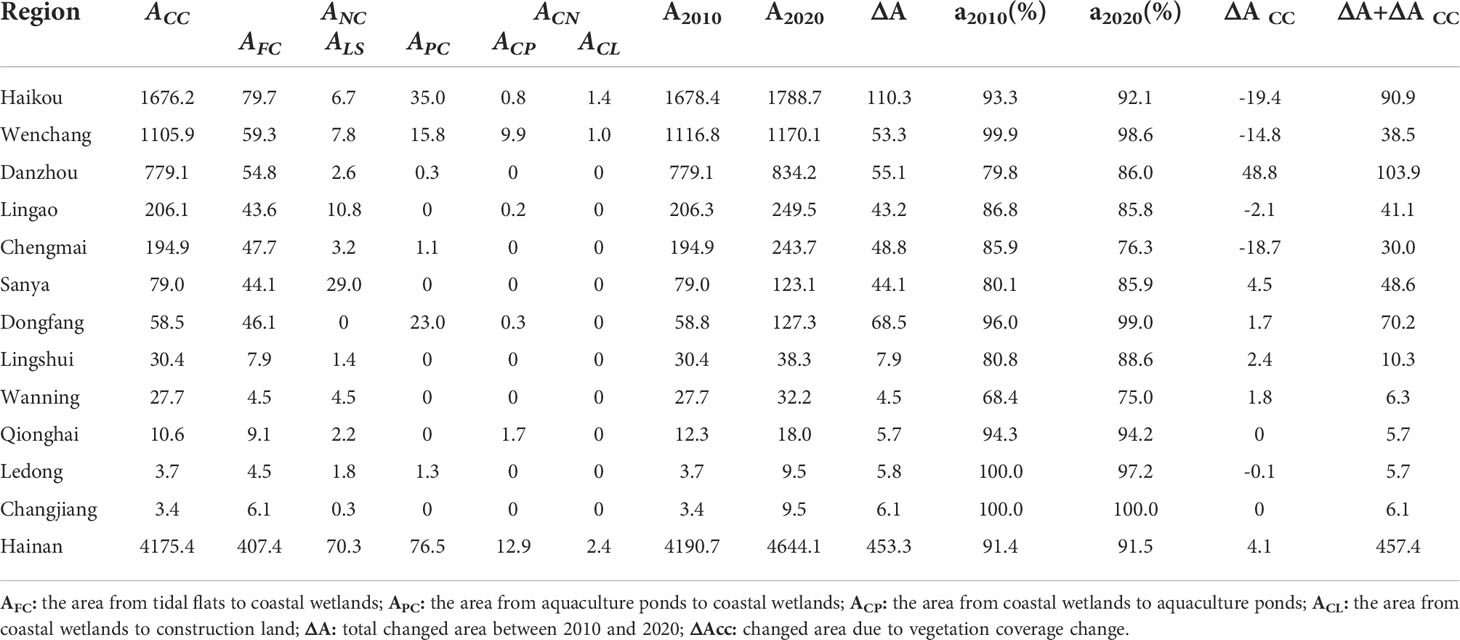
Table 2 Land-use change of coastal wetlands of Hainan between 2010 and 2020. Unit: ha.
Emission factors relating to Hainan and its coastal regions
There are 103 AGB data and 159 soil organic carbon storage data in peer-review literatures in English and Chinese. 94% of the AGB data and 96% of the soil carbon storage data relate to mangroves in Haikou, Wenchang, Danzhou and Sanya. The weighted average EFAGB and EFsoil of Hainan is 61.7 MgC ha-1 and 227.4 MgC ha-1. By using the default value (0.49) of R, the sum of the weighted average of biomass and soil carbon storage is 319.3 MgC ha-1 (see Figure 2). The highest average EFAGB is EFAGB as recorded in Qionghai, while the average EFsoil of Wenchang is also the highest among this category. EFAGB relating to Dongfang is close to that of Qionghai, and the EFAGB in the remaining regions are between 52.6 and 66.2 MgC ha-1. EFsoil in Wenchang and Qionghai ranks the second highest in Hainan; while the EFsoil in Haikou, Chengmai, Danzhou and Sanya is less than 200 MgC ha-1 (see Table 3).
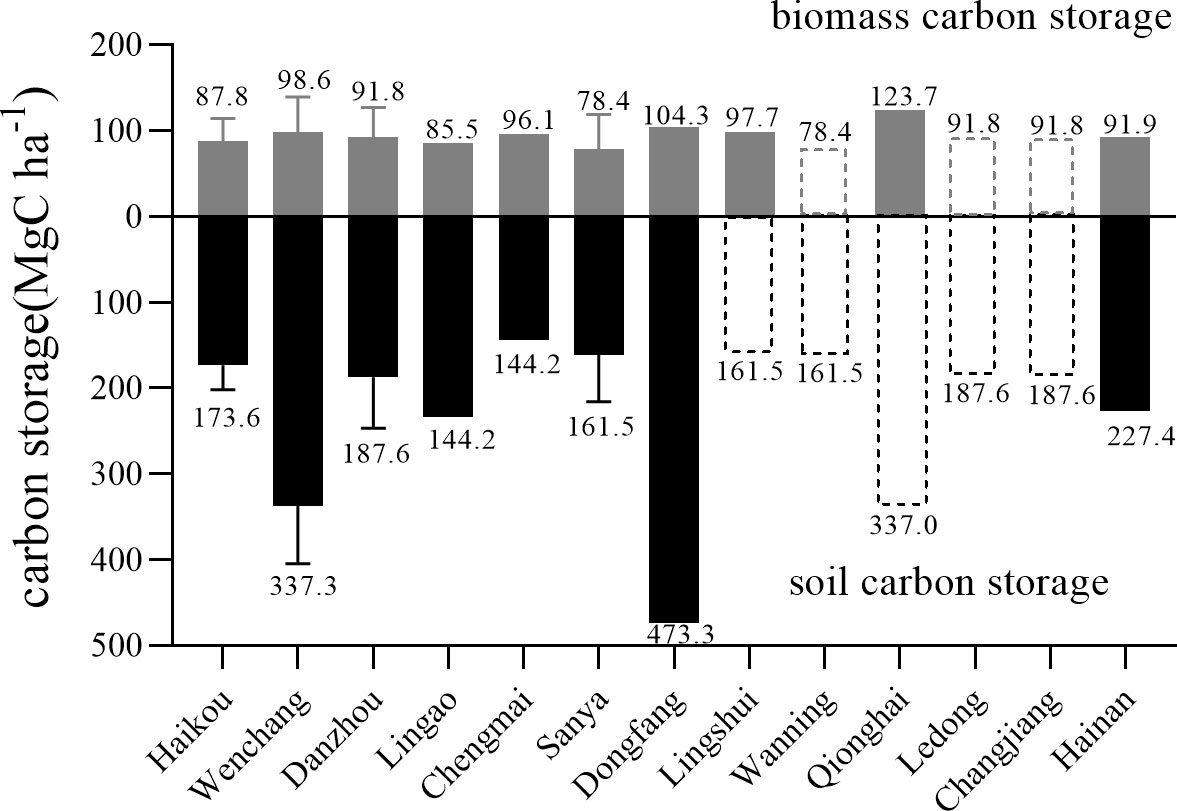
Figure 2 The average carbon storage of biomass and soil in the mangroves in Hainan. Dash lines indicate the value of adjacent regions is cited.
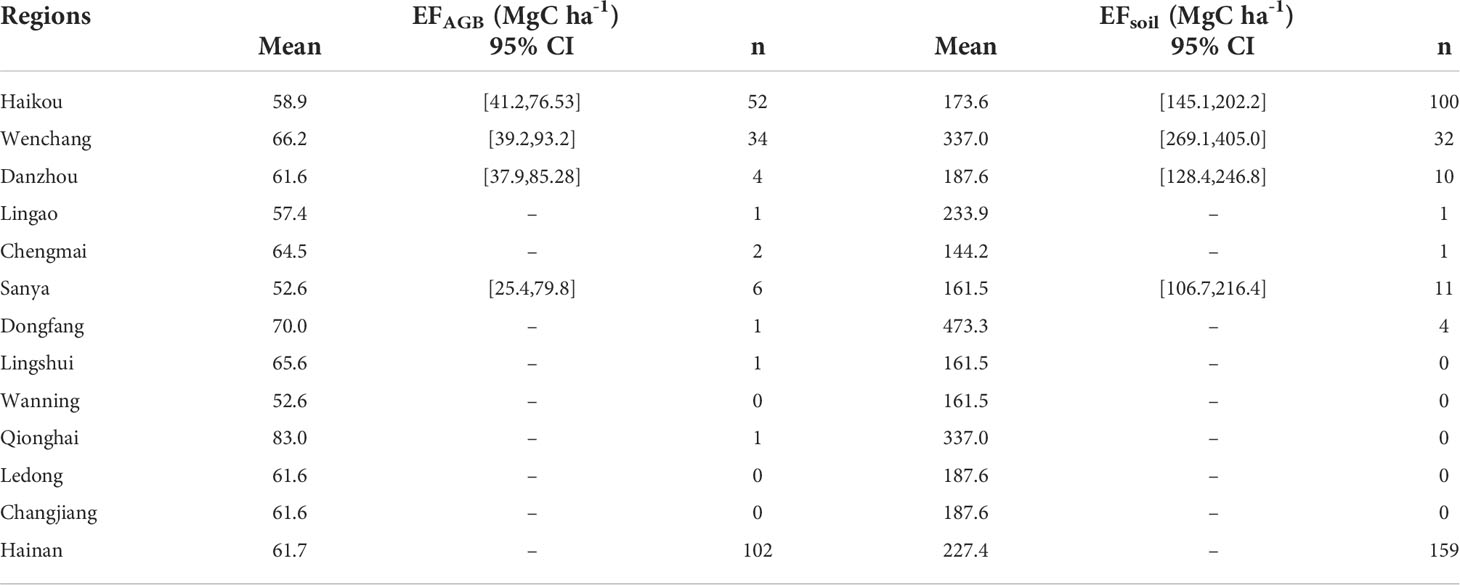
Table 3 The EFAGB and EFSOC of mangroves in Hainan
The GHGs inventory for coastal wetlands in Hainan
The annual average net CO2 emission of mangroves of Hainan is -26974.3 MgCO2e yr-1 during 2010 to 2020 (See Table 4). The CO2 emissions (-27355.6 MgCO2e yr-1) from biomass, soil, dead woods and litters in the mangroves is offset by the CH4 emissions (381.3 MgCO2e yr-1) resulting from the rewetting and restoration activities in the areas which registered a salinity of<18 ppt. The soil carbon pool in the mangroves in Wenchang and Qionghai emitted CO2 due to 9.9 ha and 1.7 ha of mangroves becoming transformed into ponds, which, in turn, also enhanced the emissions of biomass carbon pool. With more unvegetated lands transferring to mangroves, we can see Haikou, Danzhou and Dongfang as the top three regions in their net contribution of CO2 removals. Because two-thirds of the mangroves restoration in Sanya occurred in freshwaters, the CH4 emission was the highest for Hainan.

Table 4 The CO2 and CH4 inventory for mangroves in Hainan. Unit: MgCO2e yr-1.
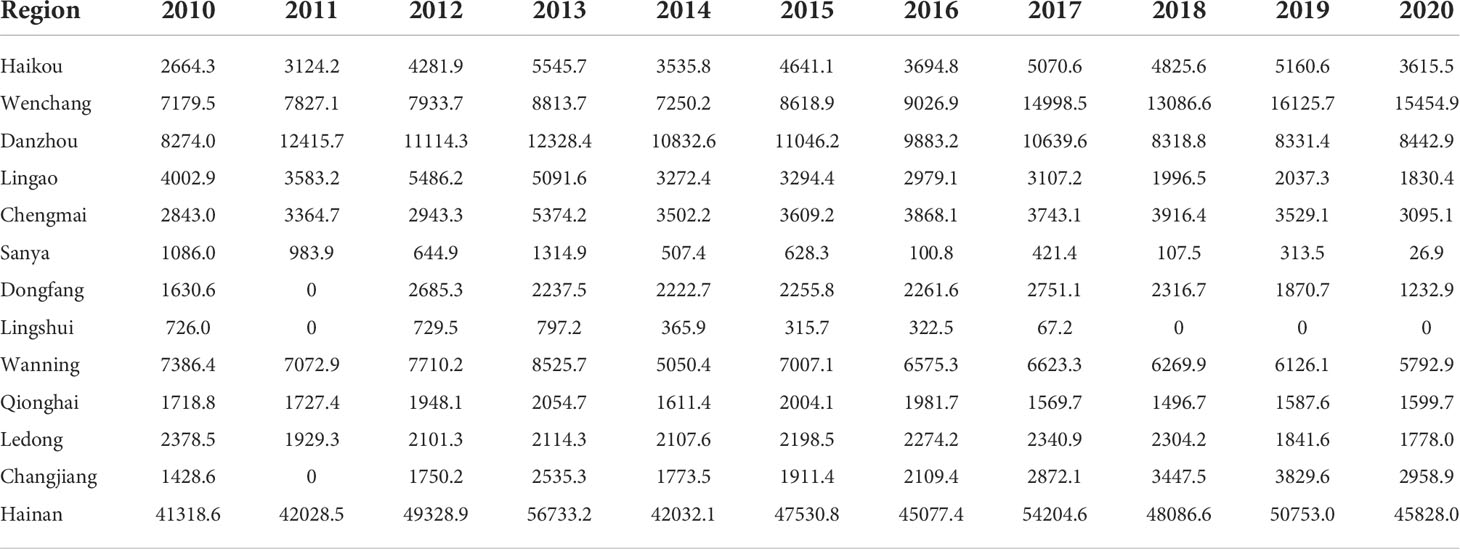
Table 5 N2O emissions of shrimp aquaculture in Hainan. Unit: MgCO2e yr-1.
Discussion
The important role of coastal blue carbon in climate mitigation has been widely accepted and passionately discussed domestically in China and worldwide (Wu et al., 2020; Macreadie et al., 2021). More and more countries include the blue carbon into their Nationally Determined Contributions, however most of countries have not reported coastal blue carbon in national inventories as the United States and Australia have done on account of them lacking qualified national activity data and an assembly of local emission factors (Yona et al., 2020). Sub-national policies and actions on blue carbon without waiting for instruction from higher authorities should be the choice for dealing locally with the climate crisis (Wedding et al., 2021), and incorporating coastal blue carbon into inventories is essential for the achievement of this goal. Compared to the national inventory, sub-national inventory reporting requires detailed tier 3 data from remote sensing and on-site studies that is not only informative for climate mitigation but is also informative of land-use changes, biodiversity conservation, industrial development, and so on.
This study reports on the GHG emissions or removals from mangroves affected by human activities in Hainan, which demonstrated a net sink capacity of CO2e during the 2010 to 2020 period, where the total area of mangroves and vegetation coverage has increased, reflecting the efforts of mangroves protection, rehabilitation and restoration in both Hainan and China in general. However, the local figures of land-use change also alert us to the impact of CO2 emissions. For example, the descending coverage rates in Haikou, Wenchang, Chengmai and Lingao, four regions north of Hainan, may have been caused by a sea-level rise, pests and diseases or liana (Derris trifoliate), meaning the necessary adaption measures should be considered and implemented. Although the Hainan Province Mangrove Protection Regulations was adopted in 1998, some mangroves have nevertheless been destroyed in Haikou, Wenchang, Qionghai, Lingao and Dongfang. The 13.9% removal of mangrove reforestation on aquaculture ponds in Wenchang, Dongfang and Haikou is offset by emissions from deforestation for the purpose of establishing aquaculture, even if ACN/ANC is 0.03, we are reminded that we need to strengthen the protection of mangroves and avoid deforestation in these areas.
N2O emissions from aquaculture in coastal wetlands is about two times that of the CO2 removal facilitated by managed mangroves, which, in turn, has a significant impact on the inventory. This problem should be taken into serious consideration by leading countries in aquaculture production. Descending shrimp production in Sanya and Lingshui, since 2019, represents the initial ‘transferring ponds to wetlands’ across the whole province. Since most of ponds on tidal flats have been dismantled and reforested with mangrove, the N2O emissions in these regions will plummet in the near future. According to the National Action Plan of Mangroves Protection and Restoration Plan (2020-2025), 5200 ha of mangroves will have been rehabilitated and restored in Hainan, and 18800 ha in China by 2025. This increase of CO2 removal will be accompanied by a decrease in N2O emissions.
This study also illustrates that there are data gaps that need to be addressed to reduce uncertainty of local inventory, which would also be informative on the national level. Some default values from IPCC 2013 Supplement have to be used as emission factors because there is a lack of national and local data, which may produce uncertainty in the inventory. It is suggested that the default values should be replaced with local data as far as possible. Meanwhile, investigation on the carbon storage of different carbon pools and the sequestration rate of above-ground biomass and soil are necessary to fill data gaps in other regions besides those of Haikou, Wenchang and Sanya, as emission factors for coastal blue carbon is highly impacted by environmental factors and plant species (Wang et al., 2019). For countries and regions that have no land-use change data or the land-use categories that are consistent with the 2006 Guidelines and the 2013 Supplement, it is suggested that a land-use change matrix be built based on official survey vectors. While it is common that countries lack spatially explicit seagrass data because of economic and technical difficulties (Unsworth et al., 2019), the Australia Inventory established a good practice of reporting on the areas of drained seagrasses, an activity which requires collaboration between different government agencies. As a comprehensive solution for Hainan and China, as well as other countries and sub-national regions, it is suggested that there be a compilation of a EFs database that incorporates the main locations, species, salinities and latitudes, which models the prediction of the EFs of certain independent variables. The development of an automatic imagery analysis system supported by machine learning continues to be a necessity for efficiently and promptly monitoring land-use change and the production activity data.
We suggest countries and sub-country regions should begin bringing coastal blue carbon into their GHGs inventories as soon as possible, and that they should take a bottom-up strategy to addressing this task. This will not only be helpful to stakeholders and decision-makers when needing to learn what has happened to coastal wetlands as a result of climate changes, but this initiative will also make nature-based solutions computable and visible, which, in the end, will inform climate change mitigation and adaptation strategies.
Data availability statement
The original contributions presented in the study are included in the article/Supplementary Material. Further inquiries can be directed to the corresponding author.
Author contributions
PZ and FW conceived and designed the study. SG, XW and BW collected and analyzed the data. PZ, SG, and CZ drafted the manuscript. PZ, FW and SK revised the manuscript. All authors contributed to the article and approved the submitted version.
Funding
This study was supported by the Key R & D Plan of Hainan Province (ZDYF2021SHFZ255), the S & T Plan of Beihai City(BKH2020165011), the Open Research of State Key Laboratory of Marine Resource Utilization in the South China Sea(MRUKF2021013), the Blue Planet Project (PORO000642) supported by WWF and OPF and the Research on Coastal Blue Carbon Status and Development Strategy of China supported by Paulson Institute and Heren Charitable Foundation.
Conflict of interest
The authors declare that the research was conducted in the absence of any commercial or financial relationships that could be construed as a potential conflict of interest.
Publisher’s note
All claims expressed in this article are solely those of the authors and do not necessarily represent those of their affiliated organizations, or those of the publisher, the editors and the reviewers. Any product that may be evaluated in this article, or claim that may be made by its manufacturer, is not guaranteed or endorsed by the publisher.
Supplementary material
The Supplementary Material for this article can be found online at: https://www.frontiersin.org/articles/10.3389/fmars.2022.932984/full#supplementary-material
References
Bindoff N., Cheung W. W. L., Kairo J. G., Aristegui J., Guinder V., Hilmi N., et al. (2019). Changing ocean, marine ecosystems, and dependent communities," in The ocean and cryosphere in a changing climate: special report of the intergovernmental panel on climate change. (Cambridge: Cambridge University Press), 447–588. doi: 10.1017/9781009157964.013
Chen L., Wang W., Zhang Y., Lin G. (2009). Recent progresses in mangrove conservation, restoration and research in China. J. Plant Ecol. 2, 45–54. doi: 10.1093/jpe/rtp009
Chmura G. L., Anisfeld S. C., Cahoon D. R., Lynch J. C. (2003). Global carbon sequestration in tidal, saline wetland soils. Global Biogeochemical Cycles 17, 1111. doi: 10.1029/2002GB001917
Costanza R., Arge, Groot R. D., Farberk S., Belt M. (1997). The value of the world's ecosystem services and natural capital. Nature 387, 253–260. doi: 10.1038/387253a0
Crooks S., Sutton-Grier A. E., Troxler T. G., Herold N., Wirth T. (2018). Coastal wetland management as a contribution to the US national greenhouse gas inventory. Nat. Climate Change 8, 1109–1112. doi: 10.1038/s41558-018-0345-0
Duarte C. M., Losada I. J., Hendriks I. E., Mazarrasa I., Marba N. (2013). The role of coastal plant communities for climate change mitigation and adaptation. Nat. Climate Change 3, 961–968. doi: 10.1038/nclimate1970
Feller I. C., McKee K. L., Cahoon D. (2007). Caribbean Mangroves adjust to rising sea level through biotic controls on change in soil elevation. Global Ecol. Biogeography 16, 545–556. doi: 10.1111/j.1466-8238.2007.00317.x
Gallo N. D., Victor D. G., Levin L. A. (2017). Ocean commitments under the Paris agreement. Nat. Climate Change 7, nclimate3422. doi: 10.1038/nclimate3422
Gao T., Ding D., Guan W., Liao B. (2018). Carbon stocks of coastal wetland ecosystems on hainan island, China. Polish J. Environ. Stud. 27, 1061–1069. doi: 10.15244/pjoes/76501
Howard J., Sutton-Grier A., Herr D., Kleypas J., Landis E., Mcleod E., et al. (2017). Clarifying the role of coastal and marine systems in climate mitigation. Front. Ecol. Environ. 15. doi: 10.1002/fee.1451
Hu W., Zhang D., Chen B., Liu X., Ye X., Jiang Q., et al. (2021). Mapping the seagrass conservation and restoration priorities: Coupling habitat suitability and anthropogenic pressures. Ecol. Indic. 129, 107960. doi: 10.1016/j.ecolind.2021.107960
Iacono C. L., Mateo M. A., Gràcia E., Guasch L., Carbonell R., Serrano L., et al. (2008). Very high-resolution seismo-acoustic imaging of seagrass meadows (Mediterranean sea): Implications for carbon sink estimates. Geophysical Res. Lett. 35, 102–102. doi: 10.1029/2008GL034773
IPCC (2014). 2013 supplement to the 2006 IPCC guidelines for national greenhouse gas inventories (Switzerland: Wetlands).
Liao J., Zhen J., Zhang L., Metternicht G. (2019). Understanding dynamics of mangrove forest on protected areas of hainan island, China: 30 years of evidence from remote sensing. Sustainability 11, 5356. doi: 10.3390/su11195356
Liu L., Wang H.-J., Yue Q. (2020). China's coastal wetlands: Ecological challenges, restoration, and management suggestions. Regional Stud. Mar. Sci. 37, 101337. doi: 10.1016/j.rsma.2020.101337
Macreadie P. I., Anton A., Raven J. A., Beaumont N., Connolly R. M., Friess D. A., et al. (2019). The future of blue carbon science. Nat. Commun. 10, 3998. doi: 10.1038/s41467-019-11693-w
Macreadie P. I., Costa M. D. P., Atwood T. B., Friess D. A., Kelleway J. J., Kennedy H., et al. (2021). Blue carbon as a natural climate solution. Nat. Rev. Earth Environ. 2, 826–839. doi: 10.1038/s43017-021-00224-1
Meng W., Feagin R. A., Hu B., He M., Li H. (2019). The spatial distribution of blue carbon in the coastal wetlands of China. Estuarine Coast. Shelf Sci. 222, 13–20. doi: 10.1016/j.ecss.2019.03.010
Pan W., Gulzar M. A., Wang Z., Guo C. (2022). Spatial distribution and regional difference of environmental efficiency based on carbon reduction goals: Evidence from China. Front. Environ. Sci. 9. doi: 10.3389/fenvs.2021.816071
Sun Z., Sun W., Tong C., Zeng C., Yu X., Mou X. (2015). China's coastal wetlands: Conservation history, implementation efforts, existing issues and strategies for future improvement. Environ. Int. 79, 25–41. doi: 10.1016/j.envint.2015.02.017
Unsworth R. K. F., Nordlund L. M., Cullen-Unsworth L. C. (2019). Seagrass meadows support global fisheries production. Conserv. Lett. e12566. doi: 10.1111/conl.12566
Wang G., Guan D., Xiao L., Peart M. R. (2019). Ecosystem carbon storage affected by intertidal locations and climatic factors in three estuarine mangrove forests of south China. Regional Environ. Change 19, 1701–1712. doi: 10.1007/s10113-019-01515-6
Wang X., Xiao X., Xu X., Zou Z., Chen B., Qin Y., et al. (2021). Rebound in china's coastal wetlands following conservation and restoration. Nat. Sustainability 4, 1076–1083. doi: 10.1038/s41893-021-00793-5
Wang X., Xiao X., Zou Z., Hou L., Li B. (2020). Mapping coastal wetlands of China using time series landsat images in 2018 and Google earth engine. ISPRS J. Photogrammetry Remote Sens. 163, 312–26. doi: 10.1016/j.isprsjprs.2020.03.014
Wedding L. M., Moritsch M., Verutes G., Arkema K., Hartge E., Reiblich J., et al. (2021). Incorporating blue carbon sequestration benefits into sub-national climate policies. Global Environ. Change-Human Policy Dimensions 69, 102206. doi: 10.1016/j.gloenvcha.2020.102206
Wilson D., Dixon S. D., Artz R. R. E., Smith T. E. L., Evans C. D., Owen H. J. F., et al. (2015). Derivation of greenhouse gas emission factors for peatlands managed for extraction in the republic of Ireland and the united kingdom. Biogeosciences 12, 5291–5308. doi: 10.5194/bg-12-5291-2015
Wu J. P., Zhang H. B., Pan Y. W., Krause-Jensen D., He Z. G., Fan W., et al. (2020). Opportunities for blue carbon strategies in China. Ocean Coast. Manage. 194, 105241. doi: 10.1016/j.ocecoaman.2020.105241
Yona L., Cashore B., Jackson R. B., Ometto J., Bradford M. A. (2020). Refining national greenhouse gas inventories. Ambio 49, 1581–1586. doi: 10.1007/s13280-019-01312-9
Keywords: coastal wetlands, mangrove, Hainan, climate change, land use change (LUC), biomass carbon accumulation, soil carbon sequestration
Citation: Zhao P, Ge S, He D, Zhong C, Wang B, Wang X, Wang F and Kao S (2022) Incorporating coastal blue carbon into subnational greenhouse gas inventories. Front. Mar. Sci. 9:932984. doi: 10.3389/fmars.2022.932984
Received: 30 April 2022; Accepted: 05 July 2022;
Published: 28 July 2022.
Edited by:
Meilin WU, Chinese Academy of Sciences, ChinaReviewed by:
Yunwei Dong, Ocean University of China, ChinaFeixue Li, Nanjing University, China
Hanzhi Lin, Science Systems and Applications, Inc., United States
Baowen Liao, Chinese Academy of Forestry, China
Copyright © 2022 Zhao, Ge, He, Zhong, Wang, Wang, Wang and Kao. This is an open-access article distributed under the terms of the Creative Commons Attribution License (CC BY). The use, distribution or reproduction in other forums is permitted, provided the original author(s) and the copyright owner(s) are credited and that the original publication in this journal is cited, in accordance with accepted academic practice. No use, distribution or reproduction is permitted which does not comply with these terms.
*Correspondence: Fengxia Wang, c3VtbWVyX3dhbmdmeEAxMjYuY29t
†These authors have contributed equally to this work and share first authorship