 Jorge López-Parages
 Iñigo Gómara
 Belén Rodríguez-Fonseca3,4
 Jesús García-Lafuente
95% of researchers rate our articles as excellent or good
Learn more about the work of our research integrity team to safeguard the quality of each article we publish.
Find out more
ORIGINAL RESEARCH article
Front. Mar. Sci. , 03 October 2022
Sec. Marine Fisheries, Aquaculture and Living Resources
Volume 9 - 2022 | https://doi.org/10.3389/fmars.2022.931832
This article is part of the Research Topic Impacts of Environmental Variability Related to Climate Change on Biological Resources in the Mediterranean View all 12 articles
This study investigates the link between large-scale variability modes of the sea surface temperature (SST) and the surface chlorophyll-a (Chl-a) concentration in spring along the northern flank of the Alboran Sea. To this aim, surface satellite-derived products of SST and Chl-a, together with atmospheric satellite variables, are used. Our results indicate that both the tropical North Atlantic and El Niño Southern Oscillation (ENSO) could trigger the development of anomalous distribution patterns of Chl-a in spring in northern Alboran. This anomalous feature of Chl-a is, in turn, associated with the alteration of the usual upwelling taking place in northern Alboran at that time of the year. The skill of the related SST signals, over the tropical North Atlantic and the tropical Pacific, as predictors of the aforementioned Chl-a response in Alboran, has also been assessed through a statistical prediction model with leave-one-out cross-validation. Our results confirm the predictive skill of ENSO to realistically estimate the coastal Chl-a concentration in spring in northern Alboran. In particular, during the El Niño/La Niña years, this Chl-a response can be robustly predicted with 4 months in advance. On the other hand, the tropical North Atlantic SSTs allow to significantly predict, up to 7 months in advance, the Chl-a concentration in spring offshore, in particular by the north of the Western and the Eastern Alboran gyres. The results presented here could contribute to develop a future seasonal forecasting tool of upwelling variability and living marine resources in northern Alboran.
The Alboran Sea is not only a natural barrier between the European and African continents but a region that connects Mediterranean and Atlantic water masses with very different characteristics. Due to its geographical location, the Alboran Sea also presents interesting aspects from a climatic, oceanographic, and biological point of view.
Despite the upper-level circulation of the Alboran Sea being very complex, a classical and simplified picture (see Figure 1) can be described as an incoming jet of Atlantic water (AJ) following a wavelike path around two anticyclonic gyres: the Western Alboran Gyre (WAG) and the Eastern Alboran Gyre (EAG). The northern Alboran Sea (defined as 5.3°W-2°W; 36°N-37°N; see red box in Figure 1) is also characterized by the presence of vertical transport of salty and nutrient-rich waters from below. This upwelling area can be easily observed from satellite data and contributes to enhance the biological productivity of this marine region. Indeed, the Alboran Sea is considered the most productive basin within the Mediterranean Sea (Bosc et al., 2004; Lazzari et al., 2011), particularly the Iberian coastal margin and the northern sector of the WAG (Minas et al., 1991; Reul et al., 2005).
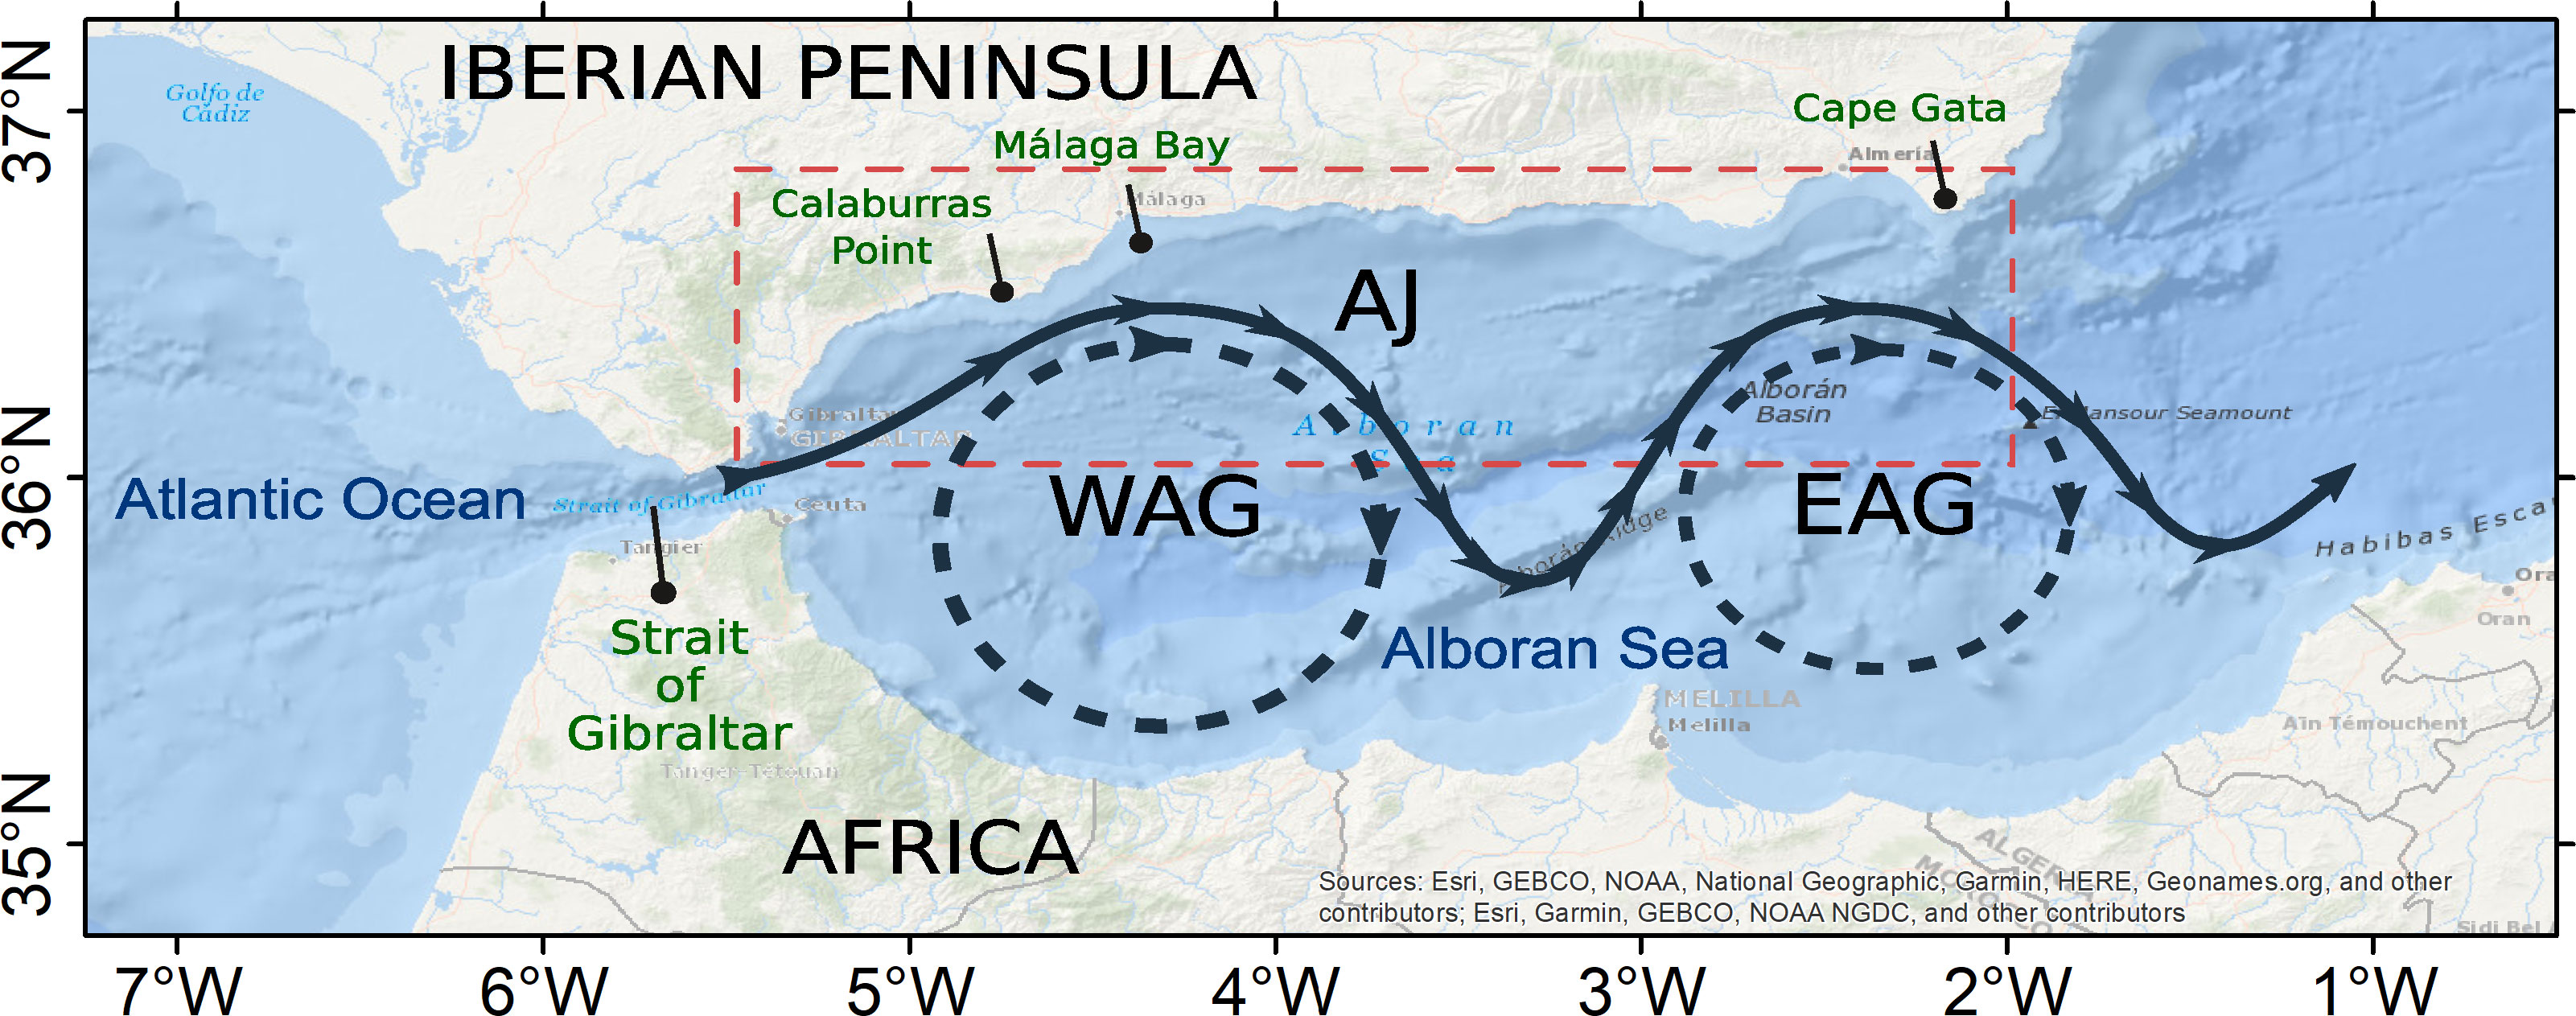
Figure 1 Simplified sketch of the study region and the Alboran Sea ocean dynamic. The area within the red box represents the so-called northern Alboran Sea (nAS). WAG and EAG refer to the so-called Western and Eastern Alboran Gyres, respectively, and AJ denotes the incoming jet of Atlantic water.
Several mechanisms are known to foster the abovementioned upwelling along the northern Alboran Sea. According to the available literature, both the wind-driven upwelling (Mercado et al., 2012) and the meridional fluctuations of the Atlantic Jet (Sarhan et al., 2000) appear to be its main drivers. Both influence the vertical supply of nutrients to the photic zone, the generation of phytoplankton blooms, and the Chlorophyll-a spatial distribution (Sarhan et al., 2000; Ramírez, 2007). Nevertheless, it is also important to note that this upwelling is far from being spatially homogeneous. In this sense, Baldacci et al. (2001) defined two upwelling areas: the first one between the Strait of Gibraltar (~5.5°W) to the Calaburras Point (~4.5°W) and the second one (also denoted as the Atlantic-Mediterranean Transition zone; see Muñoz et al., 2017) from the Calaburras Point to Cape Gata (~2°W). Both areas present similar forcing, but they differ in their upwelling seasonality along the year. Overall, a maximum of chlorophyll-a concentration has been found in late winter and spring (Ramírez et al., 2005; Macías et al., 2007; Lazzari et al., 2011), with a progressive decline from June onward. Nevertheless, upwelling events can occur even in summer under strong favorable SW–W winds producing Ekman transport and leading to occasional blooms (Ramírez et al., 2005).
Additional to the seasonal changes, the Alboran circulation and the upwelling on its northern flank also fluctuates at shorter (~inertial) and longer (inter-annual) time scales. The former is known to be mainly associated with meso- and submeso-scale processes driven by atmospheric fluctuations (Garcıa-Lafuente et al., 1998) and smaller oceanic processes such as tidal currents. This variability has been deeply analyzed and plays a significant role in the stability of the WAG (Sánchez Garrido et al., 2008; Sánchez-Garrido et al., 2013). Contrastingly, the understanding of the physical mechanisms behind the interannual variability of the Alboran circulation still poses great challenges. Overall, the interannual variability of upwelling along the northern Alboran Sea is closely related to the prevalence of favorable SW–W winds (Ponientes in Spanish), which in turn must be linked to appropriate atmospheric circulation conditions (Garcia-Gorriz and Carr, 2001). Such winds are generally associated with a dipole of sea level pressure (SLP) anomalies in the North Atlantic, with relatively high (low) pressures in subpolar (subtropical) latitudes. These SLP anomalies are usually linked to the negative phase of the North Atlantic Oscillation (NAO), the dominant atmospheric variability pattern in this region (Pinto and Raible, 2012; Gómara et al., 2016). It is important to note that the year-to-year (or longer) atmospheric fluctuations can be interpreted as changes in the frequency of day-to-day meteorological fluctuations provided the hypothesis of long-term quasi-stationary climate (Cassou, 2010). In this sense, apart from NAO, other modes contributing to interannual climate variability such as the tropical North Atlantic (Rodríguez-Fonseca et al., 2006; Losada et al., 2007) or ENSO (Brönnimann, 2007; Shaman, 2014) have been identified as drivers of wind anomalies over the western Mediterranean. ENSO and NAO have been highlighted as forcings of anomalous chlorophyll-a distributions and phytoplankton primary production in different subregions of the Mediterranean basin (Katara et al., 2008; Basterretxea et al., 2018; González-Lanchas et al., 2020). However, the specific signal of these large-scale climate modes on northern Alboran, the linking mechanisms, and the related predictive value are still questions which require further investigation. This paper investigates the interannual variability of the chlorophyll-a concentration along the northern Alboran Sea. To this aim, we analyze distribution patterns of this field and their potential links with the large-scale climate. In this context, and due to the ocean thermal inertia, it is important to mention the special relevance of those climate phenomena associated with sea surface temperature (SST) processes (Bjerknes, 1969). If we are able to find a robust cause-and-effect relationship between an SST-related variability mode and a certain distribution pattern of chlorophyll-a in the Alboran Sea, we could provide the basis for developing a novel future seasonal forecasting tool of upwelling variability in our study region. This possibility is assessed and quantified along the present study.
This study is based on surface satellite-derived chlorophyll-a concentration data, available at 1-km lat–lon resolution from 1997 to 2021, from the Mediterranean ocean color level 4 operational multi-sensor processing dataset (Volpe et al., 2018). In particular, this satellite product has been used to analyze the spatiotemporal variability of surface chlorophyll-a concentrations (hereinafter Chl-a) along the northern flank of the Alboran Sea, which is representative of the upwelling variability in that area. The surface signature of upwelling within the Alboran Sea has been also addressed by the use of high-resolution sea surface temperature (SST) data at 0.05° × 0.05° lat–lon resolution from the CMEMS-reprocessed Mediterranean SST dataset, an optimally interpolated satellite-based estimate of the SST (Saha et al., 2018). The possible large-scale SST forcings of Chl-a variability in our study region have been assessed by the use of SST data from the NOAA AVHRR OISST V2.1 dataset (Huang et al., 2021; 0.25° × 0.25° lat-lon resolution). To characterize the atmospheric conditions associated with this variability, mean sea level pressure (SLP) and zonal and meridional surface winds with a 0.25° × 0.25° lat-lon resolution have been obtained from the fifth-generation ECMWF reanalysis ERA5 (Hersbach et al., 2018).
To analyze the variability of the distribution patterns of Chl-a in the northern Alboran Sea (nAS, henceforth), an empirical orthogonal function (EOF) analysis (Lorenz, 1956; Preisendorfer and Mobley, 1988) of anomalous Chl-a concentration within this area has been performed. Widely used in climate and oceanography studies, the EOF tool is very successful in comprising the complex variability of an original data set into a few number of modes while retaining most of the total variance. This statistical technique is used here to determine the directions in which the maximum variability of the anomalous Chl-a field, mathematically described in a two-dimensional space-time matrix, is organized over the Alboran Sea. By diagonalizing the corresponding covariance matrix, we obtain the EOFs (eigenvectors), the percentage of variance explained by each mode (normalized eigenvalue), and the principal components (associated time evolution as a result of the projection of the original anomalous field onto the EOFs). A simple Chl-a index defined as the spatially averaged Chl-a anomalies over the nAS has been obtained to be compared with the EOF results. The possible links between the Chl-a interannual variability in the nAS and remote SST forcings has been analyzed in terms of linear regression maps. To infer the dynamical atmospheric mechanisms at interplay, regression maps of a Chl-a time series (principal component from the EOF) onto SLP and surface winds have been also obtained.
The predictive skill at seasonal time scales has been assessed using cross-validated hindcasts based on the maximum covariance analysis (MCA) methodology (Bretherton et al., 1992; Suárez-Moreno and Rodríguez-Fonseca, 2015). MCA performs a singular value decomposition of the covariance matrix compounded by a predictor and a predictand field in such a way that the covariance of the associated expansion coefficients (timeseries) of the resultant modes is maximized. In the present study, the anomalous Chl-a concentration in spring (averaged in March–April) is identified as the variable to be predicted (i.e., the predictand field). On the other hand, the SST anomalies averaged over specific regions and at different monthly lags with respect to the Chl-a signal are used as the predictor fields. In particular, we retain the first three modes of variability from the MCA to predict the Chl-a response from the SST signal through a simple regression model, as follows:
With being the prediction of the anomalous Chl-a field (Z) and Y the anomalous SST field within a particular region and at a certain time lag. The coefficient Psi is obtained from the MCA with information provided by the resultant modes. The cross-validation technique is applied to obtain a full record of the predicted Chl-a field. To this aim, and considering nt as the number of times of our fields, the MCA is repeated nt times by leaving out one time in the Z and Y fields each time. Thus, for each time t, Psi is calculated and is predicted from Y once the specific time t is omitted. The skill is quantified in terms of the anomaly correlation coefficient (ACC) in both time and space. In space, for each gridpoint, the Chl-a hindcast () is correlated in time with the observed Chl-a (Z). In time, for each time step, the simulated spatial map of Chl-a is correlated in space with the observed Chl-a. The robustness of the analysis is assessed by representing the squared covariance fraction and the expansion coefficients (time series associated with the MCA modes) obtained for each realization of the cross-validation procedure. In this way, we can analyze if the prediction is robust or, on the contrary, it is biased to a particular time.
The statistical significance of all our results have been assessed either by a bootstrap analysis with replacement or by a Student t-test that accounts for the autocorrelation of time series through the calculation of effective degrees of freedom (Bretherton et al., 1999). In all cases, the significant results are shown at a minimum of 95% confidence level (p-values less than 0.05).
As a starting point of analysis, the seasonal cycle of Chl-a concentration (i.e., the monthly evolution along the year) has been obtained from 1998 to 2020 (not shown), finding the maximum abundance and interannual variability (in terms of the standard deviation) over the nAS in March and April. This peak in spring is consistent with previous studies within the study region (see, e.g., Ramírez et al., 2005). Then, to investigate the interannual variability of this peak of Chl-a in spring, an EOF analysis of the anomalous Chl-a concentration (averaged in March–April) within the nAS has been made. Before the EOF, all monthly anomalies are calculated by subtracting the corresponding climatology, and the effect of the long-term trends has been reduced by removing a first-order polynomial (i.e., linear trend) from all the anomalies. The resultant leading EOF explains the 63% of the total variance and is characterized by a wide area along the Spanish coast with statistically significant positive anomalies (Figure 2A). In contrast to the second and third modes, the physically meaningful identity of this leading mode is supported using the method proposed by North et al. (1982) (see Figures S1, S2 of Supplementary Material for details). Furthermore, the link between this leading mode and the Chl-a abundance along the Spanish coast is reinforced by the fact that the related time evolution (i.e., the leading principal component) also emerges by simply averaging the Chl-a anomalies within the nAS during late winter and spring months (Figure 2C). Different combinations of months (from January to April) are selected to calculate this Chl-a index, and time correlations with our Chl-a principal component of ~0.8 are found in them all.
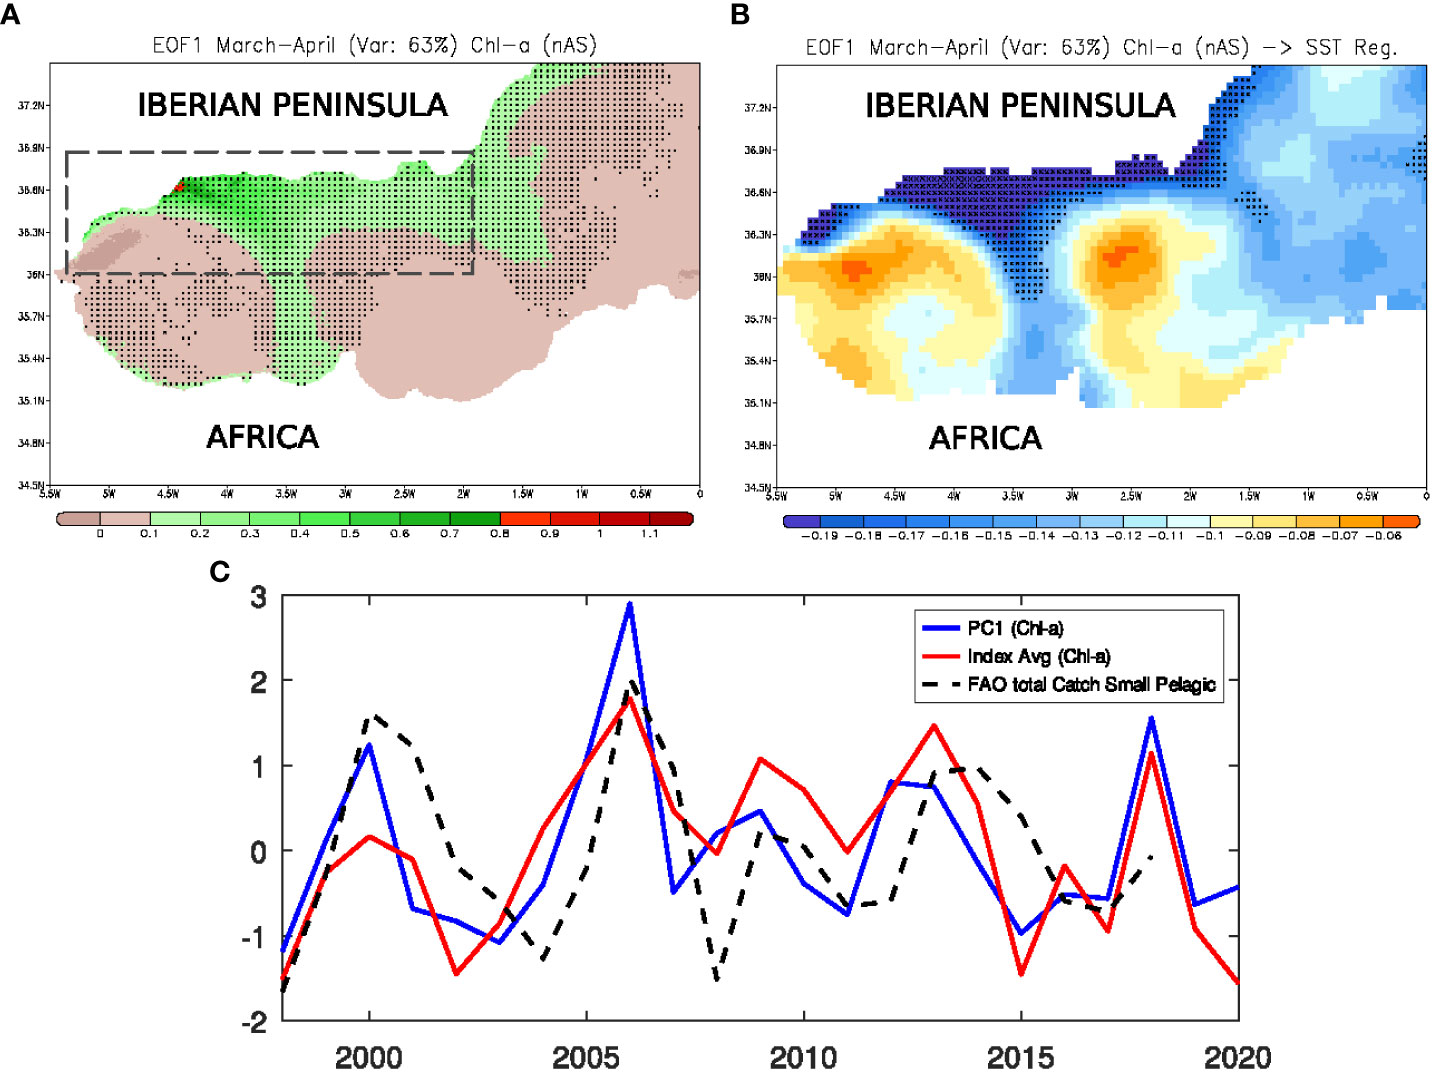
Figure 2 (A) Regression map of the leading empirical orthogonal function (EOF) of monthly Chl-a anomalies averaged in March–April and calculated over the nAS (see dashed box) onto the same Ch-a anomalies over the whole Alboran Sea (units in mg/m3 per standard deviation of PC1). (B) Regression map of the Chl-a leading mode onto the SST anomalies averaged in March–April (units in degrees per standard deviation of PC1). (C) Principal component (PC1) associated with the Ch-a leading mode in March–April over the nAS (blue line), evolution of Ch-a anomalies averaged in January–April over the nAS (red line), and annually and spatially averaged catches of small pelagic species within the nAS (dashed black line). Black points indicate areas where the response is significant (p-values less than 0.02) according to a bootstrap analysis with replacement (with 500 bootstrap replications).
The Chl-a pattern shown in Figure 2A has been documented in the past in relation to the upwelling of nutrient-rich waters (Baldacci et al., 2001; Basterretxea et al., 2018). It is specially marked within the Malaga Bay and largely extends offshore at approx. 3–3.5°W. As a result, two wide areas with negligible anomalies to the west and to the east are found. As can be seen in Figure 2A, the highest values of Chl-a roughly follow the spatial structure of the AJ waters (compare with Figure 1). This occurs because the water transported offshore due to the Ekman transport sinks where it meets the less dense AJ water. Another consequence of the aforementioned is that the pattern of our Chl-a mode is linked to the WAG and EAG gyres, with both structures located to the south of the AJ front and considered as convergence and oligotrophic zones associated with their anticyclonic gyres.
The link of our Chl-a variability mode with upwelling is consistent with the regression map of the associated principal component onto the sea surface temperature (SST) anomalies (Figure 2B). Thus, as expected, the upwelling zone identified within a narrow band along the coast is related not only to a significant increase in Chl-a abundance but also to a significant SST cooling associated with the rise of cold waters from below.
As shown in Figure 3 (right panels), the aforementioned leading Chl-a mode begins to develop in February–March east of Cape Gata. This fact responds to the occurrence of wind-driven upwelling along this part of the Iberian Peninsula. In March–April, westerlies are anomalously strong over the nAS and, as a consequence, the upwelling signature (Chl-a and SST) emerges very clearly. This coherence between anomalous Chl-a and anomalous westerlies reinforces the link of our Chl-a mode to the wind-driven upwelling associated with the Ekman transport, which is particularly important in coastal and continental shelf waters (Sarhan et al., 2000). The proposed role of wind-driven upwelling is also consistent with the intense upwelling in spring in Alboran in coincidence with stronger westerlies (Ramírez et al., 2005). The anomalous signal of Chl-a (and SST) keeps visible in April–May and begins a progressive decline from May-June onward, in agreement with the documented evolution of Chl-a and primary production in the region (Lazzari et al., 2011). In the context of the North Atlantic atmospheric circulation (see Figure 3; left panels), the related SLP configuration over the North Atlantic changes from a negative NAO-like pattern in February–March to a wavy-like structure in April–May. Please note how, in particular, the triggering of the upwelling favorable winds over the nAS in March–April coincides with the appearance of an anomalous low-pressure system over the British Islands and the weakening of the north–south (i.e., NAO-like) SLP structure over the North Atlantic.
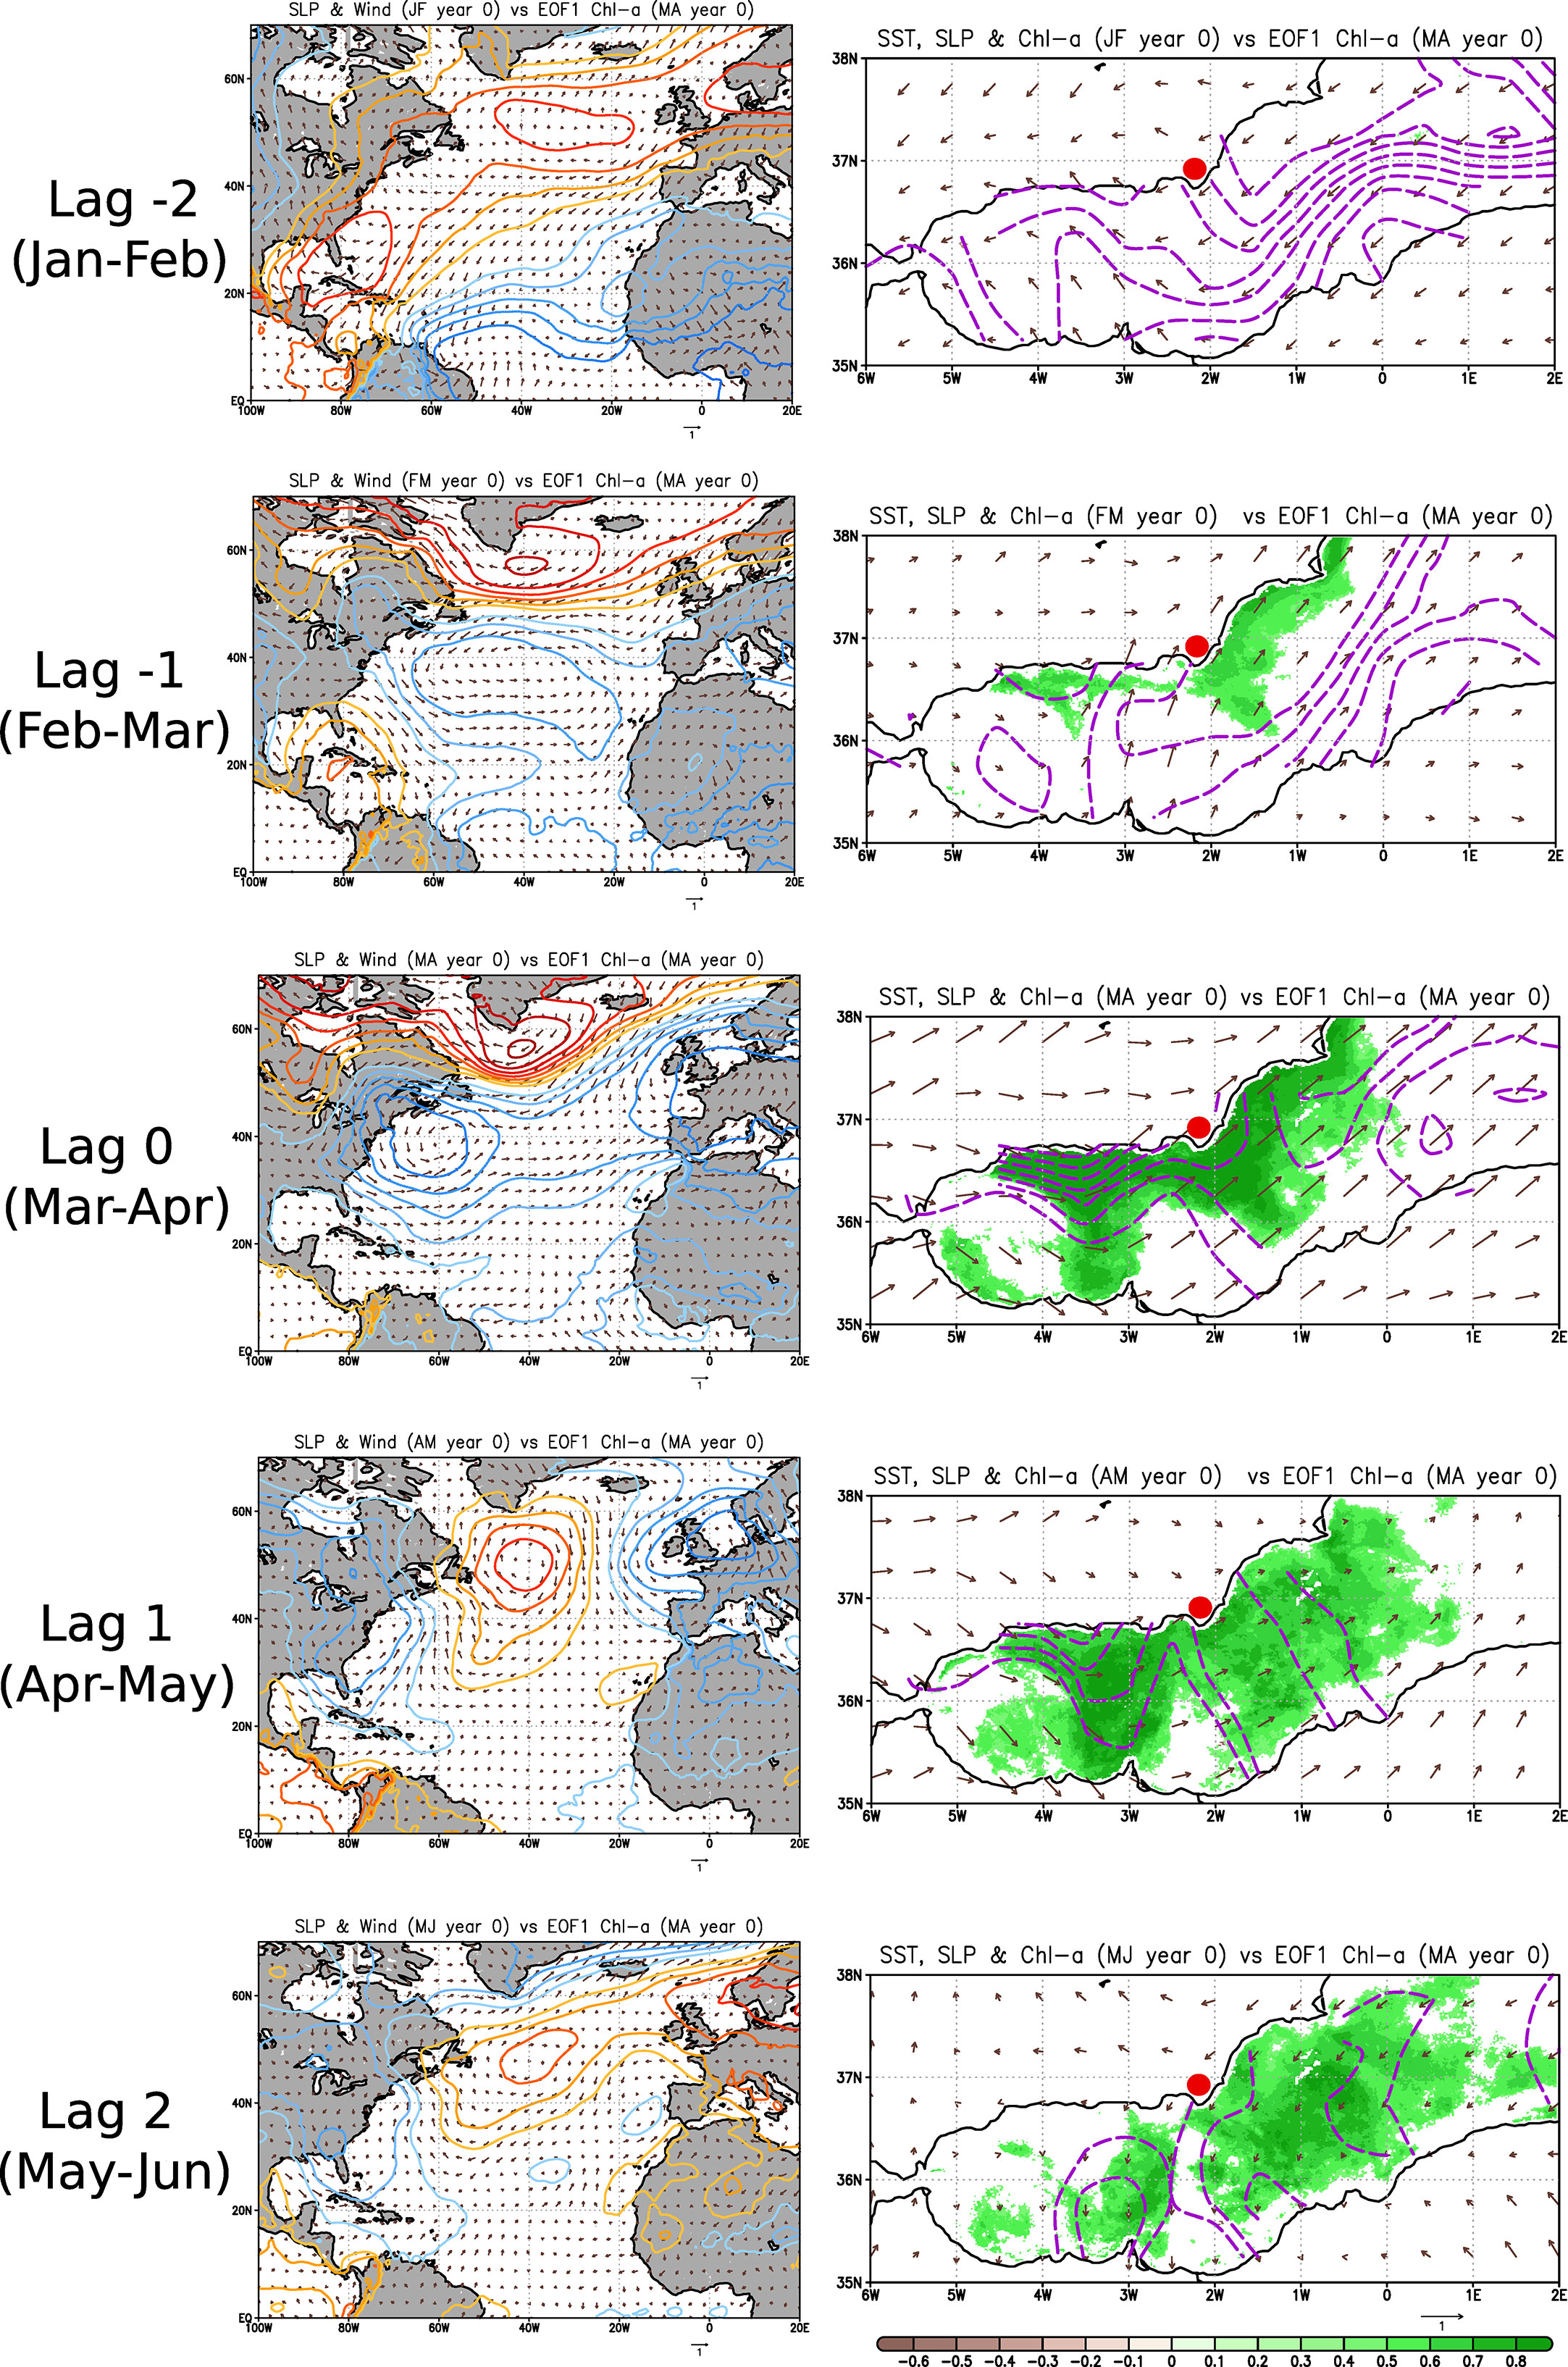
Figure 3 Regression maps, at different time lags, of the anomalous Chl-a variability mode calculated in March–April and within the nAS (PC1; see Figure 2C), onto 1) anomalous SLP (contoured with ci = 0.1 Pa; positive values in red colors and negative values in blue colors) and surface wind (vectors; unit in m/s) within the North Atlantic (left panels) and 2) anomalous SST (contoured; ci = 0.1 degrees), surface wind (vectors; unit in m/s), and Chl-a (shaded; units in mg/m3) within the Alboran Sea (right panels). Only those Chl-a anomalies which are statistically significant (p-values less than 0.05) based on a Student t-test are shown. For illustrative purposes, red point highlights the location of Cape Gata.
To identify the potential SST drivers of these changes over the North Atlantic SLP, which in turn generate the anomalous winds behind our Chl-a response in Alboran, the regression map of the Chl-a mode (i.e., the associated principal component; see Figure 2C) onto the global SST is obtained at different monthly lags (Figure 4). In particular, we plot the statistically significant SST signals linked to our Chl-a mode from April to May of the previous year (lag -11) to March–April simultaneously with the Chl-a response (lag 0). Furthermore, the SLP (contoured in Figure 4) and the surface wind (vectored in Figure 4) are also shown to broadly address the monthly evolution of the atmospheric conditions along time.
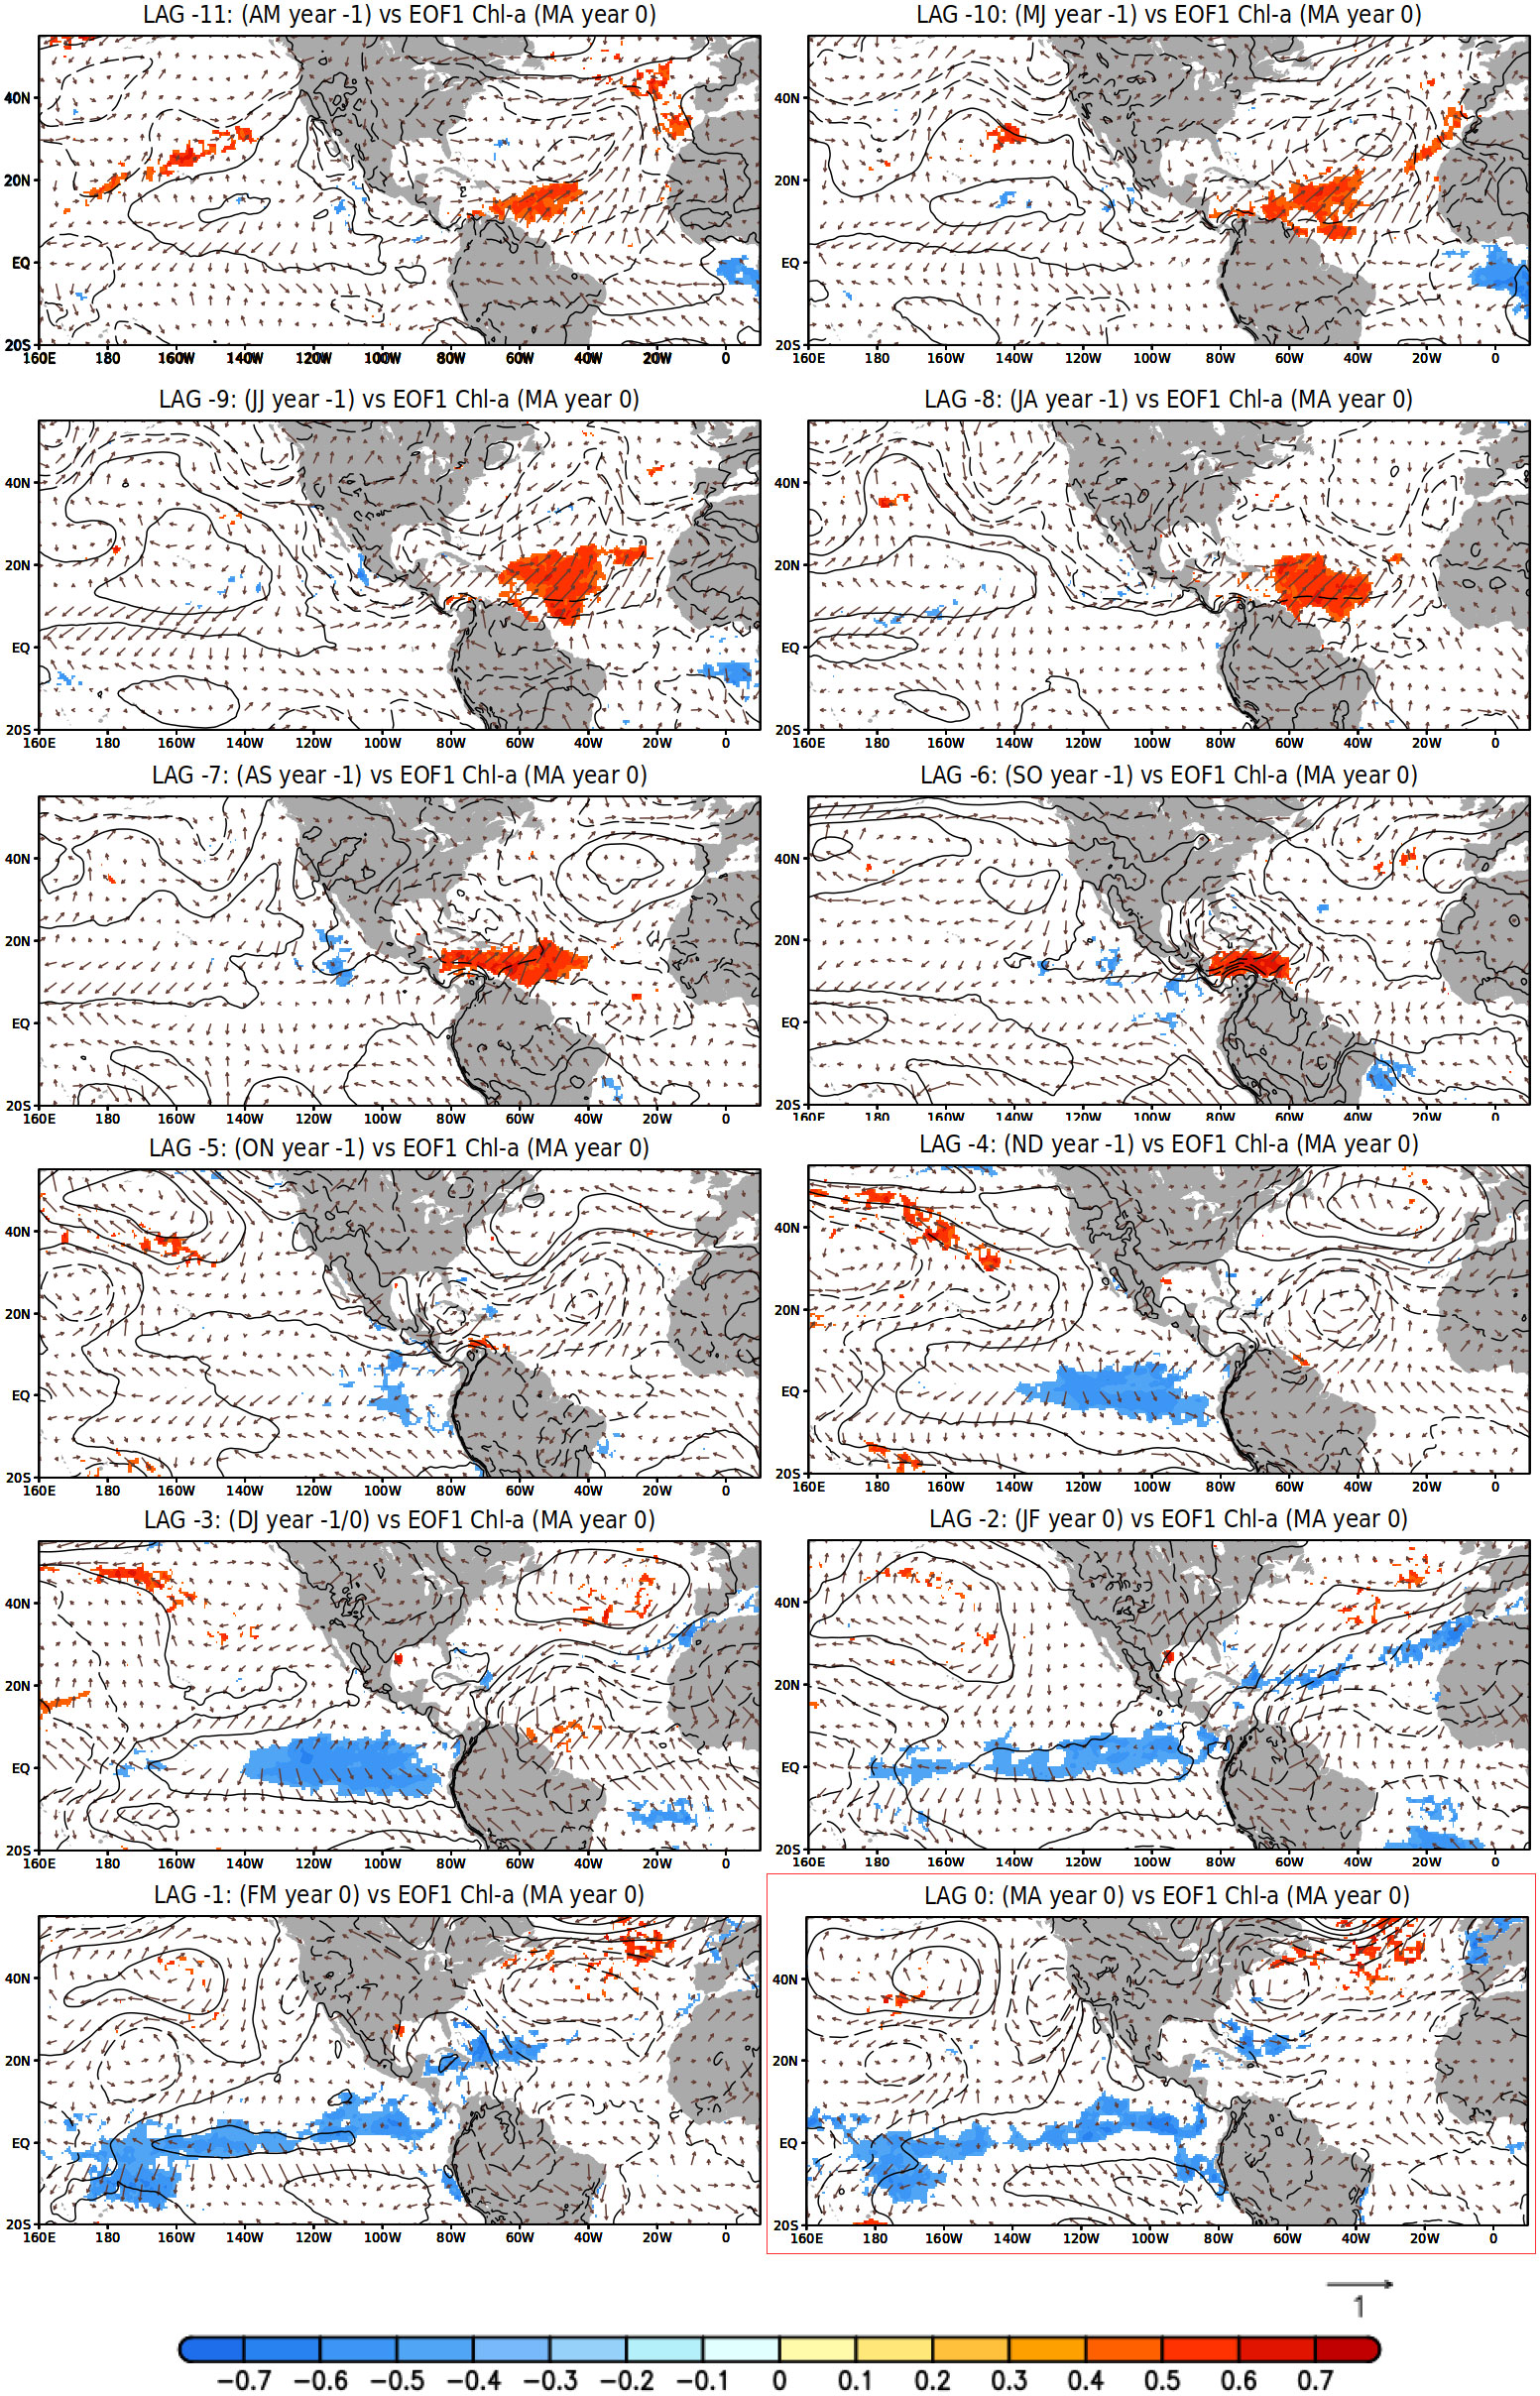
Figure 4 Regression maps, at different lags, of the Chl-a variability mode calculated in March–April and within the nAS (PC1; see Figure 2C), onto 1) SST anomalies (shaded; units in degrees), 2) sea level pressure anomalies (contoured with ci = 0.1 Pa; positive values in solid lines and negative values in dashed lines), and 3) surface wind anomalies (vectors; unit in m/s). From top-left to bottom-right panels, the responses from April to March of the previous year (lag -11) to March–April of year 0 (lag 0; highlighted in red). The corresponding lag is shown on top of each panel. Only those SST anomalies which are statistically significant (p-values less than 0.05) based on a Student t-test are shown.
As observed in Figure 4, two main areas with significant SST anomalies emerge: the central-western SSTs over the Tropical North Atlantic from lag -11 (April–May of year -1) to lag -6 (September–October of year -1) and the tropical Pacific SSTs from lag -4 (November–December of year -1) to lag 0 (March–April of year 0). This result suggests a link between the Tropical North Atlantic (hereinafter TNA) SSTs in spring-summer and the tropical Pacific SSTs in the following winter in such a way that warm (cold) conditions in the TNA favor the development of a La Nina (El Nino) event in the Pacific. This teleconnection has been documented during the last years (Ham et al., 2013; Wang et al., 2017) and is sustained by the excitation of an atmospheric Rossby wave from the TNA that propagates westward. In this way, when an anomalous warming occurs in the TNA, this atmospheric wave activity causes northeasterly wind anomalies over the subtropical northeastern Pacific, the development of cold SST anomalies in the subsequent seasons, and finally, the initiation of a La Nina episode in the tropical Pacific. The opposite impact (i.e., El Nino signal over the Pacific) broadly occurs when the TNA is cooler than usual in spring–summer. Please notice how the abovementioned northeasterly winds are identified in Figure 4 just before the appearance of the first significant SST anomalies in the eastern equatorial Pacific (see September–October and October–November panels in Figure 4). In parallel, a low-level anticyclone has been induced to the west, which in turn generates the development of La Nina event.
To understand the role of these remote SST anomalies in the development of our Chl-a mode in Alboran, it is interesting to assess the evolution of the atmospheric conditions over the Atlantic sector. In particular, Figure 4 shows how the previously mentioned transition of the SLP over the North Atlantic, from a dipolar structure in winter to a wavy structure in spring (see also Figure 3), occurs in parallel to the evolution of the La Nina episode in the Pacific. Furthermore, over the equatorial Atlantic, negative SLP anomalies (i.e., a cyclone circulation) get higher as the low-level anticyclone over the equatorial Pacific increases. The teleconnection mechanisms behind these changes of the atmospheric conditions over the Atlantic basin in parallel to the evolution of the ENSO event have been deeply analyzed in the past and are out of the scope of the present study. In particular, the wavy signature over the North Atlantic mainly responds to the triggering of atmospheric Rossby waves from the tropical Pacific to the North Atlantic sector through the troposphere (see, e.g., Jiménez-Esteve and Domeisen, 2018) and the stratosphere (see, e.g., Ayarzagüena et al., 2018), while the impact on the equatorial Atlantic is mainly linked to the alteration of the thermally driven direct circulation (i.e., the atmospheric Walker and Hadley cells) in relation to variations in the anomalous convection (see, e.g., Chang et al., 2006). In either case, a clear consequence of the aforementioned evolution of the SLP structures over the Atlantic is that the anomalous surface winds over the Alboran region change from northeasterlies in winter to westerlies in spring (Figure 4), which ultimately seems to generate the emergence of our Chl-a variability mode (Figure 3). In the following section, the potential of this teleconnection between Chl-a and remote SSTs for long-range predictability is assessed in detail.
The regression maps in Figure 4 do not represent real covariability patterns but a combination of patterns which are coupled to the Chl-a variability in the nAS. These maps allow exploring those possible regions, such as the TNA and the tropical Pacific, susceptible to act as forcings (and predictors) of the Chl-a abundance in Alboran.
In order to find real covariability patterns of SST and Chl-a and to better understand the spatiotemporal distribution of anomalous primary production in relation to a specific ocean forcing, a MCA is needed. Accordingly, two MCAs have been performed here: the first assessing the link between the TNA SSTs in August–September (lag -7) and the Chl-a concentration in the following March–April (lag 0), and the second assessing the link between the tropical Pacific SSTs in November–December (lag -4) and the Chl-a concentration in the following March–April (lag 0). The resultant modes of covariability are shown, for each case, in Figures 5, 6.
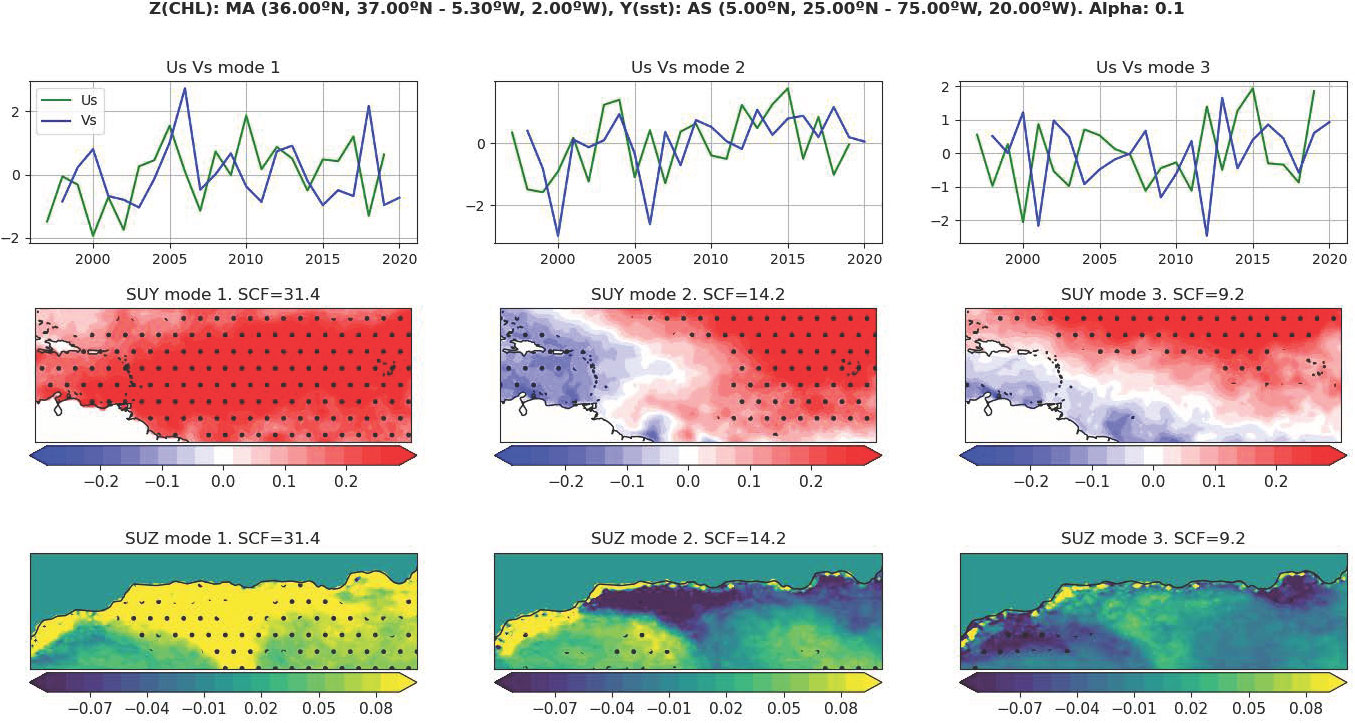
Figure 5 Three first covariability modes between TNA SSTs in August–September (predictor field) and Chl-a concentration in the following March–April in nAS (predictand field). From left to right, the leading, second, and third modes. From top to bottom, the associated expansion coefficients (Us for the predictor field and Vs for the predictand field), spatial pattern of the predictor field (anomalous SST; units in degrees per standard deviation in Us), and spatial pattern of the predict and field (anomalous Chl-a; units in mg/m3 per standard deviation in Us). Black marks in maps indicate statistically significant signals (p-values less than 0.05) based on a Student t-test. Central and bottom panels show, on top, the percentage of covariation explained by each pair of spatial patterns.
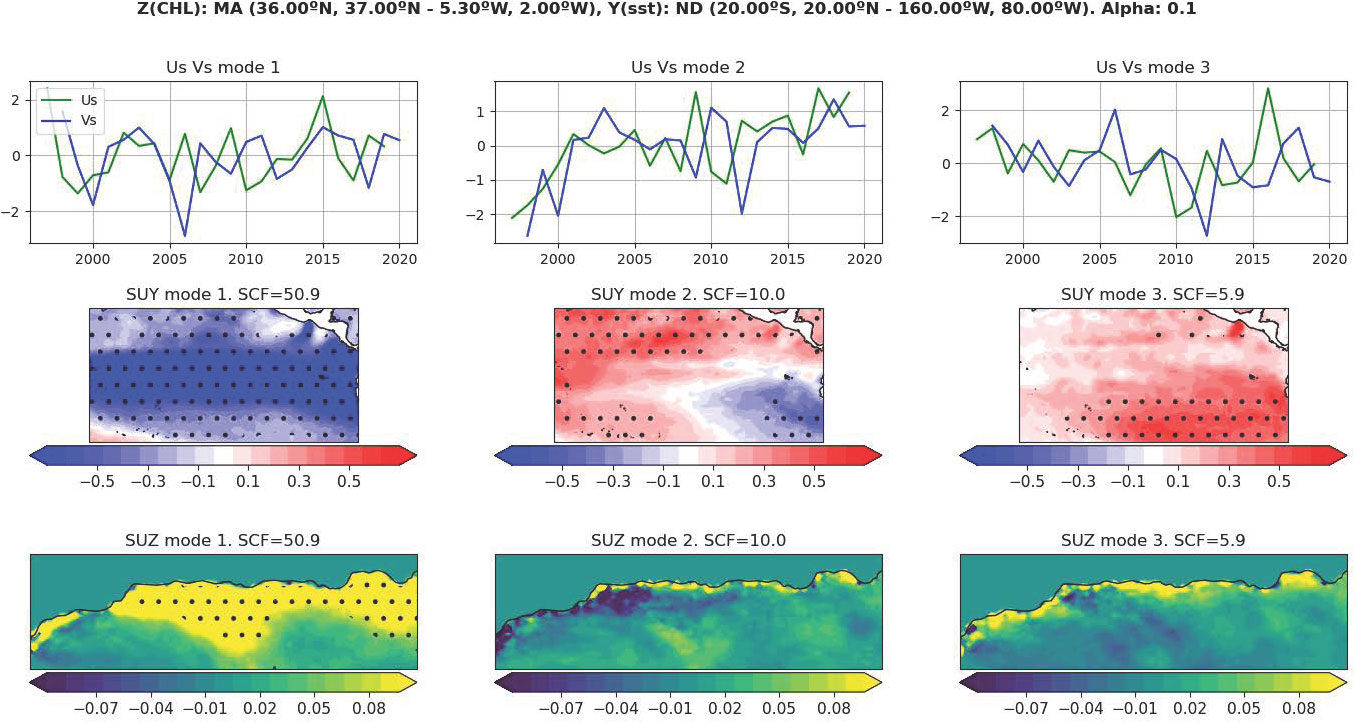
Figure 6 As Figure 5 but using the tropical Pacific SSTs in November–December (lag -4) as predictor.
In the case of the TNA (Figure 5), the leading mode presents significant SST anomalies in the whole tropical Atlantic region in association with significant responses in Chl-a concentration along the Spanish coast. The second mode is related to an anomalous zonal SST dipole with significant anomalies in the eastern side of the TNA, together with anomalous Chl-a concentrations by the north of the WAG. This structure of anomalous Chl-a seems to be indicating an anomalous upwelling (downwelling) response due to an anomalous cyclonic (anticyclonic) gyre, both in turn linked to an anomalous warming (cooling) in the eastern TNA. These two modes, which account for almost 50% of the total covariance, reinforce the cause-and-effect relationship suggested from Figure 4: a warming (cooling) of the TNA is significantly related to more (less) Chl-a concentrations in the coastal margin of the nAS.
In the case of the tropical Pacific (Figure 6), the covariability is clearly dominated by the leading mode, which accounts by itself for more than 50% of the total covariance. As expected, a characteristic ENSO SST pattern emerges in association with this leading mode in such a way that positive (El Nino) and negative (La Nina) SST signals in the Pacific are related to a decrease and an increase in Chl-a concentration along the Spanish coast, respectively.
Here, the covariability modes shown in Figures 5, 6 have been used as a basis for quantifying the skill of both TNA SSTs and Pacific SSTs to predict the Chl-a abundance in Alboran at different time lags. To this aim, a simple regression model is built and the predicted Chl-a signal is assessed through a leave-one-out cross-validation procedure (see subsection 2.3). Our results show how the ENSO-related SSTs in November–December allow to robustly predict the Chl-a concentration in March–April along the Spanish coast (Figure 7A), that is, the Chl-a signal linked to the wind-driven upwelling (see Figure 3; central panels). As expected, this skill is not stationary in time, finding years for which the spatial correlation between the predicted Chl-a pattern and the observed Chl-a pattern is higher than others (Figure 7B). The associated squared covariance fraction (Figure 7C), stable at ~0.5 along the analyzed period, reinforces the robustness of the tropical Pacific SSTs in late fall (November–December) to predict the wind-driven distribution pattern of Chl-a in nAS in spring (March–April).
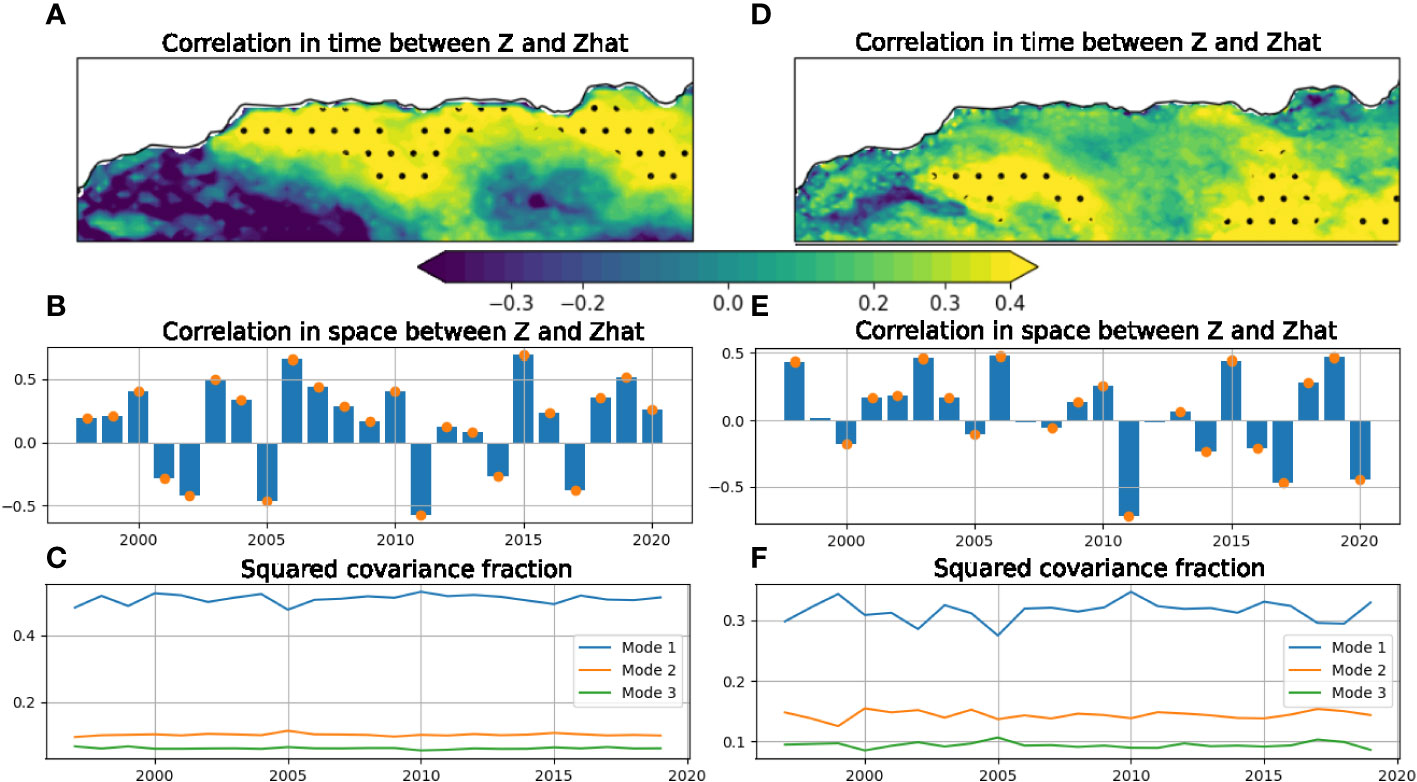
Figure 7 Cross-validated hindcast based on MCA (see Section 2.3). From top to bottom: for each spatial location, correlation in time between the observed and the predicted Chl-a signal (A, D); for each time, correlation in space between the observed and the predicted Chl-a signal (b,e); and squared covariance fraction explained by each MCA mode (C, F). Left panels show the Chl-a prediction in March–April from the Pacific SSTs in the previous November–December (lag -4); right panels show the Chl-a prediction in March-April from the TNA SSTs in August–September (lag -7). Black marks in the upper panels indicate statistically significant signals (p-values less than 0.05), based on a Student t-test.
On the contrary, the TNA SSTs in August–September allow to significantly predict the Chl-a concentration in March–April offshore, in particular by the north of the WAG and the EAG (Figure 7D). This skill, reasonably robust in terms of the related squared covariance fraction (Figure 7F), indicates that the Chl-a concentration in spring to the north of the WAG and the EAG might be predicted (at least for certain years; see Figure 7E) with 7 months in advance.
Continuing with the TNA, it is interesting to note that the leading and second covariability modes shown in Figure 5 indicate a similar but opposite link between TNA and coastal upwelling: warm conditions in western TNA with positive Chl-a anomalies on the one hand (left panels in Figure 5) and warm conditions in central TNA with negative Chl-a anomalies on the other hand (central panels in Figure 5). This result suggests that retaining both the leading and second covariability modes to predict the coastal Chl-a response may not be the best choice. Indeed, one can notice in Figures 5, 6 (see bottom-left panels) the remarkable similarity of Chl-a patterns identified in relation to the TNA-related (bottom-left panel in Figure 5) and ENSO-related (bottom-left panel in Figure 6) leading modes. This feature is consistent with the SST evolution shown in Figure 4 and suggests that, in the case of the TNA, the prediction based solely on the leading covariability mode (i.e., based on the western TNA SSTs) might allow to enhance the predictive power (from 4 to 7 months) in those years when warm (cold) TNA conditions in August–September trigger a La Nina (El Nino) event in the following winter. To illustrate this role of western TNA to anticipate the prediction of coastal Chl-a, please see the prediction of Chl-a concentration in 2006 made from both the TNA SSTs in August–September 2005 and the Pacific SSTs in November–December 2005 (Figure S3 of Supplementary Material).
This study demonstrates that the Chl-a concentration in boreal spring along the northern flank of the Alboran Sea can be predicted, at least for certain years, by solely considering climate information. The explanation lies in the fact that El Niño Southern Oscillation (ENSO) can trigger the development of anomalous distribution patterns of Chl-a in Alboran. The underlying mechanisms are associated with the well-known alteration of the SLP configuration over the North Atlantic European sector in the spring following the peak of ENSO (see, e.g., Brönnimann, 2007). This remote and lagged signal of ENSO impacts the western Mediterranean, modifying the winds blowing the Alboran region and the related wind-driven upwelling taking place along the southern Spanish coast in spring. As a result, the Chl-a concentration at the surface is modified. Considering the linear nature of our calculations, a high (low) Chl-a concentration in the nAS in spring is expected for La Niña (El Niño) conditions in winter over the tropical Pacific.
As mentioned, the teleconnection linking ENSO and the North Atlantic atmospheric circulation have been well evaluated in the past (García-Serrano et al., 2011; Jiménez-Esteve and Domeisen, 2018 and Hardiman et al., 2019, among others). Here, we provide a step forward in the understanding of how these large-scale climate links influence the Chl-a concentration in the coastal margin of the nAS. Furthermore, we explore the predictability of this Chl-a response from the remote SST forcings by designing a statistical regression model based on a maximum covariance analysis (MCA). This prediction, based on a 1-year leave-out cross-validated hindcast, has been quality-assessed and confirms that the coastal Chl-a concentration in the nAS can be reasonably well predicted, during El Nino/La Nina years, 4 months in advance. Furthermore, in those years when a significant TNA warming (cooling) precedes La Niña (El Niño) event, the aforementioned coastal Chl-a response in Alboran might be predicted over at least 7 months in advance. The role played by the amplitude of these potential SST forcings (ENSO and TNA) in modifying the time lag with respect to the related Chl-a response in Alboran has been analyzed, but no clear relationship emerges (Figure S4). The TNA SSTs in summer also allow for the prediction of another Chl-a response in Alboran in the following spring. This signal, identified offshore by the north of the WAG and the EAG (Figure 7D), does not seem to be associated with the wind-driven upwelling but with the upwelling processes associated with instabilities in the Atlantic Jet. In any case, this role of the TNA as predictor of upwelling in northern Alboran must be deeply assessed in future works.
It is important to note the fact that Chl-a concentration has been repeatedly linked in the past with upwelling (see, e.g., Ramírez et al., 2005). The limitation for directly computing physical upwelling in studies such as ours is the need of combining long (20 years or more) and high-resolution (10 km or less) datasets. However, the consistency between our Chl-mode (Figure 2A) and its related signature on the anomalous Ekman pumping (Figure S5) reinforces the link with upwelling. However, caution must be exercised when using Chl-a as a proxy of upwelling.
This work provides more relevant questions to be faced in future studies. For example, it is interesting to evaluate the persistence of our Chl-a response in spring. As shown in Figure 3, the statistically significant anomalies of Chl-a begin in February–March along the continental coast and persist offshore beyond the spring season. Where is this anomalous Chl-a signal supposed to go? Which other processes and related impacts are implied? These questions should be analyzed in detail in future works to better understand the role of our proposed teleconnection (ENSO influence on Chl-a in Alboran) in a wider context related to the Chl-a variability in the western Mediterranean.
Another interesting aspect to be further analyzed in the future is whether a bottom-up propagation of the climate-related signal across the marine food web subsequently takes place. To preliminary assess this hypothesis, the annually and spatially averaged catches of small pelagic species within the Alboran Sea have been calculated (see dashed line in Figure 2C) considering Sea Around Us Project data (https://www.seaaroundus.org/). Notice that small pelagic fishes, which quickly respond to changes in the ocean conditions, are among the most economically valuable fisheries resources and represent a vital intermediate connection between plankton and large predatory species (Cury et al., 2000). In particular, the evolution of this fish group correlates with our Chl-a variability mode at lag 0 (r = 0.49; p-value less than 0.01) and at lag +1 (r = 0.72; p-value less than 0.001). The non-parametric test described by Ebisuzaki (1997), and specially designed to avoid serial correlation, is used to quantify these correlations. The marked 1-year lagged relationship is consistent to the proposed influence of Chl-a concentration in northern Alboran on the sardine abundance in the following year (Vargas-Yáñez et al., 2020). According to the latter work, food availability in autumn/winter in northern Alboran strongly influences the body condition of spawners and the annual recruitment success of the following year. Thus, those years with enhanced (reduced) Chl-a concentrations in spring would generate favorable (unfavorable) hatching periods in autumn/winter and higher (lower) recruitment success and annual landings in the following year. This mechanism would explain the marked 1-year relationship identified here between our Chl-a mode and the catches of small pelagic fishes in northern Alboran and suggests that the ENSO signature (and its related predictability) might reach the fish level. However, deeper analyses are absolutely needed to better identify and understand the processes behind and the possible related predictability (cf. Gómara et al., 2021 as example in the tropical Pacific).
Overall, we can conclude that the implications of our results is twofold. Firstly, instead of directly correlating our Chl-a-related timeseries with well-known indices such as NAO or ENSO in efforts to identified remote forcings, we address potential predictors of Chl-a in Alboran through the use of global SST regression maps at different monthly lags. This approach gives a comprehensive vision of the predictor pattern and evolution, allows finding unexpected predictors (such as the TNA here), and considers separately their associated variabilities. Secondly, this information is applied to provide a useful springboard for implementing a simple and computationally inexpensive seasonal prediction system of primary productivity in the nAS, by solely considering climate information. Nevertheless, as mentioned, many interesting aspects emerge from this study, which must be necessarily faced in future works.
All data used in this study are open and available to any qualified researcher, and comply with the FAIR principle (findable, accessible, interoperable, and reusable).
JLP conceived the research, partially made the calculations and wrote most of the manuscript. IG significantly contributed in both the calculations and the manuscript. BRF was mainly concerned on assessing the model prediction and skill, with relevant feedbacks in the manuscript. JGL also contributed in the writing process, in particular on those aspects more related to the ocean dynamics. All authors contributed to the article and approved the submitted version.
JL-P was supported by a Postdoctoral Fellowship from the Research Own Plan of the University of Málaga (“Ayuda de Incorporación de Doctores 2020”). Thanks are also given to the projects EU-H2020 TRIATLAS (No 817578) and CARMEN (PCI2021-122061-2B), the latter funded by both the Spanish Government (MCIN/AEI/10.13039/501100011033) and the European Union (NextGenerationEU/PRTR).
The authors want to thank Pablo Durán-Rodríguez for the integration of the statistical python code in a user-friendly tool, which has let us to perform, in an efficient way, the different simulations done in this paper. Thanks are also due to Irene Nadal for her contribution in designing Figure 1 and to Simone Sammartino for useful discussions. Finally, we would like to thank the anonymous reviewers for their constructive suggestions and advice, which considerably improved the original manuscript.
The authors declare that the research was conducted in the absence of any commercial or financial relationships that could be construed as a potential conflict of interest.
All claims expressed in this article are solely those of the authors and do not necessarily represent those of their affiliated organizations, or those of the publisher, the editors and the reviewers. Any product that may be evaluated in this article, or claim that may be made by its manufacturer, is not guaranteed or endorsed by the publisher.
The Supplementary Material for this article can be found online at: https://www.frontiersin.org/articles/10.3389/fmars.2022.931832/full#supplementary-material
Ayarzagüena B., Ineson S., Dunstone N. J., Baldwin M. P., Scaife A. A. (2018). Intraseasonal Effects of El niño–Southern Oscillation on North Atlantic Climate. J. Climate 31, 8861–8873. doi: 10.1175/JCLI-D-18-0097.1
Baldacci A., Corsini G., Grasso R., Manzella G., Allen J., Cipollini P., et al. (2001). A study of the Alboran sea mesoscale system by means of empirical orthogonal function decomposition of satellite data. J. Mar. Syst. 29, 293–311. doi: 10.1016/S0924-7963(01)00021-5
Basterretxea G., Font-Muñoz J. S., Salgado-Hernanz P. M., Arrieta J., Hernández-Carrasco I. (2018). Patterns of chlorophyll interannual variability in Mediterranean biogeographical regions. Remote Sens. Environ. 215, 7–17. doi: 10.1016/j.rse.2018.05.027
Bjerknes J. (1969). Atmospheric teleconnections from the equatorial pacific. Monthly weather Rev. 97, 163–172. doi: 10.1175/1520-0493(1969)097<0163:ATFTEP>2.3.CO;2
Bosc E., Bricaud A., Antoine D. (2004). Seasonal and interannual variability in algal biomass and primary production in the Mediterranean sea, as derived from 4 years of seawifs observations. Global Biogeochemical Cycles 18 (1), 1–17. doi: 10.1029/2003GB002034
Bretherton C. S., Smith C., Wallace J. M. (1992). An intercomparison of methods for finding coupled patterns in climate data. J. Climate 5, 541–560. doi: 10.1175/1520-0442(1992)0050541:AIOMFF2.0.CO;2
Bretherton C., Widmann M., Dymnikov V., Wallace J., Blade I. (1999). Effective number of degrees of freedom of a spatial field. J. Climate 12, 1520–0442. doi: 10.1175/1520-0442(1999)012<1990:TENOSD>2.0.CO;2
Brönnimann S. (2007). Impact of El niño-southern oscillation on European climate. Rev. Geophysics 45, RG3003. doi: 10.1029/2006RG000199
Cassou C. (2010). “Euro-Atlantic regimes and their teleconnections,” in Proceedings: ECMWF seminar on predictability in the European and Atlantic regions, 6–9. (Reading, United Kingdom:ECMWF).
Chang P., Fang Y., Saravanan R., Ji L., Seidel H. (2006). The cause of the fragile relationship between the pacific el niño and the atlantic niño. Nature 443, 324–328. doi: 10.1038/nature05053
Cury P., Bakun A., Crawford R. J., Jarre A., Quinones R. A., Shannon L. J., et al. (2000). Small pelagics in upwelling systems: patterns of interaction and structural changes in “wasp-waist”. ecosystems. ICES J. Mar. Sci. 57, 603–618. doi: 10.1006/jmsc.2000.0712
Ebisuzaki W. (1997). A method to estimate the statistical significance of a correlation when the data are serially correlated. J. Climate 10, 2147–2153. doi: 10.1175/1520-0442(1997)010<2147:AMTETS>2.0.CO;2
Garcia-Gorriz E., Carr M.-E. (2001). Physical control of phytoplankton distributions in the Alboran sea: a numerical and satellite approach. J. Geophysical Research: Oceans 106, 16795–16805. doi: 10.1029/1999JC000029
García-Serrano J., Rodríguez-Fonseca B., Bladé I., Zurita-Gotor P., de la Cámara A. (2011). Rotational atmospheric circulation during north Atlantic-European winter: the influence of ENSO. Climate Dynamics 37, 1727–1743. doi: 10.1007/s00382-010-0968-y
Garcıa-Lafuente J., Cano N., Vargas M., Rubın J. P., Hernandez-Guerra A. (1998). Evolution of the Alboran sea hydrographic structures during july 1993. Deep Sea Res. Part I: Oceanographic Res. Papers 45, 39–65. doi: 10.1016/S0967-0637(97)00216-1
Gómara I., Rodríguez-Fonseca B., Mohino E., Losada T., Polo I., Coll M. (2021). Skillful prediction of tropical pacific fisheries provided by atlantic niños. Environ. Res. Lett. 16, 054066. doi: 10.1088/1748-9326/abfa4d
Gómara I., Rodríguez-Fonseca B., Zurita-Gotor P., Ulbrich S., Pinto J. G. (2016). Abrupt transitions in the nao control of explosive north atlantic cyclone development. Climate dynamics 47, 3091–3111. doi: 10.1007/s00382-016-3015-9
González-Lanchas A., Flores J.-A., Sierro F. J., Bárcena M. Á., Rigual-Hernández A. S., Oliveira D., et al. (2020). A new perspective of the Alboran upwelling system reconstruction during the marine isotope stage 11: A high-resolution coccolithophore record. Quaternary Sci. Rev. 245, 106520. doi: 10.1016/j.quascirev.2020.106520
Ham Y.-G., Kug J.-S., Park J.-Y., Jin F.-F. (2013). Sea Surface temperature in the north tropical atlantic as a trigger for el niño/southern oscillation events. Nat. Geosci. 6, 112–116. doi: 10.1038/ngeo1686
Hardiman S. C., Dunstone N. J., Scaife A. A., Smith D. M., Ineson S., Lim J., et al. (2019). The impact of strong el niño and la niña events on the north atlantic. Geophysical Res. Lett. 46, 2874–2883. doi: 10.1029/2018GL081776
Hersbach H., Bell B., Berrisford P., Biavati G., Horányi A., Muñoz Sabater J., et al. (2018). ERA5 hourly data on single levels from 1979 to present, copernicus climate change service (c3s) climate data store (cds). ECMWF 147, 5–6.
Huang B., Liu C., Banzon V., Freeman E., Graham G., Hankins B., et al. (2021). Improvements of the daily optimum interpolation sea surface temperature (doisst) version 2.1. J. Climate 34, 2923–2939. doi: 10.1175/JCLI-D-20-0166.1
Jiménez-Esteve B., Domeisen D. I. (2018). The tropospheric pathway of the enso–north atlantic teleconnection. J. Climate 31, 4563–4584. doi: 10.1175/JCLI-D-17-0716.1
Katara I., Illian J., Pierce G. J., Scott B., Wang J. (2008). Atmospheric forcing on chlorophyll concentration in the Mediterranean, In Valavanis V. D (eds) Essential fish habitat mapping in the Mediterranean. Developments in Hydrobiology, (Dordrecht:Springer), 33–48. doi: 10.1007/978-1-4020-9141-4_4
Lazzari P., Solidoro C., Ibello V., Salon S., Teruzzi A., Béranger K., et al. (2011). Seasonal and inter-annual variability of plankton chlorophyll and primary production in the Mediterranean sea: a modelling approach. Biogeosciences Discussions 8, 5379 lazzari2011. doi: 10.5194/bgd-8-5379-2011
Lorenz E. N. (1956). Empirical orthogonal functions and statistical weather prediction. Technical report, Statistical Forecast Project Report 1, Dep. of Meteor. MIT, 49.
Losada T., Rodríguez-Fonseca B., Mechoso C., Ma H. (2007). Impacts of sst anomalies on the north atlantic atmospheric circulation: a case study for the northern winter 1995/1996. Climate dynamics 29, 807–819. doi: 10.1007/s00382-007-0261-x
Macías D., Navarro G., Echevarría F., García C., Cueto J. (2007). Phytoplankton pigment distribution in the northwestern Alboran sea and meteorological forcing: A remote sensing study. J. Mar. Res. 65, 523–543. doi: 10.1357/002224007782689085
Mercado J. M., Cortés D., Ramírez T., Gómez F. (2012). Decadal weakening of the wind-induced upwelling reduces the impact of nutrient pollution in the bay of málaga (western Mediterranean sea). Hydrobiologia 680, 91–107. doi: 10.1007/s10750-011-0906-y
Minas H. J., Coste B., Le Corre P., Minas M., Raimbault P. (1991). Biological and geochemical signatures associated with the water circulation through the strait of gibraltar and in the western Alboran sea. J. Geophysical Research: Oceans 96, 8755–8771. doi: 10.1029/91JC00360
Muñoz M., Reul A., Vargas-Yáñez M., Plaza F., Bautista B., García-Martínez M., et al. (2017). Fertilization and connectivity in the garrucha canyon (se-spain) implications for marine spatial planning. Mar. Environ. Res. 126, 45–68. doi: 10.1016/j.marenvres.2017.02.007
North G. R., Bell T. L., Cahalan R. F., Moeng F. J. (1982). Sampling errors in the estimation of empirical orthogonal functions. Monthly Weather Rev. 110, 699. doi: 10.1175/1520-0493(1982)1100699:SEITEO2.0.CO;2
Pinto J. G., Raible C. C. (2012). Past and recent changes in the north atlantic oscillation. Wiley Interdiscip. Reviews: Climate Change 3, 79–90. doi: 10.1002/wcc.150
Preisendorfer R. W., Mobley C. D. (1988). Principal component analysis in meteorology and oceanography. Developments atmospheric Sci. 17, 425.
Ramírez T. (2007). Variabilidad hidrológica y dinámica biogeoquímica en el sector noroccidental del mar de alborán. (Universidad de Málaga:Doctoral dissertation).
Ramírez T., Cortés D., Mercado J., Vargas-Yañez M., Sebastián M., Liger E. (2005). Seasonal dynamics of inorganic nutrients and phytoplankton biomass in the nw Alboran sea. Estuarine Coast. Shelf Sci. 65, 654–670. doi: 10.1016/j.ecss.2005.07.012
Reul A., Rodríguez V., Jiménez-Gómez F., Blanco J., Bautista B., Sarhan T., et al. (2005). Variability in the spatio-temporal distribution and size-structure of phytoplankton across an upwelling area in the nw-Alboran sea,(w-Mediterranean). Continental Shelf Res. 25, 589–608. doi: 10.1016/j.csr.2004.09.016
Rodríguez-Fonseca B., Polo I., Serrano E., Castro M. (2006). Evaluation of the north Atlantic SST forcing on the European and northern African winter climate. Int. J. Climatology: A J. R. Meteorological Soc. 26, 179–191. doi: 10.1002/joc.1234
Saha K., Zhao X., Zhang H., Casey K., Zhang D., Baker-Yeboah S., et al. (2018). Avhrr pathfinder version 5.3 level 3 collated (l3c) global 4km sea surface temperature for 1981-present (Asheville, NC, USA: NOAA National Centers for Environmental Information).
Sánchez Garrido J. C., García Lafuente J., Criado Aldeanueva F., Baquerizo A., Sannino G. (2008). Time-spatial variability observed in velocity of propagation of the internal bore in the strait of gibraltar. J. Geophysical Research: Oceans 113, 1–6. doi: 10.1029/2007JC004624
Sánchez-Garrido J. C., García Lafuente J., Fanjul E. Á., Sotillo M. G., Francisco J. (2013). What does cause the collapse of the western Alboran gyre? results of an operational ocean model. Prog. Oceanography 116, 142–153. doi: 10.1016/j.pocean.2013.07.002
Sarhan T., García Lafuente J., Vargas M., Vargas J. M., Plaza F. (2000). Upwelling mechanisms in the northwestern Alboran sea. J. Mar. Syst. 23, 317–331. doi: 10.1016/S0924-7963(99)00068-8
Shaman J. (2014). The seasonal effects of ENSO on European precipitation: Observational analysis. J. Climate 27, 6423–6438. doi: 10.1175/JCLI-D-14-00008.1
Suárez-Moreno R., Rodríguez-Fonseca B. (2015). S4CASTv2.0: sea surface temperature based statistical seasonal forecast model. Geoscientific Model. Dev. 8, 3971–4018. doi: 10.5194/gmdd-8-3971-2015
Vargas-Yáñez M., Giráldez A., Torres P., González M., García-Martínez M., d. C., et al. (2020). Variability of oceanographic and meteorological conditions in the northern Alboran sea at seasonal, inter-annual and long-term time scales and their influence on sardine (sardina pilchardus walbaum 1792) landings. Fisheries Oceanography 29, 367–380. doi: 10.1111/fog.12477
Volpe G., Nardelli B. B., Colella S., Pisano A., Santoleri R. (2018). An operational interpolated ocean colour product in the Mediterranean sea. New Front. Operational Oceanography, (GODAE OceanView), 227–244. doi: 10.17125/gov2018.ch09
Keywords: Alboran Sea, chlorophyll-a (Chl-a), SST (sea surface temperature), climate teleconnection, seasonal predictability
Citation: López-Parages J, Gómara I, Rodríguez-Fonseca B and García-Lafuente J (2022) Potential SST drivers for Chlorophyll-a variability in the Alboran Sea: A source for seasonal predictability? Front. Mar. Sci. 9:931832. doi: 10.3389/fmars.2022.931832
Received: 29 April 2022; Accepted: 30 August 2022;
Published: 03 October 2022.
Edited by:
Jose Luis Iriarte, Austral University of Chile, ChileReviewed by:
Angela Cuttitta, National Research Council (CNR), ItalyCopyright © 2022 López-Parages, Gómara, Rodríguez-Fonseca and García-Lafuente. This is an open-access article distributed under the terms of the Creative Commons Attribution License (CC BY). The use, distribution or reproduction in other forums is permitted, provided the original author(s) and the copyright owner(s) are credited and that the original publication in this journal is cited, in accordance with accepted academic practice. No use, distribution or reproduction is permitted which does not comply with these terms.
*Correspondence: Jorge López-Parages, cGFyYWdlc0B1bWEuZXM=
Disclaimer: All claims expressed in this article are solely those of the authors and do not necessarily represent those of their affiliated organizations, or those of the publisher, the editors and the reviewers. Any product that may be evaluated in this article or claim that may be made by its manufacturer is not guaranteed or endorsed by the publisher.
Research integrity at Frontiers
Learn more about the work of our research integrity team to safeguard the quality of each article we publish.