 Daniel L. Codiga
- 1Graduate School of Oceanography, University of Rhode Island, Narragansett, RI, United States
- 2Narragansett Bay Estuary Program, Providence, RI, United States
Many urban estuaries worldwide suffer from excess phytoplankton and hypoxia (low oxygen) due to high nutrient loads. A common water quality management strategy is to require wastewater treatment facility upgrades. This case study examines Narragansett Bay, a warming temperate mid-latitude urban estuary with seasonal periodic hypoxia, during June through September from 2005 to 2019. Within this period, numerous facilities were upgraded to nitrogen removal over several years. The response of the bay is more consistent with “textbook” expectations for reduced chlorophyll and hypoxia than what was seen in many other systems—despite its complex coastline geometry, numerous river inputs, and widely-distributed treatment facilities. River flow drives inter-annual variability with increased load, density stratification, chlorophyll, and hypoxia in wet years. Mean 2013-2019 bay-wide total nitrogen load was 34% less than the 2005-2012 mean, a reduction of about 106 kg yr-1, comparable to the range of flow-driven inter-annual variations. Chlorophyll Index and Hypoxia Index event-based metrics applied to high-frequency time series observations at eight sites quantify exceedances of severe and moderate thresholds. Relatively steady 33% and 16% Chlorophyll Index declines, for severe and moderate thresholds, occurred from about 2007 to 2019. The Hypoxia Index declined markedly by 2009 and 2014 for severe and moderate thresholds, respectively, and remained at or near zero from 2014 to 2019. The load reduction explains chlorophyll and hypoxia declines better than physical processes including river flow, stratification, tidal variations, winds, sea level differences, and temperatures. River flow about 55% higher than the 2005-2019 mean would increase non-treatment facility loads by an amount comparable to the managed load decrease, so future wet summers could partially reverse the improvements. Long-term trends include warming of about 0.5°C decade-1, which reduces oxygen saturation by 0.1 mg l-1 decade-1. This rate is likely a lower bound for temperature-driven oxygen decreases, because warming can also accelerate phytoplankton growth and bacterial consumption. Without warming, the managed load decrease would have curtailed hypoxia more effectively. Climate trends should be at least as important to future eutrophication as the managed load decline because, in addition to warming influences, long-term increases in river flow would increase load and stratification.
1 Introduction
Eutrophication due to excess nutrients from human activities threatens water quality in estuarine and coastal waterbodies worldwide (Nixon, 1990; Nixon, 1995; Diaz and Rosenberg, 2008; Gilbert et al., 2010; Breitburg et al., 2018; Altieri and Diaz, 2019). Overly abundant phytoplankton provide large amounts of organic matter which fuel bacterial consumption and depletion of oxygen. Two key symptoms are high levels of chlorophyll, an indicator for phytoplankton, and low oxygen or hypoxia. Hypoxia degrades habitat for many marine species, including fish and shellfish, can alter trophic relationships (Galligan et al., 2022), and is lethal to many higher trophic level organisms (Sagasti et al., 2001).
For urban estuaries hosting large human population centers, wastewater treatment plant discharges are often a major source of nutrients (Greening and Janicki, 2006; Tedesco et al., 2014). Environmental managers in many such systems have focused on requiring wastewater treatment facility upgrades to reduce loads. These managed load declines, though costly, generally have been pursued with support of the public through adopted legislation (RIDEM, 2005).
Responses of phytoplankton and oxygen to managed nutrient load declines in different waterbodies have varied (Boesch, 2019) because a diverse range of factors control water quality. Major influences can include residence times as set mainly by circulation processes and freshwater inputs (Wei et al., 2022), sediment fluxes (Zhang et al., 2019), and internal biogeochemical processes (Savchuk, 2018). The duration and strength of density stratification regulates phytoplankton growth by its influence on the supply of nutrients to surface waters through vertical mixing (Haas et al., 1981) and influences hypoxia through establishment of a pycnocline, which restricts oxygen replenishment to deep waters (Pein et al., 2021). Both stratification and oxygen can be further controlled by a range of physical processes including advection by wind-driven currents (Xia and Jiang, 2015) and changes in vertical mixing associated with tidal currents, for example due to spring-neap cycles (Nelson et al., 1994). In some systems, river inputs are the dominant influence on inter-annual variations in both nutrient loads and stratification, making it challenging to isolate the relative importance of each to eutrophication (Murphy et al, 2011).
Long-term warming due to climate change can also influence the response (Duarte et al., 2009). Metabolic rates increase, which can accelerate phytoplankton growth as well as bacterial oxygen consumption. If warming occurs at different rates in shallow and deep water it can strengthen stratification (Scully et al, 2022). In addition, the seawater oxygen saturation concentration declines at higher temperatures (Whitney and Vlahos, 2021).
Narragansett Bay, the site of our study on the east coast of North America (Figure 1), spans portions of two states, Rhode Island and Massachusetts, and hosts the major population centers of Providence, Fall River, and Newport (NBEP, 2017a). The watershed is situated in the New England region, the most densely populated in the United States, and Providence is one is one of the most densely populated metropolitan areas in the nation. The bay has surface area of about 380 km2, mean depth of about 8 m, and a geometry that includes complex passageways, islands, and embayments (Kremer and Nixon, 1978). Several rivers enter it, each making substantial contributions to the bay-wide input, resulting in the development of stratification from spring to early fall (Codiga, 2012). Estimates of water residence times are 10-40 days (Pilson, 1985). The typical tidal range is about 1-1.5 m and tidal current magnitudes are in the 15-25 cm s-1 range (Spaulding and Swanson, 2008). The non-tidal circulation, typically up to about 5-10 cm s-1, mainly enters the system northward through the East Passage and exits southward through the West Passage (Rogers, 2008). Narragansett Bay is a relatively well-studied system and long-term changes in its phytoplankton prior to the 15-year period studied here have been documented (Li and Smayda, 1998; Oviatt et al., 2002; Nixon et al., 2009; Borkman and Smayda, 2016).
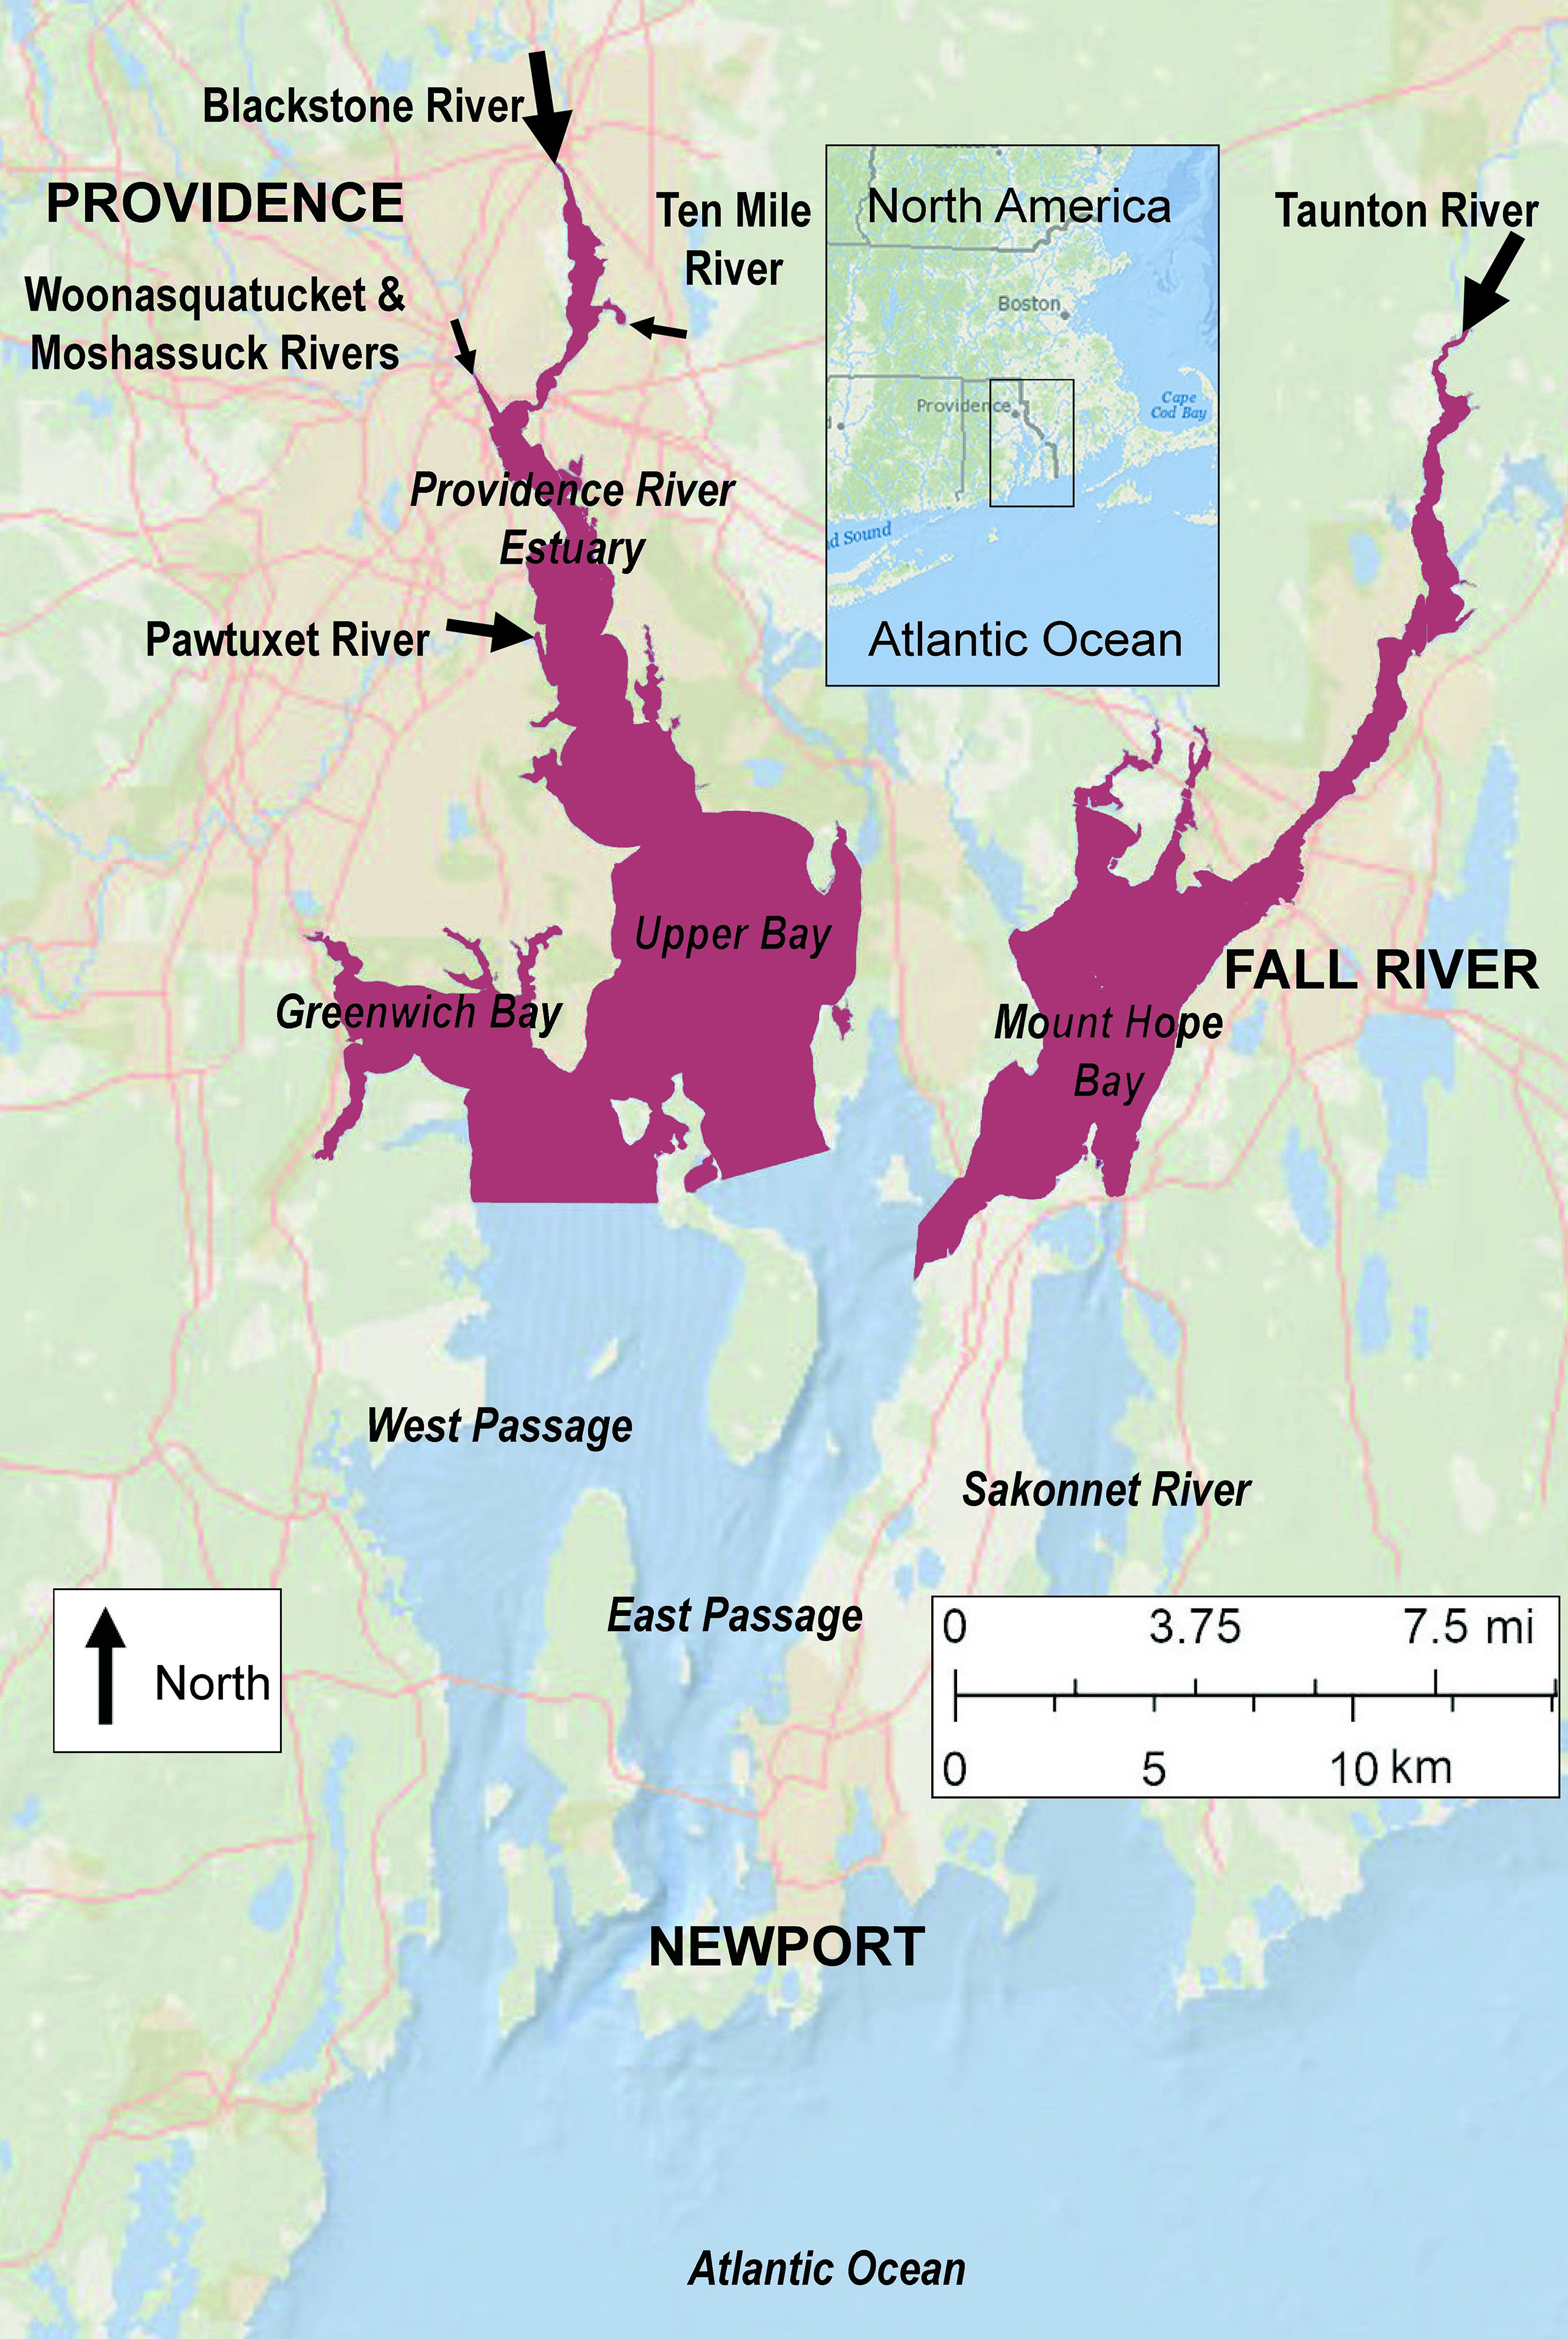
Figure 1 The urban estuary Narragansett Bay. Major population centers are Providence, in the state of Rhode Island (RI), Fall River, in the state of Massachusetts (MA), and Newport, RI. Arrows denote major river inputs with flow proportional to arrow size (the Sakonnet River is a tidal strait). Based on data in the RI and MA 2014 Integrated Reports for the USEPA Clean Water Act, Section 303d, the shaded northern regions are designated as impaired for excess nutrients and/or low oxygen by state regulatory agencies (NBEP, 2017g).
Hypoxia in Narraganset Bay occurs as a series of events, each lasting from days to weeks typically in July and August (Codiga et al., 2009), and is classified as seasonal-periodic in the Diaz and Rosenberg (2008) system. Areas experiencing hypoxia suffer degraded benthic habitat (Deacutis, 2008; Hale et al., 2016). Northern areas where the river loads enter and stratification is strongest (Deacutis et al., 2006) are most heavily impacted, and state regulatory agencies have designated them as impaired (purple areas, Figure 1). Numerous widely-distributed treatment facilities discharge to the bay, both directly and upstream within the watersheds (Figure 2).
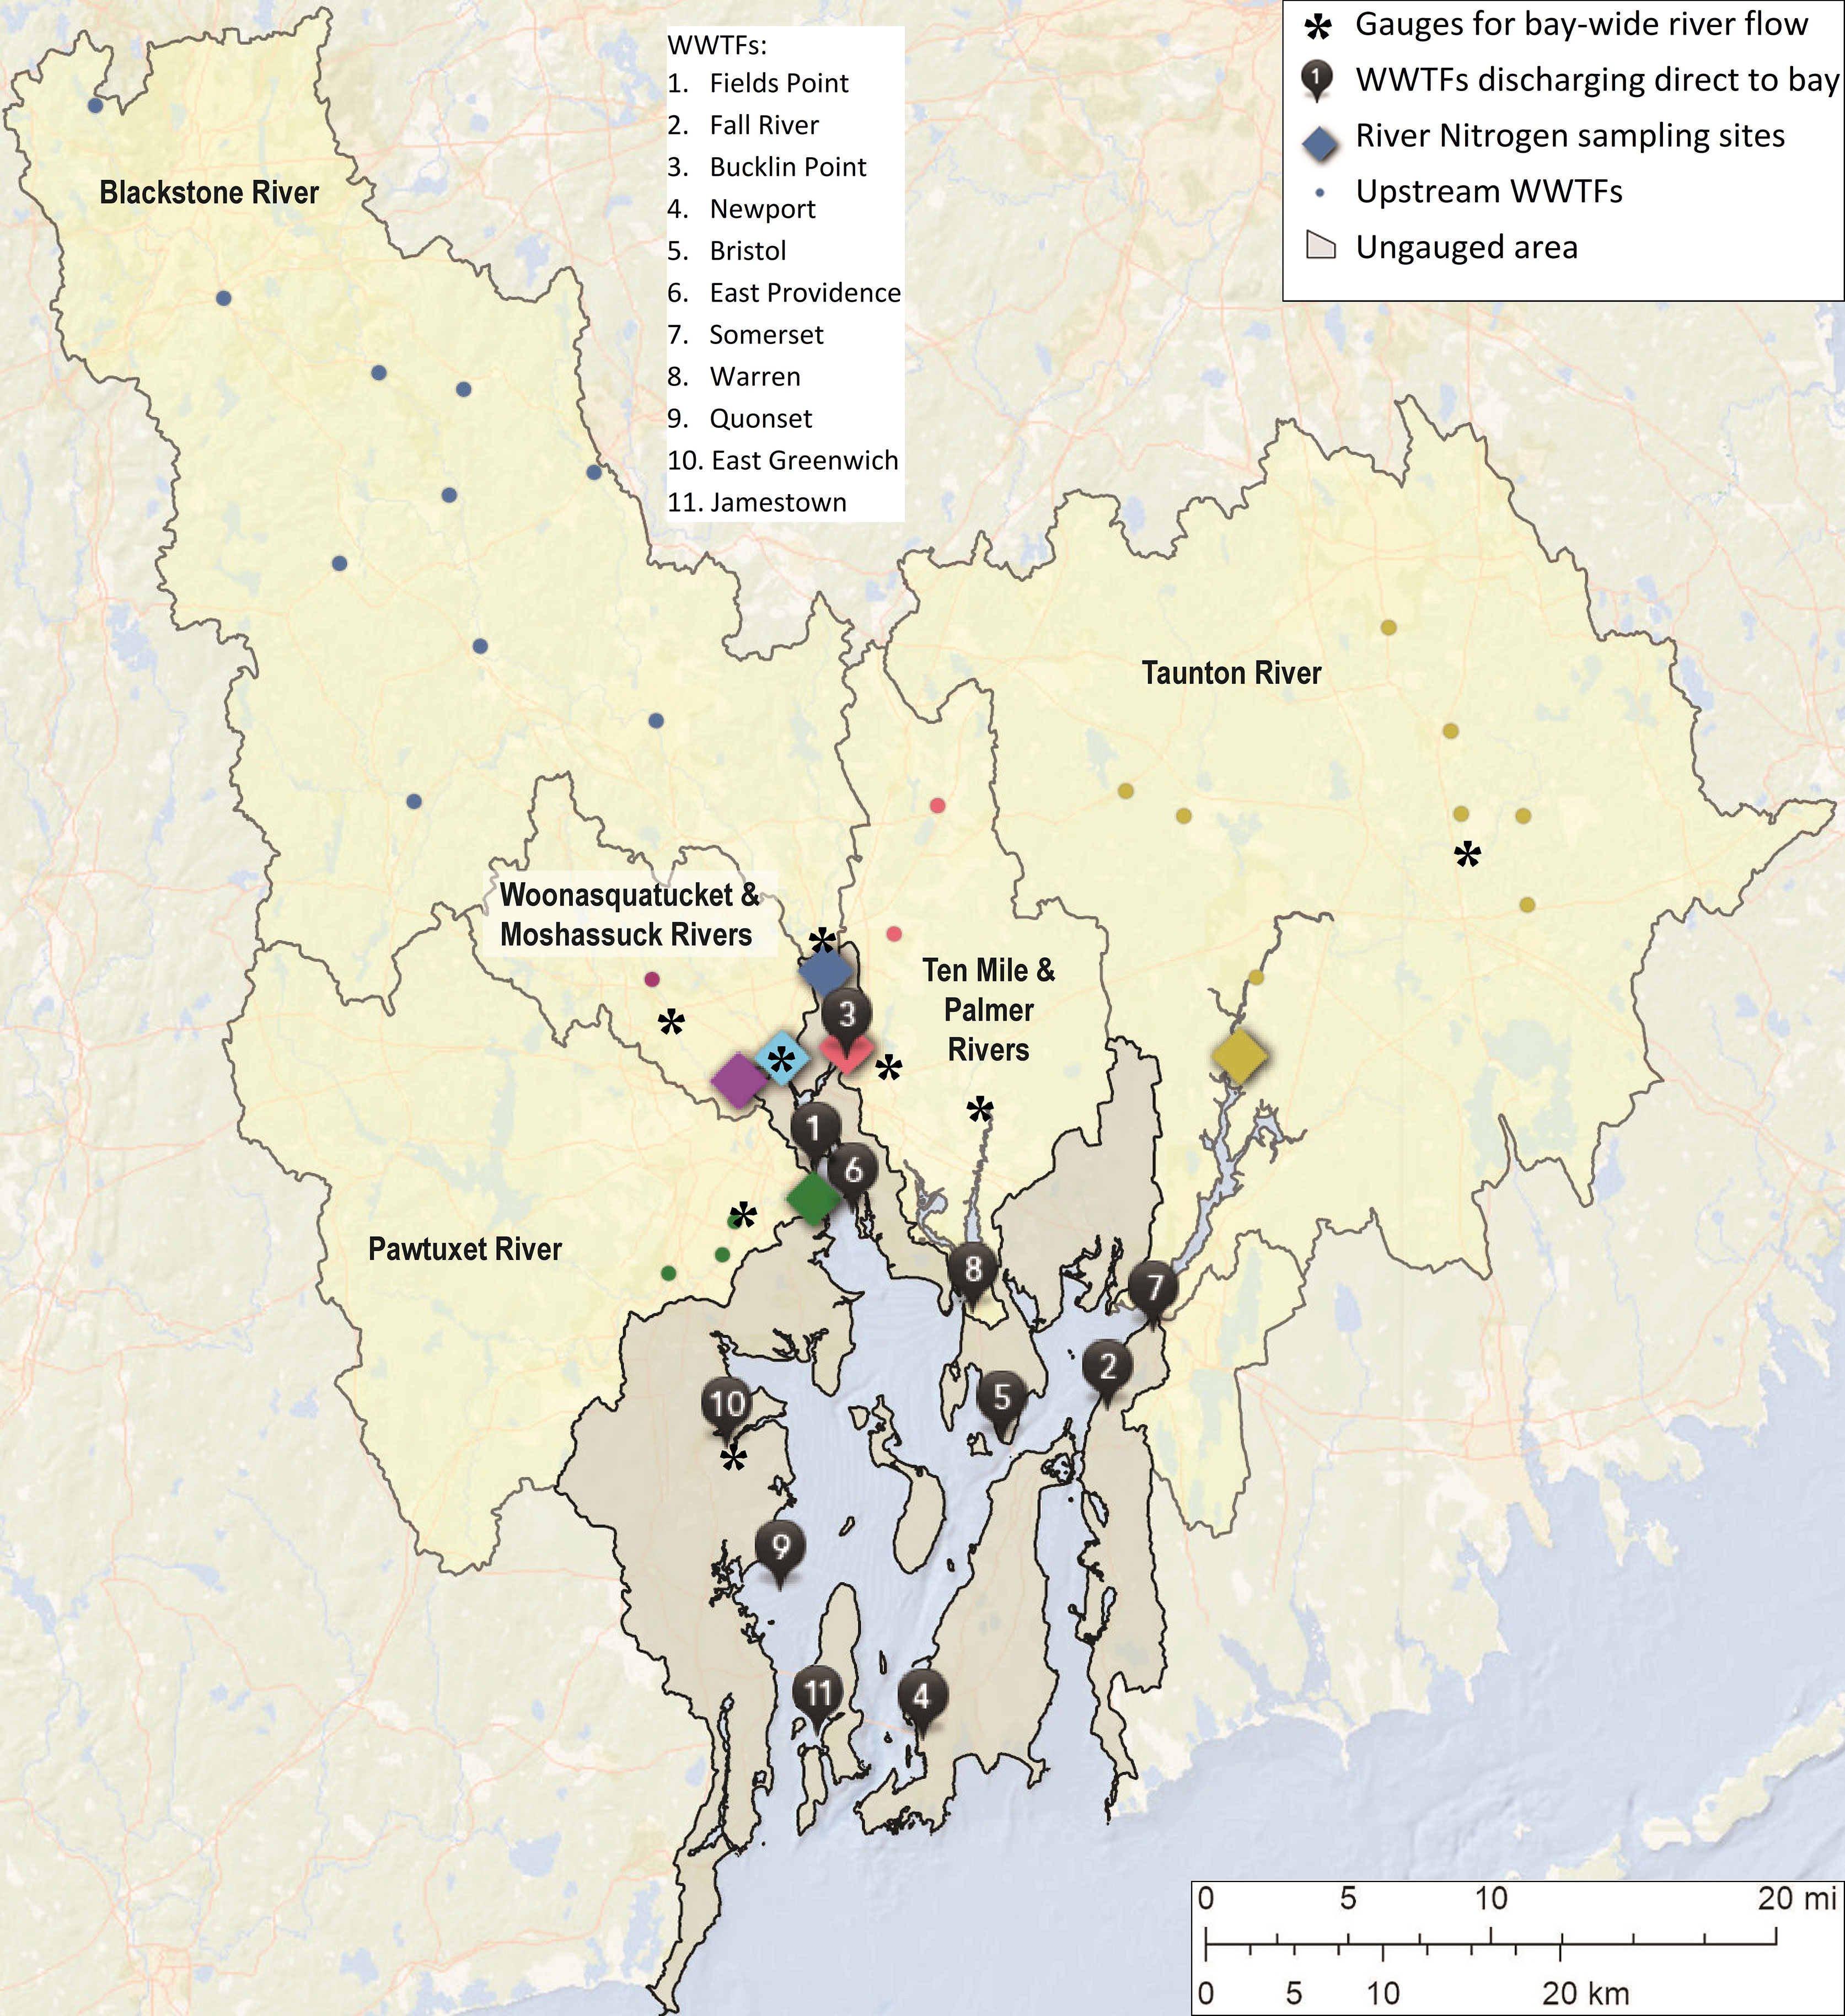
Figure 2 Bay-wide river flow calculation uses 8 gauges (black asterisks). Bay-wide load of total nitrogen uses 18 sources: 11 wastewater treatment facilities (WWTFs; black numbered pins), 6 riverine sources (colored diamonds are concentration sampling sites), and ungauged runoff direct to the bay (gray area). Riverine sources (diamonds): Taunton (yellow), Blackstone (blue), Pawtuxet (green), Ten Mile (red), Woonasquatucket (purple), and Moshassuck (cyan) Rivers; color-coded circles show upstream treatment facilities whose loads are accounted for in the river load of their respective watershed.
A high-profile fish kill occurred in the Greenwich Bay sub-embayment in 2003 which galvanized public support for action on nutrient reduction, although the cause was wind-driven stagnation of circulation as much as excess nutrients (RIDEM, 2003). Based on scientific guidance that reducing the nitrogen load would decrease phytoplankton levels and alleviate hypoxia, legislation was passed to require nitrogen load reductions bay-wide (RIDEM, 2005). Many facilities were required to upgrade to tertiary treatment, implementing the changes on relatively independent schedules over a period of at least several years (NBEP, 2017b; NBEP, 2017c). The target for the load decline was met by 2013, and early results showing lessened hypoxia seemed promising (Oviatt et al, 2017), setting the stage for the present in-depth investigation.
The focus is nitrogen and phosphorus is not part of the study, as budgets for nitrogen and phosphorus in Narragansett Bay (Nixon et al., 1995, Nixon et al., 2005, Krumholz, 2012, and NBEP, 2017c) show nitrogen is more limiting to phytoplankton. Phosphorus declined by 56% in the 1990s due to removal from detergents and implementation of controls in the watershed, and since 2005 has continued to decrease by an additional 11% so the ratios of the two inputs have been unchanged (Oviatt et al., 2017).
We examined the response to managed nitrogen load decline in Narragansett Bay, a warming temperate urban estuary, to evaluate the relative importance of several processes and put its results in the context of other systems. We focused on bay-wide conditions during 2005-2019, in the relatively deeper areas outside of small shallow embayments because they vary more independently due to local processes. We characterized the major inter-annual variability and identified its main driver. We quantified the bay-wide load of total nitrogen and examined the magnitude and timing of reductions, due to treatment facility upgrades, in the context of inter-annual variability. We evaluated the responses of chlorophyll and hypoxia, using observations from a network of fixed-site sensors with high temporal resolution. We gauged the relative importance of nitrogen load and stratification to the responses, both of which have inter-annual variations dominantly due to river flow. We investigated the potential importance of other physical influences including winds, tidal conditions, and sea level differences that can drive non-tidal circulation. Long-term warming is quantified over the period examined, and associated implications for the response of chlorophyll and hypoxia are discussed. Finally, results of this case study were put in the context of responses to managed nutrient declines in other waterbodies.
2 Methods
The period of analysis is June through September, which captures elevated summer chlorophyll and spans from the influence of late spring river flow to when hypoxia typically occurs in late June through early September. Conditions during the October through May period, not examined in part because most of the mooring sites do not sample year-round, are typified by lower phytoplankton productivity and weak or no stratification with little to no hypoxia, so are of secondary importance to June through September, given the relatively short residence times. June through September also falls entirely within the May through October recruitment period for many fish species, the period when state regulators require facilities to implement tertiary treatment to reduce loads. For full details of all methods see Codiga (2021).
2.1 Bay-Wide River Flow
Bay-wide river flow is computed using daily U.S. Geological Survey gauge measurements (e.g., USGS, 2004) from 8 rivers (Figure 2, asterisks): gauges 01108000 (Taunton River), 01113895 (Blackstone River), 01116500 (Pawtuxet River), 01109403 (Ten Mile River), 01114500 (Woonasquatucket River), 01114000 (Moshassuck River), 01109220 (Palmer River), and 01117000 (Hunt River). Gaps 3 days or shorter are filled by linear interpolation and longer gaps are filled by regression against a nearby river. The flow of each gauge is scaled up to account for ungauged area downstream of the gauge within its watershed; the scale-up factor is the same for all years but varies by day of the year, a linear interpolation of the 12 monthly values given by Ries (1990) for each river. To account for ungauged areas that drain directly to the bay (gray area in Figure 2) outside the river watersheds, the results from all scaled-up rivers are summed and the total is scaled up by the same method, also using monthly scale-up factors for ungauged areas from Ries (1990). The mean is computed over June through September.
2.2 Bay-Wide Load of Total Nitrogen
Bay-wide load of total nitrogen is computed as the sum of loads from 18 sources (Figure 2, pins and diamonds): 11 treatment facilities discharging directly to the bay, 6 rivers which include loads of treatment facilities discharging upstream in their watershed, and ungauged area draining directly to the bay. For each source, the load is computed as the product of the flow and the total nitrogen concentration. Flow and concentration measurements for treatment facilities were obtained from the state regulatory agency and facility operators. For river sources, concentrations are from 6 sites sampled by the Narragansett Bay Commission (e.g., NBC, 2019; Figure 2, diamonds) and flows are from U.S. Geological Survey gauges scaled appropriately to account for ungauged areas (NBEP, 2017c; due to the limited concentration measurement sites, the set of gauges differs in some ways from those used for bay-wide river flow). During periods when total nitrogen was not measured, it was computed using other measured quantities (e.g., sum of total Kjeldahl nitrogen plus nitrate), or using a correlation between it and other constituents during periods when both were measured. A constant concentration is used, based on measurements from a mostly rural portion of the watershed (Fulweiler and Nixon, 2005), for ungauged area (gray, Figure 2) and its flow is computed as noted above. Flow measurements have daily resolution and concentration measurements, generally available weekly to monthly, and linearly interpolated to daily resolution for both treatment facility and river sources. Despite the latter step, daily variability of load is captured because it is dominated by flow variability, which spans orders of magnitude while variations in concentration are less pronounced (Figure 3). Annual averages of the daily results generally agree to within about 10%-20% with results (Nixon et al., 2008; Krumholz, 2012; NBEP, 2017c) from the Beale’s estimator method (Beale, 1962) for the limited years to which it has been applied. The mean is computed from June through September.
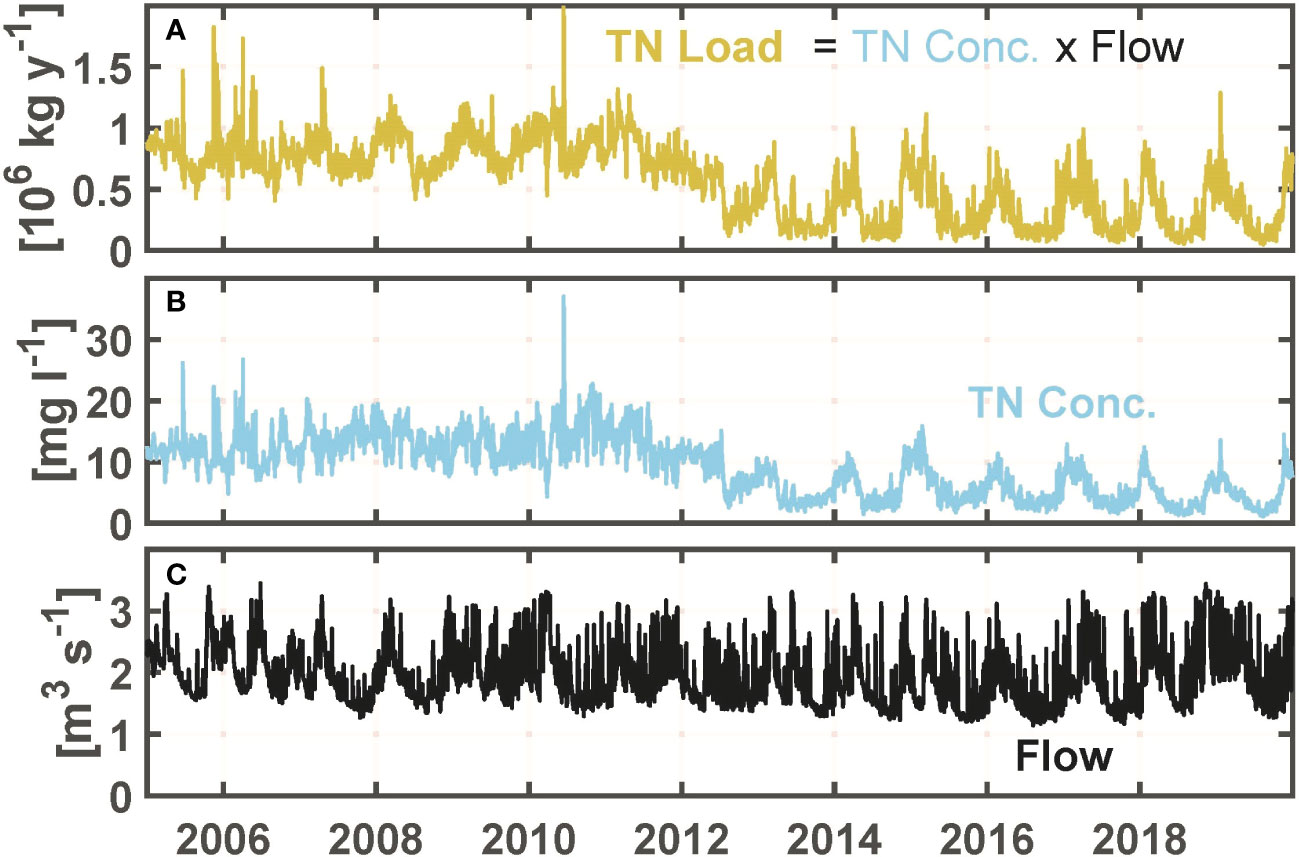
Figure 3 Example of daily total nitrogen (TN) load method, for one source: Fields Point wastewater treatment facility. (A) TN load. (B) TN concentration. (C) Flow. For this facility, effects of the upgrade to tertiary treatment were phased in mainly during 2012-2013.
2.3 Bay-Wide Phytoplankton and Hypoxia Metrics: Chlorophyll Index and Hypoxia Index
Chlorophyll and oxygen are from the 15-minute resolution time series observations of the Narragansett Bay Fixed Site Monitoring Network (e.g., NBFSMN, 2019; RIDEM, 2020) at 8 sites (Figure 4; black squares). Data from some sites are available starting in 2001, but 2005 was the first year with sufficient sampling from the 8 sites treated. These sites (depths from 5 to 11 m relative mean lower low water) provide bay-wide coverage for the present study because they encompass and extend beyond the area impacted most strongly by eutrophication (Figure 1). Other network sites are not treated here because they are in shallow embayments, such as Greenwich Bay, where variability is due to local processes and not coherent with the rest of the bay. Seasonal continuous data is collected at each site using two multi-parameter sensors (Yellow Springs International 6-series or EXO), one within 1 m of the water surface and the other within 1 m of the seafloor. Chlorophyll (ug l-1) measurements are from fluorometer sensors at the near-surface depth at each station. They have been compared to an extensive chlorophyll a discrete grab water sample dataset from laboratory analysis and shown to agree acceptably without need for post-calibration, despite that no adjustments were made for the effect of non-photochemical quenching (Codiga, 2020). Oxygen measurements are from the near-seafloor sensor. (Methods for temperature and stratification, also from these sensors, are described in Section 2.4.)
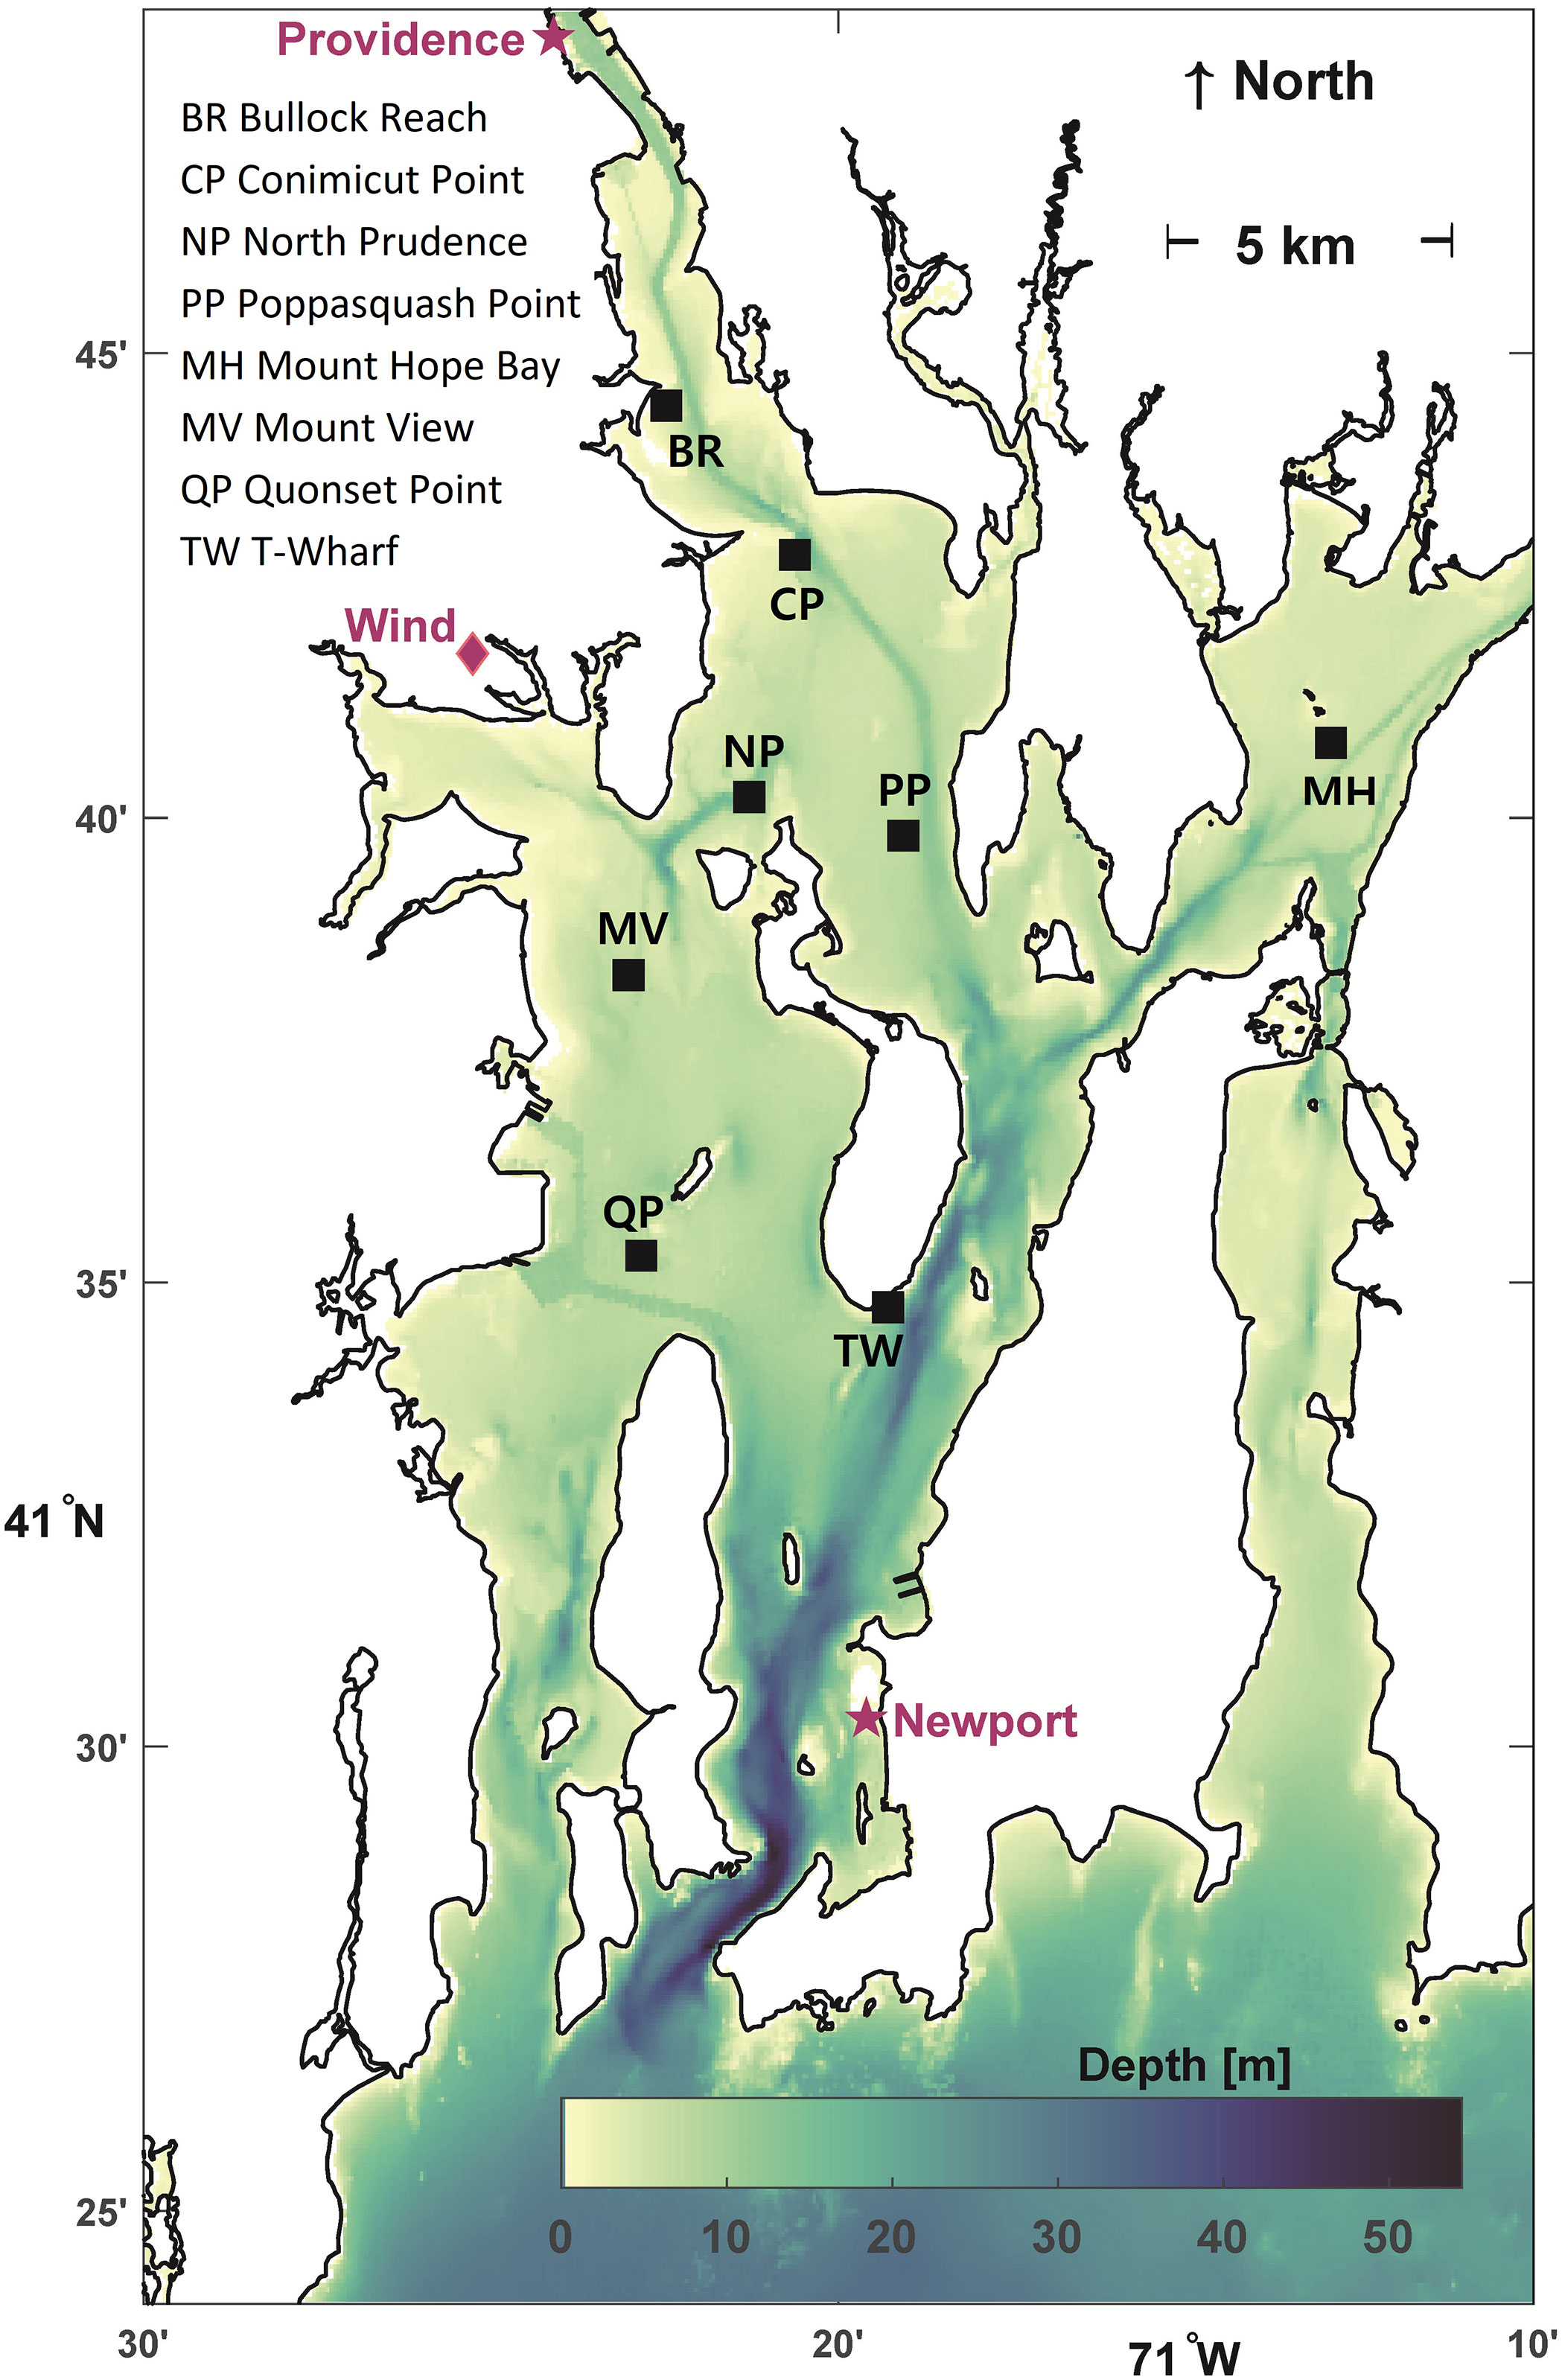
Figure 4 Stations where chlorophyll, oxygen, temperature, and stratification time series are observed (8 black squares). Bathymetric depths (colorbar). Providence and Newport sea level stations (purple stars); tidal range is from Newport sea level station. Grid point location for winds from North American Regional Reanalysis (purple diamond).
Phytoplankton is a primary source of organic matter and chlorophyll measurements are used as a proxy for the respiration that leads to hypoxia. The bay-wide metric for phytoplankton abundance is the event-based Chlorophyll Index (Figure 5A; NBEP, 2017d). An event occurs at a given station when the chlorophyll concentration remains above a fixed threshold for a period of time. The area swept out by the time series concentration curve when above the threshold is denoted the surplus-duration, because it increases both for higher values (or surplus, relative to the threshold) during the event and for a longer event duration. Units of surplus-duration are μg l-1 d; for example, if the concentration exceeds the threshold by 10 μg l-1 for a period of 2 d, the surplus-duration of the event is 20 μg l-1 d. The Chlorophyll Index (units also μg l-1 d) at a site is the season-cumulative surplus-duration or summed surplus-duration of all events from June through September, and the bay-wide Chlorophyll Index is the average of the index across the 8 sites. Two thresholds are used: moderate (8.7 μg l-1), and severe (14.6 μg l-1), determined as the 50th and 80th percentiles, respectively, of all data from all sites and years.
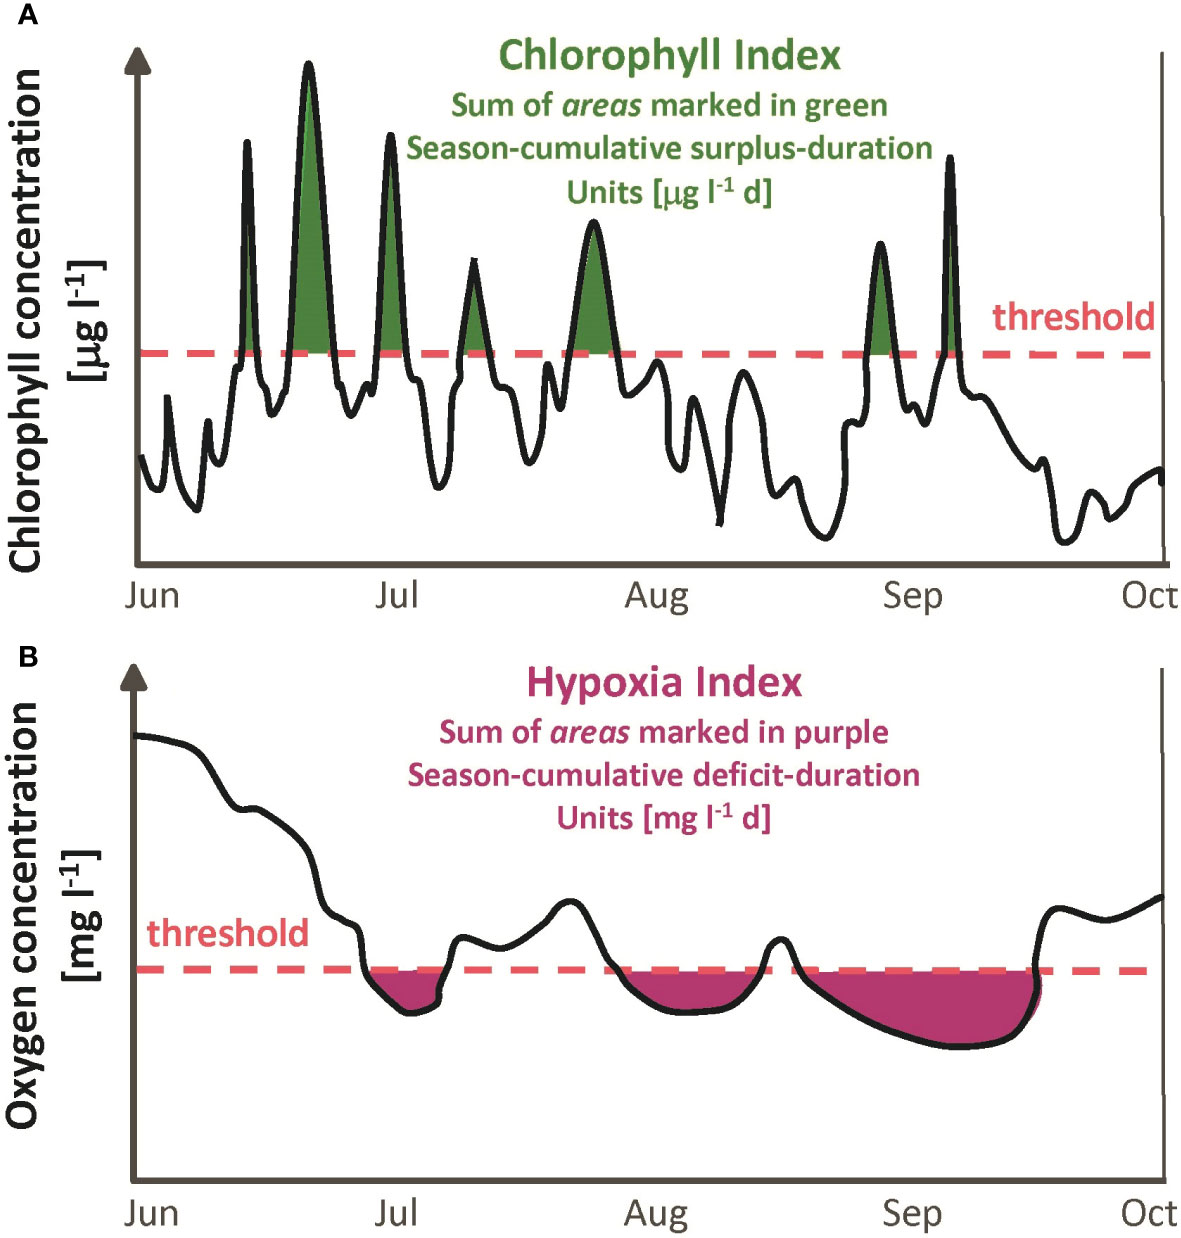
Figure 5 Schematic definitions of (A) Chlorophyll Index and (B) Hypoxia Index computed from June through September time series observations. Values used for thresholds are discussed in the text.
Steps to compute the bay-wide Chlorophyll Index relative to each threshold, which is a single value for the June through September period of each year, are as follows. First, for each of the 8 sites, the time series observations for that year are used to identify individual events when concentrations are above the threshold, and the surplus-duration is computed for each event. Next, the season-cumulative surplus-duration is computed as the sum over all events from June through September for that site. Finally, the bay-wide result is the mean of the season-cumulative values across the 8 sites.
The bay-wide metric for hypoxia is the event-based Hypoxia Index (Figure 5B; NBEP, 2017e). Events when the time series oxygen concentration falls below a threshold are characterized by their deficit-duration, analogous to the surplus-duration in chlorophyll. Units of deficit-duration are mg l-1 d; for example, if the concentration is below the threshold by 2 mg l-1 for a period of 4 d, the deficit-duration of the event is 8 mg l-1 d. The Hypoxia Index (units also mg l-1 d) at a site is the season-cumulative deficit-duration, or summed deficit-duration of all events from June through September, and the bay-wide Hypoxia Index is the average of the index across the 8 sites. The two thresholds used, denoted moderate (2.9 mg l-1) and severe (1.4 mg l-1), are determined by regulatory agencies based on criteria for protection of larval organisms (USEPA, 2000; RIDEM, 2006). Steps to compute the bay-wide Hypoxia Index are parallel to those noted above for the bay-wide Chlorophyll Index.
The Chlorophyll Index and Hypoxia Index are used because they quantify the frequency and severity of events exceeding the thresholds, and therefore are a more useful gauge of degradation than other central-tendency statistics such as the mean or median.
2.4 Stratification, Wind, Tidal Conditions, Sea Level Differences, and Temperature
Stratification is computed from the same fixed-site network sensors that measure chlorophyll and oxygen (Figure 4). They also measure temperature and salinity, which are used to compute density by the seawater equation of state. Stratification is computed as the difference between near-seafloor and near-surface densities. This suffices for the present analysis because density profiles, available much less often than the time series used, commonly have a two-layer structure (Deacutis et al., 2006). Bay-wide stratification is the June through September mean averaged across the 8 sites.
Winds are the 10-m elevation 3-hour resolution data-assimilative North American Regional Reanalysis meteorological model product (Mesinger et al., 2006) at a grid point located just north of Greenwich Bay (Figure 4). They are representative of bay-wide conditions, given the 32-km spatial resolution of the model, and used because they are gap-free unlike local wind measurements. Tidal ranges are computed using predictions for the National Oceanic and Atmospheric Administration station 8452660 at Newport, RI (Figure 4), which is representative of bay-wide tidal conditions. The daily tidal range is computed as the mean of differences (typically one, otherwise two) between successive high and low tides each day, and used as a proxy for tidal current strength. The cube of the tidal range is used here as the indicator for inter-annual variations in tidal mixing energy, as energy available for vertical mixing from tidal currents is proportional to the cube of the current speed (Niiler and Kraus, 1977). Sea level difference is treated as a proxy for non-tidal circulation influencing residence time. Sea level at Providence and Newport stations (Figure 4), the only two with sufficient observations, is differenced after applying the inverse barometer correction using atmospheric pressure measurements. The wind, tidal range cubed, and sea level difference records are low-passed by a 25-hour half-width triangle-weight running mean and interpolated or subsampled to 12-hour resolution to suppress the daily sea breeze component of winds and the tidal component of sea level difference, and then the June through September mean is computed.
For bay-wide temperatures the measurements from the fixed site network are averaged across both depths and the 8 sites, from June through September. The long-term trend calculation uses these values, as well as results from averaging only the near-surface and only the near-seafloor measurements.
2.5 Statistical Methods
Standard non-parametric statistical methods (e.g., Gilbert, 1987), the Kendall correlation coefficient Tau, and the Theil-Sen regression were used.
3 Results
The “textbook” conceptual framework for understanding eutrophication generally consists of excess nutrient loads causing overabundant phytoplankton which, through respiration during bacterial consumption of the resulting organic matter, drives hypoxia. For this reason, the results for nitrogen load are presented first, followed by chlorophyll, and hypoxia results. When presenting nitrogen load, the results for river flow are also presented as it is the main influence on inter-annual variability of load. Finally, the potential roles of physical processes, which are not always included as primary drivers in the conceptual framework, are examined: stratification, winds, tidal conditions, sea level differences, and temperature.
Bay-wide June through September total nitrogen load has inter-annual variations strongly influenced by inter-annual variations in bay-wide river flow (Figure 6A), with significant (p<0.01) correlation coefficient Tau 0.676 (Table 1). Another prominent feature in bay-wide nitrogen load is a long-term decline. This occurred over a period of several years, due to upgrade implementations at different facilities in different years. During 2013, when a treatment facility with one of the largest loads fully implemented upgrades yielding substantial declines (Figure 3), bay-wide load was notably reduced compared to earlier years with comparable river flow. This motivates examining the relationship between bay-wide load and bay-wide river flow for the 2005-2012 and 2013-2019 periods separately despite that, as noted, the load decline was not simply a step decrease at the end of the first period. Correlations between load and river flow for the two periods independently (Figure 7A) are both significant (p<0.01) with Tau 0.786 and 0.905, respectively, both higher than Tau (0.686) for the entire 2005-2019 period. The magnitude of the decline in load achieved over the entire period is comparable to or smaller than the range of inter-annual variability, making the decline more uncertain and harder to isolate. The independent regressions for the two periods (Figure 7A) help quantify the extent to which load declines: for a given river flow, load during 2013-2019 is about 106 kg yr-1 lower than during 2005-2012. The average load during 2013-2019 was 34% lower than the average load during 2005-2012.
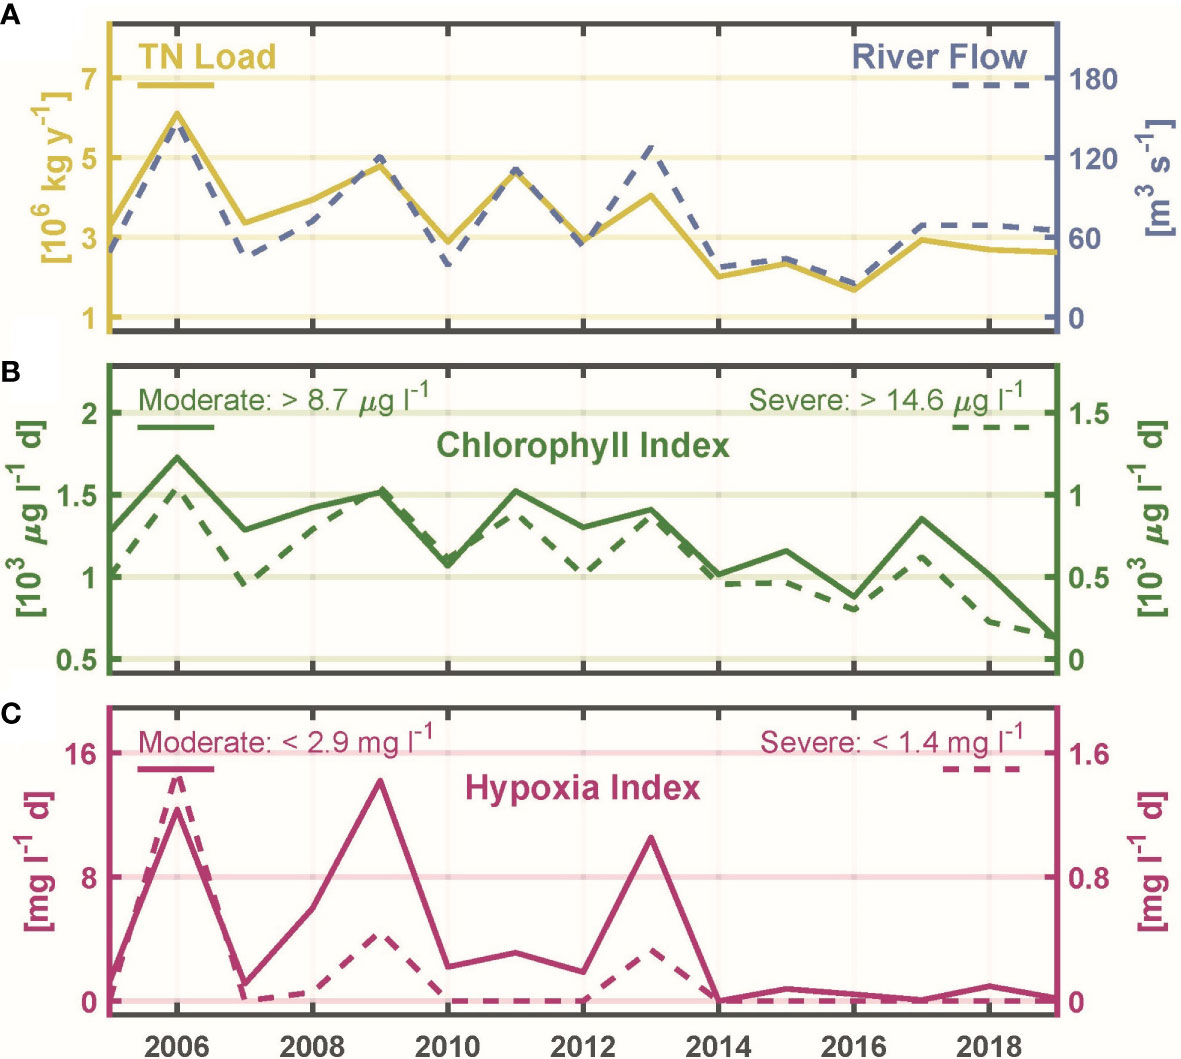
Figure 6 (A) TN load (left axis, solid line) and river flow (right axis, dashed line), June through September means. (B) Chlorophyll Index relative to moderate threshold > 8.7 μg l-1 (left axis, solid line) and relative to severe threshold > 14.6 μg l-1 (right axis, dashed line). (C) Hypoxia Index relative to moderate threshold < 2.9 mg l-1 (left axis, solid line) and relative to severe threshold < 1.4 mg l-1 (right axis, dashed line).
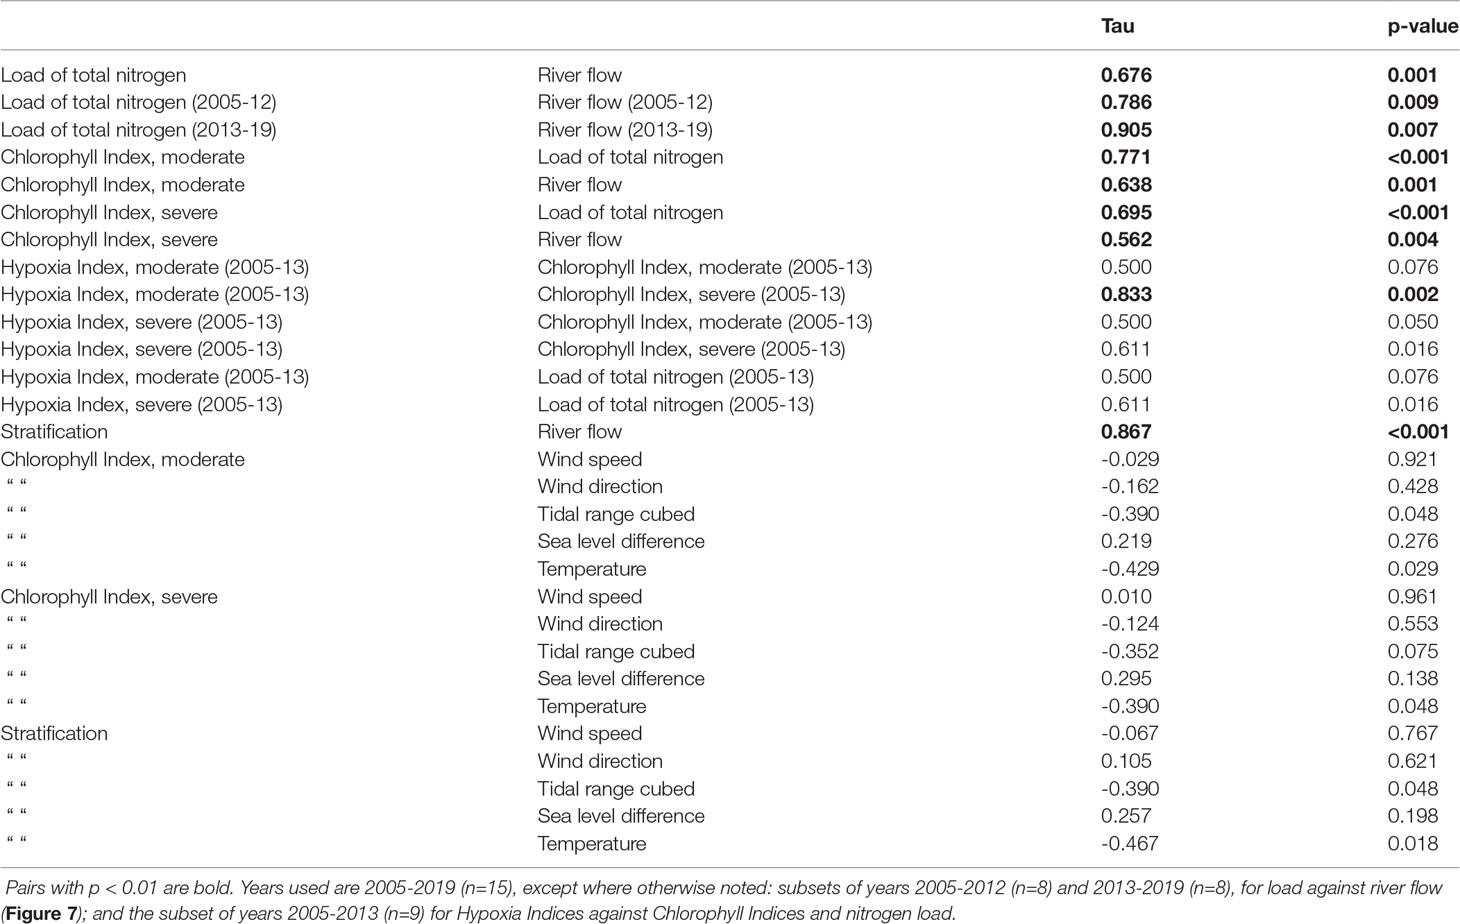
Table 1 Coefficients (Tau) and p-values for Kendall correlations between June through September mean quantities.
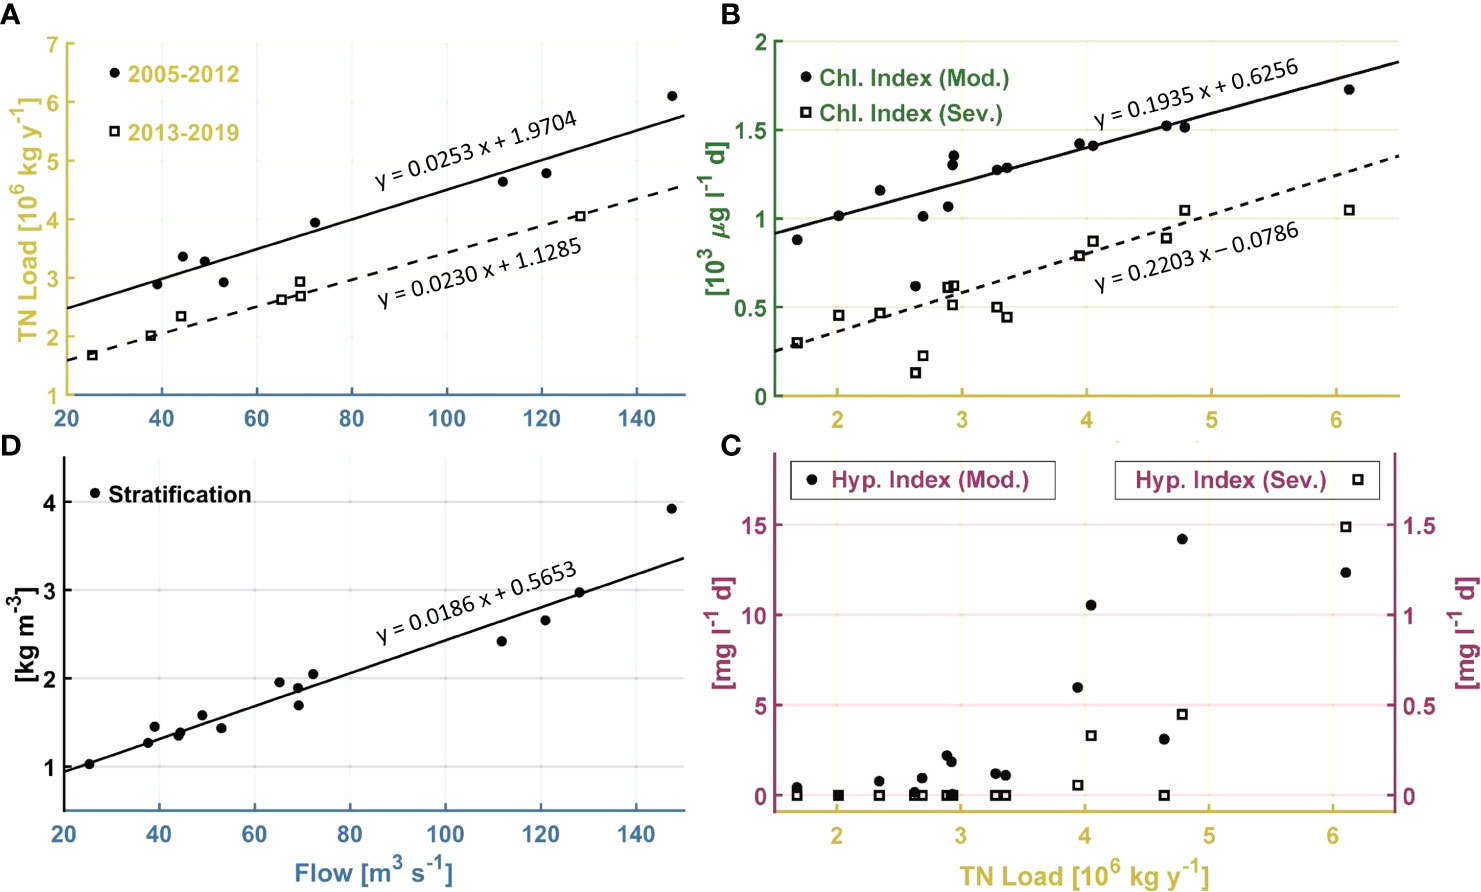
Figure 7 (A) Scatterplot and regressions for TN load as a function of river flow, June through September means, during 2005-2012 (solid circles, solid line, n = 8) and 2013-2019 (open squares, dashed line, n = 7). (B) Scatterplot and regressions of Chlorophyll Index against June through September mean TN load. Solid circles and solid line for moderate threshold > 8.7 μg l-1; open squares and dashed line for severe threshold > 14.6 μg l-1. (C) Hypoxia Index as a function of June through September mean TN load. Solid circles for moderate threshold 2.9 mg l-1, open squares for severe threshold 1.4 mg l-1. (D) Scatterplot and regression of stratification against river flow, June through September means.
The bay-wide Chlorophyll Index results, for both the moderate and severe thresholds, are characterized by inter-annual variability and a long-term decline that are both .similar to those features in the total nitrogen load time series (Figure 6B). Their correlation to nitrogen load is significant (p<0.01), for both thresholds (Figure 7B), with Tau of 0.771 and 0.695, respectively (Table 1). This supports the hypothesis that changes in phytoplankton abundance, as represented by the Chlorophyll Index, are driven by the changes in nitrogen load. Due to the relatively tight relationship between nitrogen load and river flow, the Chlorophyll Index for both moderate and severe thresholds is also significantly correlated (p<0.01) to river flow. The corresponding Tau values of 0.638 and 0.562 (Table 1), respectively, are lower than for the regression between Chlorophyll Index and nitrogen load, consistent with phytoplankton responding to nitrogen load more directly than to river flow. Based on the slopes of the regressions between Chlorophyll Indices and nitrogen load (about 0.21 x 10³ μg l-1 d per 106 kg yr-1; Figure 7B) and the 106 kg yr-1 reduction in nitrogen load between the end and beginning of the 2005-2019 period (Figure 7A), the Chlorophyll Indices declined over the period by about 0.25 x 10³ μg l-1 d. Relative to conditions during the initial years, this is a reduction of about 16% and 33% for the moderate and severe thresholds, respectively.
It is notable that during 2013, when the nitrogen load declined markedly relative to earlier years with comparable river flow (Figure 6A), the Chlorophyll Index that year did not decline in a comparable way (Figure 6B). Despite the correlated inter-annual variability of the Chlorophyll Index and nitrogen load over the time series as a whole, the relationship did not hold for each individual year.
The main characteristic of the bay-wide Hypoxia Index results (Figure 6C) is a transition from conditions during 2013 and earlier, when values ranged from 0 to about 15 mg l-1 d with high inter-annual variability, to low (less than about 2 mg l-1 d) or zero values from 2014 onward. For the Hypoxia Index relative to the severe threshold, a substantial decline relative to the peak of about 15 mg l-1 d in 2006 was clear by 2009. During the period prior to 2014, the years with higher Hypoxia Index generally occurred during years with higher Chlorophyll Index, including the year 2013. For this reason, and to exclude the period with values at or near zero, the 2005-2013 period was used in regressing Hypoxia Index against Chlorophyll Index (Table 1). The results indicate a strong relationship (Tau 0.833, p<0.01) between the Hypoxia Index relative to the moderate threshold and the Chlorophyll Index relative to the severe threshold, with weaker relationships (p>0.01) for each of the other three pairs of indices (Table 1). Thus, the relation of hypoxia metrics with chlorophyll metrics is weaker than the relation between chlorophyll metrics and nitrogen load (Figure 7B and Table 1).
Although the conceptual understanding is that nitrogen load influences hypoxia through phytoplankton, for completeness, correlations directly between Hypoxia Indices and nitrogen load were also computed for the same 2005-2013 period (Table 1; Figure 7C). The statistics are similar to correlations between Hypoxia Indices and Chlorophyll Indices, owing to the relatively strong relationship between Chlorophyll Indices and nitrogen load.
Stratification is significantly correlated to river flow (p<0.01, Tau 0.867; Figures 7D, 8A), as expected because the dominant influence on stratification in Narraganset Bay is salinity (Codiga, 2012). Furthermore, correlations of stratification to winds, tidal range cubed, sea level difference, and temperature are not significant (p>0.01; Table 1), indicating each of these associated physical processes, which could potentially influence stratification, is of secondary importance compared to river flow.
River flow drives both stratification (Figures 7D, 8A) and nitrogen load (Figures 6A, 7A). Stratification is more tightly correlated to river flow than nitrogen load (Tau 0.867 and 0.676, respectively; Table 1). There is a long-term decline in nitrogen load (Figure 6A) which is not evident in stratification (Figure 8A). These relationships support the hypothesis that the long-term decline in chlorophyll is due to nitrogen load, rather than alternative hypotheses involving long-term changes to stratification.
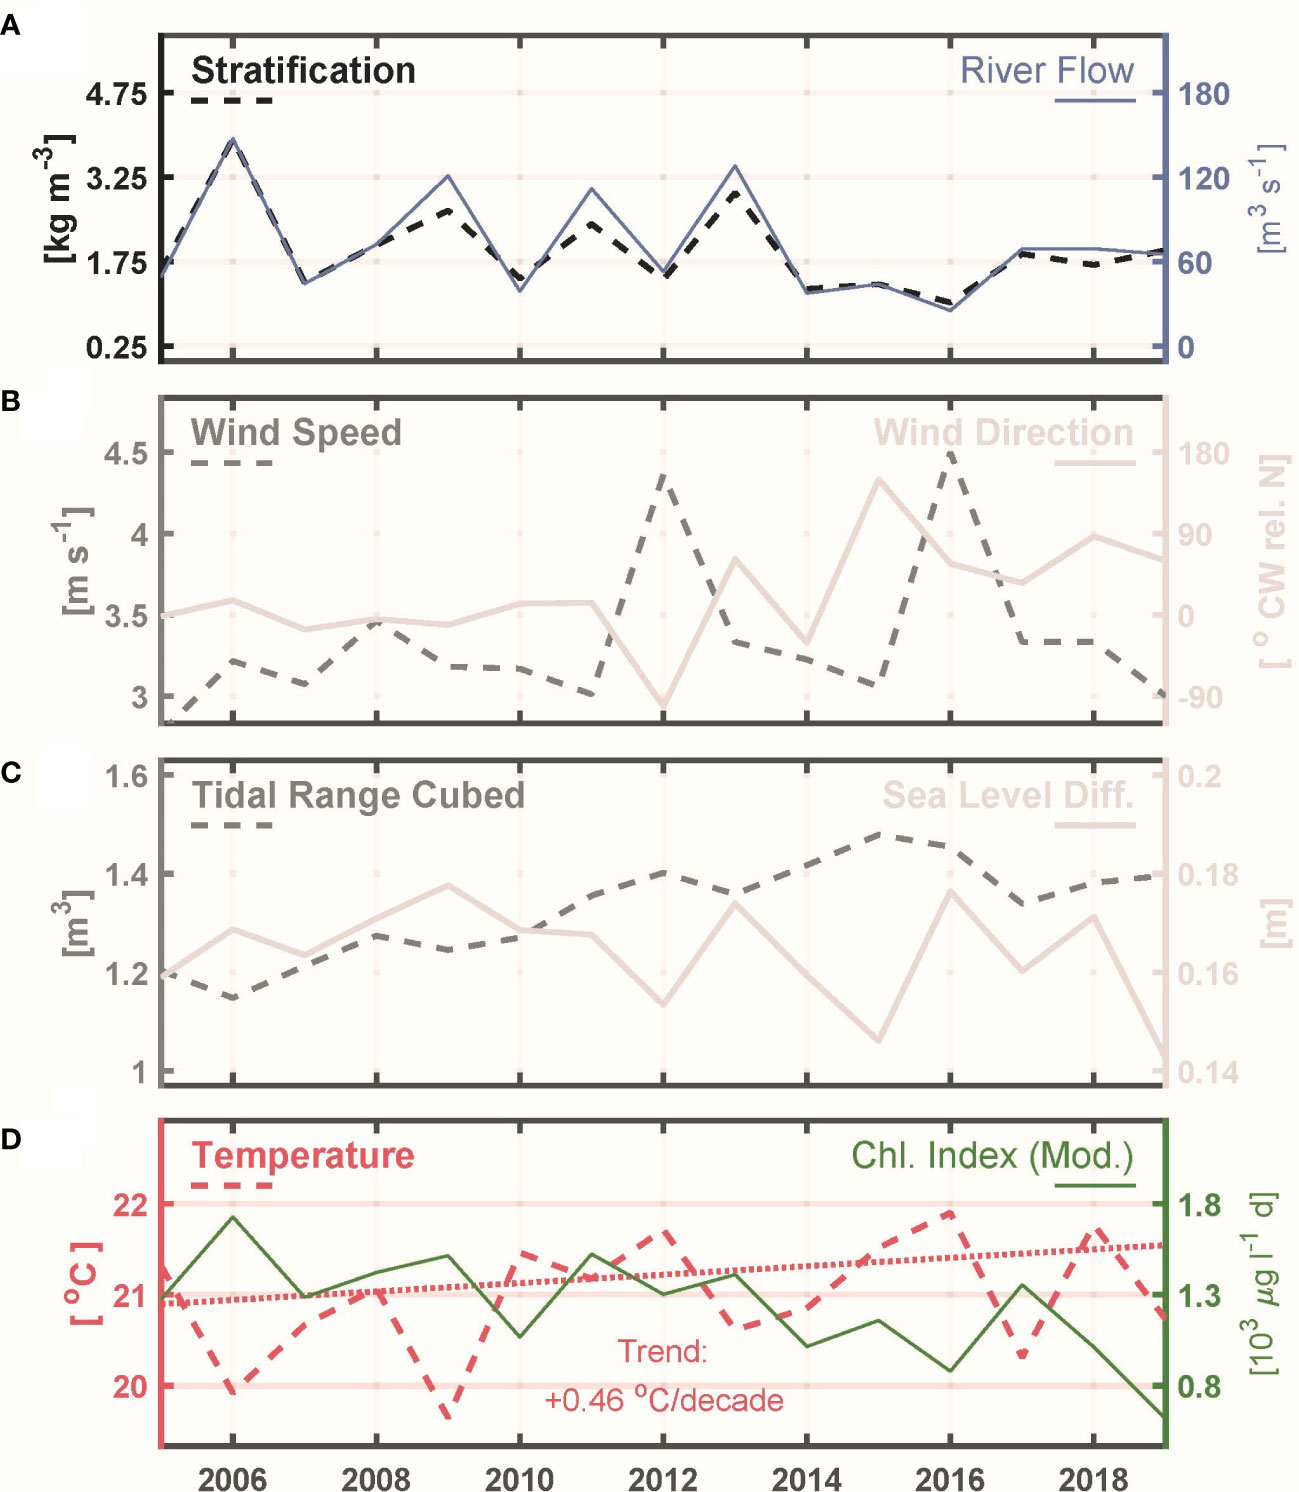
Figure 8 Physical drivers, June through September means. (A) Stratification (left axis, dashed) and River Flow (right axis, solid; repeated from Figure 6 for reference). (B) Wind speed (left axis, dashed) and wind direction (right axis, solid). (C) Tidal range cubed (left axis, dashed) and sea level difference between Providence and Newport (right axis, solid). (D) Temperature (left axis, dashed; trend regression dotted) and Chlorophyll Index relative to the moderate threshold (right axis, solid; repeated from Figure 6 for reference).
To gauge potential roles of physical influences (stratification, wind speed, wind direction, tidal range cubed, sea level difference, and temperature) their time series (Figures 8A–D) are presented with, for reference, the Chlorophyll Index relative to the moderate threshold (Figure 8D). Strong relationships of Chlorophyll Index or Hypoxia Index to physical processes are not evident and all corresponding regressions are insignificant (p>0.01; Table 1). This confirms that both the inter-annual variability and long-term decline in symptoms of eutrophication (chlorophyll, hypoxia) are best understood as a response to nitrogen load, with physical influences of secondary importance.
Inter-annual variations of bay-wide June through September mean temperature do not parallel those in Chlorophyll Index or Hypoxia Index (p>0.01, Table 1 and Figure 8D), suggesting temperature does not have a primary influence on individual year to year variations in phytoplankton metabolic growth rates and oxygen consumption rates. However, over the 15-year record there is a clear long-term warming trend at a mean rate of 0.46°C decade-1 (Figure 8D; Theil-Sen slope, 95% confidence interval -0.53 to 1.93° C decade-1). This rate is consistent with warming documented in datasets across the region (Pershing et al., 2015; Rheuban et al., 2016; Whitney and Vlahos, 2021), and corresponds to a 0.69°C higher temperature at the end of the 2005-2019 period relative to its start. There is no long-term increase in stratification due to the warming trend because, as noted above, temperature has a secondary influence on stratification compared to salinity. Furthermore, the warming rate for near-seafloor depths (0.66, c.i. -0.53 to 1.93°C decade-1) is marginally higher than for near-surface depths (0.33, c.i. -0.51 to 1.12,°C decade-1), opposite the sense that would increase stratification.
The seasonal cycle in oxygen concentrations includes values at or very near the saturation concentration when the bay is well-mixed during the winter. As spring and summer progress, consumption exceeds sources so concentrations are reduced below saturation, particularly deeper than the pycnocline where hypoxia occurs. A physico-chemical property of seawater is that the saturation concentration of oxygen declines by 0.21 mg l-1 per °C temperature increase, in the temperature, salinity, and pressure ranges for the annual cycle in Narragansett Bay (McDougall and Barker, 2011). The observed warming, of June through September mean temperatures, at an average rate of 0.46 °C decade-1 over the 2005-2019 period, corresponds to a reduction of the oxygen saturation concentration by 0.10 mg l-1 decade-1. Thus, if all other processes were the same in principle, the long-term reduction of saturation concentration by warming will lead to a trend of declining oxygen minima during the hypoxic season. The observed reduction in Narragansett Bay hypoxia, due to nitrogen load declines, has therefore, been less pronounced as a result of warming-driven declines in oxygen saturation. Separately from this effect due to the properties of seawater, the enhancement of respiration by warming temperatures will also increase oxygen consumption.
4 Discussion
In Narragansett Bay, despite its complex island and passage geometry, numerous river inputs, and broad geographic distribution of treatment facilities, the responses of phytoplankton and hypoxia to managed nitrogen load reductions have essentially followed expectations based on the “textbook” conceptual understanding of eutrophication. Periods of high chlorophyll have declined and so have hypoxic events. Our findings support the hypothesis that load reductions are responsible for the phytoplankton decline: the inter-annual variations and long-term decline of the bay-wide Chlorophyll Index, for both the moderate and severe thresholds, are similar to those characteristics in the load-time series and unlike other candidate drivers including a range of physical influences.
June through September mean river flow, the main driver of the pronounced inter-annual variability of many system attributes, including nitrogen load, was lower than typical during the latter portion of the 15-year period. This made it more difficult to discern the influence of the managed load decline. In the period from 2013 onward, only 2013 had river flow comparably as high as the three earlier years with high river flow (2006, 2009, and 2011; Figure 6). However, the 2013-2019 period had three moderate flow years in addition to the high flow in 2013, such that the regression for 2013-2019 clearly differs from that of 2005-2012, and bay-wide load in the latter period was approximately 106 kg y-1 lower for a given river flow (Figure 7A) across a range of river flows spanning from highest to lowest.
The Chlorophyll Index metric (Figure 5) depends only on values above the threshold, which are in the high end of the distribution (above the 50th and 80th percentiles, for the moderate and severe thresholds, respectively). This is appropriate because a substantial part of the organic matter leading to oxygen consumption and hypoxia results from excessive chlorophyll concentrations, including during blooms. However, particularly for the severe threshold (80th percentile), there also could be situations when the chlorophyll concentration is relatively high and sustained for long periods without exceeding the threshold. This would lead to high oxygen consumption and hypoxia, without increased Chlorophyll Index values. For these situations, a central-tendency metric, such as the mean or median chlorophyll concentration, would have advantages over the Chlorophyll Index.
Our focus on the June through September period was motivated by the relatively short flushing time of the system (10-40 days, Pilson, 1985), which suggests that conditions prior to June will not have major impact on hypoxia during the subsequent summer. This may not be the case if the delay between phytoplankton production and the subsequent oxygen consumption that leads to hypoxia is substantially longer than the flushing time. Prior analyses indicate that summer hypoxia is most strongly affected by the June river flow (Codiga et al., 2009) and that load and blooms prior to June, even for unusually large events, do not appear to affect subsequent summer hypoxia conditions (Oviatt et al., 2022). At most sites the chlorophyll time series observations are not available prior to about mid-May of each year, so we did not examine the potential role of high chlorophyll conditions during the period earlier than June. Although respiration generally follows the seasonal temperature cycle and peaks during summer (Nixon et al., 1976), seasonal patterns of chlorophyll show high concentrations during the winter-spring period outside of June to September (Kremer and Nixon, 1978; Li and Smayda, 1998). Therefore, organic matter generated earlier than June could be an important influence on hypoxia during the subsequent summer and deserves further investigation.
The physical parameter with long-term variations that could most plausibly help explain the chlorophyll decline is the tidal range cubed (Figure 8C), a proxy for tidal mixing energy. Unlike the other physical parameters examined, its changes showed a pattern during most of the analyzed period. The pattern was a long-term increase, followed by values lower than the peak during the final few years. Inter-annual changes in this parameter are due to variations in tidal cycles, including the 18.6-year lunar tidal cycle, and also the fact that the June through September period spans differing portions of spring-neap cycles each year. Increased tidal mixing will, in general, act to weaken stratification but there was no observed long-term change in the stratification parameter treated (difference between near-seafloor and near-surface density; Figure 8A). The lack of change in this stratification parameter could potentially be viewed as an apparent discrepancy with the increases in the tidal mixing parameter that occurred over much of the record. A possible resolution could be that there are long-term changes in other measures of stratification not examined, such as the buoyancy frequency, for which sufficiently frequent density profiles to evaluate its role are not available. However, we consider the most likely resolution to be that river flow has a strongly dominant influence on stratification, with changes in tidal conditions being a much weaker influence. This is supported by the correlations of stratification with river flow and with the tidal mixing parameter, which are very strong and weak, respectively (Table 1).
The response of the bay to load changes can occur over a period of at least a year. This is evidenced in particular by the year 2013, when there was a distinct reduction in nitrogen load relative to earlier years with similar river flow but the Chlorophyll Index and Hypoxia Index did not decline proportionately (Figure 6). The water residence time is much shorter than a year which suggests that some process acting on a longer duration than a year is influencing the response of the bay. Sediment fluxes of nitrogen (Nixon et al., 1995) are a plausible candidate, in contrast to load inputs due to major storms (Oviatt et al, 2022).
The relatively simple nature of the bay response, consisting of reduced chlorophyll and hypoxia resulting from the load reduction, was not necessarily a foregone conclusion. In other systems a range of influences that could potentially be important in Narragansett Bay have caused different responses to similar load declines (Boesch, 2019). In the Baltic Sea, managed nutrient load declines have been less effective than expected (Conley, 2012) partly due to sedimentary sources of nutrients (Stigebrandt and Andersson, 2020). In Narragansett Bay, studies of sediment fluxes do not suggest a similarly prominent importance (Fulweiler and Nixon, 2012; Fulweiler and Heiss, 2014). In the Long Island Sound, long-term changes in wind direction along the estuary axis caused stratification changes that led to a slower improvement in conditions than would otherwise have occurred (Wilson et al., 2008). Wind also strongly modulates stratification and hypoxia in the Chesapeake Bay (Scully, 2010). In Narragansett Bay, the predominant wind direction is not aligned sufficiently well with the orientation of the main estuary axis to cause similar wind-induced effects on stratification or hypoxia (Codiga et al, 2009; Codiga, 2012). In the James River estuary, spring-neap tidal cycles are a major driver of phytoplankton and oxygen variability (Lake et al., 2013), due to their modulation of stratification (Li et al., 2017). Early studies sought a similar link between neap tides and hypoxic events in Narragansett Bay (Bergondo et al., 2005), but analyses using longer multi-year durations have shown that tidal conditions have a weak influence on stratification and hypoxia (Codiga et al., 2009). The response of Narragansett Bay to managed nutrient declines seems most similar to that of Tampa Bay (Greening et al., 2014).
Despite the apparent simplicity of the response, a number of processes we did not examine could potentially play important roles. For example, as hypoxia became less prevalent, filter feeders may have recovered and contributed to the phytoplankton decline (Altieri and Witman, 2006). We used chlorophyll as a proxy for respiration but the relation between chlorophyll and the phytoplankton biomass that drives respiration varies due to many factors including responses to different nutrient and light conditions (Riemann et al., 1989) and changes in phytoplankton community composition (Ní Longphuirt et al., 2019). Furthermore, not all phytoplankton organic matter is consumed by bacteria to drive hypoxia; other fates include export by physical circulation processes (Bukaveckas et al., 2011) and grazing by zooplankton (Anderson and Harvey, 2019).
Warming is reducing the oxygen saturation concentration, a physico-chemical property of seawater, by 0.10 mg l-1 decade-1. This is probably a lower bound for the magnitude of the rate of long-term decline in oxygen concentration, given that warmer temperatures are also likely to increase phytoplankton production and oxygen consumption rates.
Long-term trends of increasing precipitation levels, with increasingly intense events (Melillo et al., 2014; NBEP, 2017f), are expected to drive similar changes in river flow. These may be at least as impactful as warming because higher river flow will increase the nutrient load from watershed sources other than treatment plants. An increase of 40 m3 s-1 in bay-wide river flow, by about 55% over the mean flow during the analyzed period, corresponds to increased nitrogen load from non-treatment facility sources of about 106 kg y-1 (Figure 7A). This is comparable to the magnitude of the managed load decline. Future wet summers may cause increases to non-treatment facility loads that, at least partially, offset the managed load decrease.
The competing influences on hypoxia of the managed nutrient decline, oxygen saturation decline due to climate warming, and potentially wetter future summers can be shown in a schematic diagram (Figure 9). In addition, should summer river flow increase it will strengthen stratification, further ensuring the potential for hypoxia. Thus, as seen similarly in other estuaries (Harding et al, 2016), in coming decades long-term trends driven by climate change have the potential to influence the status of eutrophication in Narragansett Bay at least as much as the recent managed nutrient declines. In addition, population growth will increase volumes processed by treatment facilities, putting pressure on their ability to maintain current levels of nitrogen removal. Understanding future evolution of bay conditions will require sustained high quality water quality monitoring and targets for acceptable nutrient loads may need to be reevaluated.
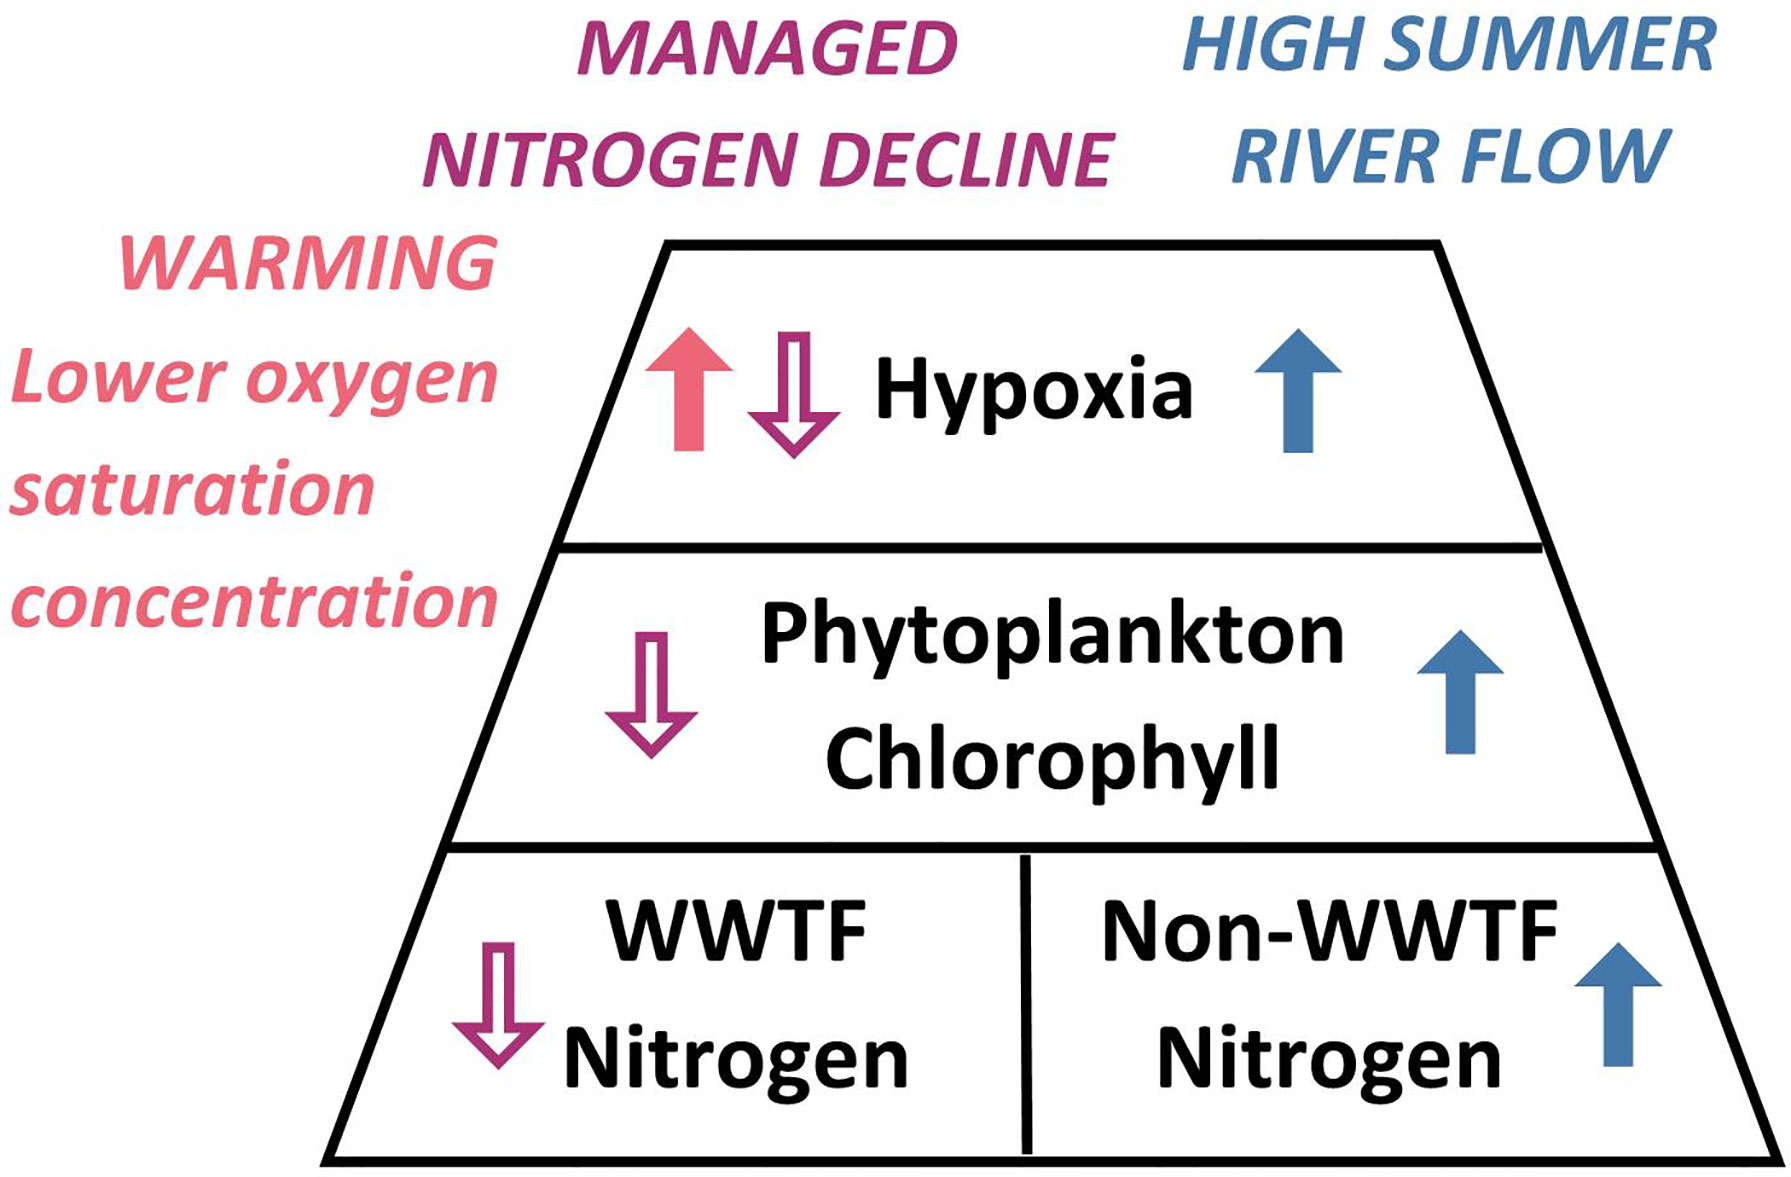
Figure 9 Schematic showing the sense of the effects of selected processes discussed in text on eutrophication-related conditions in Narragansett Bay. In black are “textbook” relationships of nutrients, phytoplankton, and hypoxia (resulting from bacterial consumption of organic matter from phytoplankton). Open purple arrows show the role of managed load declines. Red arrow shows influence of climate warming on oxygen saturation. Blue arrows show influence of high summer river flow.
5 Conclusions
Observations of key eutrophication-related conditions in the Narragansett Bay estuary (Figure 1), which suffers seasonal-periodic hypoxia, were examined during the June through September period for 2005-2019. Regulatory requirements led numerous wastewater treatment facilities discharging to the bay, both directly and via rivers of its watershed (Figure 2), to implement tertiary treatment for nitrogen removal over a period of several years. The managed decline in total nitrogen load was quantified as the product of daily flow measurements and weekly to monthly concentration measurements linearly interpolated to daily resolution (Figure 3). The water quality response was analyzed using high-frequency time series observations from a network of moored buoys across the bay (Figure 4). The metric for phytoplankton is the bay-wide Chlorophyll Index (Figure 5A), which increases with both the amplitudes and durations of the multiple short events at each site when chlorophyll concentration is higher than fixed moderate and severe thresholds. Similarly, the event-based bay-wide Hypoxia Index (Figure 5B) is the metric that quantifies periods of oxygen concentration lower than fixed moderate and severe thresholds set based on harm to organisms.
The June through September mean bay-wide load declined substantially by 2013 (Figure 6A). The load decrease between the period up to 2013 and the years from then onward was roughly the same magnitude as the range of inter-annual variability driven by year-to-year variations in river flow (Figure 6A), approximately 106 kg y-1 (Figure 7A). The Chlorophyll indices (Figure 6B) showed both inter-annual variability and a long-term decline similar to that of load with statistically significant correlation to load (Figure 7B; Table 1). The Hypoxia Indices showed inter-annual variations similar to the Chlorophyll Indices, with higher values during years with higher river flow (Figure 6C) through 2013, then declined to zero or very nearly zero from 2014 onward. Consistent with the conceptual framework that nitrogen increases phytoplankton biomass and the latter increases hypoxia, the correlations of the Hypoxia Indices with the Chlorophyll Indices were weaker (Table 1) than the correlations between Chlorophyll Indices and load, but nonetheless the Hypoxia Indices generally increased with load (Figure 7C).
The reductions in phytoplankton and hypoxia are best explained by the load decline, with physical processes of secondary importance. Stratification has inter-annual variations that follow river flow tightly (Figures 7D, 8A), more so than nitrogen load. River flow drives both stratification and load but we isolated the two effects and showed that the long-term load decline is responsible for the water quality improvements. Inter-annual variations of winds, tidal conditions, and sea level differences (Figures 8B, C) cannot explain the reductions Chlorophyll and Hypoxia Indices. In this sense, the response to the managed load decline in Narragansett Bay is more like the textbook expectation (decreased phytoplankton and hypoxia) than has occurred in many other similar waterbodies around the world.
The long-term warming trend of 0.46°C decade-1 (Figure 8D) is not, thus far, causing changes in stratification but is reducing the oxygen saturation concentration by 0.10 mg l-1 decade-1. This is probably a lower bound for the magnitude of the rate of the long-term decline in oxygen concentration, given that warmer temperatures are likely to increase phytoplankton production and oxygen consumption rates. Thus, the reduction of hypoxia, due to the managed load decline, is less than it otherwise would have been without warming (Figure 9), and warming is expected to continue to exacerbate hypoxia in the decades to come. Anticipated long-term increases in river flow, due to higher precipitation, are also likely to be a major influence on the future eutrophication status of the bay; load due to non-treatment plant sources would increase by an amount comparable to the recent load decline due to treatment plant upgrades, should river flow increase by about 55%.
Author’s Note
The contents of this document do not necessarily reflect the views and policies of NEIWPCC or the EPA, nor does NEIWPCC, NBEP or the EPA endorse trade names or recommend the use of commercial products mentioned in this document.
Data Availability Statement
The datasets presented in this study can be found in online repositories. The names of the repository/repositories and accession number(s) can be found below: https://figshare.com/s/a421d07c711a212ca7b2.
Author Contributions
DC developed methods to calculate bay-wide nitrogen load, bay-wide river flow, Chlorophyll Index, and Hypoxia Index; conceived and carried out the analysis and interpretation; prepared non-GIS figures; and wrote the original draft. HS was responsible for collecting chlorophyll and oxygen observations and associated data management and quality control, helped guide analysis, and assisted with review and editing. CO managed fieldwork funding and assisted with review and editing. CS managed analysis funding, prepared map figures, and assisted with review and editing. All authors contributed to the article and approved the submitted version.
Funding
Chlorophyll and oxygen observations used in this paper have been sustained by the NBFSMN through collective support from the Office of Water Resources at the Rhode Island Department of Environmental Management (RIDEM), the Narragansett Bay Commission (NBC), the Narragansett Bay National Estuarine Research Reserve, the Graduate School of Oceanography (GSO) at University of Rhode Island, and the North East Regional Association of Coastal and Ocean Observing Systems (NERACOOS)., The Coastal Hypoxia Research Program of the National Oceanic and Atmospheric Administration (Grants NA05NOS4781201 and NA11NOS4780043) supported much of the analysis, including development of the observation time series analysis methods. The United States Environmental Protection Agency (EPA) under assistance agreements (CE00A00004 and CE00A00407) to the New England Interstate Water Pollution Control Commission (NEIWPCC) in partnership with the Narragansett Bay Estuary Program (NBEP) supported much of the analysis, including the nitrogen loads. Publication charges were paid by GSO Dean Paula Bontempi and NERACOOS.
Conflict of Interest
The authors declare that the research was conducted in the absence of any commercial or financial relationships that could be construed as a potential conflict of interest.
Publisher’s Note
All claims expressed in this article are solely those of the authors and do not necessarily represent those of their affiliated organizations, or those of the publisher, the editors and the reviewers. Any product that may be evaluated in this article, or claim that may be made by its manufacturer, is not guaranteed or endorsed by the publisher.
Acknowledgments
Heidi Travers (RIDEM), Eliza Moore (NBC), and Jeanne Wordell and Jesselyn Dugas (Veolia) provided and explained treatment plant datasets. David Borkman, Joe Habarek, and Sue Kiernan (RIDEM) gave useful review input. Suggestions from the reviewers helped us make important improvements.
References
Altieri A., Diaz R. (2019). “Dead Zones: Oxygen Depletion in Coastal Ecosystems,” in World Seas: An Environmental Evaluation (Second Edition). Volume III: Ecological Issues and Environmental Impacts. (Amsterdam: Academic Press, an Imprint of Elsevier), 453–473. doi: 10.1016/B978-0-12-805052-1.00021-8
Altieri A. H., Witman J. D. (2006). Local Extinction of a Foundation Species in a Hypoxic Estuary: Integrating Individuals to Ecosystem. Ecology 87, 717–730. doi: 10.1890/05-0226
Anderson S. R., Harvey E. L. (2019). Seasonal Variability and Drivers of Microzooplankton Grazing and Phytoplankton Growth in a Subtropical Estuary. Front. Mar. Sci. 6. doi: 10.3389/fmars.2019.00174
Beale E. M. L. (1962). Some Uses of Computers in Operational Research. Industrielle. Organisation. 31, 51–52.
Boesch D. F. (2019). Barriers and Bridges in Abating Coastal Eutrophication. Front. Mar. Sci. 6. doi: 10.3389/fmars.2019.00123
Borkman D. G., Smayda T. J. (2016). Coincident Patterns of Waste Water Suspended Solids Reduction, Water Transparency Increase and Chlorophyll Decline in Narragansett Bay. Mar. Pollut. Bull. 107 (1), 161–169. doi: 10.1016/j.marpolbul.2016.04.004
Breitburg D., Grégoire M., Isensee K. (2018) Global Ocean Oxygen Network 2018. The Ocean is Losing its Breath: Declining Oxygen in the World’s Ocean and Coastal Waters. Available at: https://unesdoc.unesco.org/ark:/48223/pf0000265196.
Bukaveckas P. A., Barry L. E., Beckwith M. J., David V., Lederer B. (2011). Factors Determining the Location of the Chlorophyll Maximum and the Fate of Algal Production Within the Tidal Freshwater James River. Estuaries. Coasts. 34 (3), 569–582. doi: 10.1007/s12237-010-9372-4
Codiga D. L. (2012). Density Stratification in an Estuary With Complex Geometry: Driving Processes and Relationship to Hypoxia on Monthly to Inter-Annual Timescales. J. Geophys. Res. 117, C12004. Narragansett Bay Estuary Program. Providence. doi: 10.1029/2012JC008473
Codiga D. L. (2020). “Further Analysis And Synthesis Of Narragansett Bay (Ri/Ma Usa) Oxygen, Chlorophyll, And Temperature,” in NBEP Technical Report. NBEP 20-231a. Narragansett Bay Estuary Program. Providence. Available at: https://figshare.com/s/7d51f2540df6638a4552. doi: 10.6084/m9.figshare.12547676
Codiga D. L. (2021). “Analysis and Synthesis of Eutrophication-Related Conditions in Narragansett Bay (RI/MA USA): Updated Through 2019,” in NBEP Technical Report. NBEP-21-243. Narragansett Bay Estuary Program. Providence. Available at: https://figshare.com/s/a421d07c711a212ca7b2. doi: 10.6084/m9.figshare.14830890
Codiga D. L., Stoffel H. E., Deacutis C. F., Kiernan S., Oviatt C. (2009). Narragansett Bay Hypoxic Event Characteristics Based on Fixed-Site Monitoring Network Time Series: Intermittency, Geographic Distribution, Spatial Synchronicity, and Inter-Annual Variability. Estuaries. Coasts. 32 (4), 621. doi: 10.1007/s12237-009-9165-9
Deacutis C. F. (2008). “Nutrient Impacts in Upper Narragansett Bay,” in Science for Ecosystem-Based Management: Narragansett Bay in the 21st Century. Eds. Desbonnet A., Costa-Pierce B. A. (New York: Springer), 349–381.
Deacutis C., Murray D., Prell W., Saarman E., Korhun L. (2006). Hypoxia in the Upper Half of Narragansett Bay, RI, During August 2001 and 2002. Northeastern. Nat. 13, 173–198. doi: 10.1656/1092-6194(2006)13[173:HITUHO]2.0.CO;2
Diaz R. J., Rosenberg R. (2008). Spreading Dead Zones and Consequences for Marine Ecosystems. Science 321 (5891), 926–929. doi: 10.1126/science.1156401
Duarte C. M., Conley D. J., Carstensen J., Sánchez-Camacho M. (2009). Return to Neverland: Shifting Baselines Affect Eutrophication Restoration Targets. Estuaries. Coasts. 32, 29–36. doi: 10.1007/s12237-008-9111-2
Fulweiler R. W., Heiss E. M. (2014). (Nearly) a Decade of Directly Measured Sediment N2 Fluxes: What can Narragansett Bay Tell Us About the Global Ocean Nitrogen Budget? Oceanography 27 (1), 184–195. doi: 10.5670/oceanog.2014.22
Fulweiler R. W., Nixon S. W. (2005). Export of Nitrogen, Phosphorus, and Suspended Solids From a Southern New England Watershed to Little Narragansett Bay. Biogeochemistry 76, 567–593. doi: 10.1007/s10533-005-0444-7
Fulweiler R. W., Nixon S. W. (2012). Net Sediment N2 Fluxes in a Southern New England Estuary–Variations in Space and Time. Biogeochemistry 111, 111–124. doi: 10.1007/s10533-011-9660-5
Galligan B. P., Stuart Y. E., McManus M. C., Stoffel H. E. (2022). Hypoxia-Induced Predation Refuge for Northern Quahogs (Mercenaria Mercenaria) in a Temperate Estuary. Estuarine. Coast. Shelf. Sci. 265, 107732. doi: 10.1016/j.ecss.2021.107732
Gilbert D., Rabalais N. N., Díaz R. J., Zhang J. (2010). Evidence for Greater Oxygen Decline Rates in the Coastal Ocean Than in the Open Ocean. Biogeosciences 7, 2283–2296. doi: 10.5194/bg-7-2283-2010
Greening H., Janicki A. (2006). Toward Reversal of Eutrophic Conditions in a Subtropical Estuary: Water Quality and Seagrass Response to Nitrogen Loading Reductions in Tampa Bay, Florida, USA. Env. Mgmt. 38 (2), 163–178. doi: 10.1007/s00267-005-0079-4
Greening H., Janicki A., Sherwood E. T., Pribble R., Johansson J. O. R. (2014). Ecosystem Responses to Long-Term Nutrient Management in an Urban Estuary: Tampa Bay, Florida, USA. Estuar. Coast. Shelf. Sci. 151, A1–A16. doi: 10.1016/j.ecss.2014.10.003Haas
Haas L. W., Hastings S. J., Webb K. L. (1981). “Phytoplankton Response to a Stratification-Mixing Cycle in the York River Estuary During Late Summer,” in Estuaries and Nutrients. Contemporary Issues in Science and Society. Eds. Neilson B. J., Cronin L. E. (Humana Press). doi: 10.1007/978-1-4612-5826-1_33
Hale S. S., Cicchetti G., Deacutis C. F. (2016). Eutrophication and Hypoxia Diminish Ecosystem Functions of Benthic Communities in a New England Estuary. Front. Mar. Sci. 3. doi: 10.3389/fmars.2016.00249
Harding L.W., Gallegos C. L., Perry E. S., Miller W. D., Adolf J. E., Mallonee M. E., et al. (2016). Long-Term Trends of Nutrients and Phytoplankton in Chesapeake Bay. Estuaries. Coasts. 39, 664–681. doi: 10.1007/s12237-015-0023-7
Kremer J. N., Nixon S. W. (1978). A Coastal Marine Ecosystem: Simulation and Analysis (New York: Springer-Verlag).
Krumholz J. S. (2012). Spatial and Temporal Patterns in Nutrient Standing Stock and Mass-Balance in Response to Load Reductions in a Temperate Estuary.University of Rhode Island.
Lake S. J., Brush M. J., Anderson I. C., Kator H. I. (2013). Internal Versus External Drivers of Periodic Hypoxia in a Coastal Plain Tributary Estuary: The York River, Virginia. Mar. Ecol. Progressive. Ser. 492, 21–39. doi: 10.3354/meps10468
Li M., Liu W., Chant R., Valle-Levinson A. (2017). Flood-Ebb and Spring-Neap Variations of Lateral Circulation in James River Estuary. Cont. Shelf. Res. 148, 9–18. doi: 10.1016/j.csr.2017.09.007
Li Y., Smayda T. J. (1998). Temporal Variability of Chlorophyll in Narragansett Bay 1973–1990. ICES J. Mar. Sci. 55 (4), 661–667. doi: 10.1006/jmsc.1998.0383
McDougall T. J., Barker P. M. (2011). Getting Started With TEOS-10 and the Gibbs Seawater (GSW) Oceanographic Toolbox (SCOR/IAPSO WG127, International Association for the Physical Sciences of the Ocean (IAPSO). 28 pp
Melillo J. M., Richmond T. C., Yohe G. W. (Eds.) (2014). Climate Change Impacts in the United States: The Third National Climate Assessment (United States Global Change Research Program), 841 pp. Available at: https://nca2014.globalchange.gov/report.
Mesinger F., DiMego G., Kalnay E., Mitchell K., Shafran P. C., Ebisuzaki W., et al. (2006). North American Regional Reanalysis. Bull. Am. Meteorological. Soc. 87 (3), 343–360. doi: 10.1175/BAMS-87-3-343
NBC (2019) Narragansett Bay Commission, Nutrient Monitoring Program. Available at: http://snapshot.narrabay.com/app/WaterQualityInitiatives/NutrientMonitoring (Accessed 16 April, 2022).
NBEP (2017a). “State of Narragansett Bay and Its Watershed (Chapter 4, Population,” in Technical Report (Providence, RI: Narragansett Bay Estuary Program), 90–107.
NBEP (2017b). “State of Narragansett Bay and Its Watershed (Chapter 7, Wastewater Infrastructure,” in Technical Report (Providence, RI: Narragansett Bay Estuary Program), 147–165.
NBEP (2017c). “State of Narragansett Bay and Its Watershed (Chapter 8, Nutrient Loading,” in Technical Report (Providence, RI: Narragansett Bay Estuary Program), 166–189.
NBEP (2017d). “State of Narragansett Bay and Its Watershed (Chapter 16, Chlorophyll,” in Technical Report (Providence, RI: Narragansett Bay Estuary Program), 297–327.
NBEP (2017e). “State of Narragansett Bay and Its Watershed (Chapter 15, Dissolved Oxygen,” in Technical Report (Providence, RI: Narragansett Bay Estuary Program), 276–296.
NBEP (2017f). “State of Narragansett Bay and Its Watershed (Chapter 1, Temperature,” in Technical Report (Providence, RI: Narragansett Bay Estuary Program), 49–60.
NBEP (2017g). “State of Narragansett Bay and its Watershed (Chapter 18, Water Quality Conditions for Aquatic Life,” in Technical Report (Providence, RI: Narragansett Bay Estuary Program), 341–361.
NBFSMN (2019). Narragansett Bay Fixed-Site Monitoring Network 2019 Datasets (Rhode Island Department of Environmental Management, Office of Water Resources). Available at: http://www/dem.ri.gov/bart.
Nelson B. W., Sasekumar A., Ibrahim Z. Z. (1994). Neap-Spring Tidal Effects on Dissolved Oxygen in Two Malaysian Estuaries. Hydrobiologia 285, 7–17. doi: 10.1007/BF00005649
Niiler P. P., Kraus E. B. (1977). One Dimensional Models of the Upper Ocean, in Modeling and Prediction of the Upper Layers of the Ocean. Ed. Kraus E. B. (New York: Permagon), 143–172.
Ní Longphuirt S., McDermott G., O’Boyle S., Wilkes R., Stengel D. B. (2019). Decoupling Abundance and Biomass of Phytoplankton Communities Under Different Environmental Controls: A New Multi-Metric Index. Front. Mar. Sci. 6. doi: 10.3389/fmars.2019.00312
Nixon S. W. (1995). Coastal Marine Eutrophication: A Definition, Social Causes and Future Concerns. Ophelia 41, 199–219. doi: 10.1080/00785236.1995.10422044
Nixon S. W., Buckley B. A., Granger S. L., Harris L. A., Oczkowski A. J., Fulweiler R. W., et al. (2008). “Nitrogen and Phosphorous Inputs to Narragansett Bay: Past, Present, and Future,” in Science for Ecosystem-Based Management: Narragansett Bay in the 21st Century. Eds. Desbonnet A., Costa-Pierce B. A. (New York: Springer), 101–175.
Nixon S. W., Fulweiler R. W., Buckley B. A., Granger S. L., Nowicki B. L., Henry K. M. (2009). The Impact of Changing Climate on Phenology, Productivity, and Benthic–Pelagic Coupling in Narragansett Bay. Estuarine. Coast. Shelf. Sci. 82, 1–18. doi: 10.1016/j.ecss.2008.12.016
Nixon S. W., Granger S. L., Nowicki B. L. (1995). An Assessment of the Annual Mass Balance of Carbon, Nitrogen, and Phosphorous in Narragansett Bay. Biogeochem. 31 (1), 15–61. doi10.1007/BF00000805
Nixon S. W., Oviatt C. A., Hale S. S. (1976). "Nitrogen Regeneration And the Metabolism of Coastal Marine Bottom Communities," In: The Role of Terrestrial and Aquatic Organisms in Decomposition Processes, J.M. Anderson and A. MacFayden, Eds. (London: Blackwell Scientific Publications), 269–284, 1976.
Oviatt C., Keller A., Reed L. (2002). Annual Primary Production in Narragansett Bay With No Bay-Wide Winter–Spring Phytoplankton Bloom. Estuarine. Coast. Shelf. Sci. 54, 1013–1026. doi: 10.1006/ecss.2001.0872
Oviatt C. A., Smith L., Krumholz J., Coupland C., Stoffel H., Keller A., et al. (2017). Managed Nutrient Reduction Impacts on Nutrient Concentrations, Water Clarity, Primary Production, and Hypoxia in a North Temperate Estuary. Estuarine. Coast. Shelf. Sci. 199, 25–34. doi: 10.1016/j.ecss.2017.09.026
Oviatt C. A., Stoffel H., Huizenga K., Reed L., Codiga D., Fields L. (2022). A Tale of Two Spring Blooms in a Northeast Estuary of the USA: How Storms Impact Nutrients, Multiple Trophic Levels and Hypoxia. Hydrobiologia 849, 1131–1148. doi: 10.1007/s10750-021-04768-7
Pein J., Eisele A., Sanders T., Daewel U., Stanev E. V., van Beusekom J. E. E., et al. (2021). Seasonal Stratification and Biogeochemical Turnover in the Freshwater Reach of a Partially Mixed Dredged Estuary. Front. Mar. Sci. 8. doi: 10.3389/fmars.2021.623714
Pershing A. J., Alexander M. A., Hernandez C. M., Kerr L. A., Le Bris A., Mills K. E., et al. (2015). Slow Adaptation in the Face of Rapid Warming Leads to Collapse of the Gulf of Maine Cod Fishery. Science 350, 809–812. doi: 10.1126/science.aac9819
Pilson M. E. Q. (1985). On the Residence Time of Water in Narragansett Bay. Estuaries 8, 2–14. doi: 10.2307/1352116
Rheuban J. E., Williamson S., Costa J. E., Glover D. M., Jakuba R. W., McCorkle D. C., et al. (2016). Spatial and Temporal Trends in Summertime Climate and Water Quality Indicators in the Coastal Embayments of Buzzards Bay. Massachusetts. Biogeosci. 13, 253–265. doi: 10.5194/bg-13-253-2016
RIDEM (2003). The Greenwich Bay Fish Kill, August 2003: Causes, Impacts and Responses (Providence, RI: Rhode Island Department of Environmental Management), 32 pp. Available at: http://www.dem.ri.gov/pubs/fishkill.pdf.
RIDEM (2005). Plan for Managing Nutrient Loadings to Rhode Island Waters. Pursuant to RI General Law 46-12-3(25) (Providence, RI: Rhode Island Department of Environmental Management), 18p.
RIDEM (2006). Water Quality Regulations. Office of Water Resources (Rhode Island Department of Environmental Management). Available at: http://www.dem.ri.gov/programs/benviron/water/quality/surfwq/index.htm.
RIDEM (2020). Quality Assurance Project Plan, Narragansett Bay Fixed-Site Monitoring Network Seasonal Monitoring (Providence, RI: Rhode Island Department of Environmental Management). Available at: http://www.dem.ri.gov/programs/benviron/water/quality/surfwq/pdfs/nbfsmn.pdf.
Riemann B., Simonsen P., Stensgaard L. (1989). The Carbon and Chlorophyll Content of Phytoplankton From Various Nutrient Regimes. J. Plank. Res. 11 (5), 1037–1045 doi: 10.1093/plankt/11.5.1037
Ries K. G. (1990). Estimating Surface-Water Runoff to Narragansett Bay, Rhode Island and Massachusetts. U. S. Geol. Surv. Water-Resour. Invest. Rep. 89-4164, 1–49. doi: 10.3133/wri894164
Rogers J. M. (2008). Circulation and Transport in the Heart of Narragansett Bay (University of Rhode Island, Graduate School of Oceanography), 95 pp.
Sagasti A., Schaffner L. C., Duffy J. E. (2001). Effects of Periodic Hypoxia on Mortality, Feeding and Predation in an Estuarine Epifaunal Community. J. Exp. Mar. Biol. Ecol. 258, 257–283. doi: 10.1016/S0022-0981(01)00220-9
Savchuk O. P. (2018). Large-Scale Nutrient Dynamics in the Baltic Sea 1970–2016. Front. Mar. Sci. 5. doi: 10.3389/fmars.2018.00095
Scully M. E. (2010). Wind Modulation of Dissolved Oxygen in Chesapeake Bay. Estuaries. Coasts. 33 (5), 1164–1175. doi: 10.1007/s12237-010-9319-9
Scully M. E., Geyer W. R., Borkman D., Pugh T. L., Costa A., Nichols O. C. (2022). Unprecedented Summer Hypoxia in Southern Cape Cod Bay: An Ecological Response to Regional Climate Change? Biogeosci. Discuss. doi: 10.5194/bg-2022-48
Spaulding M. L., Swanson R. L. (2008). “Circulation and Transport Dynamics in Narragansett Bay,” in Science for Ecosystem-Based Management: Narragansett Bay in the 21st Century. Eds. Desbonnet A., Costa-Pierce B. A. (New York: Springer Ser. Environ.Manage.), 233–279. doi: 10.1007/978-0-387-35299-2_8
Stigebrandt A., Andersson A. (2020). The Eutrophication of the Baltic Sea has Been Boosted and Perpetuated by a Major Internal Phosphorous Source. Front. Mar. Sci. 23. doi: 10.3389/fmars.2020.572994
Tedesco M., Swanson R., Stacey P., Latimer J., Yarish C., Garza C. (2014). “Synthesis for Management. Chapter 7,” in Long Island Sound. Ed. Latimer J. S., et al, (Springer) doi: 10.1007/978-1-4614-6126-5_7
USEPA (2000). “Ambient Aquatic Life Water Quality Criteria for Dissolved Oxygen (Saltwater): Cape Cod to Cape Hatteras,” in Report EPA-822-R-00-012 (United States Environmental Protection Agency), 49 pp.
USGS (2004). “Water Resources Data for Massachusetts and Rhode Island, Water Year 2004,” in Water-Data Report MA-RI-04-1. (United States Geological Service). Available at: https://pubs.usgs.gov/wdr/2004/wdr-ma-ri-04-1/pdf/ADR2004WY.pdf.
Wei X., Garnier J., Thieu V., Passy P., LeGendre R., Billen G., et al. (2022). Nutrient Transport and Transformation in Macrotidal Estuaries of the French Atlantic Coast: A Modelling Approach Using C-GEM. Biogeosci. 19, 931–935doi: 10.5194/bg-19-931-2022
Whitney M. M., Vlahos P. (2021). Reducing Hypoxia in an Urban Estuary Despite Climate Warming. Environ. Sci. Technol. 55 (2), 941–951. doi: 10.1021/acs.est.0c03964
Wilson R. E., Swanson R. L., Crowley H. A. (2008). Perspectives on Long-Term Variations in Hypoxic Conditions in Western Long Island Sound. J. Geophysical. Research.: Oceans 113(C12), 1–13. doi: 10.1029/2007JC004693
Xia M., Jiang L. (2015). Influence of Wind and River Discharge on the Hypoxia in a Shallow Bay. Oce. Dyn. 65 (5), 665–678. doi: 10.1007/s10236-015-0826-x
Keywords: nitrogen load, eutrophication, hypoxia, chlorophyll, Narragansett Bay, warming, stratification,climate trends
Citation: Codiga DL, Stoffel HE, Oviatt CA and Schmidt CE (2022) Managed Nitrogen Load Decrease Reduces Chlorophyll and Hypoxia in Warming Temperate Urban Estuary. Front. Mar. Sci. 9:930347. doi: 10.3389/fmars.2022.930347
Received: 27 April 2022; Accepted: 22 June 2022;
Published: 22 July 2022.
Edited by:
Jesper H. Andersen, NIVA Denmark Water Research, DenmarkReviewed by:
Michelle Jillian Devlin, Fisheries and Aquaculture Science (CEFAS), United KingdomJacob Carstensen, Aarhus University, Denmark
Copyright © 2022 Codiga, Stoffel, Oviatt and Schmidt. This is an open-access article distributed under the terms of the Creative Commons Attribution License (CC BY). The use, distribution or reproduction in other forums is permitted, provided the original author(s) and the copyright owner(s) are credited and that the original publication in this journal is cited, in accordance with accepted academic practice. No use, distribution or reproduction is permitted which does not comply with these terms.
*Correspondence: Daniel L. Codiga, dcodiga@uri.edu