 Li Zhang
 Shujia Wang2
 Peng Zhang
- 1Guangxi Key Laboratory of Beibu Gulf Marine Resources, Environment and Sustainable Development, Fourth Institute of Oceanography, Ministry of Natural Resources, Beihai, China
- 2College of Chemistry and Environmental Science, Guangdong Ocean University, Zhanjiang, China
Mangroves are considered to be a sink for microplastics (MPs) due to their unique characteristics. Previous studies mainly focused on the spatial distribution of MPs, but few researchers have addressed the influence of tidal variation on this distribution, especially since the MP total number in mangroves was unknown. In this study, surface sediment samples were collected in mangroves from the Beibu Gulf, South China Sea, and the abundance, composition, and number of MPs were investigated. The results showed that MPs were widely present in all mangrove sediment samples, with abundances ranging from 26.67 ± 9.43 to 239.94 ± 37.80 items/kg. The distribution of MPs was heterogeneous among different sampling sites, with the highest levels in the Shankou (SK) area. The MP abundance in the same mangrove forest gradually increased from the low tidal zone to the high tidal zone, with the enrichment factor ranging from 1.50 to 4.00. The MP abundance was significantly correlated with particulate organic carbon (POC) (n = 12, R = 0.664, p < 0.05). Results showed that mangroves had an interception effect on MPs and factors affecting MP distribution in mangrove sediments included not only tides but also human activities, such as aquaculture, agriculture, and residential life. Finally, this paper estimated the MP total number in mangroves at different sampling areas and tidal zones, and the middle tidal zone was considered to be more accurate for MP pollution assessment in mangroves.
1 Introduction
The durability and high resistance to degradation of plastics make them an attractive material; however, the tension between human development and environmental protection is increasing, which inevitably leads to environmental pollution (Ma et al., 2021). With the 2019 coronavirus disease epidemic, the consumption of plastics increases dramatically (Govender et al., 2020), but plastics degrade relatively slowly in the ocean and environmental problems increase (Barnes et al., 2009; Sivan, 2011). Plastics enter the marine environment in various sizes and account for 80%–85% of total marine litter (Derraik, 2002; UNEP, 2016). Plastic particles formed when large particles are broken down by ultraviolet light are referred to as secondary microplastics (MPs) (Thompson et al., 2004; Thompson et al., 2009; Andrady, 2017). Primary MPs are small directly manufactured plastics (Cheung and Fok, 2017), and they include small particles added to everyday products (Napper et al., 2015; Auta et al., 2017). In 2008, at the first International Microplastics Symposium hosted by the National Oceanic and Atmospheric Administration (NOAA), MPs were defined as plastics with a diameter/size of plastics smaller than 5 mm (Arthur et al., 2008). In the past decade, most of the research attention has been focused on the marine environment (Barboza and Gimenez, 2015; Wang et al., 2022; Zhang et al., 2022a), rivers, and estuaries (Zhao et al., 2015; Gray et al., 2018; Mai et al., 2019), freshwater and drinking water (Law et al., 2014; Koelmans et al., 2019) in the distribution characteristics, transport, and fate of MPs. However, surveys have rarely been conducted at the interface between water and land (e.g., mangroves, tidal flats, and salt marshes).
Mangroves cover 0.5% of the world’s coastal areas and are one of the most common ecosystems at the land–sea interface (Alongi, 2014; Li et al., 2019). In addition, mangroves play a key role in providing food and habitat for a variety of marine and terrestrial organisms, reducing marine pollution, and protecting coastal areas from the harmful effects of natural hazards such as hurricanes and tsunamis (Kathiresan, 2003; Bayen, 2012; Kulkarni et al., 2018; Deng et al., 2021), and their complex root systems like sieves can impede water flow, thus allowing them to easily and adequately capture and retain floating material (Martin et al., 2019). The unique characteristics of mangrove ecosystems (such as high-primary productivity and abundant organic carbon) have led to the identification of mangrove ecosystems as important sinks for various pollutants from both terrestrial and marine activities (Bayen, 2012; Mohamed Nor and Obbard, 2014; Deng et al., 2021). Mangroves serve as key blue carbon ecosystems, which are located in the intertidal and sub-tidal zones where they are exposed to MP pollution (Huang et al., 2021). Previous reports have shown that blue carbon ecosystems have the potential to capture MPs from surface sediments and POCs (Furukawa et al., 1997; Kristensen et al., 2008; Huang et al., 2021). Mangroves not only clean and retain pollutants in general but also have an ecological interception effect on MPs (Liu et al., 2022). The presence of mangrove plants can modify hydrological conditions and affect the distribution and separation of MPs in different tidal areas. Specifically, MPs of different sizes, shapes, and sinking rates may have different distribution patterns in different intertidal zones of mangroves (Waldschläger and Schüttrumpf, 2019; Melkebeke et al., 2020; Duan et al., 2021). Studies on mangrove MP pollution have attracted attention. From 2015 to date, the literature studying MP pollution in mangroves has risen at a rate of 1.5–2 times per year and, today, there are more than 700 publications. However, current studies on mangrove MPs focus on abundance and spatial distribution, but there is a lack of studies on mangrove MP load and its influencing factors.
The Beibu Gulf is located in the northwestern part of the South China Sea, from the Leizhou Peninsula, Qiongzhou Strait, and Hainan Island to Vietnam, and northward to the coast of Guangxi (Zhang et al., 2018; Xue et al., 2020). The mangroves in the Beibu Gulf are the second largest mangrove area in China, accounting for more than 37% of the total mangrove area in China (Jia et al., 2015), and are the richest area of mangrove species in China (He et al., 2007; Gong et al., 2019). Nevertheless, with rapid industrialization and urbanization, considerable industrial and municipal sewage is discharged into Beibu Gulf. As a semi-enclosed bay, Beibu Gulf has a weak self-purification capability. In previous studies, organic pollutants such as antibiotics, polychlorinated biphenyls, and organophosphate esters have been found in the Beibu Gulf (Zheng et al., 2012; Zhang et al., 2014; Zhang et al., 2020d) as well as MPs (Zhu et al., 2019; Xue et al., 2020; Zhang et al., 2020a; Zhang et al., 2020b). The diverse industries located along with the coastal areas, frequent shipping activities, the marine aquaculture could constitute a significant source of MP pollution in mangroves. Conducting relevant studies can help to understand the influence of tides on mangrove MP retention and provide theoretical basis and scientific support for assessing and detecting MP pollution in mangroves in Beibu Gulf.
To bridge the knowledge gap and provide an extensive overview of the MP contamination in mangroves, this study aims (1) to investigate the abundance, characteristics, diversity, and spatial distribution characteristics of MPs in different mangrove surface sediments; (2) to investigate the distribution patterns of MPs in different intertidal zones of mangrove forests; (3) to study the influencing factors of MPs in mangroves; (4) and to estimate the load of MPs in different sampling sites from the Beibu Gulf.
2 Material and methods
2.1 Study areas and field investigation
Mangroves, located in the river basin or estuary of the northern Beibu Gulf, South China Sea, were selected as the target areas in this study. The details of sampling sites are shown in Figure 1 (21°25′–21°41′N, 108°10′–109°46′E) and Supplementary Table 1. The Lianzhou Bay (LZB) and SK are both located in Beihai city. Among which, the LZB is in the Nanliu river estuary, which is the largest river in Guangxi Province, whereas SK is the largest mangrove reserve in Guangxi Province, and there are abundant aquaculture ponds around it. The Maowei Sea (MWS) and Qinzhou Port (QZP) are both located in Qinzhou city. The MWS is close to Qinjiang river estuary and the intensive aquaculture area, whereas QZP is in the tourist areas of Qinzhou and also close to Qinzhou Port. The mangrove forest areas involved in LZB, MWS, QZP, and SK are 7.34 km2 (Li et al., 2018a), 22.87 km2 (Jia et al., 2021), 2.00 km2 (Huang, 2017), and 9.22 km2 (Jia et al., 2021), respectively (Figure 1).
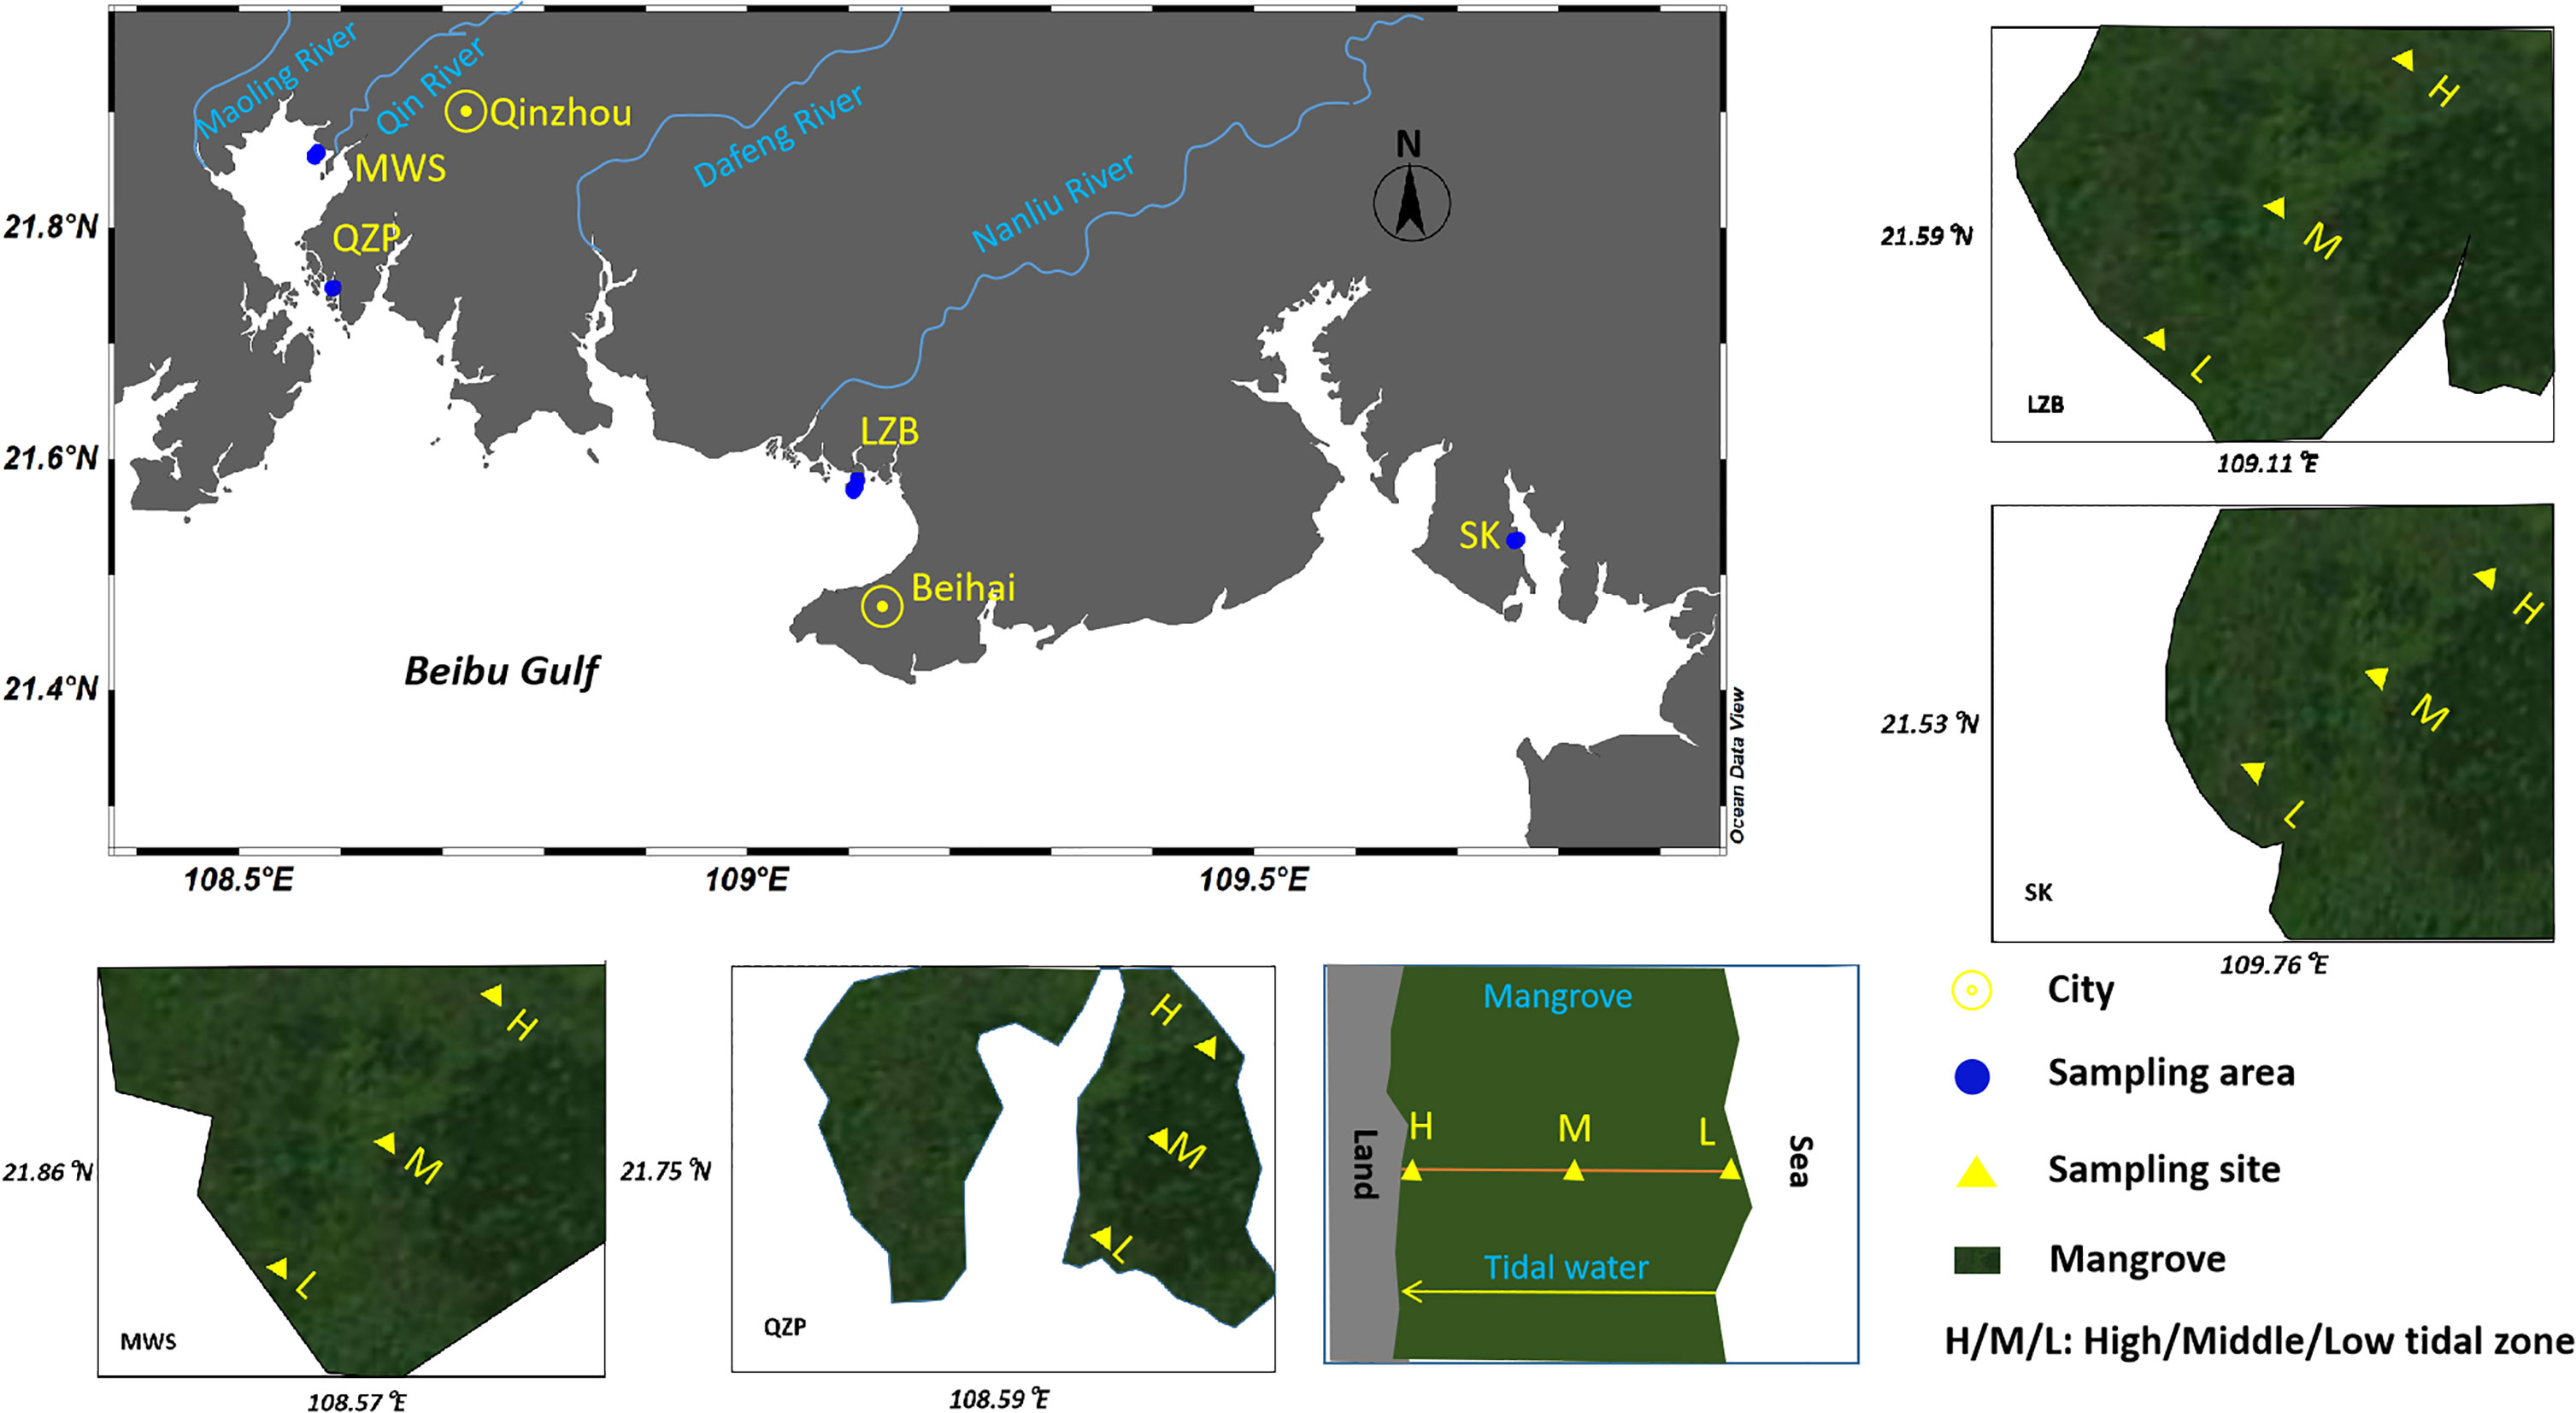
Figure 1 Map of mangrove sampling sites. (Note: the yellow triangles represents low, middle and high tidal sampling sites in each intertidal section).
In each sampling area, an intertidal section was selected along the vertical coast, and surface sediment samples were collected at the high (landward), middle (the midpoint of the line between the seaward sampling site and the landward sampling site of mangrove forests), and low tidal zones (seaward) of the mangrove forests. The separation among sampling sites in each section ranged from 33 to 763 m (distance away from the land), depending on the length of the mangrove forest, in each locality (the GPS was used to locate the middle point of each mangrove when we collected the samples). Samples from each intertidal section were collected during the lowest tidal period. In the meanwhile, to ensure that landward points were also impacted by the current tide, the entire sampling zone in each location was within the scope of high tidal line. Two separate 1.5 m × 1.5 m quadrats in each sampling site were set as replicates, with a distance of approximately 2 m between each replicate. Surface sediment (0–5 cm) was gathered with a stainless-steel grab sampler and then stored in a clean aluminum box. Finally, the entire sampling was completed in October 2020, and n =24 (12 sites × 2 replicates) surface sediment samples were obtained for further analysis.
2.2 Extraction and identification of microplastics
Extraction and identification of MPs in sediment were modified by prior methods (Masura et al., 2015), briefly: The sediment samples were first homogenized in an aluminum tray and then dried in an oven at 75°C. To avoid background contamination, the samples were covered with aluminum foil until dry. A 150-g sediment sample was taken in a 1 L of beaker, and a prepared 450 ml of sodium chloride solution (density 1.2 g/cm3) was poured into the beaker containing the sediment sample, stirred thoroughly for 5 min, and then left to stand for 15 min until the suspended solids were separated from the liquid phase. And then, the upper liquid layer was passed through a 45-µm stainless steel sieve, and the residue on the sieve was washed three times with ultra-pure water and then transferred to a 250 ml of beaker. To dissolve the natural organic matter in the water sample, 90 ml of 30% H2O2 and 90 ml of 0.05 M Ferrous Sulfate solution were added to the beaker containing the sample. The beaker was then heated to 75°C on a hot plate for 12h and cooled at room temperature (25°C) for 24h. In the next step, the samples were filtered through a 10-μm cellulose acetate filter membrane under a vacuum pump and covered with an aluminum membrane. The filter membranes were then dried in an oven at 60°C for further analysis.
The collected MPs were visually inspected under a stereomicroscope (SMZ1270, Nikon, Tokyo, Japan) with a maximum size of 40 × 40 for systematic calculation of MPs (Masura et al., 2015). The number of MPs potentially present in each photograph was calculated manually, collated the data, and then classified according to different standardized sizes, colors, and shapes (Li et al., 2021). MP abundance was calculated as items/kg dry sediment weight (items/kg d.w). MPs were classified by shape (fiber, fragment, and film), color (black, multicolored, blue, yellow, red, transparent, pink, green, and purple), and size (length: 45–100, 100–330, 330–500, 500–1,000, 1,000–2,000, 2,000–5,000 μm). The width of each size class was used as a standard. A micro-Fourier transform infrared spectrometer (Frontier, PerkinElmer, Waltham, MA, USA) was used to identify suspicious MPs. Suspicious MPs identified by visual inspection were randomly selected and verified and were the most common type. These spectra were compared to the spectrogram on the instrument with a database for validation. Matched spectra with a match rate higher than 70% were accepted (Gao et al., 2021).
2.3 Measurement of particulate organic carbon
The sediment was dried in an oven at 60°C for 12h, and the dried sediment was weighed for its volume to measure the density of its dried sediment. The dried sediment was burned in a muffle furnace at 500°C for 4h, and the loss of ignition has been determined (Huang et al., 2021).
2.4 Enrichment index and diversity index of microplastics
The enrichment index (EI) is the ratio of MP abundance at high tide to middle or low tides. EI was calculated using Equation (1) (Huang et al., 2021). EI > 1 indicates that MPs were enriched in high tide, and EI < 1 indicates that MPs were enriched in middle or low tides.
where EIm is the EI at middle tide, EIl is the EI at low tide, Ah is the MP abundance at high tide, Am is the MP abundance at middle tide, and Al stands for the MP abundance at low tide.
To estimate the complexity of MP types and sources across intertidal zones in mangrove sediments, the diversity index D’(MPs) was calculated based on Equation (2) (Jost, 2006; Wang et al., 2019; Huang et al., 2020; Huang et al., 2021). In conclusion, D’(MPs), that is, size D’(MPs), color D’(MPs), and shape D’(MPs), were calculated based on shape, color, and size features, respectively.
where x is the number of MP categories, N is the total number of MPs in a sample, and Ny represents the number of MPs classified as the yth type.
2.5 Quantifying the total number of microplastics and inventory of particulate organic carbon in the mangrove sediment
A mathematical-statistical analysis of MP abundance and POC from four sampling sites was conducted to quantify the total amount of MPs and POC in the Beibu Gulf using Equations (3) and (4).
where Ni,j (items) is the liability of MPs in mangrove sediment i at the study tidal zone j, POCi,j (kg) is the inventory of POC in mangrove sediment i at the tidal zone j, Ai,j (items/kg) is the mean MP abundance in mangrove sediment i at the tidal zone j, Pi,j (kg/km3) is the average POC in mangrove sediment i at the tidal zone j, Si (km2) is the area of mangrove i, ρi,j (kg/km3) is the density of mangrove sediment i at the tidal zone j, and D (km) is the sampling depth.
2.6 Tidal hydrodynamic data determination
Previous studies showed that the periodic rise and fall of seawater and the tidal range in this study area were very similar from month to month (Zhang, 2009; Zhang et al., 2010; Yang et al., 2018; Zhang et al., 2020c). To further analyze the influence of tidal variation on the distribution of MPs, the tidal current velocity and tidal range during the flood and ebb tides within 1 month were continuously monitored three times (during the high, middle, and low tide periods, 24h each time). All the measuring points were situated in the seaward waters close to the objective mangrove forest. The interval from the first and third monitoring was 15 days.
Three single-point current meters (Aanderaa DCS blue 5430) were used to measure current velocities. While monitoring the tidal velocity, the ping number was set as 300 and the sound speed was 1.52 × 10³ m/s. The tidal range was obtained from the National Marine Data Center (http://mds.nmdis.org.cn/pages/tidalCurrent.html).
2.7 Statistical analysis
Station maps were created using Google Earth and Ocean Data View, and mangrove areas were measured at four sites (LZB, MWS, QZP, and SK). Data were analyzed using the software Excel 2019 and plotted using Origin 2022, including MP characteristics (abundance, shape, color, size, and diversity) of mangrove sediments. MP abundance and inventory were analyzed using a one-way variance (ANOVA) analysis with SPSS28. MP size, color, shape, and diversity were analyzed using two-way ANOVA (station location and tidal area for two factors). The values were considered statistically significant when p < 0.05 and p < 0.01 indicated high significance.
2.8 Quality assurance and quality criteria
Samples were collected based on the latest quality assurance and quality control standards with stringent control measures in place (Koelmans et al., 2019; Adomat and Grischek, 2020). First, to avoid potential contamination, non-plastic laboratory tools were used throughout the sample collection, extraction, and identification process as far as possible. All solutions, including ferrous sulfate and distilled water, were filtered through a 0.45-μm cellulose acetate filter membrane before use. In all experiments, three blank controls were used for each medium. The filtered distilled water was used as a blank in the laboratory and processed according to the same procedure used for the samples (Zhu et al., 2021). The average blank MP sample contained an abundance of 26.67 items/kg, and the final corresponding MP data were calibrated against the corresponding blanks.
3 Results
3.1 Microplastic pattern in different tidal zones in the mangrove sediment
Variation in the MP abundance in mangrove forests was shown (Figure 2). MPs were widely detected in all sediment samples collected from 12 sites, with significant spatial variation in both sampling areas and tidal zones (p < 0.05). A total of 303 MPs were identified in the mangroves. In addition, the abundance of MPs was highly variable, ranging from 26.67 to 239.94 items/kg of dry sediment, with the lowest abundance in QZP–L (26.67 ± 9.43 items/kg) and the highest in SK–H (239.94 ± 37.80 items/kg), accounting for 2.51% and 22.57% of the total abundance, respectively. In addition, except for this area of LZB, the variation in the mean abundance of MPs in mangrove areas of MWS, QZP, and SK varied: low tidal zone < middle tidal zone < high tidal zone, for example, the mean MP abundance in SK at the low, middle, and high tidal zones was 83.33 ± 23.57 items/kg, 116.66 ± 108.43 items/kg, and 239.94 ± 37.80 items/kg, respectively. Significant increases in the MP abundance of 2.06-fold and 2.88-fold were observed in the high tidal zone compared to the middle and low tidal zones, respectively.

Figure 2 Variation in microplastic (MP) abundance in the studied mangrove forests.
3.2 Microplastic characteristics, diversity, and enrichment in different tidal zones in the mangrove sediment
There was little size difference between the sampling areas and tidal zones (p > 0.05) (Figure 3A), where 100–330 µm was the most abundant size category (mean percentage 29.37% ± 6.96%), followed by 500–1000 µm (24.57% ± 10.61%). While 2000–5000 µm (7.07% ± 2.28%) had little contribution from MPs. One hundred to 330 µm was the most abundant size category at the high and middle tidal zones in this study; however, 500–1000 µm was the most abundant size category at the low tidal zone.
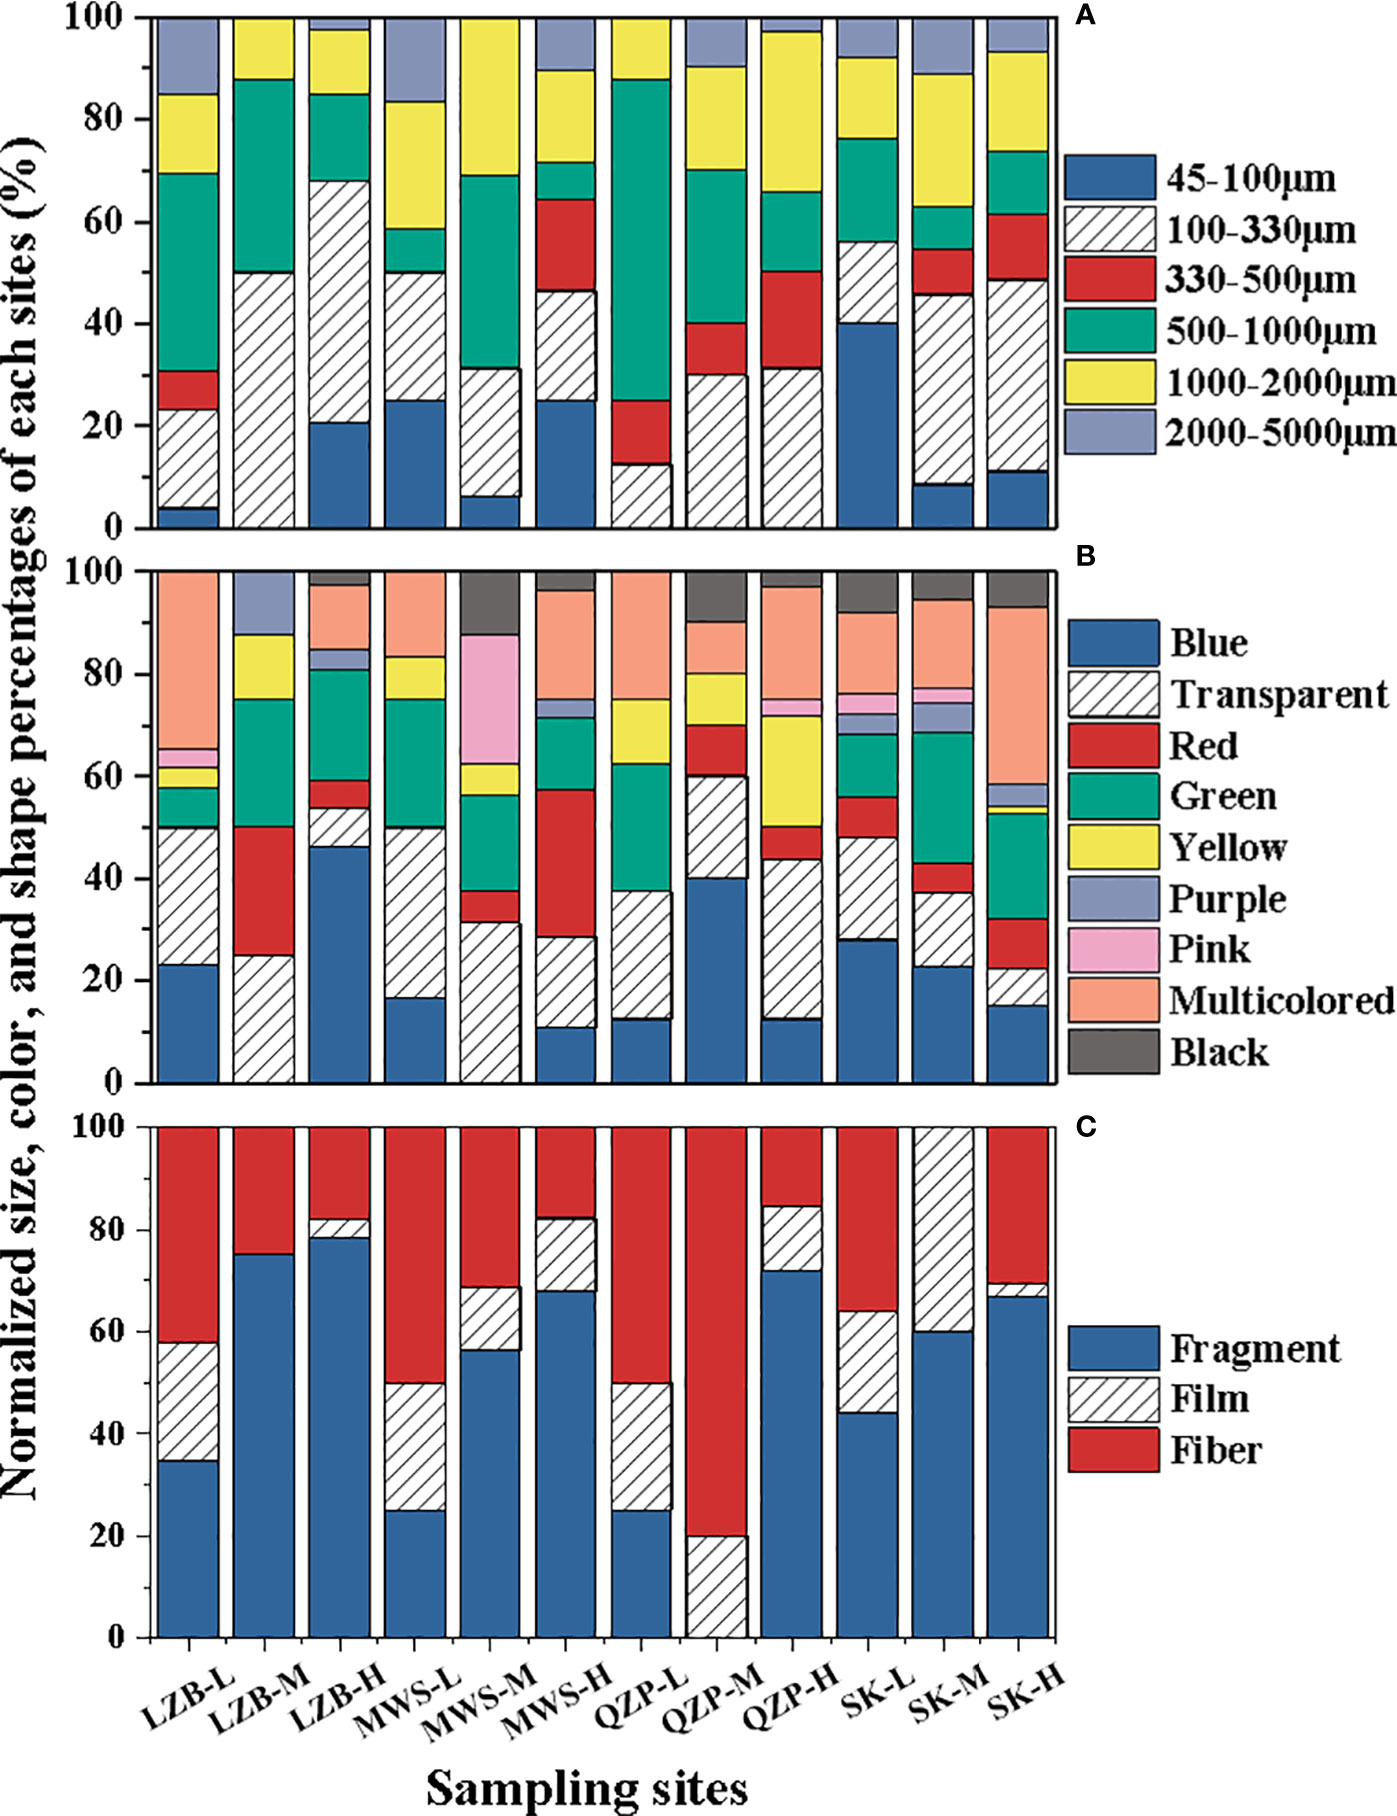
Figure 3 Characteristic percentage variation of microplastics (MPs) in mangrove forests (A) size, (B) color, and (C) shape.
MP color did not show significant differences between the different sampling areas and tidal zones (p > 0.05) (Figure 3B). Among all MPs that we studied, the most dominant color was transparent (21.63 ± 6.16%), followed by blue (18.98 ± 6.60%), multicolored (17.52 ± 4.25%), and green (16.34 ± 5.37%). All other colors were below 10%.
Generally, there were no significant differences in the detected MP shapes (fragment, film, and fiber) from various mangroves forests (p > 0.05) (Figure 3C), among which fragments were the most common shape, accounting for an average of 50.37 ± 13.16% of all samples, followed by fibers (33.05% ± 11.25%) and films (16.58% ± 5.29%), respectively. In most sampling areas, fragments were the dominant part, for example, 62.61% ± 24.29% in LZB, 49.70% ± 22.17% in MWS, 56.89% ± 11.65% in SK, except that fibers were dominant in QZP (48.54% ± 32.21%).
The typical MPs trapped in surface sediments of mangrove forests under micro-Fourier Transform infrared spectroscopy (FTIR) were shown in Figure 4. Four main polymer types were found in selected samples of multicolored fragments: (a) red fragment, (b) blue fragment, (c) blue film, and (d) blue fiber; the main types included polyethylene (a), polypropylene (b), polyethylene (c), and cellulose (d).
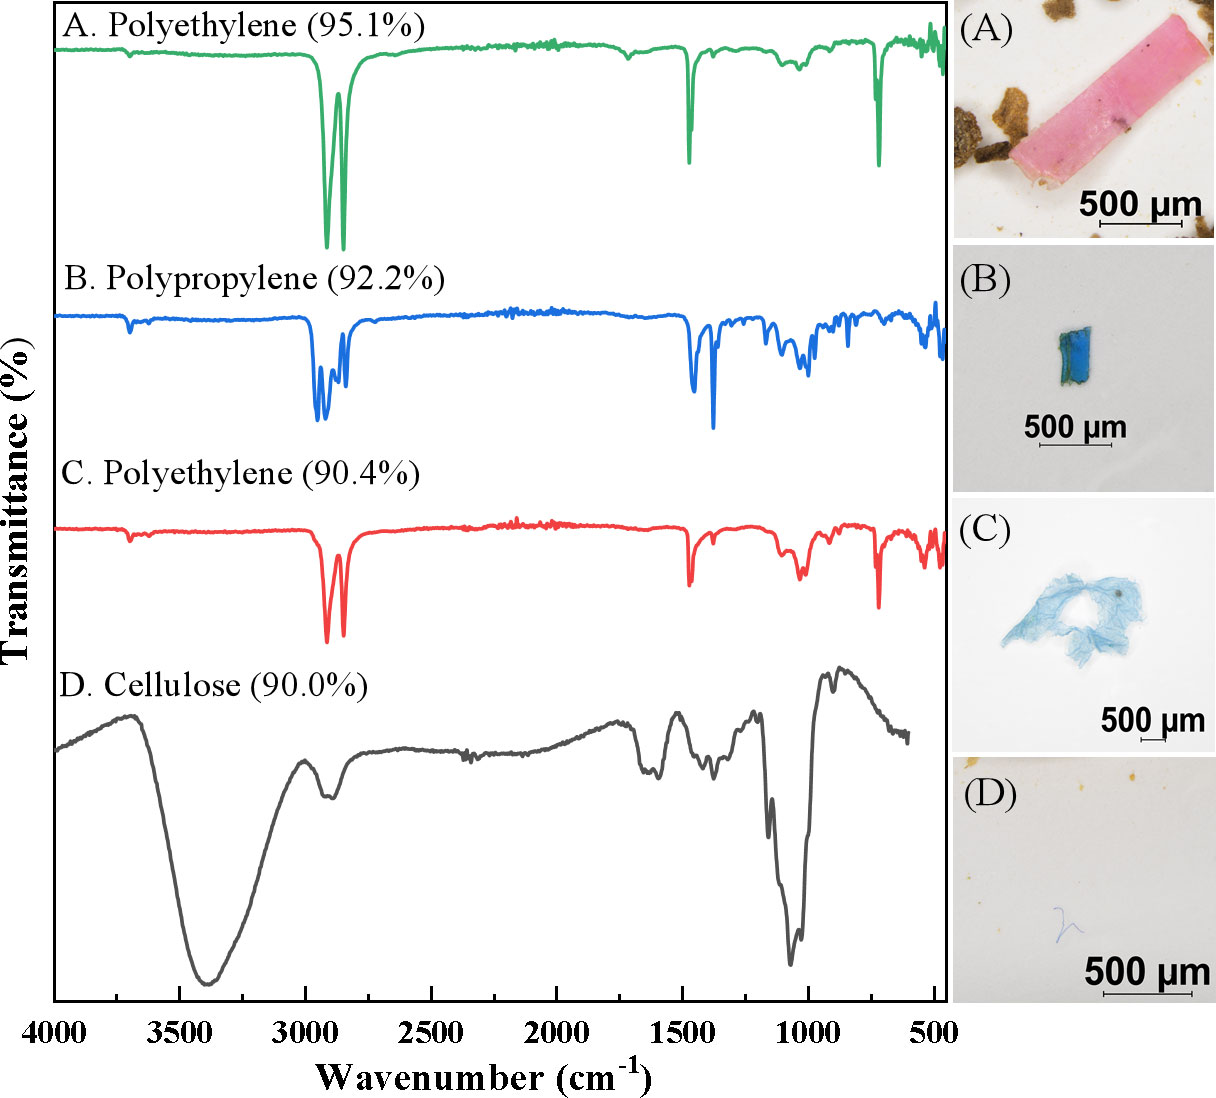
Figure 4 Typical microplastics (MPs) trapped in surface sediments of mangrove forests. (A) red fragment, (B) blue fragment, (C) blue film, and (D) blue fiber.
Diversity of the MP size index, that is, size D′ (MPs), showed no significant differences (p > 0.05) among the sampling areas (Table 1), with the size D’ (MPs) value of 0.67 ± 0.08 in LZB, 0.68 ± 0.07 in MWS, and 0.71 ± 0.06 in SK, except the size D′ (MPs) value in QZP (0.61 ± 0.10) was significantly lower than that in SK. Diversity of MP color indices, that is, color D′ (MPs), also did not show significant differences in all four sampling zones (p > 0.05), with color D′ (MPs) values of 0.73 ± 0.04 in LZB, 0.64 ± 0.05 in MWS, and 0.70 ± 0.00 in QZP, except that color D′ (MPs) values in SK (0.76 ± 0.02) were significantly higher than in MWS. Diversity of the MP shape index, that is, shape D′ (MPs), did not show significant differences among the various sampling areas (p > 0.05), with the shape D′ (MPs) value of 0.45 ± 0.15 in LZB, 0.43 ± 0.09 in MWS, and 0.45 ± 0.01 in SK, except that the shape D′ (MPs) value in LZB was significantly higher than that in QZP (0.35 ± 0.13).
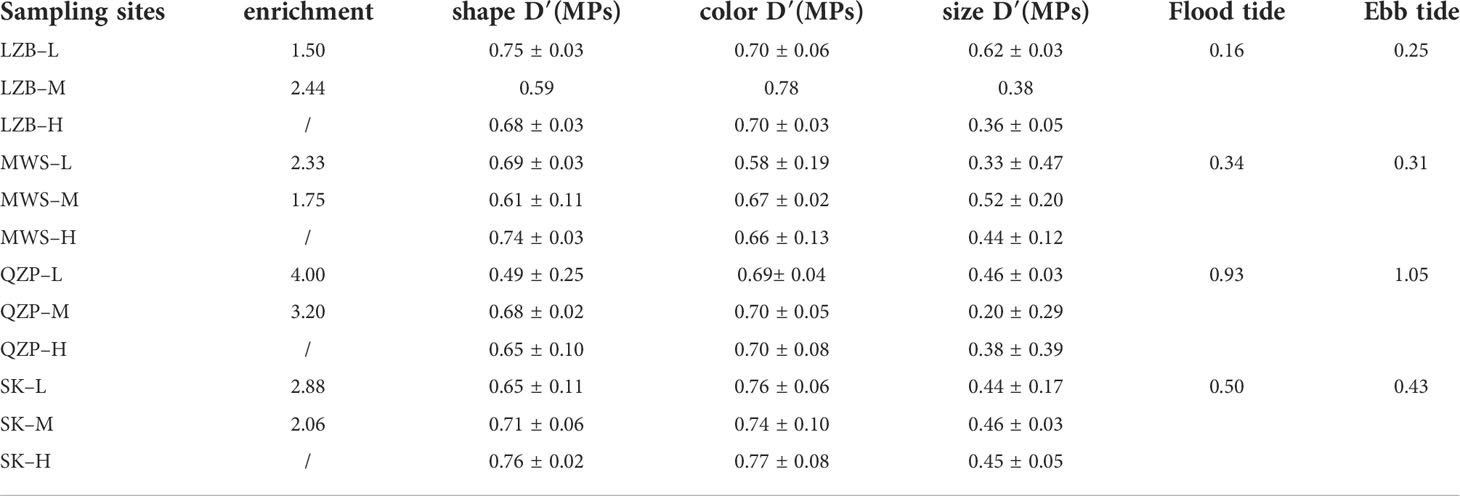
Table 1 Microplastic (MP) shape, color, size diversity indices (M ± SD) in studied mangrove forests (M ± SD) and the current velocity at the flood and ebb tides (cm/s).
For all studied mangrove forests, their EIs were greater than 1 and their enrichment indices range from 1.50 to 4.00. Except for LZB, the enrichment indices of QZP, MZS, and SK were lower at the middle tidal zone than at the low tidal zone. For example, the EIs of QZP–L, and QZP–M were 4.00 and 3.20, respectively.
3.3 Microplastic total number in different tidal zone in the mangrove sediment
Based on Equation (3), the MP total number and their average values at different tidal zones for the studied mangrove sediments were estimated. Results showed that MP total number was significantly different among studied mangroves and tidal zones (p < 0.05). Among all sampling areas, the mean MP total number in MWS was the largest (40.44%), while QZP was the smallest (3.19%) (Figure 5). Similar to MP abundance, the MP total number for most studied mangrove forests, except LZB, increased gradually from the low tidal zone to the high tidal zone. In addition, in terms of the ratio of the MP total number to its mean, the values were closest to 1 at the low tidal zone in the LZB and middle tidal zones in the MWS, QZP, and SK, with values of 0.99, 0.92, 0.61, and 0.81, respectively.
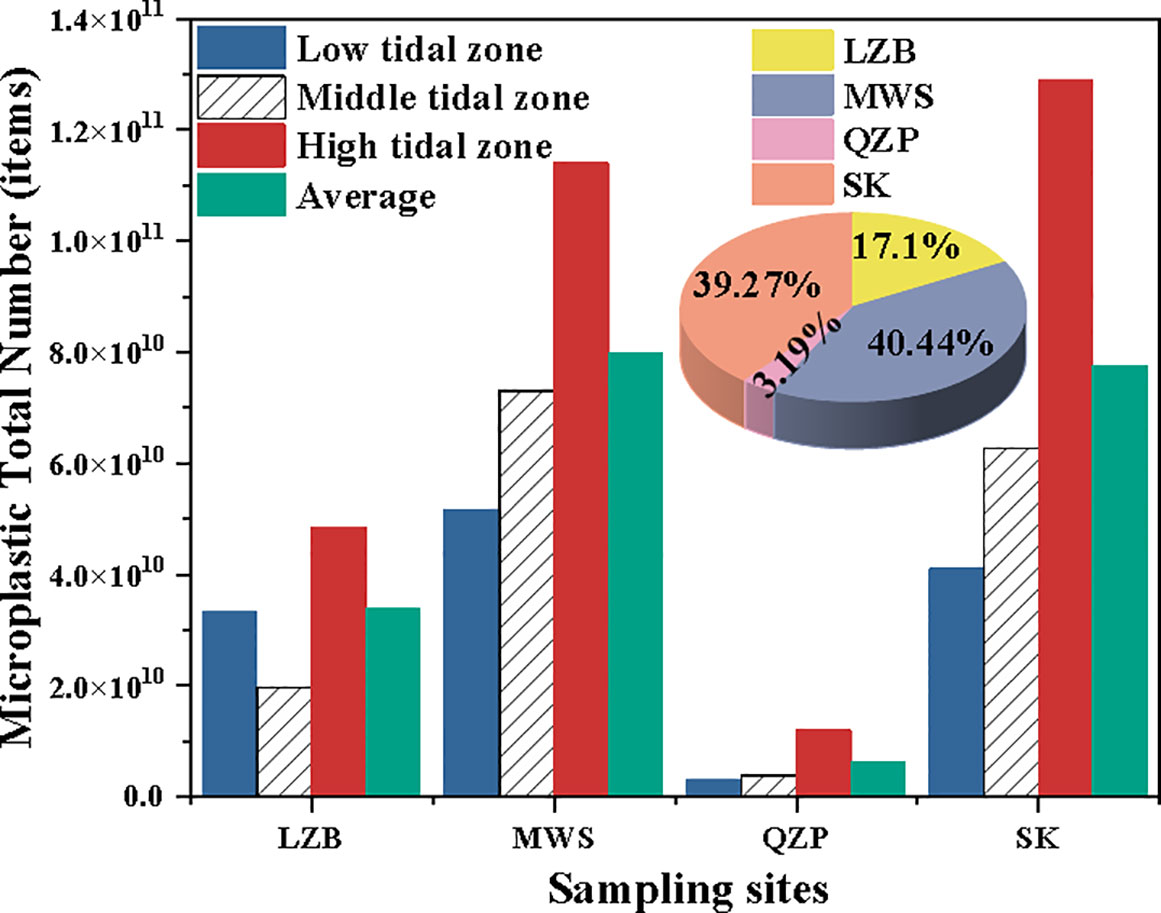
Figure 5 The microplastic (MP) total number and their percentages for different mangrove forests at different tidal zones.
4 Discussion
4.1 Abiotic factors influencing the microplastic accumulation in Beibu Gulf
4.1.1 Tidal influence
MPs were detected in surface sediments from the same mangrove forest, and their levels varied greatly at different tidal zones. Zhang et al. (2022a) reported that some of the plastic litters may have migrated from low and mid-tide areas to high tide areas with tidal changes. In the present study, the MP content was the highest at the high tidal zone in all sampling areas, with EI values of 1.50 to 4.00. Moreover, the MP abundance in mangroves generally tended to decrease from the high tidal zone to the low tidal zone, which also indicated the interception of MPs by mangroves. To study the influence of tidal velocity on the distribution of MPs in different tidal zones of mangroves, the average flood and ebb tidal current velocity of the seaward waters close to the objective mangrove forest was monitored, and the results were listed in Table 1. Based on the obtained data, we conducted a linear fitting for the MP EI values and the tidal velocity (Figure 6). The results showed that the MP EI values at both middle and low tidal zones showed a significant positive correlation trend with the flood and ebb tide velocity, indicating tide velocity was one main factor that influenced the variation of MP total number in different tidal zones. The reason could be that the high and low tidal zones could disturb the sediments at the bottom of mangrove forests and release MPs into seawater (Liu et al., 2022); however, since the sea level was higher at the high tidal zone, the transport distance of MPs in mangroves increased. Consequently, the turbulence disappeared or weakened and the water velocity slowed down, so the hydrodynamics was poor, which easily led to the accumulation of MPs. Nevertheless, at the low tidal zone, the continuous high-velocity water flow hindered the deposition of MPs and plankton due to the lower sea level and the weaker barrier force of the river (Nguyen and Luong, 2019), and the suspended particulate matter sank easily as the turbulence dissipated or decreased (Furukawa and Wolanski, 1996). However, it was worth noting that although the MP total number of LZB was highest at the high tidal zone, the MP total number at the low tidal zone was more than that at the middle tidal zone, so the EI index of LZB-L was larger. In addition, the large EI index but the small tidal velocity of LZB indicated that the variation of MP total number in mangroves was influenced not only by tides but also by other influencing factors.
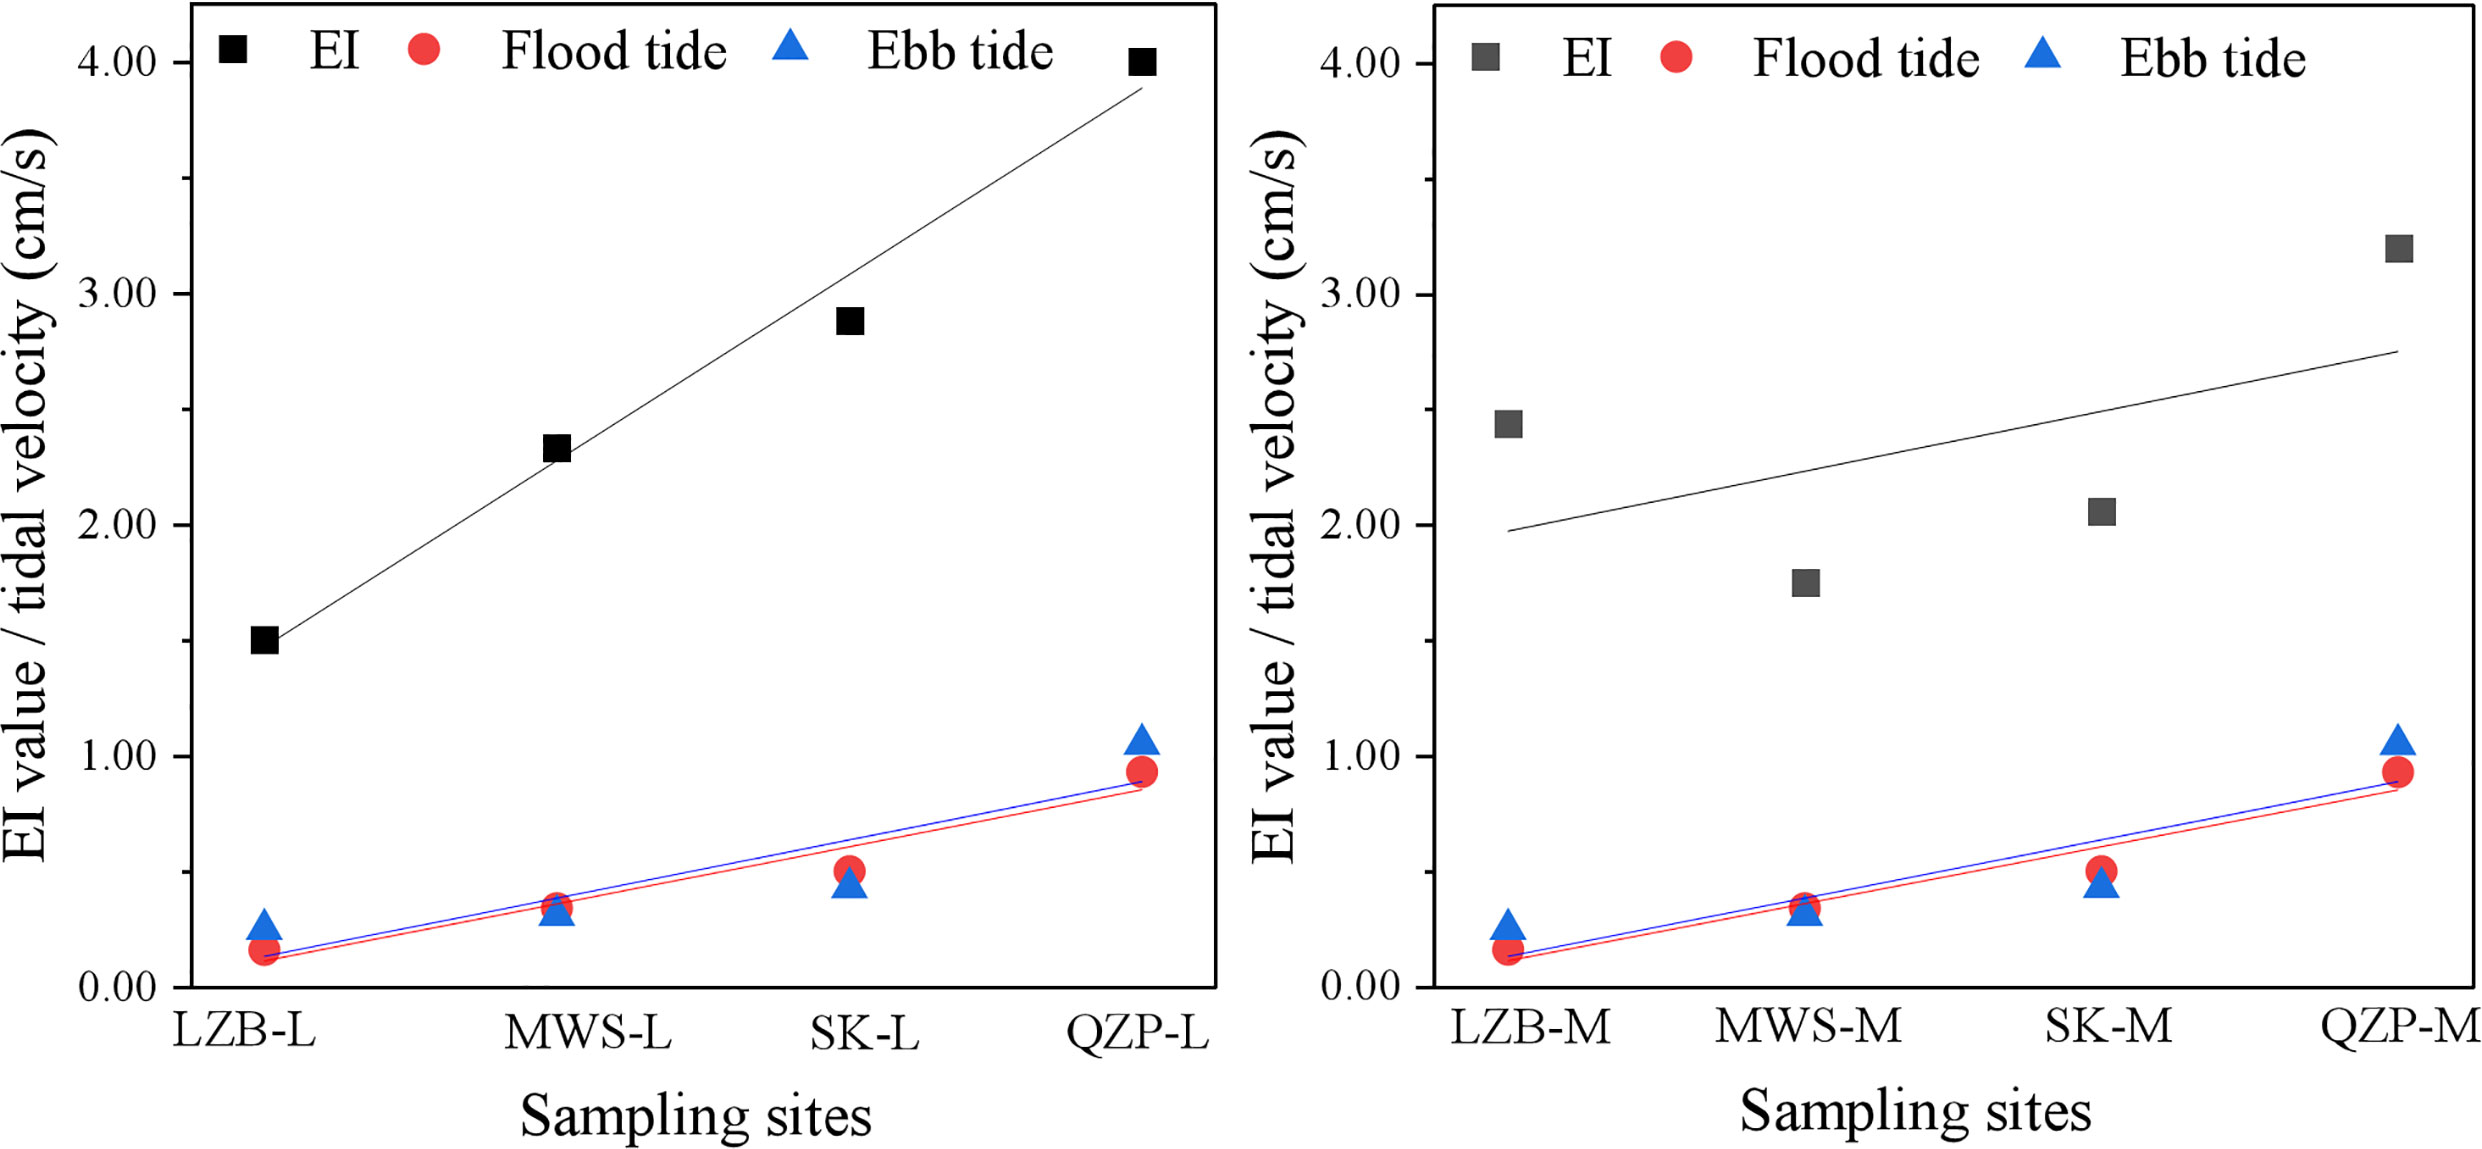
Figure 6 The conducted linear fitting for the microplastic (MP) enrichment index (EI) values and the tidal velocity.
4.1.2 Dominant factors affecting microplastic abundance at each sampling area
Geographically, MP abundance varied among sampling areas. It was found that human activities in the surrounding environment, such as agricultural activities, aquaculture, tourism activities, and residential life, affect MP abundance (Hinojosa and Thiel, 2009; Li et al., 2018a; Martin et al., 2019; Huang et al., 2020). The sampling area of LZB was located at the estuary of Nanliu River, which was the largest river in Guangxi with an annual average runoff of 68.9 × 109 cm3. And the LZB mangroves were also surrounded by residential and agricultural areas. Li et al. (2020) found that the colored MPs may come from packaging and clothing from the surrounding residential areas. Finally, with the effects of rainfall, river inputs as well as tides transportation, the multicolored MPs were inevitably deposited in mangroves, which could be the main explanation for more multicolored MPs found in LZB. The surrounding marine area of MWS had intensive aquaculture activities, especially for oysters, the open culture area of which was about 135 km2 (Zhang et al., 2021). Therefore, MP pollution in this area was associated with plastic films used in aquaculture barrels and nylon rope, as well as fishing processes. Moreover, there was Maowei River (with an annual average runoff of 15.9 × 109 cm3) draining into the bay, which could also be one main source of MPs detected in the MWS. While for the sampling areas of QZP, which was located around a small park, the MPs may be mainly from plastics left by tourists. According to previous reports, packaging products that were discarded in the environment were physically, chemically, and biodegraded, resulting in large amounts of debris (Zhang et al., 2020c). In the meanwhile, as described in part 3.1, the detected amount of MPs in QZP was the smallest among all sampling areas, which was also because the parking area was relatively less affected by anthropogenic and industrial activities. However, the MP abundance in SK, especially in the high tidal zone, was the largest among the four sites. Since Hepu County accounted for two-thirds of the entire population of Beihai City, the high population density was one of the sources of MPs in the SK area located in Hepu County. The mangrove area in SK was surrounded by abundant aquaculture ponds and was also a tourist area, so the MP load in SK was the largest among all samples. Overall, river input and human activities (including aquaculture and fisheries) are important factors influencing the distribution of MPs in mangrove sediments.
4.2 Characteristics and diversity of microplastics in mangrove forests
4.2.1 Shape
MP shape is a significant feature for tracking plastic sources and bio-intake (Huang et al., 2021). The highest proportions of fragments and fibers were observed at the high and low tidal zones in mangroves of LZB, MWS, and QZP, respectively, which could be attributed to the accumulation of MP fragments at the high tidal zone due to fishing gear left behind by activities such as fishing (Li and Liu., 2018b), fibers at the low tidal zone due to river intake (industrial or domestic wastewater). In the present study, the fragment was the predominant shape among the three tidal zones in SK, with SK having the highest mean MP abundance among all studied mangrove forests, suggesting that the high abundance of MPs in SK may increase the occurrence of all shapes except fibers and decrease the relative proportion of fibers themselves (Huang et al., 2021). The reason for the high percentage of fragments was that deviations from perfect sphericity resulted in the greater surface area and thus greater pressure and friction (Kowalski et al., 2016). MPs with many regular shapes settled easier than the irregularly shaped MPs in sediments, because they had less settling resistance (Kowalski et al., 2016; Jiao et al., 2022). According to previous studies, fibers and fragments of MPs may affect the uptake of biota, which could cause intestinal obstruction and may hinder intestinal digestion (Wright et al., 2013; Shim and Thompson, 2015; Wu et al., 2019).
4.2.2 Color
MP color can reflect the source of MPs. In the present study, the MP colors in MWS and QZP were predominantly transparent, while blue in LZB and multicolored in SK. In the former case, it was possible that some commercial fish and their larvae were visual predators that preyed on small plankton and may feed on more prey-like colored MPs, thus transparent MPs may increase and accumulate more in mangrove sediments (Maghsodian et al., 2022). In the latter case, multicolored MPs may originate from the packaging of various fishing gears during fishermen’s fishing activities (Maghshidan et al., 2020). Blue MPs were derived from the paint color of fishing boats (Aliabad et al., 2019), and nets and ropes were often blue.
4.2.3 Size
In this study, the size of MPs collected from mangrove sediments ranged from 45 to 1,000 µm. The majority of MPs in mangrove sediments were < 1,000 µm in size (73.24%), which was consistent with studies from other mangrove regions, such as China and Singapore (Mohamed Nor and Obbard, 2014; Li et al., 2018a; Zuo et al., 2020). Overall, the MP size found in this study was dominated by 100–330 µm (28.41% ± 13.99%). Smaller-sized MPs had a higher surface-to-volume ratio than larger-sized MPs, which increased their adhesion (Huang et al., 2021), and smaller MPs were more difficult to remove by water flow (Yan et al., 2019). Tides were an important factor affecting the transport of suspended particulate matter in mangroves, with the most pronounced effect of light particulate matter (Zhang et al., 2020a). The MPs found in this study were mainly 100–330 µm in size at high and middle tides and 500–1000 µm at the low tidal zone, which may be since that light suspended particulate matter increased with tides and the continuous high-velocity current at low tide in mangroves hindered the settlement of MPs, thus more MPs of smaller size could be found at high tide and a relatively larger size at low tide sedimentation. However, smaller size MPs were easily absorbed by mangrove organisms (Lusher et al., 2013; Bour et al., 2018; Zhou et al., 2018), which may adversely affect mangrove wetland organisms (Zuo et al., 2020; Huang et al., 2021).
4.2.4 Diversity
Wang et al. (2019) proposed an MP diversity index (D’ [MPs]) to reflect the complexity of MP sources. There was no significant difference between the mean shape D′ (MPs), color D′ (MPs), and size D′ (MPs) for the four sites (p > 0.05), indicating that the number of pollution sources may be similar in the study area. The MP diversity in terms of size, color, and shape was different at the low, mid, and high tidal zones. As the results showed, the shape D′ (MPs) of mangroves was high at the low tidal zone, the color D′ (MPs) was high at the middle tidal zone, and the size D′ (MPs) was high at the high tidal zone. Tides affected the distribution of MPs within mangroves, and flow velocity affected the degree of flocculation between MPs and viscous suspensions (Zhang et al., 2020a), thus affecting the settlement of MPs at different tidal zones (Li et al., 2018a). Overall, the number of pollution sources in the study area, and tides may also contribute to the diversity differences.
4.3 Interactions between particulate organic carbon and microplastic total number
MP total number and POC were calculated according to Equations (3) and (4), respectively. As is shown in Figure 7, MP total number is strongly correlated with POC (n = 12, R = 0.664, p < 0.05). A similar direct link between POC and MPs was reported by Huang et al., 2022, and the transport processes of MPs in the woods may also be trapped in the external blue carbon in the sediment (Huang et al., 2021). However, special attention was paid to the SK-H site. According to Figure 1, it was clear that SK-H had the largest MP abundance. According to the analysis in Discussion 4.1.2, there were many farming ponds around the mountain pass, which was also a tourist area, and it was highly influenced by human activities, and MPs tended to accumulate at the high tidal zone under tidal action, resulting in the highest MP abundance in SK-H. Therefore the relationship between this site and POC was difficult to reflect on. So far, the mechanisms of MP accumulation in blue carbon storage are unclear and need further exploration.
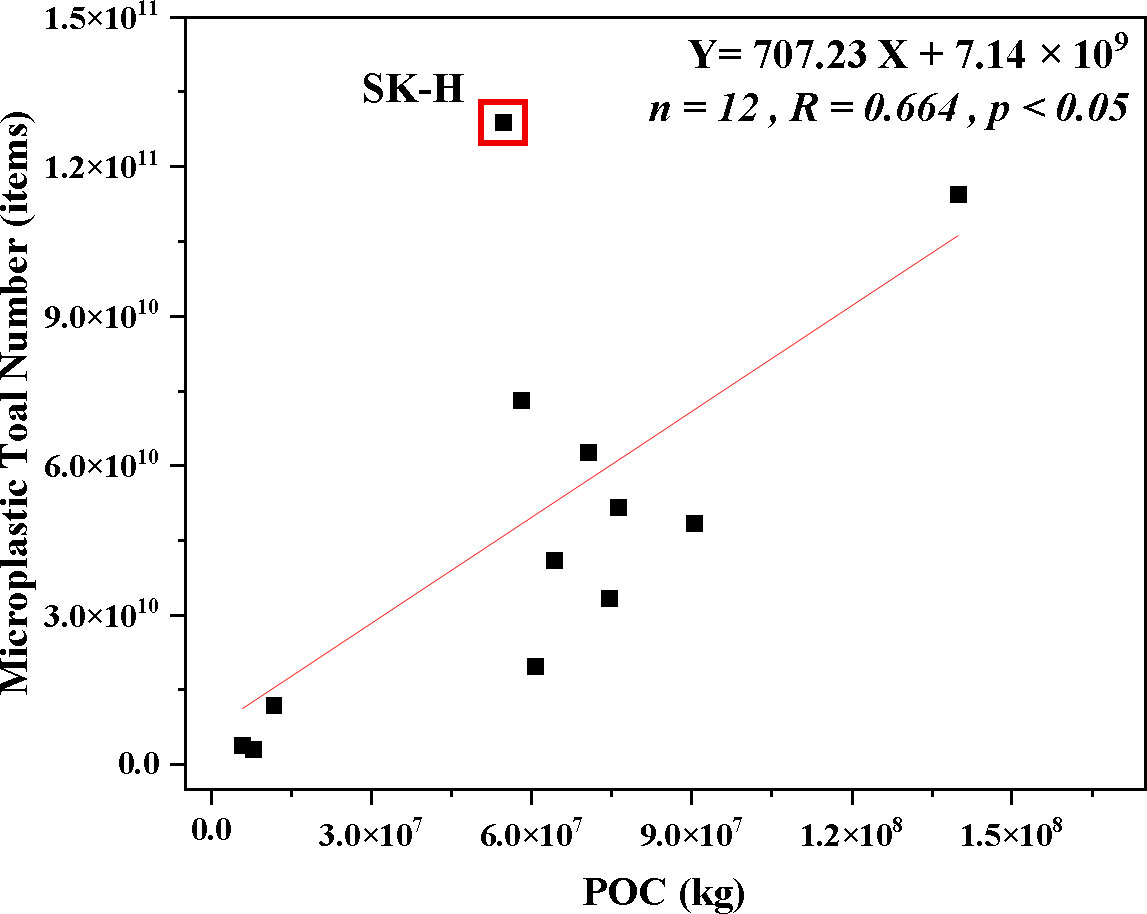
Figure 7 The linear regression relationship between total particulate organic carbon (POC) and microplastic (MP) total number in mangrove sediments.
4.4 Monitoring and assessment of microplastic total number in mangrove forests
The analysis resulted in a significant correlation between MP total number and MP abundance (R = 0.674, p < 0.05), suggesting that MP abundance can quantify MP total number to some extent. Zhang et al., 2020 demonstrated that the blockage of MPs depended mainly on hydrodynamic factors (tidal difference, flow velocity, etc.). It was shown that the MP total number at the middle tidal zones in MWS, QZP, and SK were closest to their mean values. Therefore, the middle tidal zone was considered to be more accurate for detecting MP accumulation in the whole mangrove, which may also be a significant indicator for assessing MP pollution in regional mangroves. However, the MP total number at the low tidal zone was closest to the mean value in LZB, which may be due to the poor stability of the mangrove ecosystem in the area and its vulnerability to environmental changes and increasing habitat fragmentation from year to year (Yang et al., 2017; Liao et al., 2020). In conclusion, the pre-requisite for detecting MPs at the middle tidal zone in mangroves was to examine whether the mangroves at the station were highly affected by the environment. Further studies are still needed to assess MP contamination in mangroves within a geographic area to accurately quantify MP deposition.
5 Conclusions
Mangroves have an interception effect on MPs, and the factors affecting MP distribution in mangrove sediments include not only tidal action but also human activities. The results showed that the MP abundance and MP total number of mangroves in Beibu Gulf varied greatly in different tidal areas and sampling sites, and their influencing factors were different in different locations. MP abundance in all sampling areas was highest at the high tidal zone. Smaller size MPs were enriched at the high and middle tidal zones due to the hydrodynamic effects on MP suspension and deposition. In addition, there was a strong correlation between POC and MP abundance (n = 12, R = 0.664, p < 0.05). When high environmental effects were excluded, MP abundance at the middle tidal zone was applicable to assess MP contamination levels throughout the region. The findings of this work may help us to improve our understanding of the effect of POC on mangrove MP total number and improve the accuracy of models for estimating MP pollution levels in a given area. However, the factors affecting MP contamination in mangrove sediments are complex, and which factors are primary and which are secondary require further investigation and research.
Data availability statement
The original contributions presented in the study are included in the article/supplementary material. Further inquiries can be directed to the corresponding author.
Author contributions
Conceptualization: PZ; Methodology: LZ and PZ; Software: LZ, SW, and QJ; Validation: YL and HL; Formal analysis: SW and QJ; Writing—original draft preparation: LZ, SW, and QJ; Writing—review and editing: LZ, and PZ; Visualization: YL, and HL; Supervision: LZ, and PZ; Project management: PZ and JZ; Funding acquisition: LZ and PZ. All listed authors made substantial, direct, and intellectual contributions to the work and are approved for publication.
Funding
Present work was supported by the Guangxi Key Research and Development Program (GuiKeAB22035065), Research and Development Projects in Key Areas of Guangdong Province (2020B1111020004), Guangdong Ocean University Fund Project (R18021); Science and Technology Special Project of Zhanjiang City (2019B01081); Guangxi Natural Science Foundation (2022GXNSFBA035575); First-class Special Fund (231419018); Innovation Strong School Project (230420007) of Guangdong Ocean University, and National College Student Innovation and Entrepreneurship Plan (S202110566063).
Acknowledgments
Special thanks to reviewers for their careful review and constructive suggestions. Thanks to all members of the research team and others involved in this study.
Conflict of interest
The authors declare that the research was conducted in the absence of any commercial or financial relationships that could be construed as a potential conflict of interest.
Publisher’s note
All claims expressed in this article are solely those of the authors and do not necessarily represent those of their affiliated organizations, or those of the publisher, the editors and the reviewers. Any product that may be evaluated in this article, or claim that may be made by its manufacturer, is not guaranteed or endorsed by the publisher.
Supplementary material
The Supplementary Material for this article can be found online at: https://www.frontiersin.org/articles/10.3389/fmars.2022.927884/full#supplementary-material
References
Adomat Y., Grischek T. (2020). Sampling and processing methods of microplastics in river sediments–A review. Sci. Total Environ. 758, 143691. doi: 10.1016/j.scitotenv.2020.143691
Aliabad M. K., Nassiri M., Kor K. (2019). Microplastics in the surface seawaters of Chabahar Bay, Gulf of Oman (Makran coasts). Mar. Pollut. Bull. 143, 125–133. doi: 10.1016/j.marpolbul.2019.04.037
Alongi D. M. (2014). Carbon cycling and storage in mangrove forests. Ann. Rev. Mar. Sci. 6, 195–219. doi: 10.1146/annurev-marine-010213-135020
Andrady A. L. (2017). The plastic in microplastics: A review. Mar. Pollut. Bull. 119, 12–22. doi: 10.1016/j.marpolbul.2017.01.082
Arthur C., Baker J., Bamford H. (2008). Proceedings of the international research workshop on the occurrence, effects and fate of microplastic marine debris. NOAA technical memorandum NOS–OR&R–30 (WA, USA: University of Washington Tacoma).
Auta H. S., Emenike C., Fauziah S. (2017). Distribution and importance of microplastics in the marine environment: A review of the sources, fate, effects, and potential solutions. Environ. Int. 102, 165–176. doi: 10.1016/j.envint.2017.02.013
Barboza L. G. A., Gimenez B. C. G. (2015). Microplastics in the marine environment: Current trends and future perspectives. Mar. Pollut. Bull. 97, 5–12. doi: 10.1016/j.marpolbul.2015.06.008
Barnes D. K., Galgani F., Thompson R. C., Barlaz M. (2009). Accumulation and fragmentation of plastic debris in global environments. Phil. Trans. Biol. Sci. 364, 1985–1998. doi: 10.1098/rstb.2008.0205
Bayen S. (2012). Occurrence, bio–availability and toxic effects of trace metals and organic contaminants in mangrove ecosystems: A review. Environ. Int. 48, 84–101. doi: 10.1016/j.envint.2012.07.008
Bour A., Haarr A., Keiter S., Hylland K. (2018). Environmentally relevant microplastic exposure affects sediment–dwelling bivalves. Environ. Pollut. 236, 652–660. doi: 10.1016/j.envpol.2018.02.006
Cheung P. K., Fok L. (2017). Characterisation of plastic microbeads in facial scrubs and their estimated emissions in Mainland China. Water Res. 122, 53–61. doi: 10.1016/j.watres.2017.05.053
Deng H., He J. X., Feng D., Zhao Y. Y., Sun W., Yu H. M., et al. (2021). Microplastics pollution in mangrove ecosystems: A critical review of current knowledge and future directions. Sci. Total Environ. 753, 142041. doi: 10.1016/j.scitotenv.2020.142041
Derraik J. G. B. (2002). The pollution of the marine environment by plastic debris: a review. Mar. Pollut. Bull. 44, 842–852. doi: 10.1016/S0025-326X(02)00220-5
Duan J. H., Han J., Cheung S. G., Richard K. Y. C., Lo C. M., Lee F. W. F., et al. (2021). How mangrove plants affect microplastic distribution in sediments of coastal wetlands: Case study in Shenzhen Bay, South China. Sci. Total Environ. 767, 144695. doi: 10.1016/j.scitotenv.2020.144695
Furukawa K., Wolanski E. (1996). Sedimentation in mangrove forests. Mangroves Salt Marshes 1 (1), 3–10. doi: 10.1023/A:1025973426404
Furukawa K., Wolanski E., Mueller H. (1997). Currents and sediment transport in mangrove forests. Estuar. Coast. Shelf Sci. 44, 301–310. doi: 10.1006/ecss.1996.0120
Gao F. L., Li J. X., Hu J., Sui B. L., Wang C. X., Sun C. J., et al. (2021). The seasonal distribution characteristics of microplastics on bathing beaches along the coast of Qingdao, China. Sci. Total Environ. 783, 146969. doi: 10.1016/j.scitotenv.2021.146969
Gong B., Cao H. M., Peng C. Y., Perčulija V., Tong G. X., Fang H. Y., et al. (2019). High-throughput sequencing and analysis of microbial communities in the mangrove swamps along the coast of Beibu Gulf in Guangxi, China. Sci. Rep. 9, 9377. doi: 10.1038/s41598-019-45804-w
Govender J., Naidoo T., Rajkaran A., Cebekhulu S., Bhugeloo A., Naidoo S. (2020). Towards characterising microplastic abundance, typology and retention in mangrove–dominated estuaries. Water 12, 2802. doi: 10.3390/w12102802
Gray A. D., Wertz H., Leads R. R., Weinstein J. E. (2018). Microplastic in two South Carolina Estuaries: Occurrence, distribution, and composition. Mar. Pollut. Bull. 128, 223–233. doi: 10.1016/j.marpolbul.2018.01.030
He B. Y., Lai T. H., Fan H. Q., Wang W. Q., Zheng H. L. (2007). Comparison of flooding-tolerance in four mangrove species in a diurnal tidal zone in the Beibu Gulf. Estuar. Coast. Shelf S. 74, 254–262. doi: 10.1016/j.ecss.2007.04.018
Hinojosa I. A., Thiel M. (2009). Floating marine debris in fjords, gulfs and channels of southern Chile. Mar. Pollut. Bull. 58, 341–350. doi: 10.1016/j.marpolbul.2008.10.020
Huang X. (2017). Response of mangrove soil organic carbon and heavy metal characteristics to changes in mangrove landscape patterns, East China Normal University:PhD dissertation . Available at: https://kns.cnki.net/KCMS/detail/detail.aspx?dbname=CDFDLAST2018&filename=1017070791.nh.
Huang Y. Z., Xiao X., Effiong K., Xu C. C., Su Z. N., Hu J., et al. (2021). New insights into the microplastic enrichment in the blue carbon ecosystem: Evidence from seagrass meadows and mangrove forests in coastal South China Sea. Environ. Sci. Technol. 55 (8), 4804–4812. doi: 10.1021/acs.est.0c07289
Huang Y. Z., Xiao X., Xu C. C., Perianen Y. D., Hu J., Holmer M. (2020). Seagrass beds acting as a trap of microplastics – emerging hotspot in the coastal region? Environ. Pollut. 257, 113450. doi: 10.1016/j.envpol.2019.113450
Jiao M., Ren L., Wang Y. J., Ding C. Y., Li T. Z., Cao S. H., et al. (2022). Mangrove forest: An important coastal ecosystem to intercept river microplastics. Environ. Res. 210, 112939. doi: 10.1016/j.envres.2022.112939
Jia M. M., Wang Z. M., Mao D. H., Huang C. L., Lu H. Y. (2021). Spatial-temporal changes of china’s mangrove forests over the past 50 years: An analysis towards the sustainable development goals (SDGs) (in Chinese). Chin. Sci. Bull. 66, 3886–3901. doi: 10.1360/TB-2020-1412
Jia M. M., Wang Z. M., Zhang Y. Z., Ren C. Y., Song K. S. (2015). Landsat-based estimation of mangrove forest loss and restoration in Guangxi province, China, influenced by human and natural factors. IEEE J. Sel. Top. Appl. Earth Obs. Remote Sens. 8 (1), 311–323. doi: 10.1109/JSTARS.2014.2333527
Koelmans A. A., Mohamed Nor N. H., Hermsen E., Kooi M., Mintenig S. M., De France J. (2019). Microplastics in freshwaters and drinking water: Critical review and assessment of data quality. Water Res. 155, 410–422. doi: 10.1016/j.watres.2019.02.054
Kowalski N., Reichardt A. M., Waniek J. J. (2016). Sinking rates of microplastics and potential implications of their alteration by physical, biological, and chemical factors. Mar. Pollut. Bull. 109, 310–319. doi: 10.1016/j.marpolbul.2016.05.064
Kristensen E., Bouillon S., Dittmar T., Marchand C. (2008). Organic carbon dynamics in mangrove ecosystems: A review. Aquat. Bot. 89, 201–219. doi: 10.1016/j.aquabot.2007.12.005
Kulkarni R., Deobagkar D., Zinjarde S. (2018). Metals in mangrove ecosystems and associated biota: a global perspective. Ecotoxicol. Environ. Saf. 153, 215–228. doi: 10.1016/j.ecoenv.2018.02.021
Law K. L., Moret–Ferguson S. E., Goodwin D. S., Zettler E. R., Deforce E., Kukulka T., et al. (2014). Distribution of surface plastic debris in the eastern Pacific Ocean from an 11–year data set. Environ. Sci. Technol. 48, 4732–4738. doi: 10.1021/es4053076
Liao Y. X., Pan L. H., Yan B., Shi X. F (2020). Distribution characteristics and species diversity analysis of mangrove communities in Lianzhou Bay, Guangxi. J. Guangxi Acad. Sci 36 (04), 361–70. doi: 10.13657/j.cnki.gxkxyxb.20210115.008
Li L. F., Liu W. A. (2018b). Dynamic changes of mangrove wetland landscape pattern in lianzhou gulf of guangxi and its causes. J. For. Environ. 38 (2), 171–177. doi: 10.13324/j.cnki.jfcf.2018.02.007
Liu X. Y., Liu H. T., Chen L., Wang X. H. (2022). Ecological interception effect of mangroves on microplastics. J. Hazard. Mater. 423, 127231. doi: 10.1016/j.jhazmat.2021.127231
Li R. L., Yu L. Y., Chai M. W., Wu H. L., Zhu X. S. (2020). The distribution, characteristics and ecological risks of microplastics in the mangroves of Southern China. Sci. Total Environ. 708, 135025. doi: 10.1016/j.scitotenv.2019.135025
Li R. L., Zhang L. L., Xue B. M., Wang Y. H. (2019). Abundance and characteristics of microplastics in the mangrove sediment of the semi–enclosed Maowei Sea of the south China sea: New implications for location, rhizosphere, and sediment compositions. Environ. Pollut. 244, 685–692. doi: 10.1016/j.envpol.2018.10.089
Li J., Zhang H., Zhang K. N., Yang R. J., Li R. Z., Li Y. F. (2018a). Characterization, source, and retention of microplastic in sandy beaches and mangrove wetlands of the Qinzhou bay, China. Mar. Pollut. Bull. 136, 401–406. doi: 10.1016/j.marpolbul.2018.09.025
Lusher A. L., McHugh M., Thompson R. C. (2013). Occurrence of microplastics in the gastrointestinal tract of pelagic and demersal fish from the English channel. Mar. Pollut. Bull. 67, 94–99. doi: 10.1016/j.marpolbul.2012.11.028
Maghsodian Z., Sanati A. M., Ramavandi B., Ghasemi A., Sorial G. A. (2020). Microplastics accumulation in sediments and Periophthalmus waltoni fish, mangrove forests in Southern Iran. Chemosphere 264, 128543. doi: 10.1016/j.chemosphere.2020.128543
Maghsodian Z., Sanati A. M., Tahmasebi S., Shahriari M. H., Ramavandi B. (2022). Study of microplastics pollution in sediments and organisms in mangrove forests: A review. Environ. Res. 208, 112725. doi: 10.1016/j.envres.2022.112725
Mai L., You S. N., He H., Bao L. J., Liu L. Y., Zeng E. Y. (2019). Riverine microplastic pollution in the Pearl River Delta, China: Are modeled estimates accurate? Environ. Sci. Technol. 53 (20), 11810–11817. doi: 10.1021/acs.est.9b04838
Martin C., Almahasheer H., Duarte C. M. (2019). Mangrove forests as traps for marine litter. Environ. Pollut. 247, 499–508. doi: 10.1016/j.envpol.2019.01.067
Masura J., Baker J., Foster G., Arthur C. (2015). Laboratory methods for the analysis of microplastics in the marine environment: Recommendations for quantifying synthetic particles in waters and sediments (Silver Spring, MD, USA: NOAA Tech. Memo. NOS-OR & R-48; National Oceanic and Atmospheric Administration).
Ma Y. L., Zhang S. H., Yang K., Li M. C. (2021). Influence of spatiotemporal pattern changes of impervious surface of urban megaregion on thermal environment: A case study of the guangdong – Hong Kong – Macao greater Bay Area of China. Ecol. Indic. 121, 107106. doi: 10.1016/j.ecolind.2020.107106
Melkebeke M. V., Janssen C. R., Meester S. D. (2020). Characteristics and sinking behavior of typical microplastics including the potential effect of biofouling: implications for remediation. Environ. Sci. Technol. 54 (14), 8668–8680. doi: 10.1021/acs.est.9b07378
Mohamed Nor N. H., Obbard J. P. (2014). Microplastics in Singapore’s coastal mangrove ecosystems. Mar. Pollut. Bull. 79, 278–283. doi: 10.1016/j.marpolbul.2013.11.025
Napper I. E., Bakir A., Rowland S. J., Thompson R. C. (2015). Characterisation, quantity and sorptive properties of microplastics extracted from cosmetics. Mar. Pollut. Bull. 99, 178–185. doi: 10.1016/j.marpolbul.2015.07.029
Nguyen H. T. L., Luong H. P. V. (2019). Erosion and deposition processes from field experiments of hydrodynamics in the coastal mangrove area of Can Gio, Vietnam. Oceanologia 61 (2), 252–264. doi: 10.1016/j.oceano.2018.11.004
Shim W. J., Thompson R. C. (2015). Microplastics in the ocean. Arch. Environ. Contam. Toxicol. 69, 265–268. doi: 10.1016/j.marpolbul.2013.11.025
Sivan A. (2011). New perspectives in plastic biodegradation. Curr. Opin. Biotechnol. 22, 422–426. doi: 10.1007/s00244-015-0216-x
Thompson R. C., Moore C. J., vom Saal F. S., Swan S. H. (2009). Plastics, the environment and human health: Current consensus and future trends. Philos. T. R. Soc B. 364, 2153–2166. doi: 10.1016/j.copbio.2011.01.013
Thompson R. C., Olsen Y., Mitchell R. P., Davis A., Rowland S. J., John A. W. G., et al. (2004). Lost at sea: where is all the plastic? Science 304, 838. doi: 10.1098/rstb.2009.0053
UNEP (2016). Marine plastic debris and microplastics – global lessons and research to inspire action and guide policy change (Nairobi: United Nations Environment Programme).
Waldschläger K., Schüttrumpf H. (2019). Effects of particle properties on the settling and rise velocities of microplastics in freshwater under laboratory conditions. Environ. Sci. Technol. 53 (4), 1958–1966. doi: 10.1021/acs.est.8b06794
Wang Q., Guan C. Y., Han J., Chai M. W., Li R. L. (2022). Microplastics in China Sea: Analysis, status, source, and fate. Sci. Total Environ. 803, 149887. doi: 10.1021/acs.est.8b06794
Wang T., Zou X. Q., Li B. J., Yao Y. L., Zang Z., Li Y. L., et al. (2019). Preliminary study of the source apportionment and diversity of microplastics: Taking floating microplastics in the South China Sea as an example. Environ. Pollut. 245, 965–974. doi: 10.1016/j.scitotenv.2021.149887
Wright S. L., Thompson R. C., Galloway T. S. (2013). The physical impacts of microplastics on marine organisms: a review. Environ. Pollut. 178, 483–492. doi: 10.1016/j.envpol.2018.10.110
Wu P. F., Huang J. S., Zheng Y. L., Yang Y. C., Zhang Y., He F., et al. (2019). Environmental occurrences, fate, and impacts of microplastics. Ecotoxicol. Environ. Saf. 184, 109612. doi: 10.1016/j.envpol.2013.02.031
Xue B. M., Zhang L. L., Li R. L., Wang Y. H., Guo J., Yu K. F., et al. (2020). Underestimated microplastic pollution derived from fishery activities and “hidden” in deep sediment. Environ. Sci. Technol. 54, 2210–2217. doi: 10.1016/j.ecoenv.2019.109612
Yang X., Li D., Zhao Z. (2018). Analysis on tidal characteristic of Guangxi coast. Sci. Technol. Ports 03, 27–33. doi: 10.1016/j.chemosphere.2018.11.093
Yan M. T., Nie H. Y., Xu K. H., He Y. H., Hu Y. T., Huang Y. M., et al. (2019). Microplastic abundance, distribution and composition in the Pearl River along Guangzhou city and Pearl River estuary, China. Chemosphere 217, 879–886. doi: 10.1021/acs.est.9b04850
Yang M. L., Gao T. W., Xing Y. Z., Lu Y. Z., Nong Y., Liu W. A (2017). Study on the food source of mangrove macrobenthos in Lianzhou Bay. Guangxi Sci 24, 490–97. doi: 10.13656/j.cnki.gxkx.20170920.001
Zhang G. (2009). Analysis of tidal characteristics in coastal areas of Guangxi. Pearl River 01, 29–30.
Zhang B., Chen S., Gu G. (2010). Tidal types and characteristics of the harbors along the guangxi coast. J. Mar. Sci. 28 (03), 9–16. doi: 10.1016/j.rsma.2015.04.001
Zhang M. Y., Lin Y., Booth A. M., Song X. K., Cui Y. Z., Xia B., et al. (2022a). Fate, source and mass budget of sedimentary microplastics in the Bohai Sea and the Yellow Sea. Environ. Pollut. 294, 118640. doi: 10.1016/j.scitotenv.2019.135176
Zhang L. S., Liu J. Y., Xie Y. S., Zhong S., Yang B., Lu D. L., et al. (2020b). Distribution of microplastics in surface water and sediments of Qin river in Beibu Gulf, China. Sci. Total Environ. 708, 135176. doi: 10.1016/j.jhazmat.2020.122849
Zhang J. L., Li Y. Y., Wang Y. H., Zhang Y. Y., Zhang D., Zhang R. J., et al. (2014). Spatial distribution and ecological risk of polychlorinated biphenyls in sediments from qinzhou Bay, Beibu Gulf of south China. Mar. Pollut. Bull. 80, 338–343. doi: 10.1016/j.marpolbul.2013.12.028
Zhang L., Lu L., Zhu W. J., Yang B., Lu D. L., Dan S. F., et al. (2021). Organophosphorus flame retardants (OPFRs) in the seawater and sediments of the Qinzhou Bay, Northern Beibu Gulf: Occurrence, distribution, and ecological risks. Mar. Pollut. Bull. 168, 112368. doi: 10.1016/j.marpolbul.2013.12.028
Zhang R. L., Pei J. Y., Zhang R. J., Wang S. P., Zeng W. B., Huang D. L., et al. (2018). Occurrence and distribution of antibiotics in mariculture farms, estuaries and the coast of the Beibu Gulf, China: Bioconcentration and diet safety of seafood.. Ecotoxicol. Environ. Saf. 154, 27–35. doi: 10.3390/ijerph19084886
Zhang P., Wei S. S., Zhang J. B., Ou Z., Yang Y. Q., Wang M. Y. (2020c). Occurrence, composition, and relationships in marine plastic debris on the First Long Beach adjacent to the land-based source, South China Sea. Mar. Sci. Eng. 8 (9), 666. doi: 10.1016/j.envpol.2021.118640
Zhang P., Wei S. S., Zhang J. B., Zhong H. F., Wang S. J., Jian Q. Y. (2022b). Seasonal distribution, composition, and inventory of plastic debris on the Yugang Park Beach in Zhanjiang Bay, South China Sea. Int. J. Environ. Res. Public Health 19 (8), 4886. doi: 10.3390/jmse8090666
Zhang R. J., Yu K. F., Li A., Zeng W. B., Lin T., Wang Y. H. (2020d). Occurrence, phase distribution, and bioaccumulation of organophosphate esters (OPEs) in mariculture farms of the Beibu Gulf, China: A health risk assessment through seafood consumption. Environ. Pollut. 263, 114426. doi: 10.1016/j.ecoenv.2018.02.006
Zhang L. L., Zhang S. P., Guo J., Yu K. F., Wang Y. H., Li R. L. (2020a). Dynamic distribution of microplastics in mangrove sediments in Beibu Gulf, South China: Implications of tidal current velocity and tidal range. J. Hazard. Mater. 399, 122849. doi: 10.1016/j.marpolbul.2021.112368
Zhao S. Y., Zhu L. X., Li D. J. (2015). Characterization of small plastic debris on tourism beaches around the South China Sea. Reg. Stud. Mar. Sci. 1, 55–62. doi: 10.1016/j.rsma.2015.04.001
Zheng Q., Zhang R. J., Wang Y. H., Pan X. H., Tang J. H., Zhang G. (2012). Occurrence and distribution of antibiotics in the Beibu Gulf, China: Impacts of river discharge and aquaculture activities. Mar. Environ. Res. 78, 26–33. doi: 10.1016/j.envpol.2020.114426
Zhou Q., Zhang H. B., Fu C. C., Zhou Y., Dai Z. F., Li Y., et al. (2018). The distribution and morphology of microplastics in coastal soils adjacent to the Bohai Sea and the Yellow Sea. Geoderma 322, 201–208. doi: 10.1016/j.marenvres.2012.03.007
Zhu J. M., Zhang Q., Li Y. P., Tan S. D., Kang Z. J., Yu X. Y., et al. (2019). Microplastic pollution in the Maowei Sea, a typical mariculture bay of China. Sci. Total Environment. 658, 62–68. doi: 10.1016/j.geoderma.2018.02.015
Zhu J., Zhang Q., Huang Y., Jiang Y., Li J., Michal J.J., et al. (2021). Long-term trends of microplastics in seawater and farmed oysters in the Maowei Sea, China. Environ. Pollut 273, 116450. doi: 10.1016/j.scitotenv.2018.12.192
Keywords: microplastics, mangroves, interception effects, tidal variation, Beibu Gulf
Citation: Zhang L, Wang S, Jian Q, Zhang P, Lu Y and Liu H (2022) Tidal variation shaped microplastic enrichment patterns in mangrove blue carbon ecosystem of northern Beibu Gulf, China. Front. Mar. Sci. 9:927884. doi: 10.3389/fmars.2022.927884
Received: 25 April 2022; Accepted: 30 June 2022;
Published: 28 July 2022.
Edited by:
Gert Everaert, Flanders Marine Institute, BelgiumReviewed by:
Claudia Lorenz, Aalborg University, DenmarkMiguel Angel Morales Maqueda, Newcastle University, United Kingdom
Copyright © 2022 Zhang, Wang, Jian, Zhang, Lu and Liu. This is an open-access article distributed under the terms of the Creative Commons Attribution License (CC BY). The use, distribution or reproduction in other forums is permitted, provided the original author(s) and the copyright owner(s) are credited and that the original publication in this journal is cited, in accordance with accepted academic practice. No use, distribution or reproduction is permitted which does not comply with these terms.
*Correspondence: Peng Zhang, emhhbmdwZW5nQGdkb3UuZWR1LmNu