 Jiehong Wei1Min-Yun Liu2
 Jen-Chieh Shiao3Fan Li4
 Jinquan Yang5Yoshiyuki Iizuka6Bin Kang7Ruo-Shan Tseng1
 Huan-Jie Shao1
 Te-Yu Liao1*
- 1Department of Oceanography, National Sun Yat-sen University, Kaohsiung, Taiwan
- 2Taiwan Ocean Research Institute, National Applied Research Laboratories, Kaohsiung, Taiwan
- 3Institute of Oceanography , National Taiwan University, Taipei, Taiwan
- 4Shanghai Natural History Museum, Branch of Shanghai Science and Technology Museum, Shanghai, China
- 5Key Laboratory of Exploration and Utilisation of Aquatic Genetic Resources, Ministry of Education, Shanghai Ocean University, Shanghai, China
- 6Institute of Earth Sciences, Academia Sinica, Taipei, Taiwan
- 7Fisheries College, Ocean University of China, Qingdao, China
The modern coast of China is characterized by complicated hydrology, which might be a potential factor shaping genetic structure of marine organisms. Tridentiger barbatus is a widespread benthic goby in coastal China whose range expansion might depend on larval dispersal in its spawning season. We explored the genetic structure of T. barbatus and its interrelationships with coastal currents, planktonic larval duration, and Pleistocene climate fluctuations. Genealogies of Cytb, Rh, and RAG1 reveal two lineages in T. barbatus, namely the southern and northern lineages. The southern lineage is distributed through the South China Sea to the South Yellow Sea but is absent from the North Yellow Sea and Bohai Sea. The HYCOM average flow field indicates an eddy between the North and South Yellow Seas, which might cause larval retention and limit dispersal of the southern lineage into the North Yellow Sea and the Bohai Sea. The northern lineage is distributed through the South Yellow Sea to the Bohai Sea but is absent from the South China Sea and East China Sea. The distribution of the northern lineage fits the eastward deflection of the Yellow Sea Coastal Current at the boundary of the East China Sea and South Yellow Sea, which might limit southward larval dispersal of the northern lineage into the East China Sea. We also uncovered two Cytb haplotype groups within the southern lineage, namely groups A and B, whose distributions might be shaped by the northward Taiwan Strait Current. The coincidence between the genetic structure of T. barbatus and the coastal currents and eddies strongly implies significant roles of larval dispersal and current transportation in shaping the genetic structure of T. barbatus. In addition, significant isolation by distance is found in the southern lineage, which coincides with its short planktonic larval duration (20–30 days). The inference on divergence time suggests that the observed lineages and haplotype groups in T. barbatus originated in the Pleistocene glaciations. Therefore, the coastal currents, planktonic larval duration, and historical glacial isolation are proposed as important factors shaping the genetic structure of T. barbatus.
Introduction
Due to the lack of solid barriers in the modern oceans, distance is considered an important factor in isolating geographic populations of marine species (Slatkin, 1993; Foll and Gaggiotti, 2006; Riginos et al., 2011). The ability to migrate over a geographic distance, i.e., the dispersal potential of a marine species, would thus affect gene flows and genetic structures of its geographic populations (Dawson et al., 2014). Under restricted dispersal potential, genetic differentiation among populations will accumulate as geographic distances increase (Slatkin, 1993). Such a genetic structure is termed as “isolation by distance” (IBD, Wright, 1943). Large-size pelagic fishes, e.g., Coryphaena hippurus Linnaeus 1758 and Thunnus albacares (Bonnaterre 1788), tend to perform long-distance reproductive migration and utilize a common spawning ground, which might result in genetic homogeneity and low intra-oceanic genetic divergences (Ely et al., 2005; Díaz-Jaimes et al., 2010; Pecoraro et al., 2018). Planktonic larvae and eggs could disperse by passive drifting, which is an alternative way to facilitate gene flow (Sale, 1980). Marine organisms with a longer planktonic larval duration (PLD) are generally expected to have higher dispersal potential and, therefore, might show lower levels of genetic differentiation over large geographical scales (Palumbi, 1994; Selkoe and Toonen, 2011). Since planktonic larvae drift passively in the water column, hydrographic conditions of the oceans, e.g., currents and eddies, may mediate their dispersal potential (Shanks, 2009; Ni et al., 2014). Currents are generally expected to facilitate further dispersal of larvae and reduce genetic structures among populations (Song et al., 2010; Ni et al., 2014). Nevertheless, current transportation could constrain the dispersal direction of larvae, resulting in directional gene flows and shaping haplotype distributions among geographical populations (Qiu et al., 2016; Muñoz-Ramírez et al., 2020). Frontal zones, eddies, and tidal currents might cause larval retention and interrupt gene flows among populations, eventually resulting in genetic differentiation (Rocha-Olivares and Vetter, 1999; Bakun, 2006; Magsino and Juinio-Meñez, 2008; Cowen and Sponaugle, 2009; Mullaney and Suthers, 2013).
In recent decades, huge efforts have been made to understand the genetic structure of marine organisms along the coast of China. The “vicariance, then secondary contact” hypothesis is widely accepted to explain the genetic structure of marine organisms in coastal China (Ni et al., 2014; Qiu et al., 2016). Due to dramatic sea level decline in the Pleistocene glacial periods, the East China Sea Shelf (the ECS shelf, referring to the continental shelf in the modern areas of the Bohai Sea, Yellow Sea, and East China Sea) used to be terrestrial and unsuitable habitat for marine organisms (Wang, 1999). The surfaced ECS shelf might shatter marginal seas into multiple refugia, resulting in isolation and divergences of marine organisms in the Northwest Pacific (Hu et al., 2011; Ni et al., 2014), which was highlighted by most studies as a barrier to causing lineage divergences of coastal organisms (Cheng et al., 2019; Ni et al., 2014; Zhang et al., 2019). The reflooded ECS shelf after the last glacial period provided more habitats for marine organisms to recolonize, which resulted in demographic expansion and secondary contacts of isolated populations (Crandall et al., 2012; Ni et al., 2014; Xue, 2014; Qiu et al., 2016). Biological (e.g., swimming capability and PLD) and hydrological factors (e.g., temperature and currents) might also affect the post-glacial recolonization process of marine species and continue to mediate their modern range expansion, which might subsequently shape their genetic structures in the reflooded ECS shelf. Although evidence has been proposed that post-glacial recolonization processes and contemporary hydrological factors could affect the genetic structure of marine invertebrates and algae in coastal China (e.g., Dong et al., 2012; Han et al., 2015; Li et al., 2017a), only a few studies have provided vigorous hypotheses and evidence about their impact on the genetic structure of marine fishes (Song et al., 2010; Qiu et al., 2016).
The Shokihaze goby, Tridentiger barbatus, is a benthic species characterized by dense barbels on the cheek and mandible. It is a typical small-sized benthic fish, producing adhesive eggs (Dotu, 1957). As a result, adults and eggs of T. barbatus might lack long-distance migration, and its range expansion might be limited to larval dispersal and affected by coastal currents. Regardless of its limited dispersal potential, T. barbatus is widely distributed in coastal China, Korea, and Japan (Wu and Zhong, 2008), which might imply undiscovered genetic structure within the species. Tridentiger barbatus would be an ideal candidate to study the influence of coastal currents on the genetic structure of marine organisms. In this study, individuals of T. barbatus were collected along the coast of China and the sequence data of three gene markers were analyzed to explore the genetic structure of geographical populations and their relationship to contemporary hydrological factors, planktonic larval duration, and historical climate fluctuations.
Material and methods
Sampling and DNA extraction
From 2014 to 2016, 256 specimens of T. barbatus were collected from fish markets near landing sites in coastal China. Tridentiger barbatus is a nearshore benthic species of little commercial value. It is mainly harvested by nearshore bottom trawling as bycatch and sold fresh locally at fish markets near the landing sites. Therefore, the samples from the fish markets can be treated as individuals of the local populations. The sample sites are shown in Figure 1, numbered 1–14 from south to north. The specimens were fixed in 95% ethanol and taken back to the lab. Two specimens of Tridentiger radiatus were collected from Xiamen and selected as outgroups for Maximum Likelihood tree reconstruction. The total genomic DNA of the specimens was isolated from fin clips by a Micro-Elute DNA Clean/Extraction Kit (GMbiolab), following the kit manual protocol.
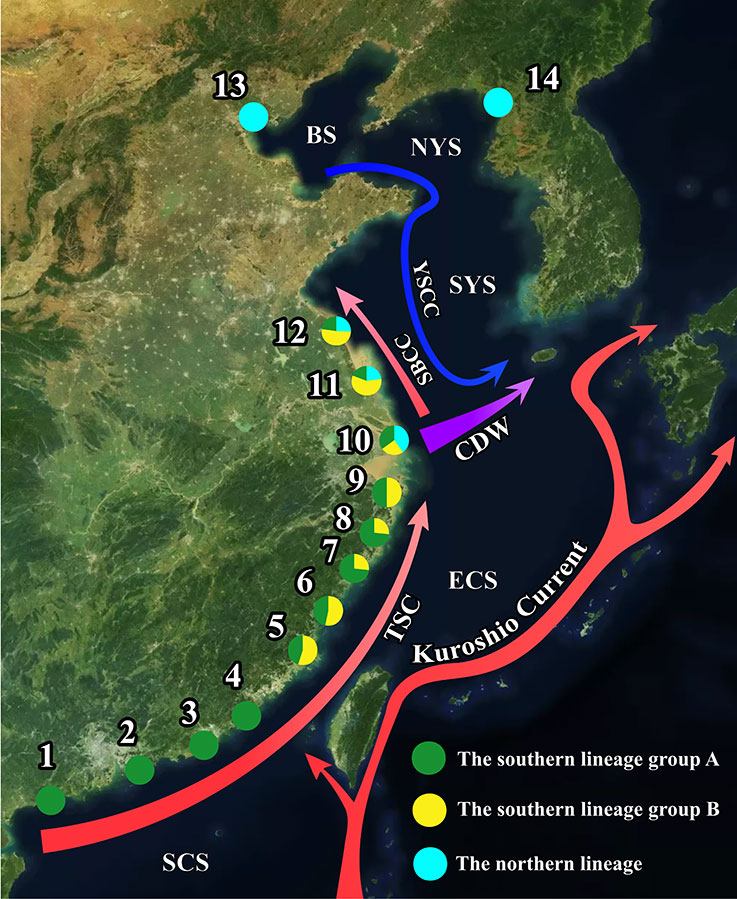
Figure 1 A map depicting sampling sites, distribution of lineages and intra-lineage haplotype groups and summer hydrographical conditions (drawn based on Yuan et al., 2017; Liu et al., 2021). Sampling sites are numerically coded from south to north: 1. Yangjiang, 2. Shenzhen, 3. Shanwei, 4. Raoping, 5. Fuding, 6. Rui’ an, 7. Dongtou, 8. Taizhou, 9. Ningbo, 10. Shanghai, 11. Rudong, 12. Lianyungang, 13. Tianjin, and 14. Dandong. Percentages of lineages and haplotype groups in each sample site are shown in pie charts. Abbreviations for ocean currents, freshwater discharge and seas: TSC, the Taiwan Strait Current; CDW, the Changjiang Diluted Water; SBCC, the Subei Coastal Current; YSCC, the Yellow Coastal Current; YSWC, the Yellow Sea Warm Current, SCS, the South China Sea; ECS, the East China Sea; SYS, the South Yellow Sea; NYS, the Northern Yellow Sea; BS, the Bohai Sea.
Hydrology in coastal China during spawning season of T. barbatus
To understand the correlation between ocean current transportation and genetic structure, we compared the genetic structure of T. barbatus with coastal currents along the coast of China. The spawning season of T. barbatus falls in summer, from May to September (Dotu, 1957). We divided the study region into the marginal seas in coastal China (Figure 1, Wei et al., 2011; Han et al., 2015; Xu et al., 2021), i.e., the South China Sea (SCS, sites 1–4), the East China Sea (ECS, sites 5–9), the South Yellow Sea (SYS, sites 10–12), the North Yellow Sea (NYS, site 13), and the Bohai Sea (BS, site 14). In summer, the SCS and ECS are affected by several northward and northeastward coastal currents, e.g., the South China Sea Coastal Currents, the Guangdong Coastal Current, and the Taiwan Strait Current (TSC, Liu et al., 2021). We used the Taiwan Strait Current to represent all the northward currents affecting the SCS and ECS. The coasts of NYS, SYS, and BS are mainly affected by two coastal currents; the Yellow Sea Coastal Currents (YSCC, Liu et al., 2021), and the Subei Coastal Current (SBCC, Yuan et al., 2017). The YSCC merges with the Changjiang Diluted Water (CDW) and is deflected eastward (Figure 1, Yuan et al., 2017; Liu et al., 2021).
The chemistry of the Yellow Sea and the Bohai Sea is more complicated and might exhibit inter-monthly and annual changes. Outputs of ocean currents and temperature from the Hybrid Coordinate Ocean Model (HYCOM), global 1/12° resolution, and 3-hour interval reanalysis were used to illustrate the average flow field of this region in the spawning season of T. barbatus. In this study, the outputs in the domain covering 32–42°N and 115–128°E at the surface level from May to September of 2015 were used. A more thorough description of the model configuration, data assimilation, and how the optimization is carried out can be found at https://hycom.org. The distribution of averaged ocean current and water temperature in the Yellow Sea and Bohai Sea reconstructed in HYCOM was shown in Figure 2. Specially, HYCOM indicated that the SBCC merged with the southward YSCC at the northern Yellow Sea, eastward off the Shandong Peninsula, and formed a clockwise eddy (Figure 2).
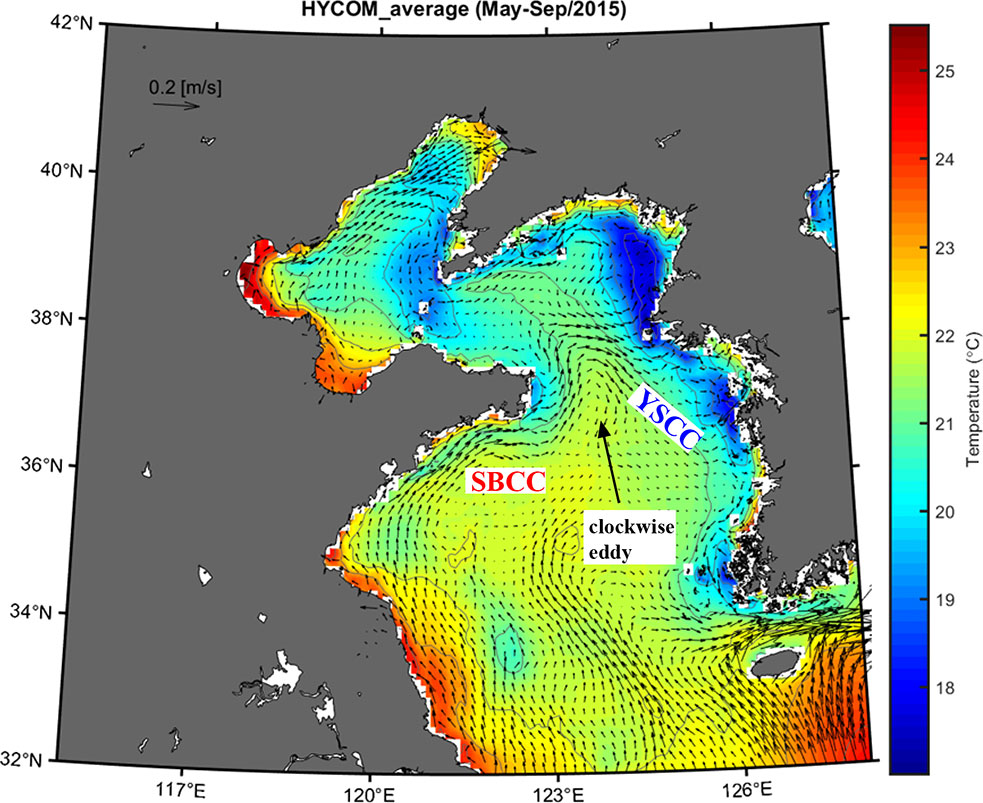
Figure 2 The distribution of averaged ocean current and water temperature during May to September in the Yellow Sea and Bohai Sea. Generated from HYCOM.
PCR and sequencing
Polymerase chain reactions (PCR) of cytochrome b (Cytb), recombination-activating gene 1 (RAG1), and Rhodopsin (Rh) were performed using ProTaq DNA polymerase sets (Pro-tech Technology) and 2× SuperRed PCR Mastermix (Toolsbiotech). PCR protocols, cycling conditions, and primers used in this study are shown in Supplementary Data 1. PCR products were purified using the SAP-Exo Kit following the recommended protocol (Jena Bioscience GmbH) and sent out for sequencing by a commercial company. Sequences were assembled with Seqman in Larsergene v7.1.0 (DNASTAR Inc., Madison, WI), aligned using the Clustal W method in Mega 7.0 using the default parameters, and trimmed to the same length (Thompson et al., 1994; Kumar et al., 2016) and revised by eye. Haplotypes of each gene were identified by DnaSP 6 (Rozas et al., 2017), and Cytb, RAG1, and Rh were labeled C, Ra, and Rh, respectively. Cytb, RAG1, and Rh haplotypes of T. barbatus and sequences of T. radiatus were deposed in NCBI, under accession numbers MK257014–MK257105 and MN413603–MN413608 (Supplementary Data 2). Haplotype composition of each sampling locality is summarized in Supplementary Table 1.
Neighbor-joining tree, maximum likelihood tree and TCS haplotype network
Best-fit models for aftermentioned molecular analyses were selected by the jModelTest2 based on the Bayesian information criterion (Schwarz, 1978; Darriba et al., 2012). The HKY+G model was selected for Cytb and the best fit model for RAG1 and Rh genes was the K80 model (Kimura, 1980; Hasegawa et al., 1985). Haplotype networks of each gene were assembled in Popart v1.7 (http://popart.otago.ac.nz) with the TCS algorithm and default settings (Clement et al., 2002). Neighbor-joining trees were reconstructed with T. radiatus, a congener of T. barbatus, as an outgroup using MEGA 7.0 (Cui et al., 2013; Kumar et al., 2016). Maximum likelihood (ML) trees were reconstructed in IQ-TREE v1.6.8 with the outgroup T. radiatus (Nguyen et al., 2015). Bootstrap values (BS) of the NJ and ML trees were estimated with 1,000 bootstrap replicates (Felsenstein, 1985).
Spatial analysis of molecular variance within geographic populations
We implemented a spatial analysis of molecular variance (SAMOVA; Dupanloup et al., 2002) and principal component analyses (PCA; Wold et al., 1987) to determine genetic partitions of geographic populations. Because two lineages, i.e., the southern and northern lineages, with a clear differentiation were revealed (see the Results section), we only estimated further spatial differentiations within the lineages. Because Rh and RAG1 showed low haplotype diversities, which led to insignificant statics in preliminary analyses, SAMOVA and PCA were only performed with Cytb data. SAMOVA selected an optimal partition strategy based on a simulated annealing process maximizing differences among groups of the population (i.e., the FCT coefficient, Excoffier et al., 1992). SAMOVA and analysis of molecular variance (AMOVA, Excoffier et al., 1992) of the best partition strategy were performed in SAMOVA v2.0 (Dupanloup et al., 2002) with ten simulated annealing processes, 100,000 simulated annealing steps, and a prior definition of the number of groups, K (2–11 for the southern lineage and 2–4 for the northern lineage based on the numbers of their geographic populations). PCA was performed in Primer-E v6.0 (Clarke and Gorley, 2005) using pairwise fixation index (Fst) matrices generated in Arlequin v3.5 (Excoffier and Lischer, 2010). Relationships among the sampling sites were plotted at the first two principal coordinates.
Molecular dating and historical demography
Due to a lack of fossil data for T. barbatus, we applied the expansion dating method proposed by Crandall et al. (2012) to estimate substitution rates. Demographic expansion was first assessed with the D test of Tajima, the Fs test of Fu, and the Bayesian skyline plot (BSP, Drummond et al., 2005). Significant negative Tajima’s D and Fu’s Fs values were can be interpreted as signals of demographic expansion. BSP infers historical population dynamics over time by estimating the unscaled effective population size (θ) between coalescence events (Drummond et al., 2005). Tajima’s D and Fu’s Fs values were calculated in DnaSP v6 (Tajima, 1989; Fu and Li, 1993; Rozas et al., 2017) with 1,000 permutations of significant test. Uncalibrated BSP was generated in Beast v1.8.4 (Drummond et al., 2005; Drummond et al., 2012). Because insufficient convergence of BSP and insignificant statics of neutral tests were retrieved from the RAG1 and Rh datasets, we only assessed demographic history and divergence time with the Cytb dataset. The best fit model and priors for Cytb determined by jModelTest2 were applied to BSP reconstruction, i.e., HKY+G (κ = 7.1489, γ = 0.18). The substitution rate was set to 1.0 substitution/site/million years based on Crandall et al. (2012). Two Markov chain Monte Carlo (MCMC) runs were performed with 100,000,000 generations, sampling every 10,000 generations and discarding the first 10% of samples as burn-in. Sufficient convergence of parameters and burn-in of runs were checked with Tracer v1.7 (http://tree.bio.ed.ac.uk/software/tracer) and ESS values (above 200). The tree and log files of the two runs for each lineage were combined in LogCombiner v1.8.4 of the BEAST package and then used for uncalibrated BSP reconstructions in Tracer v1.7. The time of the uncalibrated BSP is in the unit of substitution/site.
The estimation of transition time (ttransition) is a key step in the expansion dating method (Crandall et al., 2012). Although Crandall et al. (2012) proposed estimating ttransition using the two-epoch model in BEAST, our preliminary tests with the two-epoch model failed to converge after 1,000,000,000-step MCMC runs. Therefore, we estimated ttransition based on growth rate changes in the BSP curves. Crandall et al. (2012) assumed that coastal species that underwent post-glacial expansion had two different population stages, i.e., a constant population size stage and a population growth stage, and ttransition is the timing when a population shifted from the constant stage to the population growth stage, where the growth rate (r) was positive at the population growth stage but negative or close to zero at the constant stage. Therefore, we assumed that the timing of the most recent shift of growth rate from negative/zero to positive was the ttransition of the two stages. A matrix containing 50 data points for each uncalibrated BSP curve was generated in Tracer v1.7. Growth rate was estimated with the matrices using the grow rate formula, r = (θ1 − θ0)/(θ0 (t1 − t0)), in which θ1 and θ0 were the present and past unscaled effective population size and t1 and t0 were the present and past time. Uncalibrated ttransition was in the unit of substitutions/site. Following Crandall et al. (2012), we applied the Bolling Interstadial period (started at 14.58 Kya) as the calibrating point (c) of population expansion, during which reflooding of continental shelves might truly begin. Then the calibrated substitution rate can be calculated as μ = ttransition/c.
Divergence times of lineages were estimated with Cytb haplotypes using the Yule process model (Yule, 1925) in Beast v1.8.4 (Drummond et al., 2012). The same substitution model for BSP was applied to the divergence time estimation. The calibrated substitution rate by the expansion dating method was applied using the strict clock model with a normal distribution covering its 95% highest posterior density interval (95% HPD). Two MCMC runs were performed with 10,000,000 generations, sampling every 1,000 generations and discarding the first 10% of samples as burn-in. Sufficient convergence of parameters and burn-in of runs were checked with Tracer v1.7 and ESS values (above 200). The tree files of the two runs were combined in LogCombiner v1.8.4 of the BEAST package and then used for generating consensus trees using maximum clade credibility in TreeAnnotator v1.8.4 (the BEAST package, Drummond et al., 2012). The calibrated divergence times were in units of a million years (Myr).
Planktonic larval duration, habitat use, and isolation by distance
To understand the relationship between the dispersal potential and genetic structure, we estimated the PLD and isolation by distance pattern of T. barbatus. Sagittal otoliths were extracted from four specimens from the Jiulong River, Fujian (near site 5, Figure 1) and embedded in Epofix resin before repeated grinding and polishing along the sagittal plane until the core was revealed on the surface. The otoliths were carbon coated before the quantitative analysis of the Sr : Ca ratio at 10-μm intervals from the otolith core to the edge by an electron probe microanalyzer (EPMA, JEOL JXA-8900R, JEOL, Japan). The Sr : Ca ratio of the fish otolith is mainly affected by the Sr concentration in the aquatic environment. Low Sr : Ca ratio is proposed as a signal of exposure to freshwater while high Sr : Ca ratio represents exposure to marine/brackish water, which could thus reflect habitat use of fish species (Iizuka, 2012). The transition of freshwater to brackish water (or seawater) was around 2 to 3 × 10⁻³ in Sr : Ca ratio (Iizuka, 2012). After the analysis of otolith Sr : Ca ratios, the otoliths were polished to remove the carbon layer and etched with 0.1 M HCl for 10–15 s to enhance the contrast of growth increments before being observed under a compound light microscope. Ontogenetic shifts of fish usually induce a change in their otolith microstructure, which results in a blurred and uncountable zone in the otolith (Sponaugle and Cowen, 1994). Therefore, regular and high-contrast growth increments beneath this zone are assumed to be formed during the planktonic larval stage before the fish settles onto benthic habitats, which is the PLD of marine organisms.
To test the hypothesis of isolation by distance (Slatkin, 1993), we estimated reduced major axis (RMA) regression of standardized Cytb pairwise Fst values [Fst/(1 − Fst)] and pairwise geographic distances in IBD v1.5.1 (Bohonak, 2002). Negative standardized Fst was treated as zero in IBD v1.5.1. The significance of the linear relationship between matrices of geographic distance and standardized Fst was tested using the Mantel test with 1,000 randomization (Manly, 1994). The geographic distance between each pair of sampling sites was estimated by measuring their linear distance along the coastline on Google Map.
Results
Genetic diversity and genealogy
Nucleotide sequences of Cytb (682 bp), Rh (441 bp), and RAG1 (1216 bp) were obtained from all 256 individuals. Sixty-three, 18, and 11 haplotypes were identified in the Cytb, RAG1, and Rh data, respectively. Genealogies of Cytb, Rh, and RAG1 indicated a north-south differentiation within T. barbatus. All the specimens could be categorized into two lineages based on their Cytb, RAG1, and Rh haplotypes, namely, the southern and northern lineages (Figure 3; Supplementary Figure 1). An individual with a Cytb haplotype of the southern lineage but RAG1 and Rh haplotypes of the northern lineage, or vice versa, was not found among the study specimens. TCS networks indicated 69, 5, and 10 fixed differences between the two lineages in Cytb, Rh, and RAG1, respectively (Figure 3). The southern lineage included 206 individuals and was distributed through sites 1 to 12, while the northern lineage included 50 individuals and was distributed through sites 10 to 14 (Figure 1). The distributions of the two lineages overlapped at sites 10–12, with 107 individuals from these three sites (Figure 1). The NJ trees of Cytb, RAG1 and Rh (Supplementary Figure 1) were also well supported (BS = 97–100) by the monophyly of each lineage, except that the monophyly of the southern lineage was less supported by the Rh tree (BS = 74). Monophyly of the two lineages was well-supported (BS = 99–100) in the ML trees of Cytb and RAG1, but the northern lineage was a monophyletic clade (BS = 97) nested within the southern lineage in the Rh ML tree (Supplementary Figure 1).
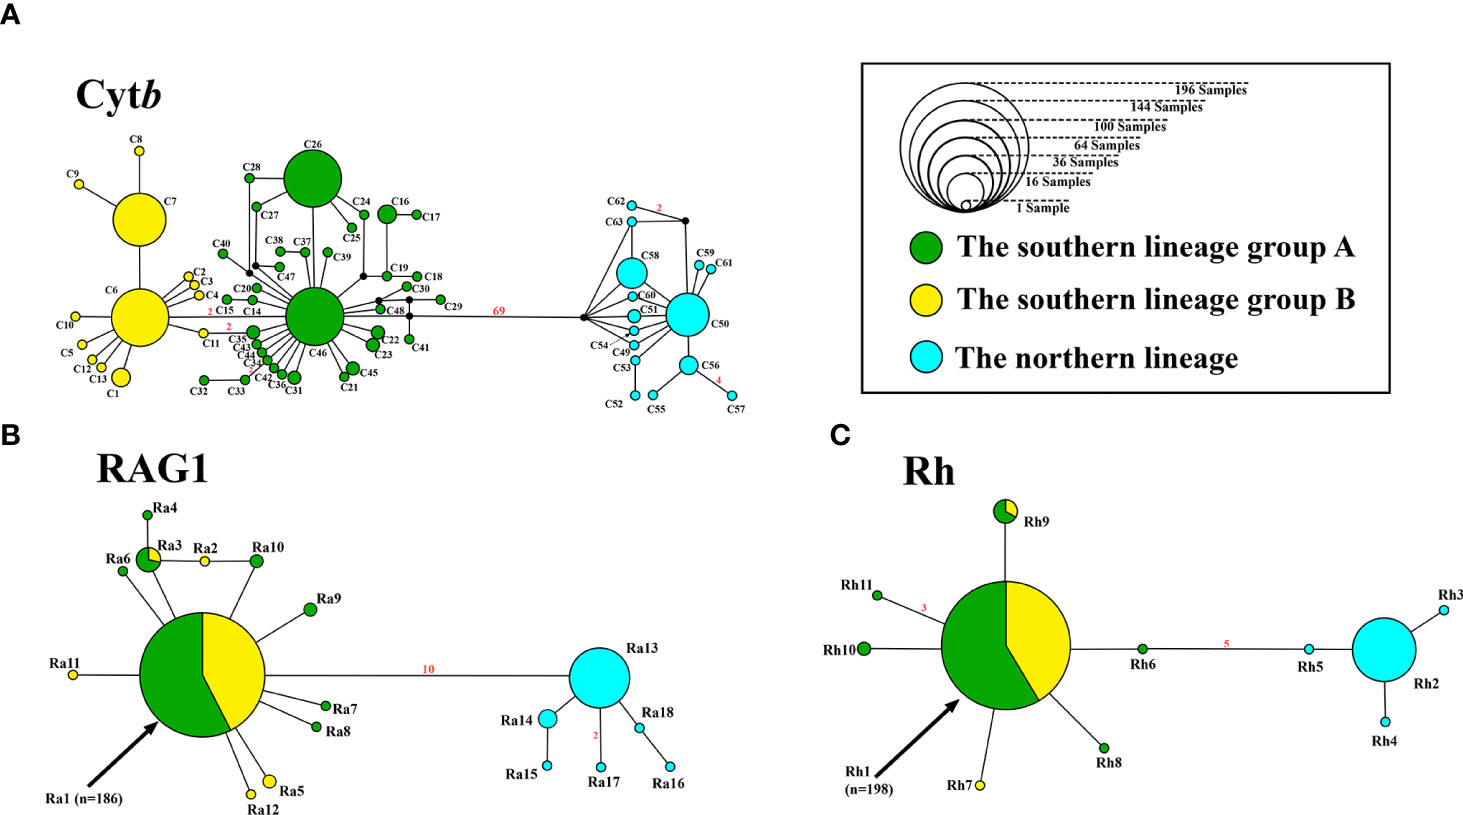
Figure 3 TCS networks of Cytb (A), RAG1 (B), and Rh (C) genes, indicating relationships of lineages and infra-lineage haplotype groups of T. barbatus. The numbers of mutation steps greater than one are shown in red.
Genetic differentiation within lineages of T. barbatus
SAMOVA based on Cytb data indicated two partition strategies that maximally differentiated the southern lineage (Supplementary Figure 2A): K = 2, sites 1–4 vs. sites 5–12; and K = 11, only sites 3–4 were grouped. Most sites of the southern lineage are divided into two groups in the PCA result: sites 1–4 vs. sites 5–12 (Supplementary Figure 3A). Therefore, we selected the K = 2 partition strategy as the best solution for the southern lineage. AMOVA of the K = 2 partition strategy indicated that the difference among groups (FCT) was significant (p <0.05) and explained 22.31% of total genetic variation within the southern lineage (Table 1). The maximum FCT of the northern lineage was observed when K = 3 (Supplementary Figure 2B, sites 10–12 vs. site 13 vs. site 14). Three groups were also indicated in PCA for the northern lineage, i.e., sites 10–12, site 13 and site 14 (Supplementary Figure 3B). However, FCT of the northern lineage was not significant in the AMOVA result (p >0.05, Table 1).
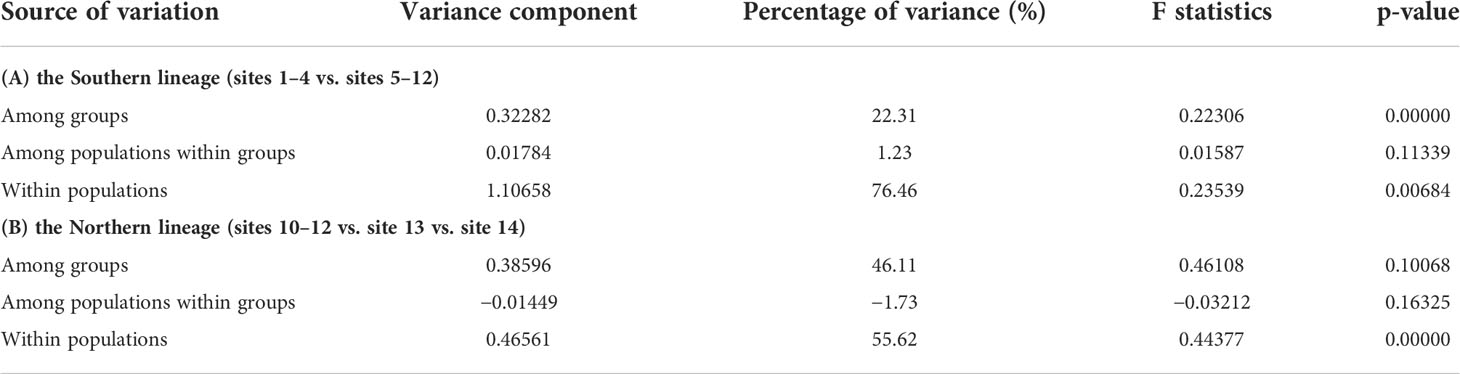
Table 1 AMOVA for the southern and northern lineages of T. barbatus with best partition strategies selected by SAMOVA.
Five dominant Cytb haplotypes (C6, C7, C26, C46, and C50) were identified. Each of them accounted for 9% to 16% of analyzed individuals, summing up to 65% of all the studied specimens (Figure 3; Supplementary Table 1). The distributions of Cytb haplotypes showed spatial structures within the two lineages. In the northern lineage, most haplotypes can be found only on a single site, except for C50, which was shared by sites 10–13. In the TCS network, we found two Cytb haplotype groups of the southern lineage with different geographic distributions: group A, C26, C46, and their close related haplotypes, and group B, C6, C7, and their closely related haplotypes (Figure 3A). Group B is monophyletic and nested within group A, supported by bootstrap values of 27 and 89 in the NJ and ML trees, respectively (Supplementary Figure 1A), but the ultrametric tree generated from BEAST resolved reciprocal monophyly of the two haplotype groups (Figure 4). Group A can be found in sites 1–12, while group B was only found in sites 5–12 (Figure 1). Both the northern and southern lineages were each dominated by a single haplotype of RAG1 and Rh, which showed no spatial structure within the lineages (Figure 3).
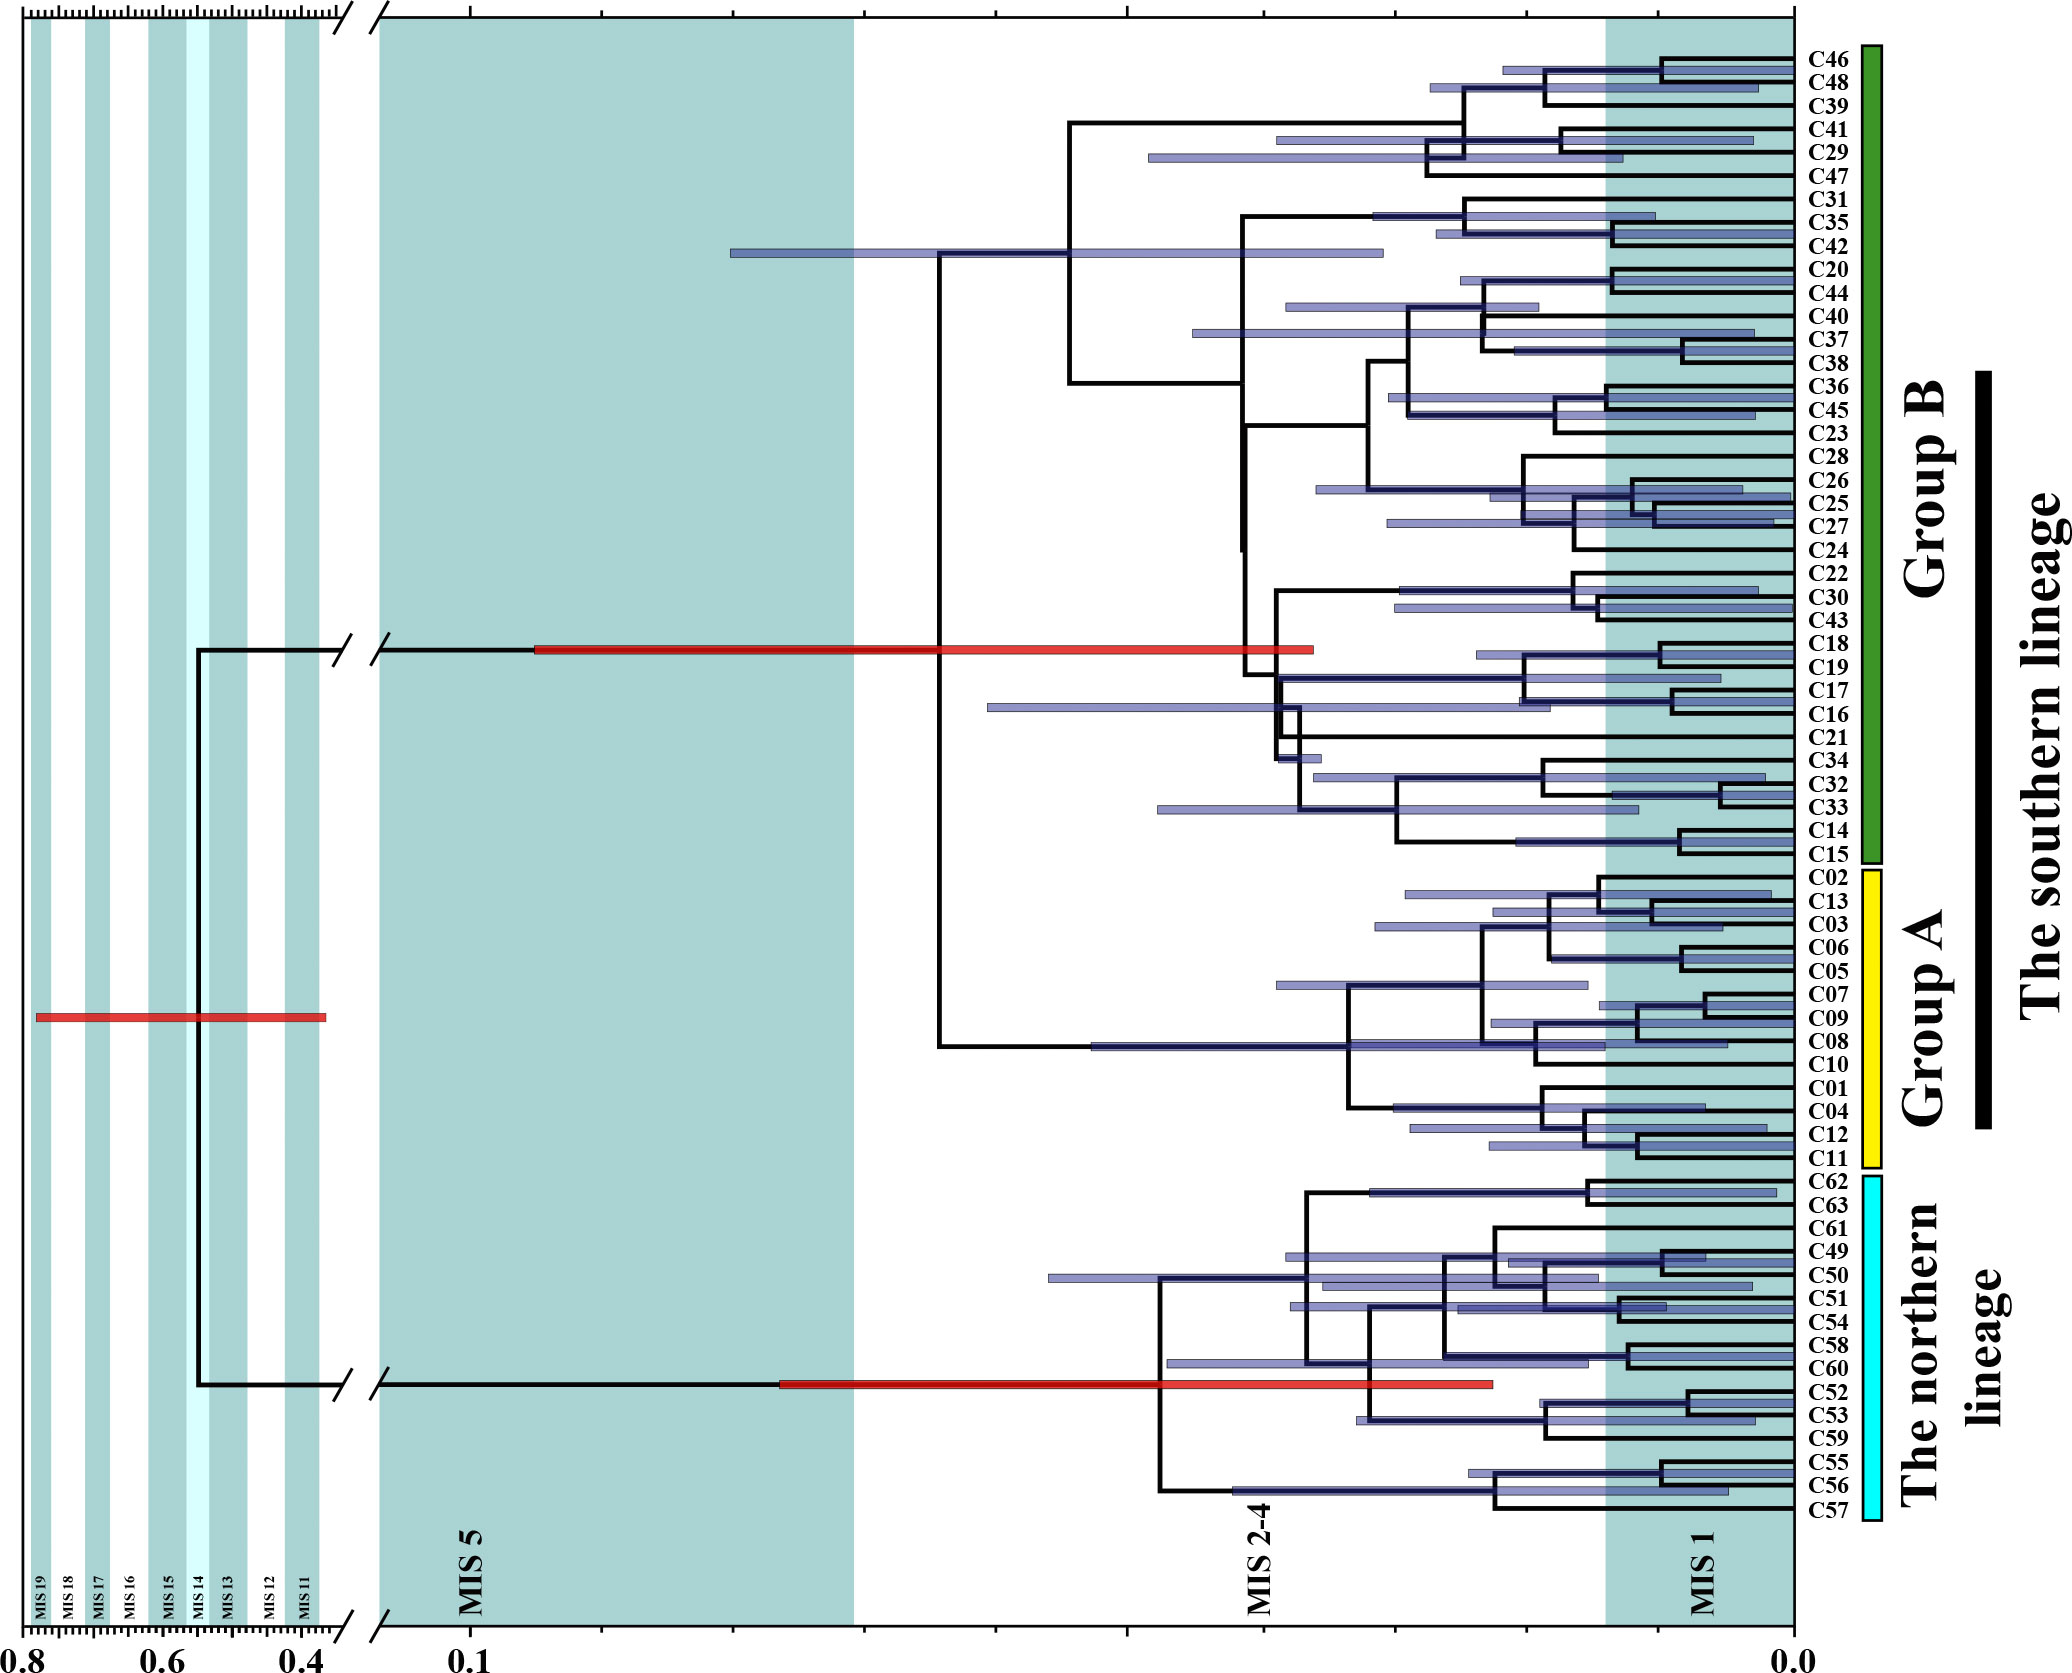
Figure 4 Divergence time of the southern and northern lineages based on Yule Process Model and calibrate substitution rate of Cytb. Intervals of marine isotopes stages are annotated following Hao et al. (2015). Interglacial periods in pale green, glacial periods in white, and the warmer glacial period MIS 14 in light blue. Node bars indicate 95% HPD intervals of the divergence times. Three red node bars denote divergence time between the northern and southern lineages, divergence time between groups A and B of the southern lineage, and tMRCA of the northern lineage respectively.
Divergence time and historical demography
Significant (p <0.05) negative Tajima’s D and Fu’s Fs values were retrieved in the two lineages (Figure 5, the southern lineage, Tajima’s D: −2.15, Fu’s Fs: −48.30; the northern lineage, Tajima’s D: −2.36, Fu’s Fs: −10.80). The BSPs indicated population growth following a population decrease in both the southern and northern lineages (Figure 5). In both lineages, growth rates at the population growth stage were mostly positive, while at the population decrease stage they were mostly negative (Figure 5). In particular, we observed a growth rate decrease following an increase stage at the population growth stage in both lineages (Figure 5). The mean ttransition of the southern and northern lineages was 0.0014 substitutions (95% HPD: 0.0011–0.0017 substitutions) and 0.0017 substitutions (95% HPD: 0.0009–0.0019 substitutions). Based on the expansion dating method (Crandall et al., 2012), the calibrated substitution rates were 9.60%/Myr (95% HPD: 7.54%–11.66%/Myr) and 11.90%/Myr (95% HPD: 6.24%–12.95%/Myr) for the southern and northern lineages, respectively. As the calibrated substitution rate of the southern lineage was based on more sequence data, we applied the substitution rate and its 95% highest posterior density interval for divergence time estimation, using a strict clock model with a normal distribution (mean = 0.0960 substitution/site/Myr, standard deviation = 0.0124). The mean divergence time between the two lineages was 0.56 Myr (95% HPD: 0.37–0.79 Myr, Figure 4), while that between groups A and B of the southern lineage was 0.07 Myr (95% HPD: 0.04–0.09 Myr). The mean time to the most recent ancestor (tMRCA) of the northern lineages was 0.05 Myr (95% HPD: 0.04–0.08 Myr).
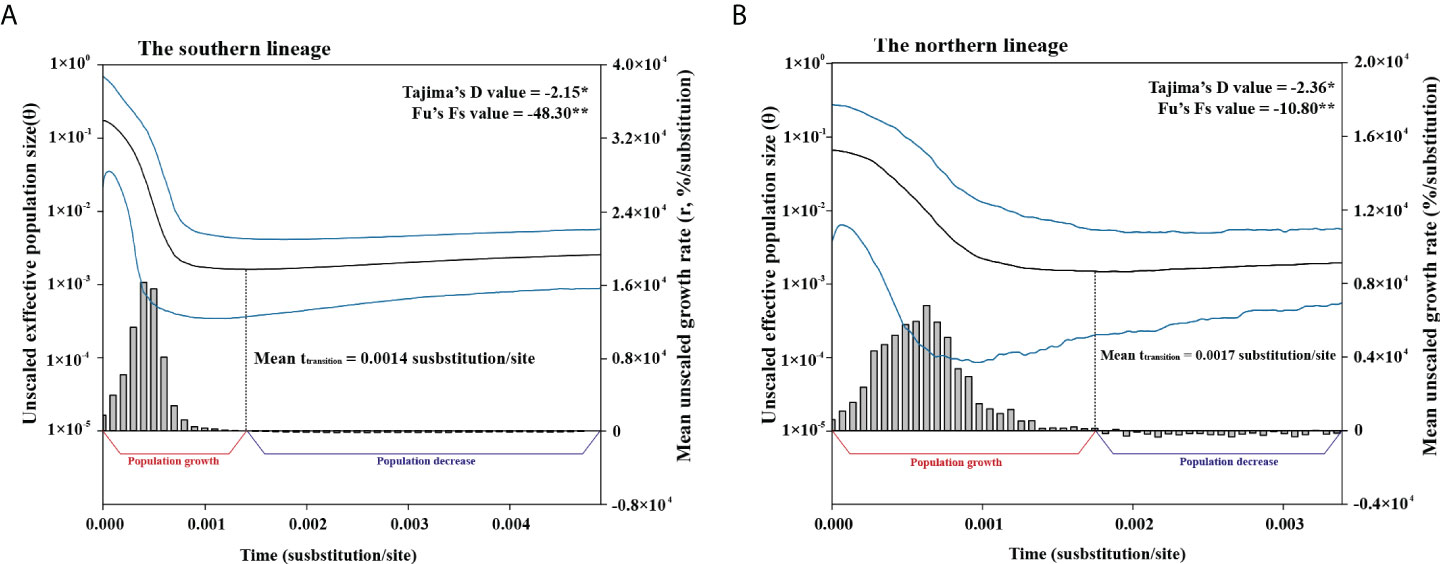
Figure 5 Bayesian skyline plots and inferred mean grow rate dynamics of the southern (A) and northern (B) lineages of T. barbatus. Mean (black), upper and lower limits of 95% HPD intervals (blue) of unscaled effective population size are presented in curves with logarithmic Y axis on the left, and the growth rate dynamic is presented in bar chart with Y axis on the right. Tajima’s D and Fu’s Fs values of each lineage are given at top-right corner. Mean uncalibrated transition time of each lineage is indicated.
Planktonic larval duration, habitat use, and isolation by distance
Near the core of the four analyzed otoliths, 26–28 growth increments were clear and discernible (i.e., No. 875, 26 increments; Nos. 890 and 891, 27 increments; and No. 893, 28 increments, Supplementary Figure 4). Beyond this zone, the growth increments were blurred and uncountable. Therefore, we assume the PLD of T. barbatus is about 20–30 days. Otolith Sr : Ca ratios showed a typical marine signature that fluctuated between 4 and 11 × 10−3 without evident trends from the otolith core to the edge (Supplementary Figure 4; Brown and Severin, 2009). Only otolith no. 875 showed lower otolith Sr : Ca ratios of between 0 and 3 × 10⁻³ at 300–400 μm from the core, which were accompanied by two distinct growth increments slightly beyond the blurred ontogenetic shift zone (Supplementary Figure 4A). The mean reduced major axis regression for the southern and northern lineages was y = 0.000275x − 0.134 (r2 = 0.715) and y = 0.000545x − 0.134 (r2 = 0.25) (Figure 6A). The Mantel test indicated that the IBD pattern was highly significant (p <0.001) for the southern lineage but non-significant (p >0.05) for the northern lineage (Figure 6B).
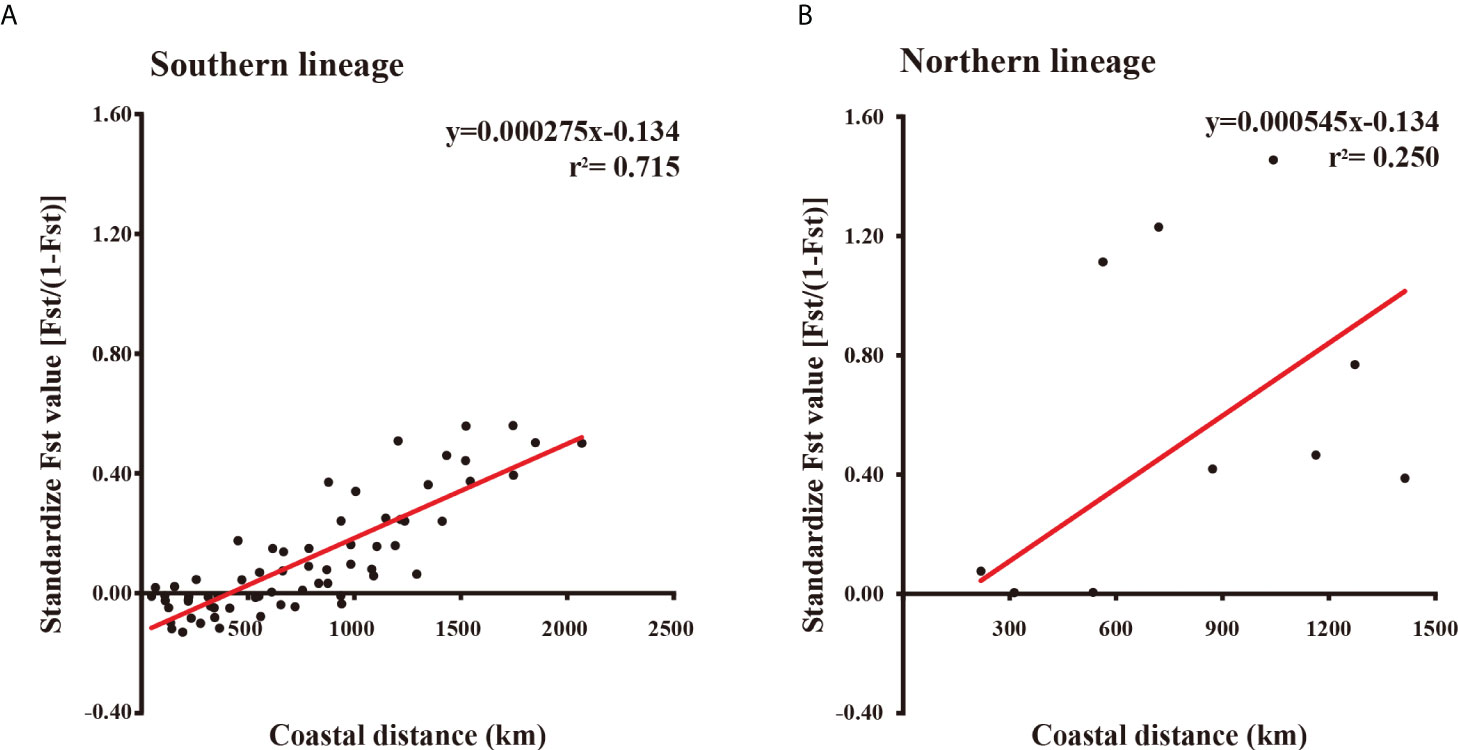
Figure 6 Plot of standardized pairwise Fst value vs. geographic distance between sampling sites of the southern (A) and northern (B) lineages. Reduce major axis regression of each plot is indicated with red lines. Regression functions and the coefficients of determination (r2) are given on top-right corner.
Discussion
Currents shaping genetic structure of T. barbatus
Correlations of the genetic structure within T. barbatus and coastal current basins during its spawning season are uncovered (Figure 1), supporting that the currents in coastal China might constrain the spatial distributions of the genetically diverged groups within marine species. Correlations of hydrographic patterns with genetic structures are occasionally found in marine species, such as the basins of Alaska and California Currents with the lineage distributions of the northeast Pacific coastal species (Rocha-Olivares and Vetter, 1999; Xuereb et al., 2018), and numerous coastal current basins with the north–south lineage divergence in the Northwest Pacific (Shen et al., 2011; Han et al., 2012; Ni et al., 2014; Qiu et al., 2016). In this study, two lineages were found within T. barbatus, i.e., the southern and northern lineages (Figure 3). The southern lineage of T. barbatus is found through the South China Sea to the South Yellow Sea (i.e., sites 1–12) but absent from the North Yellow Sea and Bohai Sea (i.e., sites 13–14, Figure 1), which coincides with the summer flow field around the Yellow Sea (Figure 2). Yuan et al. (2013, 2017) reported that the surface drifters released in Jiangsu Province, China (i.e., near sites 10–12, Figure 1) could not reach the North Yellow Sea in summer, suggesting that northward dispersal of drifting objects from the South Yellow Sea into the North Yellow Sea and the Bohai Sea (i.e., from site 12 to sites 13–14, Figure 1) might be limited due to the surface flow field. A larval retention zone of Japanese anchovy (Engraulis japonicus Temminck & Schlegel 1846) has been identified off the southeast coast of the Shandong Peninsula from May to October (Xing et al., 2020), suggesting that northward dispersal of fish larvae into the North Yellow Sea could be restricted. Our HYCOM results show a clockwise eddy formed by confluence of the YSCC and SBCC off the east Shandong Peninsula, which lays between the South Yellow Sea (sites 10–12) and North Yellow Sea (site 13, Figure 1). The observed clockwise eddy off the east Shandong Peninsula (Figure 2) might be a potential barrier constraining larval dispersal into the North Yellow Sea and the Bohai Sea, which could explain the absence of the southern lineage from these two marginal seas. The YSCC flows southward along the Changjiang Bank and deflects eastward off the Changjiang River mouth (i.e., site 10, Figure 1; Wei et al., 2011). The observed southernmost boundary of the northern lineage (i.e., site 10, Figure 1) is also close to the eastward deflection of the YSCC near the Changjiang River. The YSCC might transport the larvae of the northern lineage southward during the spawning season, but its deflection near the Changjiang River might cause larval retention and limit the further dispersal of the southern lineage into the East China Sea. In addition, Yuan et al. (2017) observed that surface drifters around the Shandong Peninsula [i.e., drifters 77 and 90, figure 12 in Yuan et al. (2017)] would eventually arrive at the Chinese Subei coast (i.e., sites 10–12, Figure 1) from August to September. The congruence between the drifter trajectories and distribution of the northern lineage might also imply an effect of the surface flow field on the dispersal potential of the northern lineage.
Furthermore, two haplotype groups of Cytb with asymmetrical distributions were found within the southern lineage, which might be another evidence for currents affecting the genetic structure of T. barbatus. Both PCA and SAMOVA concluded two geographic partitions within the southern lineage, i.e., sites 1–4 vs. sites 5–12 (Figure 1). AMOVA indicates that haplotype compositions of these two partitions are significantly different (p <0.05): sites 1–4, includes only group A, sites 5–12, includes both groups A and B (Table 1; Figures 1–3). The genetic structure within the southern lineage is similar to two lineages of another gobiiform species, Bostrychus sinensis Lacepède 1801 (the widespread lineage, distributed in both the South China Sea and East China Sea; and the restricted lineage, found only in the East China Sea, Qiu et al., 2016). Qiu et al. (2016) proposed that the genetic structure of B. sinensis might be a result of a “vicariance, then secondary contact” process. The surfaced Taiwan Strait during glacial period act as a barrier to cause genetic differentiation (Qiu et al., 2016). After the last deglaciation, the summer TSC facilitates northward dispersal of B. sinensis but concurrently, hinders southward larval dispersal of the restricted lineage (Qiu et al., 2016). By the same token, the TSC might account for northward mixing of group A and group B in sites 5–12 and restrict southward expansion of group B into sites 1–4 (Figure 1), thereby, shaping asymmetrical distributions of the two haplotype groups. Additionally, coastal China was characterized by a stronger northward monsoon during the last deglaciation, i.e., the East Asian Summer Monsoon, which might drive stronger northward surface currents (Kubota et al., 2010). The stronger northern surface currents during the deglaciation process might be another factor constraining the dispersal directions of the two haplotype groups.
Limited dispersal potential of T. barbatus
A significant IBD pattern is observed in the southern lineage of Tridentiger barbatus (Figure 6A), suggesting that its dispersal potential is restricted along the coast of China. T. barbatus tends to utilize intertidal mudflats of inner bays and estuaries as their spawning and nursery grounds (Dotu, 1957; Gao et al., 2018), which are sheltered habitats discretely distributed along the coast of China. Due to the limited dispersal potential of eggs and adults (Dotu, 1957), larval dispersal is an important process for T. barbatus to link the separated geographical populations. Coastal currents in China, with an average speed of c. 25 cm/s, are proposed as an important factor in transporting larvae over a long distance, which could facilitate gene flows and reduce genetic structure (Song et al., 2010; Li et al., 2017a). In fact, the dispersal potential of a species is the integration of numerous factors, including dispersal distance and emigration rate (Selkoe and Toonen, 2011; Benestan et al., 2021). Despite the significant effect of current transportation on dispersal distance, a low emigration rate might also account for IBD (Slatkin, 1993; Selkoe and Toonen, 2011). It is observed that a large proportion of fish larvae spawned in estuaries and inner bays tend to be retained in their nursery ground (Teodósio and Garel, 2015; Fobert et al., 2019), while estuarine freshet can intermittently flush them offshore into the coastal currents (Teodósio and Garel, 2015). Among the four analyzed otoliths, only No. 875 showed a low Sr : Ca ratio area near the ontogenetic shift zone (Supplementary Figure 4A), implying that occasional transient invasion or exposure to freshwater (e.g., estuarine freshet) is possible for T. barbatus. However, larvae of T. barbatus with a shorter PLD of 20–30 days might have fewer chances to get flushed offshore from their sheltered nursery ground and transported by strong coastal currents, which could result in a low emigration rate and a significant IBD pattern of the southern lineage. IBD patterns are also found in other estuarine gobiiform species in the Northwest Pacific with relatively short PLDs (e.g., Acanthogobius hasta (Temminck and Schlegel 1845), PLD = 5–6 days, Fan et al., 2005; Song et al., 2010; Acanthogobius flavimanus (Temminck and Schlegel 1845), PLD <30 days, Suzuki et al., 1989; Hirase et al., 2020), supporting that shorter PLD might be related to IBD.
Origin of genetic structures within T. barbatus
Our study uncovers two divergences within T. barbatus, i.e., the divergence of the southern and northern lineages, and the divergence of haplotype groups A and B in the southern lineage, which might be related to isolation during the Pleistocene glaciations. North-south differentiations in coastal China are observed within many marine fishes, isolations due to sea level declines in glacial periods are proposed as causes for such genetic structure (Liu et al., 2007; Ni et al., 2014; Qiu et al., 2016). Divergence of the southern and northern lineages is dated back to 0.37–0.79 Myr (HPD95 interval), which approximately falls into marine oxygen isotope stages (MIS) 11–19 during the Pleistocene glacial cycles (about 0.39–0.78 Myr, Figure 3, Spratt and Lisiecki, 2016). The divergence time interval covers two fierce glacial periods, i.e., the MIS 12 (0.43–0.46 Myr) and MIS 16 (0.62–0.64 Myr), whose average sea level was about 130 m lower than the present day (Figure 4, Spratt and Lisiecki, 2016). The significant sea level decline in the two stages might account for the exposure of the ECS shelf and, resultantly, the divergence of the two lineages. The mean divergence time (0.57 Myr, Figure 4) of the southern and northern lineages is close to a short and mild glacial period at the MIS 14 (about 0.54–0.56 Myr, Hao et al., 2015), whose average temperature is only 3–5°C lower than the present day (Zanchetta et al., 2017). The North Hemisphere might have experienced an extra-long interglacial period during MIS 13–15 (0.48–0.62 Myr) characterized by high sea levels (Hao et al., 2015). The ancestral population of T. barbatus might have become widespread in the Northwest Pacific in this extended interglacial period, and the exposure of the ECS shelf in MIS 12 subsequently resulted in the isolation and divergence of the T. barbatus populations (Figure 4). We also uncovered two haplotype groups in the southern lineage, whose divergence time (0.04–0.09 Myr) is encompassed in the last glacial period (about 0.01–0.11 Myr, Hughes et al., 2013), implying that the divergence of the two haplotype groups is related to another isolation event in the last glaciation. Therefore, divergences of the lineages and haplotype groups in T. barbatus populations might be related to glacial isolation, while the modern coastal current might be a factor to mediate their recent spatial distributions in the reflooded ECS shelf.
The expansion dating method provided an alternative way to estimate the substitution rate of species lacking fossil data. However, evaluation of its reliability was limited to checking the congruence between the calibrated ttransition and the reflooding events (e.g., the Bolling Interstadial period) (Crandall et al., 2012; Koblmüller et al., 2015; Hoareau, 2016), which was only verifying the prior assumption of the expansion dating method (Crandall et al., 2012). Since the method was developed for calibrating divergence time, its capability to date divergence events back to their related geographical events should be more important. It has been broadly accepted that both glacial and deglacial processes have significant effects on the genetic structure and demography of coastal species in coastal China (Song et al., 2010; Ni et al., 2014; Qiu et al., 2016; Li et al., 2017b). If the reflooding of continental shelf had caused demographic expansion of marine organisms (Crandall et al., 2012), it is plausible to assume that the exposed shelf in glacial periods could also cause isolation and divergences of lineages in some of these organisms (Ni et al., 2014). We observed two independent divergence events within T. barbatus, whose divergence times fall into the Pleistocene glacial events (Figure 4). The congruence of their divergence times with the Pleistocene glaciations might be potential evidence to support the reliability of the expansion dating method. By the same token, testifying the congruence of calibrated divergence time with the timing of other geographical events, e.g., the divergence time of transisthmian geminate species calibrated by the expansion dating method with the closure time of the Panama Isthmus (Marko, 2002), might also provide potential evidence to support the reliability of the method. Further multispecies studies may provide more insightful evidence on the reliability of the expansion dating method.
Nevertheless, the parametric two-epoch model proposed in Crandall et al. (2012) might be unsuitable to estimate the uncalibrated ttransition. The two-epoch model simulates an exponential or logistic growth preceded by a constant stage (Crandall et al., 2012), in which the exponential growth assumes infinite carrying capacity and a constant growth rate, and the logistic growth model assumes constant and finite carrying capacity and a decreasing growth rate (Schacht, 1980). The timing of a population shift from a constant stage to a logistical or exponential growth stage is assumed to be an uncalibrated ttransition. In the uncalibrated BSPs (Figure 5), we observed a growth rate increase over time followed by a growth rate decrease at the population growth stage for both lineages of T. barbatus, which obviously deviates from the growth rate scenario assumed in either the exponential or logistic growth model (i.e., constant or decreasing growth rate, Schacht, 1980). In fact, Crandall et al. (2012) hypothesized increasing habitat availability in the post-glacial reflooding process, in which the carry capacity is assumed to increase over time. It clearly violates the prior assumption of carrying capacity in both the exponential and logistic growth models. Crandall et al. (2012) retrieved an uninformative posterior distribution of growth rate from the two-epoch model, which might also imply potential deviation of the two-epoch model from the analyzed datasets. Therefore, the two-epoch model might be unsuitable to describe the post-glacial demographic expansion, and its application to ttransition estimation might cause systematic error. Our method to estimate ttransition with BSP growth rate changes might provide a non-parametric solution to apply the expansion dating method, which could avoid prior assumptions on growth rate and carrying capacity, but its reliability needs to be further validated with more datasets in the future.
Conclusion
In this study, we present the first exploration of the genetic structure of T. barbatus in coastal China. The distribution of lineages and haplotypes within T. barbatus shows congruence with the modern summer ocean current pattern of China, which provides potential evidence of ocean currents constraining the dispersal of marine organisms in coastal China. However, the divergence times of the lineages and haplotypes are dated back to the Pleistocene glacial periods, suggesting that the isolation by the continental shelf in the Pleistocene glaciations accounts for the divergences within T. barbatus. We also found a short PLD of T. barbatus (20–30 days), which might account for a significant IBD pattern in geographic populations of the species. Therefore, we conclude that the contemporary coastal currents, planktonic larval duration, and historical glacial isolation might be important factors shaping the genetic structure of T. barbatus.
Data availability statement
The datasets presented in this study can be found in online repositories. The names of the repository/repositories and accession number(s) can be found in the article/Supplementary Material.
Ethics statement
Ethical review and approval was not required for the animal study because the samples used in this study are dead specimens collected from fish markets, which does not constitute any ethical issue with alive animals.
Author contributions
JW wrote the paper with input from MYL, JCS, and TYL, with editorial comments from all authors. FL, JY, BK, and TYL collected samples. JW, MYL, JCS, HJS, and YI performed the research. JW, MYL, JCS, YI, RST, and BK analyzed the data. JY, JCS, and TYL designed the research. All authors contributed to the article and approved the submitted version.
Funding
This research was supported by grants to T-YL from the Ministry of Science and Technology (103-2611-M-110-007 and 105-2611-M-110-008) and the Asia-Pacific Ocean Research Center, National Sun Yat-Sen University.
Acknowledgments
We are grateful to Zhuo-Cheng Zhou for his assistance in sampling and to I-Hsiang Huang for his assistance in molecular work. We would also like to thank Yongshuang Xiao, Li-Wei Wu, and Han-Ting Huang for their advice on data analyses.
Conflict of interest
The authors declare that the research was conducted in the absence of any commercial or financial relationships that could be construed as a potential conflict of interest.
Publisher’s note
All claims expressed in this article are solely those of the authors and do not necessarily represent those of their affiliated organizations, or those of the publisher, the editors and the reviewers. Any product that may be evaluated in this article, or claim that may be made by its manufacturer, is not guaranteed or endorsed by the publisher.
Supplementary material
The Supplementary Material for this article can be found online at: https://www.frontiersin.org/articles/10.3389/fmars.2022.923439/full#supplementary-material
References
Bakun A. (2006). Fronts and eddies as key structures in the habitat of marine fish larvae: Opportunity, adaptive response and competitive advantage. Sci. Mar. 70 (S2), 105–122. doi: 10.3989/scimar.2006.70s2105
Benestan L., Fietz K., Loiseau N., Guerin P. E., Trofimenko E., Rühs S., et al. (2021). Restricted dispersal in a Sea of gene flow. Proc. R. Soc B: Biol. Sci. 288 (1951), 20210458. doi: 10.1098/rspb.2021.0458
Bohonak A. J. (2002). IBD (Isolation by distance): A program for analyses of isolation by distance. J. Hered. 93 (2), 153–154. doi: 10.1093/jhered/93.2.153
Brown R. J., Severin K. P. (2009). Otolith chemistry analyses indicate that water Sr:Ca is the primary factor influencing otolith Sr:Ca for freshwater and diadromous fish but not for marine fish. Can. J. Fish. Aquat. Sci. 66 (10), 1790–1808. doi: 10.1139/F09-112
Cheng J., Wang Z., Song N., Yanagimoto T., Gao T. (2019). Phylogeographic analysis of the genus Platycephalus along the coastline of the northwestern pacific inferred by mitochondrial DNA. BMC Evol. Biol. 19 (1), 1–16. doi: 10.1186/s12862-019-1477-1
Clarke K. R., Gorley R. (2005). Primer-e version 6.0. natural environmental research council (Plymouth: Plymouth Marine Laboratory).
Clement M., Snell Q., Walke P., Posada D., Crandall K. (2002). TCS: Estimating gene genealogies, Proceeding 16th International Parallel Distributed Processing Symposium p. 184. doi: 10.1109/IPDPS.2002.1016585
Cowen R. K., Sponaugle S. (2009). Larval dispersal and marine population connectivity. Annu. Rev. Mar. Sci. 1, 443–466. doi: 10.1146/annurev.marine.010908.163757
Crandall E. D., Sbrocco E. J., DeBoer T. S., Barber P. H., Carpenter K. E. (2012). Expansion dating: Calibrating molecular clocks in marine species from expansions onto the sunda shelf following the last glacial maximum. Mol. Biol. Evol. 29 (2), 707–719. doi: 10.1093/molbev/msr227
Cui R., Pan Y., Yang X., Wang Y. (2013). A new barbeled goby from south China (Teleostei: Gobiidae). Zootaxa 3670 (2), 177–192. doi: 10.11646/zootaxa.3670.2.4
Darriba D., Taboada G. L., Doallo R., Posada D. (2012). JModelTest 2: More models, new heuristics and parallel computing. Nat. Methods 9 (8), 772. doi: 10.1038/nmeth.2109
Dawson M. N., Hays C. G., Grosberg R. K., Raimondi P. T. (2014). Dispersal potential and population genetic structure in the marine intertidal of the Eastern north pacific. Ecol. Monogr. 84 (3), 435–456. doi: 10.1890/13-0871.1
Díaz-Jaimes P., Uribe-Alcocer M., Rocha-Olivares A., García-de-León F. J., Nortmoon P., Durand J. D. (2010). Global phylogeography of the dolphinfish (Coryphaena hippurus): The influence of Large effective population size and recent dispersal on the divergence of a marine pelagic cosmopolitan species. Mol. Phylogenet. Evol. 57 (3), 1209–1218. doi: 10.1016/j.ympev.2010.10.005
Dong Y. W., et al. (2012). The impact of Yangtze river discharge, ocean currents and historical events on the biogeographic pattern of Cellana toreuma along the China coast. PloS One 7 (4), e36178. doi: 10.1371/journal.pone.0036178
Dotu Y. (1957). The bionomics and life history of the goby, Triaenopogon barbatus (Günther) in the innermost part of ariake sound. Sci. Bull. Fac. Agric. 16, 261–274.
Drummond A. J., Rambaut A., Shapiro B., Pybus O. G. (2005). Bayesian Coalescent inference of past population dynamics from molecular sequences. Mol. Biol. Evol. 22 (5), 1185–1192. doi: 10.1093/molbev/msi103
Drummond A. J., Suchard M. A., Xie D., Rambaut A. (2012). Bayesian Phylogenetics with BEAUti and the BEAST 1.7. Mol. Biol. Evol. 29 (8), 1969–1973. doi: 10.1093/molbev/mss075
Dupanloup I., Schneider S., Excoffier L. (2002). A simulated annealing approach to define the genetic structure of populations. Mol. Ecol. 11, 2571–2581. doi: 10.1046/j.1365-294X.2002.01650.x
Ely B., Viñas J., Bremer J. R. A., Black D., Lucas L., et al. (2005). Consequences of the historical demography on the global population structure of two highly migratory cosmopolitan marine fishes: The yellowfin tuna (Thunnus albacares) and the skipjack tuna (Katsuwonus pelamis). BMC Evol. Biol. 5 (1), 19. doi: 10.1186/1471-2148-5-19
Excoffier L., Lischer H. E. L. (2010). Arlequin suite ver 3.5: A new series of programs to perform population genetics analyses under Linux and windows. Mol. Ecol. Resour. 10 (3), 564–567. doi: 10.1111/j.1755-0998.2010.02847.x
Excoffier L., Smouse P. E., Quattro J. M. (1992). Analysis of molecular variance inferred from metric distances among DNA haplotypes: Application to human mitochondrial DNA restriction data. Genetics 131 (2), 479–491. doi: 10.1093/genetics/131.2.479
Fan H. Y., Ji Y. P., Zhang S. H., Yuan C. T., Gao T. X. (2005). Research of fishery biology of the neritic fish Synechogobius ommaturus in the area of the huanghe delta. Period. Ocean Univ. China 35, 733–736.
Felsenstein J. (1985). Confidence limits on phylogenies: An approach using the bootstrap. Evolution 39 (4), 783–791. doi: 10.1111/j.1558-5646.1985.tb00420.x
Fobert E. K., Treml E. A., Swearer S. E. (2019). Dispersal and population connectivity are phenotype dependent in a marine metapopulation. Proc. R. Soc B. 286 (1909), 20191104. doi: 10.1098/rspb.2019.1104
Foll M., Gaggiotti O. (2006). Identifying the environmental factors that determine the genetic structure of populations. Genetics 174 (2), 875–891. doi: 10.1534/genetics.106.059451
Fu Y. X., Li W. H. (1993). Statistical tests of neutrality of mutations. Genetics 133 (3), 693–709. doi: 10.1093/genetics/133.3.693
Gao L., Cheng F., Song Y., Jiang W., Feng G., Luo Y., et al. (2018). Patterns of larval fish assemblages along the direction of freshwater input within the southern branch of the Yangtze estuary, China: Implications for conservation. J. Freshw. Ecol. 33 (1), 97–114. doi: 10.1080/02705060.2018.1426503
Han Z., Yanagimoto T., Zhang Y., Gao T. (2012). Phylogeography study of Ammodytes personatus in northwestern pacific: Pleistocene isolation, temperature and current conducted secondary contact. PloS One 7 (5), e37425. doi: 10.1371/journal.pone.0037425
Han Z., Zheng W., Zhu W., Yu C., Shui B., Gao T. (2015). A barrier to gene flow in the Asian paddle crab, Charybdis japonica, in the yellow Sea. ICES J. Mar. Sci. 72 (5), 1440–1448. doi: 10.1093/icesjms/fsv020
Hao Q., Wang L., Oldfield F., Guo Z. (2015). Extra-long interglacial in northern hemisphere during MISs 15–13 arising from limited extent of Arctic ice sheets in glacial MIS 14. Sci. Rep. 5, 12103. doi: 10.1038/srep12103
Hasegawa M., Kishino H., Yano T. A. (1985). Dating of the human–ape splitting by a molecular clock of mitochondrial DNA. J. Mol. Evol. 22 (2), 160–174. doi: 10.1007/BF02101694
Hirase S., Tezuka A., Nagano A. J., Kikuchi K., Iwasaki W. (2020). Genetic isolation by distance in the yellowfin goby populations revealed by RAD sequencing. Ichthyol. Res. 67 (1), 98–104. doi: 10.1007/s10228-019-00709-6
Hoareau T. B. (2016). Late glacial demographic expansion motivates a clock overhaul for population genetics. Syst. Biol. 65 (3), 449–464. doi: 10.1093/sysbio/syv120
Hughes P. D., Gibbard P. L., Ehlers J. (2013). Timing of glaciation during the last glacial cycle: Evaluating the concept of a global ‘Last glacial Maximum’(LGM). Earth-Sci. Rev. 1251, 171–198. doi: 10.1016/j.earscirev.2013.07.003
Hu Z. M., Uwai S., Yu S. H., Komatsu T., Ajisaka T., Duan D. L. (2011). Phylogeographic heterogeneity of the brown macroalga Sargassum horneri (Fucaceae) in the northwestern pacific in relation to late pleistocene glaciation and tectonic configurations. Mol. Ecol. 20 (18), 3894–3909. doi: 10.1111/j.1365-294X.2011.05220.x
Iizuka Y. (2012). Electron microprobe study of otolith: Migratory behavior and habitat of three major temperate species of eels. JEOL News 47 (1), 33–50.
Kimura M. (1980). A simple method for estimating evolutionary rates of base substitutions through comparative studies of nucleotide sequences. J. Mol. Evol. 16 (2), 111–120. doi: 10.1007/BF01731581
Koblmüller S., Steinwender B., Weiß S., Sefc K. M. (2015). Gene flow, population growth and a novel substitution rate estimate in a subtidal rock specialist, the black-faced blenny Tripterygion delaisi (Perciformes, blennioidei, tripterygiidae) from the Adriatic Sea. J. Zool. Syst. Evol. Res. 53 (4), 291–299. doi: 10.1111/jzs.12110
Kubota Y., Kimoto K., Tada R., Oda H., Yokoyama Y., Matsuzaki H. (2010). Variations of East Asian summer monsoon since the last deglaciation based on Mg/Ca and oxygen isotope of planktic foraminifera in the northern East China Sea. Paleoceanography 25 (4), PA4205. doi: 10.1029/2009PA001891
Kumar S., Stecher G., Tamura K. (2016). MEGA7: Molecular evolutionary genetics analysis version 7.0 for bigger datasets. Mol. Biol. Evol. 33 (7), 1870–1874. doi: 10.1093/molbev/msw054
Li J. J., Hu Z. M., Gao X., Sun Z. M., Choi H. G., Duan D. L., et al. (2017a). Oceanic currents drove population genetic connectivity of the brown alga Sargassum thunbergii in the north-West pacific. J. Biogeogr. 44 (1), 230–242. doi: 10.1111/jbi.12856
Li J. J., Hu Z. M., Sun Z. M., Yao J. T., Liu F. L., Fresia P., et al. (2017b). Historical isolation and contemporary gene flow drive population diversity of the brown alga sargassum thunbergii along the coast of China. BMC Evol. Biol. 17 (1), 1–10. doi: 10.1186/s12862-017-1089-6
Liu J. X., Gao T. X., Wu S. F., Zhang Y. P. (2007). Pleistocene isolation in the northwestern pacific marginal seas and limited dispersal in a marine fish, Chelon haematocheilus (Temminck & schlege). Mol. Ecol. 16 (2), 275–288. doi: 10.1111/j.1365-294X.2006.03140.x
Liu Z., Gan J., Hu J., Wu H., Cai Z., Deng Y., et al (2021). Progress on circulation dynamics in the East China Sea and southern Yellow Sea: Origination, pathways, and destinations of shelf currents. Prog. Oceanogr. 193, 102253. doi: 10.1016/j.pocean.2021.102553
Magsino R. M., Juinio-Meñez M. A. (2008). The influence of contrasting life history traits and oceanic processes on genetic structuring of rabbitfish populations Siganus argenteus and Siganus fuscescens along the Eastern Philippine coasts. Mar. Biol. 154 (3), 519–532. doi: 10.1007/s00227-008-0946-7
Manly B. F. J. (1994). Multivariate statistical methods: A primer. 2nd ed (New York: Chapman and Hall).
Marko P. B. (2002). Fossil calibration of molecular clocks and the divergence times of geminate species pairs separated by the Isthmus of Panama. Mol. Biol. Evol. 19 (11), 2005–2021. doi: 10.1093/oxfordjournals.molbev.a004024
Mullaney T. J., Suthers I. M. (2013). Entrainment and retention of the coastal larval fish assemblage by a short-lived, submesoscale, frontal eddy of the East Australian current. Limnol. Oceanogr. 58 (5), 1546–1556. doi: 10.4319/lo.2013.58.5.1546
Muñoz-Ramírez C. P., Barnes D. K., Cárdenas L., Meredith M. P., Morley S. A., Roman-Gonzalez A., et al. (2020). Gene flow in the Antarctic bivalve Aequiyoldia eightsii (Ja) suggests a role for the Antarctic peninsula coastal current in larval dispersal. R. Soc Open Sci. 7 (9), 200603. doi: 10.1098/rsos.200603
Nguyen L. T., Schmidt H. A., Von Haeseler A., Minh B. Q. (2015). IQ-TREE: A fast and effective stochastic algorithm for estimating maximum-likelihood phylogenies. Mol. Biol. Evol. 32 (1), 268–274. doi: 10.1093/molbev/msu300
Ni G., Li Q., Kong L., Yu H. (2014). Comparative phylogeography in marginal seas of the northwestern pacific. Mol. Ecol. 23 (3), 534–548. doi: 10.1111/mec.12620
Palumbi S. R. (1994). Genetic divergence, reproductive isolation, and marine speciation. Annu. Rev. Ecol. Evol. Syst. 25 (1), 547–572. doi: 10.1111/mec.12620
Pecoraro C., Babbucci M., Franch R., Rico C., Papetti C., et al. (2018). The population genomics of yellowfin tuna (Thunnus albacares) at global geographic scale challenges current stock delineation. Sci. Rep. 8 (1), 1–10. doi: 10.1038/s41598-018-32331-3
Qiu F., Li H., Lin H., Ding S., Miyamoto M. M. (2016). Phylogeography of the inshore fish, Bostrychus sinensis, along the pacific coastline of China. Mol. Phylogenet. Evol. 96, 112–117. doi: 10.1016/j.ympev.2015.11.020
Riginos C., Douglas K. E., Jin Y., Shanahan D. F., Treml E. A. (2011). Effects of geography and life history traits on genetic differentiation in benthic marine fishes. Ecography 34 (4), 566–575. doi: 10.1111/j.1600-0587.2010.06511.x
Rocha-Olivares A., Vetter R. D. (1999). Effects of oceanographic circulation on the gene flow, genetic structure, and phylogeography of the rosethorn rockfish (Sebastes helvomaculatus). Can. J. Fish. Aquat. Sci. 56 (5), 803–813. doi: 10.1139/f99-004
Rozas J., Ferrer-Mata A., Sanchez-DelBarrio J. C., Guirao-Librado P., Ramos-Onsins S. E., Sanchez-Garcia A. (2017). Dna SP 6: DNA sequence polymorphism analysis of Large data. Mol. Biol. Evol. 34 (12), 3299–3302. doi: 10.1093/molbev/msx248
Sale P. F. (1980). The ecology of fishes on coral reefs. Oceanogr. Mar. Biol. Ann. Rev. 18, 367–421.
Schacht R. M. (1980). Two models of population growth. Am. Anthropol. 82 (4), 782–798. doi: 10.1525/aa.1980.82.4.02a00040
Schwarz G. (1978). Estimating the dimension of a model. Ann. Stat. 6 (2), 461–464. doi: 10.1214/aos/1176344136
Selkoe K. A., Toonen R. J. (2011). Marine connectivity: A new look at pelagic larval duration and genetic metrics of dispersal. Mar. Ecol. Prog. Ser. 436, 291–305. doi: 10.3354/meps09238
Shanks A. L. (2009). Pelagic larval duration and dispersal distance revisited. Biol. Bull. 216 (3), 373–385. doi: 10.1086/BBLv216n3p373
Shen K. N., Jamandre B. W., Hsu C. C., Tzeng W. N., Durand J. D. (2011). Plio-pleistocene Sea level and temperature fluctuations in the northwestern pacific promoted speciation in the globally-distributed Flathead mullet Mugil cephalus. BMC Evol. Biol. 11 (1), 83. doi: 10.1186/1471-2148-11-83
Slatkin M. (1993). Isolation by distance in equilibrium and non-equilibrium populations. Evolution 47 (1), 264–279. doi: 10.1111/j.1558-5646.1993.tb01215.x
Song N., Zhang X. M., Sun X. F., Yanagimoto T., Gao T. X. (2010). Population genetic structure and larval dispersal potential of spottedtail goby Synechogobius ommaturus in the north-West pacific. J. Fish. Biol. 77 (2), 388–402. doi: 10.1111/j.1095-8649.2010.02694.x
Sponaugle S., Cowen R. K. (1994). Larval durations and recruitment patterns of two Caribbean gobies (Gobiidae): Contrasting early life histories in demersal spawners. Mar. Biol. 120 (1), 133–143. doi: 10.1007/BF00381949
Spratt R. M., Lisiecki L. E. (2016). A late pleistocene Sea level stack. Clim. Past. 12 (4), 1079–1092. doi: 10.5194/cp-12-1079-2016
Suzuki N., Sakurai N., Sugihara T. (1989). Development of eggs, larvae and juveniles of the oriental goby Acanthogobius flavimanus reared in the laboratory. Aqua. Sci. 36 (4), 277–289. doi: 10.11233/aquaculturesci1953.36.277
Tajima F. (1989). Statistical method for testing the neutral mutation hypothesis by DNA polymorphism. Genetics 123 (3), 585–595. doi: 10.1093/genetics/123.3.585
Teodósio M. A., Garel E. (2015). Linking hydrodynamics and fish larvae retention in estuarine nursery areas from an ecohydrological perspective. Ecohydrol. Hydrobiol. 15 (4), 182–191. doi: 10.1016/j.ecohyd.2015.08.003
Thompson J. D., Higgins D. G., Gibson T. J. (1994). CLUSTAL W: Improving the sensitivity of progressive multiple sequence alignment through sequence weighting, position-specific gap penalties and weight matrix choice. Nucleic Acids Res. 22 (22), 4673–4680. doi: 10.1093/nar/22.22.4673
Wang P. (1999). Response of Western pacific marginal seas to glacial cycles: Paleoceanographic and sedimentological features. Mar. Geol. 156 (1–4), 5–39. doi: 10.1016/S0025-3227(98)00172-8
Wei Q., Yu Z., Ran X., Zang J. (2011). Characteristics of the Western coastal current of the yellow Sea and its impacts on material transportation. Adv. Earth Sci. 26 (2), 145. doi: 10.11867/j.issn.1001-8166.2011.02.0145
Wold S., Esbensen K., Geladi P. (1987). Principal component analysis. Chemom. Intell. Lab. Syst. 2 (1–3), 37–52. doi: 10.1016/0169-7439(87)80084-9
Wu H. L., Zhong J. S. (2008), 643–657. Fauna Sinica, Ostichthyes, Perciformes (V), Gobioidei. Science, Beijing.
Xing Q., Yu H., Yu H., Sun P., Liu Y., Ye J., et al. (2020). A comprehensive model-based index for identification of larval retention areas: A case study for Japanese anchovy Engraulis japonicus in the yellow Sea. Ecol. Indic. 116, 106479. doi: 10.1016/j.ecolind.2020.106479
Xue C. (2014). Missing evidence for stepwise postglacial Sea level rise and an approach to more precise determination of former Sea levels on East China Sea shelf. Mar. Geol. 348, 52–62. doi: 10.1016/j.margeo.2013.12.004
Xuereb A., Benestan L., Normandeau E., Daigle R. M., Curtis J. M., Bernatchez L., et al. (2018). Asymmetric oceanographic processes mediate connectivity and population genetic structure, as revealed by RAD seq, in a highly dispersive marine invertebrate (Parastichopus californicus). Mol. Ecol. 27 (10), 2347–2364. doi: 10.1111/mec.14589
Xu S., Qiao Y., Xu S., Yue S., Zhang Y., Liu M., et al. (2021). Diversity, distribution and conservation of seagrass in coastal waters of the liaodong peninsula, north yellow Sea, northern China: Implications for seagrass conservation. Mar. pollut. Bull. 167, 112261. doi: 10.1016/j.marpolbul.2021.112261
Yuan D., Li Y., Qiao F., Zhao W. (2013). Temperature inversion in the huanghai Sea bottom cold water in summer. Acta Oceanol. Sin. 32 (3), 42–47. doi: 10.1007/s13131-013-0287-3
Yuan D., Li Y., Wang B., He L., Hirose N. (2017). Coastal circulation in the southwestern yellow Sea in the summers of 2008 and 2009. Cont. Shelf. Res. 143, 101–117. doi: 10.1016/j.csr.2017.01.022
Yule G. U. (1925). II.–a mathematical theory of evolution, based on the conclusions of dr. JC Willis, FR s. Proc. R. Soc Lond. B Biol. Sci. 213 (402–410), 21–87. doi: 10.1098/rstb.1925.0002
Zanchetta G., Bini M., Giaccio B., Manganelli G., Benocci A., Regattieri E., et al. (2017). Middle pleistocene (MIS 14) environmental conditions in the central Mediterranean derived from terrestrial molluscs and carbonate stable isotopes from sulmona basin (Italy). Palaeogeogr. Palaeoclimatol. Palaeoecol. 485, 236–246. doi: 10.1016/j.palaeo.2017.06.016
Dziadek S., Bundle D. R., and Cutler J. E.. (2008). Synthetic glycopeptide vaccines combining b-mannan and peptide epitopes induce protection against candidiasis. Proceedings of the National Academy of Sciences 105 (36), 13526–13531. doi: 10.1073/pnas.0803195105
Keywords: Shokihaze goby, coastal current, coastal China, population genetics, pelagic larval duration, glacial isolation
Citation: Wei J, Liu M-Y, Shiao J-C, Li F, Yang J, Iizuka Y, Kang B, Tseng R-S, Shao H-J and Liao T-Y (2022) Currents shaped the genetic structure of Tridentiger barbatus (Günther 1861) along the Chinese coast. Front. Mar. Sci. 9:923439. doi: 10.3389/fmars.2022.923439
Received: 19 April 2022; Accepted: 15 July 2022;
Published: 18 August 2022.
Edited by:
Christian Marcelo Ibáñez, Andres Bello University, ChileReviewed by:
Mariana Díaz-Santana-Iturrios, Andres Bello University, ChileJoao Braullio Luna Sales, Federal University of Pará, Brazil
Zi-Min Hu, Yantai University, China
Copyright © 2022 Wei, Liu, Shiao, Li, Yang, Iizuka, Kang, Tseng, Shao and Liao. This is an open-access article distributed under the terms of the Creative Commons Attribution License (CC BY). The use, distribution or reproduction in other forums is permitted, provided the original author(s) and the copyright owner(s) are credited and that the original publication in this journal is cited, in accordance with accepted academic practice. No use, distribution or reproduction is permitted which does not comply with these terms.
*Correspondence: Te-Yu Liao, c3dwMDExN0BnbWFpbC5jb20=