 Linlin Zhao
 Shenghao Liu
 Shouqiang Wang
 Tianyan Yang
 Qi Liu
 Tianxiang Gao
- 1Key Laboratory of Marine Eco-Environmental Science and Technology, First Institute of Oceanography, Ministry of Natural Resources, Qingdao, China
- 2Fishery College, Zhejiang Ocean University, Zhoushan, China
- 3Science and Technology Service Department, Wuhan Onemore-tech Co., Ltd., Wuhan, China
Introduction
Hexagrammos agrammus belongs to the family Hexagrammidae in the order Scorpaeniformes, and is an endemic temperate demersal fish, distributed throughout the northwestern Pacific Ocean, from Japan to the Korean Peninsula, and from the East China Sea and the Yellow Sea to the Bohai Sea. This species inhabits shallow seaweed beds and breeds from October to January, utilizing seaweed as spawning substrates (Chung and Kim, 1994). During the breeding season, a male establishes a breeding territory, and then multiple females visit and release egg masses. The male fertilizes and takes care of the eggs until they hatch (Munehara et al., 2000). Spotty-bellied greenling is an important potential marine-culture fish species that is cold tolerant, omnivorous, rich in protein and tastes delicious (Lei, 2005). There have been 17 species of Scorpaeniformes for which scaffold- or chromosome-level reference genomes are available, but only the genome of Ophiodon elongatus genome in the Hexagrammidae family has been sequenced (Longo et al., 2020).
Value of the Data
In the present study, using third-generation DNA sequencing and Hi-C technology, we first assembled a near‐complete reference genome of spotty-bellied greenling. We also inferred the phylogeny of H. agrammus with 15 other species, and analyzed the gene family expansion and contraction, aiming to investigate the evolution of the specific characteristics of this fish species.
Materials and Methods
Sampling
A female H. agrammus was sampled from a farm in Qingdao during November 2019. The muscle, eye, gonad, gill, liver, spleen and tissues were immediately immersed in liquid nitrogen. Muscle and all tissue were used for DNA and RNA extraction, respectively.
Library Construction and Genome Sequencing
Genomic DNA was extracted from muscle tissue using the standard phenol/chloroform extraction method to construct the DNA sequencing library. The Illumina NovaSeq-6000 and PacBio Sequel II platforms were applied for genomic sequencing to generate short and long genomic reads, respectively. A paired-end library was constructed with an insert size of 350 bp according to the Illumina standard protocol, and sequencing data was applied to estimate the genome size, correct the genome assembly, and evaluate assemblies. For long-read sequencing, we constructed an SMRTbell library with a fragment size of 20 Kb following the manufacturer’s protocol. The library was sequenced with one SMRT cell, which was mainly used to assemble whole genome. Hi-C genomics sequence reads were generated with the Illumina NovaSeq-6000. RNA was extracted from different tissues using TRIzol Reagent (Invitrogen, USA), mixed in equal amounts. The RNA concentration was measured using Qubit® RNA Assay Kit in Qubit® 2.0 Flurometer (Life Technologies, Carlsbad, CA, USA). RNA quality was determined by an Agilent 2100 Bioanalyzer. Only high-quality RNA samples (OD260/280 = 1.9–2.1, OD260/230 ≥ 2.1, RIN ≥ 9.5, 28/18S ≥ 1.0, > 30 µg) were used to construct these quenching libraries. Then, the sequencing was carried out by the Illumina NovaSeq-6000.
Preprocessing and Genome Size Estimation
For quality control, Trimmomatic v0.36 (Bolger et al., 2014) was employed to trim the adapter sequences and to remove low‐quality bases (Phred score <20) of the paired‐end reads, and reads shorter than 50 bp were discarded. The K-mer based method of the Illumina short-read data was used to analyze the genome survey with Jellyfish (Marçais and Kingsford, 2011) to estimate the genome size, heterozygosity, and repeat content, in which the k = 17. Genome size was calculated as the total base number/genome coverage depth.
De Novo Genome Assembly
For genome assembly, Canu v1.5 was used for initial PacBio long read correction, and genome assembly (Koren et al., 2017) by using the following parameters: maxThreads, 200; minReadLength, 1,000; corOutCoverage, 40; correctedErrorRate, 0.045; minOverlapLength, 500; rawErrorRate, 0.3; corMinCoverage, 4. For correcting random sequencing errors in the assembled genome, we first used the PacBio long reads to polish the genome in 2 rounds with Racon v1.32 (Vaser et al., 2017), and another 3 round of genome-wide base-level correction was performed using Pilon with the Illumina sequencing reads (Walker et al., 2014). Purge_haplotigs was used to remove high degree of heterozygosis contigs based on read distribution of depth and sequence similarity (Roach et al., 2018).
Chromosome Assembly via Hi-C
To construct the reference genome at the chromosome level, we constructed a Hi-C library and anchored the scaffolds into chromosomes after quality control using HiCUP v0.8.1 (Steven et al., 2015), Juicer v2.09.00 (Durand et al., 2016) and Juicebox v2.1.10 (Robinson et al., 2018) based on the draft genome assembly. In brief, HiCUP first truncated the reads at the ligation sites if present and separated them into two fragments; then the truncated reads were mapped to reference genome using bowtie2 (Langmead and Salzberg, 2012). As each end of the paired-end reads are mapped separately, it is needed pairing to get the paired-end tags (PETs). Most of Hi-C tools output mapped results in SAM/BAM format (Imakaev et al., 2012; Servant et al., 2015). After mapping, HiCUP removed any invalid or duplicated PETs by use of enzyme-digested fragments. Finally, HiCUP outputted a BAM format result with paired reads placed on adjacent lines. To further improve accuracy, high-order analysis was computed by Juicer, and identified significant chromatin loops. Final genome assembly was viewed and corrected by Juicebox.
Assessment of the Genome Assemblies
The completeness and accuracy of genome assembly was evaluated as follows: (a) The sequencing reads with short inserts (350 bp) were realigned to the assembled genome using BWA v0.7.8 (Li and Durbin, 2009); (b) the RNA-seq data of a pool of multiple tissues were aligned to the genome assembly using STAR v2.5.3a (Dobin et al., 2013); and (c) BUSCO (Benchmarking Universal Single‐Copy Orthologs) v3.0 (Simão et al., 2015) was employed to assess the completeness of the assembly using the Actinopterygii database.
Identification of Repetitive Elements
We identified repetitive elements by a combination of homology alignment and de novo searches, as follows. We used RepeatMasker (Tarailo-Graovac and Chen, 2009) with Repbase (v.16.10, http://www.girinst.org/repbase) to scan for sequences homologous to annotated repeat sequences and then used RepeatModeler (http://www.repeatmasker.org/RepeatModeler.html) with the default parameters to predict de novo transposable elements (TEs). We combined the repeat sequences identified by both methods together, which constituted the final annotated repeat set. We integrated the overlapping TEs and removed those with low scores. We identified candidate LTR-RTs using LTR_Finder v1.02 (Xu and Wang, 2007), and integrated these results and discarded false positives by the LTR_retriever pipeline and estimated insertion times.
Gene Prediction and Functional Annotation
Based on the repeat-masked genome, ab initio-based, homolog-based, and RNA-seq based methods were conducted in combination to detect the protein-coding genes in genome assembly. Genscan v1.0 (Burge and Karlin, 1997), Augustus v2.4 (Keller et al., 2011) and GlimmerHMM v3.0.4 (Majoros et al., 2004) were used for ab initio-based gene prediction. Protein sequences of Amphiprion ocellaris, Perca flavescens, Acanthochromis polyacanthus and Notothenia coriiceps were aligned to the H. agrammus genome by tBLASTn for the homolog-based prediction. For the RNA-seq based method, the retained high-quality clean reads were assembled by TopHat v2.1.2 (Kim et al., 2013) and Cufflinks v2.2.1 (Trapnell et al., 2013) to obtain isoforms for the putative transcript structures. After all gene models were merged, redundancy was removed by MAKER v 2.31.10 (Carson and Mark, 2011), and genes were annotated by CEGMA v2.5 (Parra et al., 2007). The final structured gene set was integrated by HiCESAP pipeline. All predicted genes were annotated using BLASTP (E-value cutoff 1e−5) based on the NCBI nonredundant protein (NR), Swiss-Prot and TrEMBL (Bairoch and Apweiler, 2000) databases. Protein domains were determined by searching against the InterProScan database (Zdobnov and Apweiler, 2001). Blast2GO (Conesa et al., 2005) was used to determine functions and pathways by Gene Ontology (GO) and Kyoto Encyclopedia of Genes and Genomes (KEGG) databases. For noncoding RNA prediction, we first used tRNAscan-SE v1.3.1 (Chan and Lowe, 2019) to annotate transfer RNAs (tRNAs). Afterward, Rfam v13.0 (Daub et al., 2015) and miRbase v21.0 (Griffiths-Jones et al., 2006) were used to search for ribosomal RNAs (rRNAs) and microRNAs.
Comparative Genomic Analyses
The protein sequences of 14 species (Supplementary Table 1) were downloaded, and the longest transcript was extracted from each gene. Orthologous groups were constructed by OrthoFinder v2.2.7 (Emms and Kelly, 2019). The single-copy orthologous genes shared by all 15 species were further aligned using MUSCLE v3.8.31 (Edgar, 2004) and concatenated to construct a phylogenetic tree with RaxML v8.2.12 (Stamatakis, 2014). The divergence time among species was estimated by r8s v1.81 (Sanderson, 2003), and the calibration time was selected from the TimeTree database (Kumar et al., 2017). CAFÉ v3.1 (De et al., 2006) was used to perform gene family expansion and contraction analyses. We applied GO and KEGG enrichment analyses for expanded and contracted gene families. For positive selection analysis, H. agrammus represented as foreground branch, and the other 14 species (Supplementary Table 1) represented as background branches. The CONDEML of PAML was used to estimate the dN/dS ratio (ω). Two different branch likelihood ratio tests were used to find the positively selected genes. Then GO and KEGG enrichment were performed with a false discovery rate (FDR) < 0.05.
Preliminary Analysis Report
Initially, the genome size of H. agrammus was estimated to be ~746 Mb (Figure 1A), with 76.81 Gb of short-read sequences (Table 1A; Supplementary Table 2). 1.12 Gb initial genome assembly was obtained from 135.11 Gb long-read sequences (Supplementary Table 4; Table 1A). After polishing the genome by racon, pilon and curating heterozygous diploid genome assemblies by Purge_haplotigs based on long and Illumina paired reads, we finally obtained a 733.02 Mb genome assembly, including 1,394 contigs with a contig N50 of 4.49 Mb and 43.20% GC content (Table 1B; Supplementary Table 4). The 99.37% and 96.16% read mapping rates, 99.34% and 99.52% genome coverage rates of Illumina and PacBio reads (Supplementary Tables 6, 7; Supplementary Figure 1), 0.250% heterozygous SNP rate and 0.003% homologous SNP rates (Supplementary Table 8) of the final assembled genome verified its consistency and accuracy. Among the 4,584 BUSCO groups search, 4,430 and 113 BUSCO core genes were completely identified and missing records, respectively contributing to a total of 96.64% and 2.47% BUSCO genes in the genome (Figure 1B; Supplementary Table 9). About 468,483,262 clean reads were obtained by Hi-C sequencing. And about 66.97 Gb of Hi-C data were obtained and used for subsequent analysis (Supplementary Table 10). Finally, 92.51% of the assembled sequences (977 contigs) were anchored to 24 pseudochromosomes (Figures 1C, D). The final assembled genome after Hi-C correction was 733.13 Mb, with a contig N50 of 4.14 Mb and a scaffold N50 of 29.06 Mb (Table 1B). A total of 335.338 Mb of repeat sequences were detected, accounting for 45.75% of the assembly genome (Supplementary Table 11). The repetitive sequences mainly consisted of the DNA TEs, long terminal repeats (LTRs), long interspersed nuclear elements (LINEs) and short interspersed nuclear elements (SINEs) (Supplementary Table 12), and high divergence was shown among different TEs (Supplementary Figure 3). A total of 21,848 protein-coding genes were predicted. The statistics of the predicted gene models were compared to other species, including Cottoperca gobio, Amphiprion ocellaris, Perca flavescens, Acanthochromis polyacanthus and Notothenia coriiceps, which revealed similar distribution patterns in mRNA length, coding DNA sequence (CDS) length, exon length, intron length (Supplementary Figure 4). Finally, a total of 21,019 predicted genes (96.21%) were successfully annotated by alignment to the nucleotide, protein, and annotation databases InterPro, NR, SwissProt, TrEMBL, KOG, GO, and KEGG (Table 1D). A total of 2.78 Mb of noncoding RNA (ncRNA) genes were also predicted, accounting for 0.38% of the genome (Supplementary Table 13). BUSCO analysis showed that 96.2% (4409/4584) of the complete BUSCO were found in genome annotation (Figure 1B; Supplementary Table 9). A total of 16,116 gene families were identified in H. agrammus, including 88 unique gene families (Figure 1E; Supplementary Table 14). H. agrammus is phylogenetically closely related to Cyclopterus lumpus, and the divergence time among 15 species was shown in Figure 1F. The H. agrammus genome displayed 531 expanded and 1,727 contracted gene families compared with common ancestor (Figure 1F). The results of GO and KEGG analyses for expanded and contraction gene family and positive selection genes were shown in (Supplementary Figures 5–7).
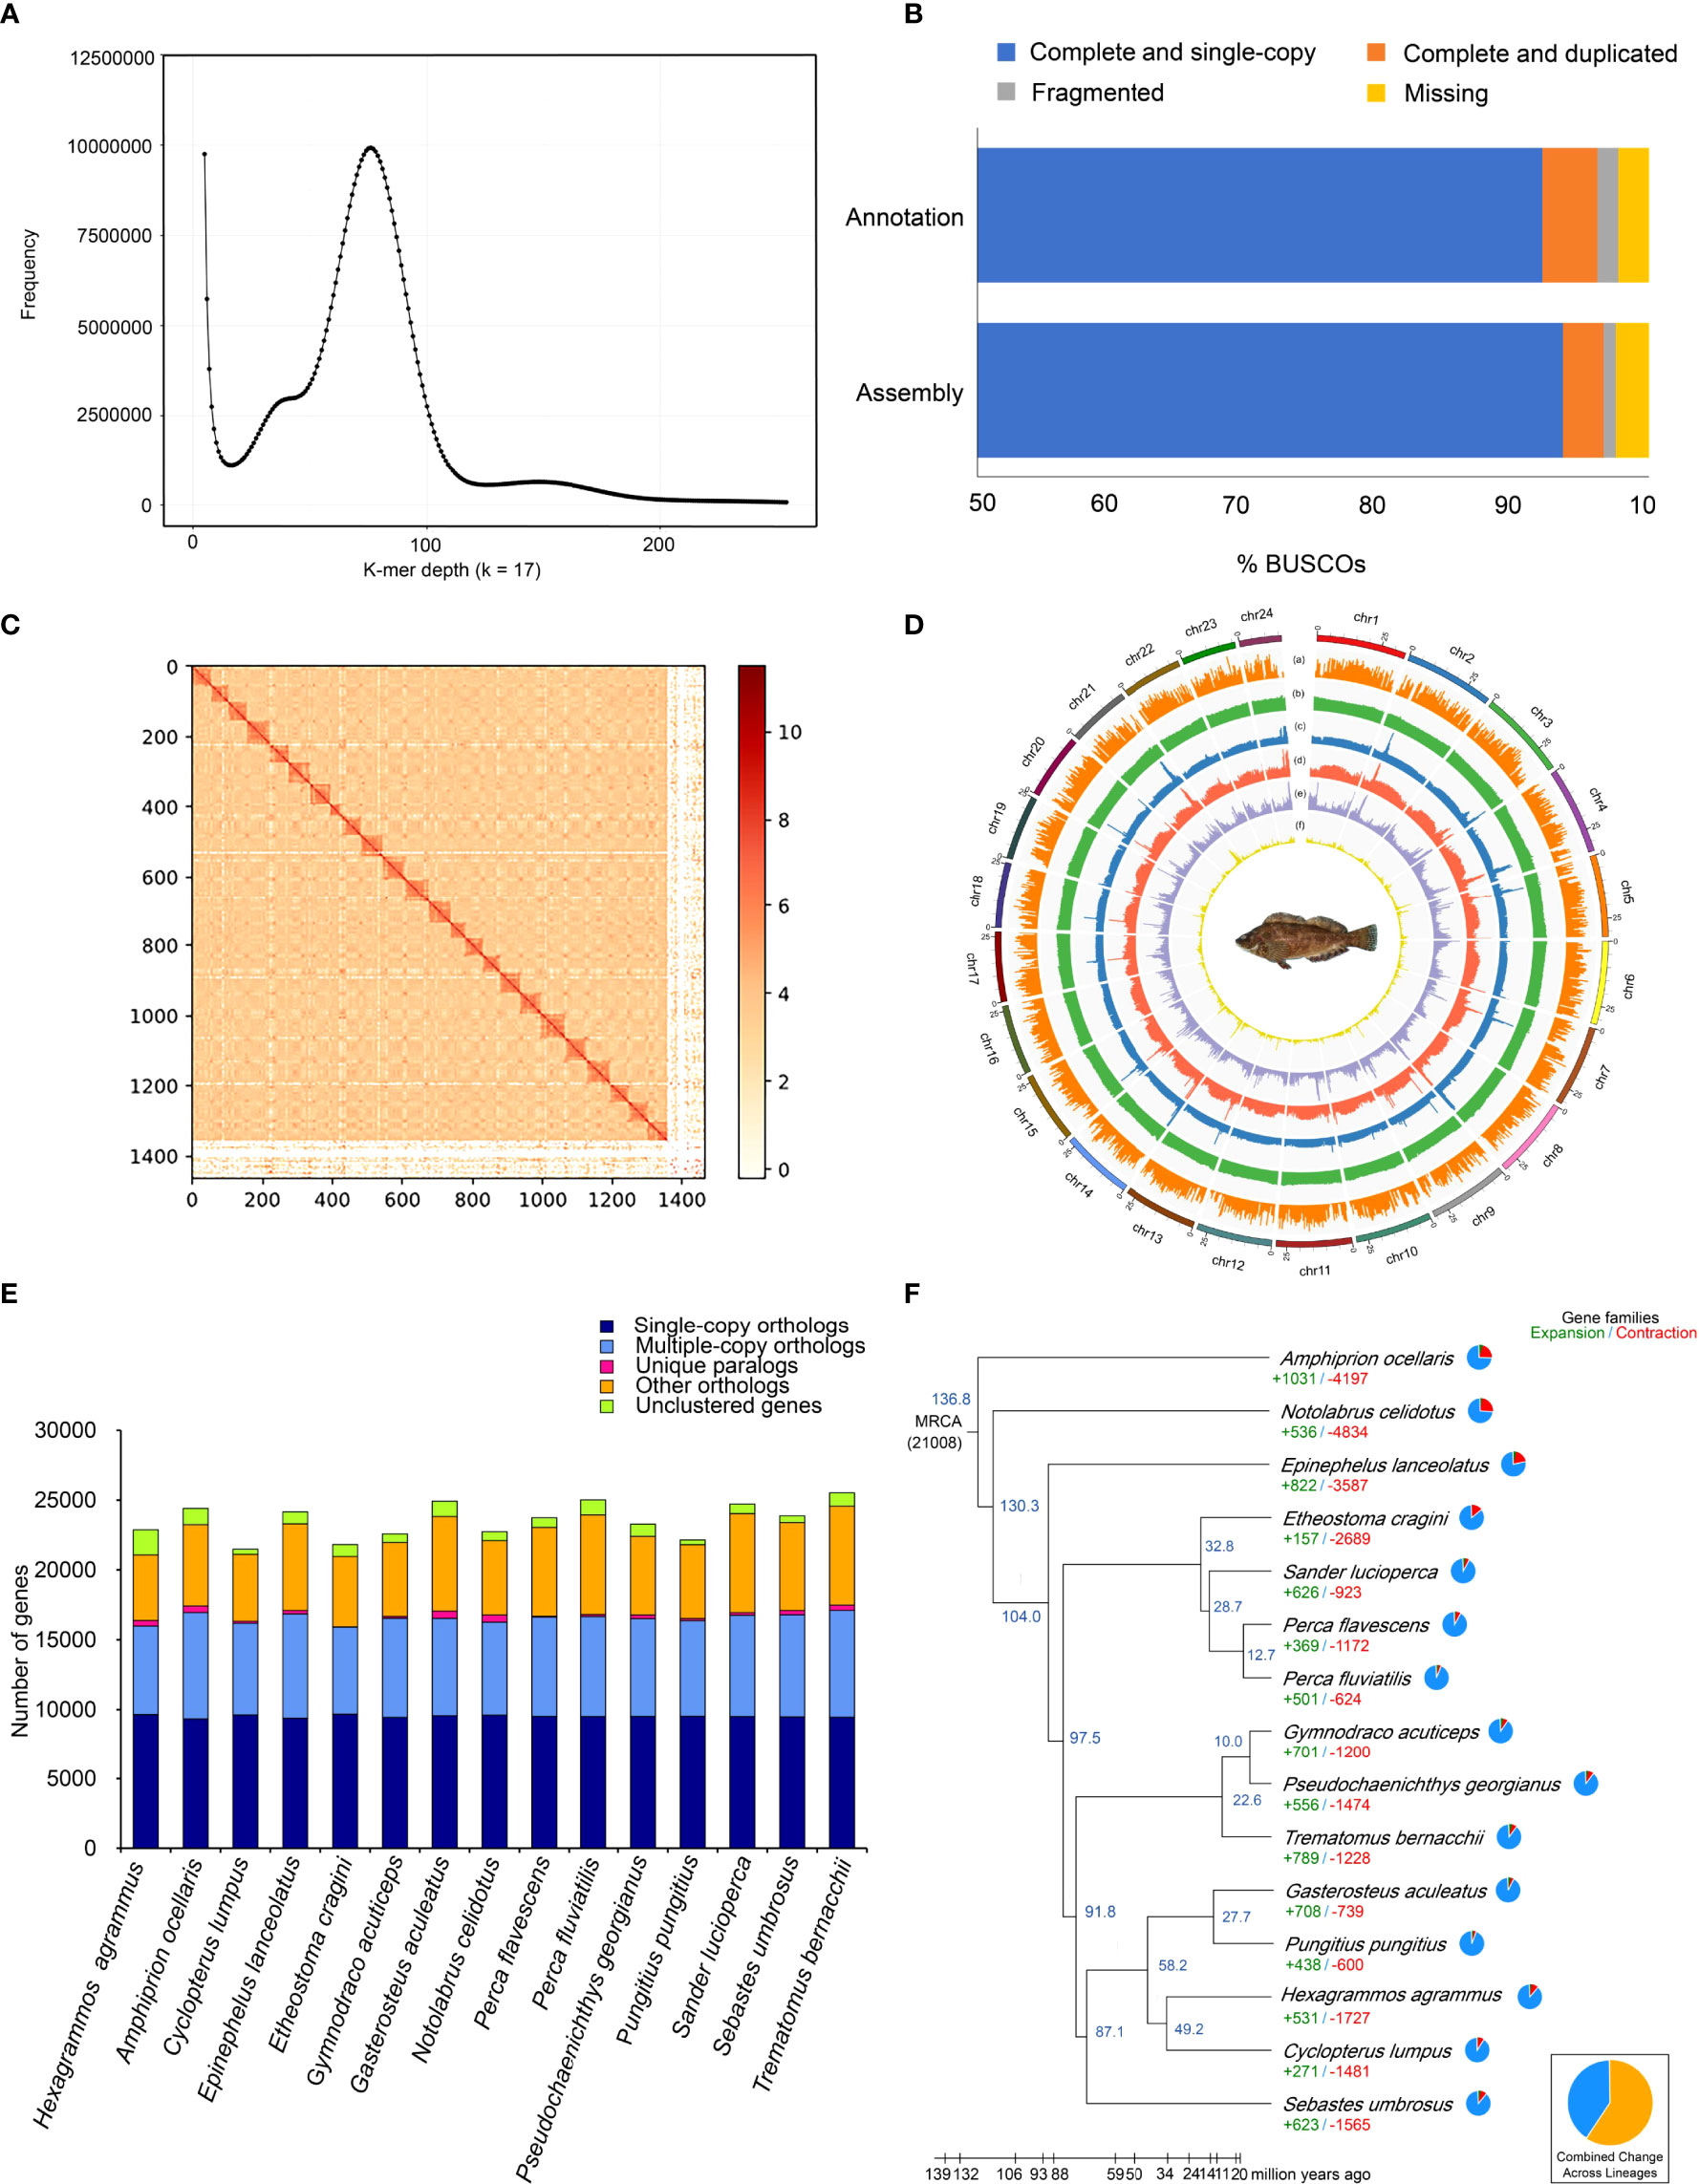
Figure 1 Summary of the sequencing and comparative genomic results. (A) Genome size estimation with Illumina short reads; (B) 96.5% and 96.2% of the complete BUSCO were found in genome assembly and annotation, respectively; (C) Statistics of the Hi-C assembly of the H. agrammus genome; (D) Genome characteristics of H. agrammus. The results from the outer circle to the inner circle are as follows: (a) Gene density; (b) GC content; (c) Illumina sequencing data depth; (d) PacBio sequencing data depth; (e) DNA TE content; (f) LTR content; (E) Ortholog clustering results among 15 species; (F) Phylogenetic tree showing the divergence time of H. agrammus with 14 other fish species.
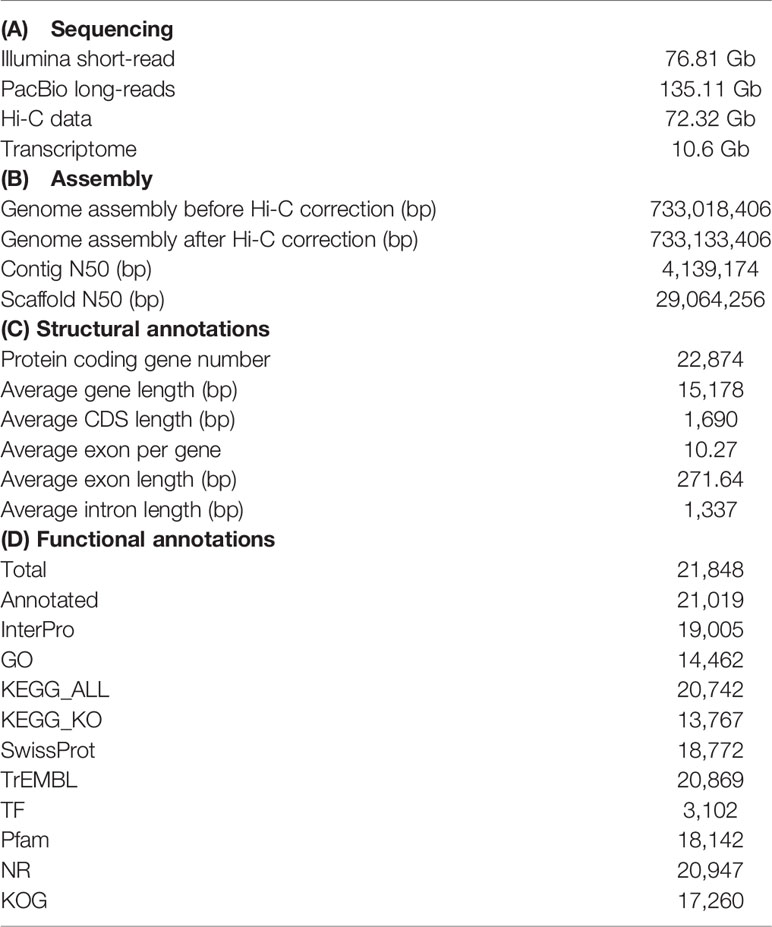
Table 1 Sequencing for annotation of the H. agrammus draft genome.
Data Availability Statement
The datasets presented in this study can be found in online repositories. The names of the repository/repositories and accession number(s) can be found in the article/supplementary material.
Ethics Statement
The animal study was reviewed and approved by Institutional Animal Care and Use Committee of First Institute of Oceanography, Ministry of Natural Resources.
Author Contributions
LZ and TG conceived and designed the experiments. TY, QL, and SW performed the sample DNA extraction. LZ, SL, and SW performed genome assembly, annotations and comparative genomics analysis. LZ drafted the manuscript. All authors read and approved the final manuscript.
Funding
This work was supported by the Province Key Research and Development Program of Zhejiang (2021C02047).
Conflict of Interest
Author QL was employed by Wuhan Onemore-tech Co., Ltd.
The remaining authors declare that the research was conducted in the absence of any commercial or financial relationships that could be construed as a potential conflict of interest.
Publisher’s Note
All claims expressed in this article are solely those of the authors and do not necessarily represent those of their affiliated organizations, or those of the publisher, the editors and the reviewers. Any product that may be evaluated in this article, or claim that may be made by its manufacturer, is not guaranteed or endorsed by the publisher.
Supplementary Material
The Supplementary Material for this article can be found online at: https://www.frontiersin.org/articles/10.3389/fmars.2022.923005/full#supplementary-material
References
Bairoch A., Apweiler R. (2000). The SWISS-PROT Protein Sequence Database and Its Supplement TrEMBL in 2000. Nucleic Acids Res. 28, 45–48. doi: 10.1093/nar/28.1.45
Bolger A. M., Lohse M., Usadel B. (2014). Trimmomatic: A Flexible Trimmer for Illumina Sequence Data. Bioinformatics 30, 2114–2120. doi: 10.1093/bioinformatics/btu170
Burge C., Karlin S. (1997). Prediction of Complete Gene Structures in Human Genomic DNA. J. Mol. Biol. 268, 78–94. doi: 10.1006/jmbi.1997.0951
Carson H., Mark Y. (2011). MAKER2: An Annotation Pipeline and Genome-Database Management Tool for Second-Generation Genome Projects. BMC Bioinform. 12, 491. doi: 10.1186/1471-2105-12-491
Chan P. P., Lowe T. M. (2019). Trnascan-SE: Searching for tRNA Genes in Genomic Sequences. Methods Mol. Biol. 1962, 1–14. doi: 10.1007/978-1-4939-9173-0_1
Chung E. Y., Kim S. Y. (1994). On the Maturity and Spawning of the Greenling Hexagrammos Agrammus (Temminck and Schlegel). Korean J. Ichthyl. 6 (2), 222–236.
Conesa A., Götz S., García-Gómez J. M., Terol J., Talón M., Robles M. (2005). Blast2GO: A Universal Tool for Annotation, Visualization and Analysis in Functional Genomics Research. Bioinformatics 21, 3674–3676. doi: 10.1093/bioinformatics/bti610
Daub J., Eberhardt R. Y., Tate J. G., Burge S. W. (2015). Rfam: Annotating Families of Non-Coding RNA Sequences. Methods Mol. Biol. 1269, 349–363. doi: 10.1007/978-1-4939-2291-8_22
De B. T., Cristianini N., Demuth J. P., Hahn M. W. (2006). CAFE: A Computational Tool for the Study of Gene Family Evolution. Bioinformatics 22 (10), 1269–1271. doi: 10.1093/bioinformatics/btl097
Dobin A., Davis C. A., Schlesinger F., Drenkow J., Zaleski C., Jha S., et al (2013). STAR: Ultrafast Universal RNA-Seq Aligner. Bioinformatics 29, 15–21. doi: 10.1093/bioinformatics/bts635
Durand N. C., Shamim M. S., Machol I., Rao S. S., Huntley M. H., Lander E. S., et al (2016). Juicer Provides a One-Click System for Analyzing Loop-Resolution Hi-C Experiments. Cell Syst. 3, 95–98. doi: 10.1016/j.cels.2016.07.002
Edgar R. C. (2004). MUSCLE: Multiple Sequence Alignment With High Accuracy and High Throughput. Nucleic Acids Res. 32, 1792–1797. doi: 10.1093/molbev/msw054
Emms D. M., Kelly S. (2019). OrthoFinder: Phylogenetic Orthology Inference for Comparative Genomics. Genome Biol. 20, 238. doi: 10.1186/s13059-019-1832-y
Griffiths-Jones S., Grocock R. J., van Dongen S., Bateman A., Enright A. J. (2006). Mirbase: microRNA Sequences, Targets and Gene Nomenclature. Nucleic Acids Res. 34, 140–144. doi: 10.1093/nar/gkj112
Imakaev M., Fudenberg G., McCord R. P., Naumova N., Goloborodko A., Lajoie B., et al (2012). Iterative Correction of Hi-C Data Reveals Hallmarks of Chromosome Organization. Nat. Methods 9 (10), 999–1003. doi: 10.1038/nmeth.2148
Keller O., Kollmar M., Stanke M., Waack S. (2011). A Novel Hybrid Gene Prediction Method Employing Protein Multiple Sequence Alignments. Bioinformatics 27 (6), 757–763. doi: 10.1093/bioinformatics/btr010
Kim D., Pertea G., Trapnell C., Pimentel H., Kelley R., Salzberg S. L. (2013). TopHat2: Accurate Alignment of Transcriptomes in the Presence of Insertions, Deletions and Gene Fusions. Genome Biol. 14, R36. doi: 10.1186/gb-2013-14-4-r36
Koren S., Walenz B. P., Berlin K., Miller J. R., Phillippy A. M. (2017). Canu: Scalable and Accurate Long-Read Assembly via Adaptive K-Mer Weighting and Repeat Separation. Genome Res. 27, 722–736. doi: 10.1101/gr.215087.116
Kumar S., Stecher G., Suleski M., Hedges S. B. (2017). TimeTree: A Resource for Timelines, Timetrees, and Divergence Times. Mol. Bio Evol. 34, 1812–1819. doi: 10.1093/molbev/msx116
Langmead B., Salzberg S. L. (2012). Fast Gapped-Read Alignment With Bowtie 2. Nat. Methods 9, 357–359. doi: 10.1038/nmeth.1923
Lei J. L. (2005). Marine Fish Culture Theory and Techniques. Beijing: China Agriculture Press, 731–744.
Li H., Durbin R. (2009). Fast and Accurate Short Read Alignment With Burrows-Wheeler Transform. Bioinformatics 25, 1754–1760. doi: 10.1093/bioinformatics/btp324
Longo G. C., Lam L., Basnett B., Samhouri J., Hamilton S., Andrews K., et al (2020). Strong Population Differentiation in Lingcod (Ophiodon Elongatus) is Driven by a Small Portion of the Genome. Evol. Appl. 13, 2536–2554. doi: 10.1111/eva.13037
Majoros W. H., Pertea M., Salzberg S. L. (2004). TigrScan and GlimmerHMM: Two Open Source Ab Initio Eukaryotic Gene-Finders. Bioinformatics 20, 2878–2879. doi: 10.1093/bioinformatics/bth315
Marçais G., Kingsford C. (2011). A Fast, Lock-Free Approach for Efficient Parallel Counting of Occurrences of K-Mers. Bioinformatics 27 (6), 764–770. doi: 10.1093/bioinformatics/btr011
Munehara H., Kanamoto Z., Miura T. (2000). Spawning Behavior and Interspecific Breeding in Three Japanese Greenlings (Hexagrammidae). Ichthyological Res. 47, 287–292. doi: 10.1007/BF02674252
Parra G., Bradnam K., Korf I. (2007). CEGMA: A Pipeline to Accurately Annotate Core Genes in Eukaryotic Genomes. Bioinformatics 23, 1061–1067. doi: 10.1093/bioinformatics/btm071
Roach M. J., Schmidt S. A., Borneman A. R. (2018). Purge Haplotigs: Allelic Contig Reassignment for Third-Gen Diploid Genome Assemblies. BMC Bioinform. 19, 460. doi: 10.1186/s12859-018-2485-7
Robinson J. T., Turner D., Durand N. C., Thorvaldsdóttir H., Mesirov J. P., Aiden E. L. (2018). Juicebox.js Provides a Cloud-Based Visualization System for Hi-C Data. Cell Syst. 6, 256–258. doi: 10.1016/j.cels.2018.01.001
Sanderson M. J. (2003). R8s: Inferring Absolute Rates of Molecular Evolution and Divergence Times in the Absence of a Molecular Clock. Bioinformatics 19, 301–302. doi: 10.1093/bioinformatics/19.2.301
Servant N., Varoquaux N., Lajoie B. R., Viara E., Chen C. J., Vert J. P., et al (2015). HiC-Pro: An Optimized and Flexible Pipeline for Hi-C Data Processing. Genome Biol. 16, 259. doi: 10.1186/s13059-015-0831-x
Simão F. A., Waterhouse R. M., Ioannidis P., Kriventseva E. V., Zdobnov E. M. (2015). BUSCO: Assessing Genome Assembly and Annotation Completeness With Single-Copy Orthologs. Bioinformatics 31, 3210–3212. doi: 10.1093/bioinformatics/btv351
Stamatakis A. (2014). RAxML Version 8: A Tool for Phylogenetic Analysis and Post-Analysis of Large Phylogenies. Bioinformatics 30, 1312–1313. doi: 10.1093/bioinformatics/btu033
Steven W., Philip E., Mayra F. M., Takashi N., Stefan S., Peter F., et al (2015). HiCUP: Pipeline for Mapping and Processing Hi-C Data. F1000Research 4, 1310. doi: 10.12688/f1000research.7334.1
Tarailo-Graovac M., Chen N. (2009). Using RepeatMasker to Identify Repetitive Elements in Genomic Sequences. Curr. Protoc. Bioinformatics 25, 4.10.1–4.10.14. doi: 10.1002/0471250953.bi0410s25
Trapnell C., Hendrickson D. G., Sauvageau M., Goff L., Rinn J. L., Pachter L. (2013). Differential Analysis of Gene Regulation at Transcript Resolution With RNA-Seq. Nat. Biotechnol. 31, 46–53. doi: 10.1038/nbt.2450
Vaser R., Sović I., Nagarajan N., Šikić M. (2017). Fast and Accurate De Novo Genome Assembly From Long Uncorrected Reads. Genome Res. 27 (5), 737–746. doi: 10.1101/gr.214270.116
Walker B. J., Abeel T., Shea T., Priest M., Abouelliel A., Sakthikumar S., et al (2014). Pilon: An Integrated Tool for Comprehensive Microbial Variant Detection and Genome Assembly Improvement. PloS One 9, e112963. doi: 10.1371/journal.pone.0112963
Xu Z., Wang H. (2007). LTR_FINDER: An Efficient Tool for the Prediction of Full-Length LTR Retrotransposons. Nucleic Acids Res. 35, 265–268. doi: 10.1093/nar/gkm286
Keywords: Hexagrammos agrammus, Hexagrammidae, genome sequencing, chromosomal assembly, annotation
Citation: Zhao L, Liu S, Wang S, Yang T, Liu Q and Gao T (2022) Chromosomal Assembly of the Hexagrammos agrammus Genome via Third-Generation DNA Sequencing and Hi-C Technology. Front. Mar. Sci. 9:923005. doi: 10.3389/fmars.2022.923005
Received: 18 April 2022; Accepted: 16 May 2022;
Published: 09 June 2022.
Edited by:
Yang Jin, Norwegian University of Life Sciences, NorwayReviewed by:
Hyun Park, Korea University, South KoreaGuangyi Fan, Beijing Genomics Institute (BGI), China
Copyright © 2022 Zhao, Liu, Wang, Yang, Liu and Gao. This is an open-access article distributed under the terms of the Creative Commons Attribution License (CC BY). The use, distribution or reproduction in other forums is permitted, provided the original author(s) and the copyright owner(s) are credited and that the original publication in this journal is cited, in accordance with accepted academic practice. No use, distribution or reproduction is permitted which does not comply with these terms.
*Correspondence: Tianxiang Gao, Z2FvdGlhbnhpYW5nMDYxMUAxNjMuY29t